 Deutsch
 English
 Español
 Français
 Italiano
 Nederlands
 Polski
 Português
 Русский
 Türkçe
 Svenska
 Chinese
 Magyar
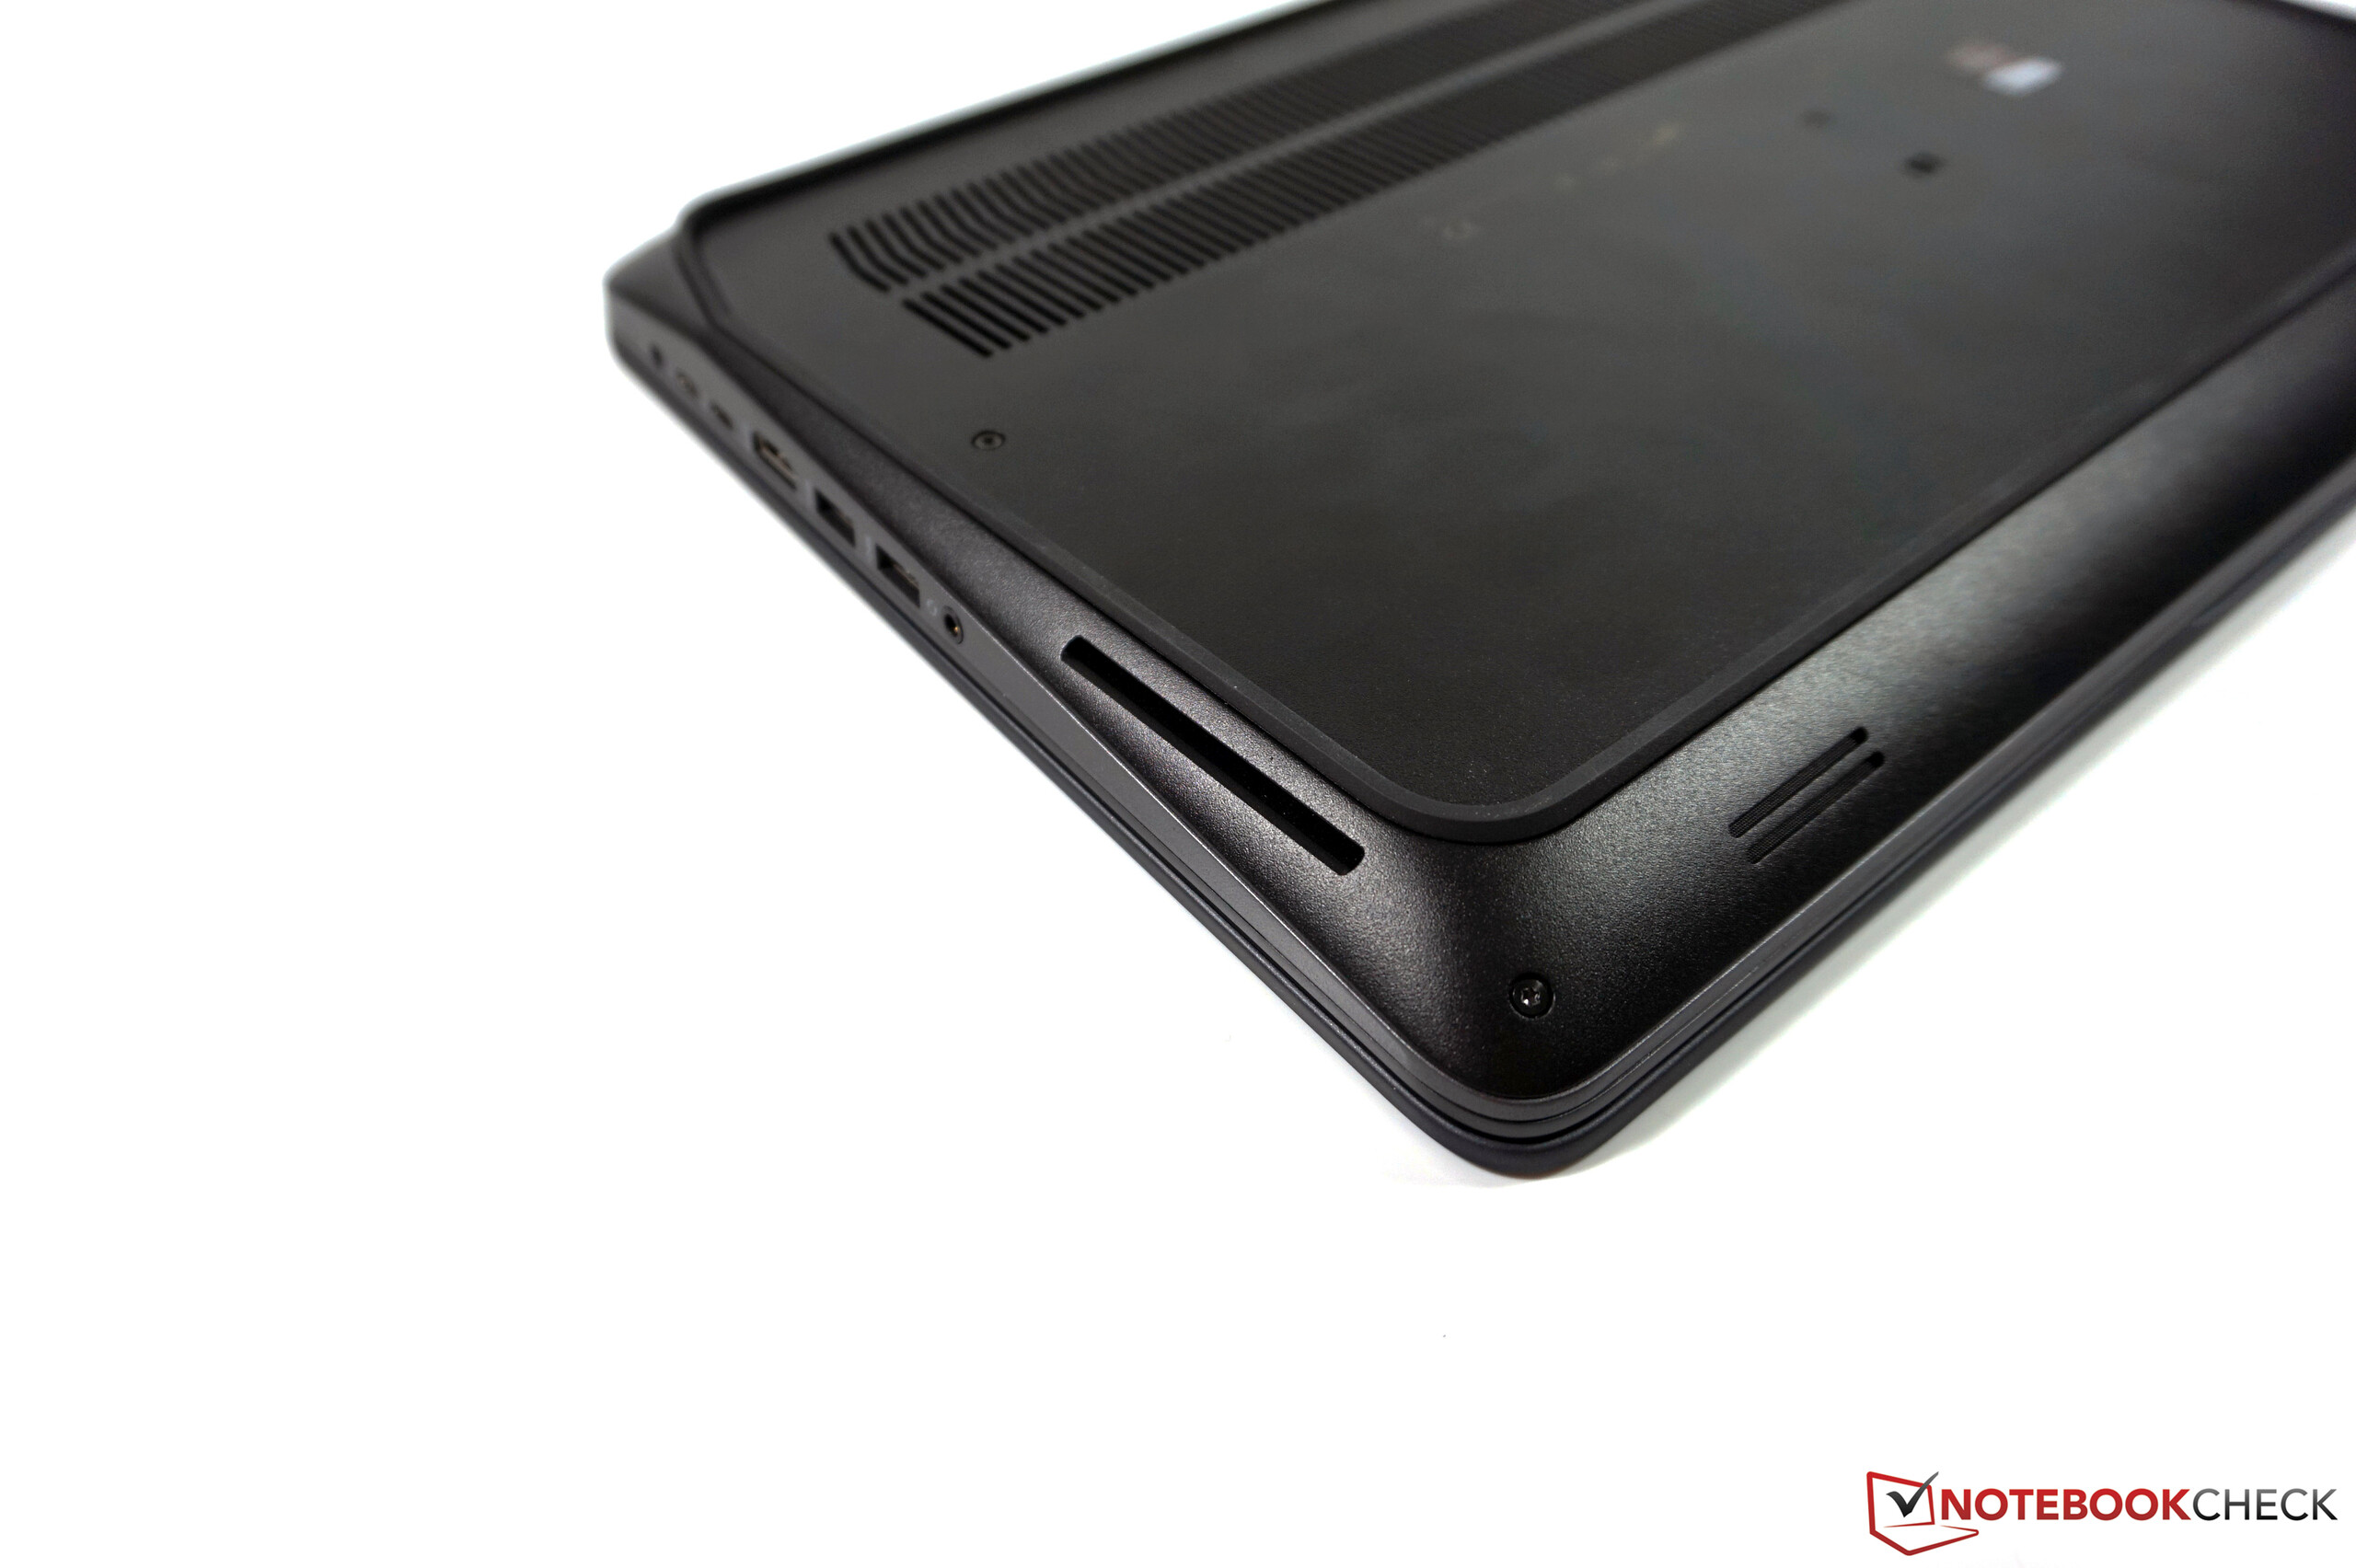
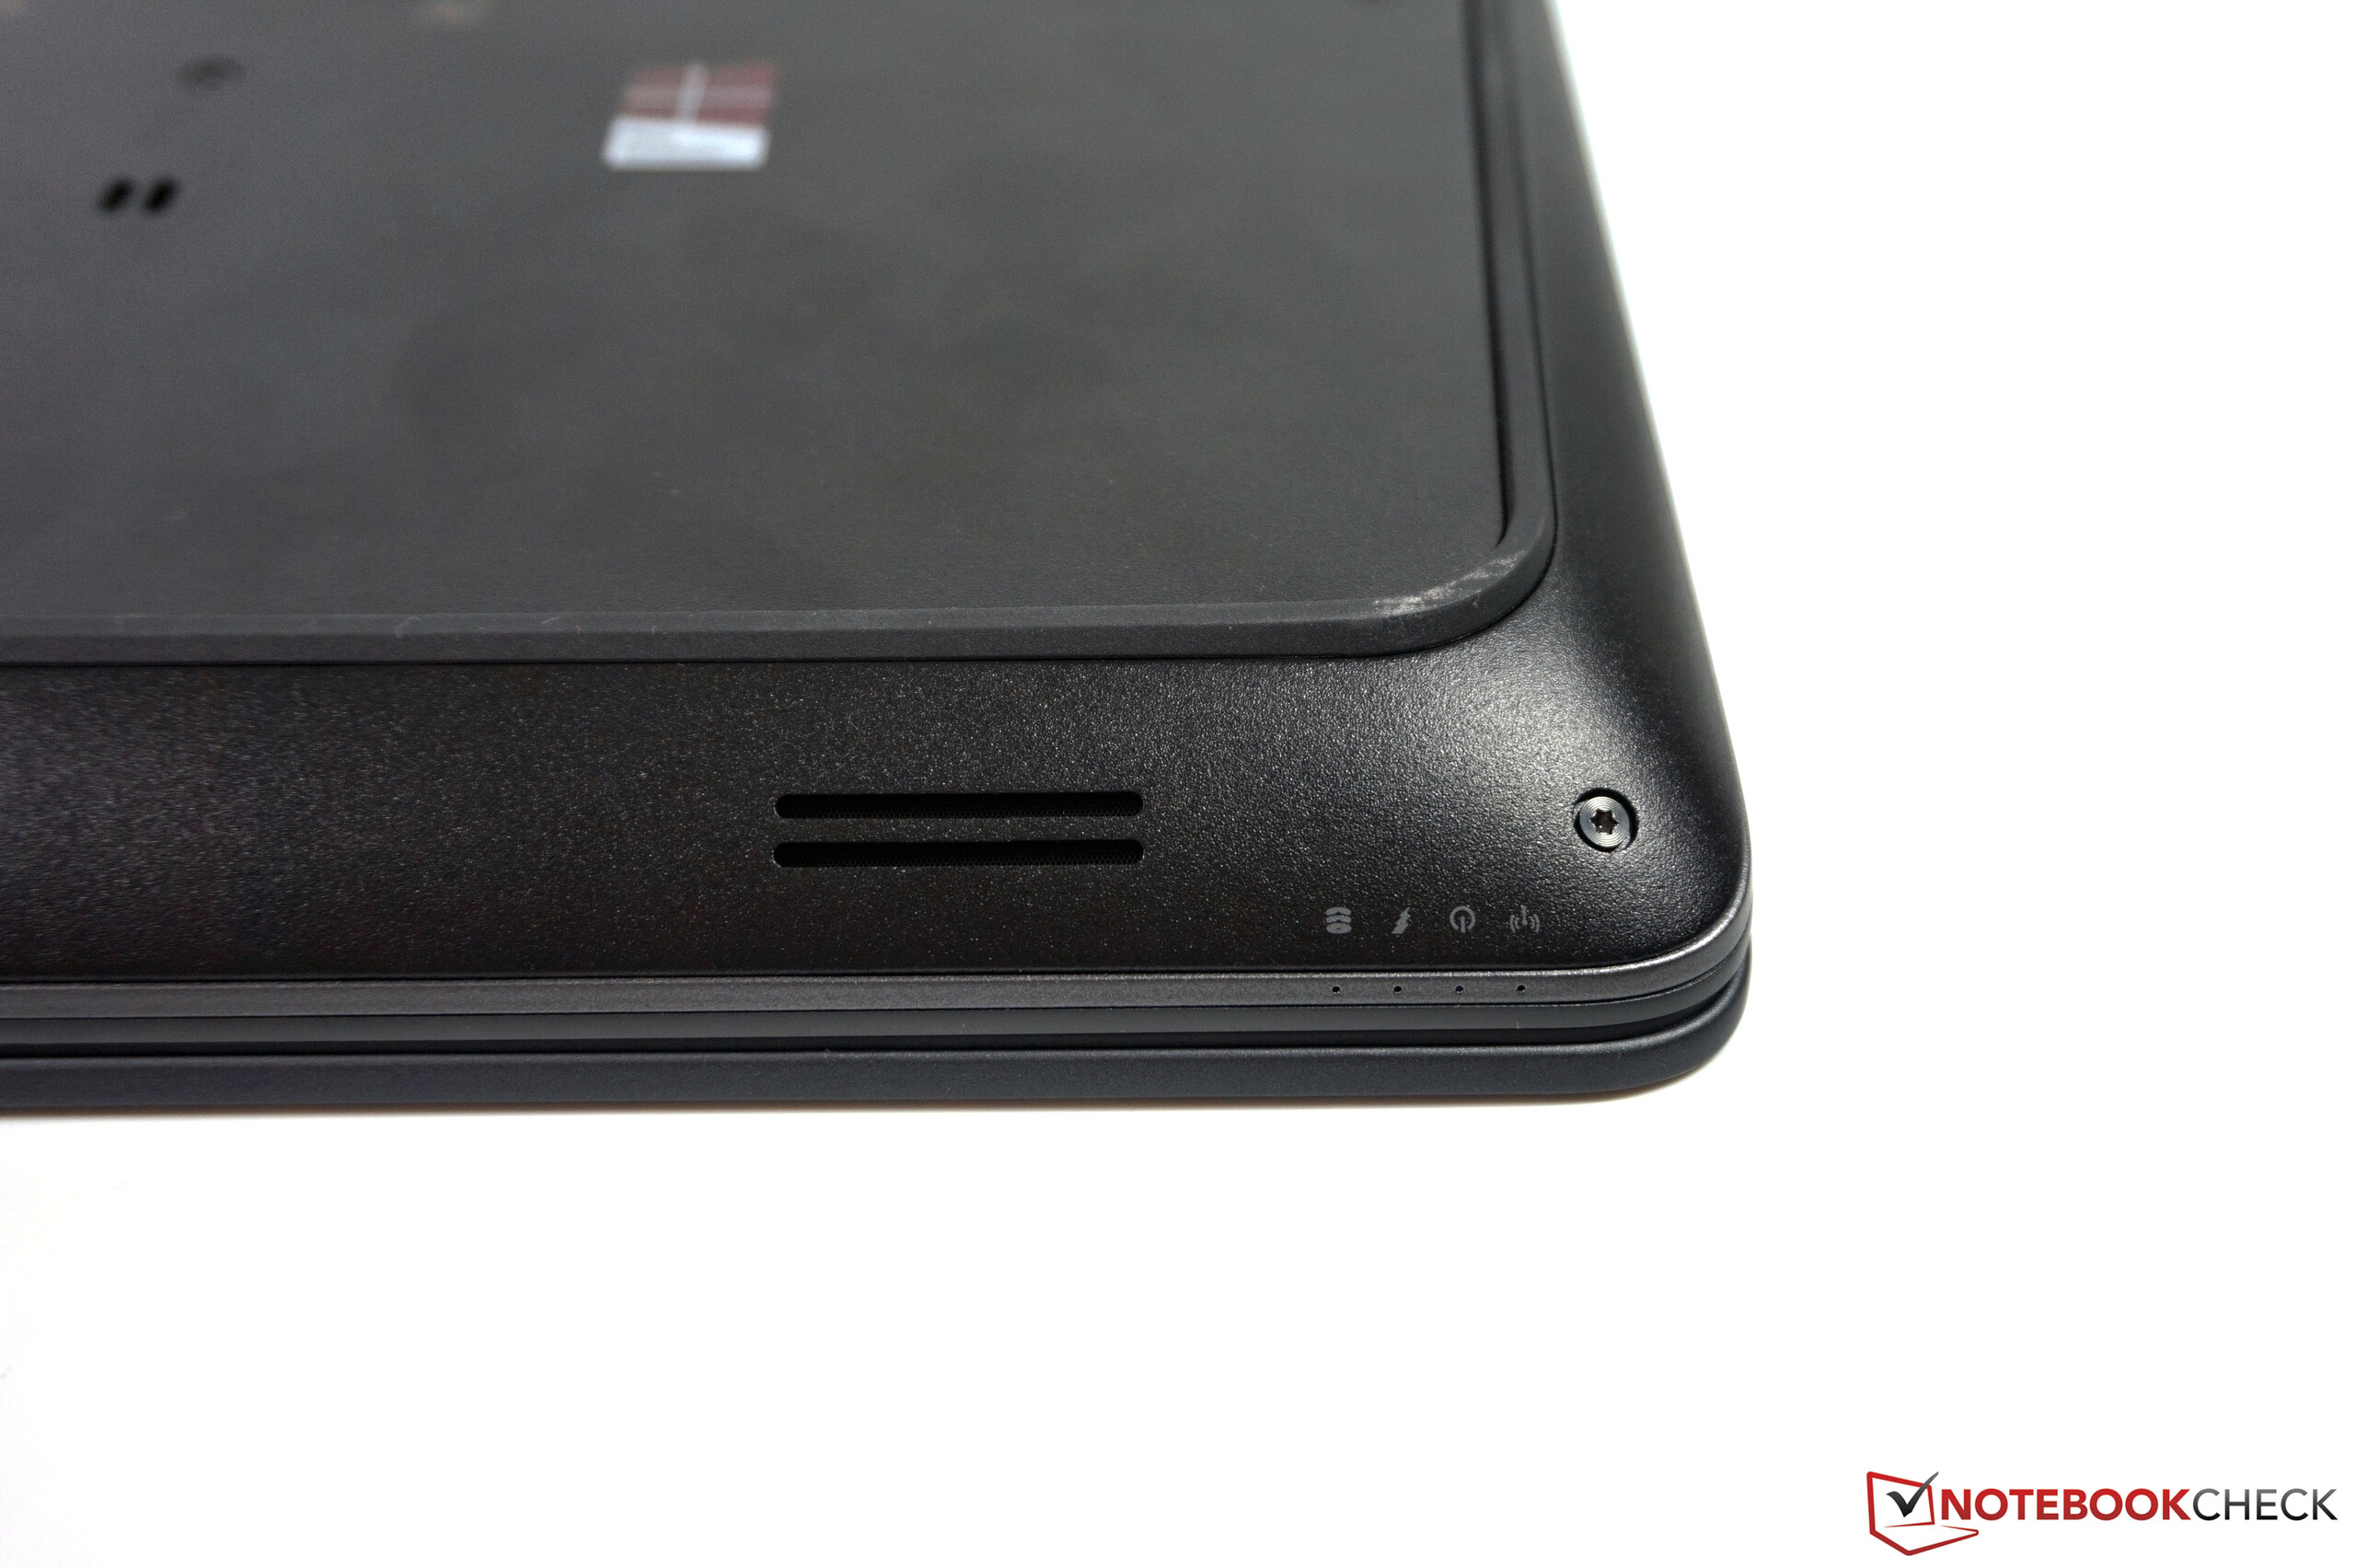
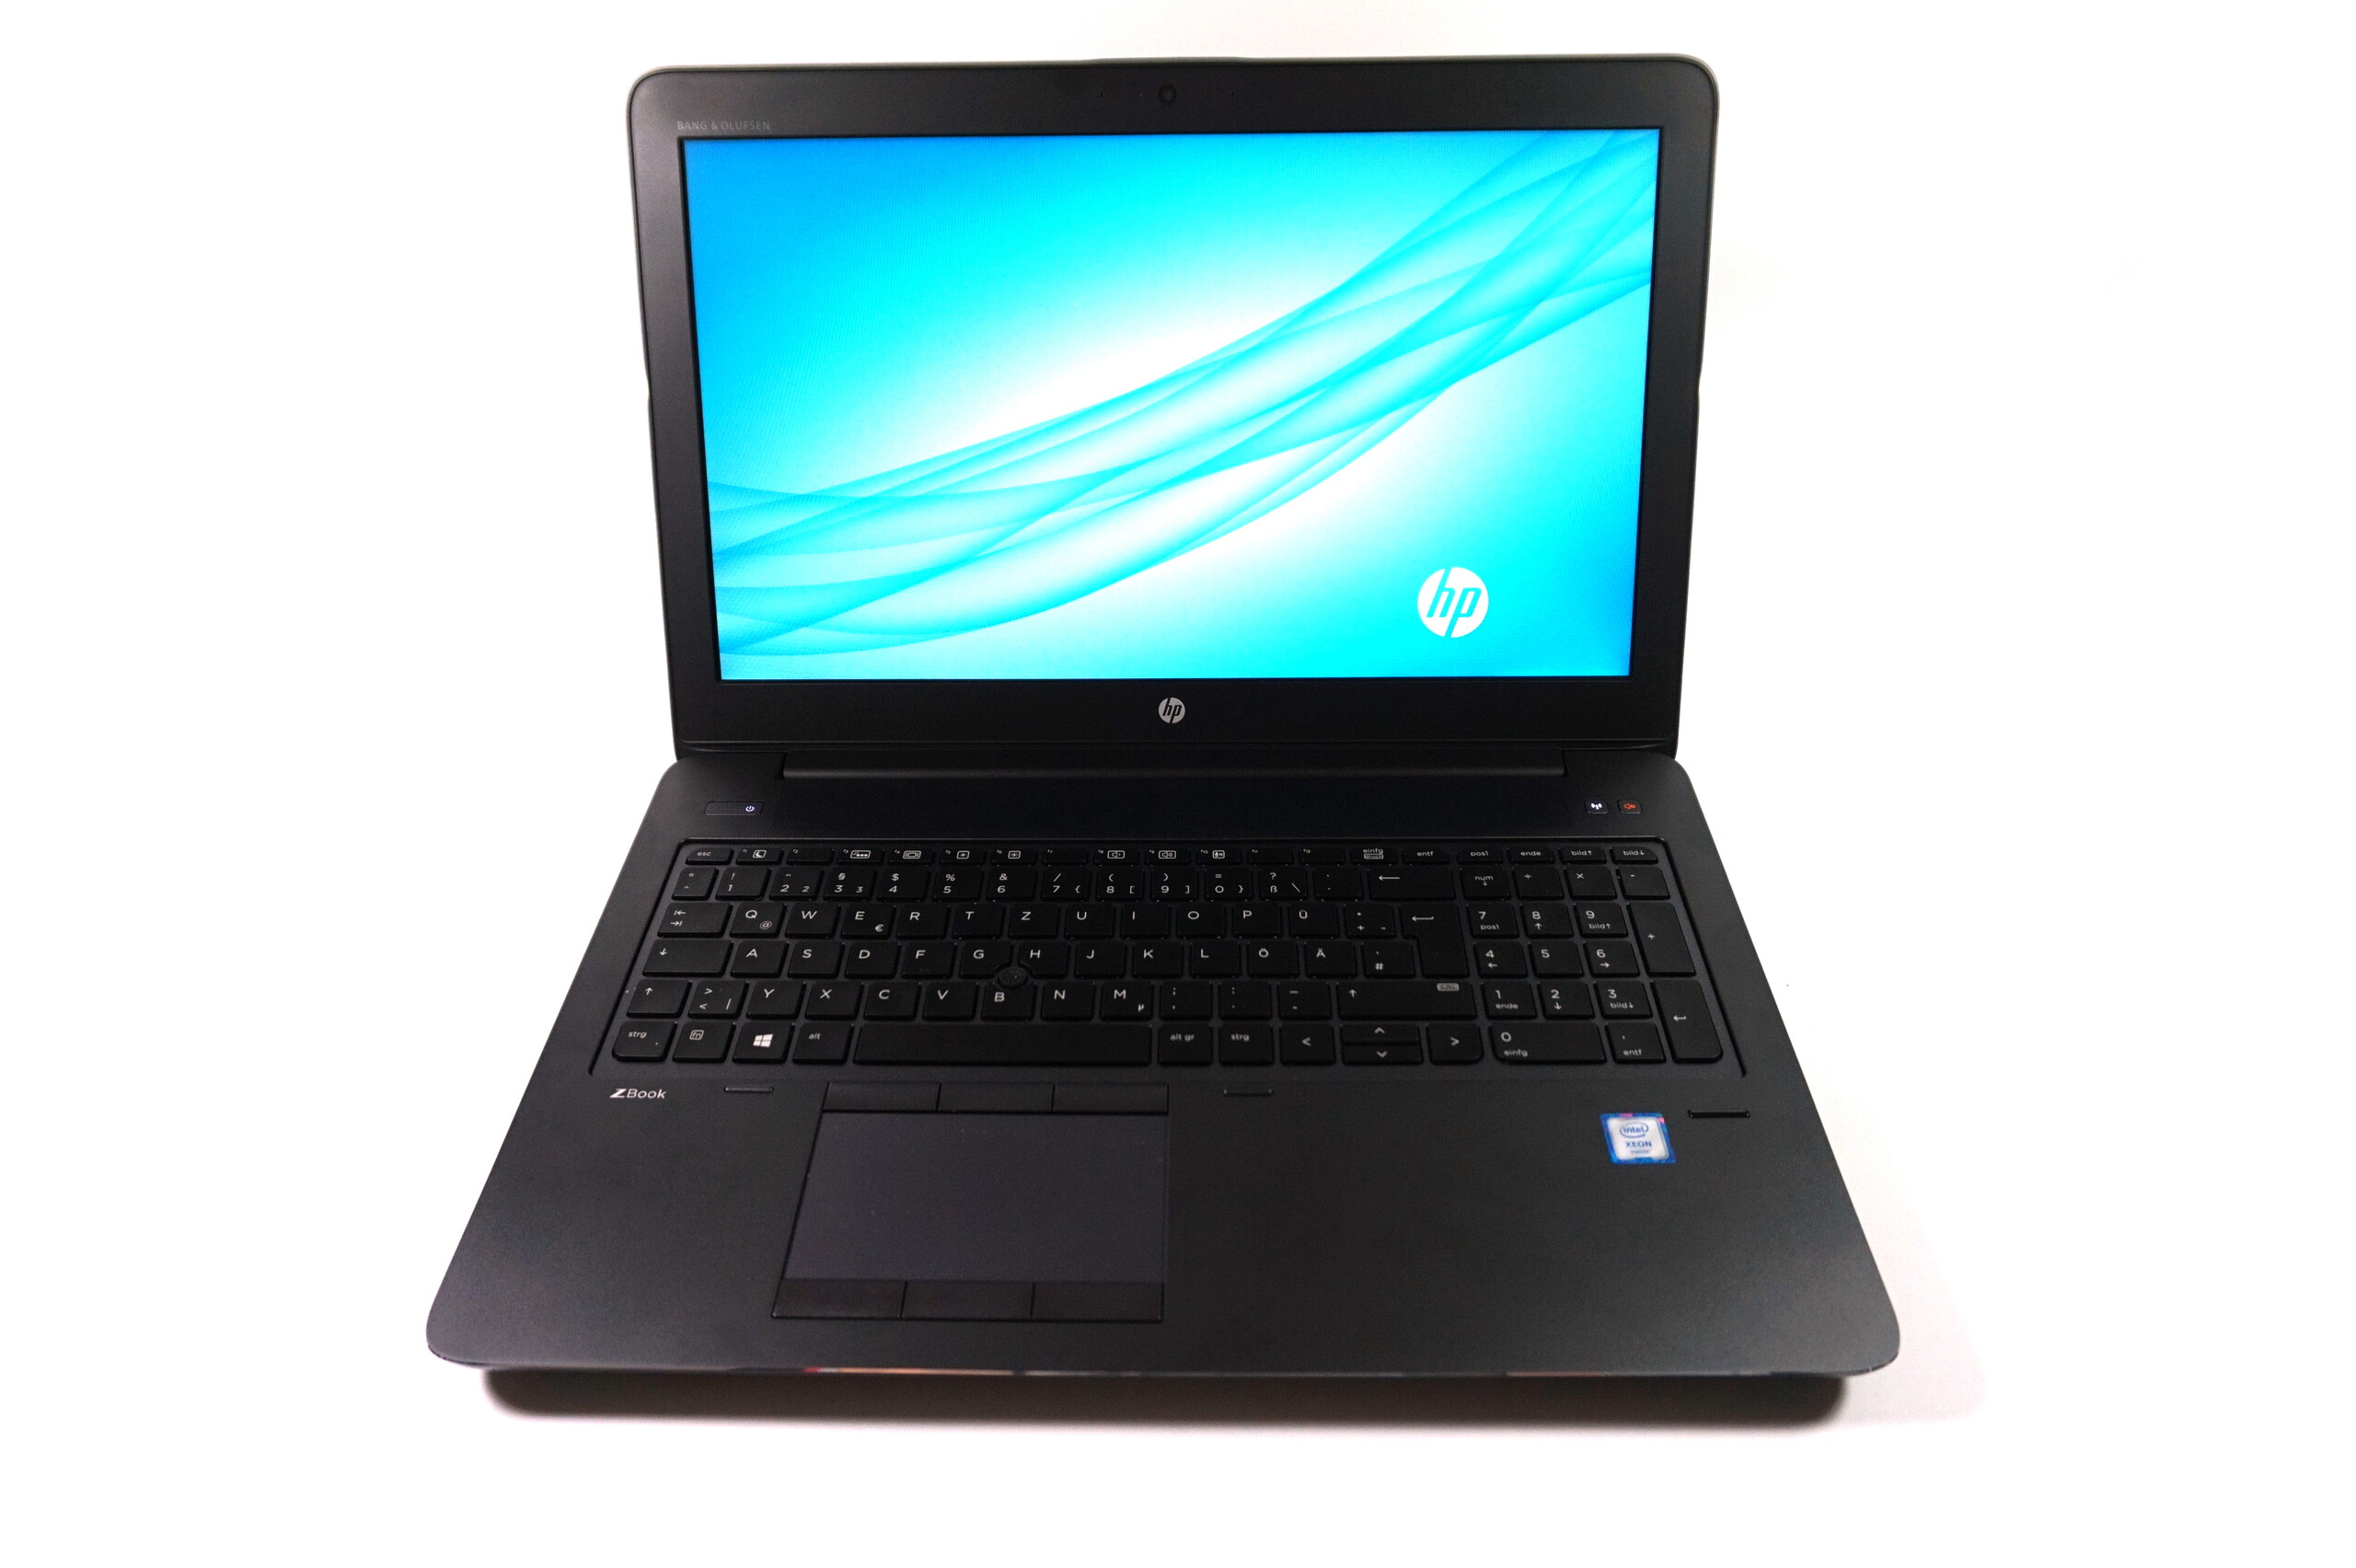
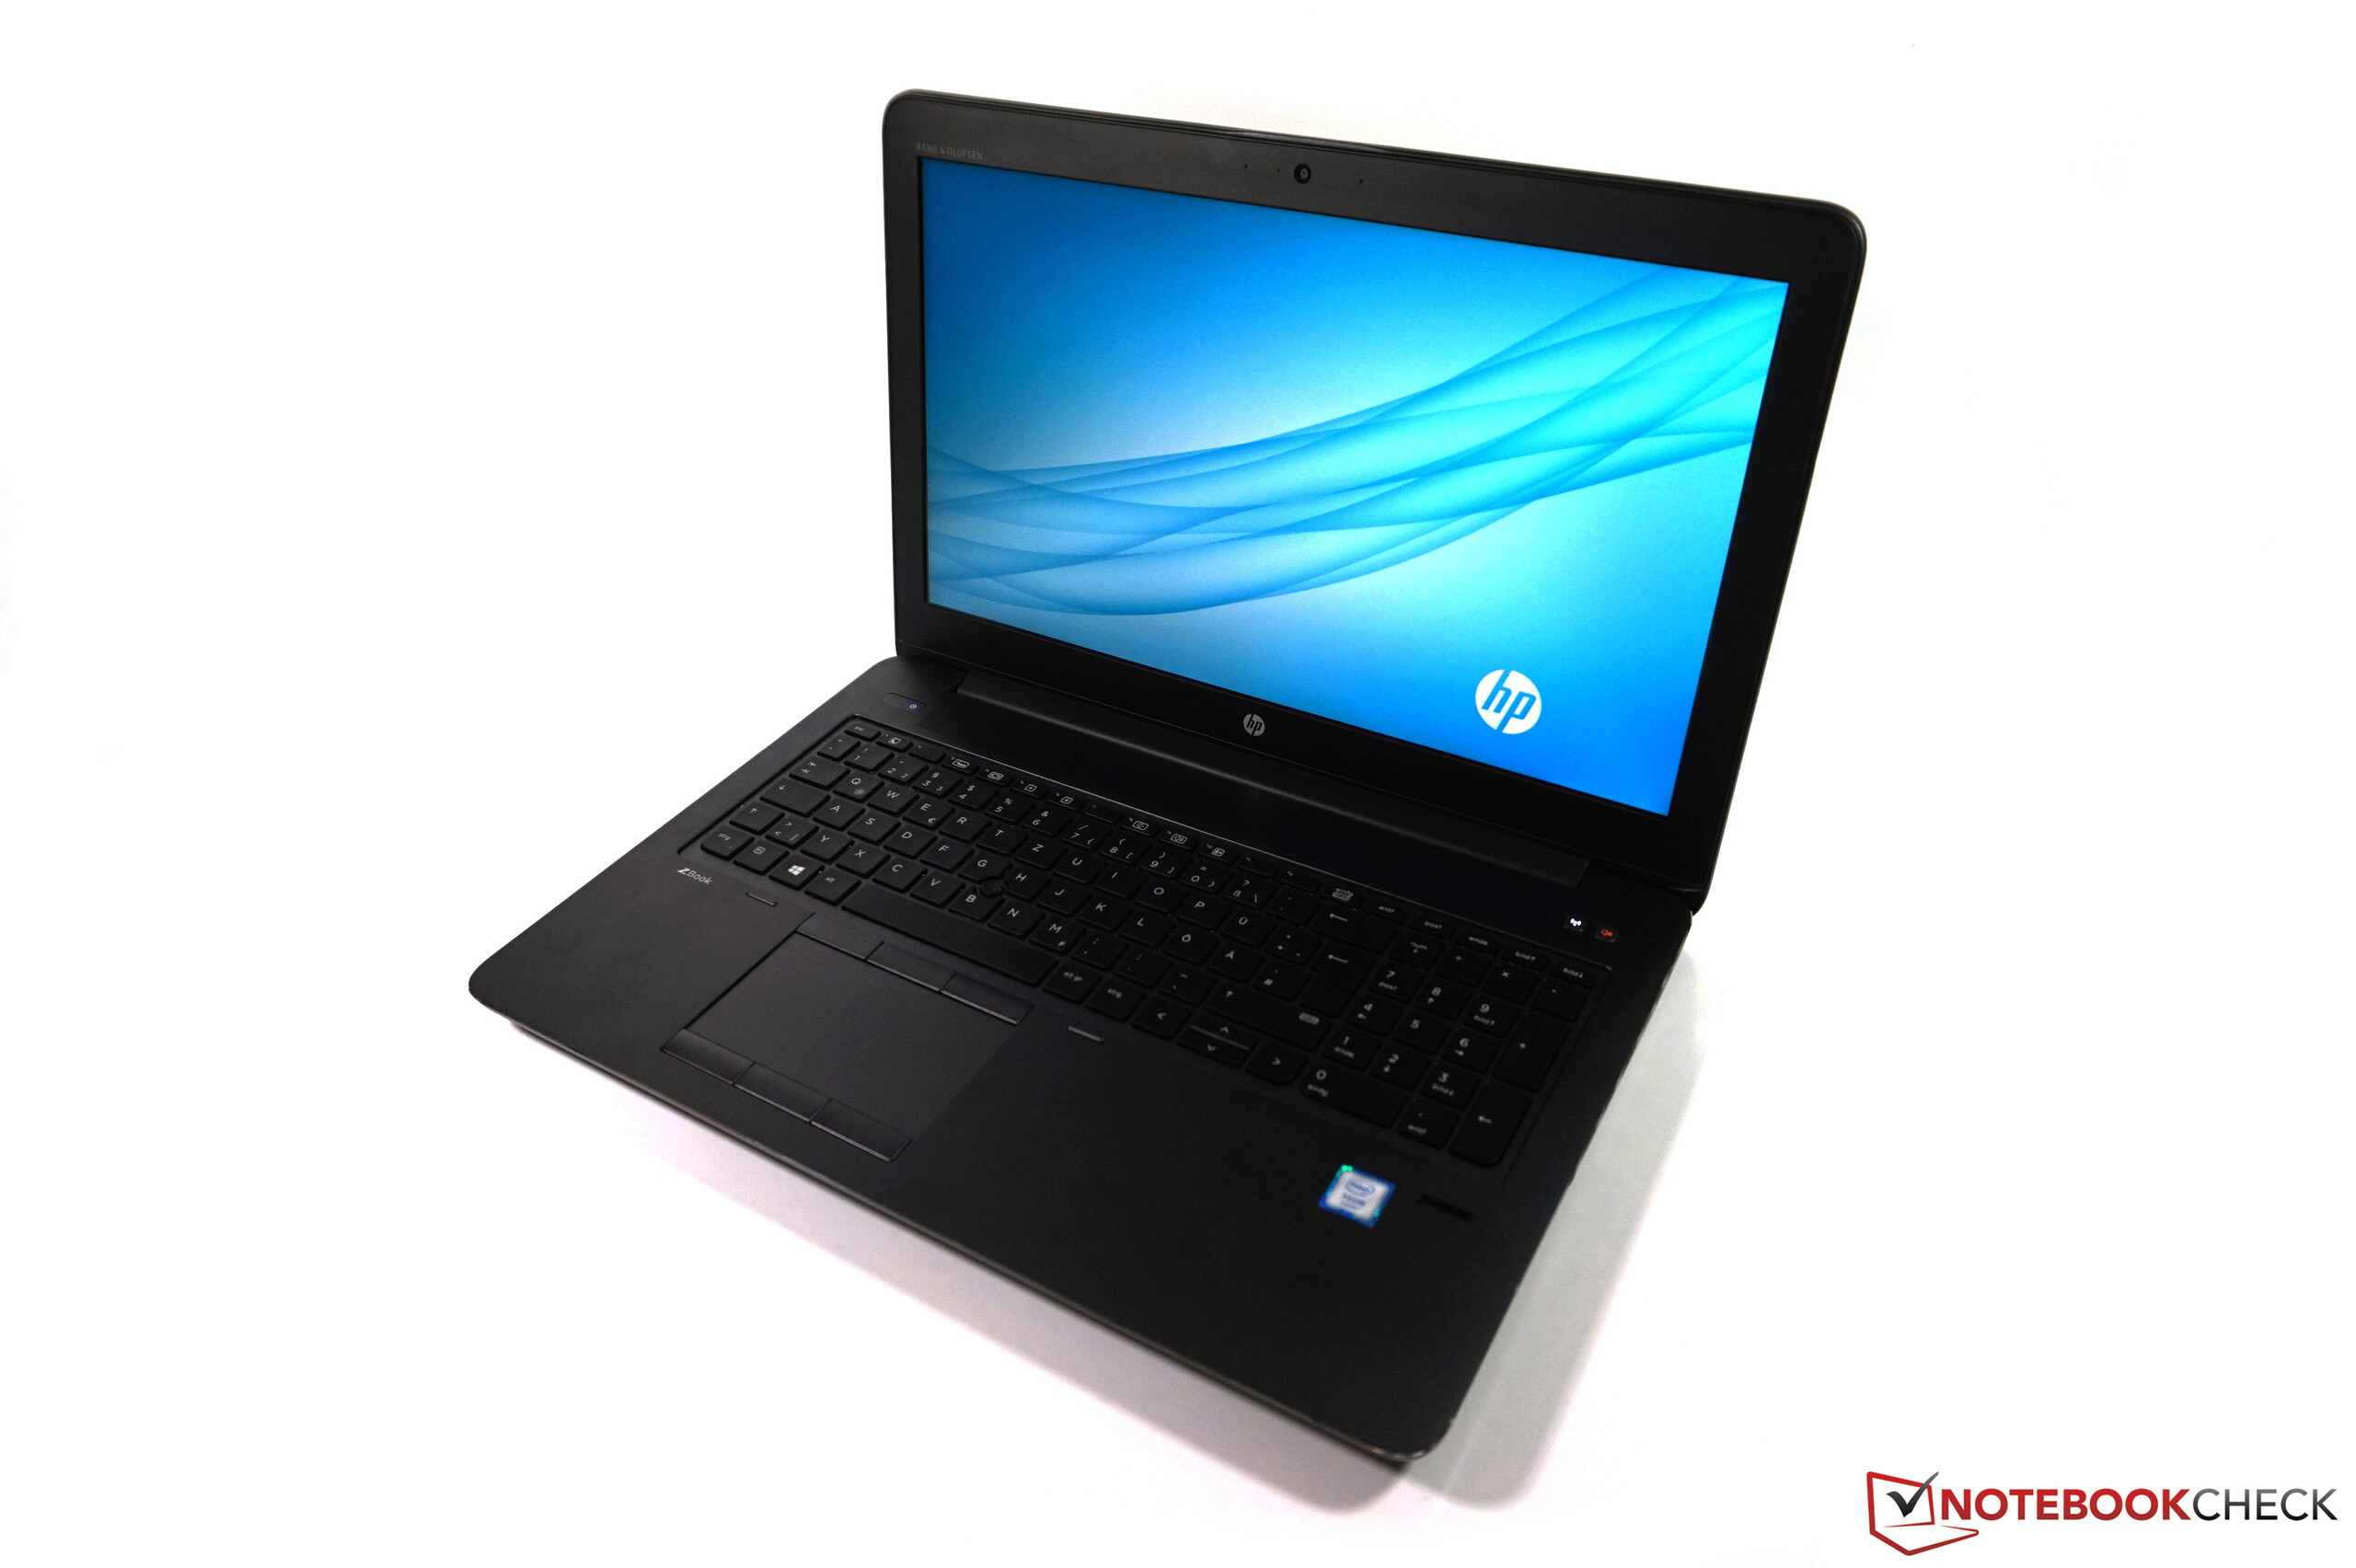
Breve análisis de la estación de trabajo HP ZBook 15 G4 (Xeon, Quadro M2200, Full-HD)
| SD Card Reader | |
| average JPG Copy Test (av. of 3 runs) | |
| HP ZBook 15 G4-Y4E80AV (Toshiba Exceria Pro SDXC 64 GB UHS-II) | |
| Lenovo ThinkPad P51 20HH0016GE (Toshiba Exceria Pro SDXC 64 GB UHS-II) | |
| HP ZBook 15 G3 (Toshiba Exceria Pro SDXC 64 GB UHS-II) | |
| Lenovo ThinkPad P50 (Toshiba Exceria Pro SDXC 64 GB UHS-II) | |
| MSI WE72 7RJ (Toshiba Exceria Pro SDXC 64 GB UHS-II) | |
| maximum AS SSD Seq Read Test (1GB) | |
| Lenovo ThinkPad P51 20HH0016GE (Toshiba Exceria Pro SDXC 64 GB UHS-II) | |
| HP ZBook 15 G4-Y4E80AV (Toshiba Exceria Pro SDXC 64 GB UHS-II) | |
| HP ZBook 15 G3 (Toshiba Exceria Pro SDXC 64 GB UHS-II) | |
| Lenovo ThinkPad P50 (Toshiba Exceria Pro SDXC 64 GB UHS-II) | |
| MSI WE72 7RJ (Toshiba Exceria Pro SDXC 64 GB UHS-II) | |
| Networking | |
| iperf3 transmit AX12 | |
| Lenovo ThinkPad P51 20HH0016GE | |
| HP ZBook 15 G4-Y4E80AV | |
| MSI WE72 7RJ | |
| iperf3 receive AX12 | |
| Lenovo ThinkPad P51 20HH0016GE | |
| HP ZBook 15 G4-Y4E80AV | |
| MSI WE72 7RJ | |
| |||||||||||||||||||||||||
iluminación: 89 %
Brillo con batería: 319 cd/m²
Contraste: 1107:1 (Negro: 0.29 cd/m²)
ΔE Color 4.5 | 0.5-29.43 Ø5
ΔE Greyscale 2.9 | 0.57-98 Ø5.3
82.6% sRGB (Argyll 1.6.3 3D)
54.2% AdobeRGB 1998 (Argyll 1.6.3 3D)
60.4% AdobeRGB 1998 (Argyll 2.2.0 3D)
82.7% sRGB (Argyll 2.2.0 3D)
64% Display P3 (Argyll 2.2.0 3D)
Gamma: 2.27
| HP ZBook 15 G4-Y4E80AV LG Philips LGD057E, , 1920x1080, 15.60 | Lenovo ThinkPad P51 20HH0016GE LEN40BD, B156ZAN02.1, , 3840x2160, 15.60 | MSI WE72 7RJ LP173WF4-SPF1, , 1920x1080, 17.30 | HP ZBook 15 G3 Samsung SDC5344, , 1920x1080, 15.60 | |
|---|---|---|---|---|
| Display | 40% | 4% | 11% | |
| Display P3 Coverage | 64 | 86.3 35% | 67.4 5% | 66.8 4% |
| sRGB Coverage | 82.7 | 99.5 20% | 85.3 3% | 95.5 15% |
| AdobeRGB 1998 Coverage | 60.4 | 99.3 64% | 62.4 3% | 69 14% |
| Response Times | -1% | -9% | -59% | |
| Response Time Grey 50% / Grey 80% * | 39.2 ? | 40.8 ? -4% | 45.2 ? -15% | 54 ? -38% |
| Response Time Black / White * | 25.6 ? | 25.2 ? 2% | 26.4 ? -3% | 35.6 ? -39% |
| PWM Frequency | 20830 ? | 198 ? -99% | ||
| Screen | 13% | -22% | -20% | |
| Brightness middle | 321 | 317 -1% | 302 -6% | 306 -5% |
| Brightness | 320 | 309 -3% | 306 -4% | 289 -10% |
| Brightness Distribution | 89 | 89 0% | 93 4% | 85 -4% |
| Black Level * | 0.29 | 0.36 -24% | 0.31 -7% | 0.34 -17% |
| Contrast | 1107 | 881 -20% | 974 -12% | 900 -19% |
| Colorchecker dE 2000 * | 4.5 | 2.7 40% | 6.2 -38% | 5.1 -13% |
| Colorchecker dE 2000 max. * | 9.5 | 4.1 57% | 10.6 -12% | 9.9 -4% |
| Greyscale dE 2000 * | 2.9 | 3 -3% | 7.3 -152% | 7.4 -155% |
| Gamma | 2.27 97% | 2.27 97% | 2.08 106% | 2.37 93% |
| CCT | 6519 100% | 6077 107% | 7020 93% | 7263 89% |
| Color Space (Percent of AdobeRGB 1998) | 54.2 | 87.6 62% | 56 3% | 63 16% |
| Color Space (Percent of sRGB) | 82.6 | 99.5 20% | 85.2 3% | 95 15% |
| Media total (Programa/Opciones) | 17% /
16% | -9% /
-15% | -23% /
-21% |
* ... más pequeño es mejor
Tiempos de respuesta del display
| ↔ Tiempo de respuesta de Negro a Blanco | ||
|---|---|---|
| 25.6 ms ... subida ↗ y bajada ↘ combinada | ↗ 14.8 ms subida | 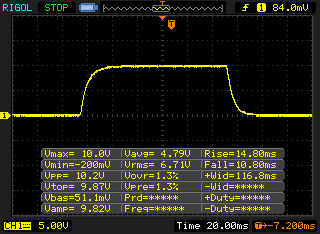 |
| ↘ 10.8 ms bajada | ||
| La pantalla mostró tiempos de respuesta relativamente lentos en nuestros tests pero podría ser demasiado lenta para los jugones. En comparación, todos los dispositivos de prueba van de ##min### (mínimo) a 240 (máximo) ms. » 56 % de todos los dispositivos son mejores. Eso quiere decir que el tiempo de respuesta es peor que la media (21.5 ms) de todos los dispositivos testados. | ||
| ↔ Tiempo de respuesta 50% Gris a 80% Gris | ||
| 39.2 ms ... subida ↗ y bajada ↘ combinada | ↗ 20.4 ms subida | 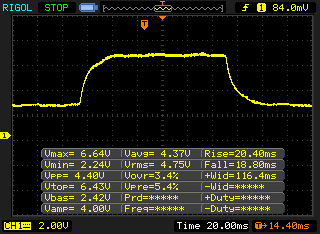 |
| ↘ 18.8 ms bajada | ||
| La pantalla mostró tiempos de respuesta lentos en nuestros tests y podría ser demasiado lenta para los jugones. En comparación, todos los dispositivos de prueba van de ##min### (mínimo) a 636 (máximo) ms. » 54 % de todos los dispositivos son mejores. Eso quiere decir que el tiempo de respuesta es peor que la media (33.7 ms) de todos los dispositivos testados. | ||
Parpadeo de Pantalla / PWM (Pulse-Width Modulation)
| Parpadeo de Pantalla / PWM detectado | 20830 Hz | ≤ 80 % de brillo | 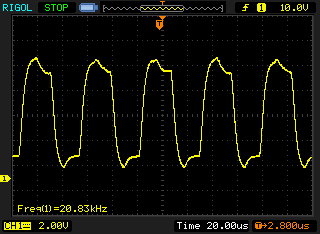 |
La retroiluminación del display parpadea a 20830 Hz (seguramente usa PWM - Pulse-Width Modulation) a un brillo del 80 % e inferior. Sobre este nivel de brillo no debería darse parpadeo / PWM. La frecuencia de 20830 Hz es bastante alta, por lo que la mayoría de gente sensible al parpadeo no debería ver parpadeo o tener fatiga visual. Comparación: 53 % de todos los dispositivos testados no usaron PWM para atenuar el display. Si se usó, medimos una media de 17900 (mínimo: 5 - máxmo: 3846000) Hz. | |||
| Cinebench R15 | |
| CPU Single 64Bit | |
| HP ZBook 15 G4-Y4E80AV | |
| Lenovo ThinkPad P51 20HH0016GE | |
| Fujitsu Celsius H970 | |
| MSI WE72 7RJ | |
| HP ZBook 15 G3 | |
| Lenovo ThinkPad P50 | |
| Lenovo ThinkPad P50 20ENV509PB | |
| CPU Multi 64Bit | |
| HP ZBook 15 G4-Y4E80AV | |
| Lenovo ThinkPad P51 20HH0016GE | |
| Lenovo ThinkPad P50 20ENV509PB | |
| MSI WE72 7RJ | |
| HP ZBook 15 G3 | |
| Lenovo ThinkPad P50 | |
| Fujitsu Celsius H970 | |
| PCMark 8 | |
| Home Score Accelerated v2 | |
| HP ZBook 15 G4-Y4E80AV | |
| MSI WE72 7RJ | |
| Lenovo ThinkPad P50 | |
| HP ZBook 15 G3 | |
| Lenovo ThinkPad P51 20HH0016GE | |
| Work Score Accelerated v2 | |
| HP ZBook 15 G4-Y4E80AV | |
| HP ZBook 15 G3 | |
| MSI WE72 7RJ | |
| Lenovo ThinkPad P50 | |
| Lenovo ThinkPad P51 20HH0016GE | |
| PCMark 10 | |
| Score | |
| HP ZBook 15 G4-Y4E80AV | |
| Essentials | |
| HP ZBook 15 G4-Y4E80AV | |
| Productivity | |
| HP ZBook 15 G4-Y4E80AV | |
| Digital Content Creation | |
| HP ZBook 15 G4-Y4E80AV | |
| PCMark 8 Home Score Accelerated v2 | 4375 puntos | |
| PCMark 8 Creative Score Accelerated v2 | 5663 puntos | |
| PCMark 8 Work Score Accelerated v2 | 5423 puntos | |
| PCMark 10 Score | 4834 puntos | |
ayuda | ||
| HP ZBook 15 G4-Y4E80AV Samsung SSD SM961 1TB M.2 MZVKW1T0HMLH | Lenovo ThinkPad P51 20HH0016GE Samsung PM961 NVMe MZVLW512HMJP | HP ZBook 15 G3 Samsung SM951 MZVPV512HDGL m.2 PCI-e | MSI WE72 7RJ Samsung SM961 MZVPW256 m.2 PCI-e | Lenovo ThinkPad P50 Samsung SM951 MZVPV256HDGL m.2 PCI-e | |
|---|---|---|---|---|---|
| CrystalDiskMark 3.0 | 13% | 19% | -6% | 30% | |
| Read Seq | 2166 | 1705 -21% | 1502 -31% | 1492 -31% | 1771 -18% |
| Write Seq | 1682 | 1541 -8% | 1538 -9% | 1512 -10% | 1304 -22% |
| Read 512 | 411.6 | 1038 152% | 1164 183% | 312.6 -24% | 1364 231% |
| Write 512 | 1175 | 1157 -2% | 1432 22% | 1483 26% | 1291 10% |
| Read 4k | 57.5 | 61.3 7% | 59.1 3% | 59.9 4% | 60.2 5% |
| Write 4k | 187.6 | 176 -6% | 207.3 11% | 184.2 -2% | 256.7 37% |
| Read 4k QD32 | 733 | 664 -9% | 798 9% | 681 -7% | 953 30% |
| Write 4k QD32 | 619 | 560 -10% | 393.8 -36% | 590 -5% | 389.6 -37% |

| SPECviewperf 11 | |
| 1920x1080 Siemens NX | |
| HP ZBook 15 G4-Y4E80AV | |
| MSI WE72 7RJ | |
| HP ZBook 15 G3 | |
| Saelic Veni G422 G7TPK4 | |
| 1920x1080 Tcvis | |
| HP ZBook 15 G4-Y4E80AV | |
| MSI WE72 7RJ | |
| HP ZBook 15 G3 | |
| Saelic Veni G422 G7TPK4 | |
| 1920x1080 SolidWorks | |
| HP ZBook 15 G4-Y4E80AV | |
| HP ZBook 15 G3 | |
| MSI WE72 7RJ | |
| Saelic Veni G422 G7TPK4 | |
| 1920x1080 Pro/ENGINEER | |
| HP ZBook 15 G4-Y4E80AV | |
| HP ZBook 15 G3 | |
| MSI WE72 7RJ | |
| Saelic Veni G422 G7TPK4 | |
| 1920x1080 Maya | |
| HP ZBook 15 G3 | |
| HP ZBook 15 G4-Y4E80AV | |
| MSI WE72 7RJ | |
| Saelic Veni G422 G7TPK4 | |
| 1920x1080 Lightwave | |
| HP ZBook 15 G4-Y4E80AV | |
| HP ZBook 15 G3 | |
| MSI WE72 7RJ | |
| Saelic Veni G422 G7TPK4 | |
| 1920x1080 Ensight | |
| HP ZBook 15 G4-Y4E80AV | |
| MSI WE72 7RJ | |
| Saelic Veni G422 G7TPK4 | |
| HP ZBook 15 G3 | |
| 1920x1080 Catia | |
| HP ZBook 15 G3 | |
| HP ZBook 15 G4-Y4E80AV | |
| MSI WE72 7RJ | |
| Saelic Veni G422 G7TPK4 | |
| SPECviewperf 12 | |
| 1900x1060 Solidworks (sw-03) | |
| HP ZBook 15 G4-Y4E80AV | |
| MSI WE72 7RJ | |
| HP ZBook 15 G3 | |
| 1900x1060 Siemens NX (snx-02) | |
| HP ZBook 15 G4-Y4E80AV | |
| MSI WE72 7RJ | |
| HP ZBook 15 G3 | |
| 1900x1060 Showcase (showcase-01) | |
| MSI WE72 7RJ | |
| HP ZBook 15 G4-Y4E80AV | |
| HP ZBook 15 G3 | |
| 1900x1060 Medical (medical-01) | |
| HP ZBook 15 G4-Y4E80AV | |
| MSI WE72 7RJ | |
| HP ZBook 15 G3 | |
| 1900x1060 Maya (maya-04) | |
| HP ZBook 15 G4-Y4E80AV | |
| MSI WE72 7RJ | |
| HP ZBook 15 G3 | |
| 1900x1060 Energy (energy-01) | |
| HP ZBook 15 G4-Y4E80AV | |
| MSI WE72 7RJ | |
| HP ZBook 15 G3 | |
| 1900x1060 Creo (creo-01) | |
| HP ZBook 15 G4-Y4E80AV | |
| MSI WE72 7RJ | |
| HP ZBook 15 G3 | |
| 1900x1060 Catia (catia-04) | |
| MSI WE72 7RJ | |
| HP ZBook 15 G4-Y4E80AV | |
| HP ZBook 15 G3 | |
| SiSoft Sandra 2016 | |
| GP Financial Analysis (FP High/Double Precision) | |
| Lenovo ThinkPad P51 20HH0016GE | |
| HP ZBook 15 G4-Y4E80AV | |
| HP ZBook 15 G3 | |
| Lenovo ThinkPad P50 | |
| GP Cryptography (Higher Security AES256+SHA2-512) | |
| HP ZBook 15 G4-Y4E80AV | |
| Lenovo ThinkPad P51 20HH0016GE | |
| HP ZBook 15 G3 | |
| Lenovo ThinkPad P50 | |
| Image Processing | |
| Lenovo ThinkPad P51 20HH0016GE | |
| HP ZBook 15 G4-Y4E80AV | |
| HP ZBook 15 G3 | |
| Lenovo ThinkPad P50 | |
| 3DMark | |
| 1280x720 Cloud Gate Standard Graphics | |
| Saelic Veni G422 G7TPK4 | |
| MSI WE72 7RJ | |
| HP ZBook 15 G4-Y4E80AV | |
| Lenovo ThinkPad P51 20HH0016GE | |
| HP ZBook 15 G3 | |
| Asus G752VL-T7023T | |
| 1920x1080 Fire Strike Graphics | |
| Saelic Veni G422 G7TPK4 | |
| MSI WE72 7RJ | |
| Lenovo ThinkPad P51 20HH0016GE | |
| HP ZBook 15 G4-Y4E80AV | |
| Asus G752VL-T7023T | |
| HP ZBook 15 G3 | |
| Unigine Valley 1.0 | |
| 1920x1080 Extreme HD Preset OpenGL AA:x8 | |
| Lenovo ThinkPad P51 20HH0016GE | |
| HP ZBook 15 G4-Y4E80AV | |
| MSI WE72 7RJ | |
| HP ZBook 15 G3 | |
| 1920x1080 Extreme HD DirectX AA:x8 | |
| MSI WE72 7RJ | |
| HP ZBook 15 G4-Y4E80AV | |
| Lenovo ThinkPad P51 20HH0016GE | |
| HP ZBook 15 G3 | |
| Unigine Heaven 4.0 | |
| Extreme Preset DX11 | |
| MSI WE72 7RJ | |
| Lenovo ThinkPad P51 20HH0016GE | |
| HP ZBook 15 G4-Y4E80AV | |
| Extreme Preset OpenGL | |
| Lenovo ThinkPad P51 20HH0016GE | |
| HP ZBook 15 G4-Y4E80AV | |
| MSI WE72 7RJ | |
| 3DMark Ice Storm Standard Score | 144957 puntos | |
| 3DMark Cloud Gate Standard Score | 22003 puntos | |
| 3DMark Fire Strike Score | 5232 puntos | |
| 3DMark Time Spy Score | 1903 puntos | |
ayuda | ||
| The Witcher 3 | |
| 1366x768 Medium Graphics & Postprocessing | |
| Lenovo ThinkPad P51 20HH0016GE | |
| MSI GE72 965M Ti | |
| HP ZBook 15 G4-Y4E80AV | |
| Lenovo ThinkPad P50 | |
| HP ZBook 15 G3 | |
| 1920x1080 High Graphics & Postprocessing (Nvidia HairWorks Off) | |
| Gigabyte Sabre 15G | |
| Lenovo ThinkPad P51 20HH0016GE | |
| MSI GE72 965M Ti | |
| HP ZBook 15 G4-Y4E80AV | |
| Lenovo ThinkPad P50 | |
| HP ZBook 15 G3 | |
| bajo | medio | alto | ultra | |
| BioShock Infinite (2013) | 270.9 | 174.1 | 149.1 | 56.8 |
| The Witcher 3 (2015) | 104.6 | 63.4 | 30.3 | 18 |
| Rise of the Tomb Raider (2016) | 123 | 68.5 | 37.4 | 33 |
Ruido
| Ocioso |
| 29.5 / 29.5 / 30 dB(A) |
| Carga |
| 39.5 / 36 dB(A) |
 | ||
30 dB silencioso 40 dB(A) audible 50 dB(A) ruidosamente alto |
||
min: | ||
(-) The maximum temperature on the upper side is 50.8 °C / 123 F, compared to the average of 38.1 °C / 101 F, ranging from 22.2 to 69.8 °C for the class Workstation.
(-) The bottom heats up to a maximum of 57.4 °C / 135 F, compared to the average of 41.3 °C / 106 F
(+) In idle usage, the average temperature for the upper side is 25.5 °C / 78 F, compared to the device average of 32 °C / 90 F.
(±) Playing The Witcher 3, the average temperature for the upper side is 33.5 °C / 92 F, compared to the device average of 32 °C / 90 F.
(+) The palmrests and touchpad are cooler than skin temperature with a maximum of 29 °C / 84.2 F and are therefore cool to the touch.
(±) The average temperature of the palmrest area of similar devices was 27.8 °C / 82 F (-1.2 °C / -2.2 F).
HP ZBook 15 G4-Y4E80AV audio analysis
(±) | speaker loudness is average but good (77.1 dB)
Bass 100 - 315 Hz
(±) | reduced bass - on average 13.6% lower than median
(±) | linearity of bass is average (9.7% delta to prev. frequency)
Mids 400 - 2000 Hz
(+) | balanced mids - only 3.8% away from median
(+) | mids are linear (5.8% delta to prev. frequency)
Highs 2 - 16 kHz
(±) | higher highs - on average 7% higher than median
(+) | highs are linear (5.8% delta to prev. frequency)
Overall 100 - 16.000 Hz
(±) | linearity of overall sound is average (19.2% difference to median)
Compared to same class
» 61% of all tested devices in this class were better, 6% similar, 33% worse
» The best had a delta of 7%, average was 18%, worst was 35%
Compared to all devices tested
» 41% of all tested devices were better, 7% similar, 52% worse
» The best had a delta of 4%, average was 25%, worst was 134%
Lenovo ThinkPad P51 20HH0016GE audio analysis
(-) | not very loud speakers (64.5 dB)
Bass 100 - 315 Hz
(±) | reduced bass - on average 12.3% lower than median
(±) | linearity of bass is average (10.4% delta to prev. frequency)
Mids 400 - 2000 Hz
(+) | balanced mids - only 3.9% away from median
(+) | mids are linear (6.4% delta to prev. frequency)
Highs 2 - 16 kHz
(+) | balanced highs - only 2.7% away from median
(±) | linearity of highs is average (13.3% delta to prev. frequency)
Overall 100 - 16.000 Hz
(±) | linearity of overall sound is average (24.7% difference to median)
Compared to same class
» 82% of all tested devices in this class were better, 3% similar, 15% worse
» The best had a delta of 7%, average was 18%, worst was 35%
Compared to all devices tested
» 71% of all tested devices were better, 6% similar, 23% worse
» The best had a delta of 4%, average was 25%, worst was 134%
| Off / Standby | |
| Ocioso | |
| Carga |
|
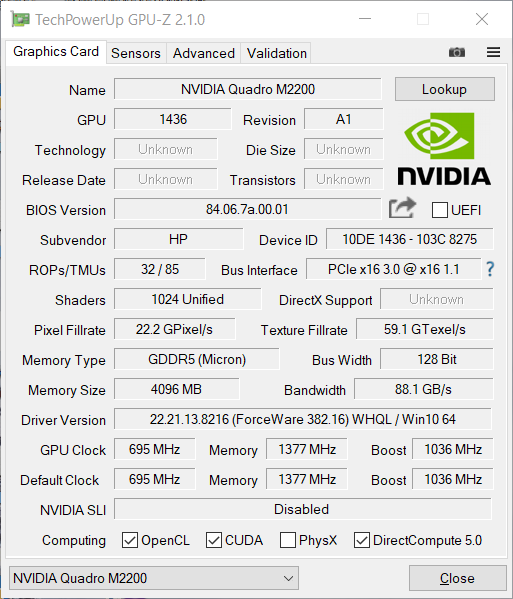
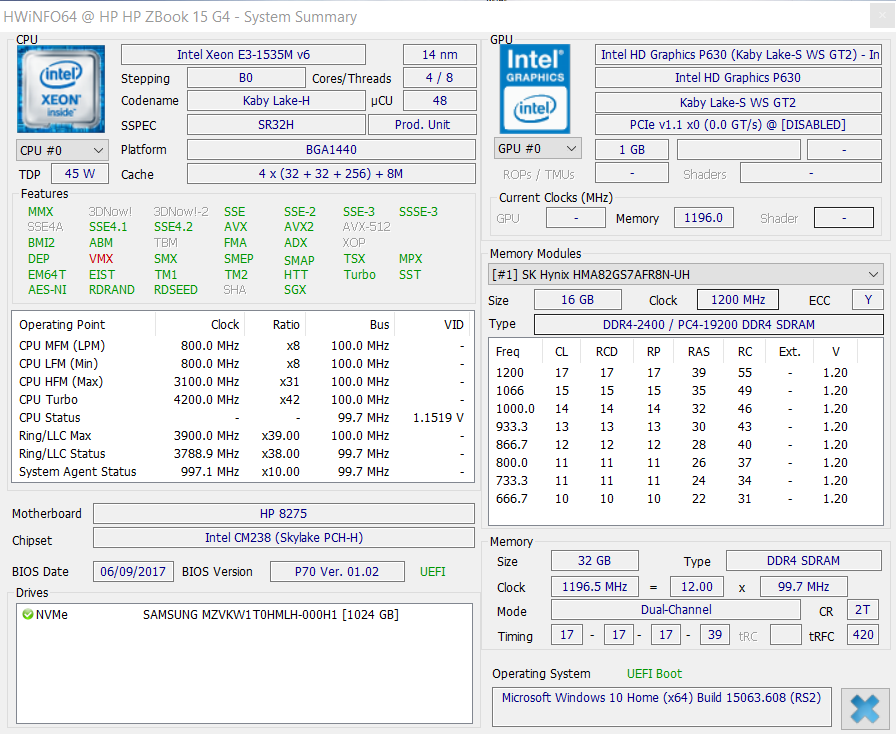
| HP ZBook 15 G4-Y4E80AV E3-1535M v6, Quadro M2200, Samsung SSD SM961 1TB M.2 MZVKW1T0HMLH, IPS, 1920x1080, 15.60 | Lenovo ThinkPad P51 20HH0016GE E3-1505M v6, Quadro M2200, Samsung PM961 NVMe MZVLW512HMJP, IPS, 3840x2160, 15.60 | MSI WE72 7RJ i7-7700HQ, Quadro M2200, Samsung SM961 MZVPW256 m.2 PCI-e, IPS, 1920x1080, 17.30 | HP ZBook 15 G3 E3-1505M v5, Quadro M2000M, Samsung SM951 MZVPV512HDGL m.2 PCI-e, UWVA-IPS, 1920x1080, 15.60 | |
|---|---|---|---|---|
| Power Consumption | -35% | -68% | -2% | |
| Idle Minimum * | 5.9 | 8.6 -46% | 15 -154% | 5.7 3% |
| Idle Average * | 8.9 | 15.9 -79% | 20.1 -126% | 12.2 -37% |
| Idle Maximum * | 12.7 | 22.1 -74% | 23.8 -87% | 12.6 1% |
| Load Average * | 95.2 | 84.4 11% | 85.6 10% | 83.1 13% |
| Witcher 3 ultra * | 87.7 | |||
| Load Maximum * | 154 | 130.6 15% | 128 17% | 138.2 10% |
* ... más pequeño es mejor
| HP ZBook 15 G4-Y4E80AV E3-1535M v6, Quadro M2200, 90 Wh | Lenovo ThinkPad P51 20HH0016GE E3-1505M v6, Quadro M2200, 90 Wh | MSI WE72 7RJ i7-7700HQ, Quadro M2200, 51 Wh | HP ZBook 15 G3 E3-1505M v5, Quadro M2000M, 90 Wh | Lenovo ThinkPad P50 E3-1505M v5, Quadro M2000M, 90 Wh | |
|---|---|---|---|---|---|
| Duración de Batería | -20% | -70% | -22% | -40% | |
| Reader / Idle | 1096 | 981 -10% | 268 -76% | 822 -25% | 539 -51% |
| H.264 | 629 | 455 -28% | 181 -71% | 449 -29% | 331 -47% |
| WiFi v1.3 | 547 | 413 -24% | 177 -68% | 386 -29% | 288 -47% |
| Load | 115 | 95 -17% | 42 -63% | 110 -4% | 98 -15% |
Pro
Contra
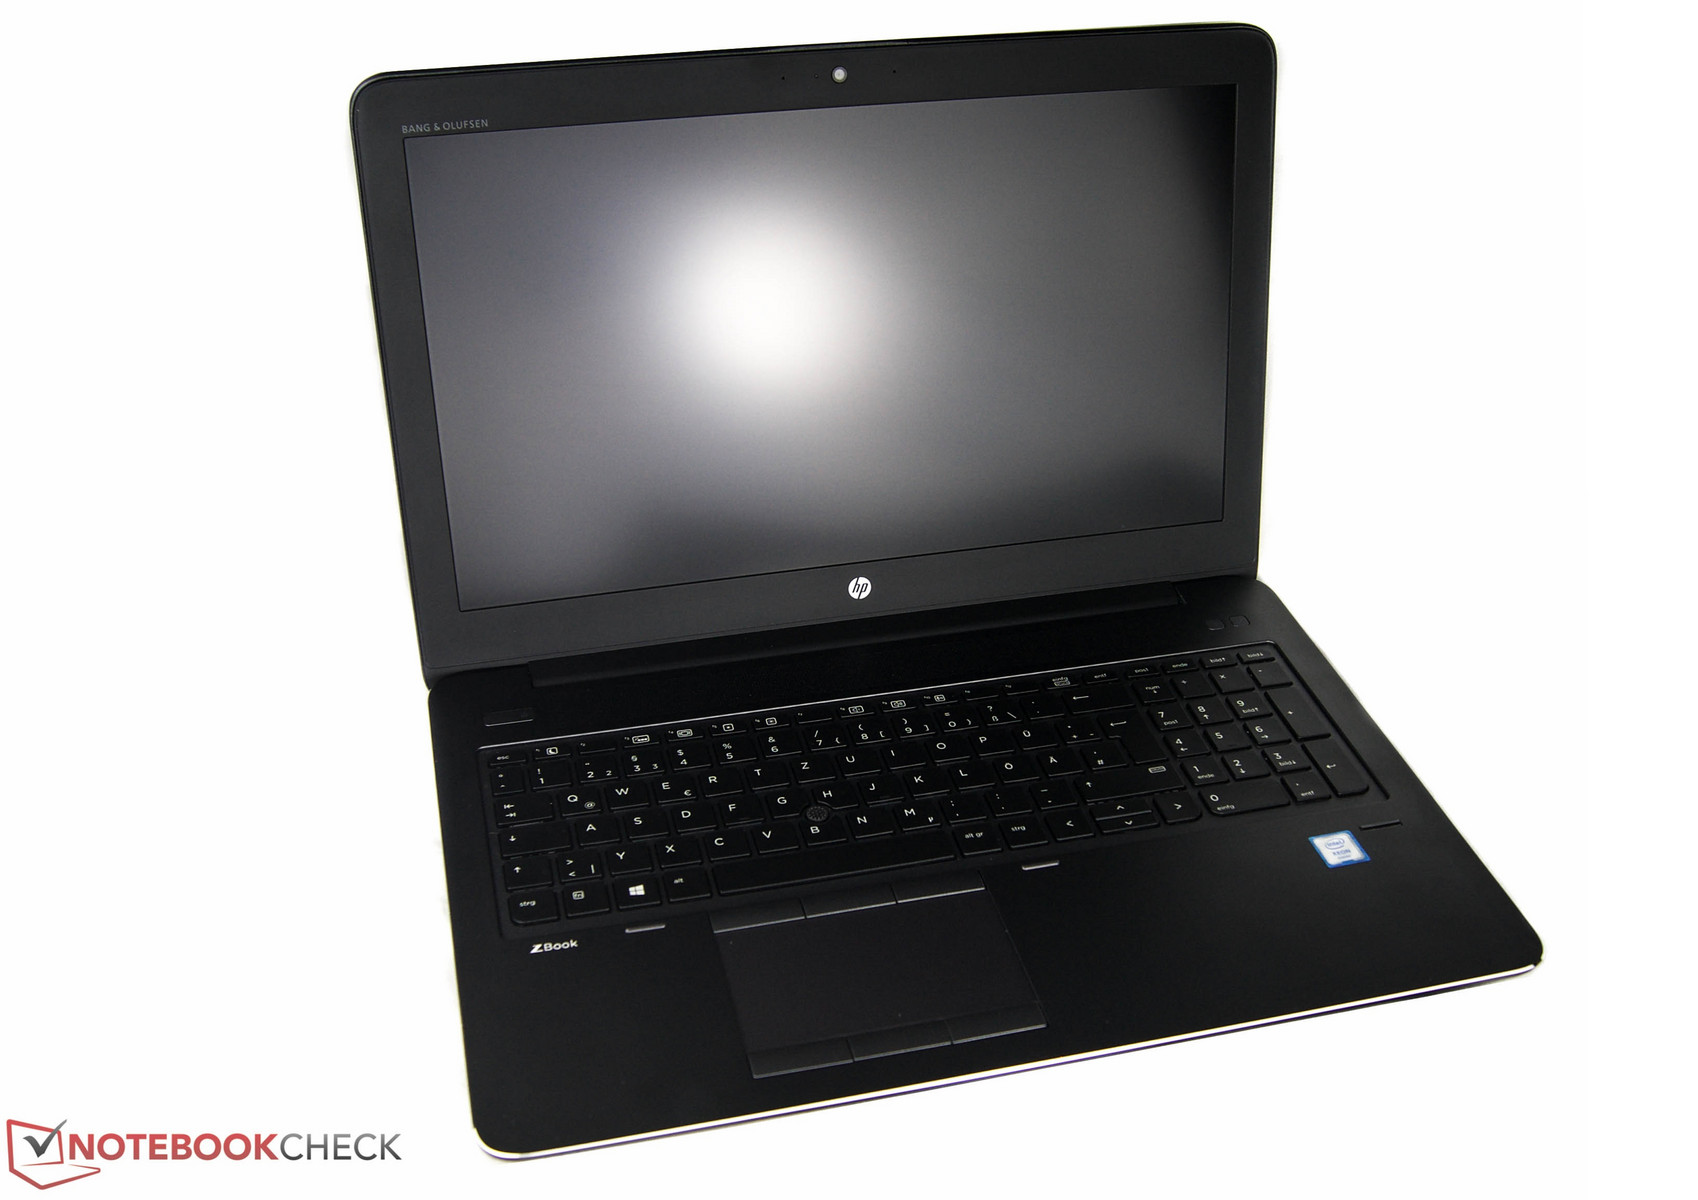
El ZBook entra en la siguiente ronda con un aumento persuasivo de la potencia de rendimiento. En nuestro análisis de la última generación, todo lo que teníamos que decit eran palabras de alabanza para el diseño y la estabilidad de la carcasa. También estábamos impresionados con la amplia selección de puertos y una buena capacidad de actualización. El actual ZBook G4 está de nuevo disponible en una serie de configuraciones diferentes. Tuvimos el placer de probar el modelo superior. Sólo en el ámbito de la pantalla hemos visto mucho que mejorar. Estamos particularmente decepcionados de que la cobertura del espacio de color de la pantalla es menor que en la generación anterior. Pero en todos los demás aspectos, el G4 es mejor que su predecesor, especialmente teniendo en cuenta el gran poder que permanece inactivo en su interior. El potente procesador Xeon y la mejora de la GPU juntos producen un marcado auge en el rendimiento informático y gráfico. A pesar de este aumento en el rendimiento, las temperaturas del portátil siguen siendo un poco más bajas, y su gestión de la energía está mejor equilibrada. Pero como si eso no fuera suficiente: La vida de la batería es ahora lo suficientemente fuerte incluso para un día de trabajo algo prolongado. Desafortunadamente, la imagen general está un poco empañada por los altavoces débiles y silenciosos. Esperamos ver mejoras aquí en las próximas generaciones.
Con todo, el nuevo HP ZBook demuestra de nuevo ser una estación de trabajo portátil muy buena.
El ZBook está disponible en Alemania a partir de 2200 Euros. Nuestro dispositivo de prueba cuesta 4650 euros. Sin embargo, una configuración con un procesador ligeramente más débil y más barato puede ser más sensato. Antes de tomar una decisión, echa un vistazo a la competencia - como el Lenovo ThinkPad P51 - quen duda vale la pena.
Ésta es una versión acortada del análisis original. Puedes leer el análisis completo en inglés aquí.
HP ZBook 15 G4-Y4E80AV
-
09/27/2017 v6(old)
Nino Ricchizzi