 Deutsch
 English
 Español
 Français
 Italiano
 Nederlands
 Polski
 Português
 Русский
 Türkçe
 Svenska
 Chinese
 Magyar
Breve análisis del Acer Predator 17 G9-793


| SD Card Reader | |
| average JPG Copy Test (av. of 3 runs) | |
| SCHENKER XMG U716 | |
| MSI GT72VR 6RE-015US | |
| Alienware 17 R3 (A17-9935) | |
| Acer Predator 17 G9-793-77LG | |
| Asus G752VS-XB78K | |
| maximum AS SSD Seq Read Test (1GB) | |
| SCHENKER XMG U716 | |
| MSI GT72VR 6RE-015US | |
| Acer Predator 17 G9-793-77LG | |
| Alienware 17 R3 (A17-9935) | |
| Asus G752VS-XB78K | |
| Networking | |
| iperf Server (receive) TCP 1 m | |
| Asus G752VS-XB78K | |
| Acer Predator 17 G9-793-77LG | |
| iperf Client (transmit) TCP 1 m | |
| Acer Predator 17 G9-793-77LG | |
| Asus G752VS-XB78K | |
| |||||||||||||||||||||||||
iluminación: 88 %
Brillo con batería: 336 cd/m²
Contraste: 1344:1 (Negro: 0.25 cd/m²)
ΔE Color 3.61 | 0.5-29.43 Ø5
ΔE Greyscale 4.78 | 0.57-98 Ø5.3
100% sRGB (Argyll 1.6.3 3D)
88% AdobeRGB 1998 (Argyll 1.6.3 3D)
99.4% AdobeRGB 1998 (Argyll 2.2.0 3D)
100% sRGB (Argyll 2.2.0 3D)
86.9% Display P3 (Argyll 2.2.0 3D)
Gamma: 2.32
| Acer Predator 17 G9-793-77LG AU Optronics B173ZAN01.0 (AUO109B), 3840x2160 | Asus G752VS-XB78K LG Philips LP173WF4-SPF3 (LGD04E8), 1920x1080 | MSI GT72VR 6RE-015US LG Philips LGD046E, 1920x1080 | Alienware 17 R3 (A17-9935) CV69H_173WF4 (LGD0459), 1920x1080 | SCHENKER XMG U716 AU B173ZAN01.0 (AUO109B), 3840x2160 | |
|---|---|---|---|---|---|
| Display | -25% | -23% | -26% | 0% | |
| Display P3 Coverage | 86.9 | 66.9 -23% | 68.3 -21% | 66.9 -23% | 86.5 0% |
| sRGB Coverage | 100 | 85.2 -15% | 86.7 -13% | 83.9 -16% | 100 0% |
| AdobeRGB 1998 Coverage | 99.4 | 62.3 -37% | 63.4 -36% | 61.4 -38% | 99 0% |
| Response Times | 3% | 1% | 8% | -20% | |
| Response Time Grey 50% / Grey 80% * | 37 ? | 38 ? -3% | 34.4 ? 7% | 33 ? 11% | 45 ? -22% |
| Response Time Black / White * | 24 ? | 22 ? 8% | 25.2 ? -5% | 23 ? 4% | 28 ? -17% |
| PWM Frequency | |||||
| Screen | -10% | -10% | -24% | -11% | |
| Brightness middle | 336 | 328 -2% | 348.7 4% | 360 7% | 374 11% |
| Brightness | 320 | 317 -1% | 327 2% | 336 5% | 356 11% |
| Brightness Distribution | 88 | 88 0% | 89 1% | 90 2% | 88 0% |
| Black Level * | 0.25 | 0.3 -20% | 0.323 -29% | 0.44 -76% | 0.4 -60% |
| Contrast | 1344 | 1093 -19% | 1080 -20% | 818 -39% | 935 -30% |
| Colorchecker dE 2000 * | 3.61 | 3.74 -4% | 4.09 -13% | 4.76 -32% | 4.23 -17% |
| Colorchecker dE 2000 max. * | 6.02 | 8.97 -49% | 9.02 -50% | 10.8 -79% | 6.7 -11% |
| Greyscale dE 2000 * | 4.78 | 2.67 44% | 2.14 55% | 3.69 23% | 5.48 -15% |
| Gamma | 2.32 95% | 2.41 91% | 2.25 98% | 2.24 98% | 2.35 94% |
| CCT | 6185 105% | 6861 95% | 6885 94% | 6091 107% | 6686 97% |
| Color Space (Percent of AdobeRGB 1998) | 88 | 56 -36% | 56.9 -35% | 55 -37% | 88 0% |
| Color Space (Percent of sRGB) | 100 | 85 -15% | 86.5 -13% | 84 -16% | 100 0% |
| Media total (Programa/Opciones) | -11% /
-11% | -11% /
-11% | -14% /
-20% | -10% /
-10% |
* ... más pequeño es mejor
Tiempos de respuesta del display
| ↔ Tiempo de respuesta de Negro a Blanco | ||
|---|---|---|
| 24 ms ... subida ↗ y bajada ↘ combinada | ↗ 5 ms subida | 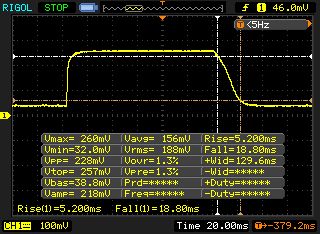 |
| ↘ 19 ms bajada | ||
| La pantalla mostró buenos tiempos de respuesta en nuestros tests pero podría ser demasiado lenta para los jugones competitivos. En comparación, todos los dispositivos de prueba van de ##min### (mínimo) a 240 (máximo) ms. » 48 % de todos los dispositivos son mejores. Eso quiere decir que el tiempo de respuesta es peor que la media (21.5 ms) de todos los dispositivos testados. | ||
| ↔ Tiempo de respuesta 50% Gris a 80% Gris | ||
| 37 ms ... subida ↗ y bajada ↘ combinada | ↗ 13 ms subida | 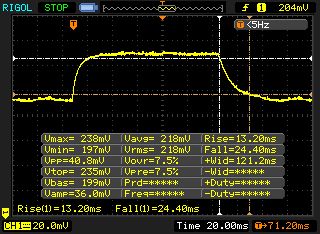 |
| ↘ 24 ms bajada | ||
| La pantalla mostró tiempos de respuesta lentos en nuestros tests y podría ser demasiado lenta para los jugones. En comparación, todos los dispositivos de prueba van de ##min### (mínimo) a 636 (máximo) ms. » 47 % de todos los dispositivos son mejores. Eso quiere decir que el tiempo de respuesta es similar al dispositivo testado medio (33.7 ms). | ||
Parpadeo de Pantalla / PWM (Pulse-Width Modulation)
| Parpadeo de Pantalla / PWM no detectado | 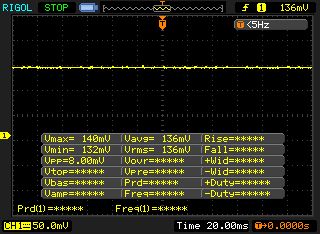 | ||
Comparación: 53 % de todos los dispositivos testados no usaron PWM para atenuar el display. Si se usó, medimos una media de 17915 (mínimo: 5 - máxmo: 3846000) Hz. | |||
| PCMark 8 - Home Score Accelerated v2 | |
| Asus G752VS-XB78K | |
| MSI GT72VR 6RE-015US | |
| SCHENKER XMG U716 | |
| Acer Predator 17 G9-793-77LG | |
| PCMark 8 Home Score Accelerated v2 | 4060 puntos | |
| PCMark 8 Creative Score Accelerated v2 | 2303 puntos | |
ayuda | ||
| Acer Predator 17 G9-793-77LG Toshiba NVMe THNSN5256GPU7 | Asus G752VS-XB78K Toshiba NVMe THNSN5512GPU7 | MSI GT72VR 6RE-015US SanDisk SD8SNAT256G1122 | Alienware 17 R3 (A17-9935) Samsung PM951 NVMe 512 GB | SCHENKER XMG U716 Samsung SM951 MZHPV512HDGL m.2 PCI-e | |
|---|---|---|---|---|---|
| AS SSD | -53% | 14% | |||
| Seq Read | 2016 | 507 -75% | 1942 -4% | ||
| Seq Write | 837 | 322.1 -62% | 1516 81% | ||
| 4K Read | 35.5 | 21.41 -40% | 40.86 15% | ||
| 4K Write | 105.2 | 84.1 -20% | 102.8 -2% | ||
| Score Total | 2320 | 688 -70% | 1910 -18% |

| 3DMark 11 - 1280x720 Performance GPU | |
| Asus G752VS-XB78K | |
| Acer Predator 17 G9-793-77LG | |
| SCHENKER XMG U716 | |
| MSI GT72VR 6RE-015US | |
| Alienware 17 R3 (A17-9935) | |
| 3DMark - 1920x1080 Fire Strike Graphics | |
| MSI GT72VR 6RE-015US | |
| Asus G752VS-XB78K | |
| Acer Predator 17 G9-793-77LG | |
| SCHENKER XMG U716 | |
| Alienware 17 R3 (A17-9935) | |
| 3DMark 11 Performance | 15153 puntos | |
| 3DMark Cloud Gate Standard Score | 24298 puntos | |
| 3DMark Fire Strike Score | 12354 puntos | |
ayuda | ||
| Far Cry Primal | |
| 3840x2160 High Preset AA:SM | |
| Asus G752VS-XB78K | |
| Acer Predator 17 G9-793-77LG | |
| 1920x1080 Ultra Preset AA:SM | |
| Asus G752VS-XB78K | |
| Acer Predator 17 G9-793-77LG | |
| Rise of the Tomb Raider | |
| 3840x2160 High Preset AA:FX AF:4x | |
| Asus G752VS-XB78K | |
| Acer Predator 17 G9-793-77LG | |
| 1920x1080 Very High Preset AA:FX AF:16x | |
| Asus G752VS-XB78K | |
| MSI GT72VR 6RE-015US | |
| Acer Predator 17 G9-793-77LG | |
| Alienware 17 R3 (A17-9935) | |
| Anno 2205 | |
| 3840x2160 High Preset AA:4x | |
| Acer Predator 17 G9-793-77LG | |
| SCHENKER XMG U716 | |
| 1920x1080 Ultra High Preset AA:8x | |
| Acer Predator 17 G9-793-77LG | |
| SCHENKER XMG U716 | |
| The Witcher 3 | |
| 3840x2160 High Graphics & Postprocessing (Nvidia HairWorks Off) | |
| Acer Predator 17 G9-793-77LG | |
| Asus G752VS-XB78K | |
| SCHENKER XMG U716 | |
| 1920x1080 Ultra Graphics & Postprocessing (HBAO+) | |
| Acer Predator 17 G9-793-77LG | |
| Asus G752VS-XB78K | |
| SCHENKER XMG U716 | |
| The Division | |
| 3840x2160 High Preset AF:8x | |
| Acer Predator 17 G9-793-77LG | |
| 1920x1080 Ultra Preset AF:16x | |
| Acer Predator 17 G9-793-77LG | |
| Mirror's Edge Catalyst | |
| 3840x2160 High Preset AF:16x | |
| Acer Predator 17 G9-793-77LG | |
| 1920x1080 Ultra Preset AF:16x | |
| MSI GT72VR 6RE-015US | |
| Acer Predator 17 G9-793-77LG | |
| Battlefield 4 | |
| 3840x2160 High Preset | |
| Asus G752VS-XB78K | |
| Acer Predator 17 G9-793-77LG | |
| SCHENKER XMG U716 | |
| 1920x1080 Ultra Preset AA:4x MS | |
| Asus G752VS-XB78K | |
| Acer Predator 17 G9-793-77LG | |
| SCHENKER XMG U716 | |
| Star Wars Battlefront | |
| 3840x2160 High Preset AA:FX | |
| Acer Predator 17 G9-793-77LG | |
| SCHENKER XMG U716 | |
| 1920x1080 Ultra Preset AA:FX | |
| Acer Predator 17 G9-793-77LG | |
| SCHENKER XMG U716 | |
| bajo | medio | alto | ultra | 4K | |
| Battlefield 4 (2013) | 172.9 | 131.2 | 67.3 | ||
| The Witcher 3 (2015) | 103.8 | 58 | 38 | ||
| Anno 2205 (2015) | 44.1 | 49.2 | |||
| Star Wars Battlefront (2015) | 143.6 | 123.8 | 47.6 | ||
| Rise of the Tomb Raider (2016) | 107.6 | 85.5 | 37.4 | ||
| Far Cry Primal (2016) | 80 | 75 | 35 | ||
| The Division (2016) | 92 | 73.2 | 36.9 | ||
| Mirror's Edge Catalyst (2016) | 99.2 | 90.9 | 35.2 |
Ruido
| Ocioso |
| 33 / 34 / 40 dB(A) |
| Carga |
| 44 / 50 dB(A) |
 | ||
30 dB silencioso 40 dB(A) audible 50 dB(A) ruidosamente alto |
||
min: | ||
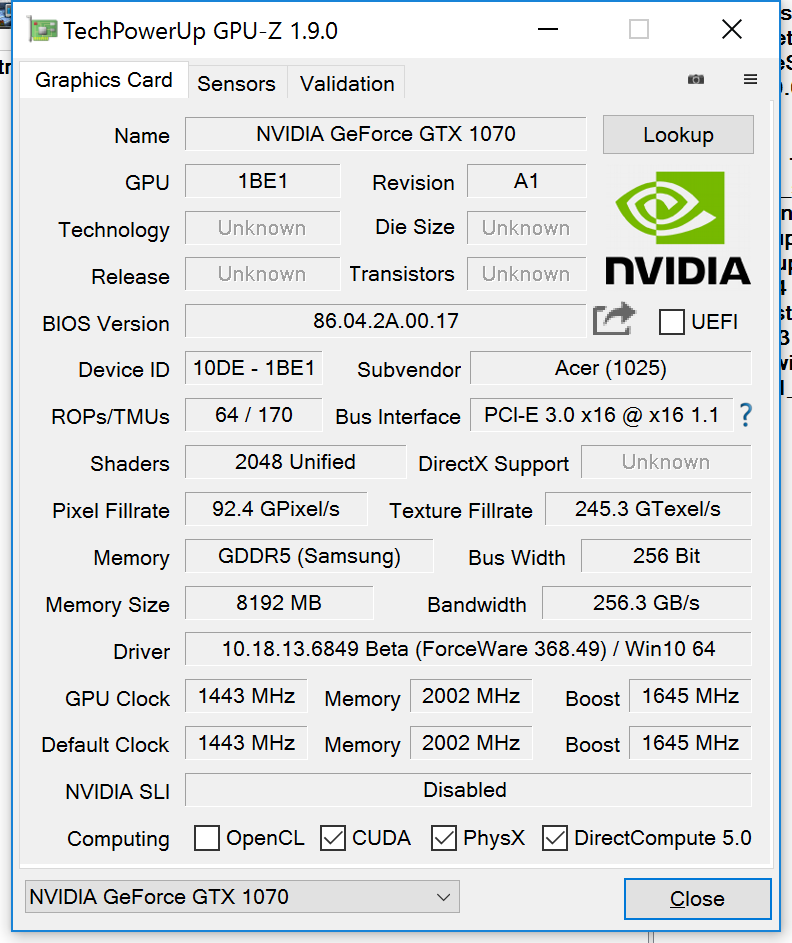
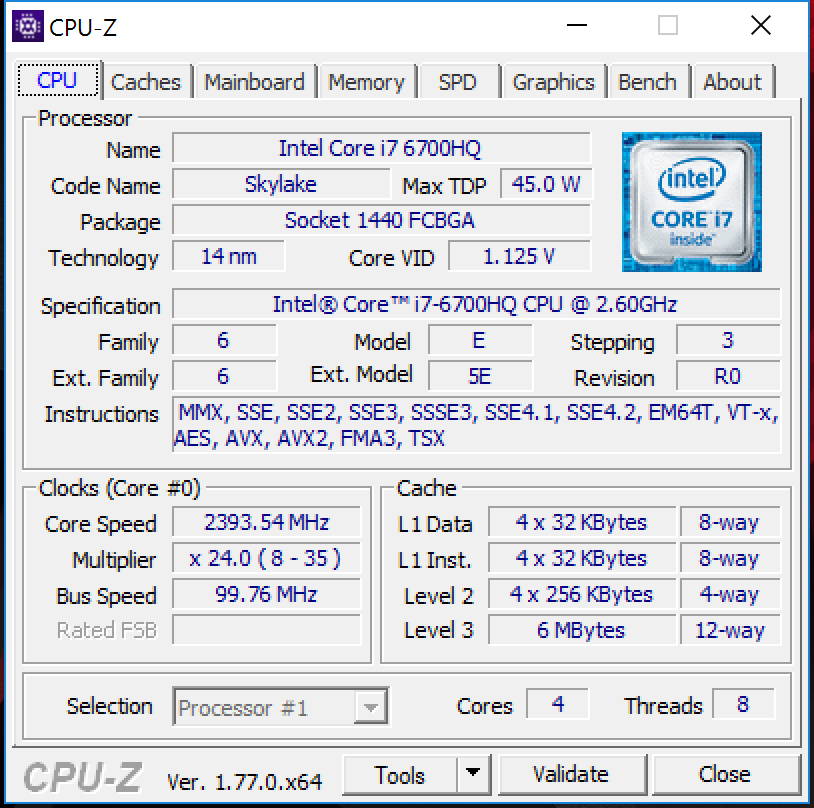
| Acer Predator 17 G9-793-77LG GeForce GTX 1070 Mobile, 6700HQ | Asus G752VS-XB78K GeForce GTX 1070 Mobile, 6820HK | MSI GT72VR 6RE-015US GeForce GTX 1070 Mobile, 6700HQ | Alienware 17 R3 (A17-9935) GeForce GTX 980M, 6700HQ | SCHENKER XMG U716 GeForce GTX 980 (Laptop), 6700 | |
|---|---|---|---|---|---|
| Noise | 8% | 7% | 8% | 1% | |
| off / environment * | 31 | 30 3% | 28.9 7% | 30 3% | |
| Idle Minimum * | 33 | 31 6% | 32.4 2% | 31 6% | 33 -0% |
| Idle Average * | 34 | 32 6% | 32.4 5% | 32 6% | 35 -3% |
| Idle Maximum * | 40 | 33 17% | 32.4 19% | 33 17% | 38 5% |
| Load Average * | 44 | 40 9% | 39.4 10% | 38 14% | 45 -2% |
| Load Maximum * | 50 | 47 6% | 52 -4% | 50 -0% | 48 4% |
* ... más pequeño es mejor
(±) The maximum temperature on the upper side is 42.6 °C / 109 F, compared to the average of 40.4 °C / 105 F, ranging from 21.2 to 68.8 °C for the class Gaming.
(±) The bottom heats up to a maximum of 44.9 °C / 113 F, compared to the average of 43.2 °C / 110 F
(+) In idle usage, the average temperature for the upper side is 29.5 °C / 85 F, compared to the device average of 33.8 °C / 93 F.
(+) The palmrests and touchpad are reaching skin temperature as a maximum (33.5 °C / 92.3 F) and are therefore not hot.
(-) The average temperature of the palmrest area of similar devices was 28.9 °C / 84 F (-4.6 °C / -8.3 F).
| Acer Predator 17 G9-793-77LG GeForce GTX 1070 Mobile, 6700HQ | Asus G752VS-XB78K GeForce GTX 1070 Mobile, 6820HK | MSI GT72VR 6RE-015US GeForce GTX 1070 Mobile, 6700HQ | Alienware 17 R3 (A17-9935) GeForce GTX 980M, 6700HQ | SCHENKER XMG U716 GeForce GTX 980 (Laptop), 6700 | |
|---|---|---|---|---|---|
| Heat | 3% | -2% | -11% | -20% | |
| Maximum Upper Side * | 42.6 | 42.9 -1% | 40.6 5% | 51.1 -20% | 48.8 -15% |
| Maximum Bottom * | 44.9 | 41.5 8% | 59.4 -32% | 53.2 -18% | 55.8 -24% |
| Idle Upper Side * | 33.1 | 31.6 5% | 28.2 15% | 31.7 4% | 36.7 -11% |
| Idle Bottom * | 28.9 | 29.5 -2% | 27.8 4% | 32.2 -11% | 37.3 -29% |
* ... más pequeño es mejor
Acer Predator 17 G9-793-77LG audio analysis
(+) | speakers can play relatively loud (83 dB)
Bass 100 - 315 Hz
(±) | reduced bass - on average 7.8% lower than median
(±) | linearity of bass is average (8.2% delta to prev. frequency)
Mids 400 - 2000 Hz
(+) | balanced mids - only 4% away from median
(+) | mids are linear (4.6% delta to prev. frequency)
Highs 2 - 16 kHz
(+) | balanced highs - only 3.7% away from median
(±) | linearity of highs is average (7.1% delta to prev. frequency)
Overall 100 - 16.000 Hz
(+) | overall sound is linear (12% difference to median)
Compared to same class
» 10% of all tested devices in this class were better, 4% similar, 86% worse
» The best had a delta of 6%, average was 18%, worst was 132%
Compared to all devices tested
» 7% of all tested devices were better, 2% similar, 91% worse
» The best had a delta of 4%, average was 25%, worst was 134%
MSI GT73VR-6RE16SR451 audio analysis
(+) | speakers can play relatively loud (82 dB)
Bass 100 - 315 Hz
(±) | reduced bass - on average 6.2% lower than median
(+) | bass is linear (6.4% delta to prev. frequency)
Mids 400 - 2000 Hz
(+) | balanced mids - only 1.6% away from median
(+) | mids are linear (5.3% delta to prev. frequency)
Highs 2 - 16 kHz
(±) | higher highs - on average 6.6% higher than median
(+) | highs are linear (6.8% delta to prev. frequency)
Overall 100 - 16.000 Hz
(+) | overall sound is linear (13.8% difference to median)
Compared to same class
» 20% of all tested devices in this class were better, 6% similar, 74% worse
» The best had a delta of 6%, average was 18%, worst was 132%
Compared to all devices tested
» 12% of all tested devices were better, 3% similar, 85% worse
» The best had a delta of 4%, average was 25%, worst was 134%
| Off / Standby | |
| Ocioso | |
| Carga |
|
| Acer Predator 17 G9-793-77LG GeForce GTX 1070 Mobile, 6700HQ | Asus G752VS-XB78K GeForce GTX 1070 Mobile, 6820HK | MSI GT72VR 6RE-015US GeForce GTX 1070 Mobile, 6700HQ | Alienware 17 R3 (A17-9935) GeForce GTX 980M, 6700HQ | SCHENKER XMG U716 GeForce GTX 980 (Laptop), 6700 | |
|---|---|---|---|---|---|
| Power Consumption | 11% | 6% | 34% | -28% | |
| Idle Minimum * | 25 | 24 4% | 22.3 11% | 12 52% | 35 -40% |
| Idle Average * | 35 | 31 11% | 27.3 22% | 18 49% | 44 -26% |
| Idle Maximum * | 46 | 36 22% | 30 35% | 26 43% | 51 -11% |
| Load Average * | 103 | 94 9% | 152.2 -48% | 95 8% | 134 -30% |
| Load Maximum * | 223 | 204 9% | 204.2 8% | 188 16% | 298 -34% |
* ... más pequeño es mejor
| Acer Predator 17 G9-793-77LG 88 Wh | Asus G752VS-XB78K 90 Wh | MSI GT72VR 6RE-015US 83 Wh | Alienware 17 R3 (A17-9935) 92 Wh | SCHENKER XMG U716 82 Wh | |
|---|---|---|---|---|---|
| Duración de Batería | 4% | 8% | 104% | -22% | |
| Reader / Idle | 278 | 311 12% | 322 16% | 758 173% | 158 -43% |
| WiFi v1.3 | 200 | 210 5% | 224 12% | 444 122% | |
| Load | 89 | 84 -6% | 86 -3% | 105 18% | 88 -1% |
| H.264 | 186 | ||||
| Gaming | 80 |
Pro
Contra
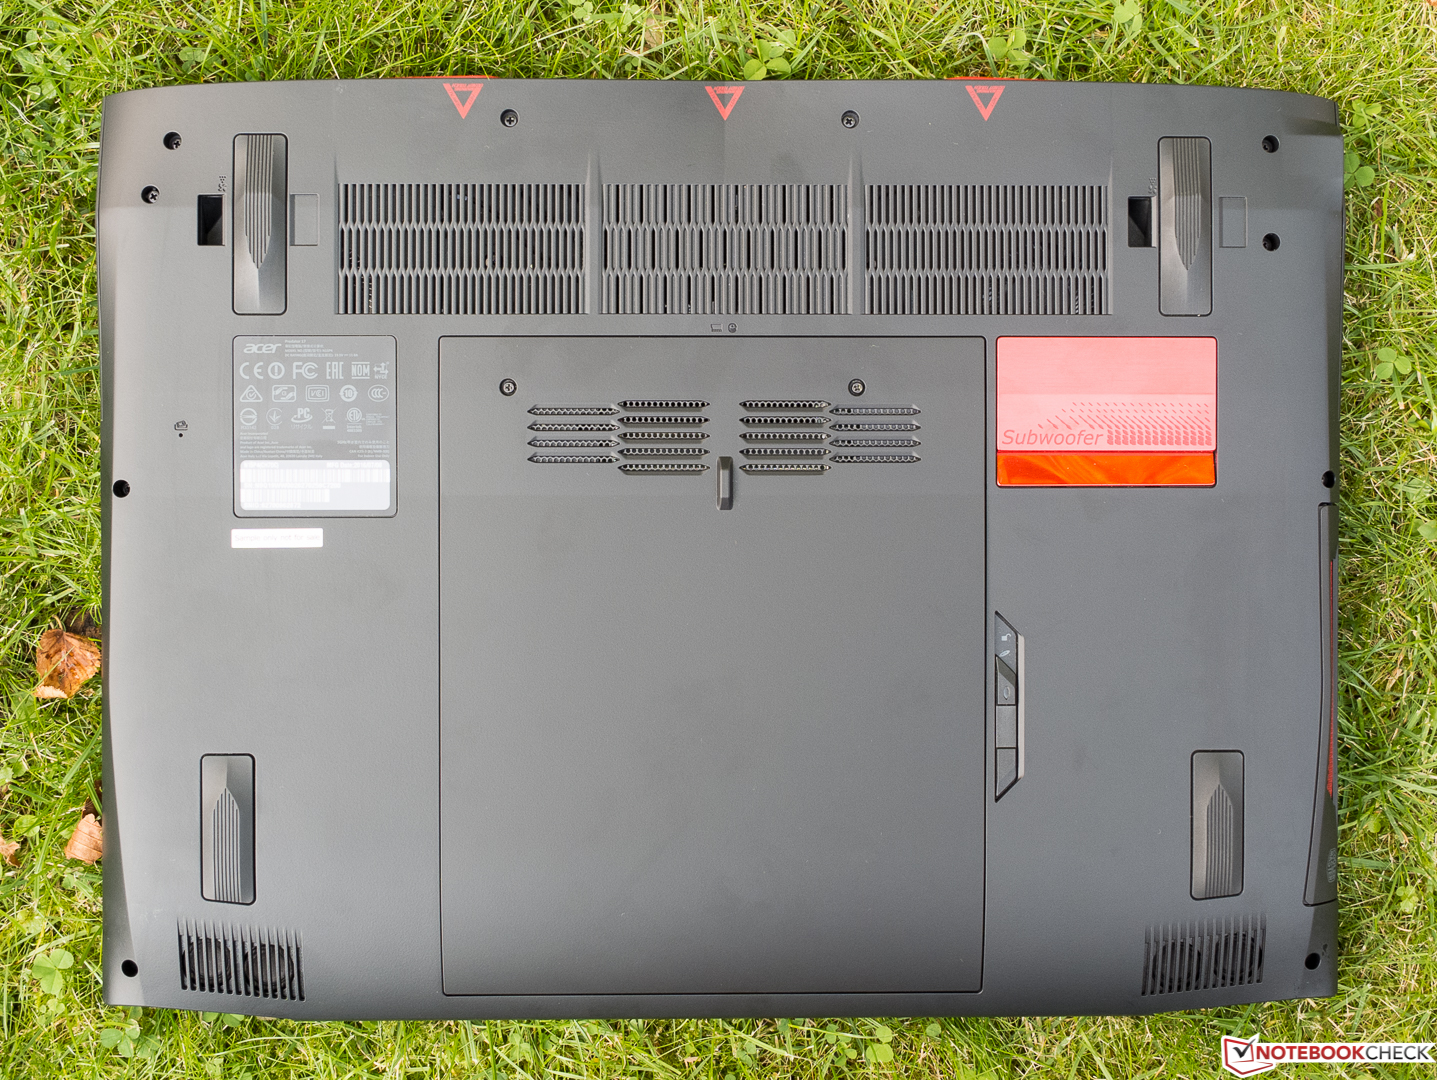
El sangrado de pantalla que observamos posiblemente sea atribuible al estado de preproducción de nuestro modelo de pruebas (aunque lo dudamos) - pero aún así ajustamos nuestra valoración como corresponde. Es más problemático que la CPU de este portátil particularmente enorme y pesado alcance temperaturas de más de 98 °C y que la GPU también se ralentice. Cierto, nuestras quejas son a muy alto nivel. Después de todo, el "motor" nunca se para incluso cuando juegas a juegos muy exigentes con los ajustes al máximo. Nos queda una crítica: el G9-793 sigue teniendo un mantenimiento difícil.
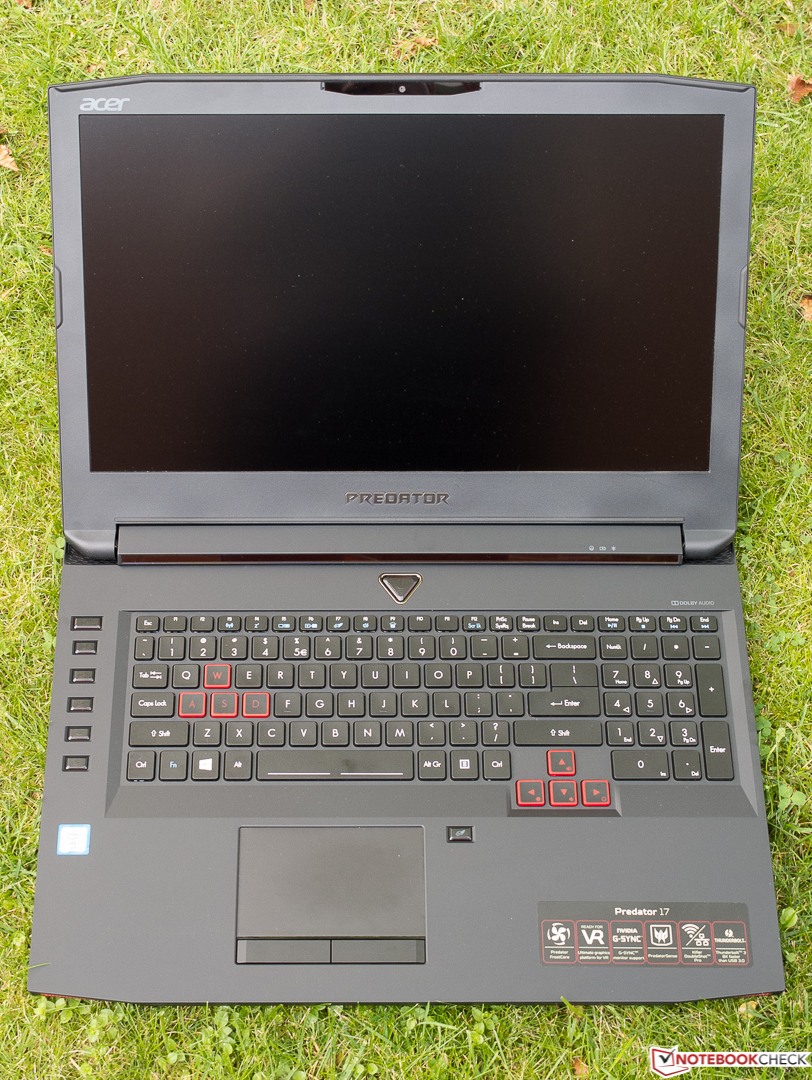
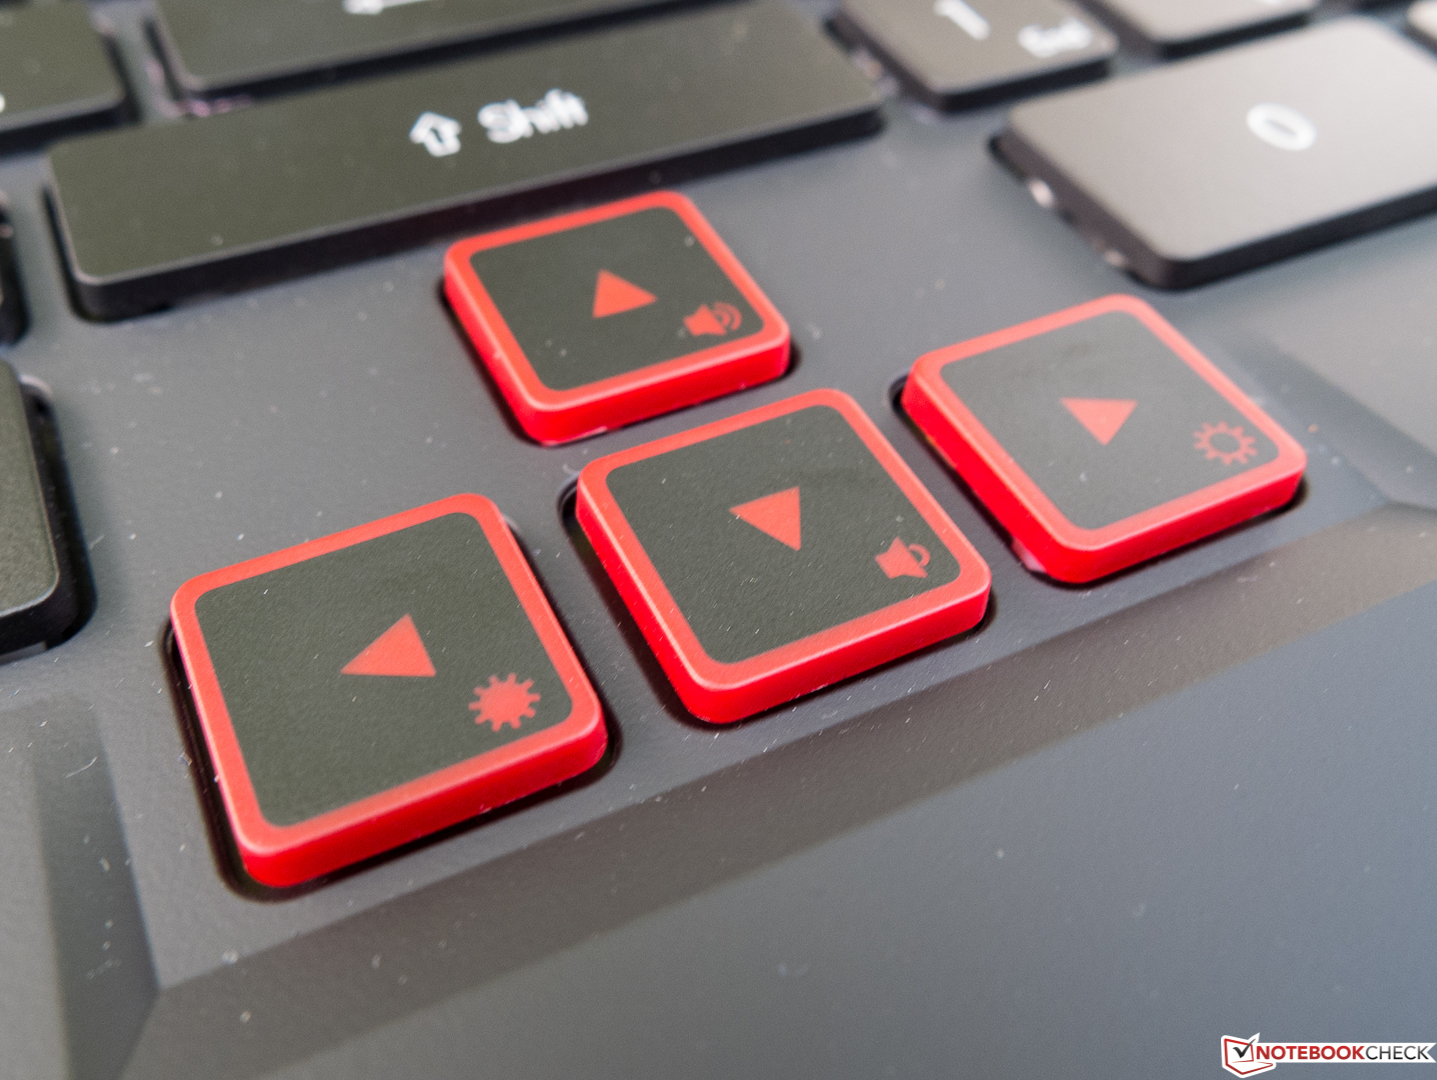
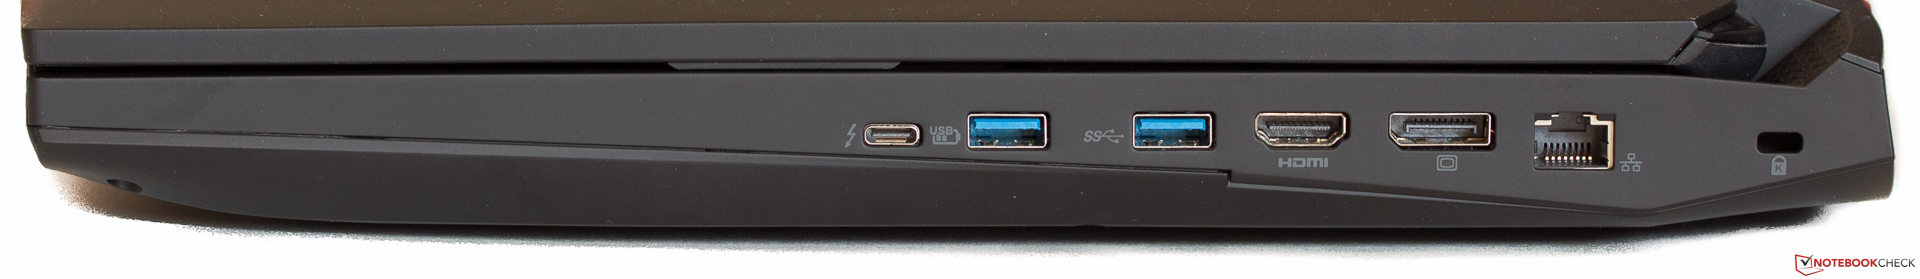
Aspectos positivos son la decentísima calidad de construcción, el display genial, el potentísimo hardware, y la selección de puertos con vista a futuro incluyendo Thunderbolt 3. Las herramientas específicas de juego y las teclas programables también sobresalen. Por último, pero no por ello menos importante, el decentísimo sistema de sonido también es digno de mención.
Ésta es una versión acortada del análisis original. Puedes leer el análisis completo en inglés aquí.
Acer Predator 17 G9-793-77LG
-
09/03/2016 v5.1(old)
Sven Kloevekorn
Pricecompare
