 Deutsch
 English
 Español
 Français
 Italiano
 Nederlands
 Polski
 Português
 Русский
 Türkçe
 Svenska
 Chinese
 Magyar
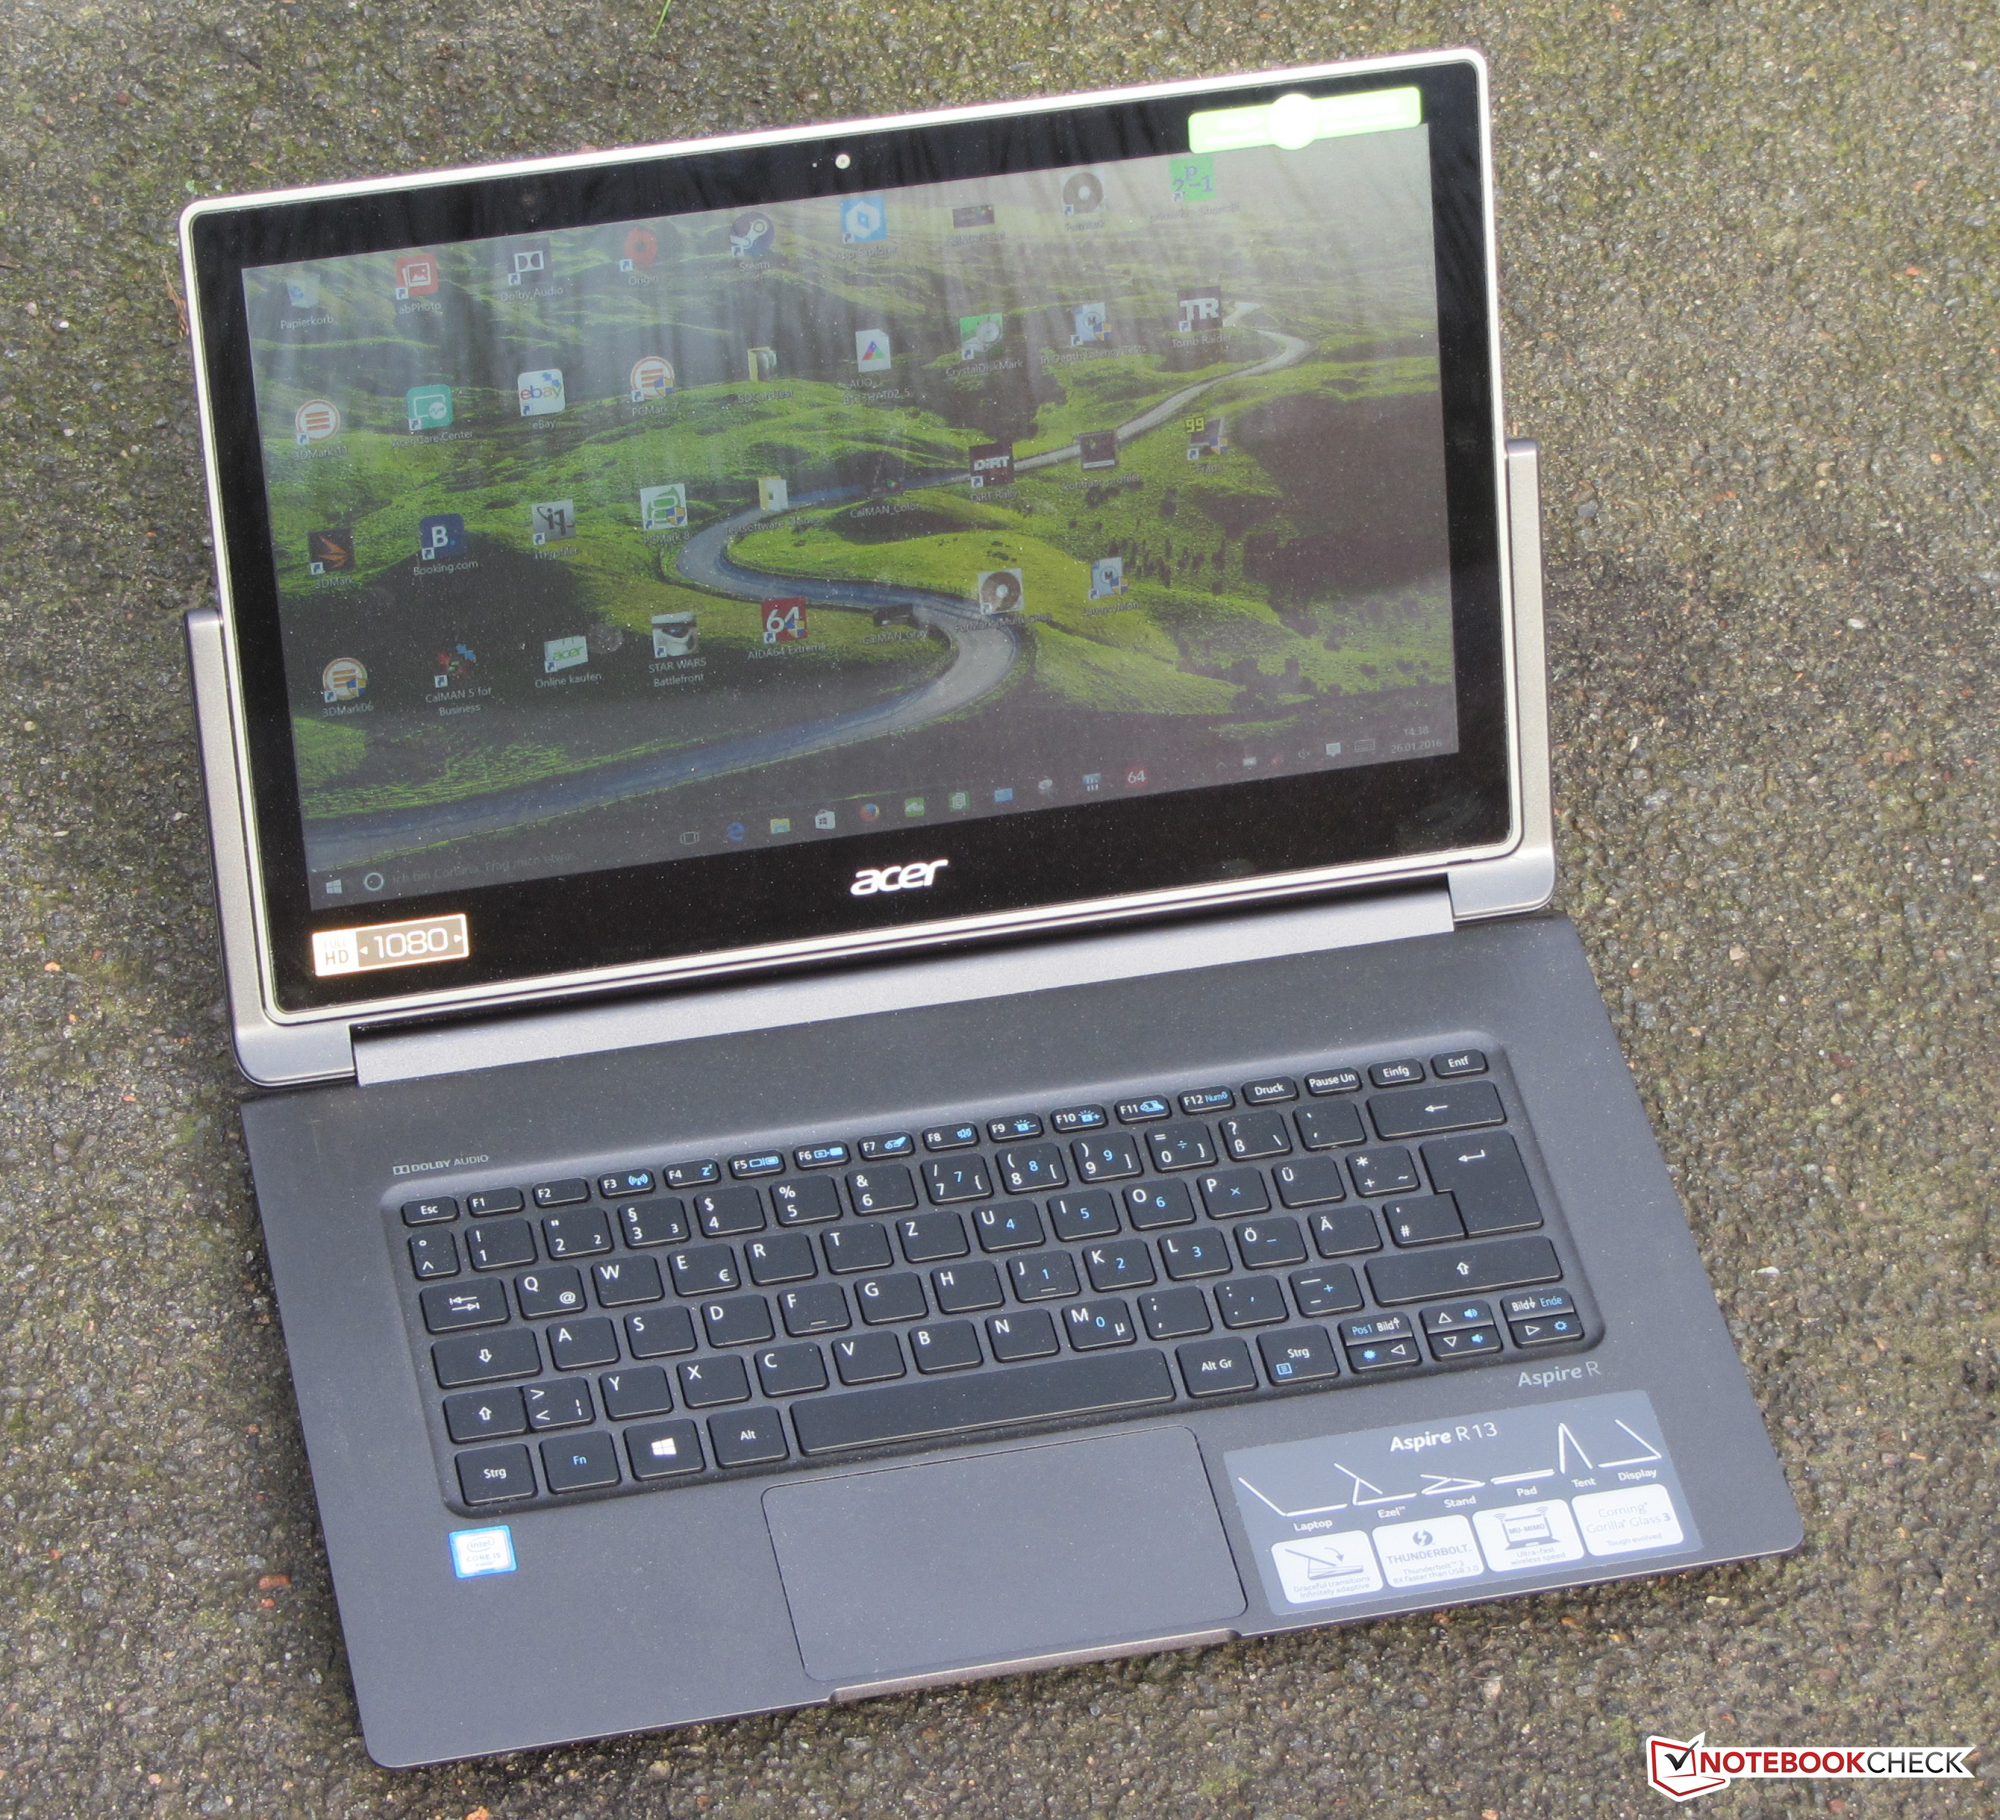
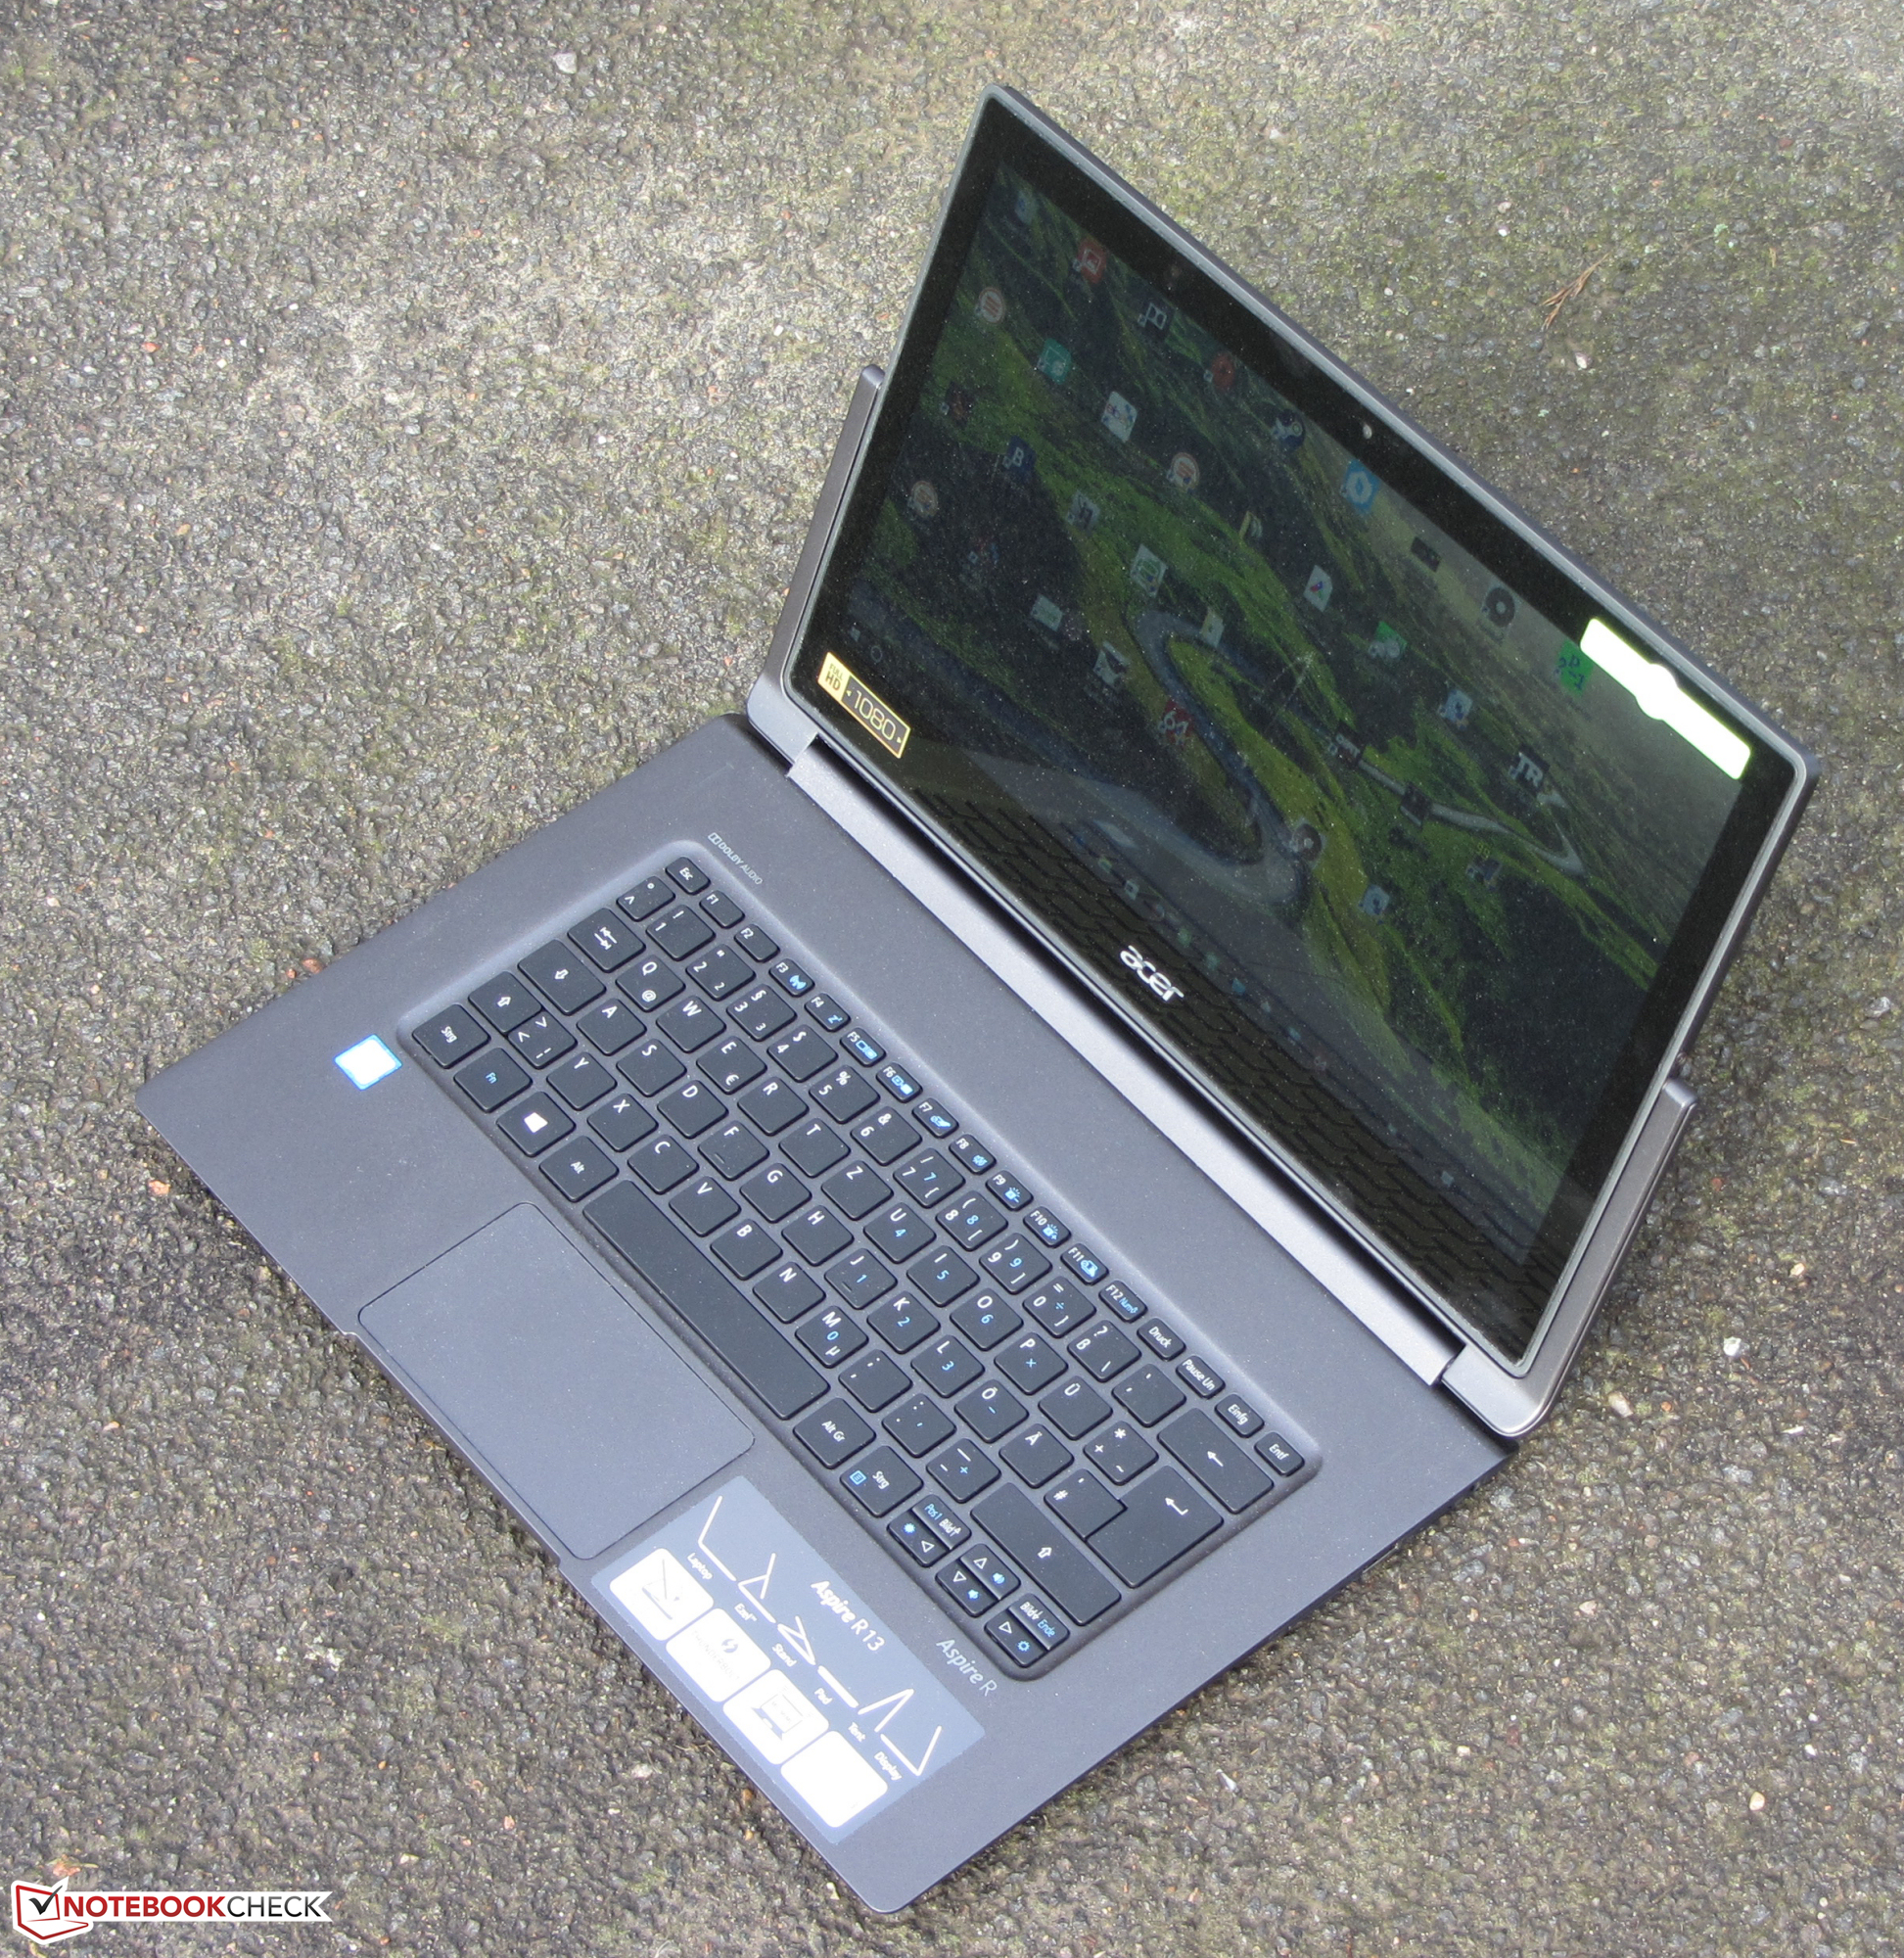
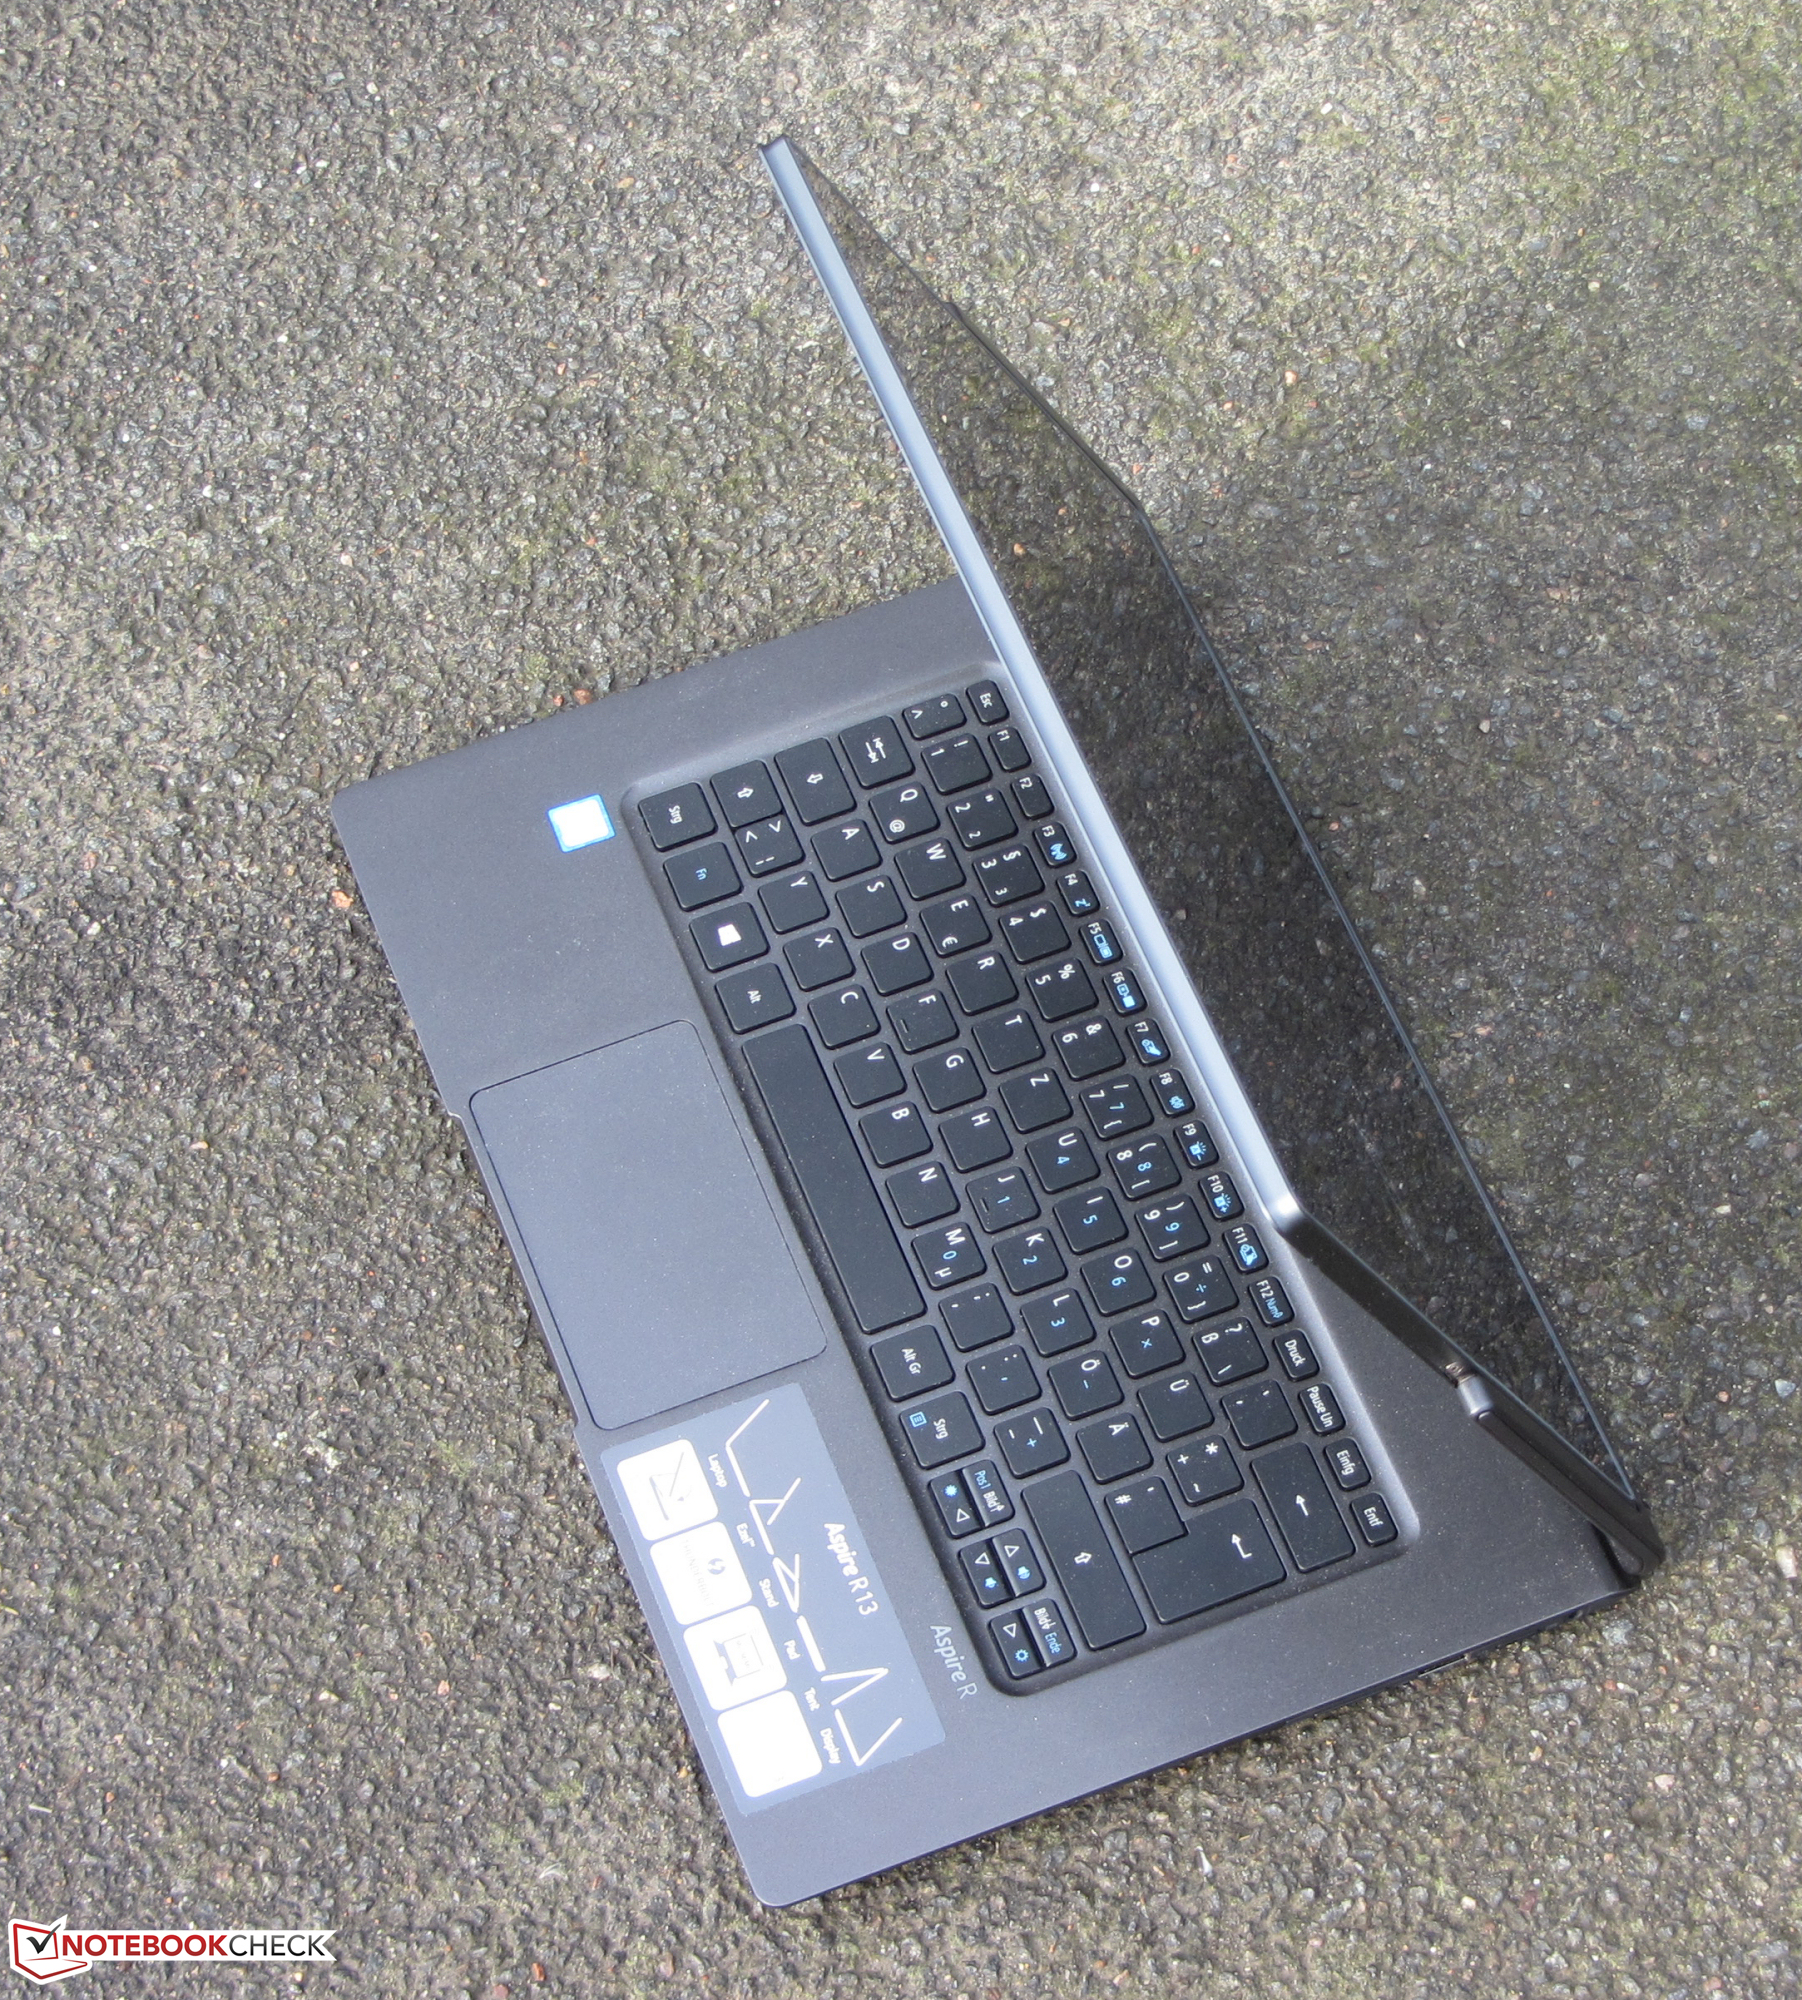
Breve análisis del Convertible Acer Aspire R13 R7-372T
| |||||||||||||||||||||||||
iluminación: 90 %
Brillo con batería: 339 cd/m²
Contraste: 1541:1 (Negro: 0.22 cd/m²)
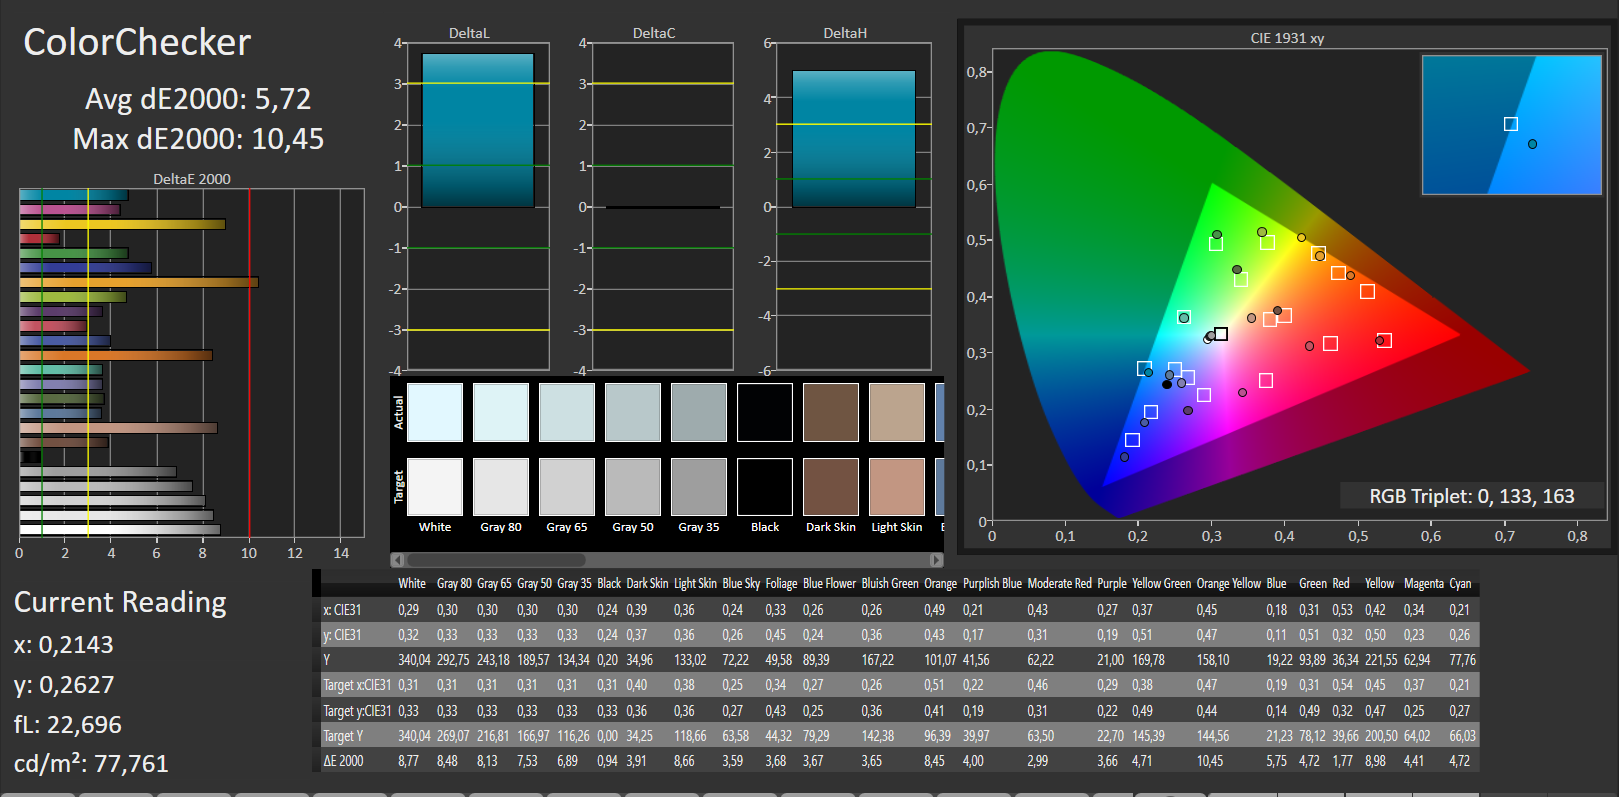
ΔE Color 5.72 | 0.5-29.43 Ø5
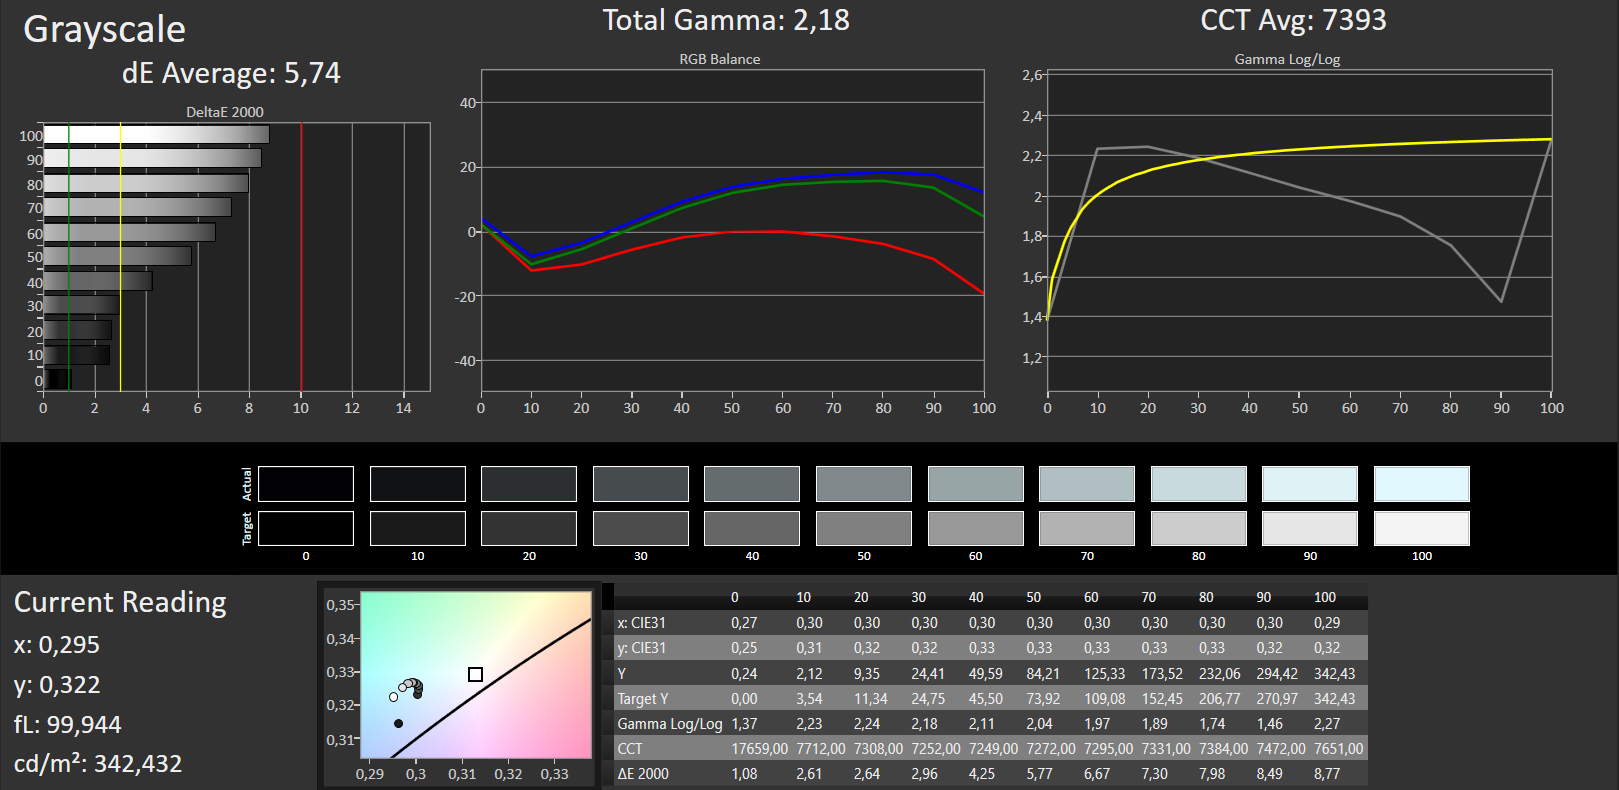
ΔE Greyscale 5.74 | 0.57-98 Ø5.3
92% sRGB (Argyll 1.6.3 3D)
59% AdobeRGB 1998 (Argyll 1.6.3 3D)
64.3% AdobeRGB 1998 (Argyll 2.2.0 3D)
92.3% sRGB (Argyll 2.2.0 3D)
63.2% Display P3 (Argyll 2.2.0 3D)
Gamma: 2.18
Parpadeo de Pantalla / PWM (Pulse-Width Modulation)
| Parpadeo de Pantalla / PWM no detectado | ||
Comparación: 53 % de todos los dispositivos testados no usaron PWM para atenuar el display. Si se usó, medimos una media de 17942 (mínimo: 5 - máxmo: 3846000) Hz. | ||
Tiempos de respuesta del display
| ↔ Tiempo de respuesta de Negro a Blanco | ||
|---|---|---|
| 26 ms ... subida ↗ y bajada ↘ combinada | ↗ 5 ms subida | 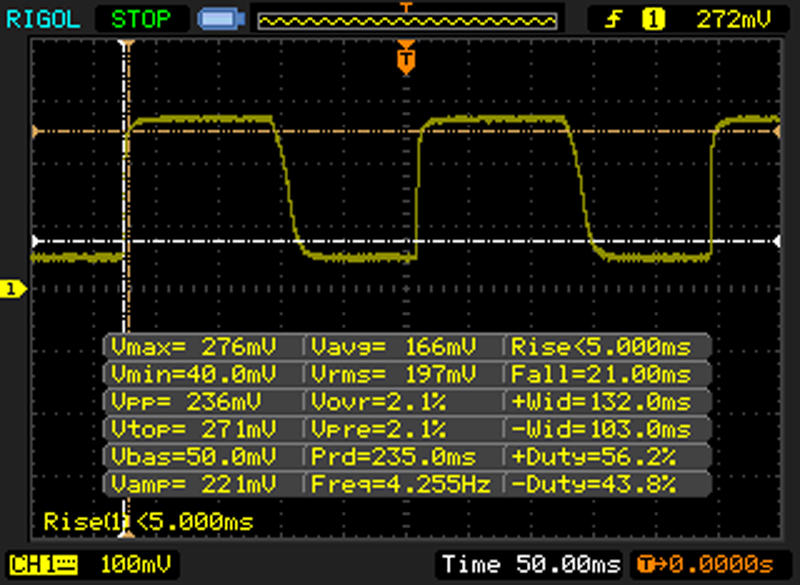 |
| ↘ 21 ms bajada | ||
| La pantalla mostró tiempos de respuesta relativamente lentos en nuestros tests pero podría ser demasiado lenta para los jugones. En comparación, todos los dispositivos de prueba van de ##min### (mínimo) a 240 (máximo) ms. » 57 % de todos los dispositivos son mejores. Eso quiere decir que el tiempo de respuesta es peor que la media (21.5 ms) de todos los dispositivos testados. | ||
| ↔ Tiempo de respuesta 50% Gris a 80% Gris | ||
| 48 ms ... subida ↗ y bajada ↘ combinada | ↗ 13 ms subida | 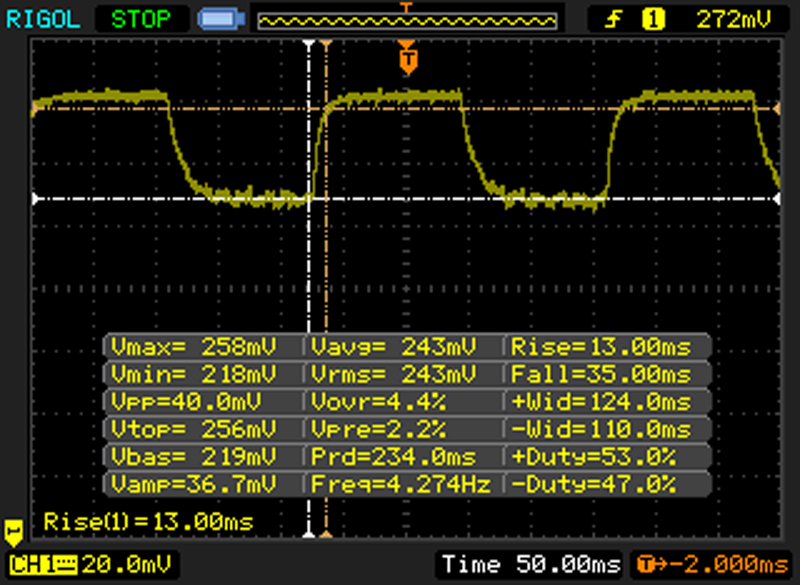 |
| ↘ 35 ms bajada | ||
| La pantalla mostró tiempos de respuesta lentos en nuestros tests y podría ser demasiado lenta para los jugones. En comparación, todos los dispositivos de prueba van de ##min### (mínimo) a 636 (máximo) ms. » 80 % de todos los dispositivos son mejores. Eso quiere decir que el tiempo de respuesta es peor que la media (33.8 ms) de todos los dispositivos testados. | ||
| Acer Aspire R13 R7-372T IPS, 1920x1080 | Acer Aspire R7-371T-52EL IPS, 1920x1080 | Acer Aspire R13 R7-371T-779K IPS, 2560x1440 | HP Spectre x360 13-4104ng IPS, 2560x1440 | Lenovo Yoga 900-13ISK 80MK IPS, 3200x1800 | Asus Zenbook UX303UB-R4100T IPS, 1920x1080 | Asus Zenbook UX305CA-EHM1 IPS, 1920x1080 | |
|---|---|---|---|---|---|---|---|
| Display | 4% | -1% | 4% | 1% | |||
| Display P3 Coverage | 63.2 | 66.8 6% | 63.2 0% | 66.9 6% | 64.5 2% | ||
| sRGB Coverage | 92.3 | 92.8 1% | 88.7 -4% | 92.3 0% | 90.4 -2% | ||
| AdobeRGB 1998 Coverage | 64.3 | 67.3 5% | 64.9 1% | 67.6 5% | 65.5 2% | ||
| Response Times | 39% | 17% | -39% | 14% | |||
| Response Time Grey 50% / Grey 80% * | 48 ? | 24 ? 50% | 38.8 ? 19% | 68 ? -42% | 37.6 ? 22% | ||
| Response Time Black / White * | 26 ? | 19 ? 27% | 22.4 ? 14% | 35 ? -35% | 24.8 ? 5% | ||
| PWM Frequency | 1316 | 178 ? | 201.6 ? | ||||
| Screen | -4% | 1% | -6% | -30% | -3% | -11% | |
| Brightness middle | 339 | 321 -5% | 316 -7% | 324 -4% | 319.8 -6% | 385 14% | 324.3 -4% |
| Brightness | 331 | 322 -3% | 305 -8% | 324 -2% | 302 -9% | 394 19% | 314 -5% |
| Brightness Distribution | 90 | 83 -8% | 90 0% | 90 0% | 88 -2% | 89 -1% | 93 3% |
| Black Level * | 0.22 | 0.32 -45% | 0.23 -5% | 0.34 -55% | 0.835 -280% | 0.41 -86% | 0.289 -31% |
| Contrast | 1541 | 1003 -35% | 1374 -11% | 953 -38% | 383 -75% | 939 -39% | 1122 -27% |
| Colorchecker dE 2000 * | 5.72 | 4.79 16% | 4.21 26% | 4.36 24% | 2.68 53% | 3.84 33% | 6.03 -5% |
| Colorchecker dE 2000 max. * | 10.45 | ||||||
| Greyscale dE 2000 * | 5.74 | 2.67 53% | 5.16 10% | 4.62 20% | 2.35 59% | 3.79 34% | 7.89 -37% |
| Gamma | 2.18 101% | 2.52 87% | 2.58 85% | 2.18 101% | 2.09 105% | 2.23 99% | 2.08 106% |
| CCT | 7393 88% | 6835 95% | 6934 94% | 6857 95% | 6975 93% | 6499 100% | 6490 100% |
| Color Space (Percent of AdobeRGB 1998) | 59 | 60 2% | 57 -3% | 60 2% | 65.46 11% | ||
| Color Space (Percent of sRGB) | 92 | 93 1% | 88 -4% | 92 0% | 90.36 -2% | ||
| Media total (Programa/Opciones) | -4% /
-4% | 1% /
1% | 12% /
3% | -5% /
-17% | -13% /
-6% | 1% /
-5% |
* ... más pequeño es mejor
| Cinebench R15 | |
| CPU Multi 64Bit (ordenar por valor) | |
| Acer Aspire R13 R7-372T | |
| Acer Aspire R7-371T-52EL | |
| Acer Aspire R13 R7-371T-779K | |
| HP Spectre x360 13-4104ng | |
| Lenovo Yoga 900-13ISK 80MK | |
| Asus Zenbook UX303UB-R4100T | |
| Asus Zenbook UX305CA-EHM1 | |
| CPU Single 64Bit (ordenar por valor) | |
| Acer Aspire R13 R7-372T | |
| Acer Aspire R7-371T-52EL | |
| Acer Aspire R13 R7-371T-779K | |
| HP Spectre x360 13-4104ng | |
| Lenovo Yoga 900-13ISK 80MK | |
| Asus Zenbook UX303UB-R4100T | |
| Asus Zenbook UX305CA-EHM1 | |
| Cinebench R11.5 | |
| CPU Multi 64Bit (ordenar por valor) | |
| Acer Aspire R13 R7-372T | |
| Acer Aspire R7-371T-52EL | |
| Acer Aspire R13 R7-371T-779K | |
| HP Spectre x360 13-4104ng | |
| Lenovo Yoga 900-13ISK 80MK | |
| Asus Zenbook UX303UB-R4100T | |
| Asus Zenbook UX305CA-EHM1 | |
| CPU Single 64Bit (ordenar por valor) | |
| Acer Aspire R13 R7-372T | |
| Acer Aspire R7-371T-52EL | |
| Acer Aspire R13 R7-371T-779K | |
| HP Spectre x360 13-4104ng | |
| Lenovo Yoga 900-13ISK 80MK | |
| Asus Zenbook UX303UB-R4100T | |
| Asus Zenbook UX305CA-EHM1 | |
| Cinebench R10 | |
| Rendering Multiple CPUs 32Bit (ordenar por valor) | |
| Acer Aspire R13 R7-372T | |
| Acer Aspire R7-371T-52EL | |
| HP Spectre x360 13-4104ng | |
| Lenovo Yoga 900-13ISK 80MK | |
| Asus Zenbook UX303UB-R4100T | |
| Rendering Single 32Bit (ordenar por valor) | |
| Acer Aspire R13 R7-372T | |
| Acer Aspire R7-371T-52EL | |
| HP Spectre x360 13-4104ng | |
| Lenovo Yoga 900-13ISK 80MK | |
| Asus Zenbook UX303UB-R4100T | |
| Geekbench 3 | |
| 32 Bit Single-Core Score (ordenar por valor) | |
| Acer Aspire R13 R7-372T | |
| Acer Aspire R7-371T-52EL | |
| HP Spectre x360 13-4104ng | |
| Asus Zenbook UX303UB-R4100T | |
| 32 Bit Multi-Core Score (ordenar por valor) | |
| Acer Aspire R13 R7-372T | |
| Acer Aspire R7-371T-52EL | |
| HP Spectre x360 13-4104ng | |
| Asus Zenbook UX303UB-R4100T | |
| Sunspider - 1.0 Total Score (ordenar por valor) | |
| Acer Aspire R13 R7-372T | |
| Acer Aspire R7-371T-52EL | |
| Acer Aspire R13 R7-371T-779K | |
| HP Spectre x360 13-4104ng | |
| Asus Zenbook UX303UB-R4100T | |
| Asus Zenbook UX305CA-EHM1 | |
| JetStream 1.1 - Total Score (ordenar por valor) | |
| Acer Aspire R13 R7-372T | |
| Asus Zenbook UX303UB-R4100T | |
| Mozilla Kraken 1.1 - Total (ordenar por valor) | |
| Acer Aspire R13 R7-372T | |
| Acer Aspire R7-371T-52EL | |
| Acer Aspire R13 R7-371T-779K | |
| HP Spectre x360 13-4104ng | |
| Asus Zenbook UX303UB-R4100T | |
| Octane V2 - Total Score (ordenar por valor) | |
| Acer Aspire R13 R7-372T | |
| Acer Aspire R7-371T-52EL | |
| Acer Aspire R13 R7-371T-779K | |
| HP Spectre x360 13-4104ng | |
| Asus Zenbook UX303UB-R4100T | |
| Peacekeeper - --- (ordenar por valor) | |
| Acer Aspire R13 R7-372T | |
| Acer Aspire R7-371T-52EL | |
| Asus Zenbook UX303UB-R4100T | |
* ... más pequeño es mejor
| PCMark 7 Score | 5130 puntos | |
| PCMark 8 Home Score Accelerated v2 | 3198 puntos | |
| PCMark 8 Creative Score Accelerated v2 | 3886 puntos | |
| PCMark 8 Work Score Accelerated v2 | 4091 puntos | |
ayuda | ||
| PCMark 8 - Home Score Accelerated v2 (ordenar por valor) | |
| Acer Aspire R13 R7-372T | |
| Acer Aspire R7-371T-52EL | |
| Acer Aspire R13 R7-371T-779K | |
| Lenovo Yoga 900-13ISK 80MK | |
| Asus Zenbook UX303UB-R4100T | |
| Asus Zenbook UX305CA-EHM1 | |
| PCMark 7 - Score (ordenar por valor) | |
| Acer Aspire R13 R7-372T | |
| Acer Aspire R13 R7-371T-779K | |
| HP Spectre x360 13-4104ng | |
| HP Spectre x360 13-4104ng | |
| Lenovo Yoga 900-13ISK 80MK | |
| Asus Zenbook UX303UB-R4100T | |
| Asus Zenbook UX305CA-EHM1 | |

| 3DMark 06 Standard Score | 9062 puntos | |
| 3DMark 11 Performance | 1512 puntos | |
| 3DMark Ice Storm Standard Score | 53850 puntos | |
| 3DMark Cloud Gate Standard Score | 5792 puntos | |
| 3DMark Fire Strike Score | 810 puntos | |
ayuda | ||
| 3DMark 11 - 1280x720 Performance (ordenar por valor) | |
| Acer Aspire R13 R7-372T | |
| Acer Aspire R7-371T-52EL | |
| Acer Aspire R13 R7-371T-779K | |
| HP Spectre x360 13-4104ng | |
| HP Spectre x360 13-4104ng | |
| Lenovo Yoga 900-13ISK 80MK | |
| Asus Zenbook UX303UB-R4100T | |
| Asus Zenbook UX305CA-EHM1 | |
| 3DMark | |
| 1280x720 Ice Storm Standard Score (ordenar por valor) | |
| Acer Aspire R13 R7-372T | |
| Acer Aspire R7-371T-52EL | |
| Acer Aspire R13 R7-371T-779K | |
| HP Spectre x360 13-4104ng | |
| HP Spectre x360 13-4104ng | |
| Lenovo Yoga 900-13ISK 80MK | |
| Asus Zenbook UX303UB-R4100T | |
| Asus Zenbook UX305CA-EHM1 | |
| 1280x720 Cloud Gate Standard Score (ordenar por valor) | |
| Acer Aspire R13 R7-372T | |
| Acer Aspire R7-371T-52EL | |
| Acer Aspire R13 R7-371T-779K | |
| HP Spectre x360 13-4104ng | |
| HP Spectre x360 13-4104ng | |
| Lenovo Yoga 900-13ISK 80MK | |
| Asus Zenbook UX303UB-R4100T | |
| Asus Zenbook UX305CA-EHM1 | |
| 1280x720 Sky Diver Score (ordenar por valor) | |
| Acer Aspire R13 R7-372T | |
| Acer Aspire R7-371T-52EL | |
| Asus Zenbook UX303UB-R4100T | |
| 1920x1080 Fire Strike Score (ordenar por valor) | |
| Acer Aspire R13 R7-372T | |
| Acer Aspire R7-371T-52EL | |
| HP Spectre x360 13-4104ng | |
| HP Spectre x360 13-4104ng | |
| Lenovo Yoga 900-13ISK 80MK | |
| Asus Zenbook UX303UB-R4100T | |
| Asus Zenbook UX305CA-EHM1 | |
| 3DMark 06 - 1280x1024 Standard Score AA:0x AF:0x (ordenar por valor) | |
| Acer Aspire R13 R7-372T | |
| HP Spectre x360 13-4104ng | |
| Asus Zenbook UX303UB-R4100T | |
| bajo | medio | alto | ultra | |
| Tomb Raider (2013) | 72.2 | 38.3 | 23.7 | 10.8 |
| Dirt Rally (2015) | 113.2 | 25 | 15 | 12.5 |
| Star Wars Battlefront (2015) | 29.9 | 16.1 |
Ruido
| Ocioso |
| 31.5 / 31.5 / 31.7 dB(A) |
| Carga |
| 39.7 / 39.4 dB(A) |
 | ||
30 dB silencioso 40 dB(A) audible 50 dB(A) ruidosamente alto |
||
min: | ||
| Acer Aspire R13 R7-372T 6200U, HD Graphics 520 | Acer Aspire R7-371T-52EL 5200U, HD Graphics 5500 | Acer Aspire R13 R7-371T-779K 4510U, HD Graphics 4400 | HP Spectre x360 13-4104ng 6200U, HD Graphics 520 | Lenovo Yoga 900-13ISK 80MK 6500U, HD Graphics 520 | Asus Zenbook UX303UB-R4100T 6500U, GeForce 940M | |
|---|---|---|---|---|---|---|
| Noise | 5% | 3% | 4% | 7% | 3% | |
| Idle Minimum * | 31.5 | 29.6 6% | 30.9 2% | 29.6 6% | 29.7 6% | 31.5 -0% |
| Idle Average * | 31.5 | 31 2% | 30.9 2% | 29.6 6% | 29.8 5% | 31.5 -0% |
| Idle Maximum * | 31.7 | 31.8 -0% | 32 -1% | 34.6 -9% | 30 5% | 31.5 1% |
| Load Average * | 39.7 | 36.5 8% | 37.6 5% | 34.7 13% | 32 19% | 35.9 10% |
| Load Maximum * | 39.4 | 36.7 7% | 37.6 5% | 37.9 4% | 38.5 2% | 38.2 3% |
* ... más pequeño es mejor
(-) The maximum temperature on the upper side is 45.2 °C / 113 F, compared to the average of 35.3 °C / 96 F, ranging from 19.6 to 55.7 °C for the class Convertible.
(±) The bottom heats up to a maximum of 41 °C / 106 F, compared to the average of 36.7 °C / 98 F
(+) In idle usage, the average temperature for the upper side is 25 °C / 77 F, compared to the device average of 30.2 °C / 86 F.
(+) The palmrests and touchpad are cooler than skin temperature with a maximum of 27.1 °C / 80.8 F and are therefore cool to the touch.
(±) The average temperature of the palmrest area of similar devices was 28.1 °C / 82.6 F (+1 °C / 1.8 F).
| Acer Aspire R13 R7-372T 6200U, HD Graphics 520 | Acer Aspire R7-371T-52EL 5200U, HD Graphics 5500 | Acer Aspire R13 R7-371T-779K 4510U, HD Graphics 4400 | HP Spectre x360 13-4104ng 6200U, HD Graphics 520 | Lenovo Yoga 900-13ISK 80MK 6500U, HD Graphics 520 | Asus Zenbook UX303UB-R4100T 6500U, GeForce 940M | Asus Zenbook UX305CA-EHM1 6Y30, HD Graphics 515 | |
|---|---|---|---|---|---|---|---|
| Heat | -2% | -12% | 4% | 9% | -9% | 17% | |
| Maximum Upper Side * | 45.2 | 43.7 3% | 46 -2% | 39.6 12% | 37.4 17% | 56.6 -25% | 34.6 23% |
| Maximum Bottom * | 41 | 47.5 -16% | 51.8 -26% | 39.7 3% | 36.4 11% | 54.3 -32% | 35.2 14% |
| Idle Upper Side * | 26.9 | 23.8 12% | 28.5 -6% | 25 7% | 26.6 1% | 24 11% | 22.6 16% |
| Idle Bottom * | 27.6 | 29.2 -6% | 31.1 -13% | 29.8 -8% | 25.6 7% | 24.2 12% | 23.4 15% |
* ... más pequeño es mejor
| Off / Standby | |
| Ocioso | |
| Carga |
|
| Acer Aspire R13 R7-372T 6200U, HD Graphics 520 | Acer Aspire R7-371T-52EL 5200U, HD Graphics 5500 | Acer Aspire R13 R7-371T-779K 4510U, HD Graphics 4400 | HP Spectre x360 13-4104ng 6200U, HD Graphics 520 | Asus Zenbook UX303UB-R4100T 6500U, GeForce 940M | |
|---|---|---|---|---|---|
| Power Consumption | 27% | 9% | 12% | -9% | |
| Idle Minimum * | 5.1 | 3.5 31% | 4.8 6% | 3.9 24% | 3.2 37% |
| Idle Average * | 7.2 | 5.6 22% | 8.2 -14% | 7.4 -3% | 7.6 -6% |
| Idle Maximum * | 9 | 5.8 36% | 8.3 8% | 9.2 -2% | 8 11% |
| Load Average * | 34.2 | 26.2 23% | 27 21% | 28.1 18% | 47 -37% |
| Load Maximum * | 37 | 29.1 21% | 28.3 24% | 27.6 25% | 55 -49% |
* ... más pequeño es mejor
| Acer Aspire R13 R7-372T 50 Wh | Acer Aspire R7-371T-52EL 48 Wh | Acer Aspire R13 R7-371T-779K 61 Wh | HP Spectre x360 13-4104ng 56 Wh | Lenovo Yoga 900-13ISK 80MK 66 Wh | Asus Zenbook UX303UB-R4100T 50 Wh | Asus Zenbook UX305CA-EHM1 45 Wh | |
|---|---|---|---|---|---|---|---|
| Duración de Batería | -1% | 13% | 7% | 10% | 41% | ||
| Reader / Idle | 740 | 520 -30% | 844 14% | 997 35% | 1052 42% | ||
| H.264 | 401 | 372 -7% | 413 3% | ||||
| WiFi v1.3 | 441 | 500 13% | 403 -9% | 410 -7% | 382 -13% | ||
| Load | 110 | 148 35% | 128 16% | 118 7% | 215 95% | ||
| WiFi | 449 | 396 |
Pro
Contra
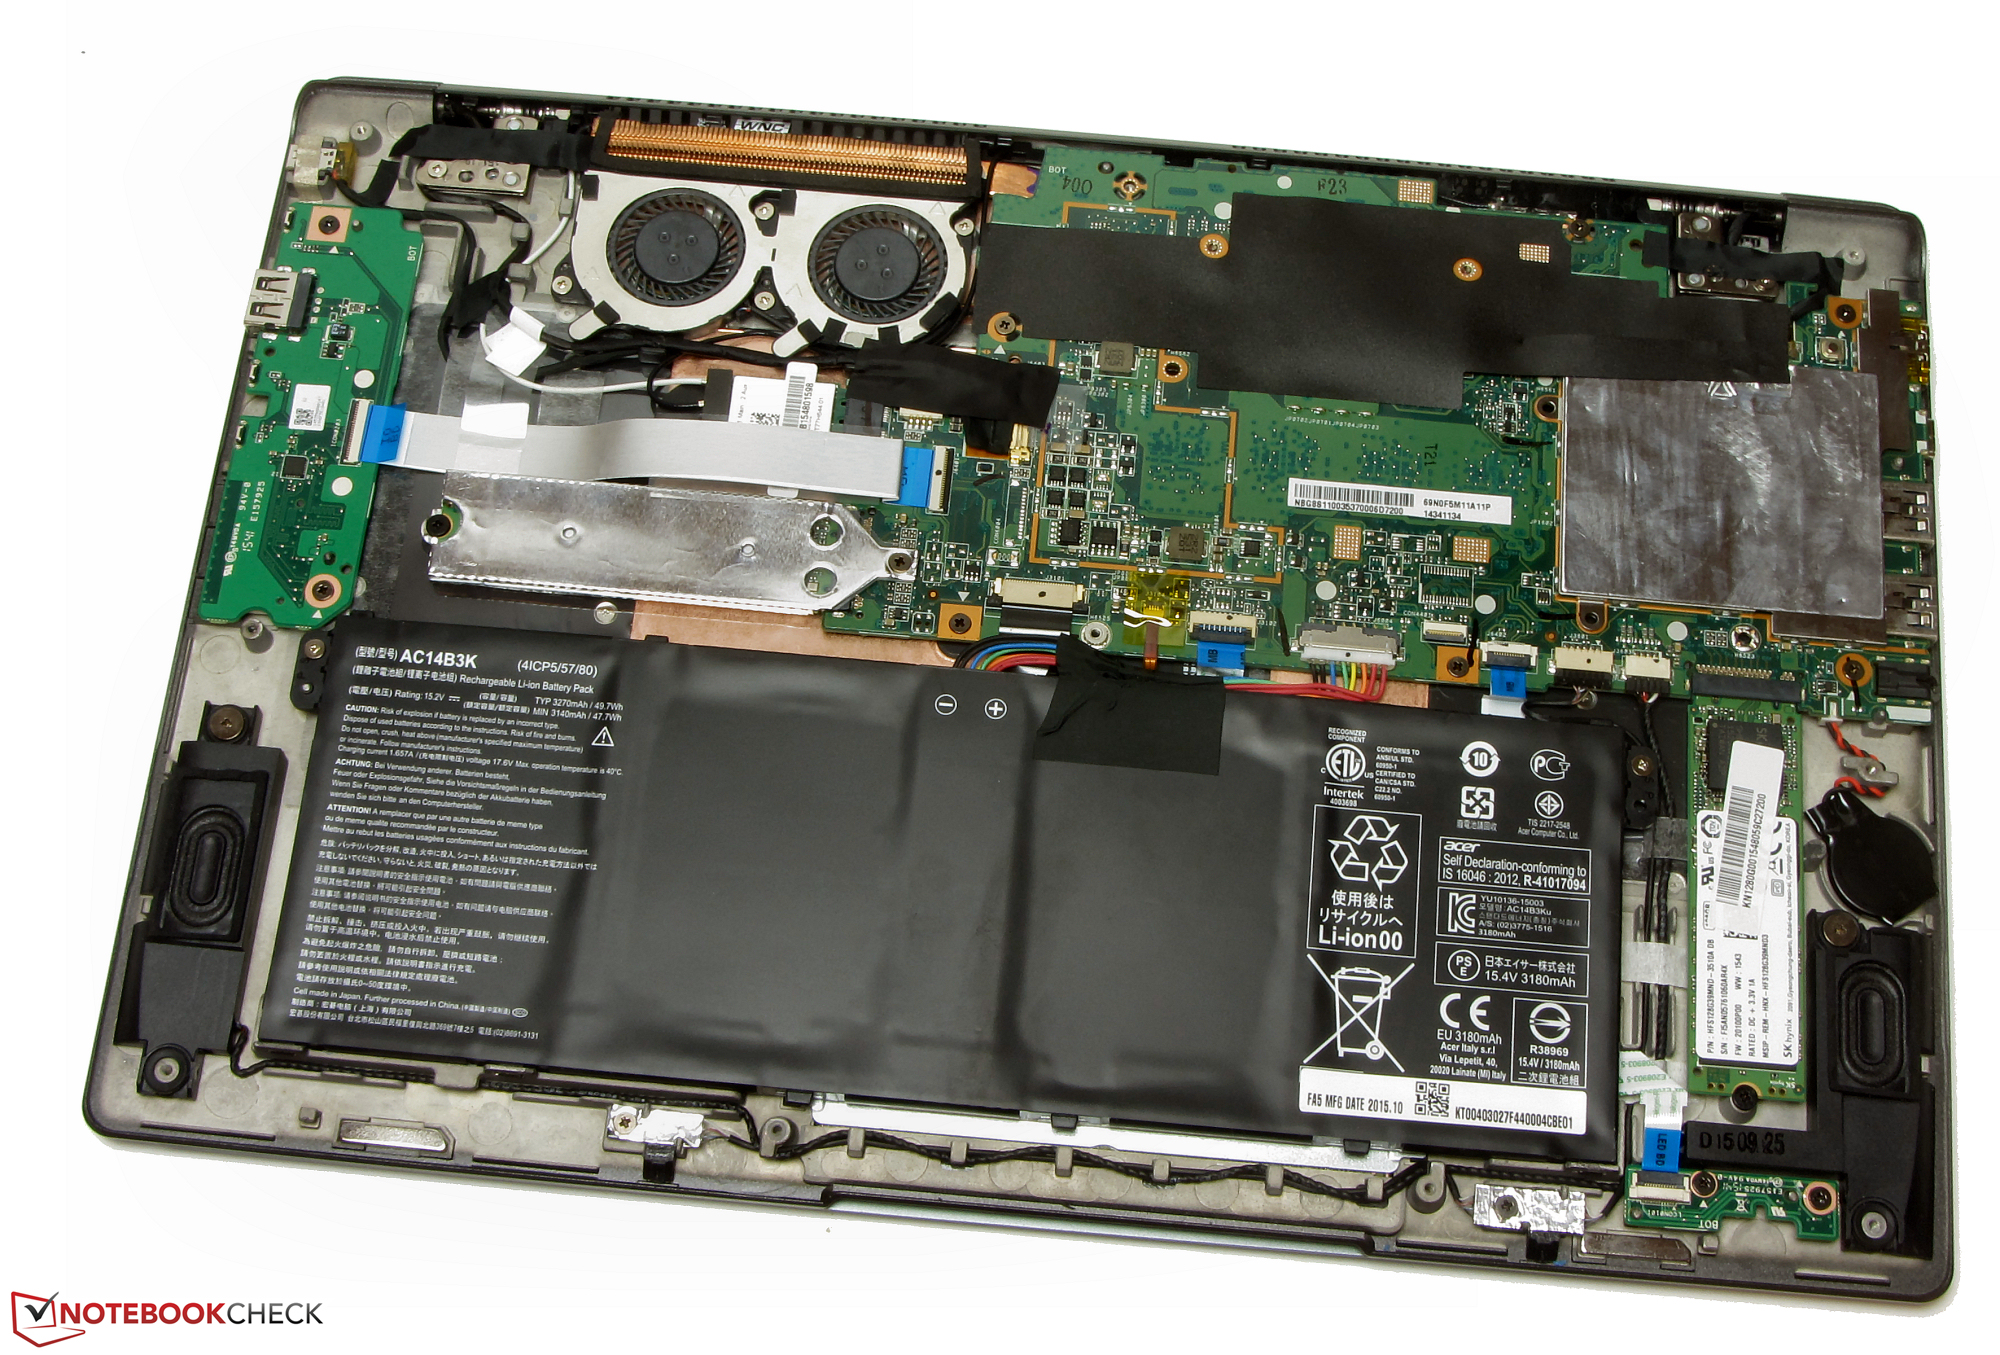
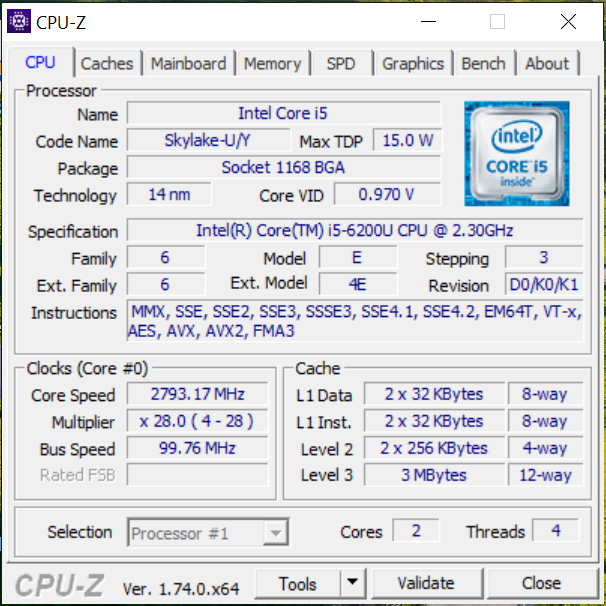
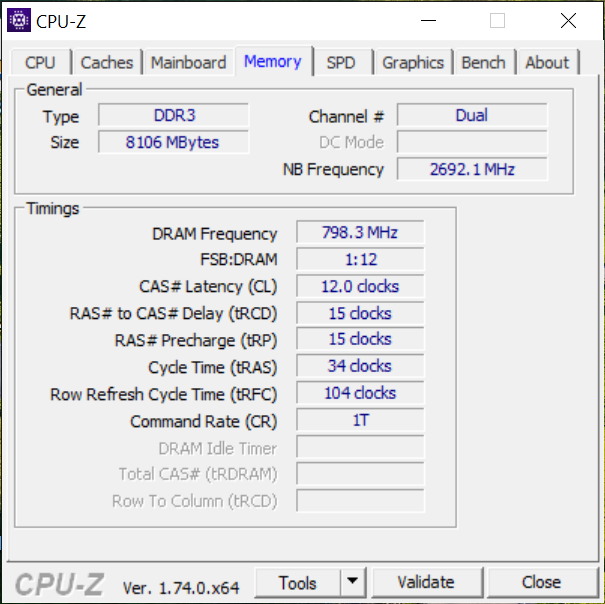
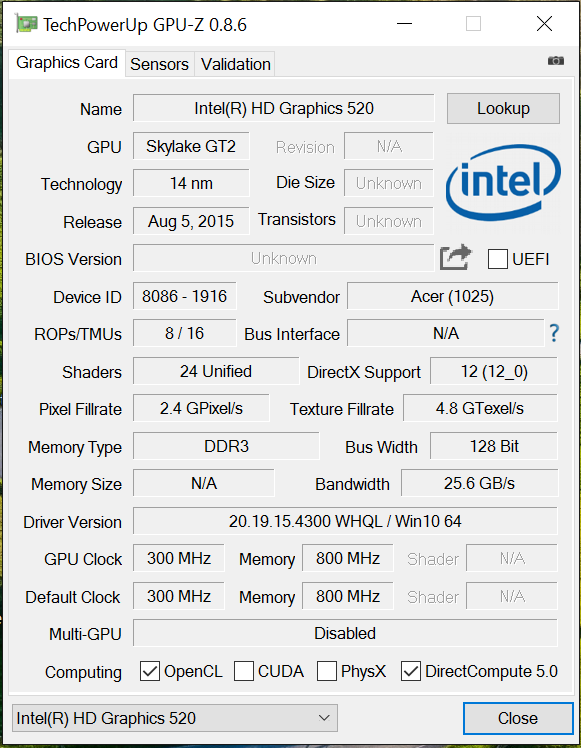
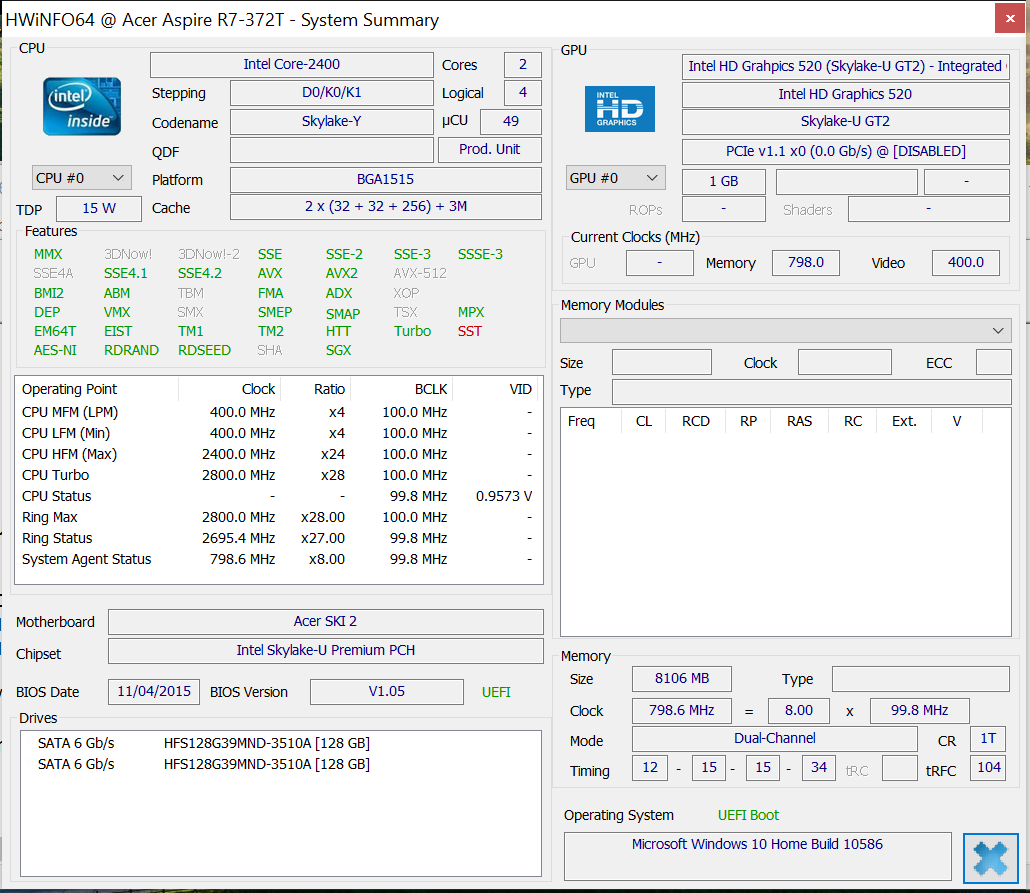
Gracias al nuevo procesador Skylake, el Acer Aspire R13 R7-372T deja atrás a su predecesor Broadwell. La CPU ofrece potencia más que suficiente para las diversas tareas diarias. La GPU integrada y la RAM en dual-channel posibilitan el juego, aunque aún así hay restricciones. El convertible ni siquiera se calienta mucho y también permanece bastante silencioso. El array RAID 0 SSD garantiza un sistema muy rápido y cortos tiempos de carga de aplicación.
Aunque el nuevo Aspire R13 es en esencia el producto del mantenimiento regular de un modelo, Acer ha logrado ejecutar esta actualización realmente bien.
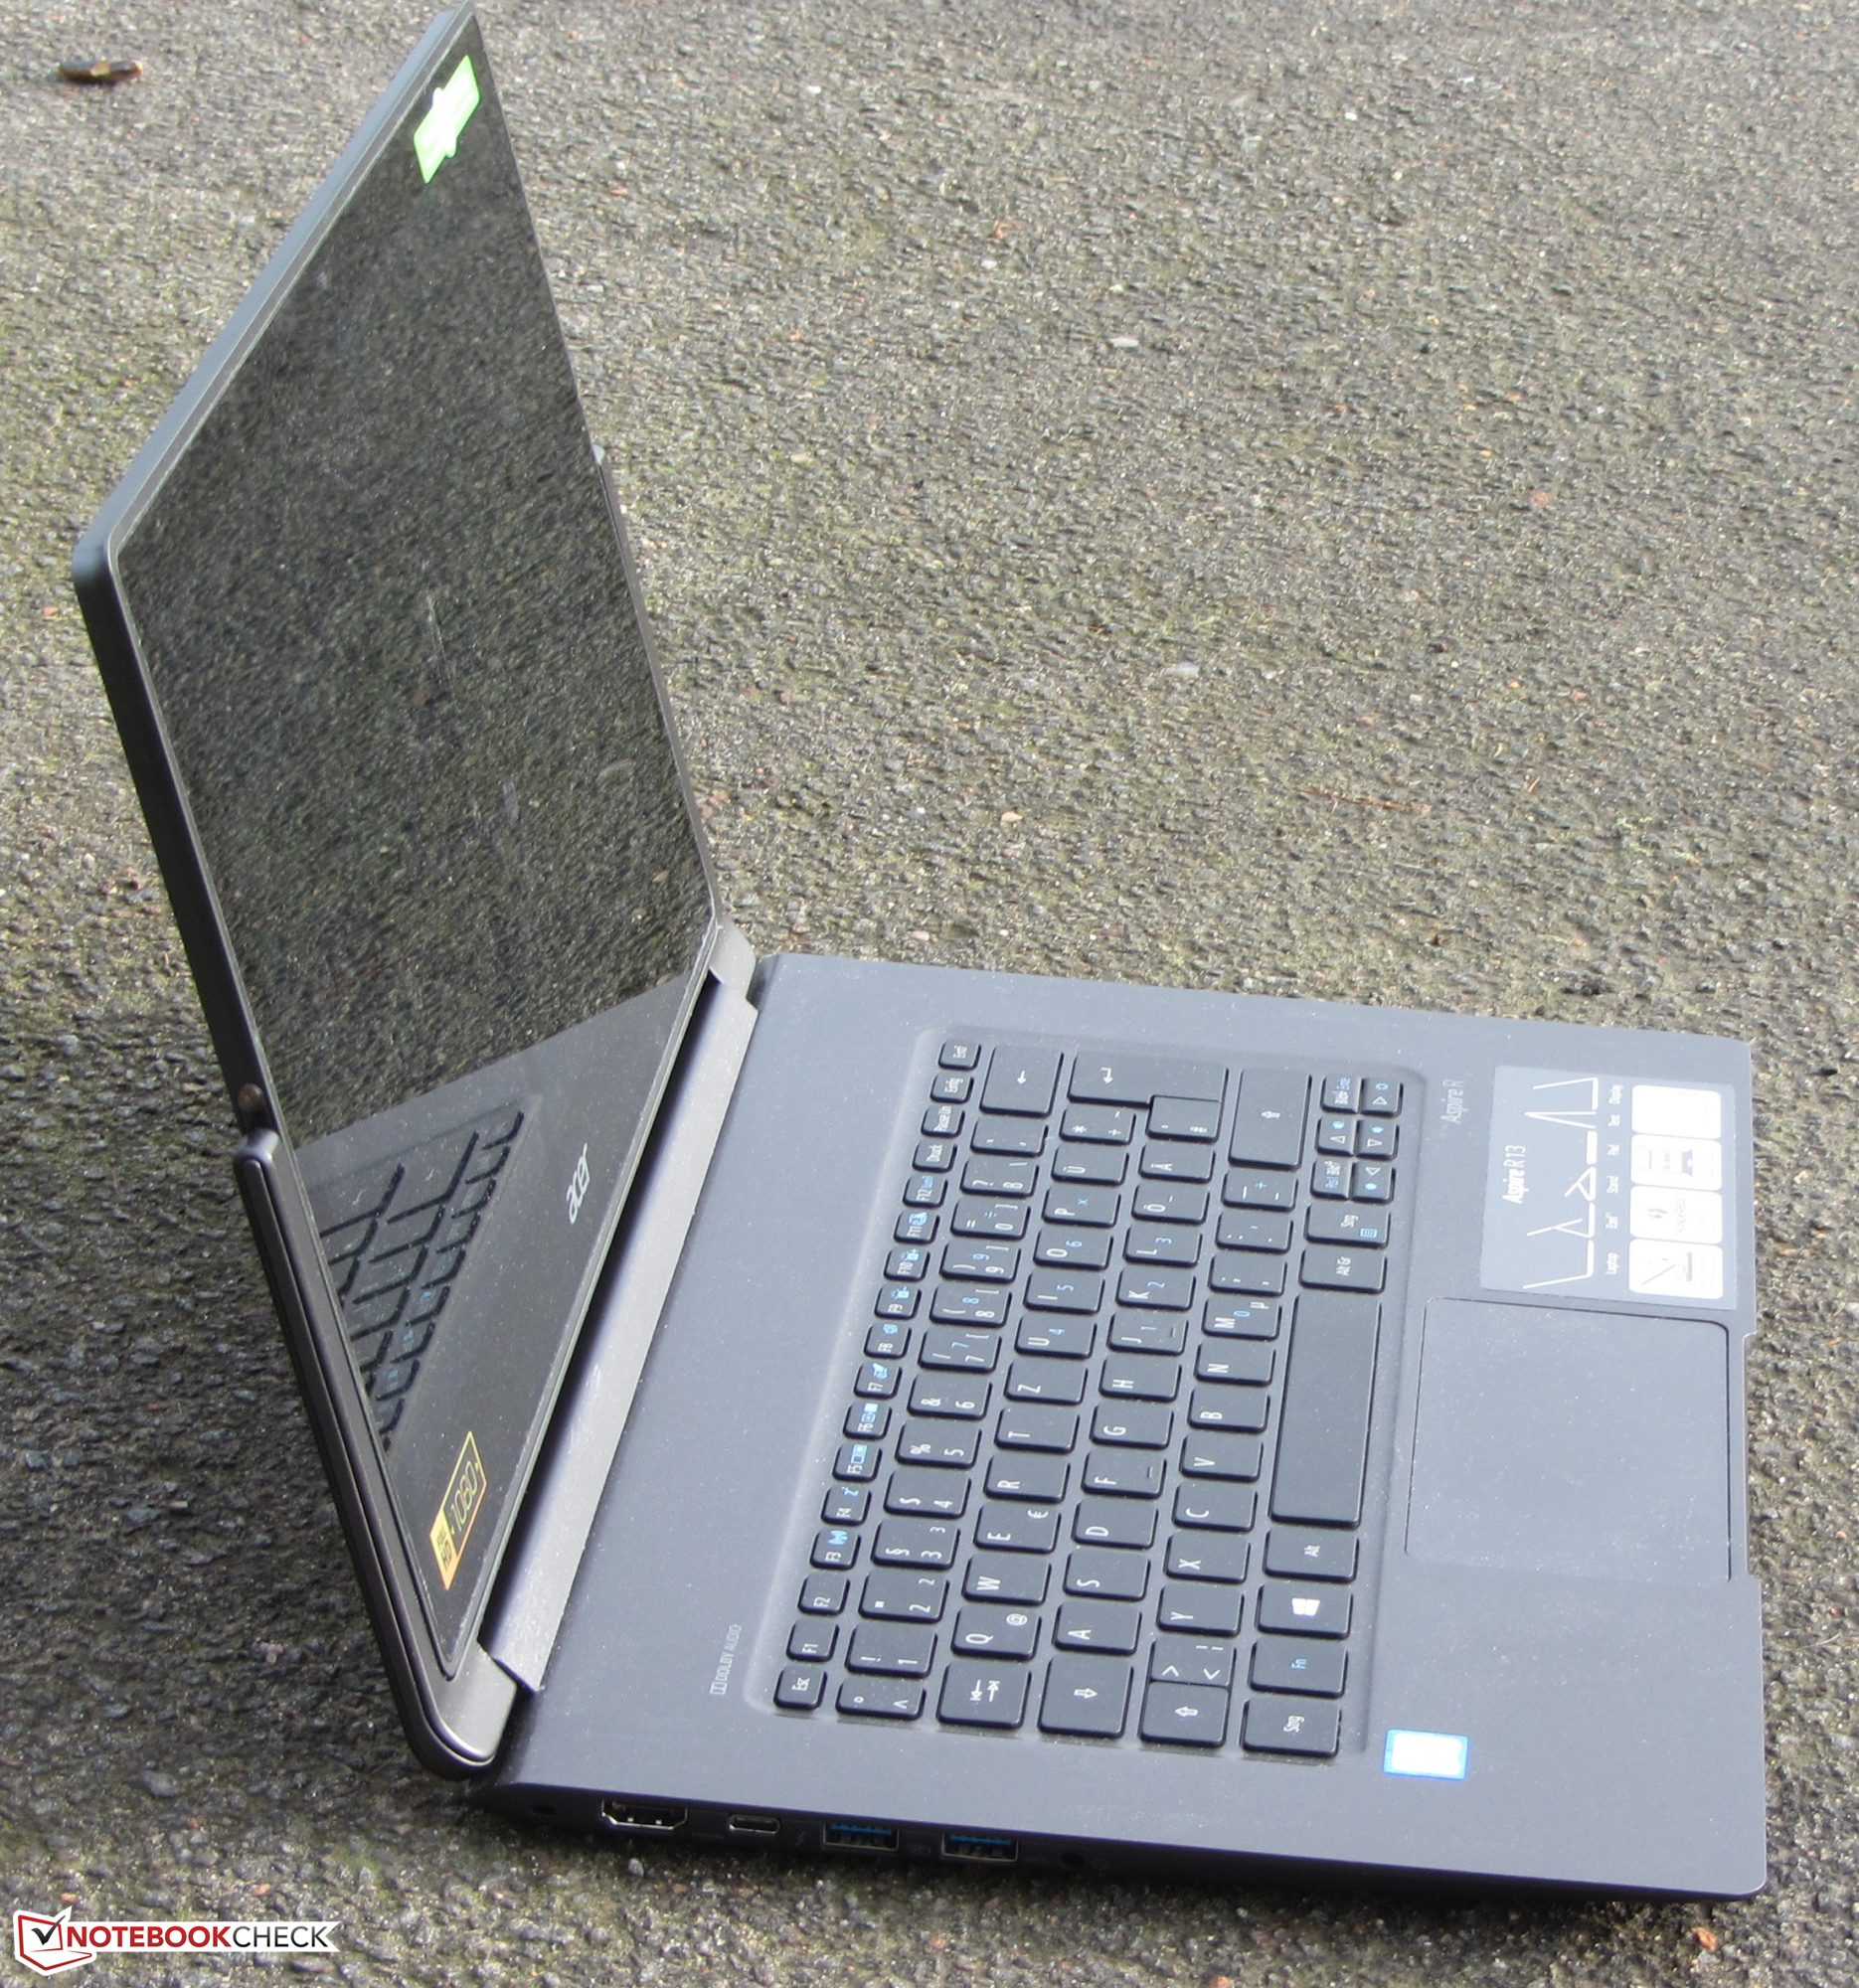
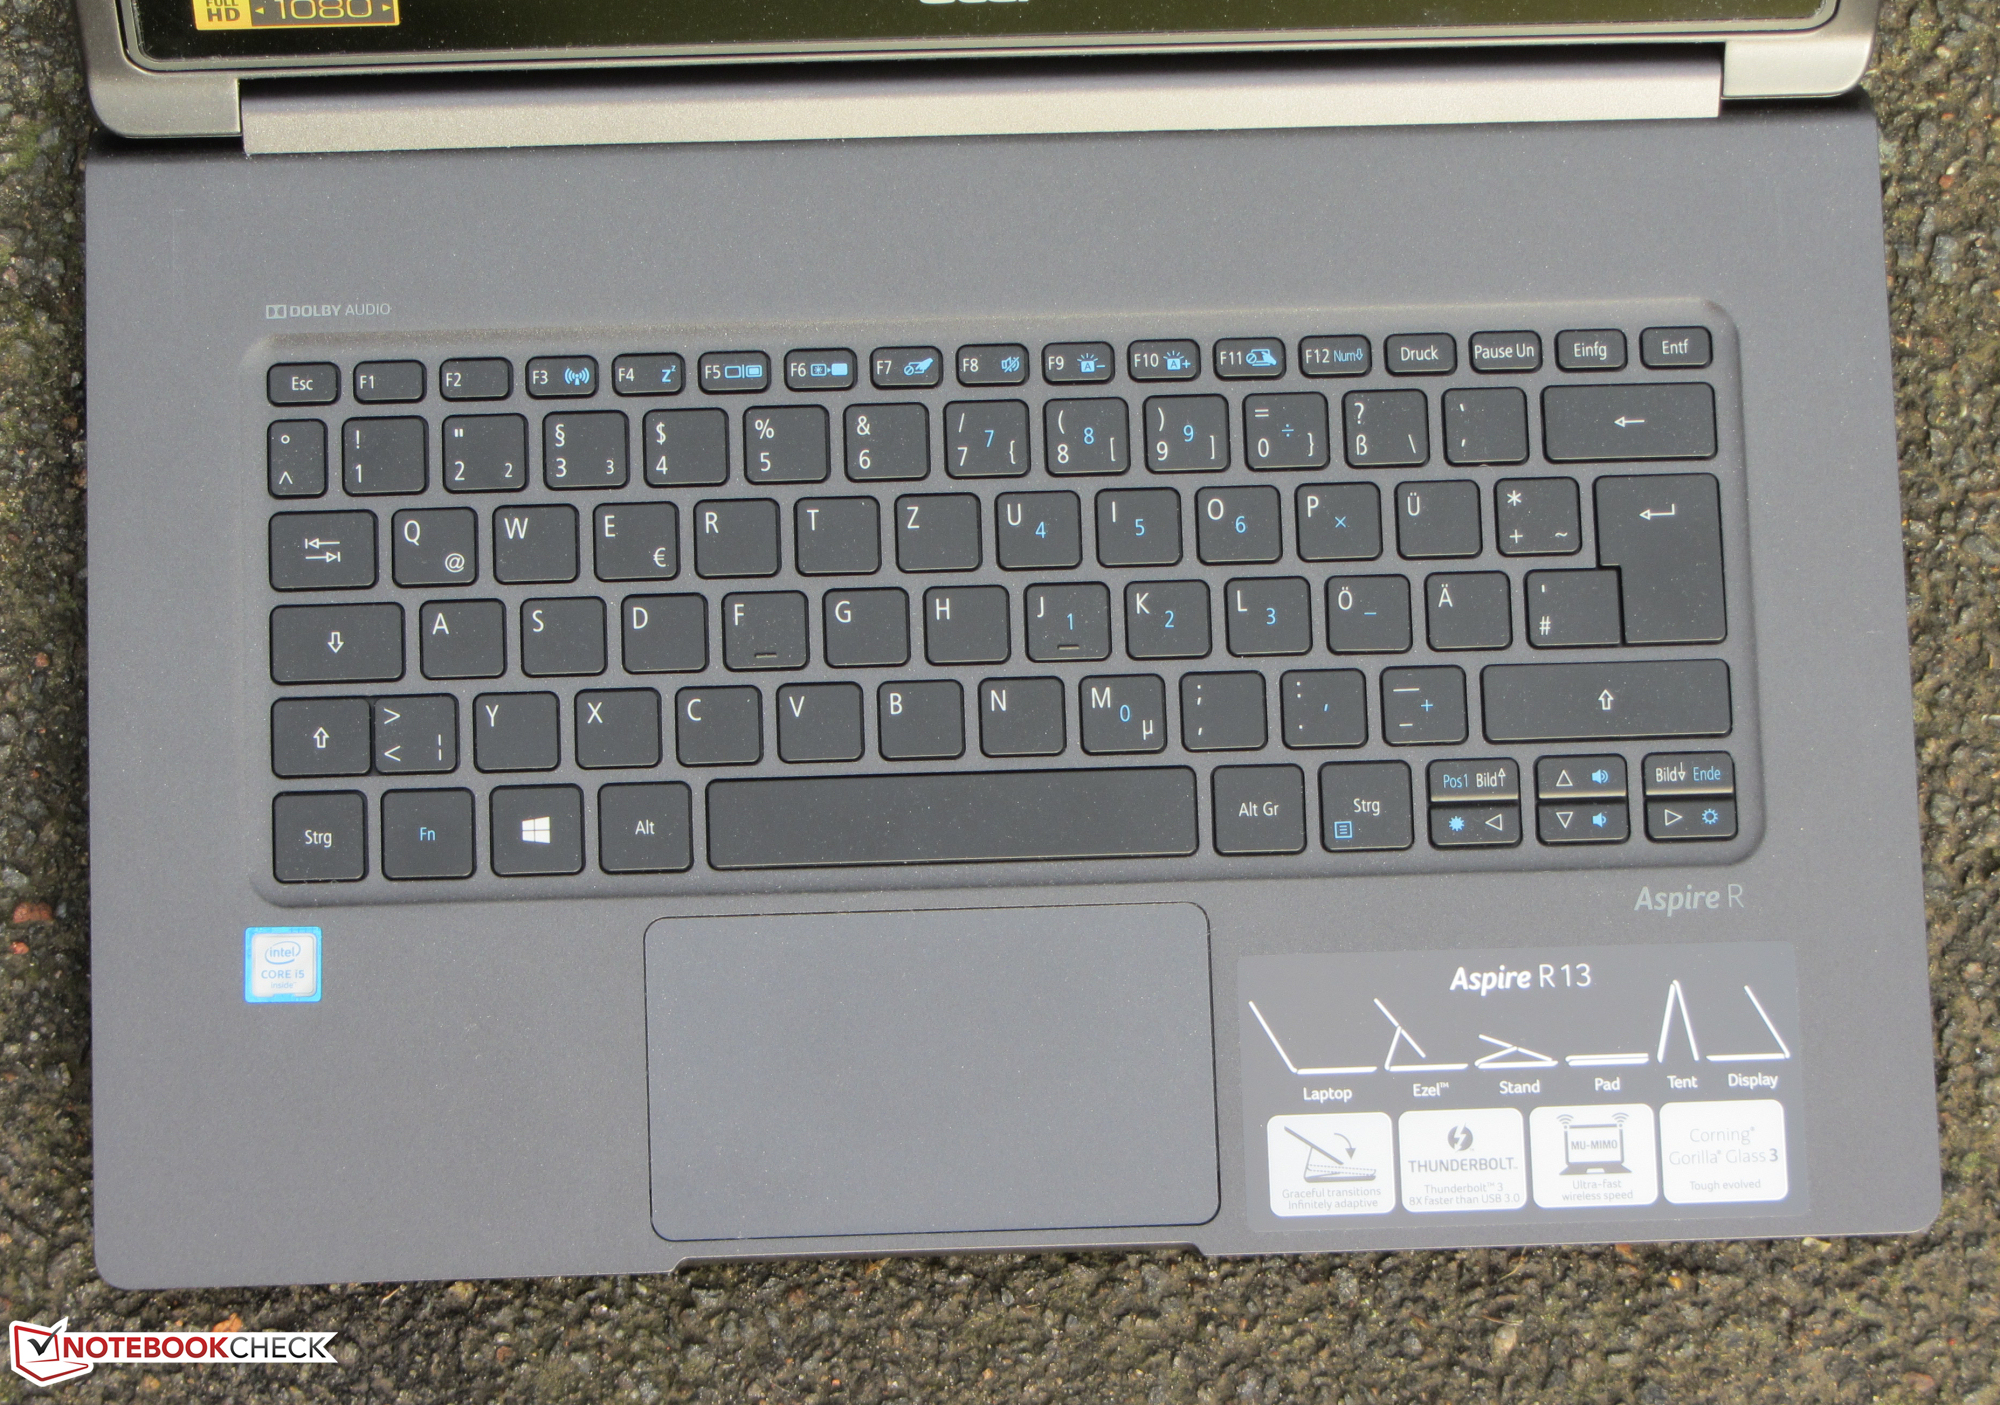
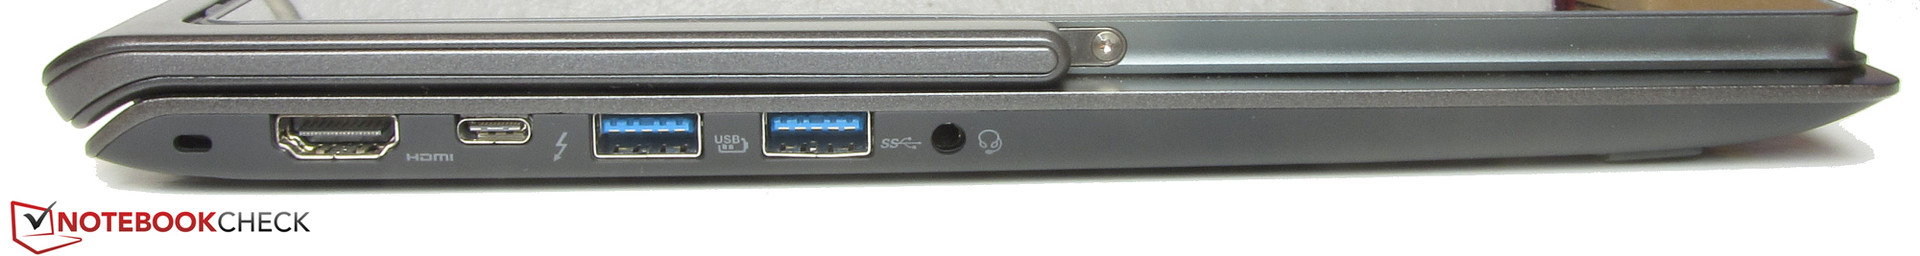
El modelo Skylake mejora el ya buenísimo display que traía el modelo Broadwell y ofrece más brillo y un contraste sustancialmente superior. Sendos displays usan la tecnología IPS y tienen muy buena estabilidad de ángulo de visión. El atractivo paquete queda aún mejor gracias a los buenos dispositivos de entrada y al gran aguante de la batería. Ek¡l puerto Thunderbolt 3 ofrece nuevas capacidades de expansión.
Ésta es una versión acortada del análisis original. Puedes leer el análisis completo en inglés aquí.
Acer Aspire R13 R7-372T
-
04/18/2016 v5.1(old)
Sascha Mölck
Pricecompare
