 Deutsch
 English
 Español
 Français
 Italiano
 Nederlands
 Polski
 Português
 Русский
 Türkçe
 Svenska
 Chinese
 Magyar
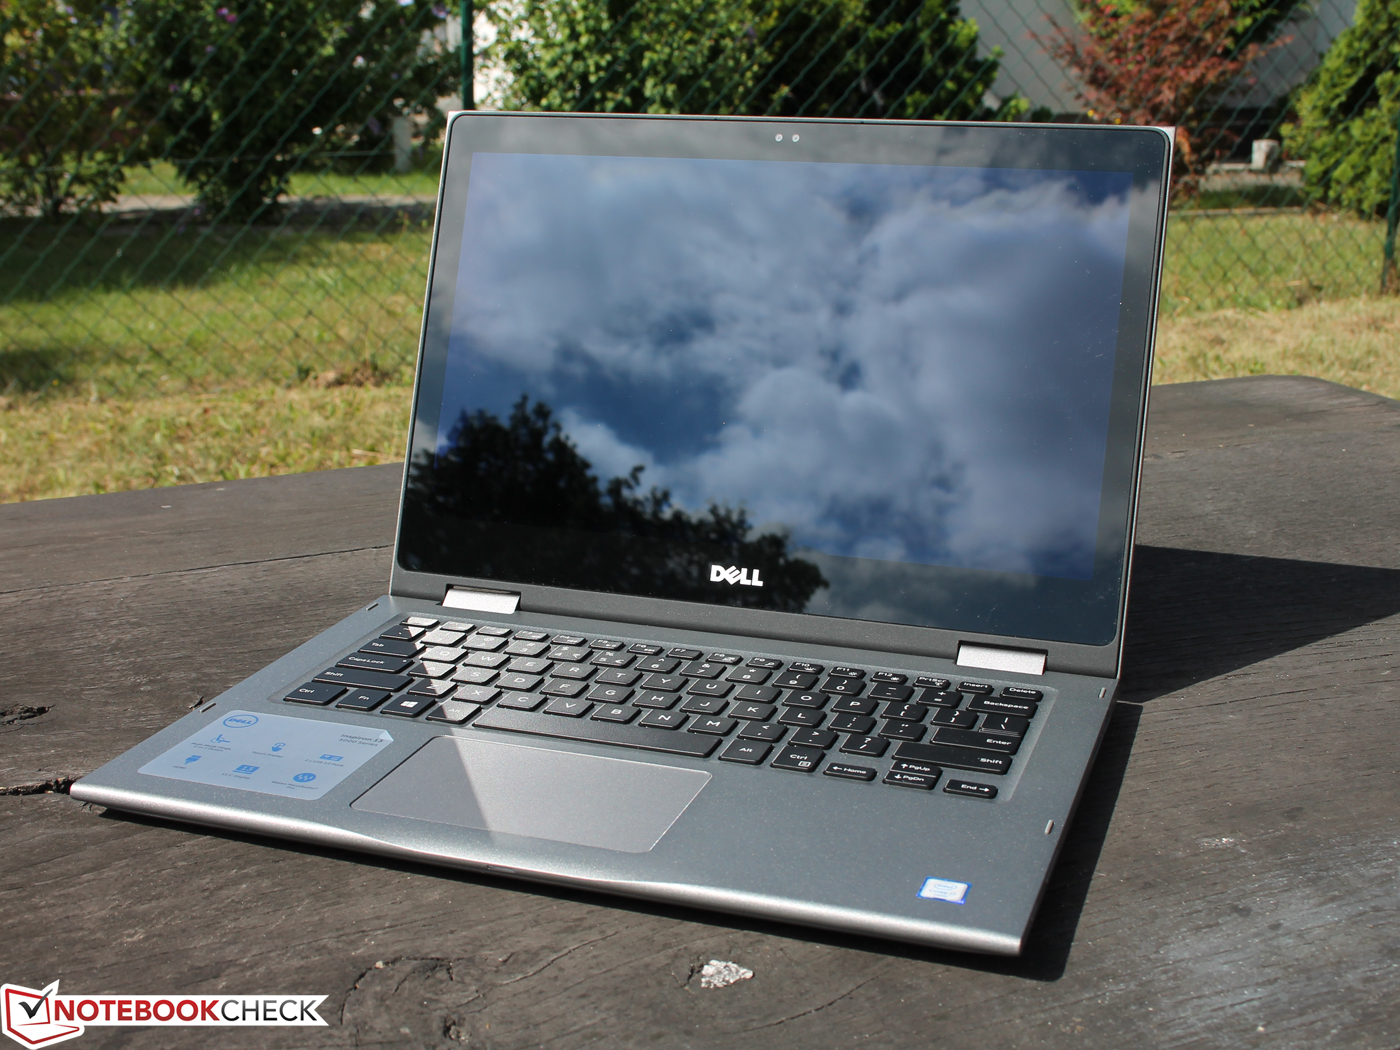
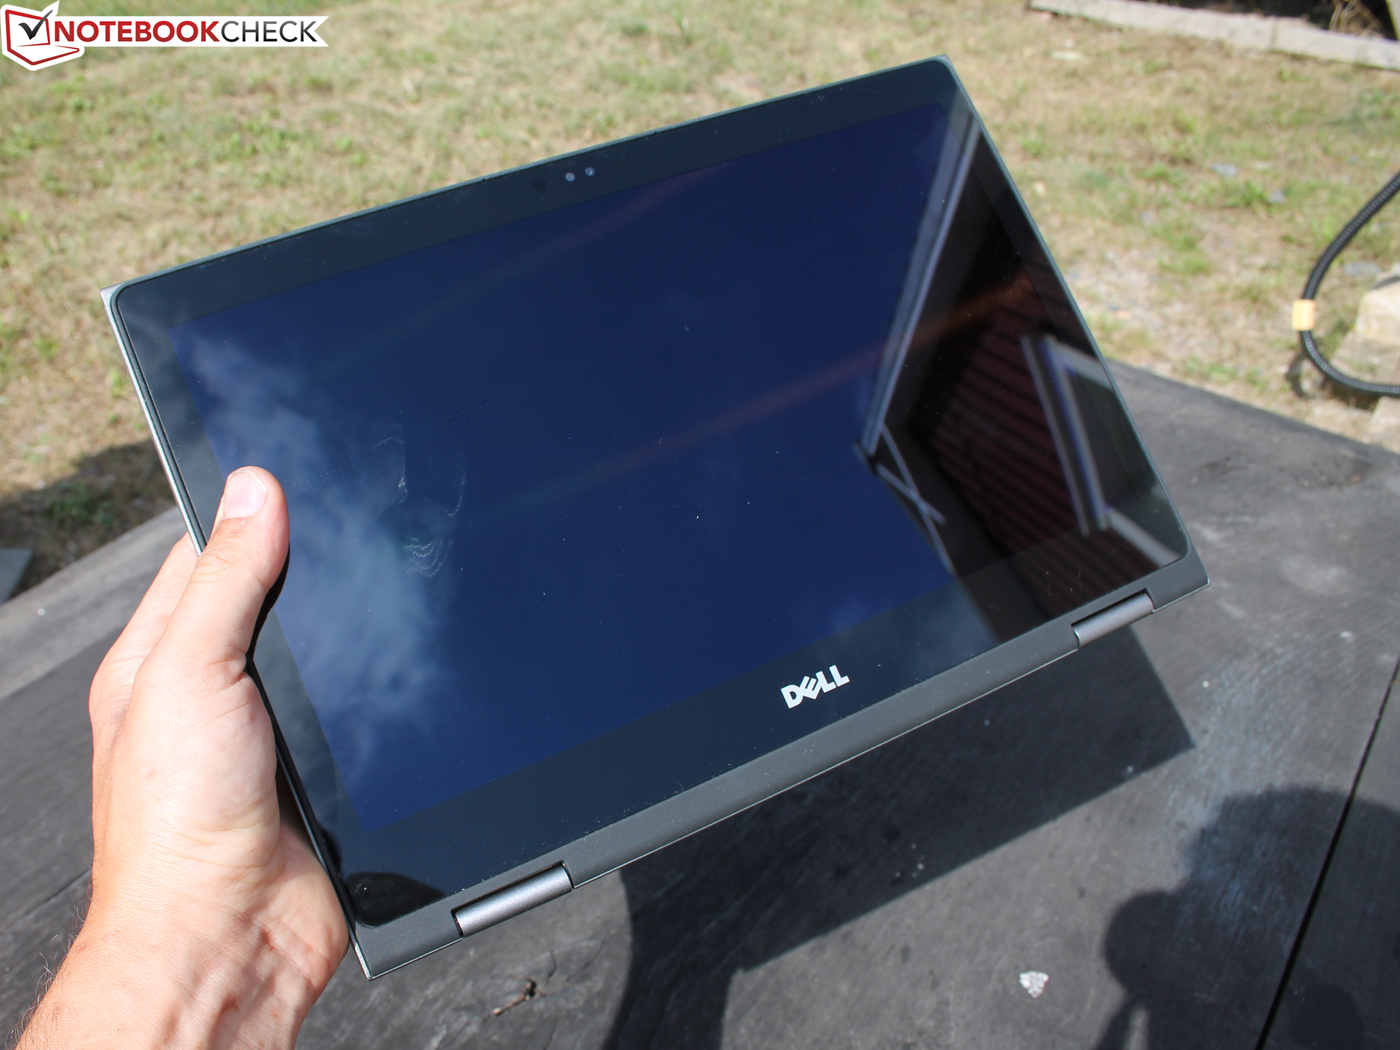
Breve análisis del Convertible Dell Inspiron 13 5368
| SD Card Reader | |
| average JPG Copy Test (av. of 3 runs) | |
| HP EliteBook 820 G3 | |
| Asus Zenbook UX360CA-FC060T | |
| Dell Inspiron 13 5368 | |
| Acer Aspire R13 R7-372T-746N | |
| maximum AS SSD Seq Read Test (1GB) | |
| HP EliteBook 820 G3 | |
| Asus Zenbook UX360CA-FC060T | |
| Acer Aspire R13 R7-372T-746N | |
| Dell Inspiron 13 5368 | |
| |||||||||||||||||||||||||
iluminación: 92 %
Brillo con batería: 239 cd/m²
Contraste: 1000:1 (Negro: 0.24 cd/m²)
ΔE Color 4.75 | 0.5-29.43 Ø5
ΔE Greyscale 4.3 | 0.57-98 Ø5.3
57.39% sRGB (Argyll 1.6.3 3D)
36.79% AdobeRGB 1998 (Argyll 1.6.3 3D)
40.17% AdobeRGB 1998 (Argyll 2.2.0 3D)
57.7% sRGB (Argyll 2.2.0 3D)
38.88% Display P3 (Argyll 2.2.0 3D)
Gamma: 2.5
| Dell Inspiron 13 5368 AUO B133HAB, , 1920x1080, 13.30 | Acer Aspire R13 R7-372T-746N Sharp LQ133T1JW02, , 2560x1440, 13.30 | HP Spectre x360 13-4104ng LG Philips LGD0000, , 2560x1440, 13.30 | Asus Zenbook UX360CA-FC060T AUO B133HAN02.7, , 1920x1080, 13.30 | Lenovo Yoga 900-13ISK 80MK 3200x1800, 13.30 | |
|---|---|---|---|---|---|
| Display | 75% | 67% | 65% | 60% | |
| Display P3 Coverage | 38.88 | 69.6 79% | 66.8 72% | 65.1 67% | 63.2 63% |
| sRGB Coverage | 57.7 | 98 70% | 92.8 61% | 93 61% | 88.7 54% |
| AdobeRGB 1998 Coverage | 40.17 | 70.7 76% | 67.3 68% | 66.5 66% | 64.9 62% |
| Response Times | 11% | 42% | 32% | 20% | |
| Response Time Grey 50% / Grey 80% * | 44 ? | 36 ? 18% | 24 ? 45% | 29 ? 34% | 38.8 ? 12% |
| Response Time Black / White * | 31 ? | 30 ? 3% | 19 ? 39% | 22 ? 29% | 22.4 ? 28% |
| PWM Frequency | 1000 ? | 192 ? | 1316 | ||
| Screen | 36% | 17% | 8% | -6% | |
| Brightness middle | 240 | 320 33% | 324 35% | 302 26% | 319.8 33% |
| Brightness | 229 | 308 34% | 324 41% | 298 30% | 302 32% |
| Brightness Distribution | 92 | 91 -1% | 90 -2% | 90 -2% | 88 -4% |
| Black Level * | 0.24 | 0.17 29% | 0.34 -42% | 0.21 12% | 0.835 -248% |
| Contrast | 1000 | 1882 88% | 953 -5% | 1438 44% | 383 -62% |
| Colorchecker dE 2000 * | 4.75 | 3.18 33% | 4.36 8% | 6.33 -33% | 2.68 44% |
| Colorchecker dE 2000 max. * | 9.09 | 9.91 -9% | 11.89 -31% | ||
| Greyscale dE 2000 * | 4.3 | 4.13 4% | 4.62 -7% | 8.13 -89% | 2.35 45% |
| Gamma | 2.5 88% | 2.03 108% | 2.18 101% | 2.52 87% | 2.09 105% |
| CCT | 5893 110% | 6752 96% | 6857 95% | 6811 95% | 6975 93% |
| Color Space (Percent of AdobeRGB 1998) | 36.79 | 65 77% | 60 63% | 60 63% | 57 55% |
| Color Space (Percent of sRGB) | 57.39 | 98 71% | 93 62% | 93 62% | 88 53% |
| Media total (Programa/Opciones) | 41% /
40% | 42% /
31% | 35% /
23% | 25% /
12% |
* ... más pequeño es mejor
Tiempos de respuesta del display
| ↔ Tiempo de respuesta de Negro a Blanco | ||
|---|---|---|
| 31 ms ... subida ↗ y bajada ↘ combinada | ↗ 15 ms subida |  |
| ↘ 16 ms bajada | ||
| La pantalla mostró tiempos de respuesta lentos en nuestros tests y podría ser demasiado lenta para los jugones. En comparación, todos los dispositivos de prueba van de ##min### (mínimo) a 240 (máximo) ms. » 81 % de todos los dispositivos son mejores. Eso quiere decir que el tiempo de respuesta es peor que la media (21.5 ms) de todos los dispositivos testados. | ||
| ↔ Tiempo de respuesta 50% Gris a 80% Gris | ||
| 44 ms ... subida ↗ y bajada ↘ combinada | ↗ 20 ms subida | 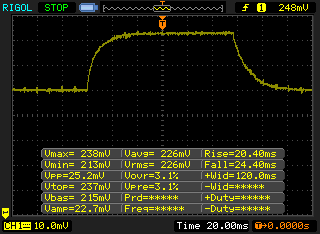 |
| ↘ 24 ms bajada | ||
| La pantalla mostró tiempos de respuesta lentos en nuestros tests y podría ser demasiado lenta para los jugones. En comparación, todos los dispositivos de prueba van de ##min### (mínimo) a 636 (máximo) ms. » 69 % de todos los dispositivos son mejores. Eso quiere decir que el tiempo de respuesta es peor que la media (33.8 ms) de todos los dispositivos testados. | ||
Parpadeo de Pantalla / PWM (Pulse-Width Modulation)
| Parpadeo de Pantalla / PWM no detectado | ||
Comparación: 53 % de todos los dispositivos testados no usaron PWM para atenuar el display. Si se usó, medimos una media de 17933 (mínimo: 5 - máxmo: 3846000) Hz. | ||
| Cinebench R15 | |
| CPU Single 64Bit | |
| Dell Inspiron 13 5368 | |
| HP Spectre x360 13-4104ng | |
| Acer Aspire R13 R7-372T-746N | |
| Lenovo Yoga 900-13ISK 80MK | |
| Asus Zenbook UX360CA-FC060T | |
| CPU Multi 64Bit | |
| Acer Aspire R13 R7-372T-746N | |
| Dell Inspiron 13 5368 | |
| Lenovo Yoga 900-13ISK 80MK | |
| HP Spectre x360 13-4104ng | |
| Asus Zenbook UX360CA-FC060T | |
| PCMark 8 | |
| Home Score Accelerated v2 | |
| Dell Inspiron 13 5368 | |
| Acer Aspire R13 R7-372T-746N | |
| Lenovo Yoga 900-13ISK 80MK | |
| Asus Zenbook UX360CA-FC060T | |
| Work Score Accelerated v2 | |
| Dell Inspiron 13 5368 | |
| Acer Aspire R13 R7-372T-746N | |
| Lenovo Yoga 900-13ISK 80MK | |
| Asus Zenbook UX360CA-FC060T | |
| PCMark 8 Home Score Accelerated v2 | 3699 puntos | |
| PCMark 8 Work Score Accelerated v2 | 4577 puntos | |
ayuda | ||
| Dell Inspiron 13 5368 Toshiba THNSNK256GCS8 | Acer Aspire R13 R7-372T-746N Lite-On CV1-8B256 | HP Spectre x360 13-4104ng Samsung SSD PM851 256 GB MZNTE256HMHP | Asus Zenbook UX360CA-FC060T Lite-On CV1-8B128 | Lenovo Yoga 900-13ISK 80MK Samsung SSD PM871 MZNLN512HCJH | |
|---|---|---|---|---|---|
| CrystalDiskMark 3.0 | 13% | -17% | -19% | 19% | |
| Read Seq | 479 | 507 6% | 491.8 3% 491.8 3% | 497 4% | 514 7% |
| Write Seq | 270.1 | 354.4 31% | 264.5 -2% 264.5 -2% | 182.9 -32% | 459.5 70% |
| Read 512 | 428.3 | 355.3 -17% | 396.2 -7% 396.2 -7% | 353 -18% | 413.4 -3% |
| Write 512 | 267.9 | 353.9 32% | 264.5 -1% 264.5 -1% | 144.1 -46% | 424.5 58% |
| Read 4k | 23.77 | 32.66 37% | 30.88 30% 30.88 30% | 31.89 34% | 36.34 53% |
| Write 4k | 81.4 | 81.6 0% | 75.6 -7% 75.6 -7% | 62 -24% | 100.1 23% |
| Read 4k QD32 | 333.6 | 277.6 -17% | 31.85 -90% 31.85 -90% | 207.7 -38% | 313.8 -6% |
| Write 4k QD32 | 200.9 | 261.2 30% | 73.9 -63% 73.9 -63% | 131.8 -34% | 96.8 -52% |

| 3DMark 11 - 1280x720 Performance GPU | |
| Dell Inspiron 13 5368 | |
| Acer Aspire R13 R7-372T-746N | |
| Lenovo Yoga 900-13ISK 80MK | |
| HP Spectre x360 13-4104ng | |
| HP Spectre x360 13-4104ng | |
| Asus Zenbook UX360CA-FC060T | |
| 3DMark - 1280x720 Cloud Gate Standard Graphics | |
| Dell Inspiron 13 5368 | |
| Acer Aspire R13 R7-372T-746N | |
| HP Spectre x360 13-4104ng | |
| HP Spectre x360 13-4104ng | |
| Lenovo Yoga 900-13ISK 80MK | |
| Asus Zenbook UX360CA-FC060T | |
| 3DMark 11 Performance | 1658 puntos | |
| 3DMark Cloud Gate Standard Score | 5937 puntos | |
ayuda | ||
| Rise of the Tomb Raider - 1024x768 Lowest Preset | |
| Dell Inspiron 13 5368 | |
| Asus VivoBook Flip TP301UA-DW006T | |
| Asus Zenbook UX360CA-FC060T | |
| BioShock Infinite - 1366x768 Medium Preset | |
| Dell Inspiron 13 5368 | |
| Acer Aspire R13 R7-372T-746N | |
| HP Spectre x360 13-4104ng | |
| Asus VivoBook Flip TP301UA-DW006T | |
| Asus Zenbook UX360CA-FC060T | |
| Thief - 1024x768 Very Low Preset | |
| Dell Inspiron 13 5368 | |
| Asus VivoBook Flip TP301UA-DW006T | |
| bajo | medio | alto | ultra | |
| BioShock Infinite (2013) | 59.8 | 32.2 | 27.5 | |
| Thief (2014) | 24.3 | 15.1 | 12.6 | |
| Rise of the Tomb Raider (2016) | 17.3 | 11 |
Ruido
| Ocioso |
| 29 / 29 / 29 dB(A) |
| Carga |
| 31 / 40.3 dB(A) |
 | ||
30 dB silencioso 40 dB(A) audible 50 dB(A) ruidosamente alto |
||
min: | ||
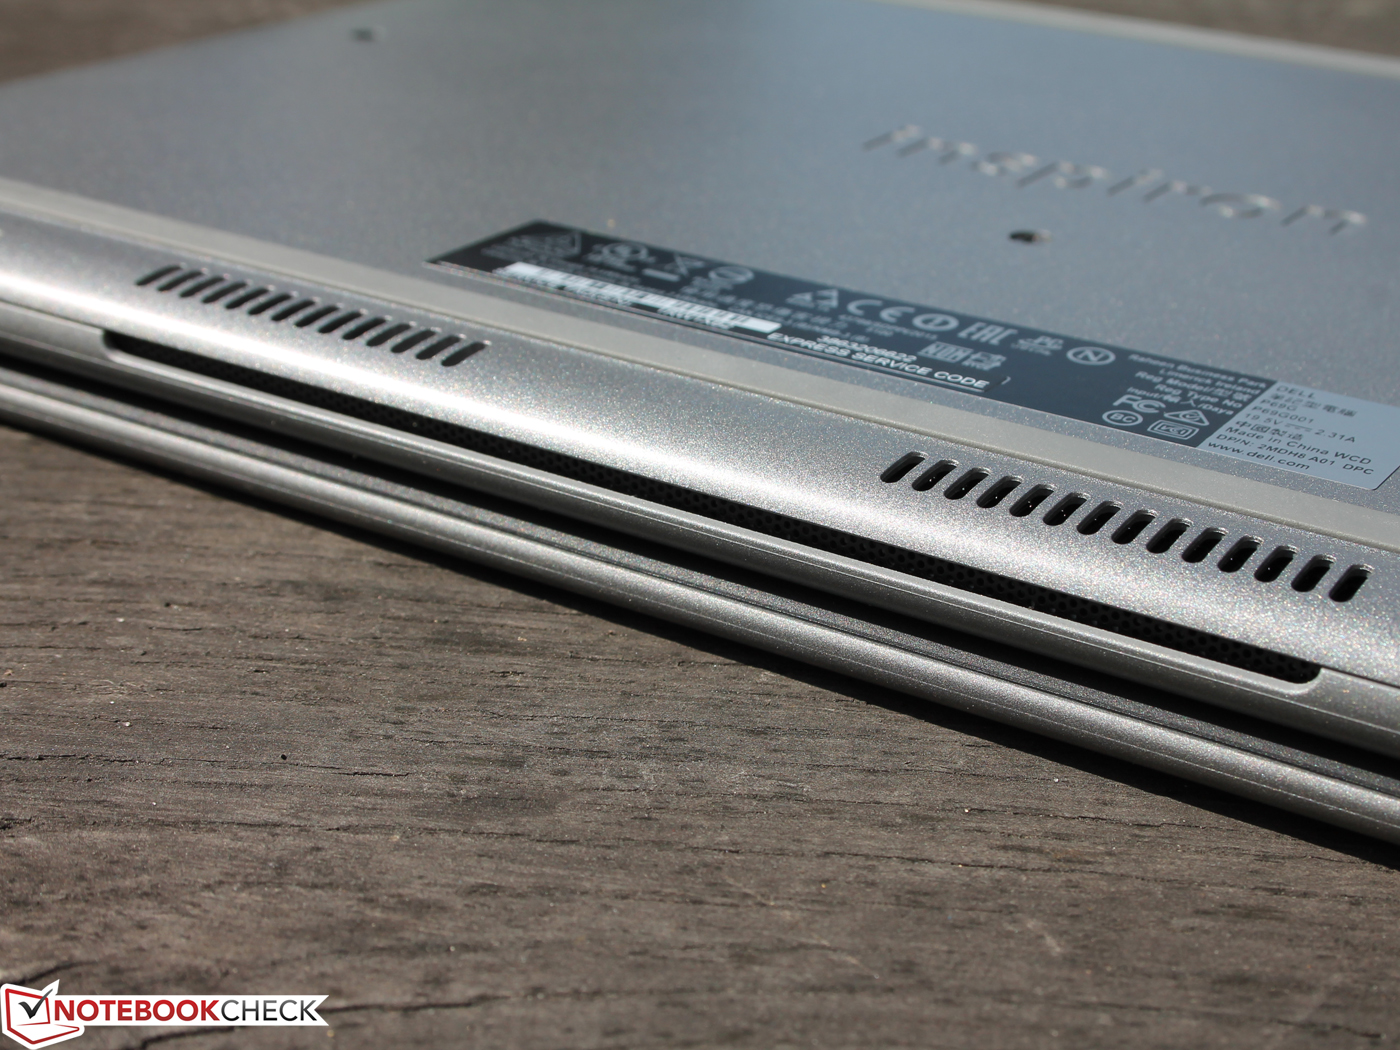
(±) The maximum temperature on the upper side is 41.6 °C / 107 F, compared to the average of 35.3 °C / 96 F, ranging from 19.6 to 55.7 °C for the class Convertible.
(-) The bottom heats up to a maximum of 45.9 °C / 115 F, compared to the average of 36.8 °C / 98 F
(+) In idle usage, the average temperature for the upper side is 29.9 °C / 86 F, compared to the device average of 30.2 °C / 86 F.
(+) The palmrests and touchpad are cooler than skin temperature with a maximum of 28.6 °C / 83.5 F and are therefore cool to the touch.
(±) The average temperature of the palmrest area of similar devices was 28.1 °C / 82.6 F (-0.5 °C / -0.9 F).
Dell Inspiron 13 5368 audio analysis
(+) | speakers can play relatively loud (84.6 dB)
Bass 100 - 315 Hz
(±) | reduced bass - on average 12.2% lower than median
(±) | linearity of bass is average (12.6% delta to prev. frequency)
Mids 400 - 2000 Hz
(±) | higher mids - on average 7.1% higher than median
(±) | linearity of mids is average (7.1% delta to prev. frequency)
Highs 2 - 16 kHz
(±) | reduced highs - on average 6.4% lower than median
(±) | linearity of highs is average (10.2% delta to prev. frequency)
Overall 100 - 16.000 Hz
(±) | linearity of overall sound is average (20.8% difference to median)
Compared to same class
» 50% of all tested devices in this class were better, 11% similar, 39% worse
» The best had a delta of 6%, average was 21%, worst was 57%
Compared to all devices tested
» 51% of all tested devices were better, 8% similar, 41% worse
» The best had a delta of 4%, average was 25%, worst was 134%
Acer Aspire R13 R7-372T-746N audio analysis
(±) | speaker loudness is average but good (75 dB)
Analysis not possible as minimum curve is missing or too high
| Off / Standby | |
| Ocioso | |
| Carga |
|
| Dell Inspiron 13 5368 6500U, HD Graphics 520, Toshiba THNSNK256GCS8, IPS, 1920x1080, 13.30 | Acer Aspire R13 R7-372T-746N 6500U, HD Graphics 520, Lite-On CV1-8B256, IPS, 2560x1440, 13.30 | HP Spectre x360 13-4104ng 6200U, HD Graphics 520, Samsung SSD PM851 256 GB MZNTE256HMHP, IPS, 2560x1440, 13.30 | Asus Zenbook UX360CA-FC060T 6Y30, HD Graphics 515, Lite-On CV1-8B128, IPS with 72% NTSC, 1920x1080, 13.30 | |
|---|---|---|---|---|
| Power Consumption | -39% | -6% | 13% | |
| Idle Minimum * | 4.4 | 6.2 -41% | 3.9 11% | 3.4 23% |
| Idle Average * | 6.1 | 8 -31% | 7.4 -21% | 7 -15% |
| Idle Maximum * | 6.8 | 11.6 -71% | 9.2 -35% | 7.6 -12% |
| Load Average * | 29 | 40 -38% | 28.1 3% | 19 34% |
| Load Maximum * | 31.9 | 36.6 -15% | 27.6 13% | 20.1 37% |
* ... más pequeño es mejor
| Dell Inspiron 13 5368 6500U, HD Graphics 520, 42 Wh | Acer Aspire R13 R7-372T-746N 6500U, HD Graphics 520, 49 Wh | HP Spectre x360 13-4104ng 6200U, HD Graphics 520, 56 Wh | Asus Zenbook UX360CA-FC060T 6Y30, HD Graphics 515, 54 Wh | Lenovo Yoga 900-13ISK 80MK 6500U, HD Graphics 520, 66 Wh | |
|---|---|---|---|---|---|
| Duración de Batería | 19% | 108% | 97% | 47% | |
| Reader / Idle | 674 | 669 -1% | 1027 52% | 844 25% | |
| WiFi v1.3 | 240 | 382 59% | 500 108% | 386 61% | 403 68% |
| Load | 86 | 85 -1% | 239 178% | 128 49% | |
| H.264 | 393 |
Pro
Contra
El Dell Inspiron 13 5368 no logra la puntuación más alta, por lo que difícilmente logrará entrar en nuestro Top 10 Convertibles. El rendimiento no es el motivo - la configuración Core i7 y SSD deja atrás a todos los rivales y usa muy bien el Turbo. Los defectos empiezan en la construcción: chasis flexible que no cierra magnéticamente en modo Tablet, las ligeras debilidades del teclado, y el escaso desplazamiento del touchpad. Lo que es más, el peso de 1.6 kg es relativamente alto, la pantalla sólo es moderadamente brillante, y un puerto USB Type-C podría mejorar la conectividad. Aunque esos aspectos siguen siendo tolerables, la falta de estos puntos reduce la puntuación general. El Dell Inspiron 13 5368 muestra su mayor defecto en el aguante WiFi de apenas cuatro horas. Los rivales aguantan de seis a ocho horas.
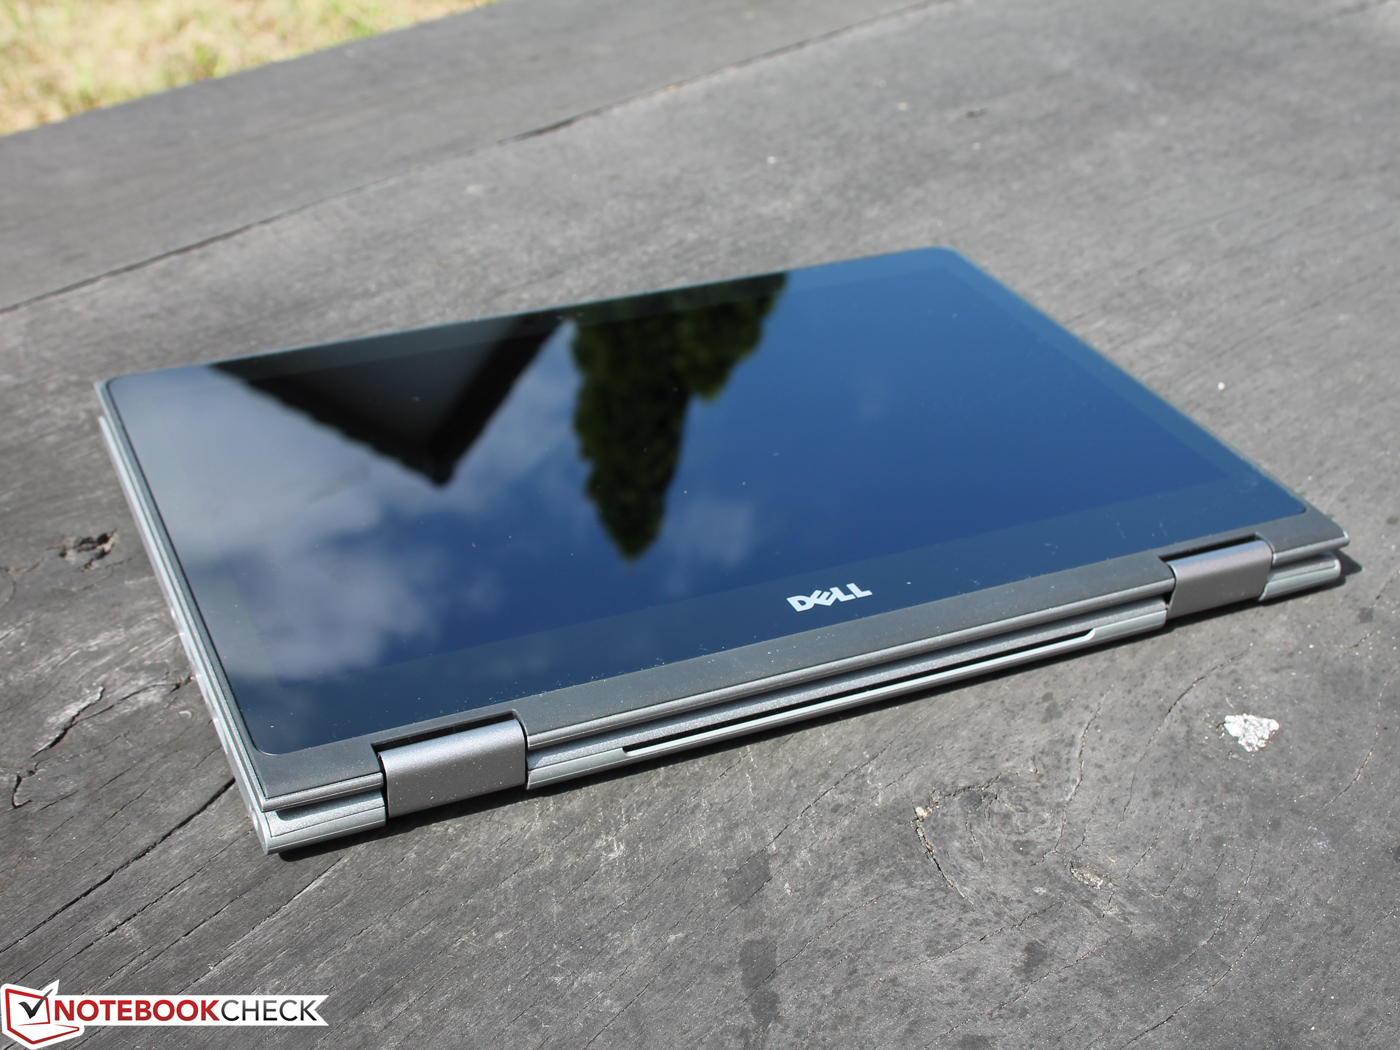
La suma de los pequeños defectos no puede compensar las ventajas de rendimiento, mantenimiento, y el decente contrasto de la pantalla. En definitiva, estamos ante un potente - en términos de cálculo - convertible todoterreno que no es demasiado caro comparado con sus rivales con un precio de 1000 Euros. Aquí, HP Spectre x360 13 y Acer Aspire R13 R7 tienen más que ofrecer, especialmente en lo referente a la construcción. El Lenovo Yoga 900-13ISK tiene un diseño aún más elegante, pero es estúpidamente caro. El Asus Zenbook UX360CA-FC060T tiene una carcasa delgada de gran calidad, pero sufre con su teclado repiqueteante.
Ésta es una versión acortada del análisis original. Puedes leer el análisis completo en inglés aquí.
Dell Inspiron 13 5368
-
08/26/2016 v5.1(old)
Sebastian Jentsch