 Deutsch
 English
 Español
 Français
 Italiano
 Nederlands
 Polski
 Português
 Русский
 Türkçe
 Svenska
 Chinese
 Magyar
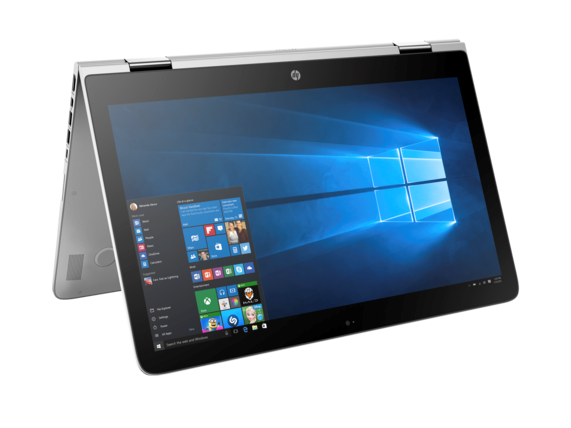
Breve análisis del Convertible HP Spectre x360 15-ap012dx
| |||||||||||||||||||||||||
iluminación: 88 %
Brillo con batería: 298 cd/m²
Contraste: 523:1 (Negro: 0.57 cd/m²)
ΔE Color 4.43 | 0.5-29.43 Ø5
ΔE Greyscale 2.45 | 0.57-98 Ø5.3
87.8% sRGB (Argyll 1.6.3 3D)
57.2% AdobeRGB 1998 (Argyll 1.6.3 3D)
63.9% AdobeRGB 1998 (Argyll 2.2.0 3D)
88.2% sRGB (Argyll 2.2.0 3D)
62.8% Display P3 (Argyll 2.2.0 3D)
Gamma: 2.45
| HP Spectre x360 15-ap012dx 15.60, 3840x2160 | HP Spectre x360 15-ap011dx 15.60, 1920x1080 | Toshiba Satellite L50-C-275 15.60, 1920x1080 | Dell XPS 15 9550 i7 FHD 15.60, 1920x1080 | HP Envy 15-w103ng x360 15.60, 1920x1080 | Lenovo Ideapad 500s-14ISK 14.00, 1920x1080 | |
|---|---|---|---|---|---|---|
| Display | -2% | -3% | 10% | -34% | -33% | |
| Display P3 Coverage | 62.8 | 64.8 3% | 64.1 2% | 68.5 9% | 39.97 -36% | 40.74 -35% |
| sRGB Coverage | 88.2 | 83.5 -5% | 82.9 -6% | 97.2 10% | 59.8 -32% | 60.6 -31% |
| AdobeRGB 1998 Coverage | 63.9 | 61 -5% | 60.6 -5% | 70.4 10% | 41.32 -35% | 42.15 -34% |
| Response Times | -16% | 26% | -87% | -7% | -7% | |
| Response Time Grey 50% / Grey 80% * | 32.8 ? | 40 ? -22% | 24 ? 27% | 64 ? -95% | 37 ? -13% | 43 ? -31% |
| Response Time Black / White * | 28 ? | 30.4 ? -9% | 21 ? 25% | 50 ? -79% | 28 ? -0% | 23 ? 18% |
| PWM Frequency | 50 ? | |||||
| Screen | -2% | 2% | 3% | -32% | -64% | |
| Brightness middle | 298 | 289.9 -3% | 294 -1% | 371.5 25% | 208 -30% | 249 -16% |
| Brightness | 295 | 275 -7% | 285 -3% | 356 21% | 205 -31% | 235 -20% |
| Brightness Distribution | 88 | 88 0% | 83 -6% | 92 5% | 80 -9% | 87 -1% |
| Black Level * | 0.57 | 0.289 49% | 0.26 54% | 0.252 56% | 0.26 54% | 0.44 23% |
| Contrast | 523 | 1003 92% | 1131 116% | 1474 182% | 800 53% | 566 8% |
| Colorchecker dE 2000 * | 4.43 | 5.24 -18% | 5.07 -14% | 5.55 -25% | 6.97 -57% | 9.47 -114% |
| Colorchecker dE 2000 max. * | 6.62 | 9.55 -44% | 9.33 -41% | 10.95 -65% | 15.41 -133% | |
| Greyscale dE 2000 * | 2.45 | 4.46 -82% | 4.25 -73% | 7.1 -190% | 7.37 -201% | 10.22 -317% |
| Gamma | 2.45 90% | 2.31 95% | 2.49 88% | 2.1 105% | 2.34 94% | 2.34 94% |
| CCT | 6326 103% | 6818 95% | 6597 99% | 6823 95% | 11451 57% | |
| Color Space (Percent of AdobeRGB 1998) | 57.2 | 54.7 -4% | 54 -6% | 63.4 11% | 38 -34% | 39 -32% |
| Color Space (Percent of sRGB) | 87.8 | 83.3 -5% | 83 -5% | 97.9 12% | 59 -33% | 57 -35% |
| Media total (Programa/Opciones) | -7% /
-4% | 8% /
4% | -25% /
-8% | -24% /
-29% | -35% /
-50% |
* ... más pequeño es mejor
Tiempos de respuesta del display
| ↔ Tiempo de respuesta de Negro a Blanco | ||
|---|---|---|
| 28 ms ... subida ↗ y bajada ↘ combinada | ↗ 4.8 ms subida | 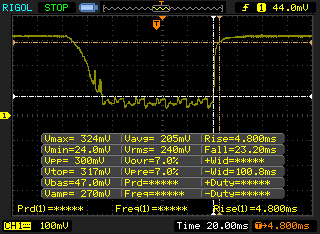 |
| ↘ 23.2 ms bajada | ||
| La pantalla mostró tiempos de respuesta relativamente lentos en nuestros tests pero podría ser demasiado lenta para los jugones. En comparación, todos los dispositivos de prueba van de ##min### (mínimo) a 240 (máximo) ms. » 67 % de todos los dispositivos son mejores. Eso quiere decir que el tiempo de respuesta es peor que la media (21.5 ms) de todos los dispositivos testados. | ||
| ↔ Tiempo de respuesta 50% Gris a 80% Gris | ||
| 32.8 ms ... subida ↗ y bajada ↘ combinada | ↗ 14.8 ms subida | 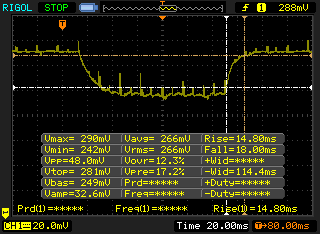 |
| ↘ 18 ms bajada | ||
| La pantalla mostró tiempos de respuesta lentos en nuestros tests y podría ser demasiado lenta para los jugones. En comparación, todos los dispositivos de prueba van de ##min### (mínimo) a 636 (máximo) ms. » 38 % de todos los dispositivos son mejores. Eso quiere decir que el tiempo de respuesta es similar al dispositivo testado medio (33.7 ms). | ||
Parpadeo de Pantalla / PWM (Pulse-Width Modulation)
| Parpadeo de Pantalla / PWM no detectado | 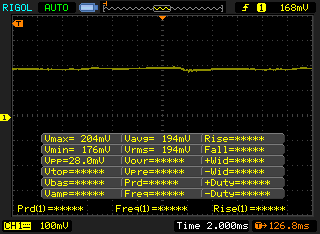 | ||
Comparación: 53 % de todos los dispositivos testados no usaron PWM para atenuar el display. Si se usó, medimos una media de 17900 (mínimo: 5 - máxmo: 3846000) Hz. | |||

| Cinebench R10 | |
| Rendering Single CPUs 64Bit (ordenar por valor) | |
| Lenovo IdeaPad Y50 | |
| Microsoft Surface Pro 4 Core i7 | |
| Lenovo ThinkPad T440s 20AQ006BGE | |
| Rendering Multiple CPUs 64Bit (ordenar por valor) | |
| Lenovo IdeaPad Y50 | |
| Microsoft Surface Pro 4 Core i7 | |
| Lenovo ThinkPad T440s 20AQ006BGE | |
| wPrime 2.10 - 1024m (ordenar por valor) | |
| HP Spectre x360 15-ap012dx | |
| Lenovo IdeaPad Y50 | |
| Microsoft Surface Pro 4 Core i7 | |
| Razer Blade Stealth UHD i7-6500U | |
| Super Pi Mod 1.5 XS 32M - 32M (ordenar por valor) | |
| HP Spectre x360 15-ap012dx | |
| Lenovo IdeaPad Y50 | |
| Microsoft Surface Pro 4 Core i7 | |
| Razer Blade Stealth UHD i7-6500U | |
* ... más pequeño es mejor
| PCMark 7 - Score (ordenar por valor) | |
| HP Spectre x360 15-ap012dx | |
| Microsoft Surface Pro 4 Core i7 | |
| Dell XPS 15 9550 i7 FHD | |
| Lenovo IdeaPad Y50-70-59441231 | |
| HP Envy 15-w000ng x360 | |
| PCMark 7 Score | 5326 puntos | |
| PCMark 8 Home Score Accelerated v2 | 2847 puntos | |
| PCMark 8 Creative Score Accelerated v2 | 3796 puntos | |
| PCMark 8 Work Score Accelerated v2 | 3576 puntos | |
ayuda | ||

| HP Spectre x360 15-ap012dx HD Graphics 520, 6200U, Sandisk X300 SD7SN6S-256G-1006 | HP Spectre x360 15-ap011dx HD Graphics 520, 6200U, Liteon L8H-256V2G | Toshiba Satellite L50-C-275 GeForce 930M, 6200U, Samsung SSD PM871 MZNLN256HCHP | Dell XPS 15 9550 i7 FHD GeForce GTX 960M, 6700HQ, Samsung PM951 NVMe 512 GB | HP Envy 15-w103ng x360 GeForce 930M, 6200U, Samsung SSD PM851 256 GB MZNTE256HMHP | Lenovo Ideapad 500s-14ISK GeForce 940M, 6500U, Samsung PM871 MZYLN256HCHP | |
|---|---|---|---|---|---|---|
| AS SSD | 1% | 6% | 134% | -3% | 8% | |
| Copy Game MB/s | 307.7 | 208.1 -32% | 178.3 -42% | 805 162% | 196.1 -36% | 197.6 -36% |
| Copy Program MB/s | 215.3 | 185.6 -14% | 105.3 -51% | 325.3 51% | 137.9 -36% | 168.7 -22% |
| Copy ISO MB/s | 403.4 | 224.2 -44% | 244.1 -39% | 1127 179% | 436.8 8% | 236 -41% |
| Score Total | 850 | 882 4% | 1080 27% | 2410 184% | 950 12% | 1032 21% |
| Score Write | 250 | 353 41% | 381 52% | 675 170% | 303 21% | 336 34% |
| Score Read | 397 | 352 -11% | 463 17% | 1180 197% | 432 9% | 460 16% |
| Access Time Write * | 0.057 | 0.05 12% | 0.041 28% | 0.035 39% | 0.044 23% | 0.041 28% |
| Access Time Read * | 0.08 | 0.067 16% | 0.102 -28% | 0.038 52% | 0.131 -64% | 0.067 16% |
| 4K-64 Write | 143.8 | 252.9 76% | 271.8 89% | 513 257% | 201.8 40% | 223 55% |
| 4K-64 Read | 318 | 274.8 -14% | 380.8 20% | 990 211% | 356.5 12% | 376.6 18% |
| 4K Write | 78.3 | 74.1 -5% | 81.8 4% | 105.4 35% | 78.3 0% | 82.8 6% |
| 4K Read | 31.04 | 26 -16% | 32.34 4% | 31.86 3% | 25.25 -19% | 33.12 7% |
| Seq Write | 278.1 | 263.2 -5% | 273.9 -2% | 570 105% | 226.4 -19% | 298.7 7% |
| Seq Read | 475.3 | 513 8% | 498 5% | 1579 232% | 507 7% | 500 5% |
* ... más pequeño es mejor
| 3DMark 11 | |
| 1280x720 Performance (ordenar por valor) | |
| HP Spectre x360 15-ap012dx | |
| Microsoft Surface Pro 4 Core i7 | |
| Razer Blade Stealth UHD i7-6500U | |
| Lenovo IdeaPad 100-15IBD | |
| Dell Vostro 3546 JAN15HSW1601_1K9_Win | |
| 1280x720 Performance GPU (ordenar por valor) | |
| HP Spectre x360 15-ap012dx | |
| Microsoft Surface Pro 4 Core i7 | |
| Razer Blade Stealth UHD i7-6500U | |
| Lenovo IdeaPad 100-15IBD | |
| Dell Vostro 3546 JAN15HSW1601_1K9_Win | |
| 3DMark 11 Performance | 1565 puntos | |
| 3DMark Ice Storm Standard Score | 41767 puntos | |
| 3DMark Cloud Gate Standard Score | 5217 puntos | |
| 3DMark Fire Strike Score | 825 puntos | |
| 3DMark Fire Strike Extreme Score | 373 puntos | |
ayuda | ||
| HP Spectre x360 15-ap012dx HD Graphics 520, 6200U, Sandisk X300 SD7SN6S-256G-1006 | Toshiba Satellite L50-C-275 GeForce 930M, 6200U, Samsung SSD PM871 MZNLN256HCHP | HP Envy 15-w103ng x360 GeForce 930M, 6200U, Samsung SSD PM851 256 GB MZNTE256HMHP | Dell XPS 15 9550 i7 FHD GeForce GTX 960M, 6700HQ, Samsung PM951 NVMe 512 GB | Lenovo IdeaPad Y50-70-59441231 GeForce GTX 960M, 4710HQ, Samsung SSD PM851 512 GB MZ7TE512HMHP | Lenovo Yoga 500-14ISK GeForce 920M, 6200U, WDC Slim WD10SPCX-24HWST1 | |
|---|---|---|---|---|---|---|
| Noise | 2% | -10% | -4% | -14% | -8% | |
| off / environment * | 29.5 | 22 25% | 31.3 -6% | |||
| Idle Minimum * | 29.5 | 31.3 -6% | 32.9 -12% | 29.2 1% | 29.6 -0% | 32.8 -11% |
| Idle Average * | 29.5 | 31.3 -6% | 32.9 -12% | 29.3 1% | 31.1 -5% | 32.8 -11% |
| Idle Maximum * | 29.6 | 32.2 -9% | 32.9 -11% | 29.5 -0% | 34.3 -16% | 32.8 -11% |
| Load Average * | 38.1 | 36.4 4% | 37 3% | 36.5 4% | 45 -18% | 39.4 -3% |
| Load Maximum * | 38.2 | 36.6 4% | 46 -20% | 47.7 -25% | 49.2 -29% | 39.2 -3% |
* ... más pequeño es mejor
Ruido
| Ocioso |
| 29.5 / 29.5 / 29.6 dB(A) |
| Carga |
| 38.1 / 38.2 dB(A) |
 | ||
30 dB silencioso 40 dB(A) audible 50 dB(A) ruidosamente alto |
||
min: | ||
(+) The maximum temperature on the upper side is 39.9 °C / 104 F, compared to the average of 35.3 °C / 96 F, ranging from 19.6 to 55.7 °C for the class Convertible.
(±) The bottom heats up to a maximum of 41 °C / 106 F, compared to the average of 36.8 °C / 98 F
(+) In idle usage, the average temperature for the upper side is 24.1 °C / 75 F, compared to the device average of 30.2 °C / 86 F.
(+) The palmrests and touchpad are reaching skin temperature as a maximum (34.2 °C / 93.6 F) and are therefore not hot.
(-) The average temperature of the palmrest area of similar devices was 28.1 °C / 82.6 F (-6.1 °C / -11 F).
| HP Spectre x360 15-ap012dx HD Graphics 520, 6200U, Sandisk X300 SD7SN6S-256G-1006 | HP Spectre x360 15-ap011dx HD Graphics 520, 6200U, Liteon L8H-256V2G | Toshiba Satellite L50-C-275 GeForce 930M, 6200U, Samsung SSD PM871 MZNLN256HCHP | HP Envy 15-w103ng x360 GeForce 930M, 6200U, Samsung SSD PM851 256 GB MZNTE256HMHP | Lenovo IdeaPad Y50-70-59441229 GeForce GTX 960M, 4710HQ, Samsung SSD PM851 256 GB MZ7TE256HMHP | Dell XPS 15-9550 i7 GeForce GTX 960M, 6700HQ, Samsung PM951 NVMe 512 GB | |
|---|---|---|---|---|---|---|
| Power Consumption | 14% | 8% | 17% | -62% | -120% | |
| Idle Minimum * | 6.5 | 5.8 11% | 4.7 28% | 4.15 36% | 4.3 34% | 12.5 -92% |
| Idle Average * | 13.3 | 9.9 26% | 9.9 26% | 8.2 38% | 7.8 41% | 19.6 -47% |
| Idle Maximum * | 15.1 | 11.1 26% | 10.1 33% | 8.2 46% | 10.6 30% | 22.8 -51% |
| Load Average * | 30.8 | 30.6 1% | 36 -17% | 34.6 -12% | 99.7 -224% | 102 -231% |
| Load Maximum * | 38.5 | 36.2 6% | 51 -32% | 48 -25% | 112.3 -192% | 107 -178% |
* ... más pequeño es mejor
| Off / Standby | |
| Ocioso | |
| Carga |
|
| HP Spectre x360 15-ap012dx 65 Wh | HP Spectre x360 15-ap011dx 65 Wh | Toshiba Satellite L50-C-275 45 Wh | Dell XPS 15 9550 i7 FHD 84 Wh | HP Envy 15-w103ng x360 48 Wh | Lenovo IdeaPad Y50-70-59441229 56 Wh | |
|---|---|---|---|---|---|---|
| Duración de Batería | 25% | -20% | 20% | -8% | -41% | |
| Reader / Idle | 705 | 823 17% | 979 39% | |||
| WiFi v1.3 | 431 | 537 25% | 345 -20% | 544 26% | 398 -8% | 254 -41% |
| Load | 113 | 149 32% | 106 -6% |
Pro
Contra
¿Deberías comprar el modelo 4K UHD más caro en vez del FHD más barato? las ventajas son obvias, incluyendo textos e imágenes más nítidos para una multitarea potencialmente mejor. También quedamos aliviados al no encontrar reducciones importantes en brillo debido a la mayor densidad de pixel.
Si bien el cambio a una matriz RGBW ha resultado en colores ligeramente más precisos antes del calibrado, el contraste ha sufrido y la escala de grises es peor que la del modelo FHD. La gestión de batería se ha llevado un buen golpe aguantando hasta dos horas en uso WLAN. Sólo podemos asumir que el modelo de mayor calidad con los Core i7-6560U e Iris Graphics 540 más potentes reducirán aún más el aguante de la batería. Con todo, siete horas de uso realista está muy bien para un sistema de 15.6".
El pequeño puñado de defectos no son lo bastante importantes para disuadir a compradores potenciales. Deberían, empero, hacerse más claros para los usuarios ya que los fabricantes no siempre expresan claramente especificaciones como brillo de retroiluminación, contraste o precisión del color en cada opción de display. Esto es válido para todos los fabricantes, no sólo HP, ya que hemos registrado diferentes niveles de brillo, contraste y cobertura entre los modelos XPS 13, los Zenbook UX303, y otros debido a diferencias de resolución.
El Spectre x360 15 4K UHD ofrece una pantalla táctil aún más espléndida de lo esperado. El aguante de la batería y el contraste se llevan golpes serios, pero por lo demás es uno de los mejores convertibles de 15" que hay ahora.
Ésta es una versión acortada del análisis original. Puedes leer el análisis completo en inglés aquí.
HP Spectre x360 15-ap012dx
-
02/27/2017 v6(old)
Allen Ngo
Pricecompare
