 Deutsch
 English
 Español
 Français
 Italiano
 Nederlands
 Polski
 Português
 Русский
 Türkçe
 Svenska
 Chinese
 Magyar
Breve análisis del Dell Inspiron 17 5759-5118
| |||||||||||||||||||||||||
iluminación: 84 %
Brillo con batería: 304 cd/m²
Contraste: 822:1 (Negro: 0.37 cd/m²)
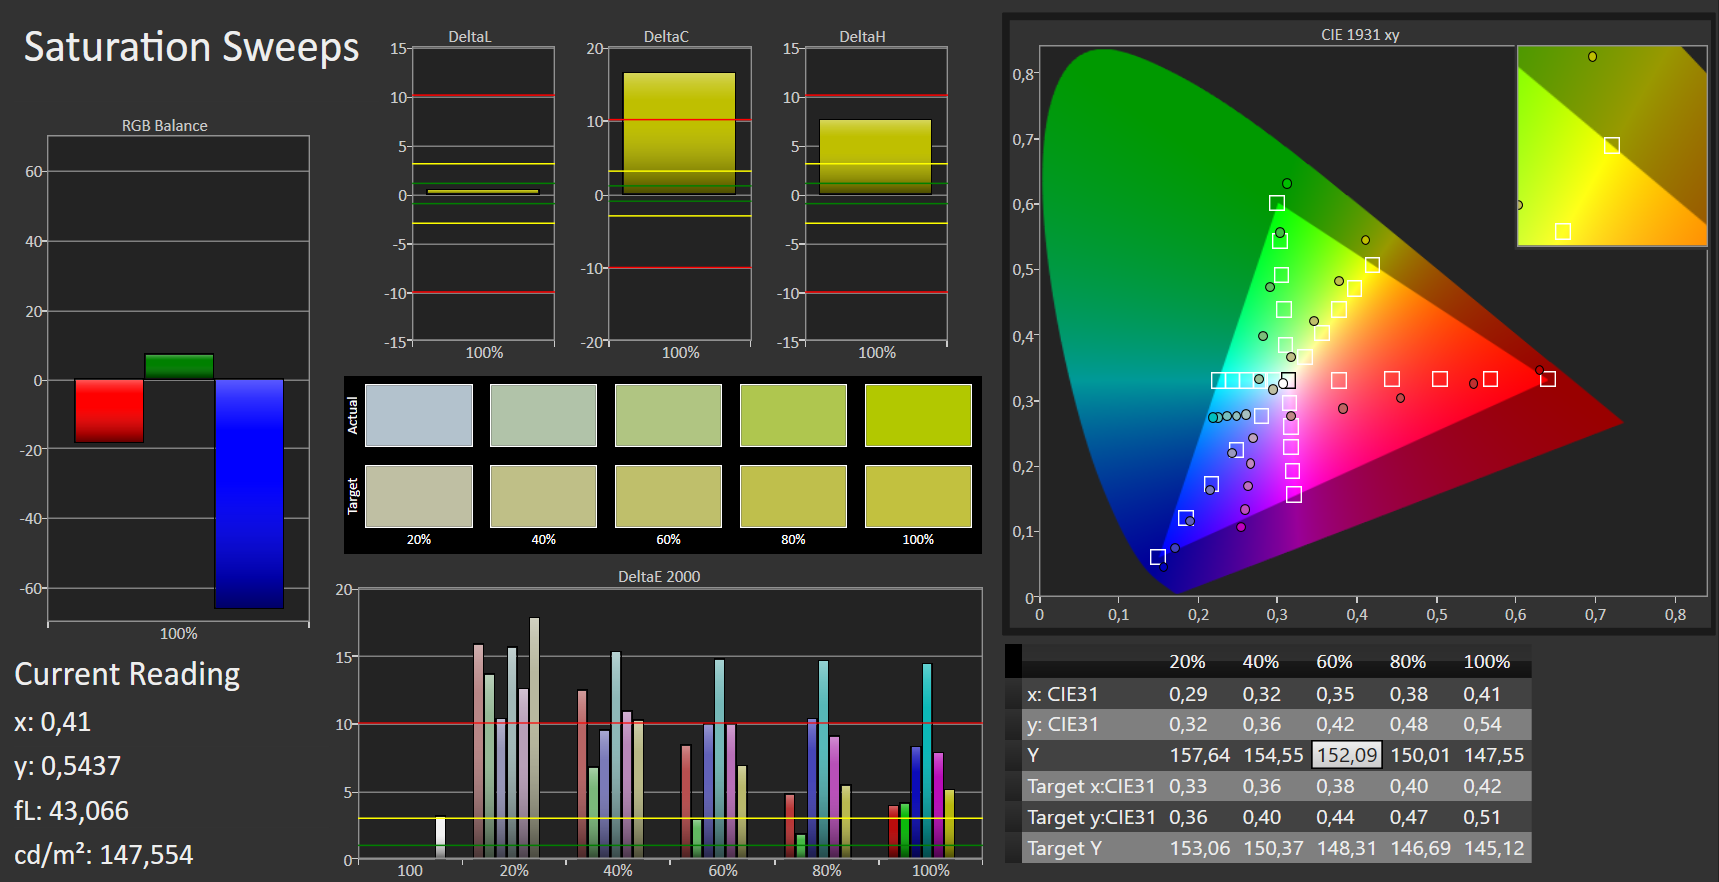
ΔE Color 10.62 | 0.5-29.43 Ø5
ΔE Greyscale 11.78 | 0.57-98 Ø5.3
90% sRGB (Argyll 1.6.3 3D)
59% AdobeRGB 1998 (Argyll 1.6.3 3D)
66.3% AdobeRGB 1998 (Argyll 2.2.0 3D)
90.6% sRGB (Argyll 2.2.0 3D)
69.3% Display P3 (Argyll 2.2.0 3D)
Gamma: 2.39
Parpadeo de Pantalla / PWM (Pulse-Width Modulation)
| Parpadeo de Pantalla / PWM detectado | 200 Hz | ≤ 90 % de brillo |
La retroiluminación del display parpadea a 200 Hz (seguramente usa PWM - Pulse-Width Modulation) a un brillo del 90 % e inferior. Sobre este nivel de brillo no debería darse parpadeo / PWM. La frecuencia de 200 Hz es relativamente baja, por lo que la gente sensible debería ver parpadeos y padecer fatiga visual por la pantalla (usado al brillo indicado a continuación). Comparación: 53 % de todos los dispositivos testados no usaron PWM para atenuar el display. Si se usó, medimos una media de 17942 (mínimo: 5 - máxmo: 3846000) Hz. | ||


Tiempos de respuesta del display
| ↔ Tiempo de respuesta de Negro a Blanco | ||
|---|---|---|
| 24 ms ... subida ↗ y bajada ↘ combinada | ↗ 7 ms subida | 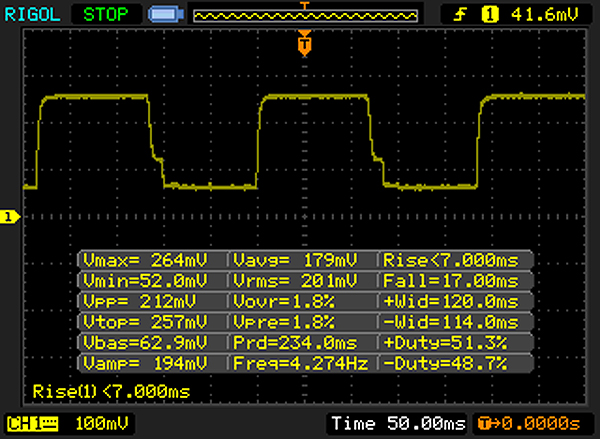 |
| ↘ 17 ms bajada | ||
| La pantalla mostró buenos tiempos de respuesta en nuestros tests pero podría ser demasiado lenta para los jugones competitivos. En comparación, todos los dispositivos de prueba van de ##min### (mínimo) a 240 (máximo) ms. » 48 % de todos los dispositivos son mejores. Eso quiere decir que el tiempo de respuesta es peor que la media (21.5 ms) de todos los dispositivos testados. | ||
| ↔ Tiempo de respuesta 50% Gris a 80% Gris | ||
| 86 ms ... subida ↗ y bajada ↘ combinada | ↗ 44 ms subida |  |
| ↘ 42 ms bajada | ||
| La pantalla mostró tiempos de respuesta lentos en nuestros tests y podría ser demasiado lenta para los jugones. En comparación, todos los dispositivos de prueba van de ##min### (mínimo) a 636 (máximo) ms. » 99 % de todos los dispositivos son mejores. Eso quiere decir que el tiempo de respuesta es peor que la media (33.8 ms) de todos los dispositivos testados. | ||
| Dell Inspiron 17 5759-5118 TN LED, 1920x1080 | Dell Inspiron 17-5758 IPS, 1920x1080 | HP ProBook 470 G3 UWVA TN LED, 1920x1080 | Acer TravelMate P277-MG-7474 TN LED, 1920x1080 | Lenovo B70-80 80MR0006GE TN, 1600x900 | HP Pavilion 17-g054ng TN-Panel, 1920x1080 | Acer Aspire E5-772G-70VP TN LED, 1920x1080 | |
|---|---|---|---|---|---|---|---|
| Display | 3% | -1% | 2% | -16% | 1% | 1% | |
| Display P3 Coverage | 69.3 | 69.6 0% | 65.1 -6% | 69.9 1% | 54 -22% | 66.1 -5% | 69.4 0% |
| sRGB Coverage | 90.6 | 94.3 4% | 92 2% | 92.1 2% | 81 -11% | 96.1 6% | 91.9 1% |
| AdobeRGB 1998 Coverage | 66.3 | 69 4% | 66.5 0% | 67.3 2% | 55.5 -16% | 68.1 3% | 67.3 2% |
| Response Times | 30% | 1% | |||||
| Response Time Grey 50% / Grey 80% * | 86 ? | 35 ? 59% | 27 ? 69% | ||||
| Response Time Black / White * | 24 ? | 24 ? -0% | 28 ? -17% | ||||
| PWM Frequency | 200 ? | 100 -50% | |||||
| Screen | -1% | 20% | 3% | -19% | 17% | -12% | |
| Brightness middle | 304 | 276 -9% | 314 3% | 336 11% | 252 -17% | 294 -3% | 243 -20% |
| Brightness | 292 | 258 -12% | 291 0% | 319 9% | 236 -19% | 270 -8% | 284 -3% |
| Brightness Distribution | 84 | 87 4% | 88 5% | 84 0% | 90 7% | 86 2% | 79 -6% |
| Black Level * | 0.37 | 0.38 -3% | 0.32 14% | 0.43 -16% | 0.51 -38% | 0.31 16% | 0.45 -22% |
| Contrast | 822 | 726 -12% | 981 19% | 781 -5% | 494 -40% | 948 15% | 540 -34% |
| Colorchecker dE 2000 * | 10.62 | 9.38 12% | 3.43 68% | 9.26 13% | 12.66 -19% | 3.72 65% | 12.04 -13% |
| Greyscale dE 2000 * | 11.78 | 11.81 -0% | 3.72 68% | 10.09 14% | 13.37 -13% | 5.23 56% | 13.25 -12% |
| Gamma | 2.39 92% | 2.03 108% | 2.39 92% | 2.57 86% | 1.93 114% | 2.4 92% | 2.6 85% |
| CCT | 12997 50% | 8966 72% | 6764 96% | 12421 52% | 6491 100% | 7270 89% | 14950 43% |
| Color Space (Percent of AdobeRGB 1998) | 59 | 61 3% | 59.8 1% | 60 2% | 52 -12% | 61.9 5% | 60 2% |
| Color Space (Percent of sRGB) | 90 | 94 4% | 92 2% | 92 2% | 76 -16% | 95.9 7% | 92 2% |
| Media total (Programa/Opciones) | 1% /
-0% | 16% /
17% | 2% /
2% | -18% /
-18% | 9% /
13% | -6% /
-9% |
* ... más pequeño es mejor


| Geekbench 3 | |
| 32 Bit Single-Core Score (ordenar por valor) | |
| Dell Inspiron 17 5759-5118 | |
| HP ProBook 470 G3 | |
| HP Pavilion 17-g054ng | |
| Asus F751LB-T4030H | |
| HP Pavilion 17-f217ng | |
| 32 Bit Multi-Core Score (ordenar por valor) | |
| Dell Inspiron 17 5759-5118 | |
| HP ProBook 470 G3 | |
| HP Pavilion 17-g054ng | |
| Asus F751LB-T4030H | |
| HP Pavilion 17-f217ng | |
| JetStream 1.1 - Total Score (ordenar por valor) | |
| Dell Inspiron 17 5759-5118 | |
| HP ProBook 470 G3 | |
| Peacekeeper - --- (ordenar por valor) | |
| Dell Inspiron 17 5759-5118 | |
| HP ProBook 470 G3 | |
| HP Pavilion 17-g054ng | |
| Asus F751LB-T4030H | |
| HP Pavilion 17-f217ng | |
* ... más pequeño es mejor
| PCMark 7 Score | 2843 puntos | |
| PCMark 8 Home Score Accelerated v2 | 3232 puntos | |
| PCMark 8 Creative Score Accelerated v2 | 3873 puntos | |
| PCMark 8 Work Score Accelerated v2 | 4234 puntos | |
ayuda | ||

| 3DMark 05 Standard | 10717 puntos | |
| 3DMark 06 Standard Score | 5921 puntos | |
| 3DMark Vantage P Result | 4772 puntos | |
| 3DMark 11 Performance | 1889 puntos | |
| 3DMark Ice Storm Standard Score | 40597 puntos | |
| 3DMark Cloud Gate Standard Score | 4167 puntos | |
| 3DMark Fire Strike Score | 824 puntos | |
| 3DMark Fire Strike Extreme Score | 411 puntos | |
ayuda | ||
| 3DMark 06 - 1280x1024 Standard Score AA:0x AF:0x (ordenar por valor) | |
| Dell Inspiron 17 5759-5118 | |
| HP ProBook 470 G3 | |
| HP Pavilion 17-g054ng | |
| Asus Asuspro Essential P751JF-T2007G | |
| bajo | medio | alto | ultra | |
| Diablo III (2012) | 66.7 | 41.8 | 32.4 | 20.4 |
| Counter-Strike: GO (2012) | 108.7 | 68.1 | 48.3 | 26.4 |
| Tomb Raider (2013) | 57.8 | 29.1 | 22.3 | 11.6 |
| BioShock Infinite (2013) | 44.9 | 25.6 | 21.4 | 7.8 |
| Thief (2014) | 20 | 12.8 | 10.4 | 5.2 |
| Wolfenstein: The New Order (2014) | 33.9 | 30.2 | 12.4 | |
| GRID: Autosport (2014) | 132 | 46.1 | 21.6 | 12.6 |
| Sims 4 (2014) | 145.9 | 41.8 | 17.7 | 14.7 |
| Middle-earth: Shadow of Mordor (2014) | 21.5 | 14.5 | 8.1 | 6.3 |
| Alien: Isolation (2014) | 31.6 | 22.1 | 12.1 | 8.3 |
| F1 2014 (2014) | 83 | 56 | 31 | 12.5 |
| Dragon Age: Inquisition (2014) | 34.1 | 22.1 | 7.3 | 4.9 |
| Evolve (2015) | 22.2 | 14.5 | 8.5 | 5.2 |
| Battlefield Hardline (2015) | 47.6 | 33.2 | 10.2 | 6.3 |
| Dirt Rally (2015) | 114.2 | 29.4 | 15.6 | 12.5 |
| The Witcher 3 (2015) | 17.2 | 11.3 | 6.4 | 2.9 |
| Batman: Arkham Knight (2015) | 17 | 14 | 7 | 3 |
| Metal Gear Solid V (2015) | 40.2 | 26.4 | 9.9 | 7.1 |
| World of Warships (2015) | 49.6 | 34.6 | 17.5 | 12.3 |
| FIFA 16 (2015) | 58.3 | 39.7 | 18.4 | |
| Anno 2205 (2015) | 28.9 | 15.8 | 6.8 | 3.1 |
| Call of Duty: Black Ops 3 (2015) | 34.8 | 19.8 | 9.6 | 6.1 |
| Star Wars Battlefront (2015) | 33.7 | 20.6 | 9.3 | 6.1 |
| Rainbow Six Siege (2015) | 39.4 | 24.8 | 12.4 | 9.9 |
| Just Cause 3 (2015) | 23.1 | 19 | 9.2 | 6.3 |
| Tomb Raider | |
| 1024x768 Low Preset (ordenar por valor) | |
| Dell Inspiron 17 5759-5118 | |
| HP ProBook 470 G3 | |
| Acer Aspire E17 E5-752G-T7WY | |
| Lenovo B70-80 80MR0006GE | |
| HP Pavilion 17-g054ng | |
| Asus F751LB-T4030H | |
| HP Pavilion 17-f217ng | |
| HP ProBook 430 G3 P5T00ES | |
| HP ProBook 430 G3 P5T00ES | |
| 1366x768 Normal Preset AA:FX AF:4x (ordenar por valor) | |
| Dell Inspiron 17 5759-5118 | |
| HP ProBook 470 G3 | |
| Lenovo B70-80 80MR0006GE | |
| HP Pavilion 17-g054ng | |
| Asus Asuspro Essential P751JF-T2007G | |
| Asus F751LB-T4030H | |
| HP Pavilion 17-f217ng | |
| HP ProBook 430 G3 P5T00ES | |
| HP ProBook 430 G3 P5T00ES | |
| Wolfenstein: The New Order - 1280x720 Low Preset (ordenar por valor) | |
| Dell Inspiron 17 5759-5118 | |
| Dell Inspiron 17-5758 | |
| Asus F751LB-T4030H | |
| GRID: Autosport | |
| 1024x768 Ultra Low Preset (ordenar por valor) | |
| Dell Inspiron 17 5759-5118 | |
| HP ProBook 470 G3 | |
| Lenovo B70-80 80MR0006GE | |
| HP Pavilion 17-g054ng | |
| HP ProBook 430 G3 P5T00ES | |
| HP ProBook 430 G3 P5T00ES | |
| 1366x768 Medium Preset (ordenar por valor) | |
| Dell Inspiron 17 5759-5118 | |
| HP ProBook 470 G3 | |
| Lenovo B70-80 80MR0006GE | |
| HP Pavilion 17-g054ng | |
| Acer Aspire E5-772G-70VP | |
| Asus Asuspro Essential P751JF-T2007G | |
| HP ProBook 430 G3 P5T00ES | |
| HP ProBook 430 G3 P5T00ES | |
| Dirt Rally | |
| 1024x768 Ultra Low Preset (ordenar por valor) | |
| Dell Inspiron 17 5759-5118 | |
| Dell Inspiron 17-5758 | |
| HP ProBook 470 G3 | |
| Acer TravelMate P277-MG-7474 | |
| HP Pavilion 17-g054ng | |
| Asus F751LB-T4030H | |
| HP ProBook 430 G3 P5T00ES | |
| HP ProBook 430 G3 P5T00ES | |
| 1366x768 Medium Preset (ordenar por valor) | |
| Dell Inspiron 17 5759-5118 | |
| Dell Inspiron 17-5758 | |
| HP ProBook 470 G3 | |
| Acer TravelMate P277-MG-7474 | |
| HP Pavilion 17-g054ng | |
| Asus Asuspro Essential P751JF-T2007G | |
| Asus F751LB-T4030H | |
| HP ProBook 430 G3 P5T00ES | |
| HP ProBook 430 G3 P5T00ES | |
| Diablo III | |
| 1366x768 Medium / low (ordenar por valor) | |
| Dell Inspiron 17 5759-5118 | |
| Dell Inspiron 17-5758 | |
| HP ProBook 470 G3 | |
| HP Pavilion 17-g054ng | |
| HP Pavilion 17-f217ng | |
| HP ProBook 430 G3 P5T00ES | |
| HP ProBook 430 G3 P5T00ES | |
| 1366x768 High AA:on (ordenar por valor) | |
| Dell Inspiron 17 5759-5118 | |
| Dell Inspiron 17-5758 | |
| HP ProBook 470 G3 | |
| HP Pavilion 17-g054ng | |
| HP Pavilion 17-f217ng | |
| HP ProBook 430 G3 P5T00ES | |
| HP ProBook 430 G3 P5T00ES | |
| Sims 4 - 1366x768 Medium Preset (ordenar por valor) | |
| Dell Inspiron 17 5759-5118 | |
| Dell Inspiron 17-5758 | |
| HP ProBook 470 G3 | |
| Lenovo B70-80 80MR0006GE | |
| HP Pavilion 17-g054ng | |
| HP ProBook 430 G3 P5T00ES | |
| HP ProBook 430 G3 P5T00ES | |
| Battlefield Hardline - 1024x768 Low Graphics Quality (DX11) (ordenar por valor) | |
| Dell Inspiron 17 5759-5118 | |
| Dell Inspiron 17-5758 | |
| HP ProBook 470 G3 | |
| HP Pavilion 17-g054ng | |
| Asus Asuspro Essential P751JF-T2007G | |
| Asus F751LB-T4030H | |
| HP Pavilion 17-f217ng | |
| HP ProBook 430 G3 P5T00ES | |
| HP ProBook 430 G3 P5T00ES | |
| Star Wars Battlefront - 1024x768 Low Preset (ordenar por valor) | |
| Dell Inspiron 17 5759-5118 | |
| HP ProBook 470 G3 | |
| FIFA 16 | |
| 1280x720 Low Preset (ordenar por valor) | |
| Dell Inspiron 17 5759-5118 | |
| HP ProBook 470 G3 | |
| HP ProBook 430 G3 P5T00ES | |
| HP ProBook 430 G3 P5T00ES | |
| 1366x768 High Preset AA:2x MS (ordenar por valor) | |
| Dell Inspiron 17 5759-5118 | |
| HP ProBook 470 G3 | |
| HP ProBook 430 G3 P5T00ES | |
| HP ProBook 430 G3 P5T00ES | |
| World of Warships | |
| 1366x768 Low Preset AF:Trilinear (ordenar por valor) | |
| Dell Inspiron 17 5759-5118 | |
| HP ProBook 470 G3 | |
| HP ProBook 430 G3 P5T00ES | |
| HP ProBook 430 G3 P5T00ES | |
| 1366x768 Medium Preset AF:Trilinear (ordenar por valor) | |
| Dell Inspiron 17 5759-5118 | |
| HP ProBook 470 G3 | |
| HP ProBook 430 G3 P5T00ES | |
| HP ProBook 430 G3 P5T00ES | |
Ruido
| Ocioso |
| 33.9 / 33.9 / 33.9 dB(A) |
| HDD |
| 33.9 dB(A) |
| DVD |
| 37.1 / dB(A) |
| Carga |
| 43.8 / 44.2 dB(A) |
 | ||
30 dB silencioso 40 dB(A) audible 50 dB(A) ruidosamente alto |
||
min: | ||
| Dell Inspiron 17 5759-5118 6200U, Radeon R5 M335 | Dell Inspiron 17-5758 5500U, GeForce 920M | HP ProBook 470 G3 6500U, Radeon R7 M340 | Acer TravelMate P277-MG-7474 5500U, GeForce 940M | Lenovo B70-80 80MR0006GE 5200U, GeForce 920M | HP Pavilion 17-g054ng A10-8700P, Radeon R8 M365DX | Acer Aspire E5-772G-70VP 5500U, GeForce 940M | |
|---|---|---|---|---|---|---|---|
| Noise | 2% | 14% | 1% | 6% | 8% | 5% | |
| Idle Minimum * | 33.9 | 31.6 7% | 30 12% | 33.5 1% | 33 3% | 30.8 9% | 32 6% |
| Idle Average * | 33.9 | 31.6 7% | 30 12% | 33.5 1% | 33.5 1% | 30.8 9% | 32.3 5% |
| Idle Maximum * | 33.9 | 32.9 3% | 30 12% | 33.6 1% | 34.1 -1% | 31.2 8% | 32.6 4% |
| Load Average * | 43.8 | 45.4 -4% | 35.1 20% | 43.3 1% | 35.8 18% | 37.8 14% | 41.2 6% |
| Load Maximum * | 44.2 | 45.6 -3% | 38.9 12% | 43.6 1% | 40.7 8% | 43.4 2% | 41.6 6% |
* ... más pequeño es mejor
(+) The maximum temperature on the upper side is 38.7 °C / 102 F, compared to the average of 36.9 °C / 98 F, ranging from 21.1 to 71 °C for the class Multimedia.
(-) The bottom heats up to a maximum of 46.6 °C / 116 F, compared to the average of 39.1 °C / 102 F
(+) In idle usage, the average temperature for the upper side is 24.2 °C / 76 F, compared to the device average of 31.2 °C / 88 F.
(+) The palmrests and touchpad are cooler than skin temperature with a maximum of 31.9 °C / 89.4 F and are therefore cool to the touch.
(-) The average temperature of the palmrest area of similar devices was 28.8 °C / 83.8 F (-3.1 °C / -5.6 F).
| Dell Inspiron 17 5759-5118 6200U, Radeon R5 M335 | Dell Inspiron 17-5758 5500U, GeForce 920M | HP ProBook 470 G3 6500U, Radeon R7 M340 | Acer TravelMate P277-MG-7474 5500U, GeForce 940M | Lenovo B70-80 80MR0006GE 5200U, GeForce 920M | HP Pavilion 17-g054ng A10-8700P, Radeon R8 M365DX | Acer Aspire E5-772G-70VP 5500U, GeForce 940M | |
|---|---|---|---|---|---|---|---|
| Heat | -21% | -17% | 2% | -6% | -1% | -20% | |
| Maximum Upper Side * | 38.7 | 54.1 -40% | 43 -11% | 36.2 6% | 40.2 -4% | 38.2 1% | 46.9 -21% |
| Maximum Bottom * | 46.6 | 43 8% | 45.8 2% | 47.4 -2% | 41.7 11% | 34.2 27% | 54.7 -17% |
| Idle Upper Side * | 25.2 | 33.3 -32% | 32.5 -29% | 25.7 -2% | 30.8 -22% | 30.8 -22% | 32.6 -29% |
| Idle Bottom * | 27.9 | 32.8 -18% | 35.6 -28% | 26.1 6% | 30.4 -9% | 30.5 -9% | 31.3 -12% |
* ... más pequeño es mejor
| Off / Standby | |
| Ocioso | |
| Carga |
|
| Dell Inspiron 17 5759-5118 6200U, Radeon R5 M335 | Dell Inspiron 17-5758 5500U, GeForce 920M | HP ProBook 470 G3 6500U, Radeon R7 M340 | Acer TravelMate P277-MG-7474 5500U, GeForce 940M | Lenovo B70-80 80MR0006GE 5200U, GeForce 920M | HP Pavilion 17-g054ng A10-8700P, Radeon R8 M365DX | Acer Aspire E5-772G-70VP 5500U, GeForce 940M | |
|---|---|---|---|---|---|---|---|
| Power Consumption | 19% | -7% | -16% | 23% | -3% | -21% | |
| Idle Minimum * | 6.2 | 4 35% | 5.7 8% | 5.4 13% | 4.4 29% | 4.1 34% | 6 3% |
| Idle Average * | 11.6 | 9.2 21% | 11.3 3% | 12.6 -9% | 7.7 34% | 9.6 17% | 12.2 -5% |
| Idle Maximum * | 12.3 | 9.4 24% | 12.2 1% | 14.3 -16% | 7.9 36% | 11 11% | 14.5 -18% |
| Load Average * | 36 | 40.4 -12% | 44.8 -24% | 52.1 -45% | 33.6 7% | 57.6 -60% | 54 -50% |
| Load Maximum * | 55 | 40.8 26% | 66.3 -21% | 67.5 -23% | 49.8 9% | 65.7 -19% | 73.7 -34% |
* ... más pequeño es mejor
| Dell Inspiron 17 5759-5118 40 Wh | Dell Inspiron 17-5758 40 Wh | HP ProBook 470 G3 44 Wh | Acer TravelMate P277-MG-7474 37 Wh | Lenovo B70-80 80MR0006GE 41 Wh | HP Pavilion 17-g054ng 41 Wh | Acer Aspire E5-772G-70VP 37 Wh | |
|---|---|---|---|---|---|---|---|
| Duración de Batería | 3% | -2% | -15% | 9% | -21% | -11% | |
| Reader / Idle | 578 | 448 -22% | 490 -15% | 482 -17% | 437 -24% | 473 -18% | 454 -21% |
| H.264 | 265 | 270 2% | 228 -14% | ||||
| WiFi v1.3 | 301 | 243 -19% | 277 -8% | 247 -18% | 335 11% | 216 -28% | 259 -14% |
| Load | 71 | 107 51% | 81 14% | 64 -10% | 100 41% | 53 -25% | 72 1% |
Pro
Contra
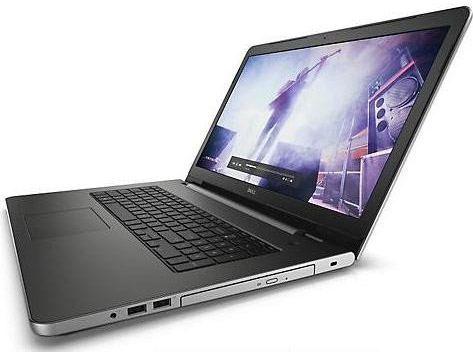
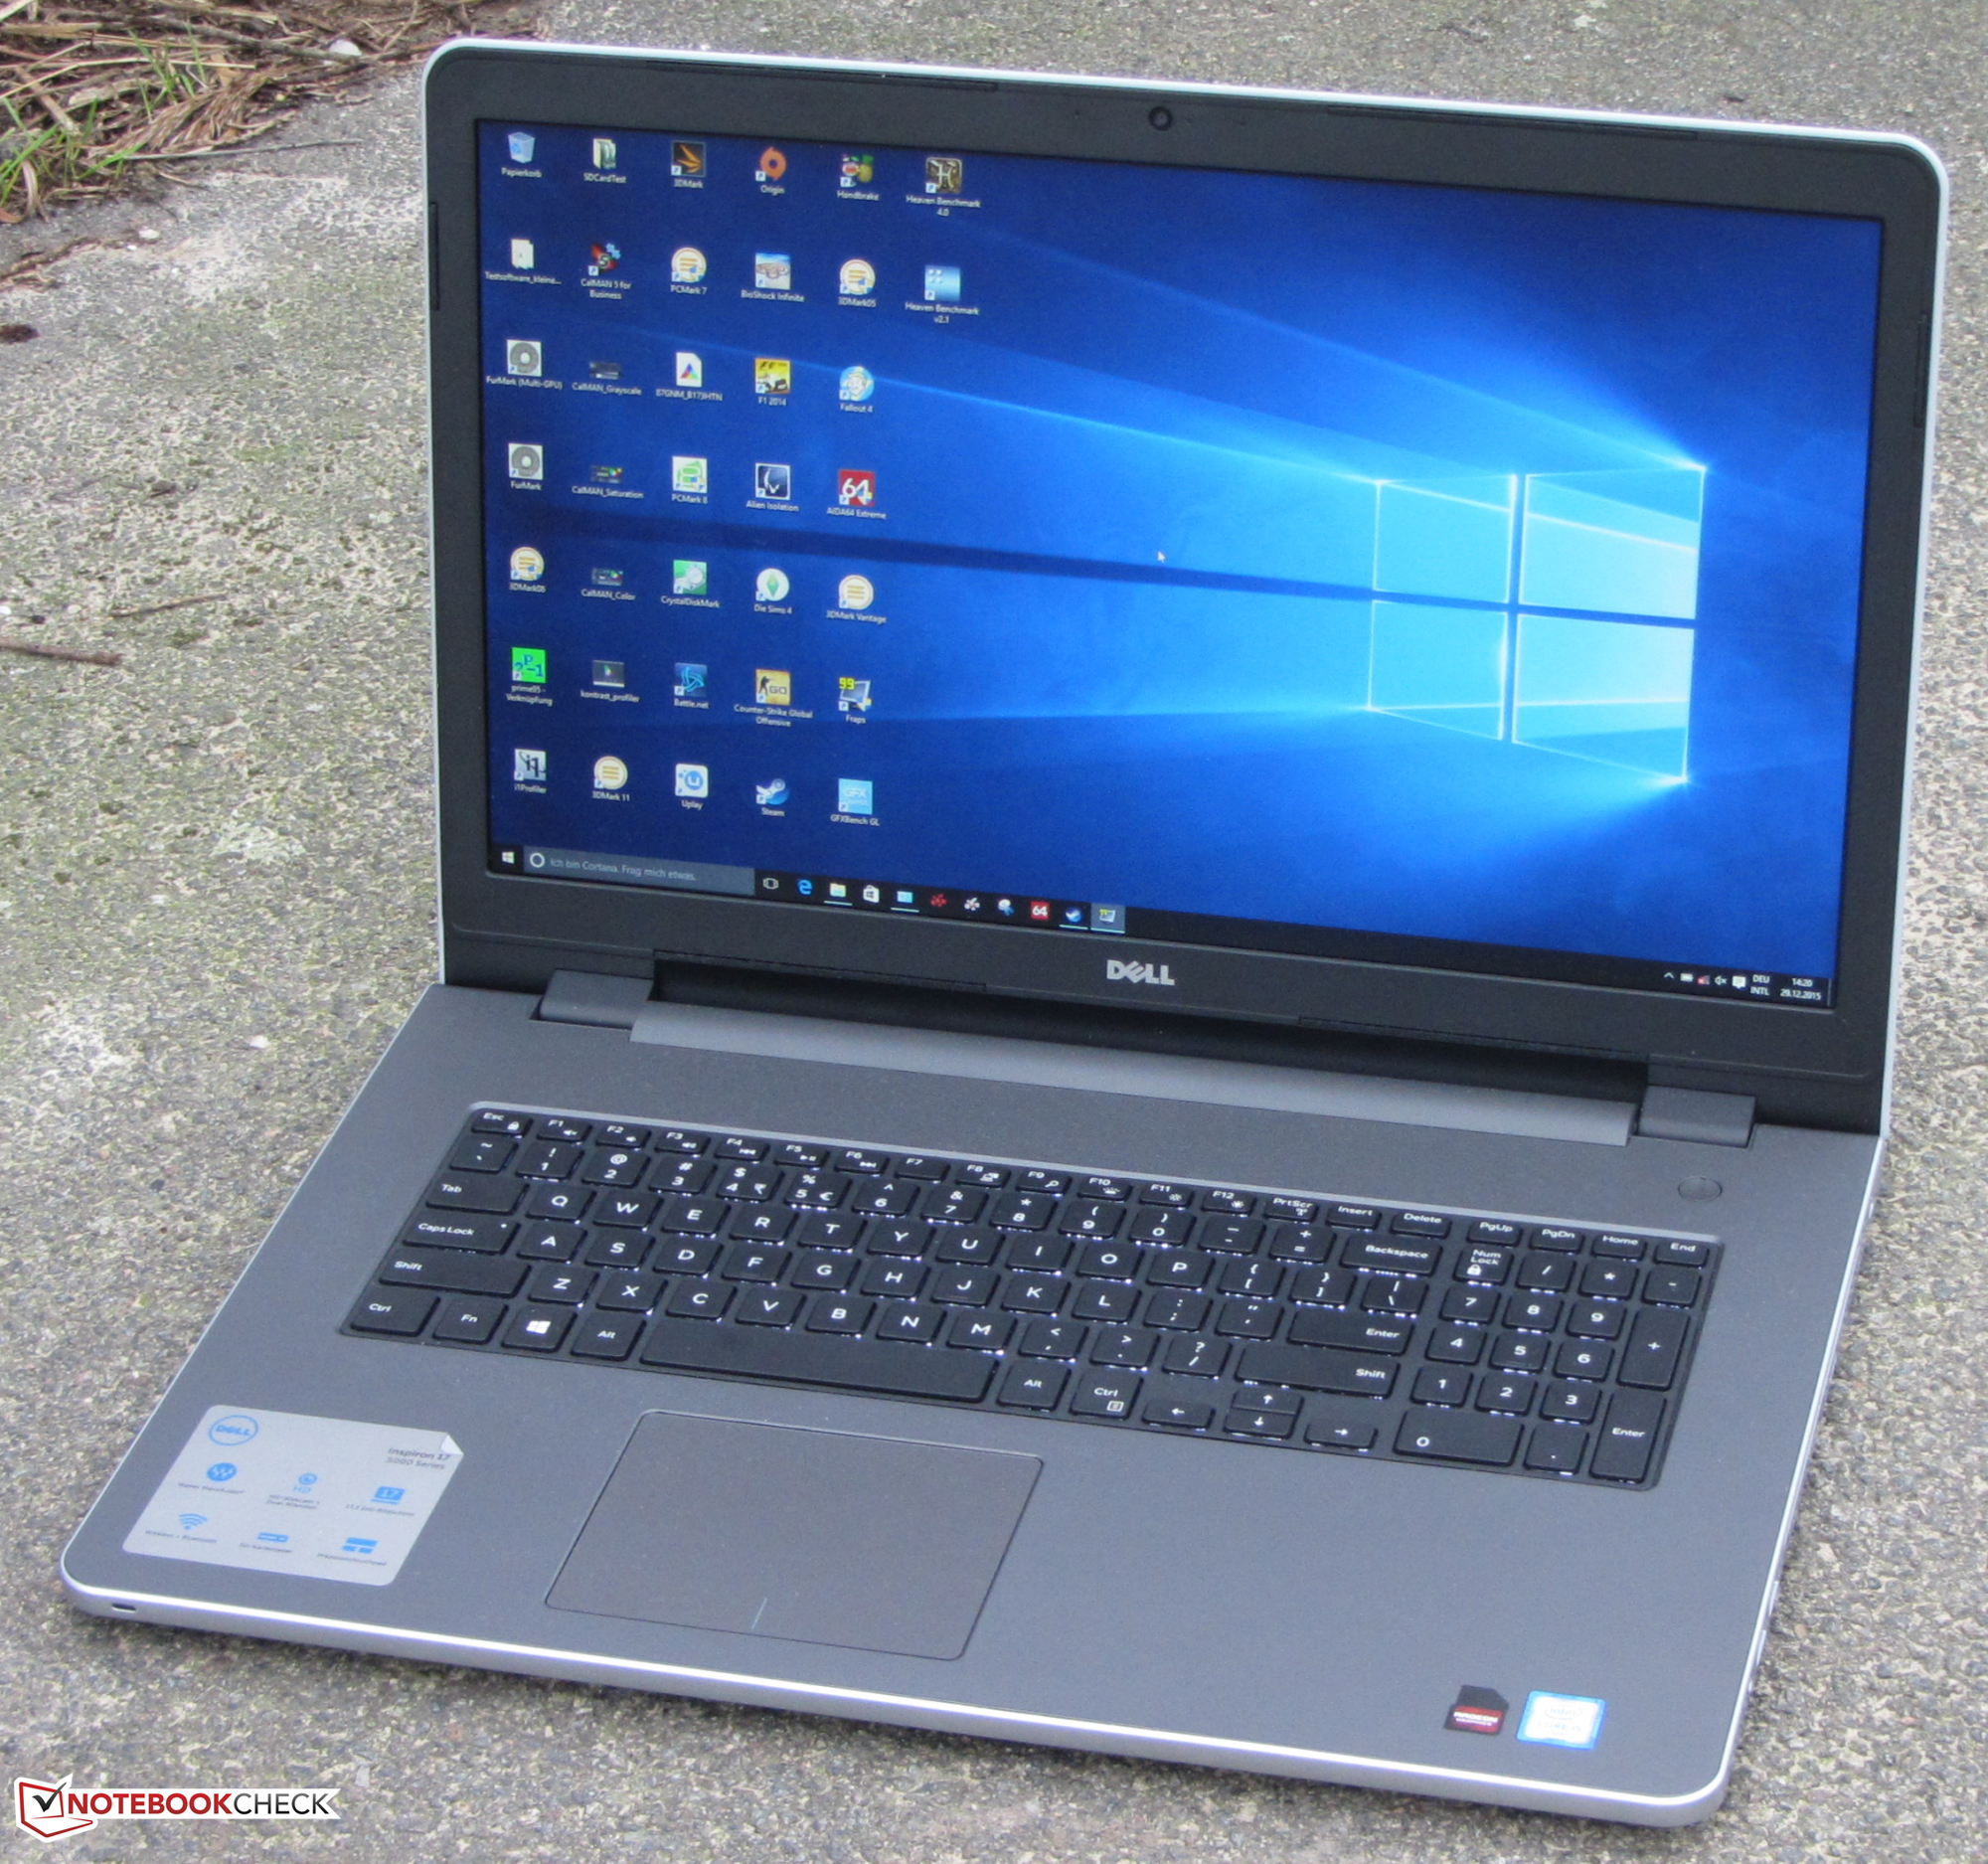
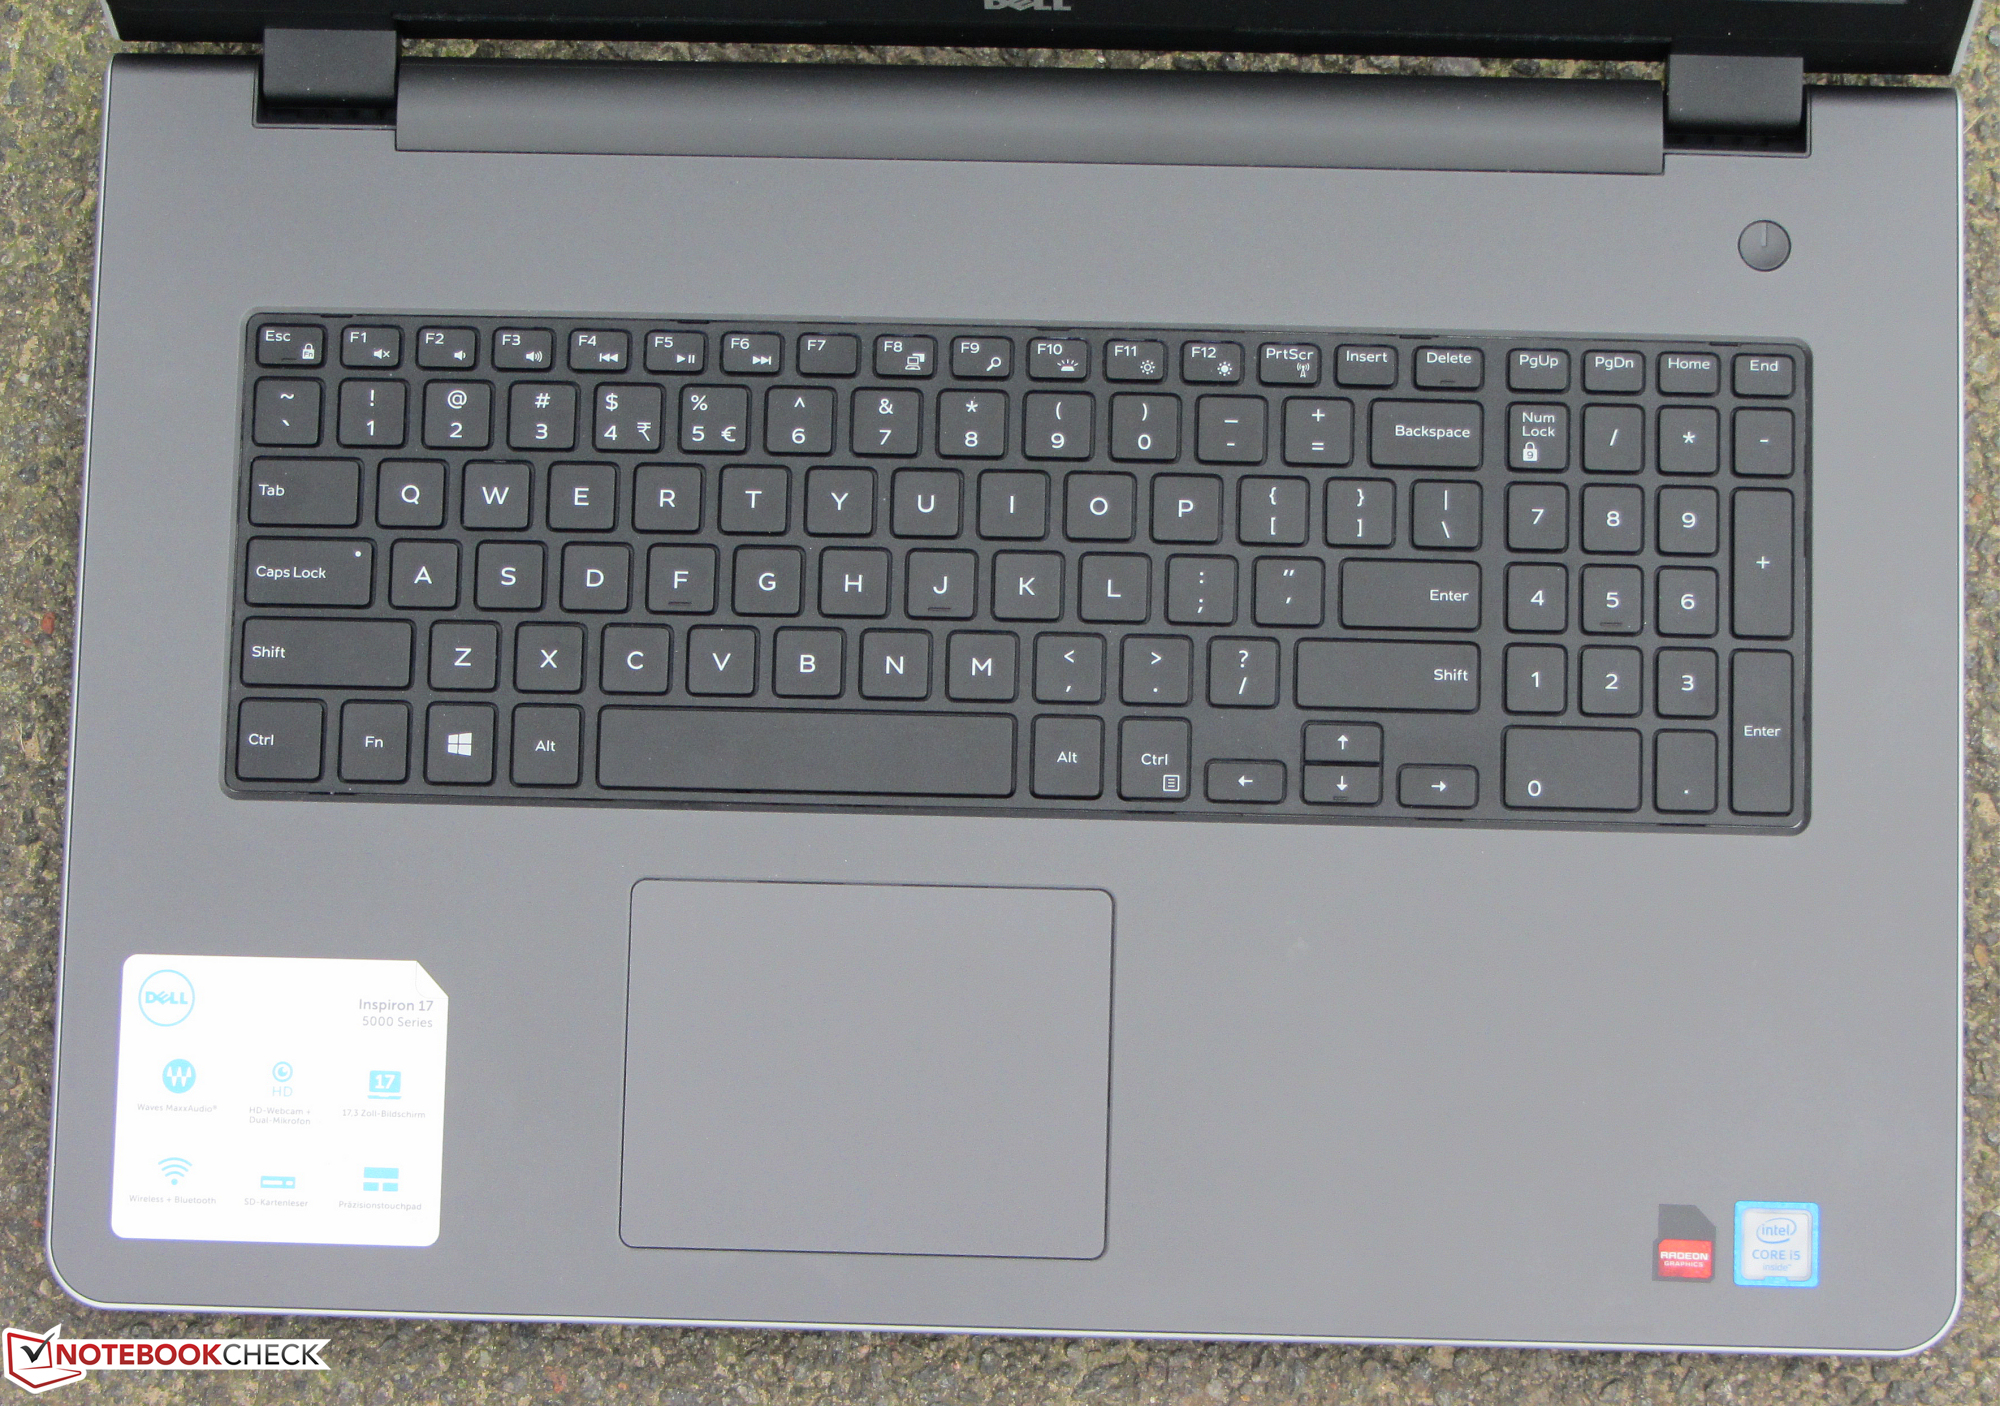
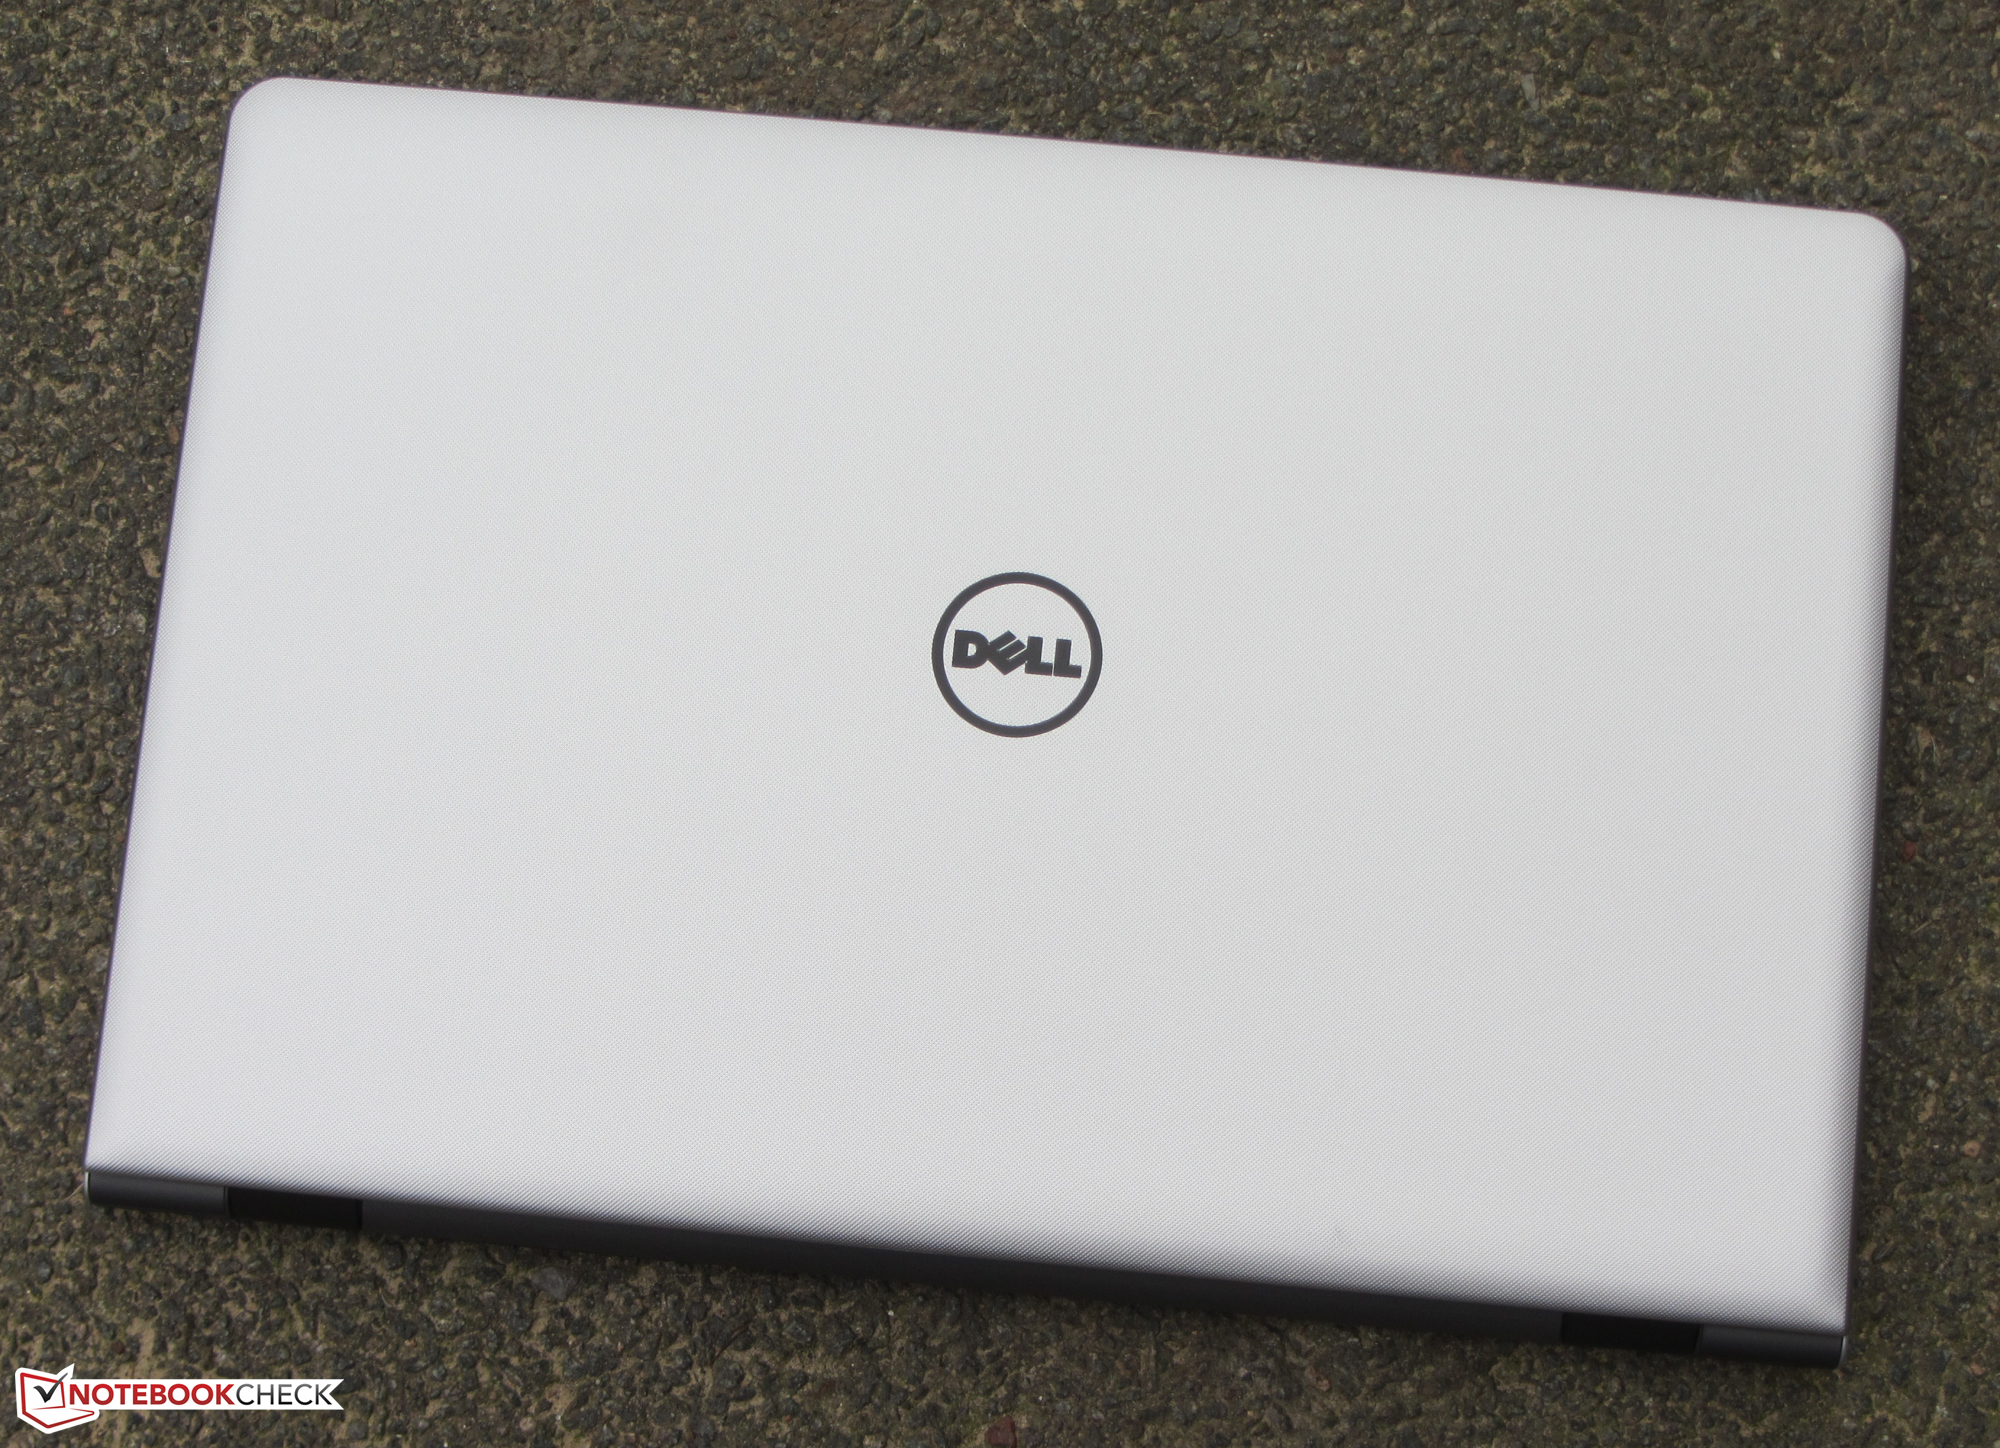
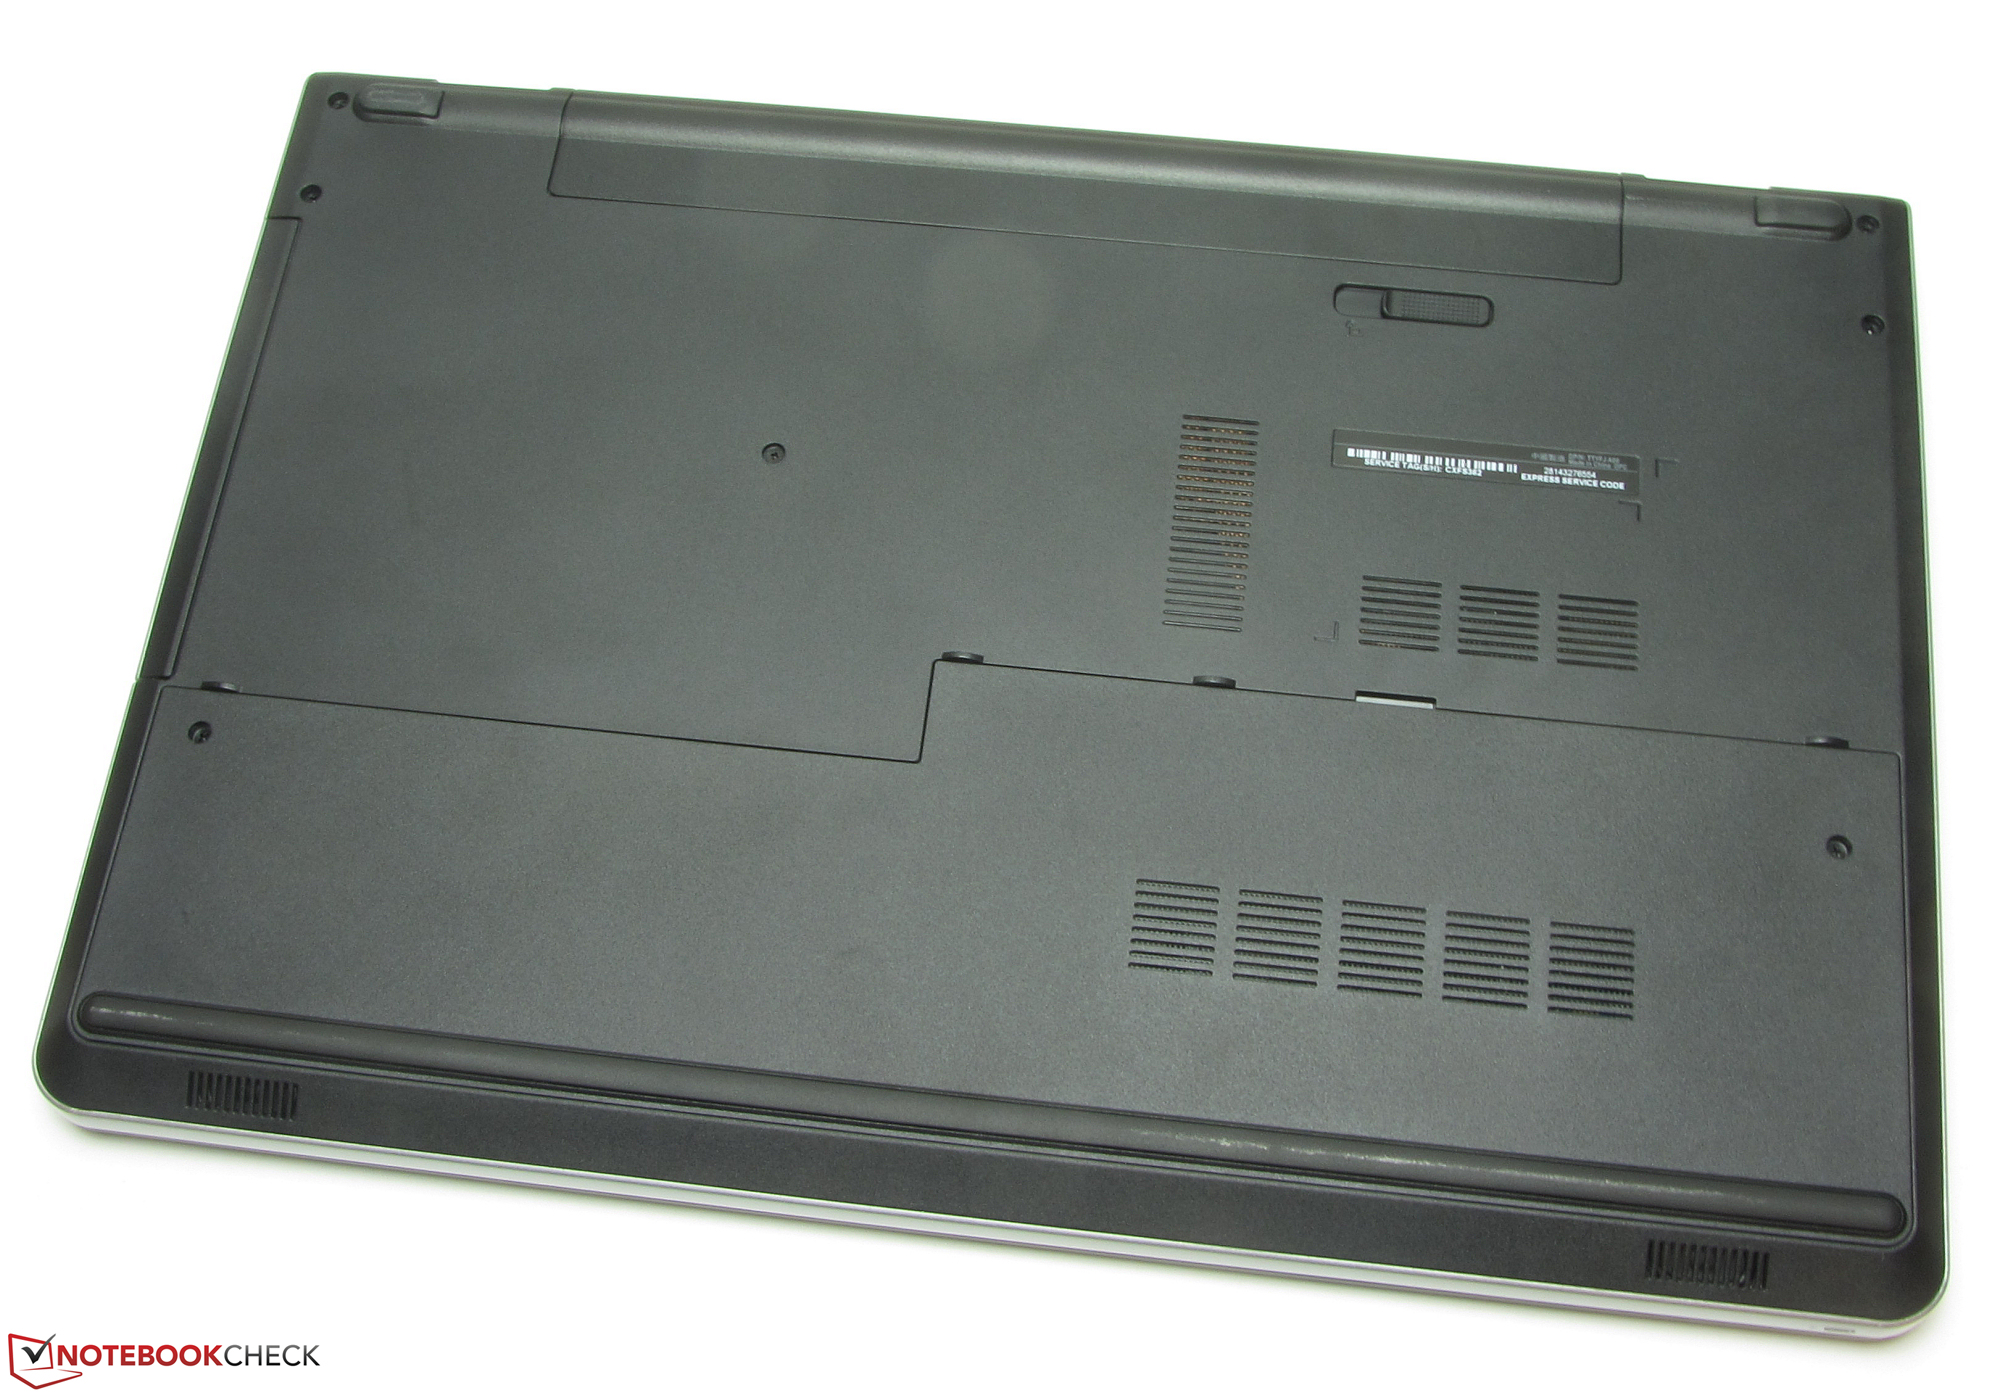
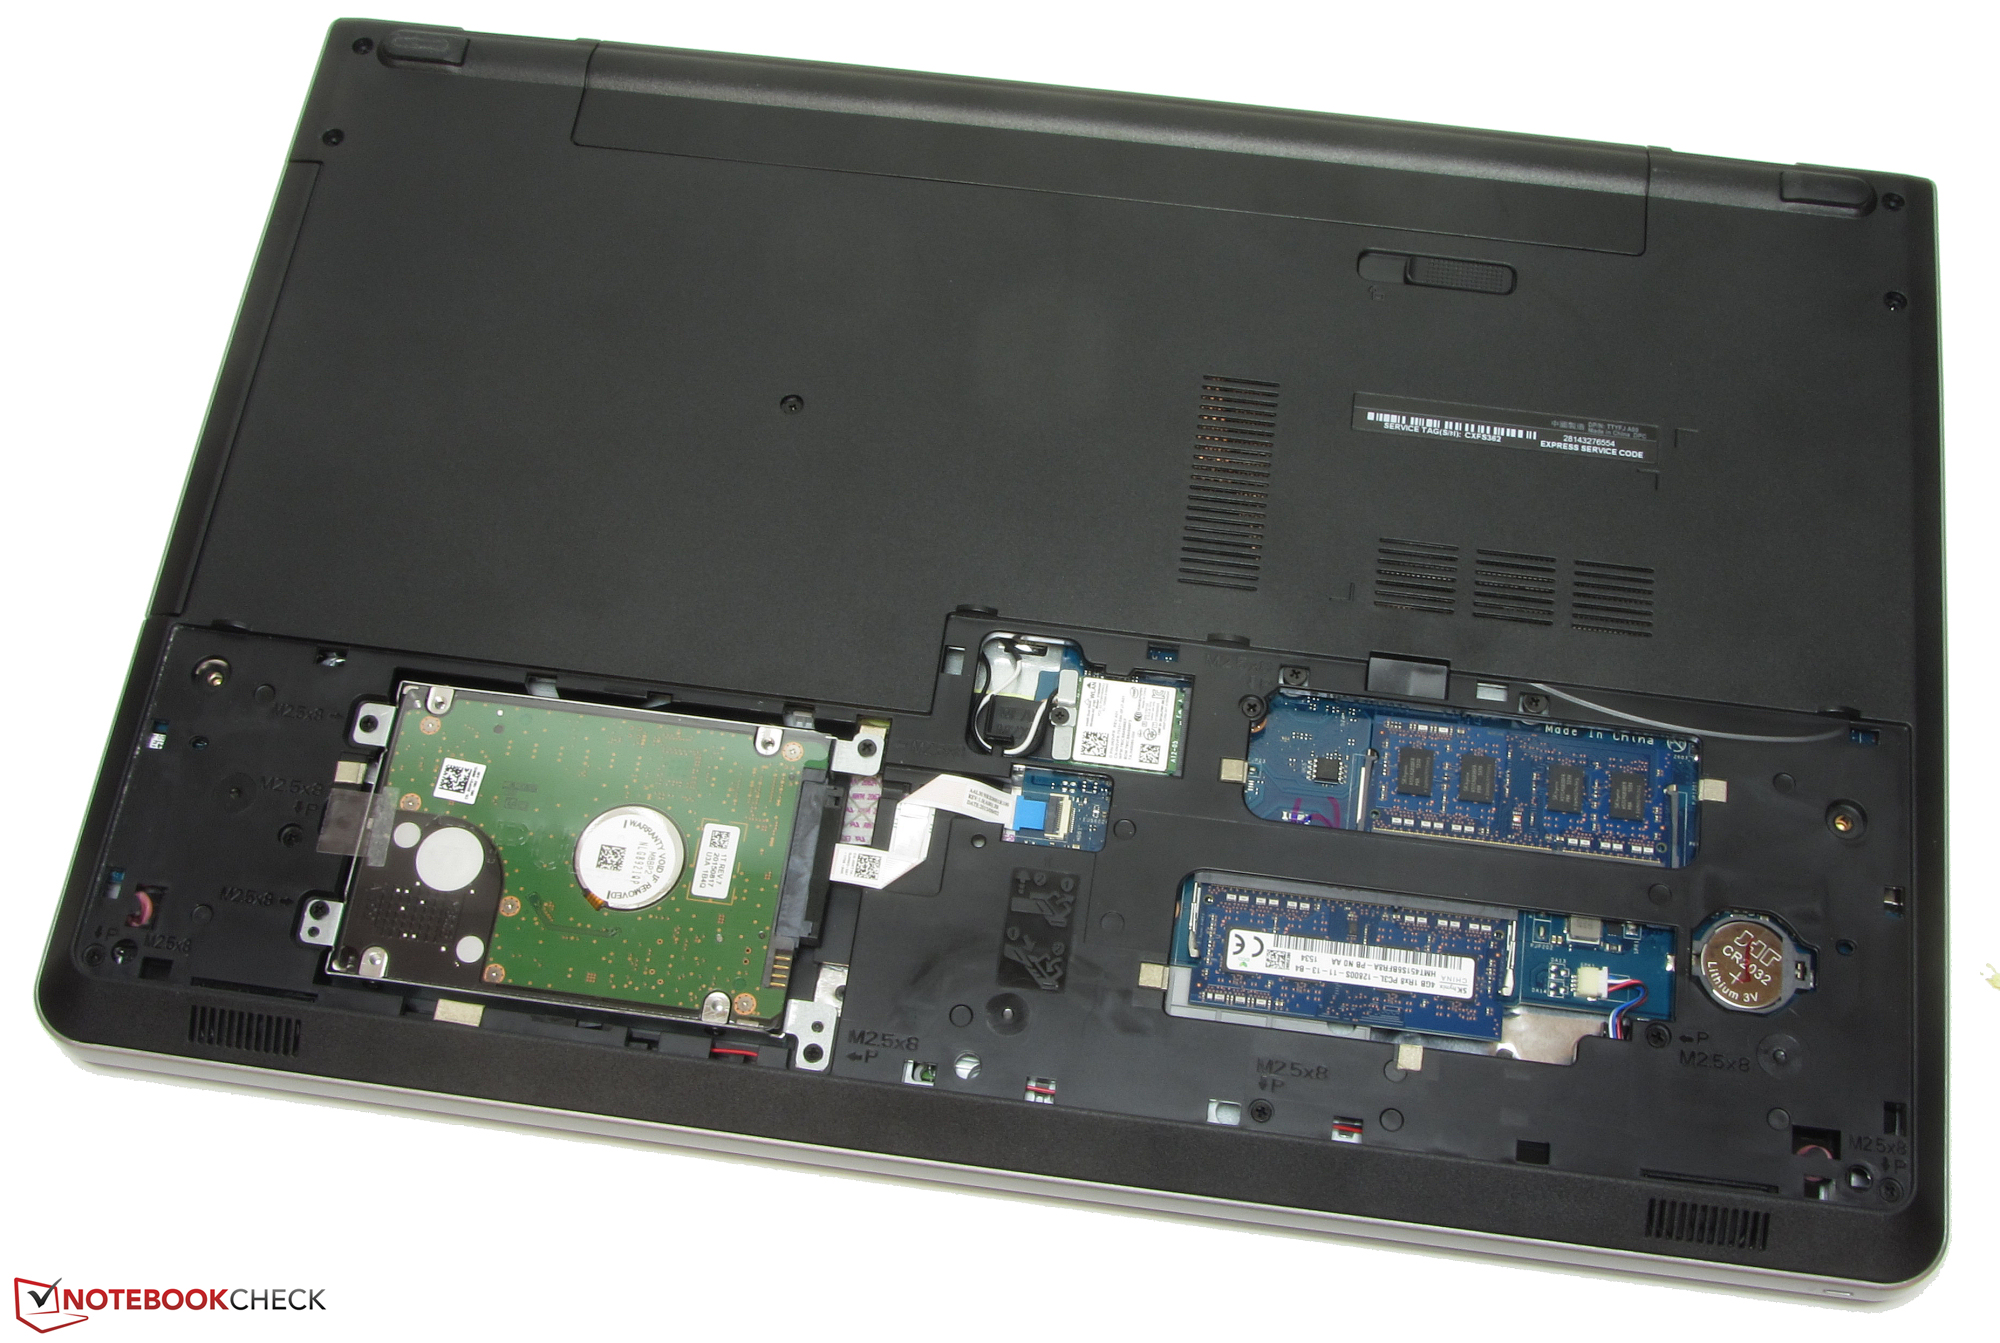
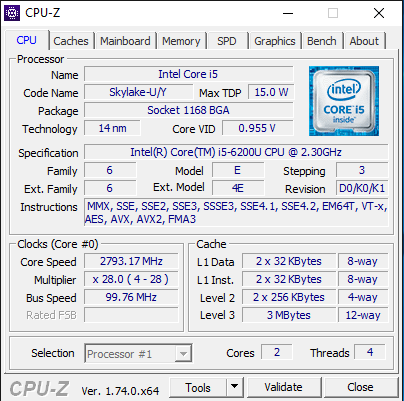
El nuevo modelo Inspiron 17 viene equipado con un procesador Skylake. Esto lleva a un rendimiento de aplicación mejorado. Sin embargo, Dell rebaja el rendimiento de gráfica. En general, el núcleo gráfico Radeon R5 M335 es más débil que el GeForce 920M del predecesor. Así, el rendimiento de juego se reduce de una generación Inspiron a la siguiente. El portátil suele funcionar en silencio y apenas se calienta. También tiene suficiente capacidad de almacenamiento. El portátil ofrece un HDD de 1 TB. Gracias a la escotilla de mantenimiento, es fácil cambiarlo. El aguante de la batería es satisfactorio en general. El teclado no se llevará ningún premio. Aunque es la misma unidad que la del predecesor, el teclado se balancea considerablemente debido a la falta de soporte en la parte inferior.
El elevado brillo y buen contraste del panel mate Full HD son agradables. Aunque es una pantalla TN que depende del ángulo de visión, es uno de los mejores modelos. Los ángulos de visión son más amplios de los que nos tienen acostumbrados las pantallas TN. Por desgracia, la pantalla muestra parpadeo PWM por debajo del brillo del 90% (200 Hz).
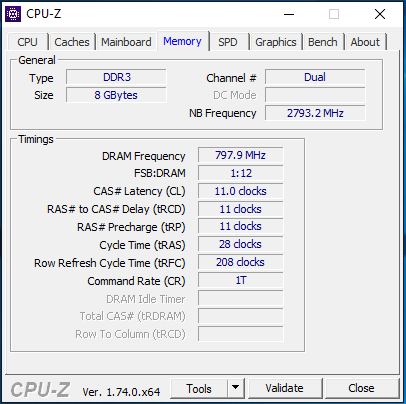
Dell básicamente ha montado un todoterreno decente. Sin embargo, el débil núcleo gráfico Radeon no termina de encajar en la foto. Apenas ofrece más rendimiento que la gráfica Intel integrada en dual-channel. El comprador normalmente estará mejor servido con una versión más barata del modelo Inspiron sin GPU dedicada.
Debería notarse que los modelos de precio reducido están equipados con paneles HD+ (1600x900 pixels). Los compradores que valoren una pantalla Full HD tendrán que llevarse nuestro modelo de pruebas.
Ésta es una versión acortada del análisis original. Puedes leer el análisis completo en inglés aquí.
Dell Inspiron 17 5759-5118
-
12/31/2015 v4(old)
Sascha Mölck