 Deutsch
 English
 Español
 Français
 Italiano
 Nederlands
 Polski
 Português
 Русский
 Türkçe
 Svenska
 Chinese
 Magyar
Breve análisis del Dell XPS 13 2016 (i7, 256 GB, QHD+)
| |||||||||||||||||||||||||
iluminación: 90 %
Brillo con batería: 216 cd/m²
Contraste: 1583:1 (Negro: 0.18 cd/m²)
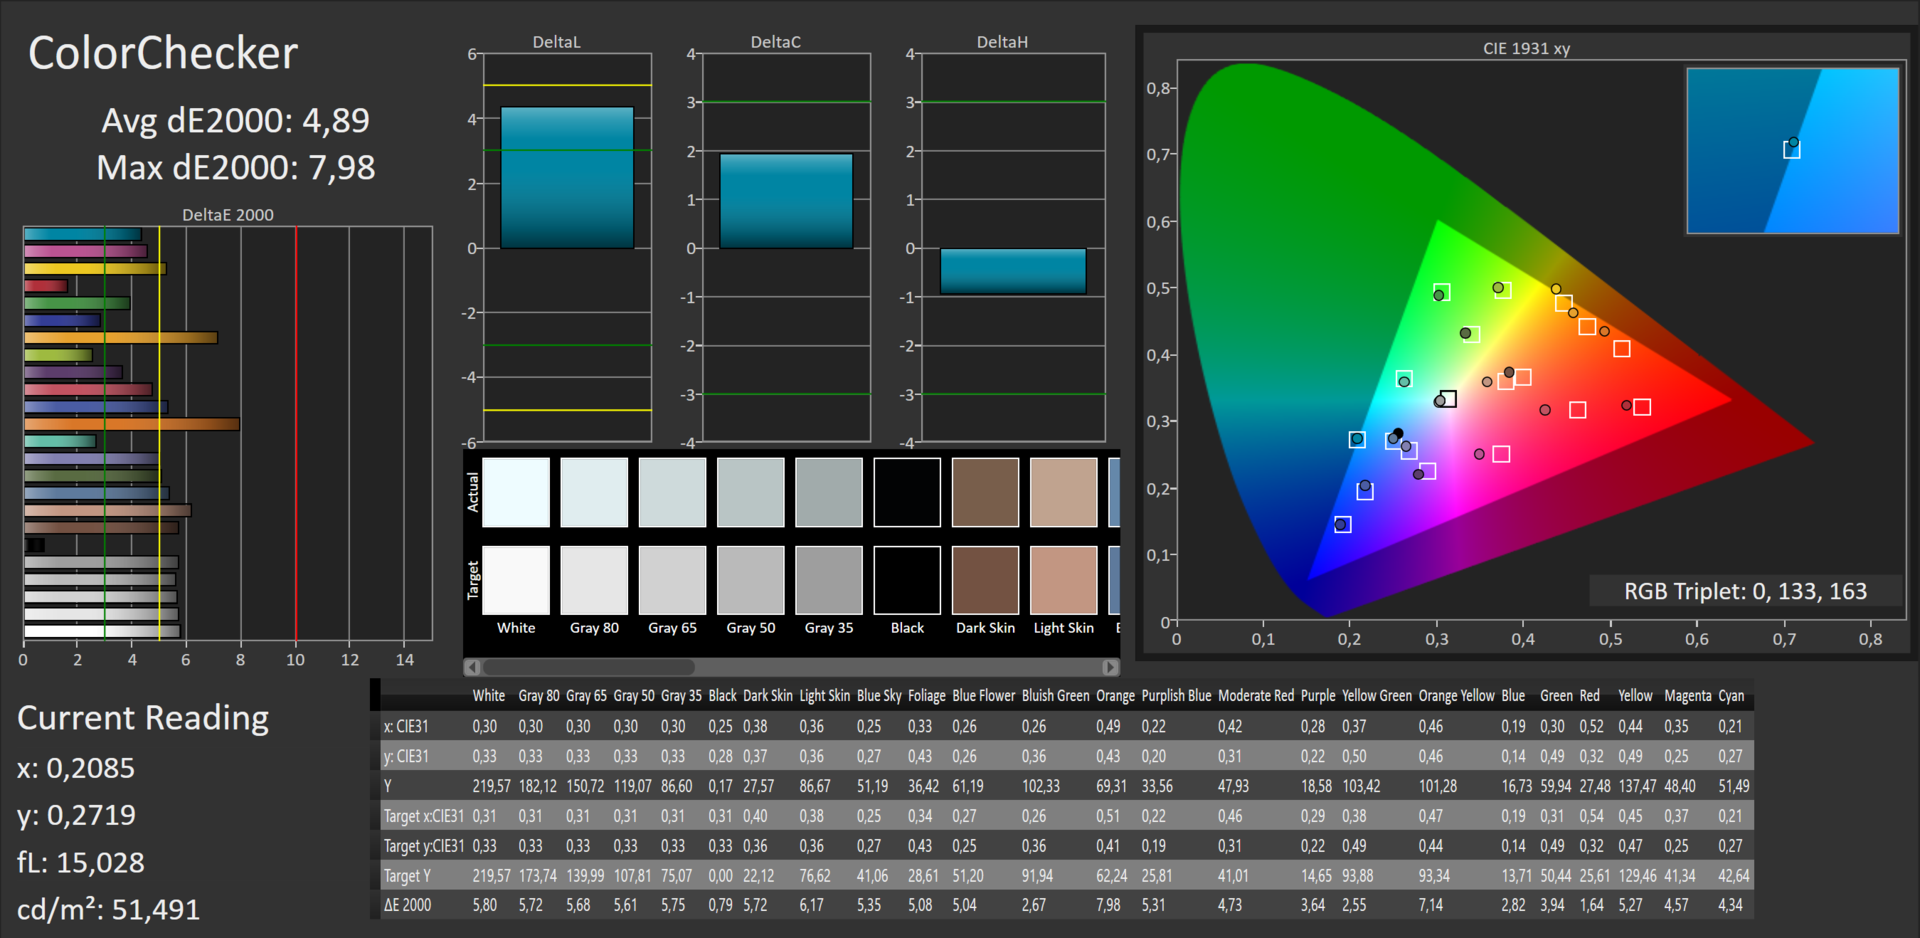
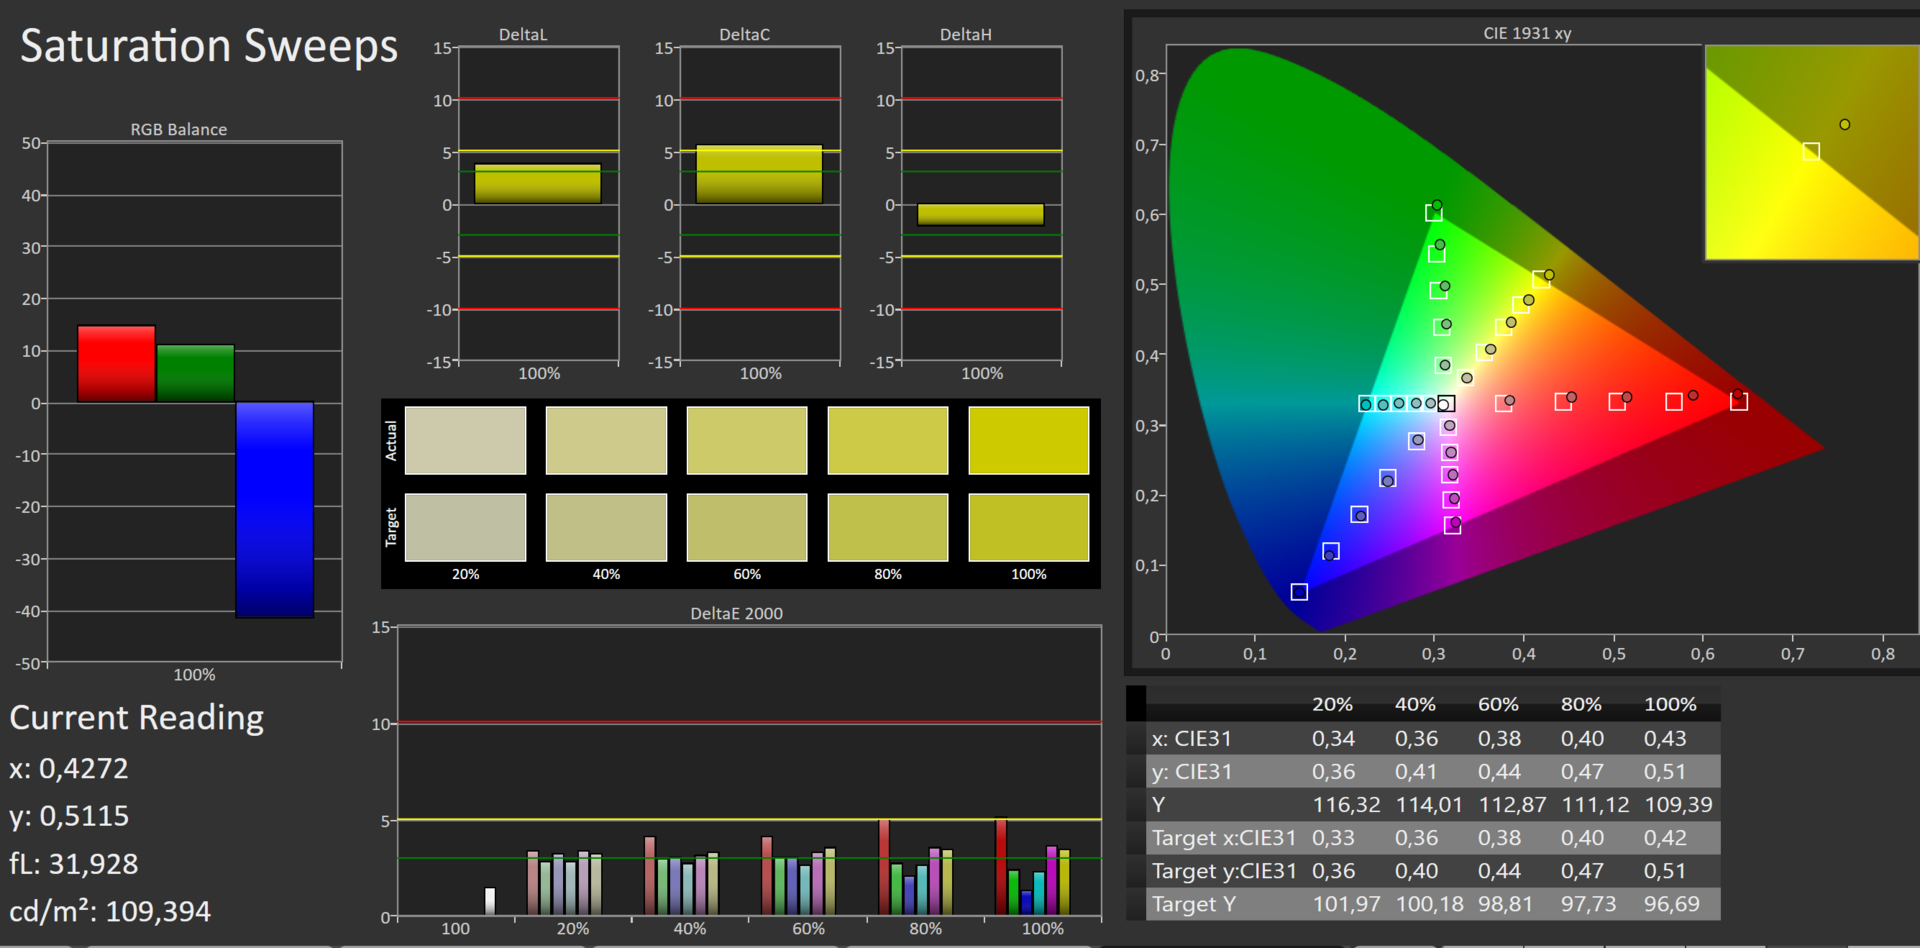
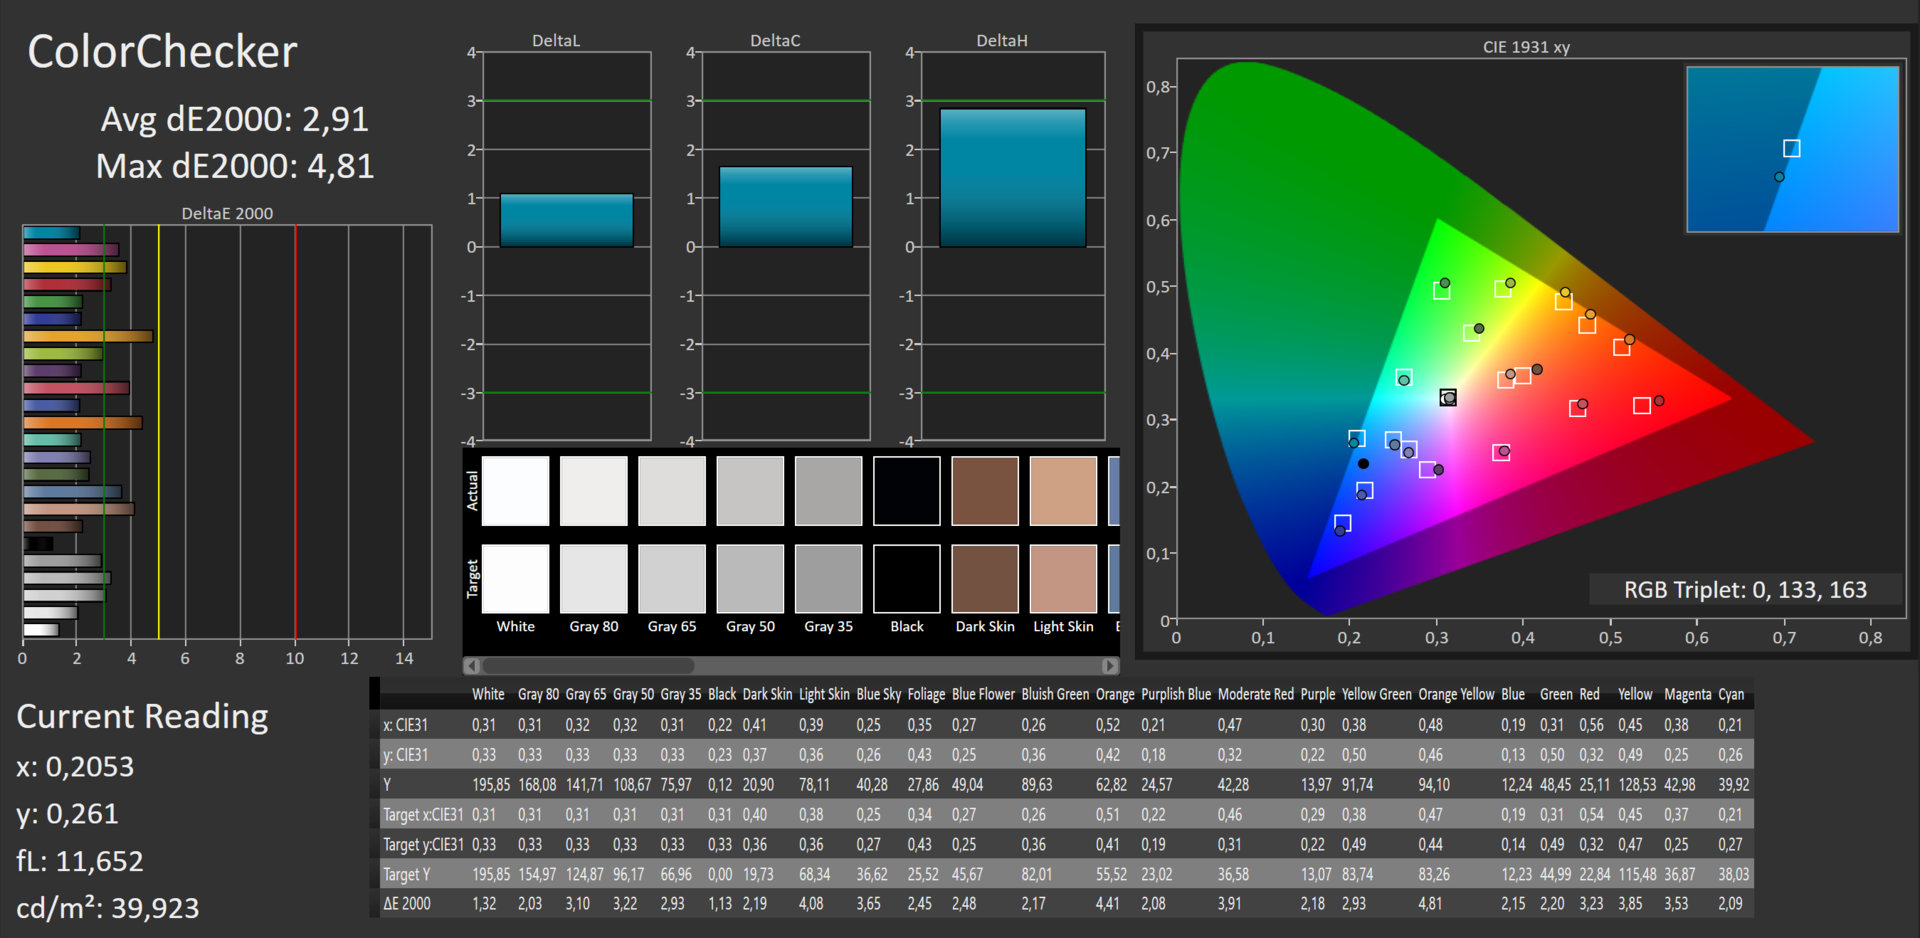
ΔE Color 4.89 | 0.5-29.43 Ø5
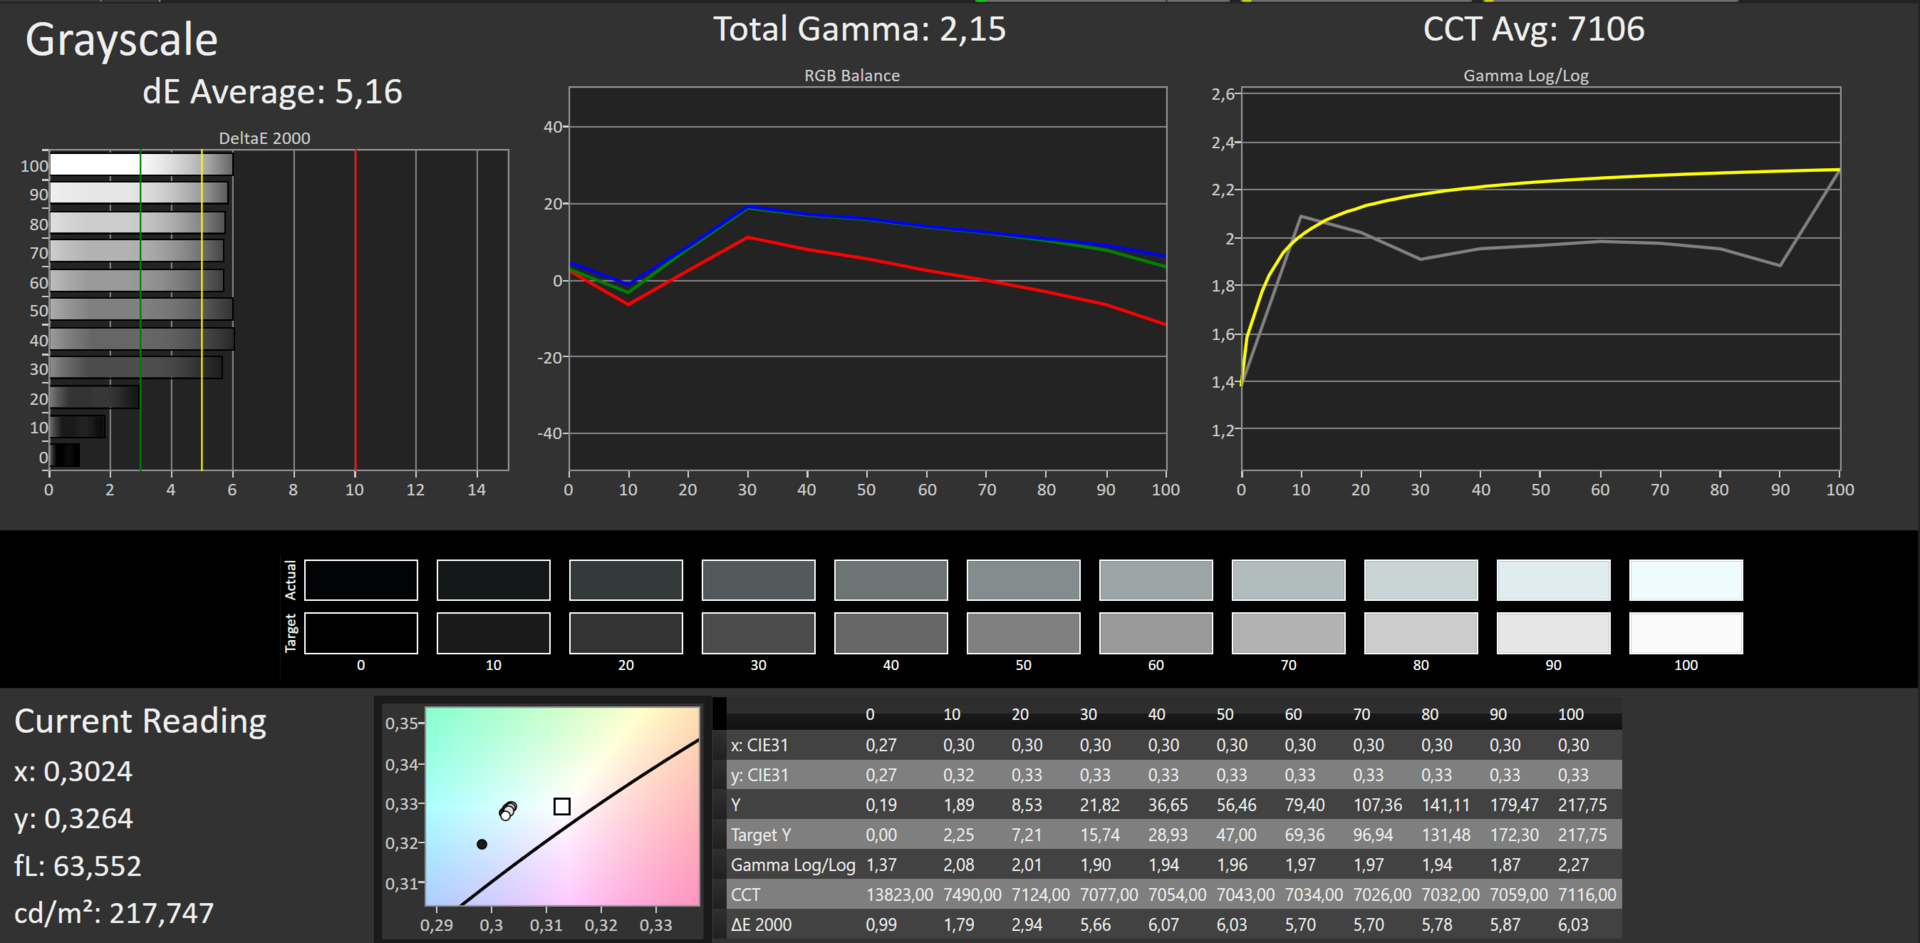
ΔE Greyscale 5.16 | 0.57-98 Ø5.3
93% sRGB (Argyll 1.6.3 3D)
59% AdobeRGB 1998 (Argyll 1.6.3 3D)
65.5% AdobeRGB 1998 (Argyll 2.2.0 3D)
93.6% sRGB (Argyll 2.2.0 3D)
63.6% Display P3 (Argyll 2.2.0 3D)
Gamma: 2.15
| Dell XPS 13-9350 Touch 13.3 3200x1800 IGZO | Dell XPS 13-9350 Non-Touch 13.3 1920x1080 IPS | Dell XPS 13-9343 Touch 13.3 3200x1800 IPS | Dell XPS 13-9343 Non-Touch 13.3 1920x1080 IPS | Apple MB Air 13 2015-03 13.3 1440x900 TN | MS Surface Pro 4 12.3 2736x1824 IPS | MS Surface Book 13.5 3000x2000 IPS | |
|---|---|---|---|---|---|---|---|
| Display | -30% | 8% | 0% | -37% | 2% | 4% | |
| Display P3 Coverage | 63.6 | 44.53 -30% | 72 13% | 65.9 4% | 40.1 -37% | 65 2% | 67 5% |
| sRGB Coverage | 93.6 | 66.8 -29% | 96 3% | 89.6 -4% | 59.8 -36% | 96.5 3% | 95.8 2% |
| AdobeRGB 1998 Coverage | 65.5 | 45.97 -30% | 71.6 9% | 66.2 1% | 41.51 -37% | 67 2% | 68.9 5% |
| Response Times | -39% | -15% | |||||
| Response Time Grey 50% / Grey 80% * | 40 ? | 46 ? -15% | 48.4 ? -21% | ||||
| Response Time Black / White * | 30 ? | 31.2 ? -4% | 32.8 ? -9% | ||||
| PWM Frequency | 4900 ? | 50 ? -99% | |||||
| Screen | -7% | 8% | -11% | -20% | 3% | 21% | |
| Brightness middle | 285 | 277.5 -3% | 367.3 29% | 409.7 44% | 329 15% | 413 45% | 430.9 51% |
| Brightness | 281 | 276 -2% | 372 32% | 405 44% | 310 10% | 396 41% | 410 46% |
| Brightness Distribution | 90 | 88 -2% | 77 -14% | 93 3% | 82 -9% | 87 -3% | 93 3% |
| Black Level * | 0.18 | 0.191 -6% | 0.178 1% | 0.366 -103% | 0.405 -125% | 0.36 -100% | 0.254 -41% |
| Contrast | 1583 | 1453 -8% | 2063 30% | 1119 -29% | 812 -49% | 1147 -28% | 1696 7% |
| Colorchecker dE 2000 * | 4.89 | 4.88 -0% | 5.92 -21% | 7.67 -57% | 3.96 19% | 3.09 37% | 2.06 58% |
| Greyscale dE 2000 * | 5.16 | 4.26 17% | 4.79 7% | 4.66 10% | 3.51 32% | 3.92 24% | 2.22 57% |
| Gamma | 2.15 102% | 2.59 85% | 2.42 91% | 1.65 133% | 3.83 57% | 2.3 96% | 2.13 103% |
| CCT | 7106 91% | 6562 99% | 7013 93% | 6502 100% | 6711 97% | 7333 89% | 6520 100% |
| Color Space (Percent of AdobeRGB 1998) | 59 | 41.6 -29% | 63 7% | 59.65 1% | 38.4 -35% | 61 3% | 64 8% |
| Color Space (Percent of sRGB) | 93 | 65.79 -29% | 96.4 4% | 59.8 -36% | 97 4% | 96 3% | |
| Colorchecker dE 2000 max. * | 7.51 | ||||||
| Media total (Programa/Opciones) | -19% /
-13% | 8% /
8% | -6% /
-8% | -29% /
-24% | -11% /
-6% | 3% /
12% |
* ... más pequeño es mejor
Tiempos de respuesta del display
| ↔ Tiempo de respuesta de Negro a Blanco | ||
|---|---|---|
| 30 ms ... subida ↗ y bajada ↘ combinada | ↗ 7 ms subida | 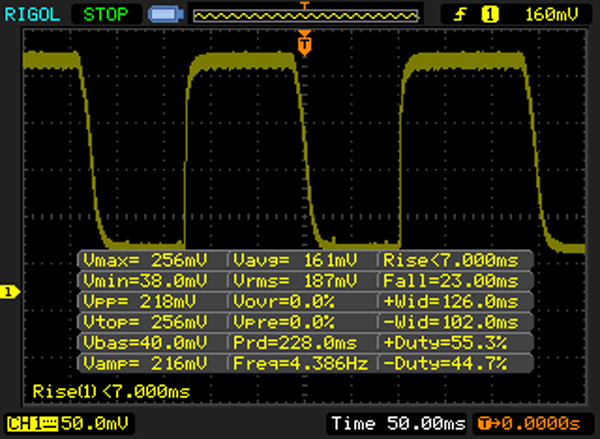 |
| ↘ 23 ms bajada | ||
| La pantalla mostró tiempos de respuesta lentos en nuestros tests y podría ser demasiado lenta para los jugones. En comparación, todos los dispositivos de prueba van de ##min### (mínimo) a 240 (máximo) ms. » 77 % de todos los dispositivos son mejores. Eso quiere decir que el tiempo de respuesta es peor que la media (21.5 ms) de todos los dispositivos testados. | ||
| ↔ Tiempo de respuesta 50% Gris a 80% Gris | ||
| 40 ms ... subida ↗ y bajada ↘ combinada | ↗ 10 ms subida | 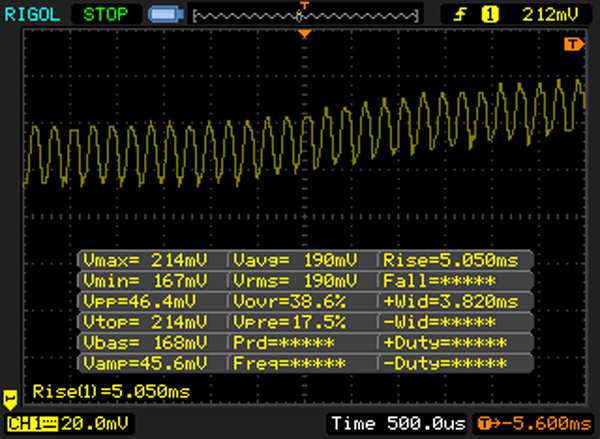 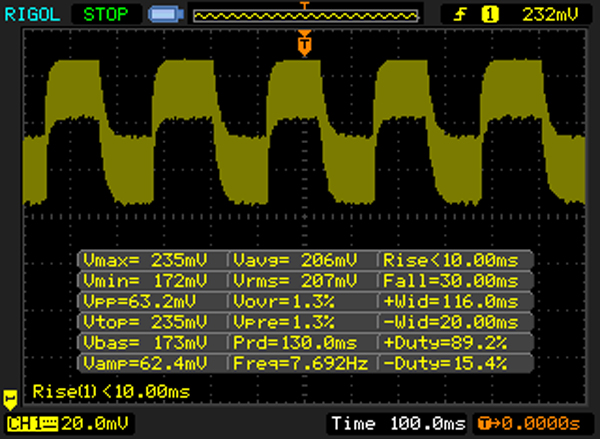 |
| ↘ 30 ms bajada | ||
| La pantalla mostró tiempos de respuesta lentos en nuestros tests y podría ser demasiado lenta para los jugones. En comparación, todos los dispositivos de prueba van de ##min### (mínimo) a 636 (máximo) ms. » 56 % de todos los dispositivos son mejores. Eso quiere decir que el tiempo de respuesta es peor que la media (33.8 ms) de todos los dispositivos testados. | ||
Parpadeo de Pantalla / PWM (Pulse-Width Modulation)
| Parpadeo de Pantalla / PWM detectado | 4900 Hz | ≤ 100 % de brillo | 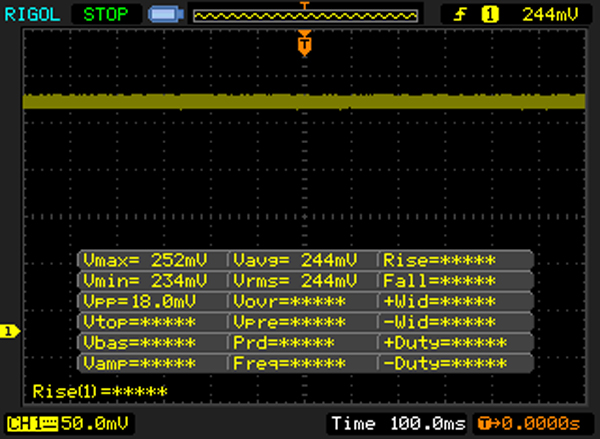 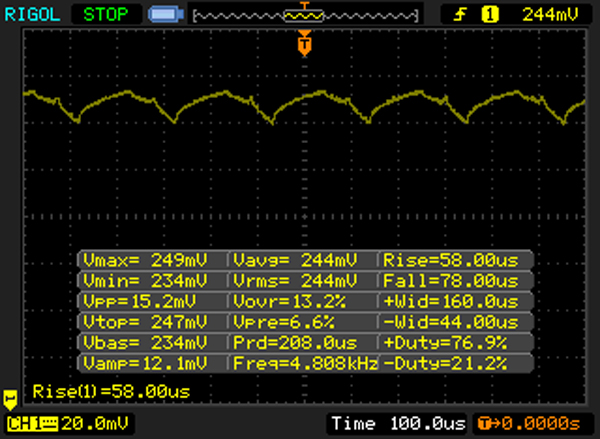 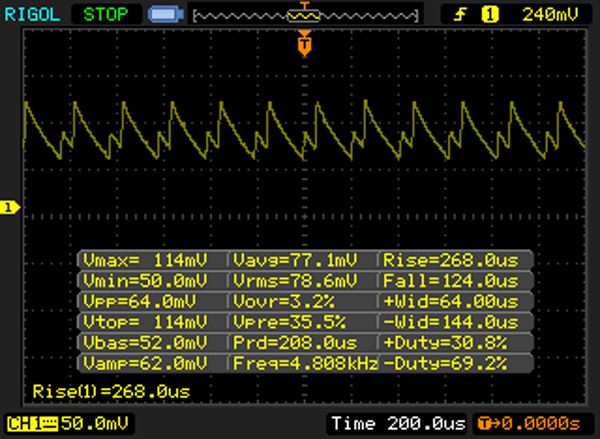 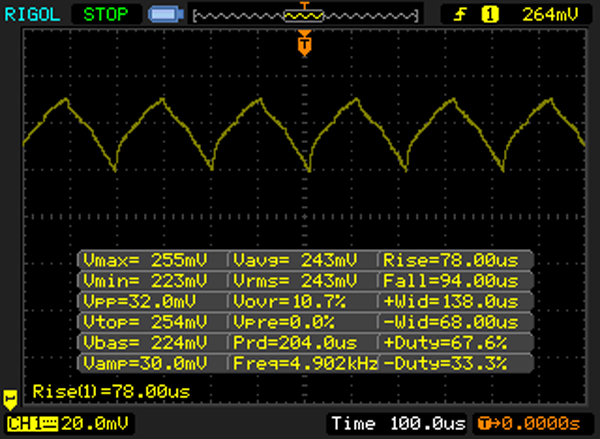 |
La retroiluminación del display parpadea a 4900 Hz (seguramente usa PWM - Pulse-Width Modulation) a un brillo del 100 % e inferior. Sobre este nivel de brillo no debería darse parpadeo / PWM. La frecuencia de 4900 Hz es bastante alta, por lo que la mayoría de gente sensible al parpadeo no debería ver parpadeo o tener fatiga visual. Comparación: 53 % de todos los dispositivos testados no usaron PWM para atenuar el display. Si se usó, medimos una media de 17942 (mínimo: 5 - máxmo: 3846000) Hz. | |||
| PCMark 7 Score | 4977 puntos | |
| PCMark 8 Home Score Accelerated v2 | 2822 puntos | |
| PCMark 8 Work Score Accelerated v2 | 3735 puntos | |
ayuda | ||
| Dell XPS 13-9350 Touch Samsung PM951 NVMe MZ-VLV256D | Dell XPS 13-9350 Non-Touch Samsung PM951 NVMe MZ-VLV256D | Dell XPS 13-9343 Touch Lite-On IT L8T-256L9G | Dell XPS 13-9343 Non-Touch Samsung SSD PM851 M.2 2280 128GB | Apple MB Air 13 2015-03 Apple SSD SD0256F | MS Surface Pro 4 Samsung MZFLV128 NVMe | MS Surface Book Samsung MZFLV256 NVMe | |
|---|---|---|---|---|---|---|---|
| CrystalDiskMark 3.0 | -12% | -11% | -40% | 33% | -31% | ||
| Read Seq | 764 | 1097 44% | 489.6 -36% | 526 -31% | 1352 77% | 666 -13% | |
| Write Seq | 311.4 | 307.7 -1% | 424.2 36% | 124.2 -60% | 1111 257% | 154.2 -50% | |
| Read 4k | 42.16 | 38.52 -9% | 34.76 -18% | 27.82 -34% | 21.93 -48% | 28.51 -32% | |
| Write 4k | 121 | 113 -7% | 79.3 -34% | 95.5 -21% | 30.94 -74% | 101.5 -16% | |
| Read 4k QD32 | 485.7 | 244.7 -50% | 354 -27% | 325.7 -33% | 339.5 -30% | 368.3 -24% | |
| Write 4k QD32 | 293.6 | 151.5 -48% | 326.3 11% | 124.5 -58% | 342.9 17% | 153.6 -48% | |
| AS SSD | -22% | -18% | -39% | 41% | -20% | 22% | |
| Seq Read | 735 | 1243 69% | 484.7 -34% | 497.9 -32% | 1212 65% | 832 13% | 1223 66% |
| Seq Write | 301.2 | 152.6 -49% | 416.8 38% | 119.6 -60% | 1001 232% | 142.5 -53% | 275.2 -9% |
| 4K Read | 38.21 | 34.61 -9% | 30.89 -19% | 25.94 -32% | 19.16 -50% | 34.24 -10% | 34.31 -10% |
| 4K Write | 97.6 | 0.98 -99% | 58.8 -40% | 84 -14% | 23.73 -76% | 86.5 -11% | 85 -13% |
| Score Read | 809 | 1147 42% | 425 -47% | 441 -45% | 1281 58% | 645 -20% | 1566 94% |
| Score Write | 391 | 60 -85% | 369 -6% | 184 -53% | 463 18% | 239 -39% | 394 1% |
| Copy ISO MB/s | 317.8 | 283.1 | 643 | 121.9 | 388.2 | ||
| Copy Program MB/s | 149.1 | 157.5 | 245 | 63.5 | 174.1 | ||
| Media total (Programa/Opciones) | -17% /
-17% | -15% /
-15% | -40% /
-39% | 37% /
37% | -26% /
-25% | 22% /
22% |

| 3DMark - 1280x720 Cloud Gate Standard Score (ordenar por valor) | |
| Dell XPS 13-9350 Touch | |
| Dell XPS 13-9350 Non-Touch | |
| Dell XPS 13-9343 Touch | |
| Dell XPS 13-9343 Non-Touch | |
| Apple MB Air 13 2015-03 | |
| MS Surface Pro 4 | |
| MS Surface Book | |
| 3DMark 11 Performance | 1556 puntos | |
| 3DMark Ice Storm Standard Score | 52990 puntos | |
| 3DMark Cloud Gate Standard Score | 5896 puntos | |
| 3DMark Fire Strike Score | 847 puntos | |
ayuda | ||
| Metro 2033 - 1360x768 Normal DX10 AA:A AF:4x (ordenar por valor) | |
| Dell XPS 13-9350 Non-Touch | |
| Dell XPS 13-9343 Touch | |
| BioShock Infinite - 1366x768 Medium Preset (ordenar por valor) | |
| Dell XPS 13-9350 Touch | |
| Dell XPS 13-9350 Non-Touch | |
| Dell XPS 13-9343 Touch | |
| Apple MB Air 13 2015-03 | |
| MS Surface Pro 4 | |
| MS Surface Book | |
| Tomb Raider - 1366x768 Normal Preset AA:FX AF:4x (ordenar por valor) | |
| Dell XPS 13-9350 Touch | |
| Apple MB Air 13 2015-03 | |
| MS Surface Pro 4 | |
| MS Surface Book | |
| bajo | medio | alto | ultra | |
| Tomb Raider (2013) | 71.8 | 36.6 | 24.4 | 11.2 |
| BioShock Infinite (2013) | 51.4 | 27.9 | 24.1 | 7.4 |
| Dirt Rally (2015) | 95 | 23.6 | 12.7 | |
| Metal Gear Solid V (2015) | 43.7 | 28.3 | 11.5 |
| Dell XPS 13-9350 Touch HD Graphics 520, 6500U, Samsung PM951 NVMe MZ-VLV256D | Dell XPS 13-9350 Non-Touch HD Graphics 520, 6200U, Samsung PM951 NVMe MZ-VLV256D | Dell XPS 13-9343 Touch HD Graphics 5500, 5200U, Lite-On IT L8T-256L9G | Dell XPS 13-9343 Non-Touch HD Graphics 5500, 5200U, Samsung SSD PM851 M.2 2280 128GB | Apple MB Air 13 2015-03 HD Graphics 6000, 5650U, Apple SSD SD0256F | MS Surface Pro 4 HD Graphics 520, 6300U, Samsung MZFLV128 NVMe | MS Surface Book Maxwell GPU (940M, GDDR5), 6300U, Samsung MZFLV256 NVMe | |
|---|---|---|---|---|---|---|---|
| Noise | 13% | -3% | 7% | -3% | -4% | 1% | |
| Idle Minimum * | 31.8 | 28.2 11% | 30.2 5% | 29 9% | 29.2 8% | 31.5 1% | 29.5 7% |
| Idle Average * | 31.8 | 28.3 11% | 30.3 5% | 29.1 8% | 29.2 8% | 31.5 1% | 29.6 7% |
| Idle Maximum * | 34.8 | 28.4 18% | 30.4 13% | 29.2 16% | 29.2 16% | 31.5 9% | 29.7 15% |
| Load Average * | 34.8 | 30.2 13% | 34.4 1% | 31.1 11% | 40.2 -16% | 40.5 -16% | 37.5 -8% |
| Load Maximum * | 34.8 | 30.2 13% | 48 -38% | 38.4 -10% | 46.3 -33% | 40.7 -17% | 40.9 -18% |
* ... más pequeño es mejor
Ruido
| Ocioso |
| 31.8 / 31.8 / 34.8 dB(A) |
| Carga |
| 34.8 / 34.8 dB(A) |
 | ||
30 dB silencioso 40 dB(A) audible 50 dB(A) ruidosamente alto |
||
min: | ||
| Dell XPS 13-9350 Touch HD Graphics 520, 6500U, Samsung PM951 NVMe MZ-VLV256D | Dell XPS 13-9350 Non-Touch HD Graphics 520, 6200U, Samsung PM951 NVMe MZ-VLV256D | Dell XPS 13-9343 Touch HD Graphics 5500, 5200U, Lite-On IT L8T-256L9G | Dell XPS 13-9343 Non-Touch HD Graphics 5500, 5200U, Samsung SSD PM851 M.2 2280 128GB | Apple MB Air 13 2015-03 HD Graphics 6000, 5650U, Apple SSD SD0256F | MS Surface Pro 4 HD Graphics 520, 6300U, Samsung MZFLV128 NVMe | MS Surface Book Maxwell GPU (940M, GDDR5), 6300U, Samsung MZFLV256 NVMe | |
|---|---|---|---|---|---|---|---|
| Heat | 15% | 19% | 19% | 20% | -4% | 26% | |
| Maximum Upper Side * | 57 | 45.2 21% | 40.6 29% | 44.6 22% | 43.8 23% | 52.3 8% | 44.2 22% |
| Maximum Bottom * | 56 | 45.2 19% | 41.2 26% | 44.8 20% | 42.1 25% | 51.4 8% | 41.2 26% |
| Idle Upper Side * | 34.1 | 30.4 11% | 31.2 9% | 28.8 16% | 28.5 16% | 43.2 -27% | 26 24% |
| Idle Bottom * | 34.3 | 31.2 9% | 30.6 11% | 28.8 16% | 28.9 16% | 36 -5% | 23.8 31% |
* ... más pequeño es mejor
(-) The maximum temperature on the upper side is 57 °C / 135 F, compared to the average of 35.9 °C / 97 F, ranging from 21.4 to 59 °C for the class Subnotebook.
(-) The bottom heats up to a maximum of 56 °C / 133 F, compared to the average of 39.4 °C / 103 F
(+) In idle usage, the average temperature for the upper side is 29.9 °C / 86 F, compared to the device average of 30.7 °C / 87 F.
(±) The palmrests and touchpad can get very hot to the touch with a maximum of 37.5 °C / 99.5 F.
(-) The average temperature of the palmrest area of similar devices was 28.3 °C / 82.9 F (-9.2 °C / -16.6 F).
| Dell XPS 13-9350 Touch 6500U | Dell XPS 13-9350 Non-Touch 6200U | Dell XPS 13-9343 Touch 5500U | Dell XPS 13-9343 Non-Touch 5200U | |
|---|---|---|---|---|
| Power Consumption | -0% | 26% | 24% | |
| Idle Minimum * | 6.8 | 6.6 3% | 2.7 60% | 4.4 35% |
| Idle Average * | 10 | 9.3 7% | 5.7 43% | 9 10% |
| Idle Maximum * | 10.5 | 11 -5% | 6 43% | 10.7 -2% |
| Load Average * | 30.2 | 32.2 -7% | 32.1 -6% | 19.6 35% |
| Load Maximum * | 33.6 | 33.2 1% | 36.2 -8% | 19.9 41% |
* ... más pequeño es mejor
| Off / Standby | |
| Ocioso | |
| Carga |
|
| Dell XPS 13-9350 Touch 6500U 56Wh | Dell XPS 13-9350 Non-Touch 6200U 56Wh | Dell XPS 13-9343 Touch 5200U 52Wh | Dell XPS 13-9343 Non-Touch 5200U 54Wh | Apple MB Air 13 2015-03 5650U 54Wh | MS Surface Pro 4 6300U 38Wh | MS Surface Book 6300U 69Wh | |
|---|---|---|---|---|---|---|---|
| Duración de Batería | 17% | 26% | 48% | 46% | 7% | 26% | |
| Reader / Idle | 784 | 782 0% | 912 16% | 1295 65% | 1572 101% | 899 15% | 1070 36% |
| WiFi v1.3 | 432 | 451 4% | 598 38% | 620 44% | 427 -1% | 402 -7% | |
| Load | 103 | 150 46% | 140 36% | 145 41% | 97 -6% | 111 8% | 153 49% |
| WiFi | 580 | ||||||
| H.264 | 604 |
Pro
Contra
Hay bastantes dispositivos entre los que elegir: ¿Debería llevarme el estiloso Ultrabook XPS 13 con su delgadísimo bisel, o el tablet Surface Pro 4? O claramente: ¿XPS 13 FHD vs. XPS 13 QHD? La decisión no depende de la potencia de cálculo, tanto el XPS como el Surface calculan al mismo alto nivel sin ralentización alguna. La diferencia de rendimiento de la versión más económica Core i5 se puede desdeñar a nuestro parecer.
La menor duración de la versión del XPS 13 i7/QHD respecto al modelo hermano con i5/FHD y la comparación con el mercado hablan en su contra. 5:30 horas es demasiado corto para un Ultrabook premium. Detalles como el control de iluminación también usado por PWM, las pocas opciones de mantenimiento y la mala webcam son ciertamente dignas de crítica. Mantendremos a nuestros lectores al día sobre el Content Adaptive Brightness Control (CABC).
Muchos argumentos hablan en pro del XPS 13 - incluyendo la versión i5 - como aparece en la lista de Pros. Mencionamos aquí el chasis de gran calidad con el delgado bisel, al igual que el rendimiento relativamente bueno bajo carga, el quedo desarrollo de ruido y el panel de gran contraste y resolución. El comprador potencial tendrá que decidir si eso es necesario o no. El manejo táctil también funciona tan impecablemente como siempre, y lo mismo cabe decirse del teclado y el ClickPad.
Por 1549 Euros ( bruto, sin incluir gastos de envío o similares), el cliente se lleva un subportátil sofisticado que puede ser uno de los mejores. El anterior modelo de 2015 con i7-5500U y 256 GB de SSD sigue fuerte en el mercado, y se vende desde 1500 Euros. Aunque la nueva versión no trae un procesador/gráfica extremadamente más rápidos, tiene Thunderbolt 3 en USB Type C combinado con USB 3.1 Gen 2. Por ello no hay mucho que hable a favor de comprar el anterior modelo del 2015; el usuario estará más preparado para el futuro con las próximas opciones de anclaje por Thunderbolt 3.
Ésta es una versión acortada del análisis original. Puedes leer el análisis completo en inglés aquí.
Dell XPS 13 2016 i7 256GB QHD
-
02/16/2016 v5(old)
Sebastian Jentsch