 Deutsch
 English
 Español
 Français
 Italiano
 Nederlands
 Polski
 Português
 Русский
 Türkçe
 Svenska
 Chinese
 Magyar
Breve análisis del Gigabyte P55W v5

| |||||||||||||||||||||||||
iluminación: 89 %
Brillo con batería: 254 cd/m²
Contraste: 907:1 (Negro: 0.28 cd/m²)
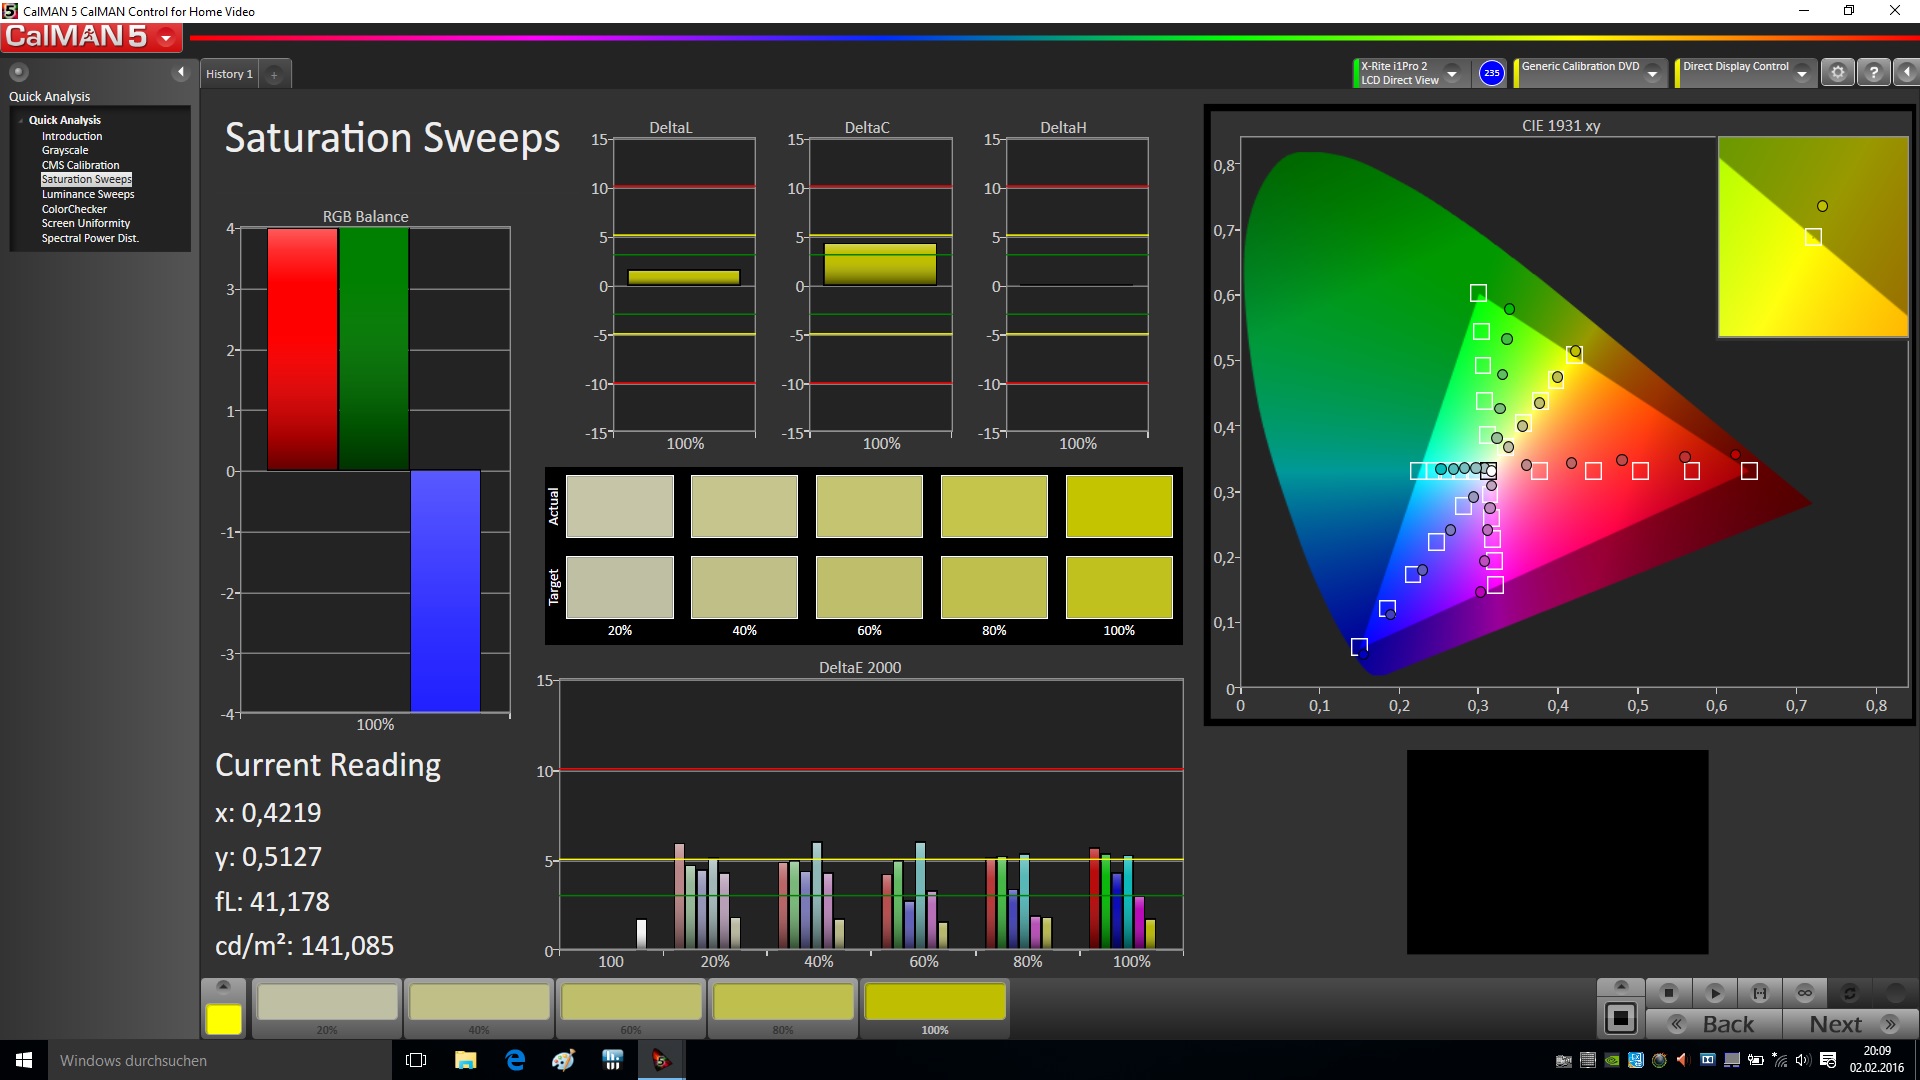
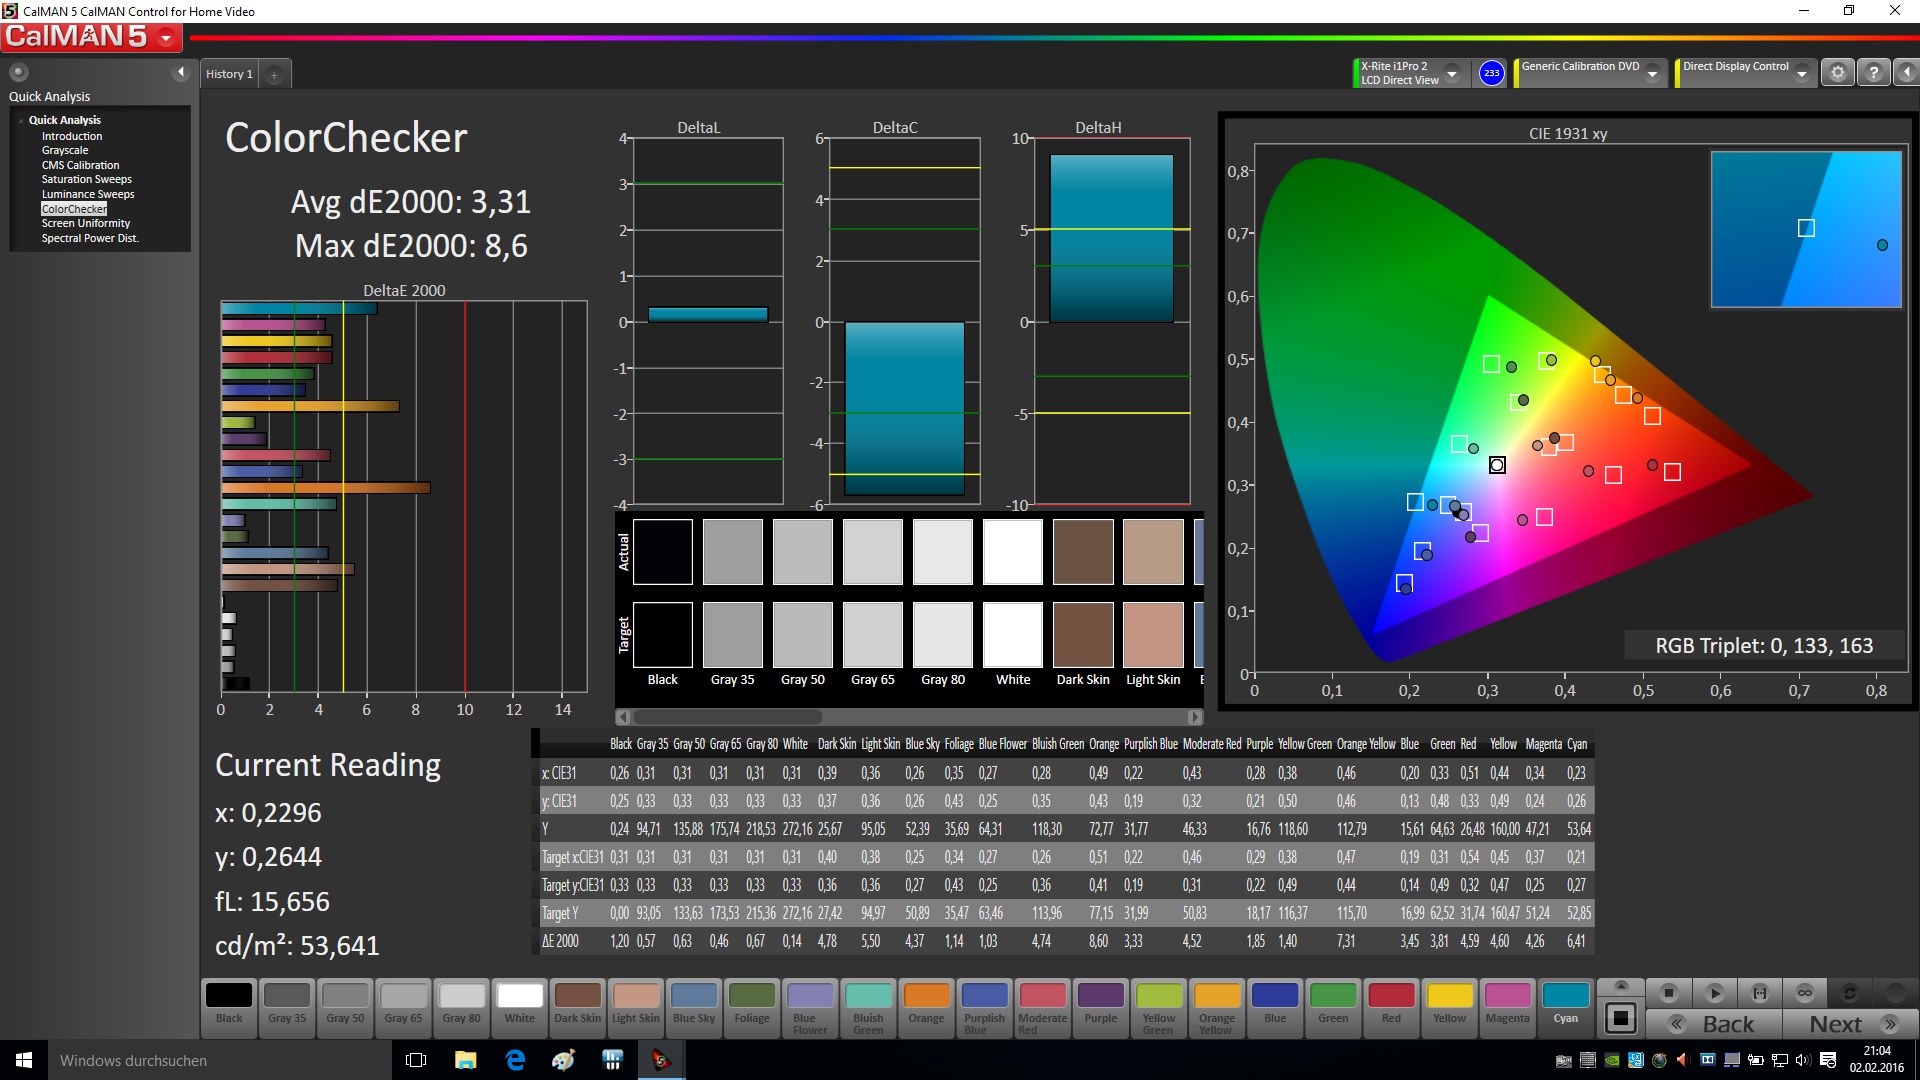
ΔE Color 4.28 | 0.5-29.43 Ø5
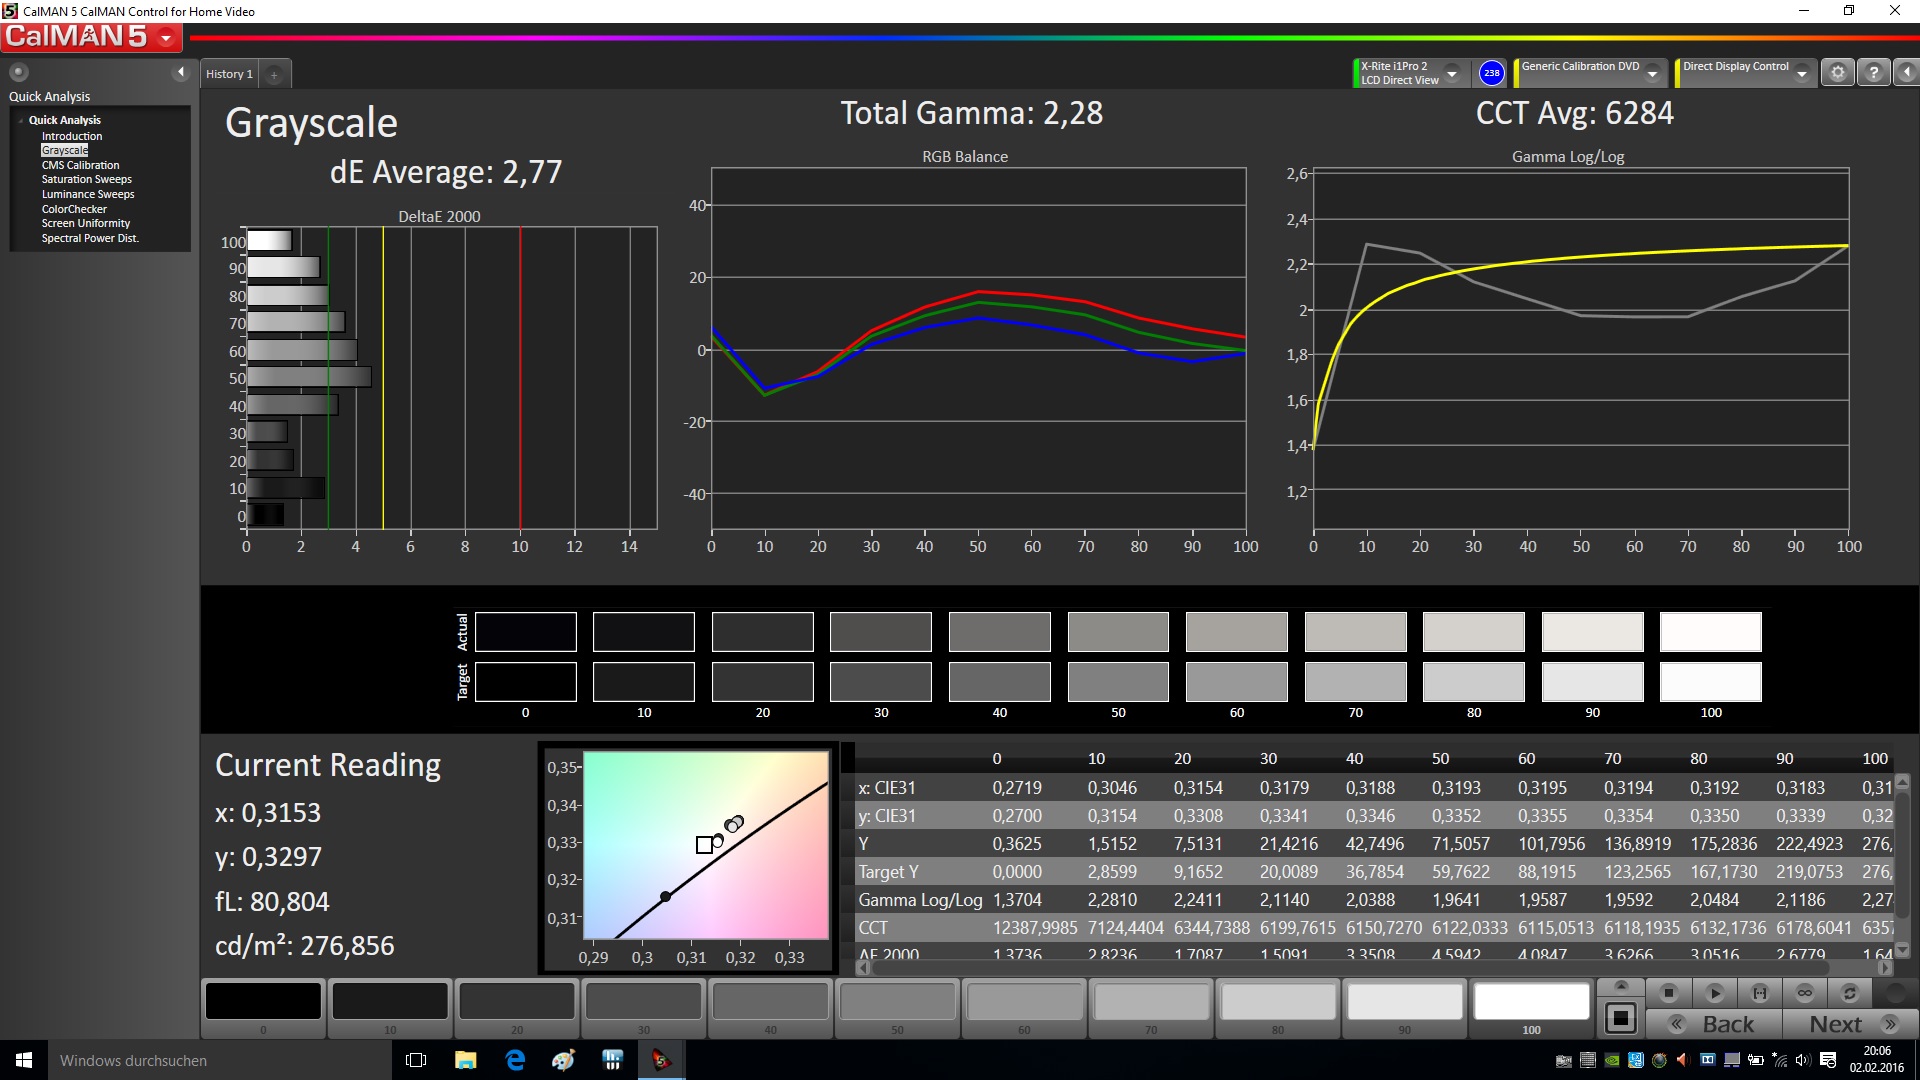
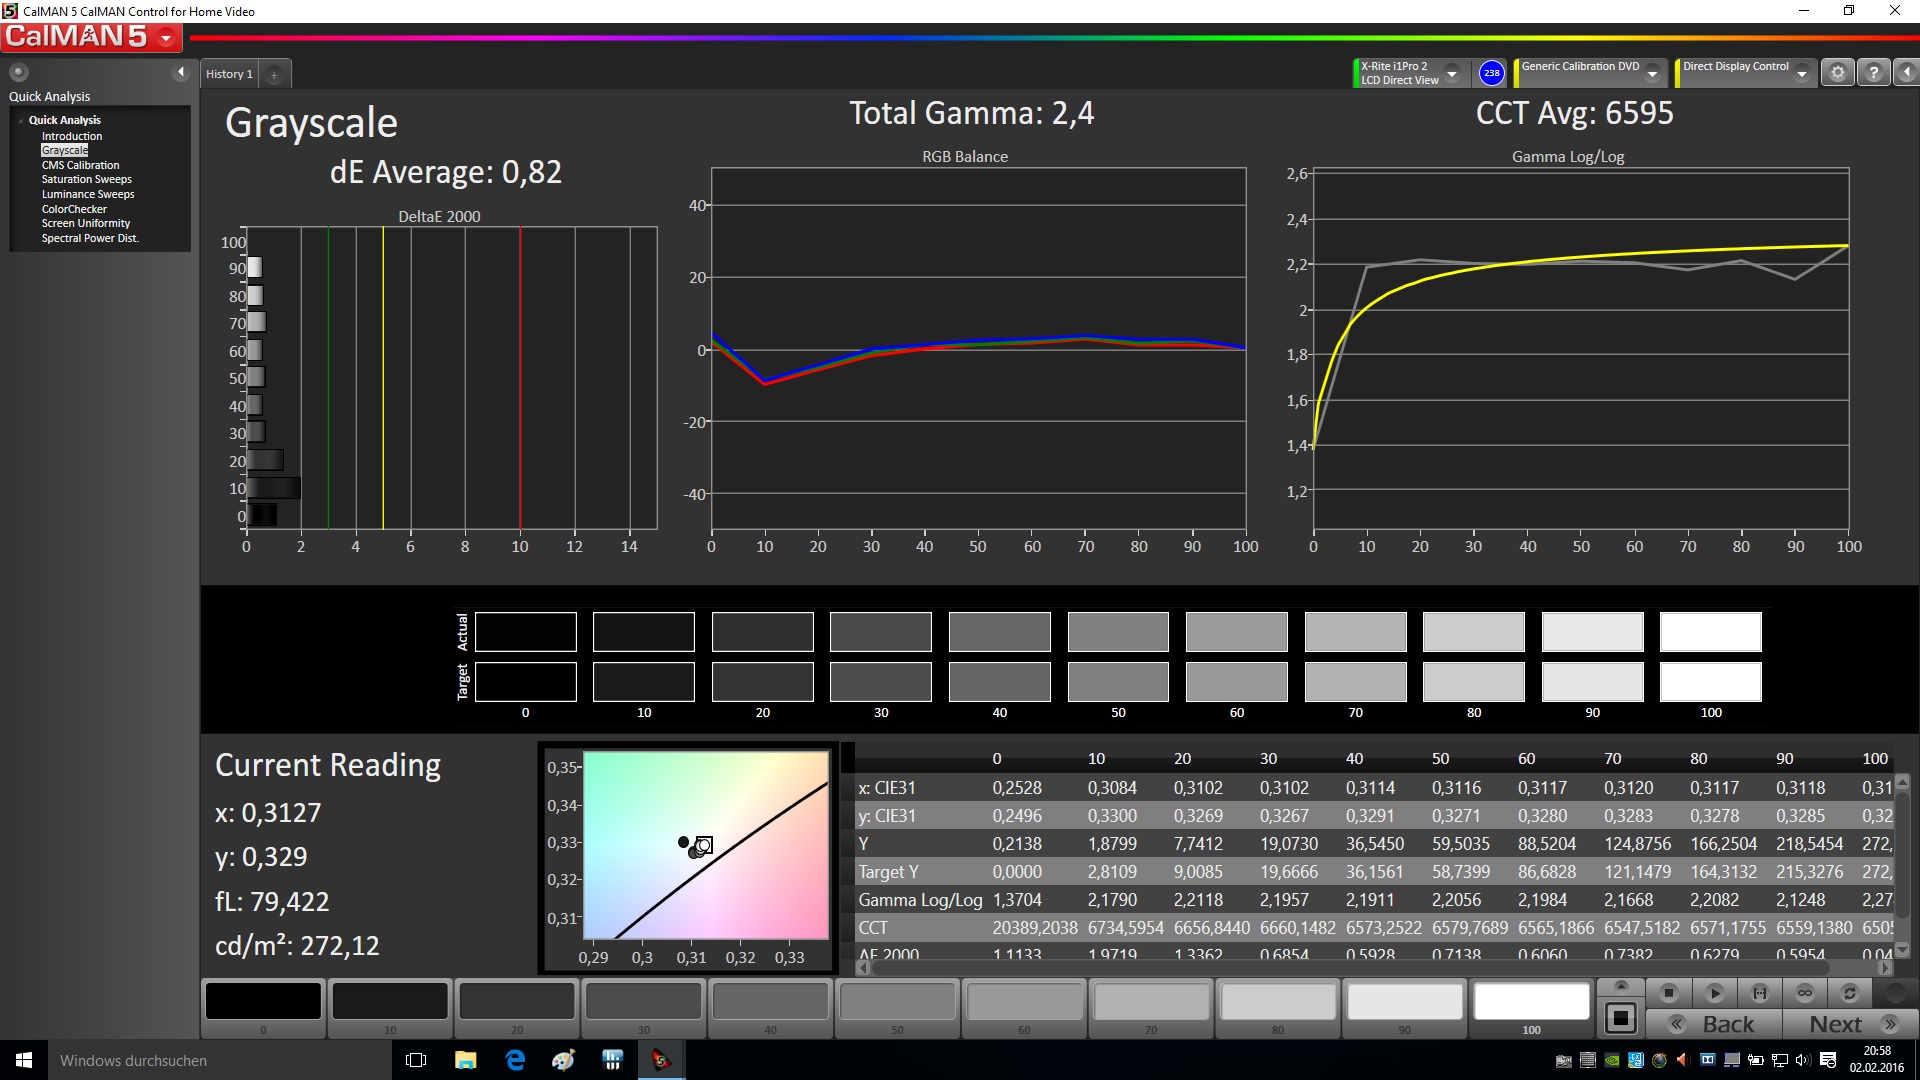
ΔE Greyscale 2.77 | 0.57-98 Ø5.3
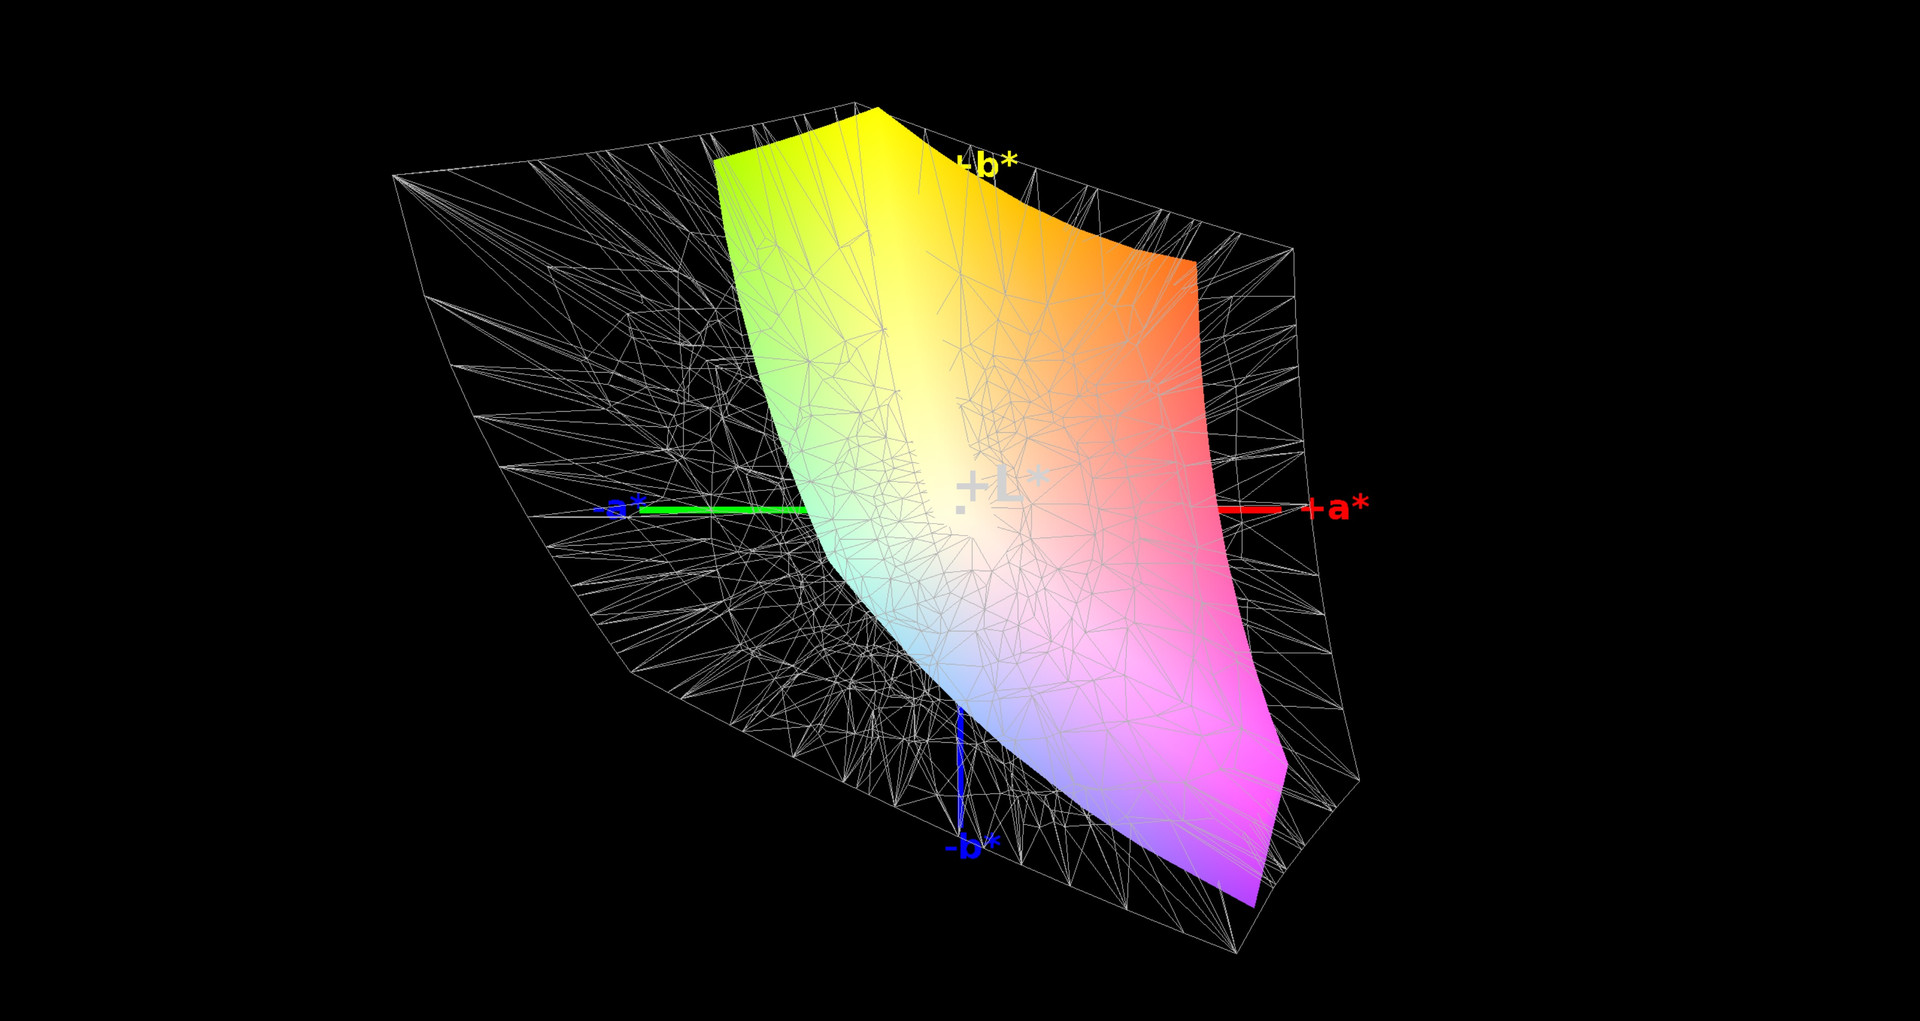
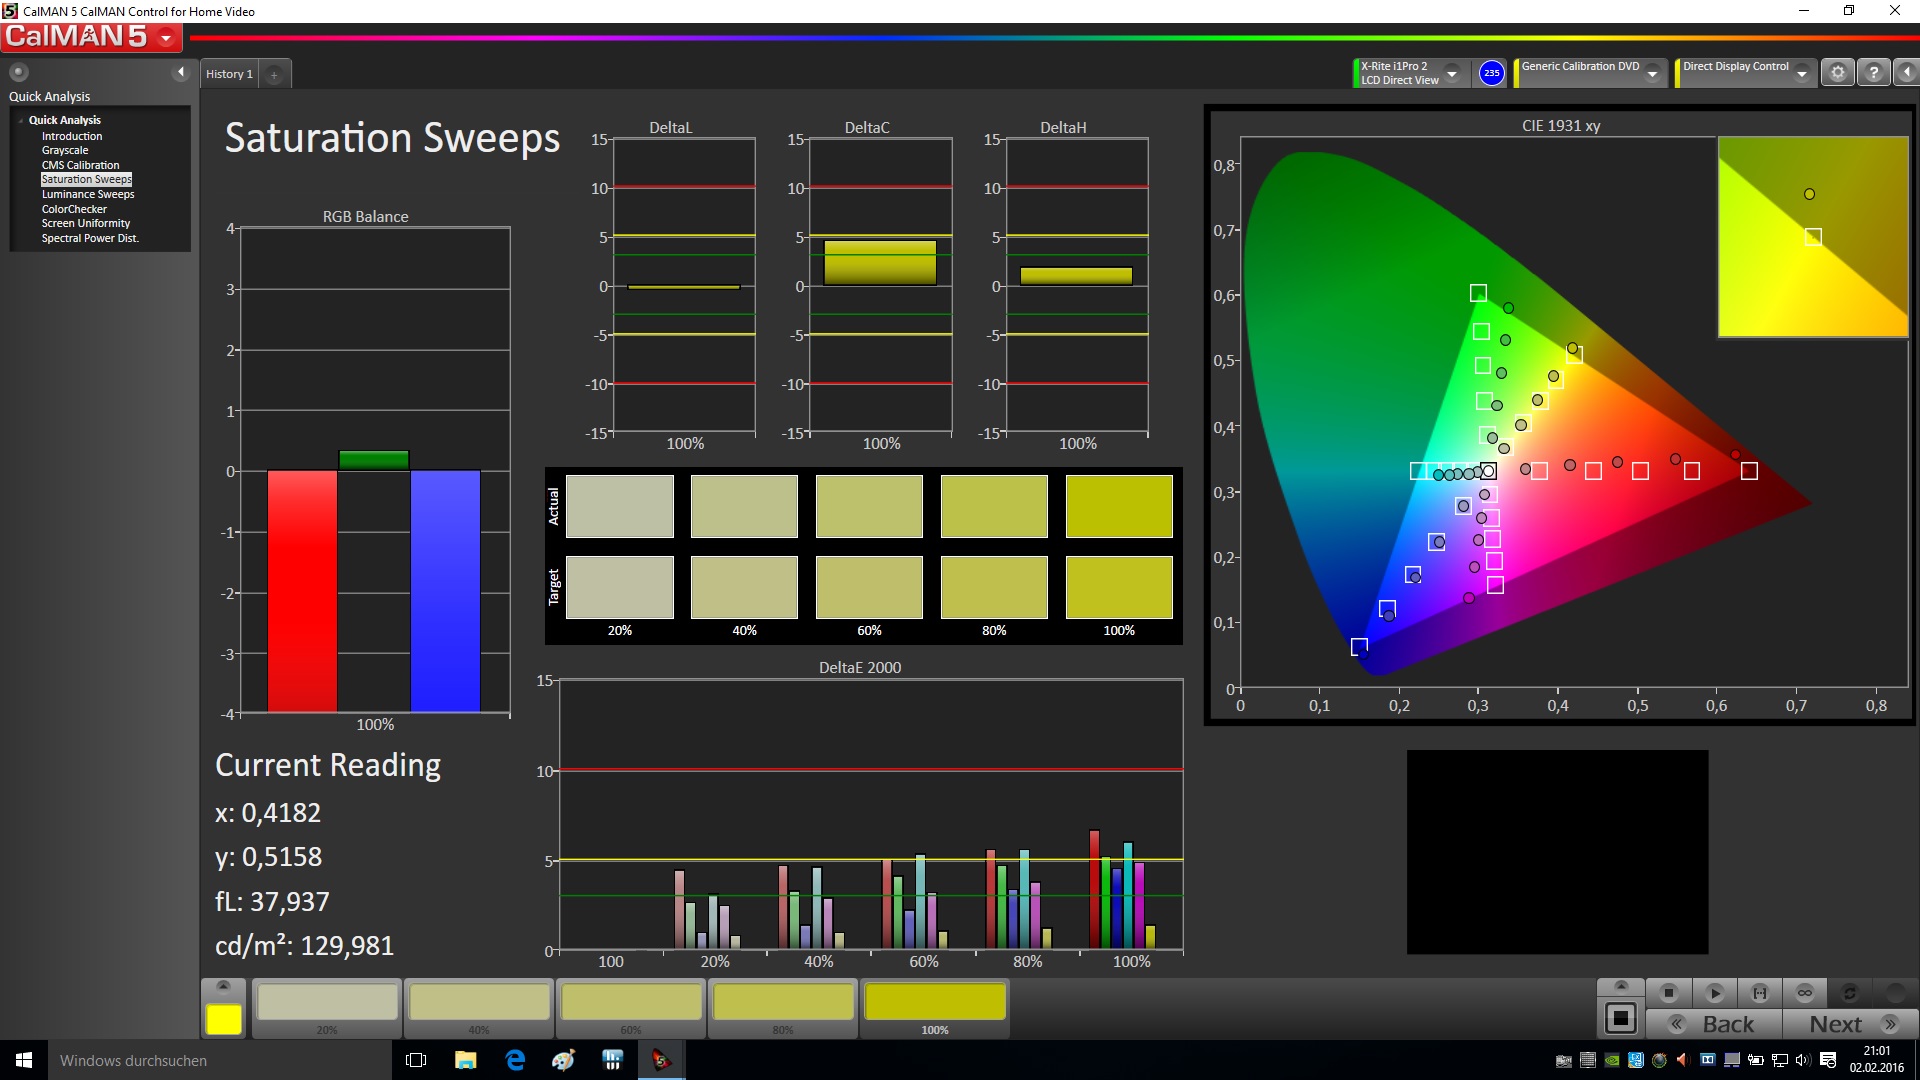
73% sRGB (Argyll 1.6.3 3D)
47% AdobeRGB 1998 (Argyll 1.6.3 3D)
51.2% AdobeRGB 1998 (Argyll 2.2.0 3D)
73.5% sRGB (Argyll 2.2.0 3D)
50.1% Display P3 (Argyll 2.2.0 3D)
Gamma: 2.28
| Gigabyte P55W v5 LG Philips LP156WF4-SPH1 | Gigabyte P55 V4 LG Philips, ID: LGD040E, Name: 156WF4 | MSI GS60-6QE4K16H21 Samsung 156FL02-P01 (SDC424B) | MSI GE62-6QD16H11 LG Philips LP156WF6 | Acer Predator 15 G9-591-74ZV LG LP156WF6-SPP1 (LGD04D5) | SCHENKER XMG P506 Samsung 156HL01-102 (SDC324C) | |
|---|---|---|---|---|---|---|
| Display | 18% | 7% | 22% | 24% | 33% | |
| Display P3 Coverage | 50.1 | 64 28% | 53.1 6% | 64.5 29% | 66 32% | 66.4 33% |
| sRGB Coverage | 73.5 | 80.6 10% | 80 9% | 85.6 16% | 85.8 17% | 96 31% |
| AdobeRGB 1998 Coverage | 51.2 | 58.9 15% | 54.8 7% | 62.5 22% | 62.7 22% | 68.6 34% |
| Response Times | 7% | 15% | 19% | |||
| Response Time Grey 50% / Grey 80% * | 44 ? | 40 ? 9% | 31 ? 30% | 31 ? 30% | ||
| Response Time Black / White * | 27 ? | 26 ? 4% | 27 ? -0% | 25 ? 7% | ||
| PWM Frequency | 1316 ? | |||||
| Screen | 7% | -37% | 10% | 5% | -4% | |
| Brightness middle | 254 | 262.3 3% | 212 -17% | 300 18% | 310 22% | 310 22% |
| Brightness | 267 | 265 -1% | 197 -26% | 291 9% | 287 7% | 299 12% |
| Brightness Distribution | 89 | 89 0% | 78 -12% | 88 -1% | 86 -3% | 84 -6% |
| Black Level * | 0.28 | 0.259 7% | 0.49 -75% | 0.32 -14% | 0.36 -29% | 0.35 -25% |
| Contrast | 907 | 1013 12% | 433 -52% | 938 3% | 861 -5% | 886 -2% |
| Colorchecker dE 2000 * | 4.28 | 4.29 -0% | 7.8 -82% | 3.51 18% | 3.83 11% | 4.1 4% |
| Colorchecker dE 2000 max. * | 10.6 | 8.72 18% | ||||
| Greyscale dE 2000 * | 2.77 | 2.28 18% | 5.23 -89% | 2.52 9% | 2.53 9% | 5.7 -106% |
| Gamma | 2.28 96% | 2.31 95% | 3.05 72% | 2.38 92% | 2.42 91% | 2.53 87% |
| CCT | 6284 103% | 6350 102% | 6693 97% | 6759 96% | 6934 94% | 7454 87% |
| Color Space (Percent of AdobeRGB 1998) | 47 | 53 13% | 50 6% | 56 19% | 56 19% | 63 34% |
| Color Space (Percent of sRGB) | 73 | 80.3 10% | 80 10% | 86 18% | 86 18% | 96 32% |
| Media total (Programa/Opciones) | 13% /
10% | -8% /
-22% | 16% /
13% | 16% /
11% | 15% /
5% |
* ... más pequeño es mejor


Parpadeo de Pantalla / PWM (Pulse-Width Modulation)
| Parpadeo de Pantalla / PWM no detectado | 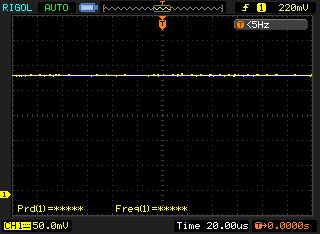 | ||
Comparación: 53 % de todos los dispositivos testados no usaron PWM para atenuar el display. Si se usó, medimos una media de 17900 (mínimo: 5 - máxmo: 3846000) Hz. | |||
Tiempos de respuesta del display
| ↔ Tiempo de respuesta de Negro a Blanco | ||
|---|---|---|
| 27 ms ... subida ↗ y bajada ↘ combinada | ↗ 7 ms subida | 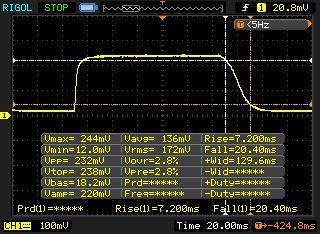 |
| ↘ 20 ms bajada | ||
| La pantalla mostró tiempos de respuesta relativamente lentos en nuestros tests pero podría ser demasiado lenta para los jugones. En comparación, todos los dispositivos de prueba van de ##min### (mínimo) a 240 (máximo) ms. » 63 % de todos los dispositivos son mejores. Eso quiere decir que el tiempo de respuesta es peor que la media (21.5 ms) de todos los dispositivos testados. | ||
| ↔ Tiempo de respuesta 50% Gris a 80% Gris | ||
| 44 ms ... subida ↗ y bajada ↘ combinada | ↗ 18 ms subida |  |
| ↘ 26 ms bajada | ||
| La pantalla mostró tiempos de respuesta lentos en nuestros tests y podría ser demasiado lenta para los jugones. En comparación, todos los dispositivos de prueba van de ##min### (mínimo) a 636 (máximo) ms. » 70 % de todos los dispositivos son mejores. Eso quiere decir que el tiempo de respuesta es peor que la media (33.7 ms) de todos los dispositivos testados. | ||

| Cinebench R10 | |
| Rendering Multiple CPUs 32Bit (ordenar por valor) | |
| Gigabyte P55W v5 | |
| Gigabyte P55 V4 | |
| MSI GS60-6QE4K16H21 | |
| MSI GE62-6QD16H11 | |
| Acer Predator 15 G9-591-74ZV | |
| SCHENKER XMG P506 | |
| Rendering Single 32Bit (ordenar por valor) | |
| Gigabyte P55W v5 | |
| Gigabyte P55 V4 | |
| MSI GS60-6QE4K16H21 | |
| MSI GE62-6QD16H11 | |
| Acer Predator 15 G9-591-74ZV | |
| SCHENKER XMG P506 | |
| Geekbench 3 | |
| 32 Bit Multi-Core Score (ordenar por valor) | |
| Gigabyte P55W v5 | |
| 32 Bit Single-Core Score (ordenar por valor) | |
| Gigabyte P55W v5 | |
| Sunspider - 1.0 Total Score (ordenar por valor) | |
| Gigabyte P55W v5 | |
| MSI GS60-6QE4K16H21 | |
| JetStream 1.1 - Total Score (ordenar por valor) | |
| Gigabyte P55W v5 | |
| Mozilla Kraken 1.1 - Total (ordenar por valor) | |
| Gigabyte P55W v5 | |
| Octane V2 - Total Score (ordenar por valor) | |
| Gigabyte P55W v5 | |
| Peacekeeper - --- (ordenar por valor) | |
| Gigabyte P55W v5 | |
* ... más pequeño es mejor
| PCMark 7 Score | 5124 puntos | |
| PCMark 8 Home Score Accelerated v2 | 3832 puntos | |
| PCMark 8 Creative Score Accelerated v2 | 4579 puntos | |
| PCMark 8 Work Score Accelerated v2 | 4852 puntos | |
ayuda | ||

| 3DMark 06 Standard Score | 24611 puntos | |
| 3DMark 11 Performance | 8932 puntos | |
| 3DMark Ice Storm Standard Score | 64844 puntos | |
| 3DMark Cloud Gate Standard Score | 20087 puntos | |
| 3DMark Fire Strike Score | 6565 puntos | |
ayuda | ||
| 3DMark 11 - 1280x720 Performance (ordenar por valor) | |
| Gigabyte P55W v5 | |
| Gigabyte P55 V4 | |
| MSI GS60-6QE4K16H21 | |
| MSI GE62-6QD16H11 | |
| Acer Predator 15 G9-591-74ZV | |
| SCHENKER XMG P506 | |
| 3DMark | |
| 1280x720 Ice Storm Standard Score (ordenar por valor) | |
| Gigabyte P55W v5 | |
| Gigabyte P55 V4 | |
| MSI GS60-6QE4K16H21 | |
| MSI GE62-6QD16H11 | |
| Acer Predator 15 G9-591-74ZV | |
| SCHENKER XMG P506 | |
| 1280x720 Cloud Gate Standard Score (ordenar por valor) | |
| Gigabyte P55W v5 | |
| Gigabyte P55 V4 | |
| MSI GS60-6QE4K16H21 | |
| MSI GE62-6QD16H11 | |
| Acer Predator 15 G9-591-74ZV | |
| SCHENKER XMG P506 | |
| 1280x720 Sky Diver Score (ordenar por valor) | |
| Gigabyte P55W v5 | |
| Acer Predator 15 G9-591-74ZV | |
| SCHENKER XMG P506 | |
| 1920x1080 Fire Strike Score (ordenar por valor) | |
| Gigabyte P55W v5 | |
| Gigabyte P55 V4 | |
| MSI GS60-6QE4K16H21 | |
| MSI GE62-6QD16H11 | |
| Acer Predator 15 G9-591-74ZV | |
| SCHENKER XMG P506 | |
| 3DMark 06 - 1280x1024 Standard Score AA:0x AF:0x (ordenar por valor) | |
| Gigabyte P55W v5 | |
| Gigabyte P55 V4 | |
| bajo | medio | alto | ultra | |
| Tomb Raider (2013) | 278.8 | 233.7 | 186.8 | 87.5 |
| BioShock Infinite (2013) | 158.4 | 140.8 | 133.1 | 69.7 |
| Dirt Rally (2015) | 167.7 | 92.4 | 77.3 | 57.3 |
| Batman: Arkham Knight (2015) | 91 | 84 | 57 | 36 |
| Anno 2205 (2015) | 117.5 | 102.6 | 54.9 | 17.4 |
| Call of Duty: Black Ops 3 (2015) | 100.1 | 97 | 59.6 | 55.7 |
| Just Cause 3 (2015) | 85.3 | 77.7 | 56.4 | 47.8 |
| Rise of the Tomb Raider (2016) | 102.1 | 70.4 | 44.6 | 37.1 |
| XCOM 2 (2016) | 66.2 | 47 | 34.8 | 16.5 |
| Tomb Raider - 1920x1080 Ultra Preset AA:FX AF:16x (ordenar por valor) | |
| Gigabyte P55W v5 | |
| Gigabyte P55 V4 | |
| MSI GE62-6QD16H11 | |
| BioShock Infinite - 1920x1080 Ultra Preset, DX11 (DDOF) (ordenar por valor) | |
| Gigabyte P55W v5 | |
| Gigabyte P55 V4 | |
| Dirt Rally - 1920x1080 Ultra Preset AA:4x MS (ordenar por valor) | |
| Gigabyte P55W v5 | |
| MSI GE62-6QD16H11 | |
| SCHENKER XMG P506 | |
| Batman: Arkham Knight - 1920x1080 High / On AA:SM AF:16x (ordenar por valor) | |
| Gigabyte P55W v5 | |
| SCHENKER XMG P506 | |
| Anno 2205 - 1920x1080 High Preset AA:4x (ordenar por valor) | |
| Gigabyte P55W v5 | |
| MSI GS60-6QE4K16H21 | |
| Acer Predator 15 G9-591-74ZV | |
| Call of Duty: Black Ops 3 - 1920x1080 Extra / On AA:T2x SM (ordenar por valor) | |
| Gigabyte P55W v5 | |
| Acer Predator 15 G9-591-74ZV | |
| Just Cause 3 - 1920x1080 Very High / On AA:SM AF:16x (ordenar por valor) | |
| Gigabyte P55W v5 | |
| Rise of the Tomb Raider - 1920x1080 Very High Preset AA:FX AF:16x (ordenar por valor) | |
| Gigabyte P55W v5 | |
| XCOM 2 - 1920x1080 High Preset AA:FX AF:8x (ordenar por valor) | |
| Gigabyte P55W v5 | |
Ruido
| Ocioso |
| 33 / 34 / 35 dB(A) |
| DVD |
| 36 / dB(A) |
| Carga |
| 43 / 49 dB(A) |
 | ||
30 dB silencioso 40 dB(A) audible 50 dB(A) ruidosamente alto |
||
min: | ||
| Gigabyte P55W v5 6700HQ, GeForce GTX 970M | Gigabyte P55 V4 5700HQ, GeForce GTX 970M | MSI GS60-6QE4K16H21 6700HQ, GeForce GTX 970M | MSI GE62-6QD16H11 6700HQ, GeForce GTX 960M | Acer Predator 15 G9-591-74ZV 6700HQ, GeForce GTX 980M | SCHENKER XMG P506 6700HQ, GeForce GTX 970M | |
|---|---|---|---|---|---|---|
| Noise | 9% | -3% | -0% | -3% | 1% | |
| Idle Minimum * | 33 | 28.8 13% | 35 -6% | 33 -0% | 31 6% | 30.8 7% |
| Idle Average * | 34 | 28.9 15% | 36 -6% | 34 -0% | 32 6% | 32.8 4% |
| Idle Maximum * | 35 | 29 17% | 37 -6% | 38 -9% | 42 -20% | 35.9 -3% |
| Load Average * | 43 | 39 9% | 40 7% | 42 2% | 47 -9% | 42.2 2% |
| Load Maximum * | 49 | 52.3 -7% | 50 -2% | 46 6% | 48 2% | 51 -4% |
* ... más pequeño es mejor
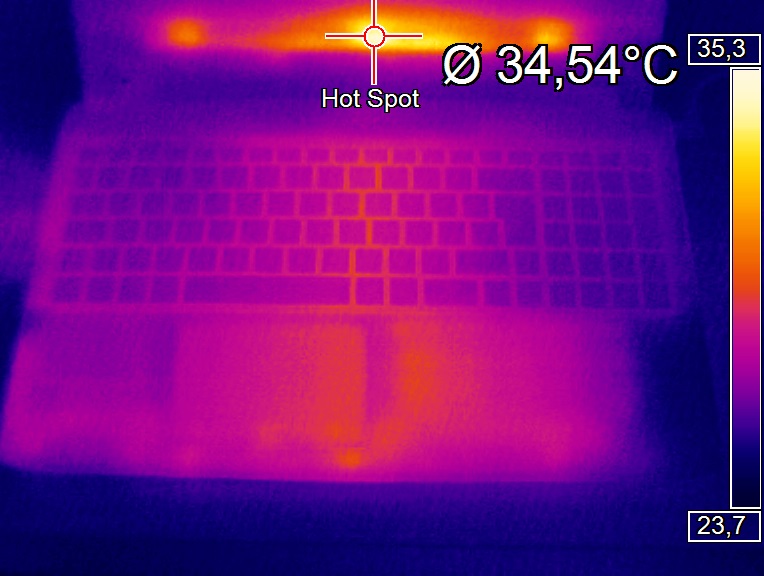
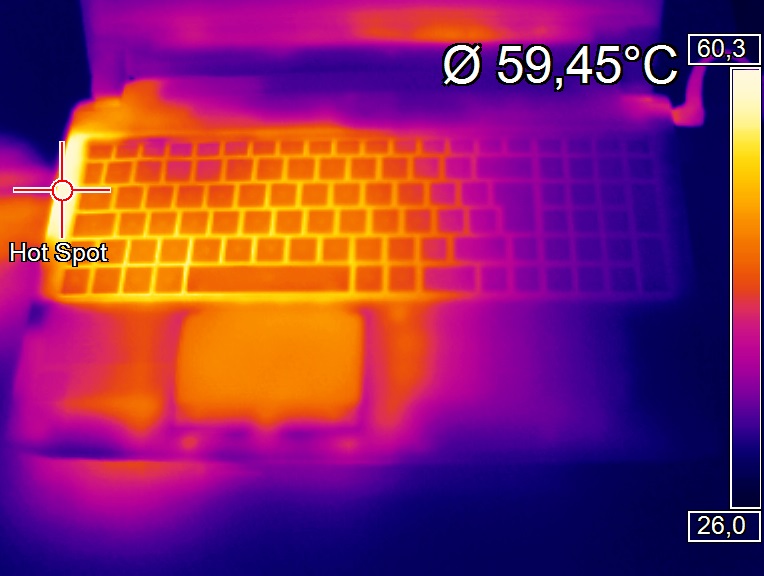
(-) The maximum temperature on the upper side is 50 °C / 122 F, compared to the average of 40.4 °C / 105 F, ranging from 21.2 to 68.8 °C for the class Gaming.
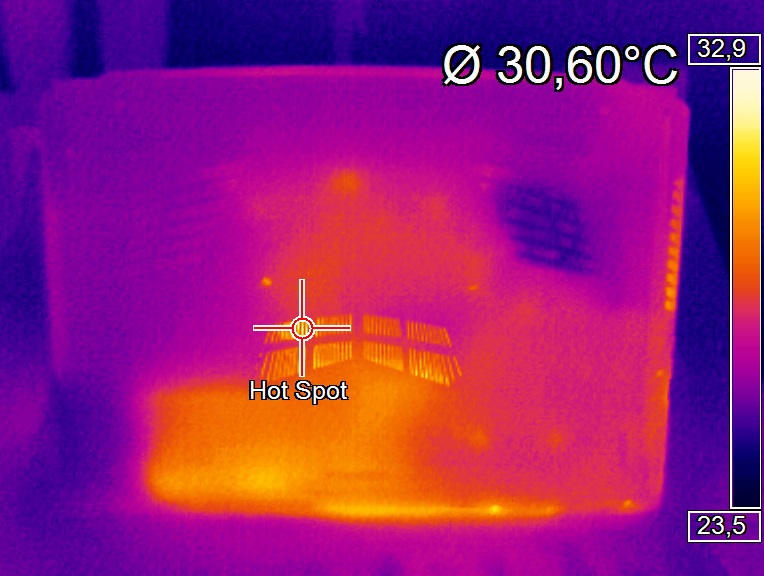
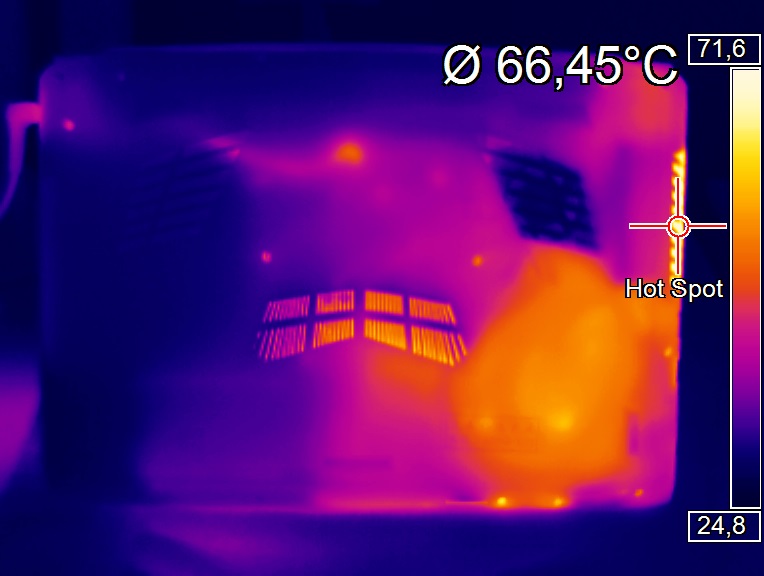
(-) The bottom heats up to a maximum of 57.7 °C / 136 F, compared to the average of 43.2 °C / 110 F
(+) In idle usage, the average temperature for the upper side is 25 °C / 77 F, compared to the device average of 33.8 °C / 93 F.
(-) The palmrests and touchpad can get very hot to the touch with a maximum of 45.4 °C / 113.7 F.
(-) The average temperature of the palmrest area of similar devices was 28.9 °C / 84 F (-16.5 °C / -29.7 F).
| Gigabyte P55W v5 6700HQ, GeForce GTX 970M | Gigabyte P55 V4 5700HQ, GeForce GTX 970M | MSI GS60-6QE4K16H21 6700HQ, GeForce GTX 970M | MSI GE62-6QD16H11 6700HQ, GeForce GTX 960M | Acer Predator 15 G9-591-74ZV 6700HQ, GeForce GTX 980M | SCHENKER XMG P506 6700HQ, GeForce GTX 970M | |
|---|---|---|---|---|---|---|
| Heat | -18% | -10% | -26% | -7% | -11% | |
| Maximum Upper Side * | 50 | 48.2 4% | 51.4 -3% | 53.3 -7% | 49.8 -0% | 49.3 1% |
| Maximum Bottom * | 57.7 | 50.2 13% | 68.9 -19% | 49.3 15% | 59.2 -3% | 60.4 -5% |
| Idle Upper Side * | 25.7 | 35.6 -39% | 27.1 -5% | 41.2 -60% | 32.2 -25% | 31.4 -22% |
| Idle Bottom * | 27.2 | 41.2 -51% | 30.4 -12% | 40.8 -50% | 26.9 1% | 32.3 -19% |
* ... más pequeño es mejor
| Off / Standby | |
| Ocioso | |
| Carga |
|
| Gigabyte P55W v5 6700HQ, GeForce GTX 970M | MSI GS60-6QE4K16H21 6700HQ, GeForce GTX 970M | MSI GE62-6QD16H11 6700HQ, GeForce GTX 960M | Acer Predator 15 G9-591-74ZV 6700HQ, GeForce GTX 980M | SCHENKER XMG P506 6700HQ, GeForce GTX 970M | |
|---|---|---|---|---|---|
| Power Consumption | -47% | -61% | -23% | -10% | |
| Idle Minimum * | 9 | 17 -89% | 20 -122% | 12 -33% | 10.5 -17% |
| Idle Average * | 13 | 22 -69% | 24 -85% | 16 -23% | 14.6 -12% |
| Idle Maximum * | 17 | 28 -65% | 30 -76% | 22 -29% | 20.7 -22% |
| Load Average * | 81 | 91 -12% | 97 -20% | 100 -23% | 81.8 -1% |
| Load Maximum * | 152 | 149 2% | 155 -2% | 162 -7% | 146.3 4% |
* ... más pequeño es mejor
| Gigabyte P55W v5 61 Wh | Gigabyte P55 V4 57 Wh | MSI GS60-6QE4K16H21 47 Wh | MSI GE62-6QD16H11 53 Wh | Acer Predator 15 G9-591-74ZV Wh | SCHENKER XMG P506 60 Wh | |
|---|---|---|---|---|---|---|
| Duración de Batería | -15% | -51% | -55% | 22% | -22% | |
| Reader / Idle | 604 | 517 -14% | 213 -65% | 184 -70% | 670 11% | 314 -48% |
| H.264 | 332 | 137 -59% | 442 33% | |||
| WiFi v1.3 | 348 | 231 -34% | 157 -55% | 149 -57% | ||
| Load | 93 | 95 2% | 61 -34% | 60 -35% | 113 22% | 98 5% |
Pro
Contra
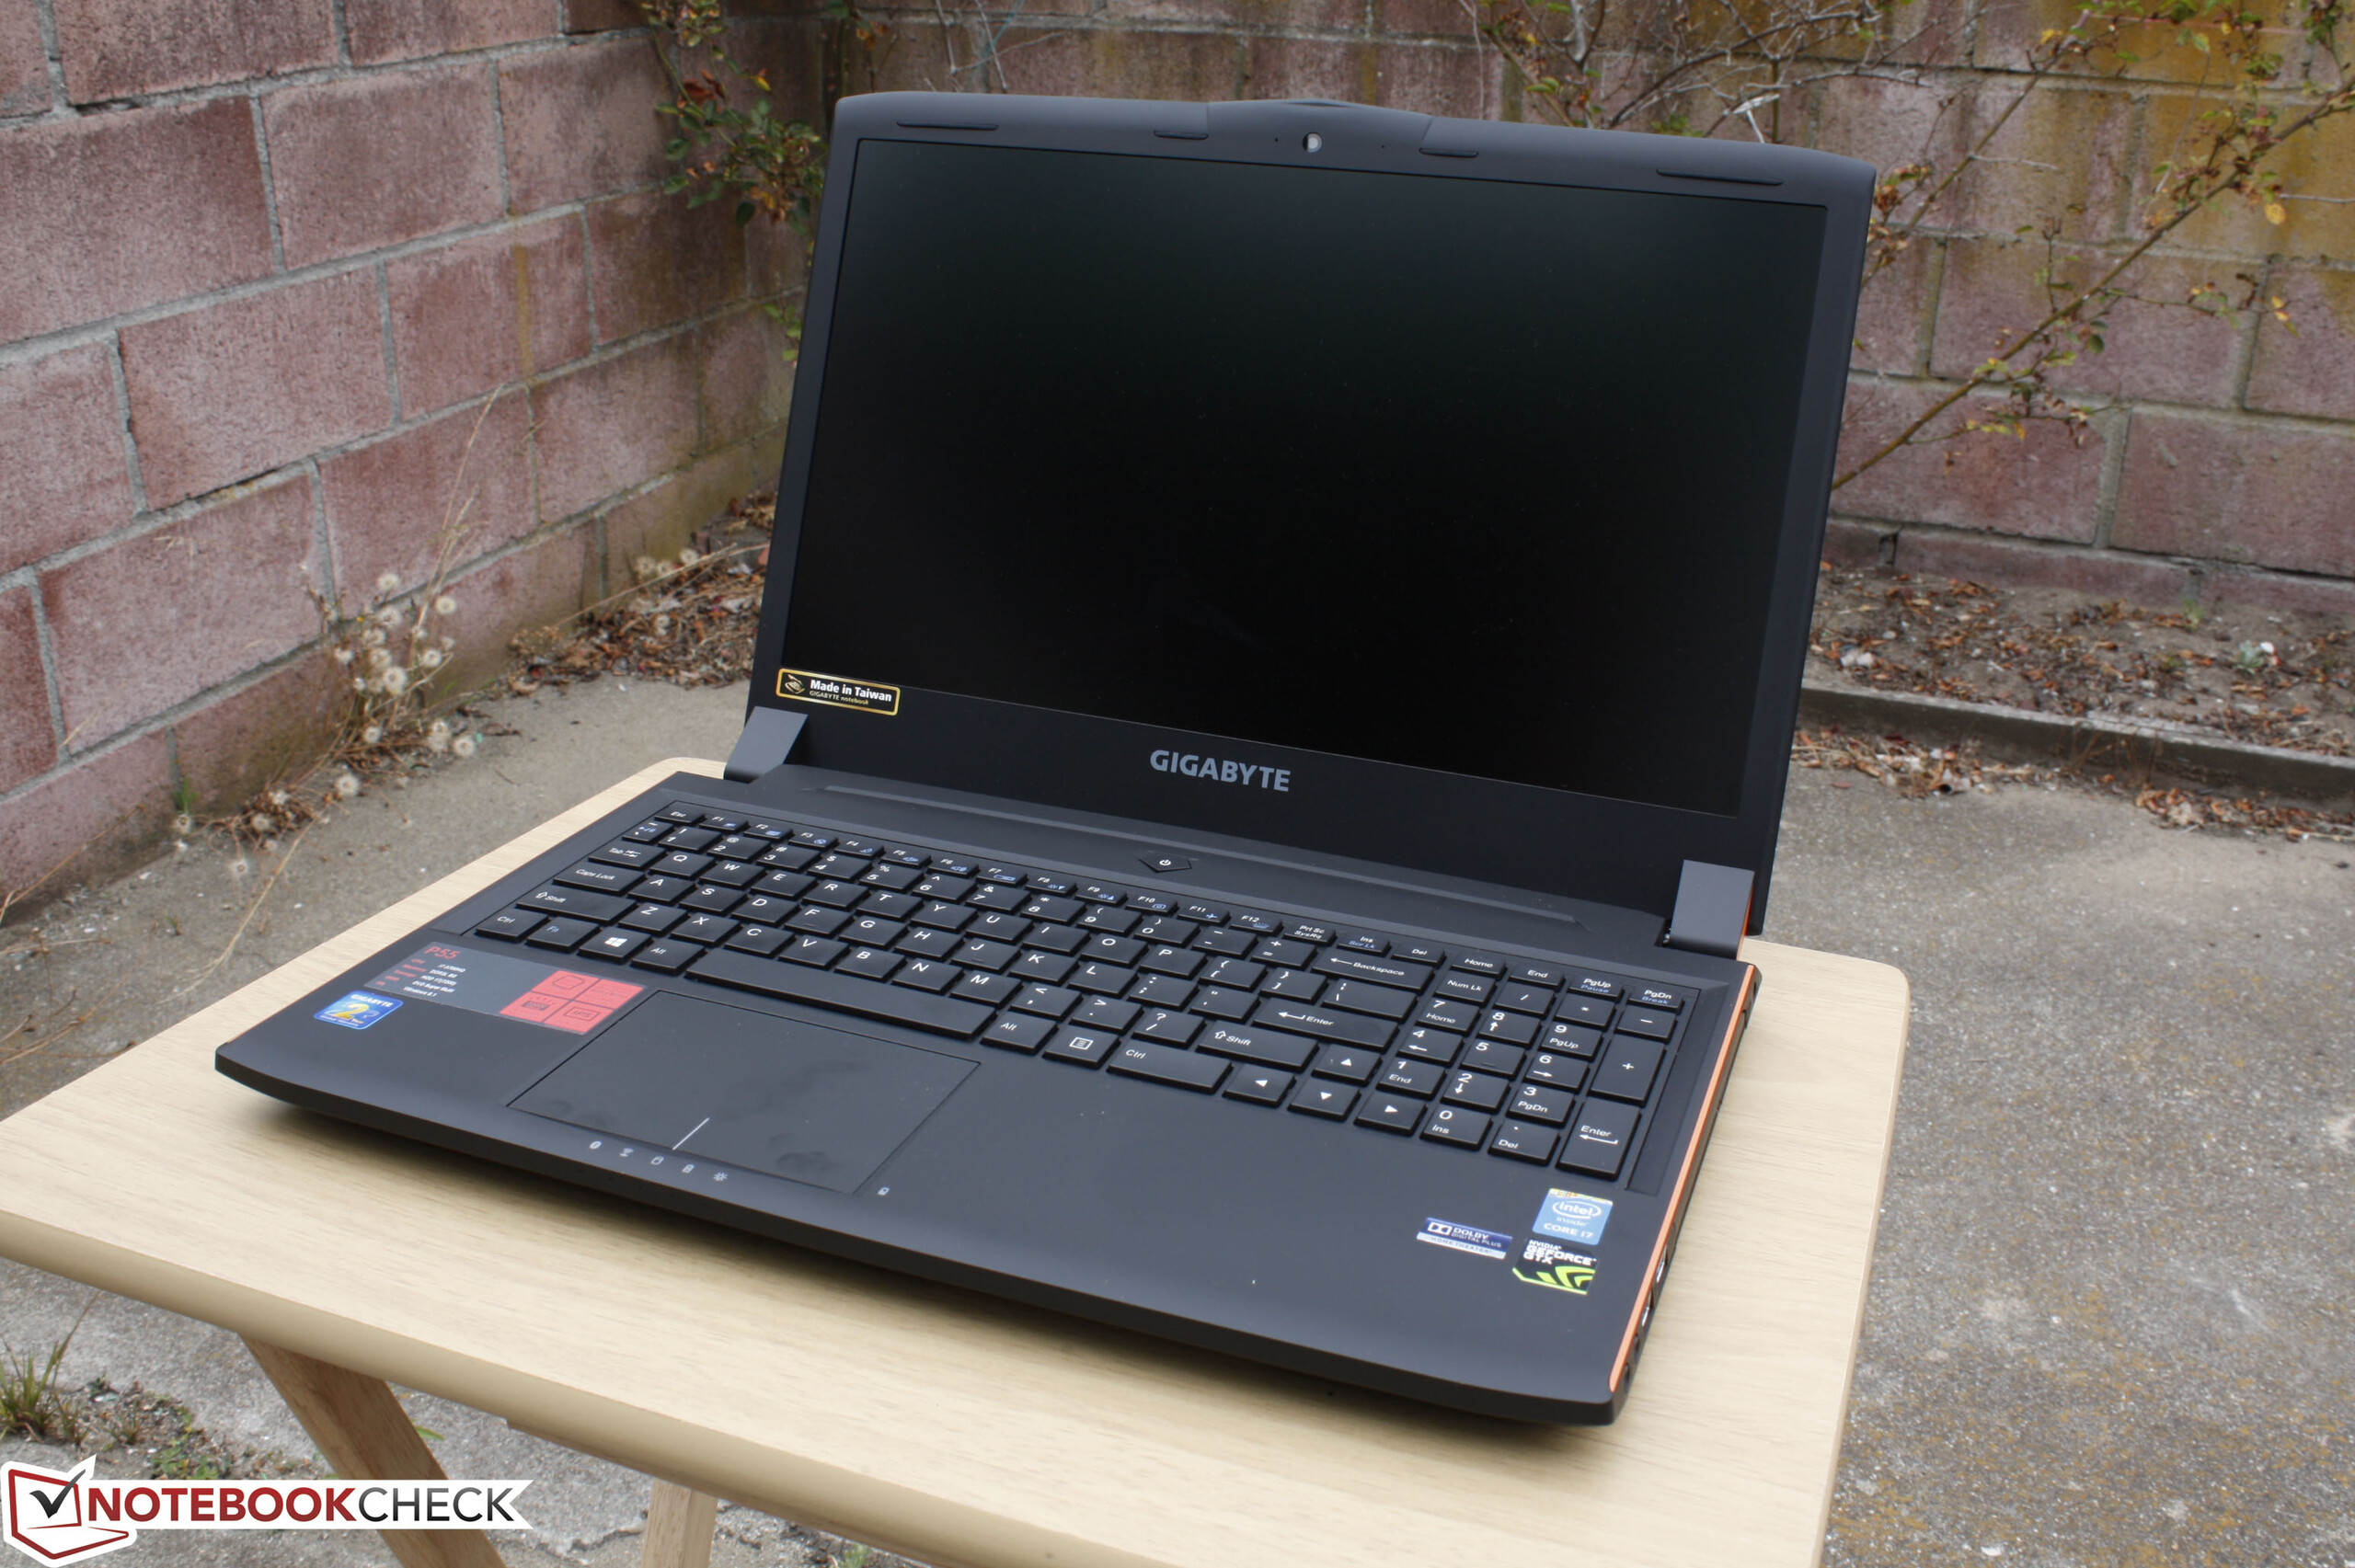
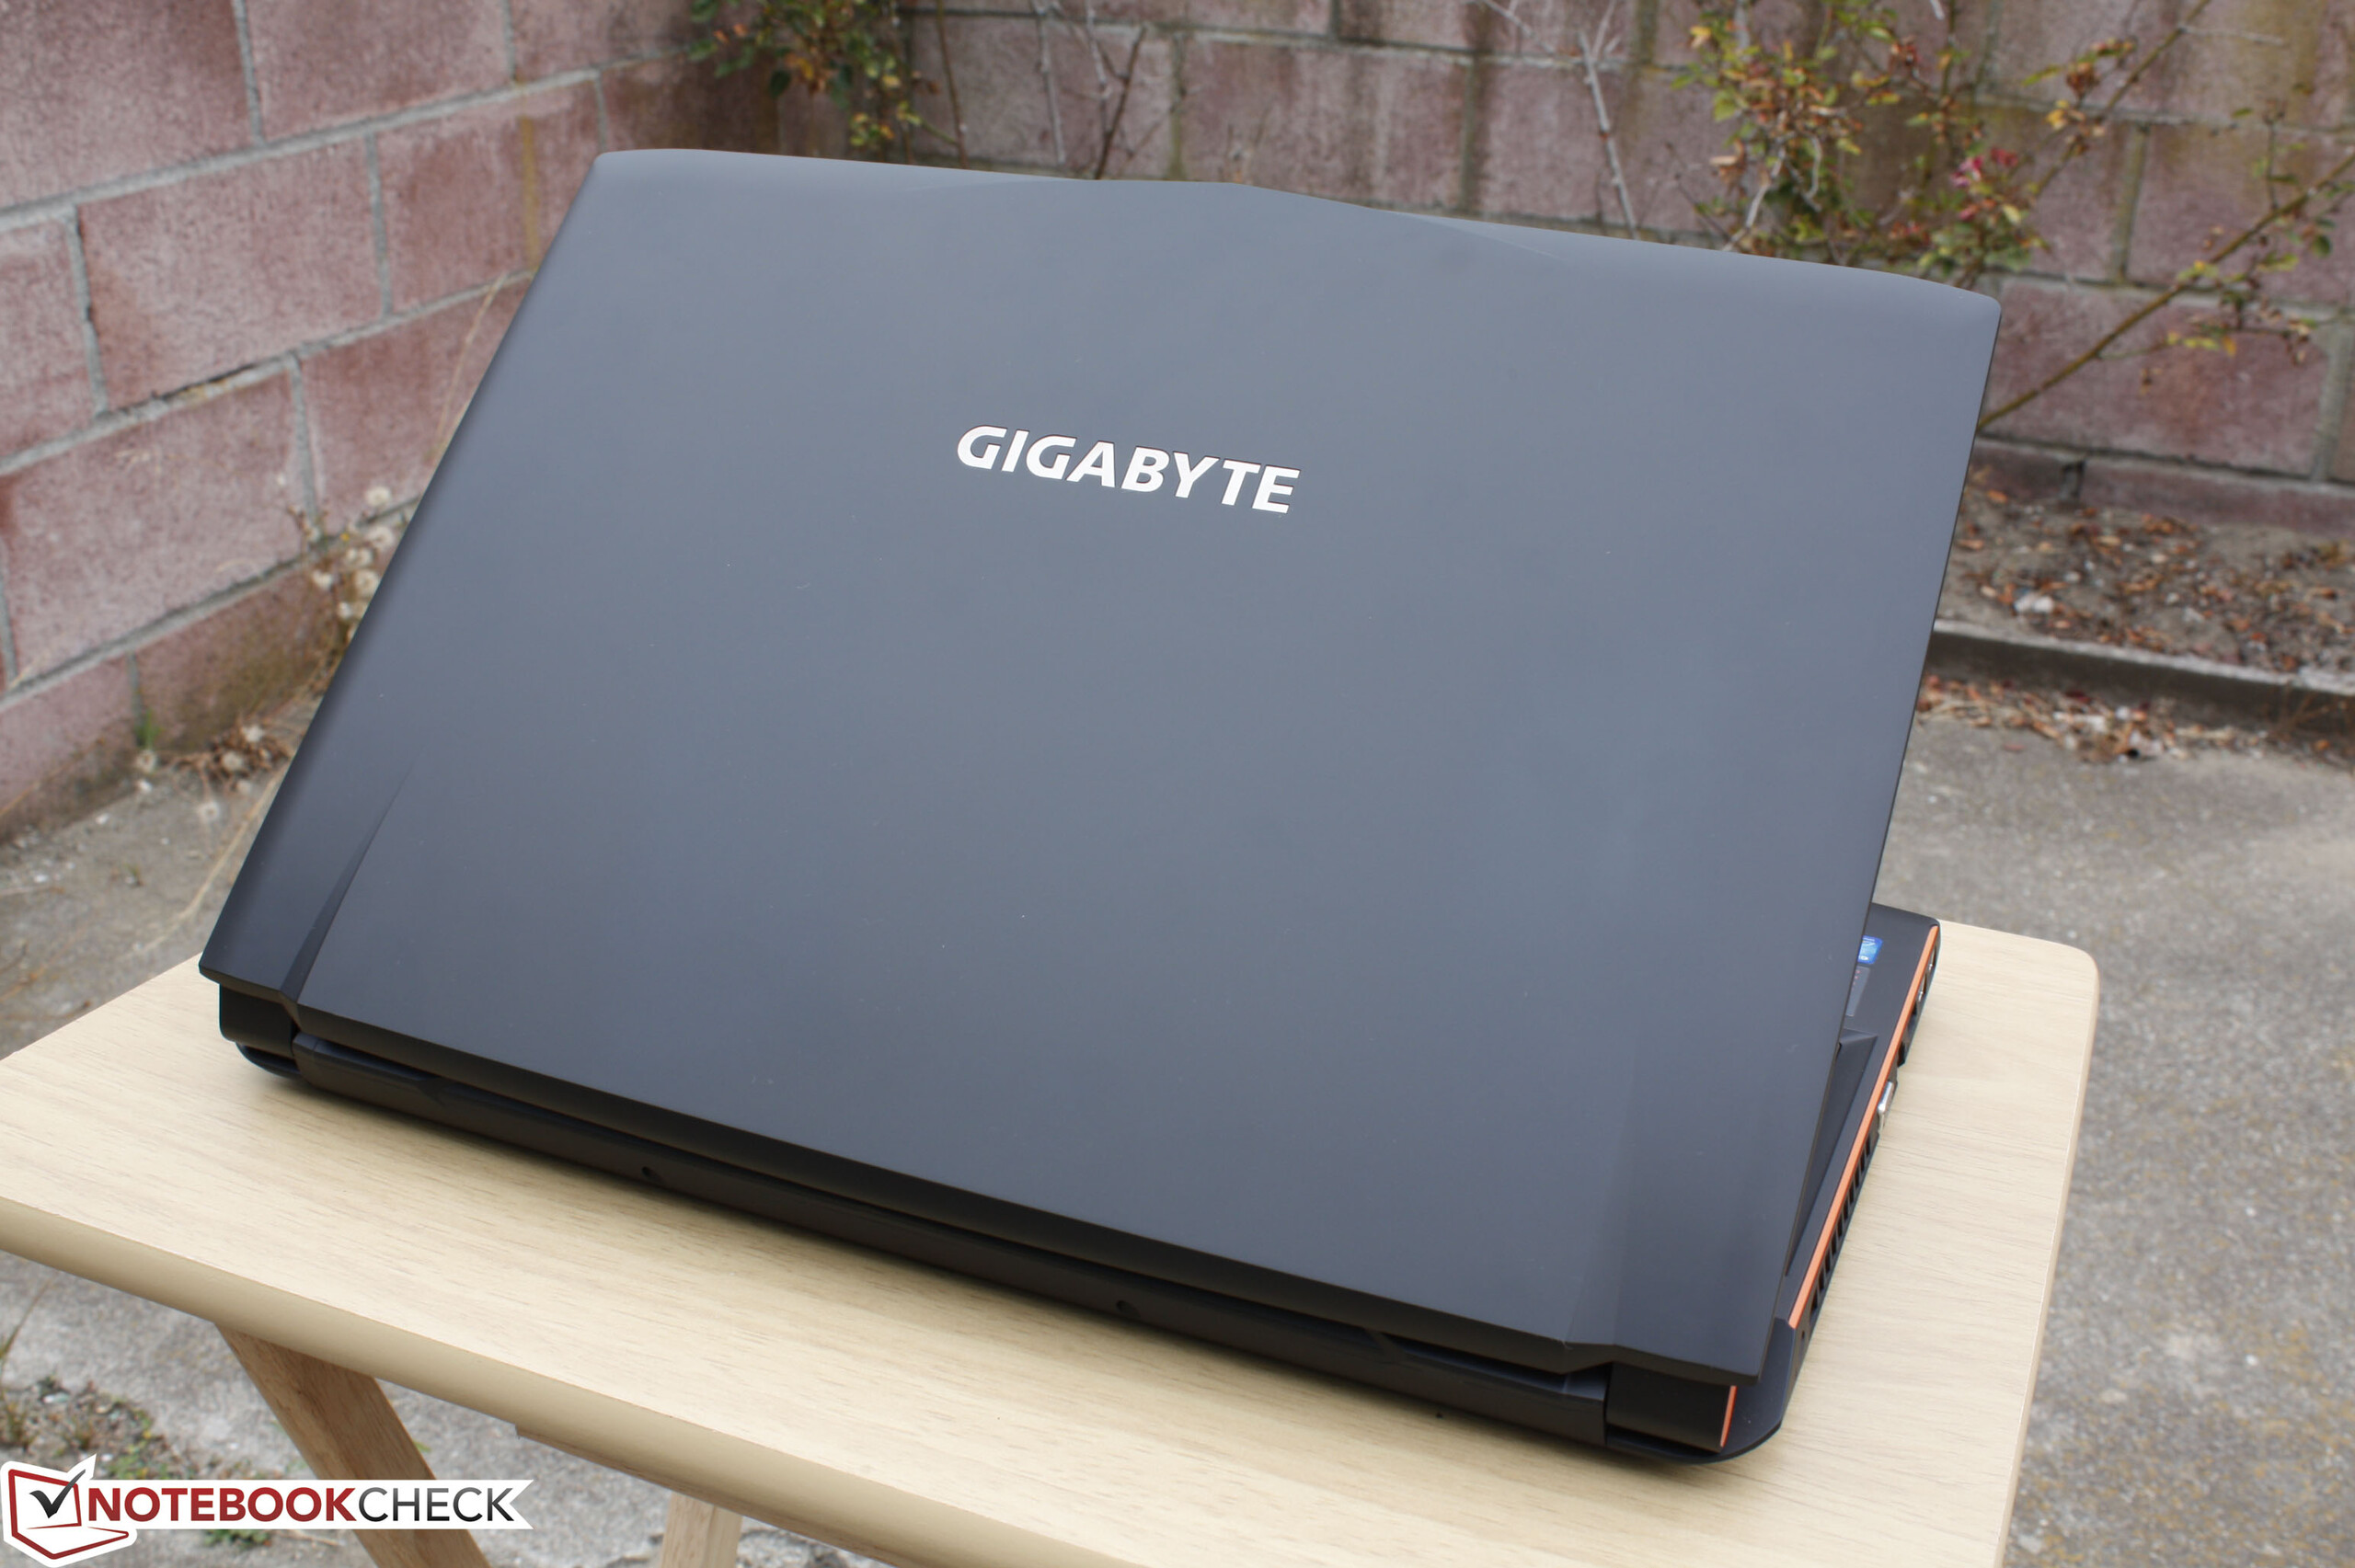
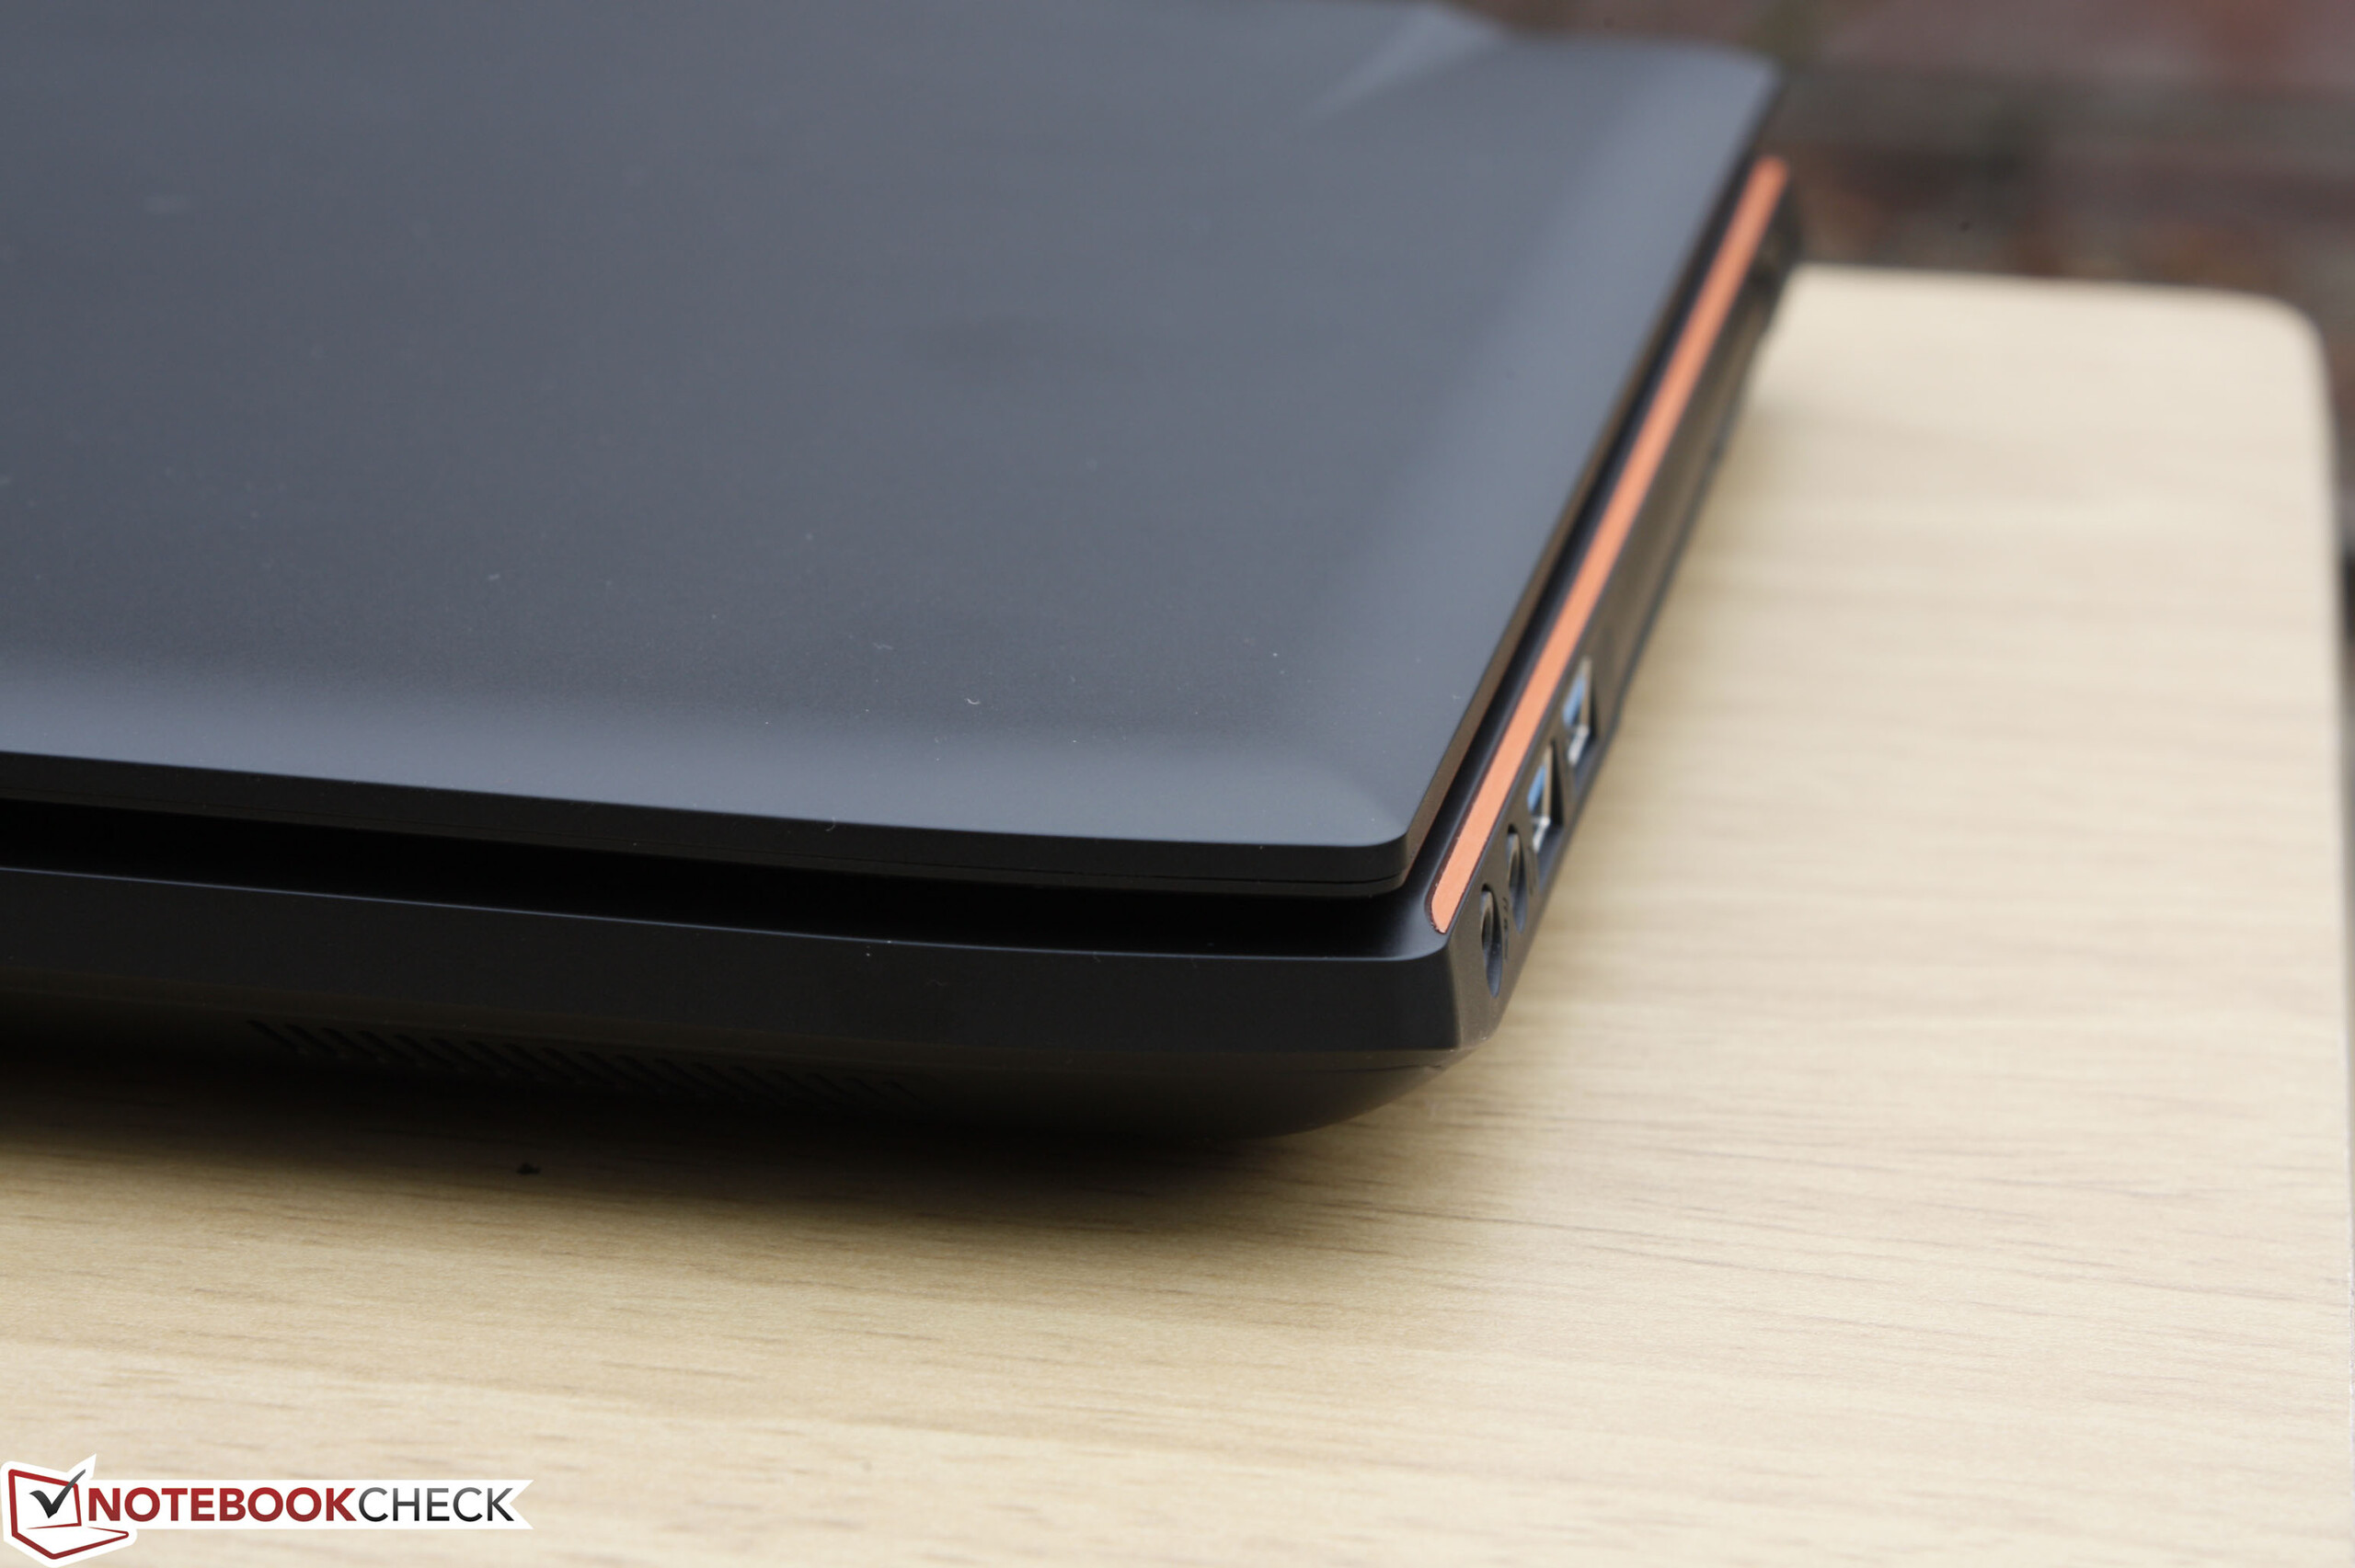
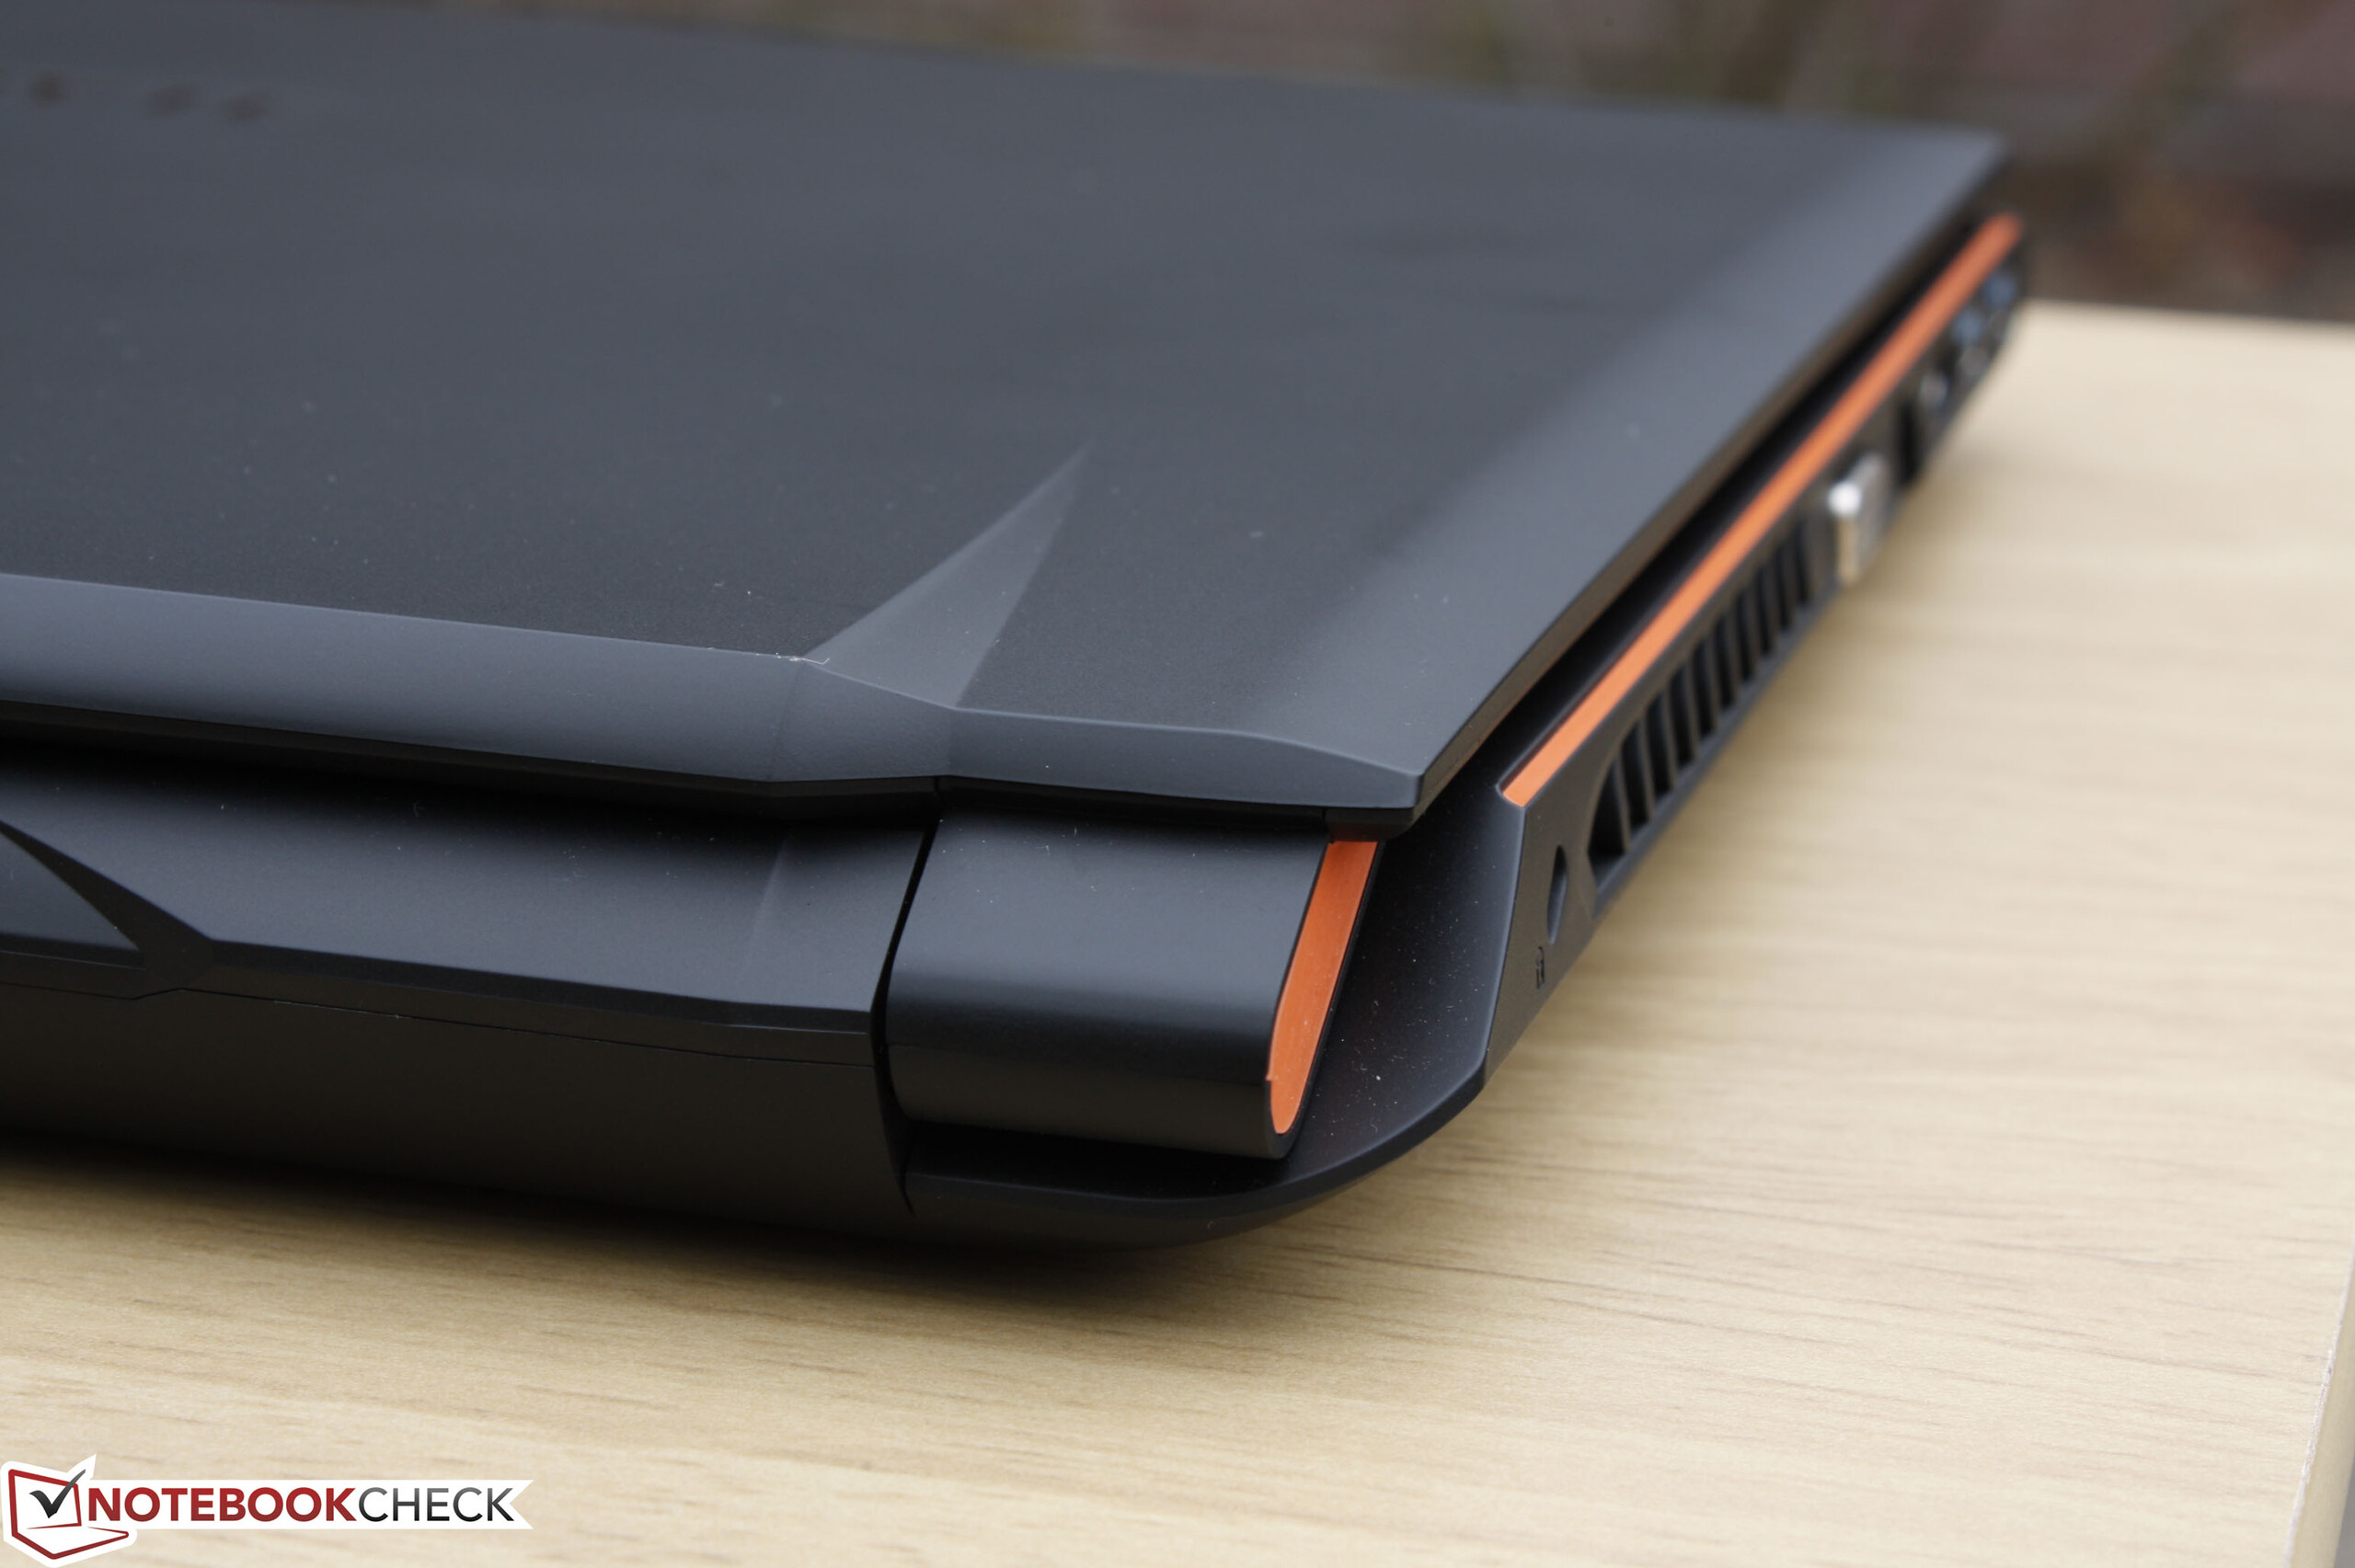
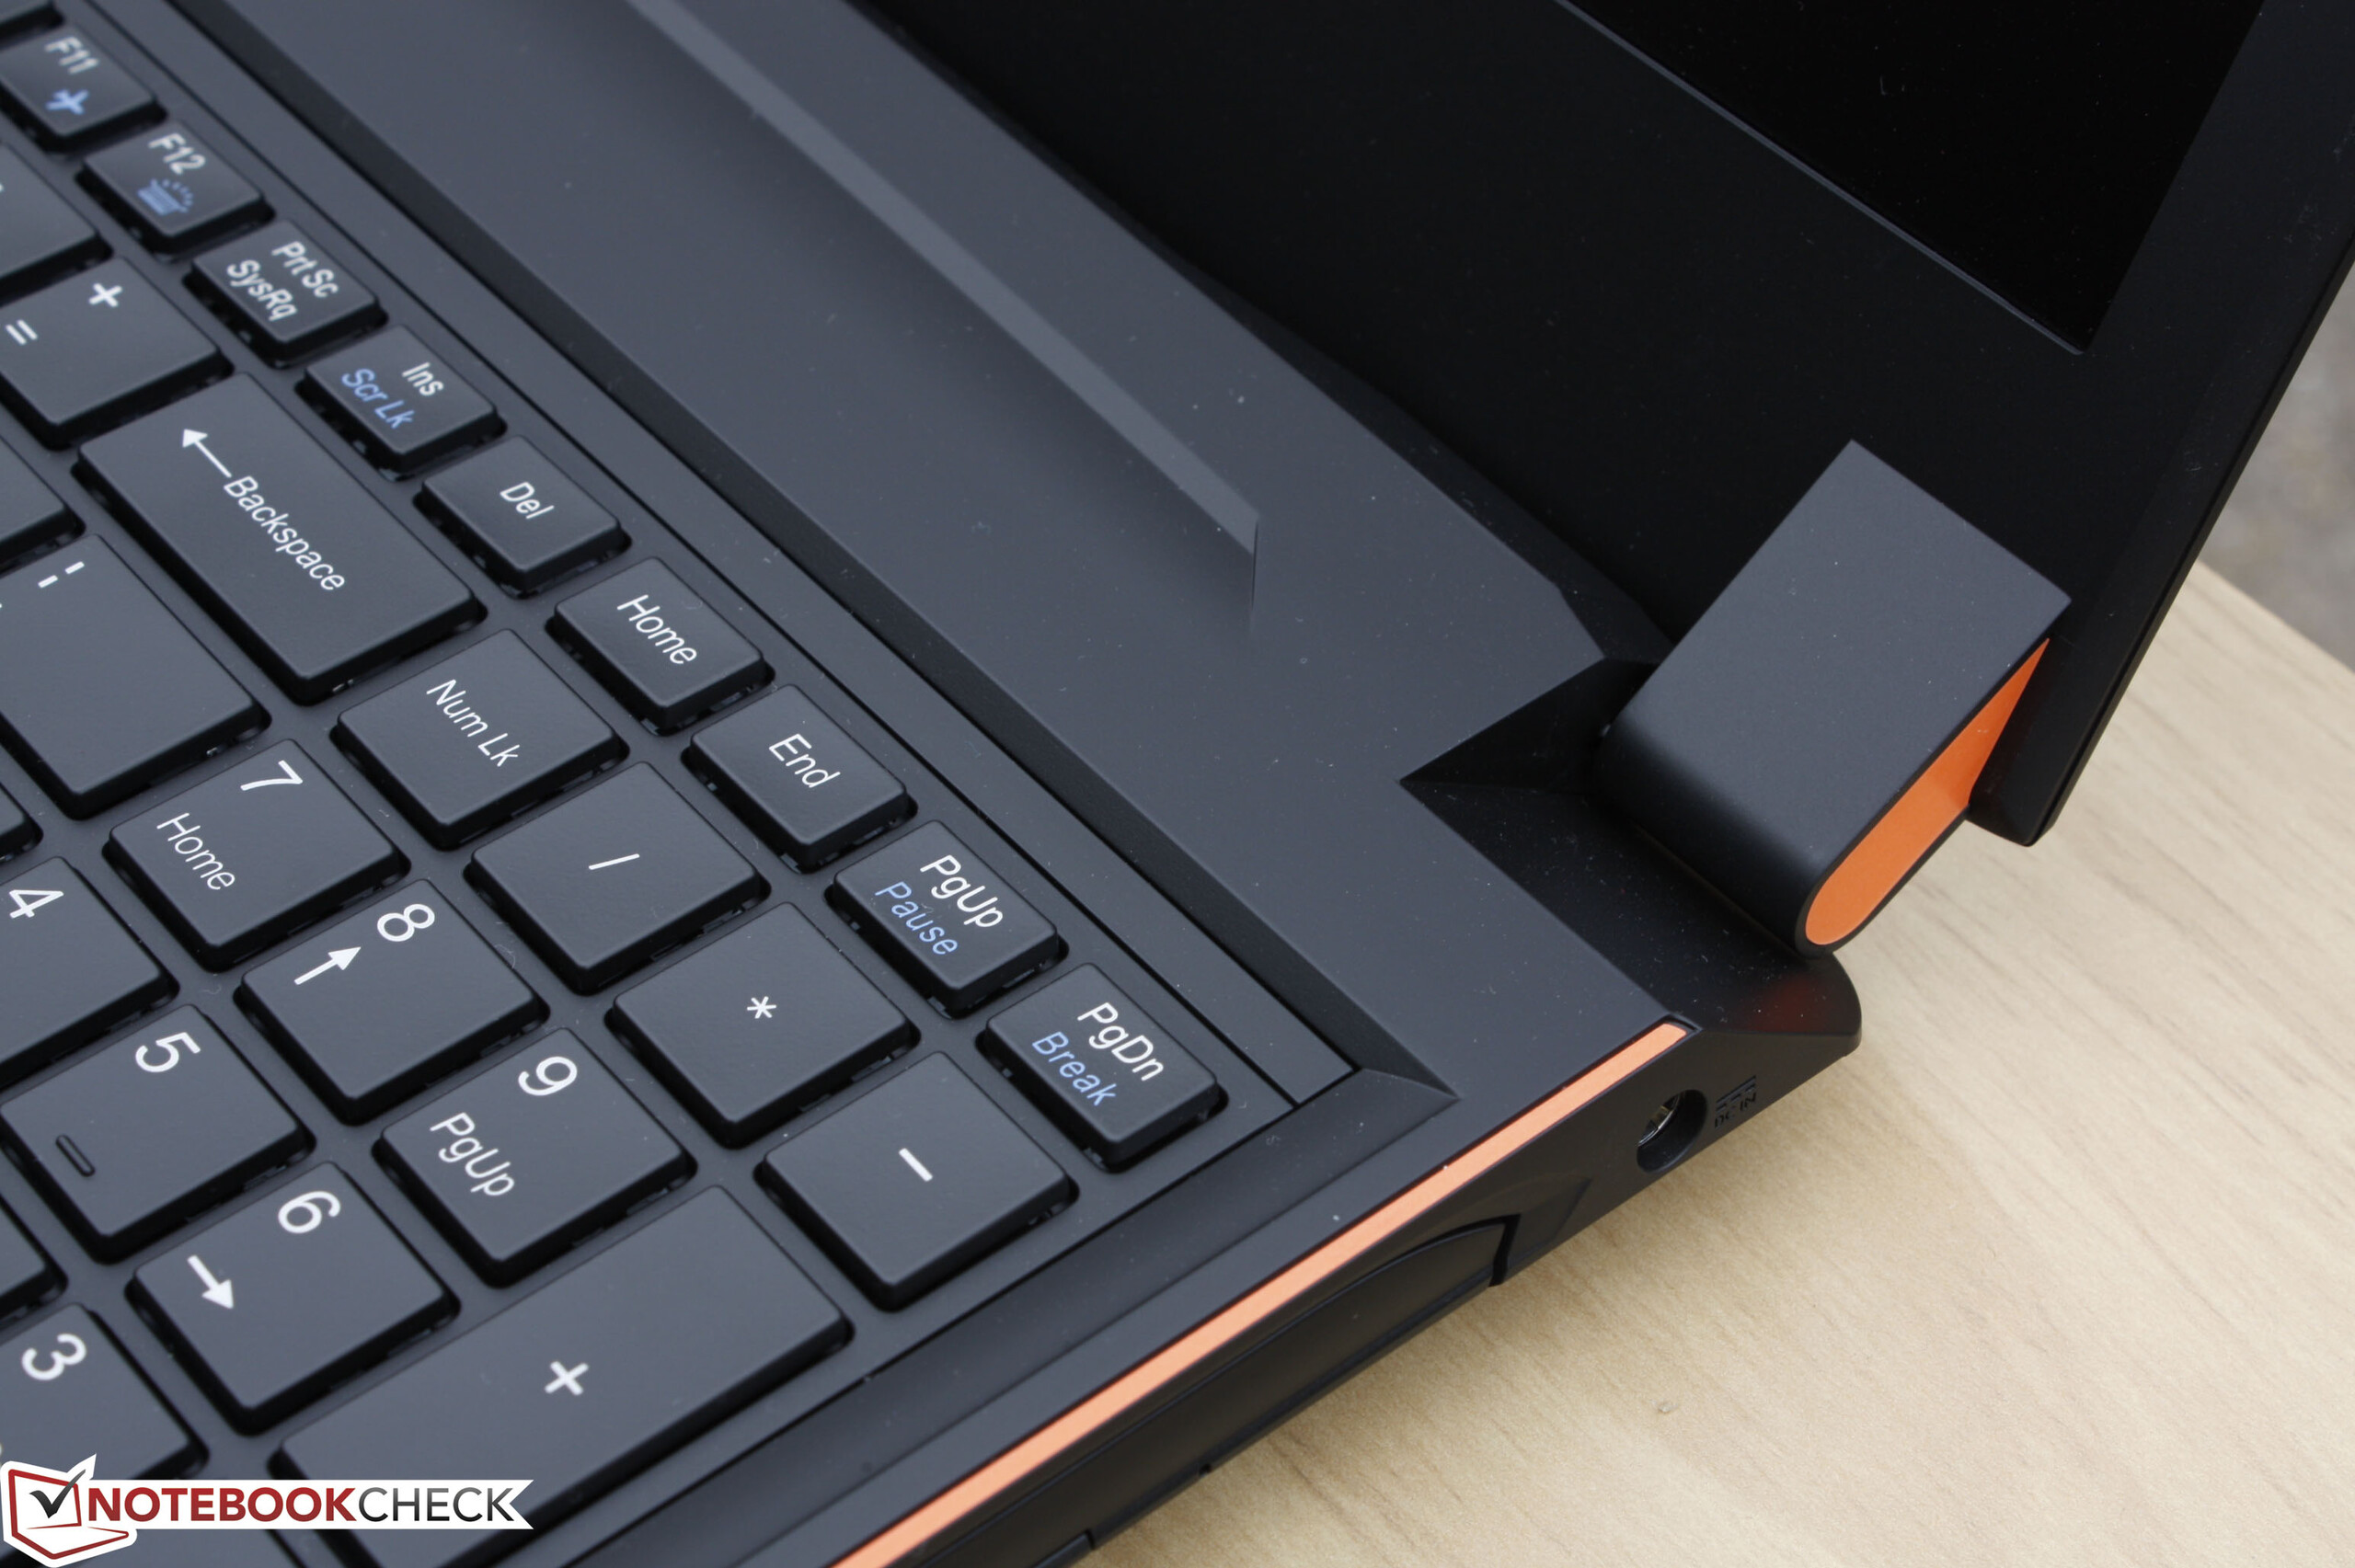
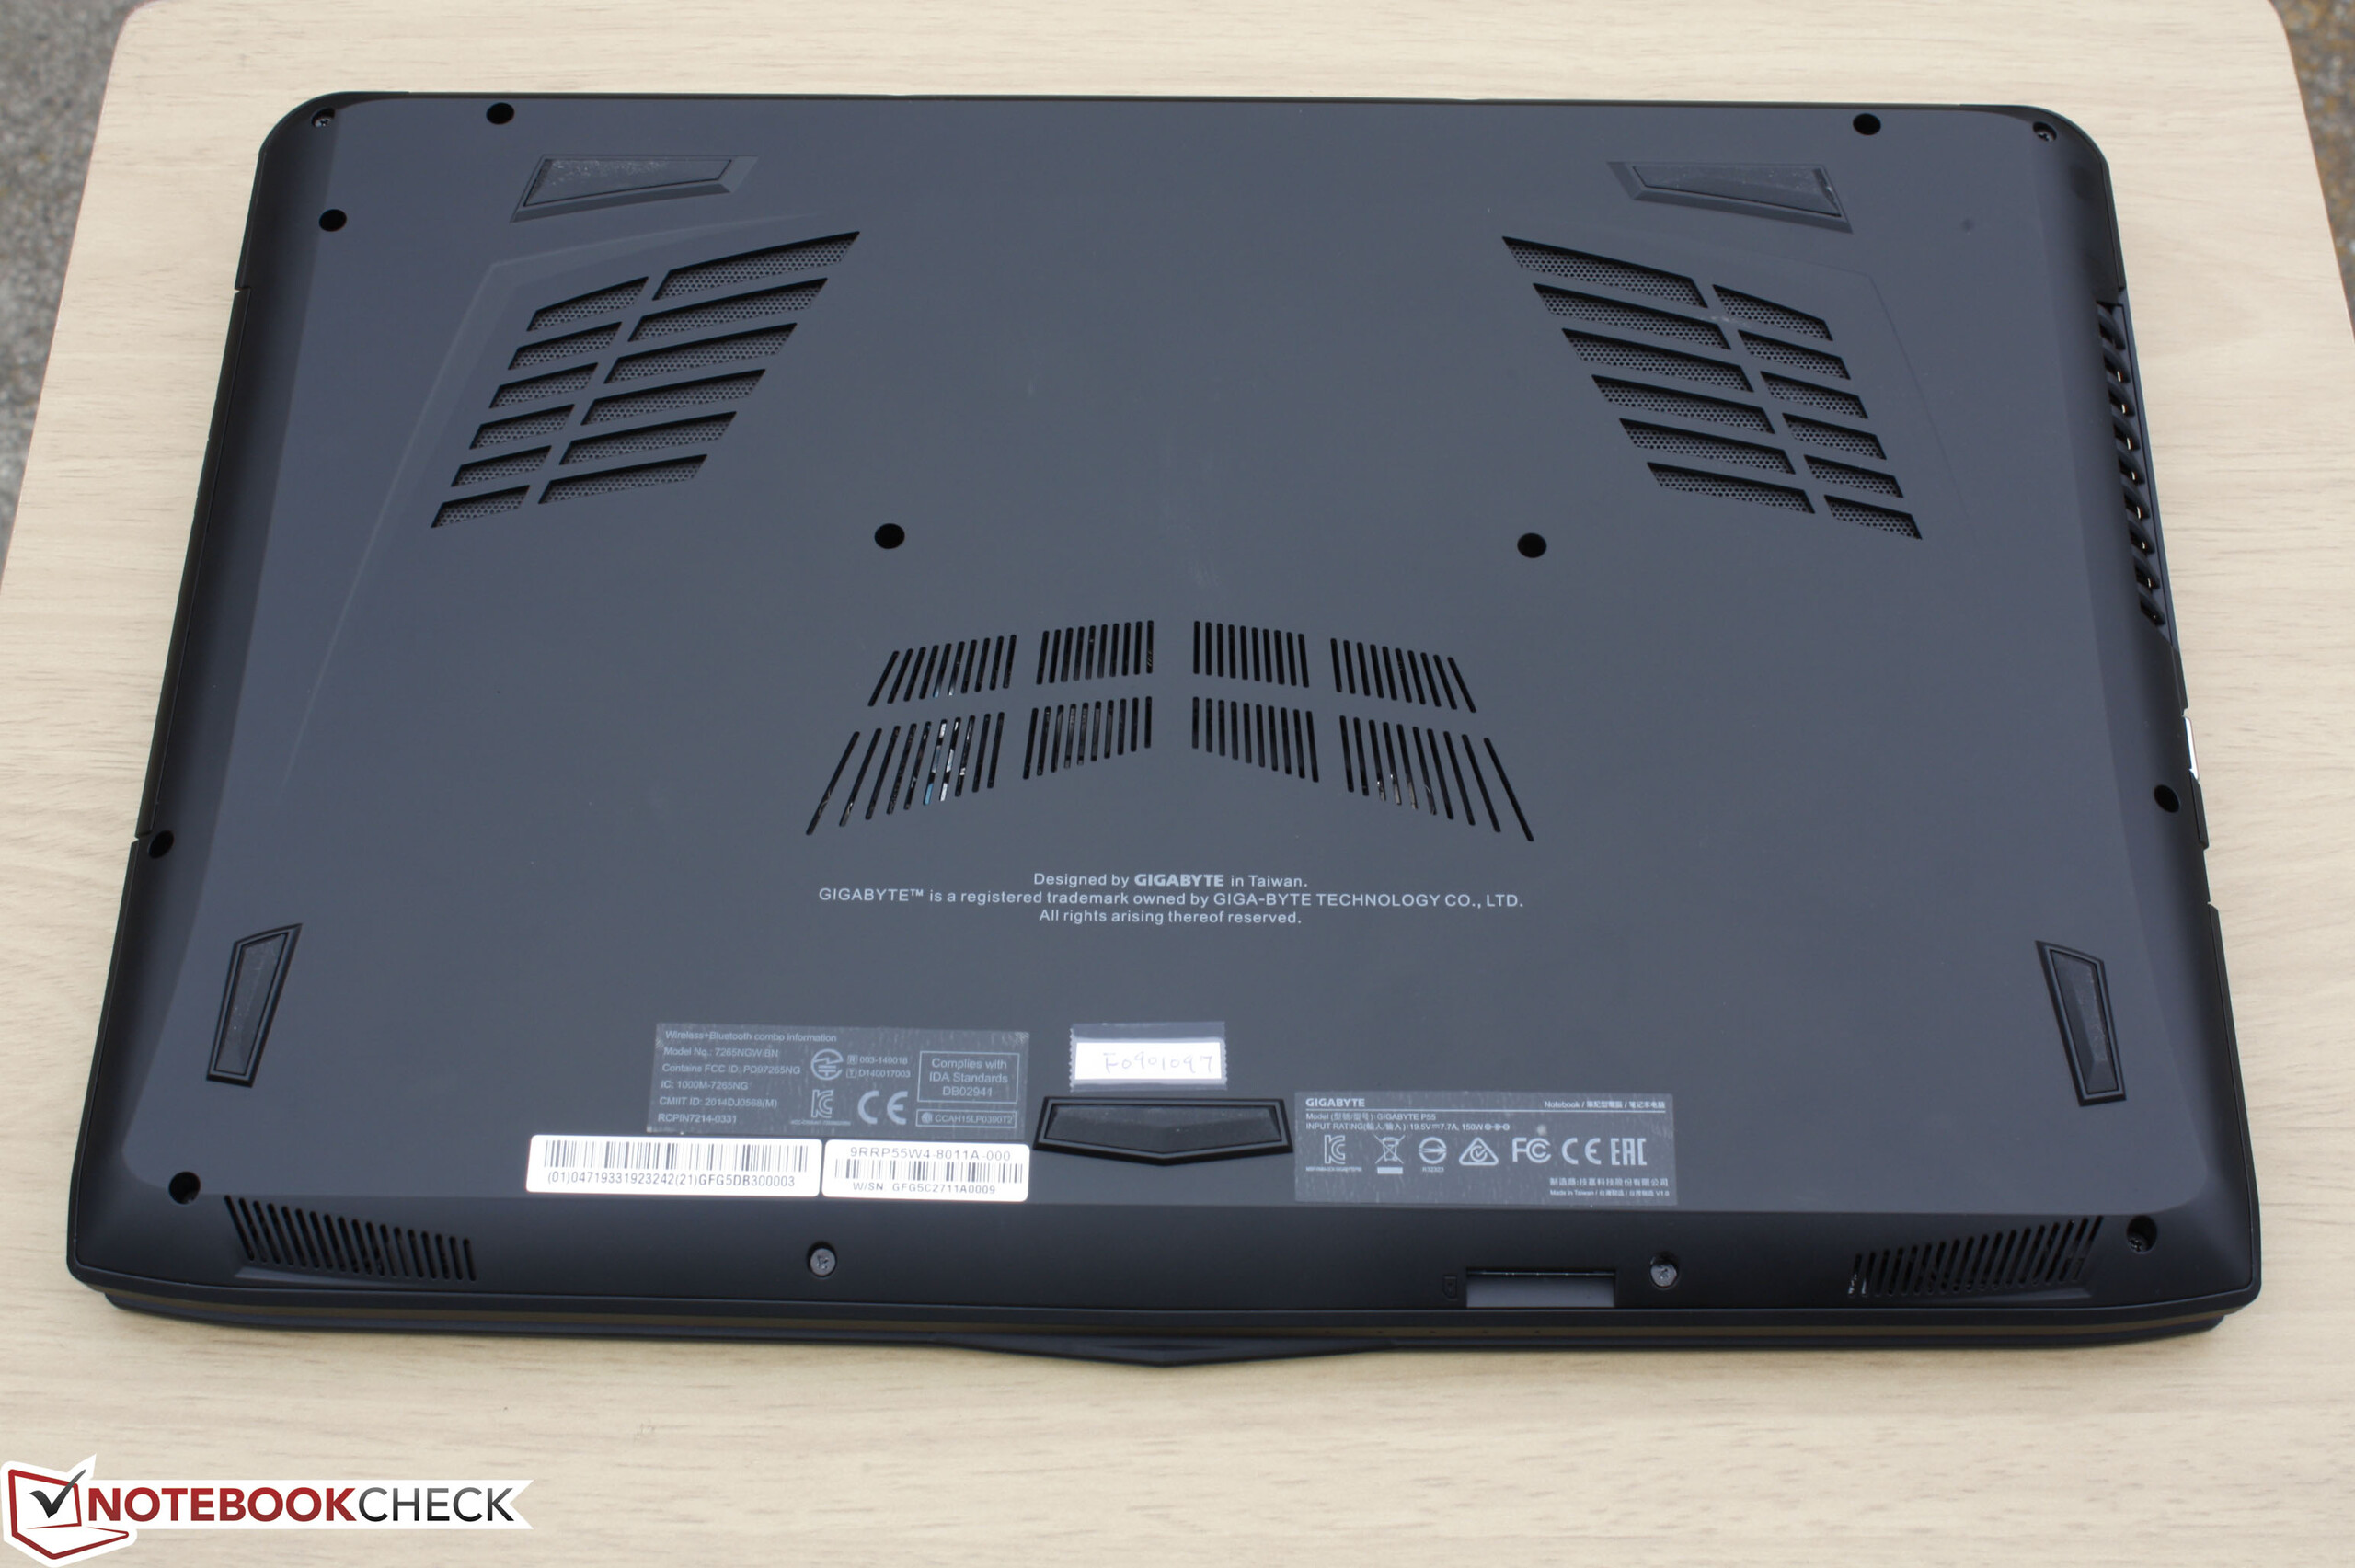
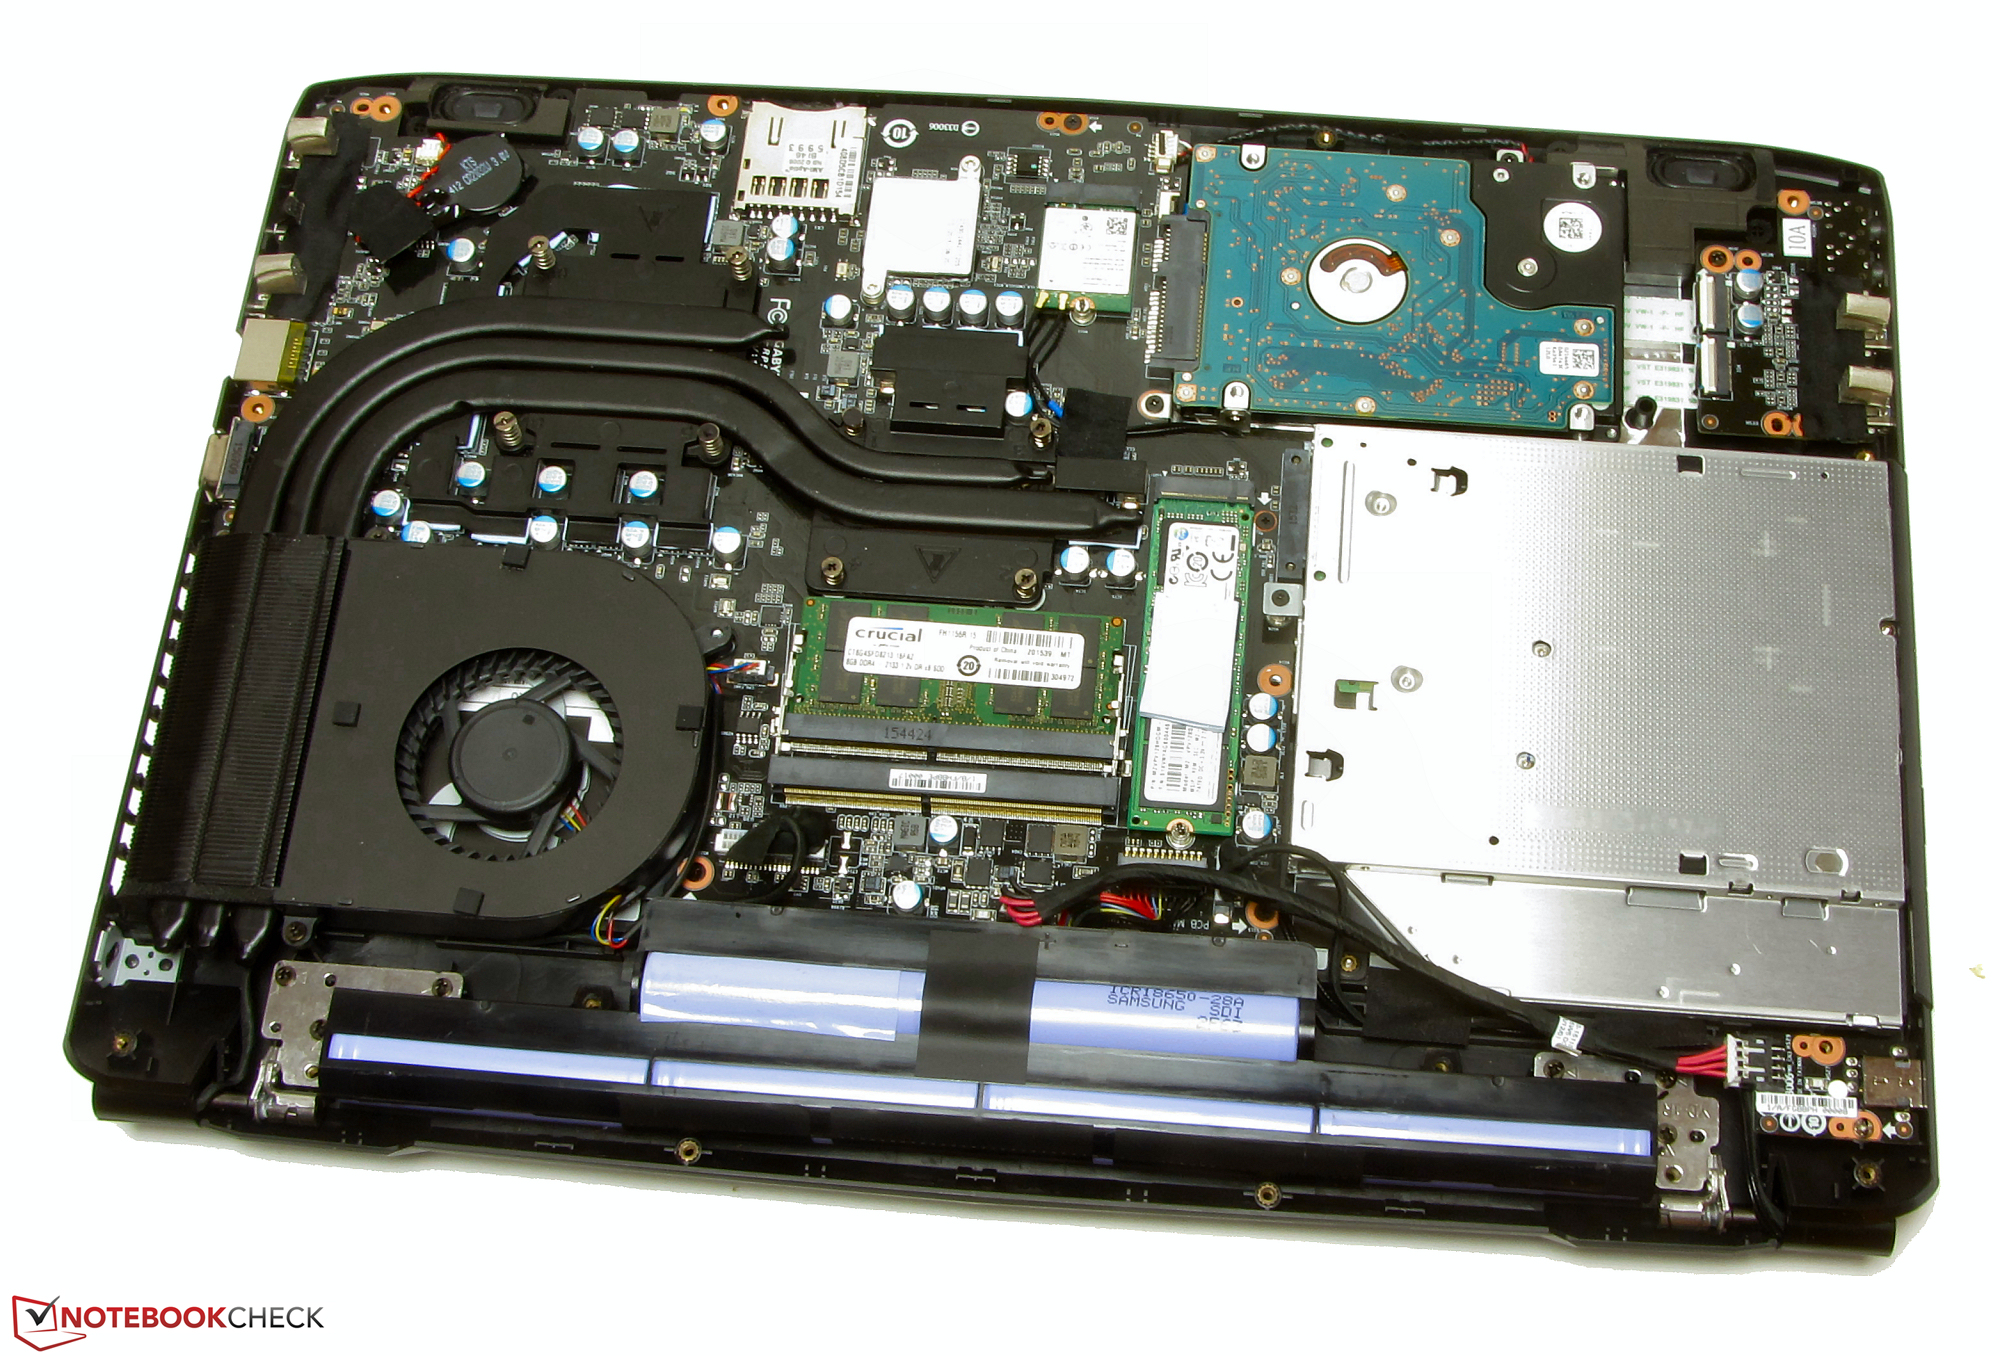
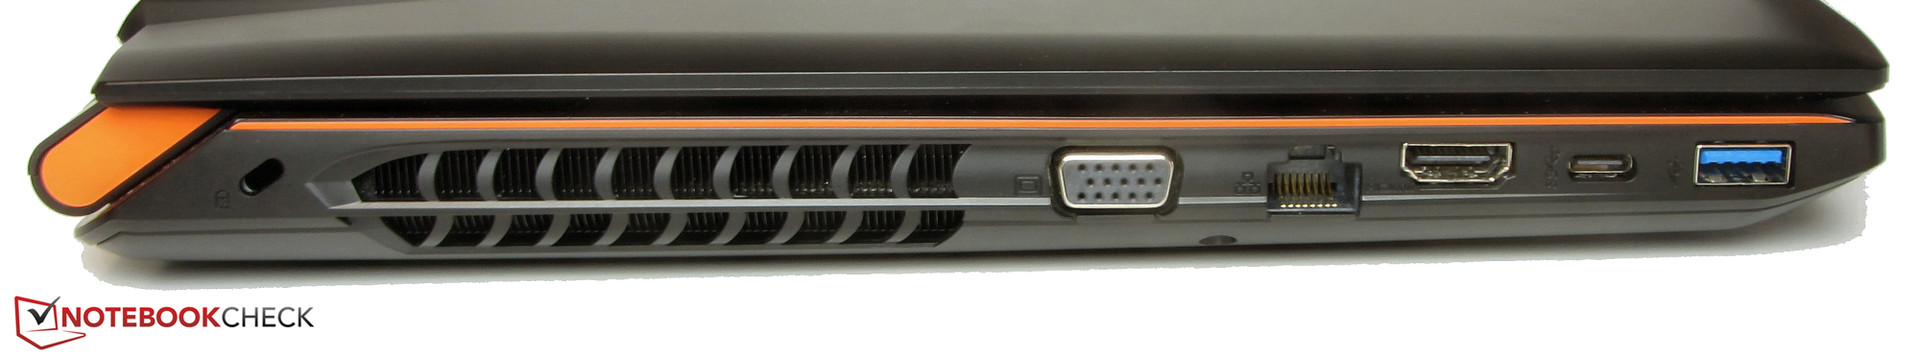
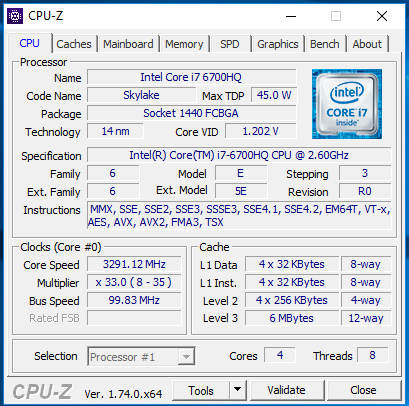
El Gigabyte P55W v5 es un portátil de juego de 15.6". El procesador Core i7 ofrece bastante potencia de cálculo para todos los escenarios comunes de uso. La GeForce GTX 970M renderiza todos los juegos actuales con fluidez. Un velocísimo SSD NVMe asegura un sistema rápido. Gracias al HDD de 2.5" no te quedarás sin espacio de almacenamiento. Sendos dispositivos de almacenamiento se pueden cambiar con facilidad con modelos de mayor capacidad. Aunque el P55W v5 no tiene una escotilla de mantenimiento, la bandeja base se reemplaza con facilidad. Sorprende un teclado tan bueno en un portátil de juego. Al igual que la gran duración de la batería en nuestras pruebas realistas. El panel mate Full HD IPS agrada con ángulo de visión estable y contraste decente. Sin embargo, su brillo podría ser mayor.
Gigabyte actualiza su P55W v5. Las modificaciones e innovaciones (NVMe, DDR4 RAM, USB 3.1, y CPU Skylake) resultan razonables.
Sin embargo, Gigabyte debería haber seguido esta senda con más consistencia. Por ejemplo, habría sido deseable un DisplayPort y se habría agradecido más memoria gráfica. Quizá Gigabyte tenga estos puntos en cuenta para su P55W v6.
Ésta es una versión acortada del análisis original. Puedes leer el análisis completo en inglés aquí.
Gigabyte P55W v5
-
02/29/2016 v5(old)
Sascha Mölck