 Deutsch
 English
 Español
 Français
 Italiano
 Nederlands
 Polski
 Português
 Русский
 Türkçe
 Svenska
 Chinese
 Magyar
Breve análisis del HP 15z-ba000
| SD Card Reader | |
| average JPG Copy Test (av. of 3 runs) | |
| Toshiba Satellite C55-C-1NE | |
| Acer Aspire E5-574-53YZ | |
| HP 15z-ba000 | |
| HP 250 G4 T6P08ES | |
| Lenovo Ideapad 310-15ISK | |
| maximum AS SSD Seq Read Test (1GB) | |
| Toshiba Satellite C55-C-1NE | |
| HP 15z-ba000 | |
| Acer Aspire E5-574-53YZ | |
| Lenovo Ideapad 310-15ISK | |
| HP 250 G4 T6P08ES | |
| Networking | |
| iperf Server (receive) TCP 1 m | |
| Apple MacBook 12 (Early 2016) 1.1 GHz | |
| Lenovo Ideapad 310-15ISK | |
| HP 15z-ba000 | |
| iperf Client (transmit) TCP 1 m | |
| Apple MacBook 12 (Early 2016) 1.1 GHz | |
| Lenovo Ideapad 310-15ISK | |
| HP 15z-ba000 | |
| |||||||||||||||||||||||||
iluminación: 80 %
Brillo con batería: 244.5 cd/m²
Contraste: 635:1 (Negro: 0.385 cd/m²)
ΔE Color 8.62 | 0.5-29.43 Ø5
ΔE Greyscale 9.8 | 0.57-98 Ø5.3
57.71% sRGB (Argyll 1.6.3 3D)
39.86% AdobeRGB 1998 (Argyll 1.6.3 3D)
39.86% AdobeRGB 1998 (Argyll 2.2.0 3D)
57.7% sRGB (Argyll 2.2.0 3D)
38.58% Display P3 (Argyll 2.2.0 3D)
Gamma: 2.09
| HP 15z-ba000 BOE06A4, TN, 15.60, 1366x768 | Acer Aspire E5-574-53YZ AU Optronics AUO38ED / AUO B156HTN03.8, TN, 15.60, 1920x1080 | HP 250 G4 T6P08ES ChiMei, TN LED, 15.60, 1366x768 | Lenovo Ideapad 310-15ISK LG Philips LP156WHU-TPG1, TN LED, 15.60, 1366x768 | Toshiba Satellite C55-C-1NE 156AT37-T01 (SDC4141), TN, 15.60, 1366x768 | |
|---|---|---|---|---|---|
| Display | -4% | 13% | -4% | -5% | |
| Display P3 Coverage | 38.58 | 37.21 -4% | 43.63 13% | 37.06 -4% | 36.7 -5% |
| sRGB Coverage | 57.7 | 56 -3% | 65.1 13% | 55.8 -3% | 55.3 -4% |
| AdobeRGB 1998 Coverage | 39.86 | 38.44 -4% | 45.1 13% | 38.29 -4% | 37.92 -5% |
| Response Times | 11% | 21% | -8% | 7% | |
| Response Time Grey 50% / Grey 80% * | 41.2 ? | 42.4 ? -3% | 42 ? -2% | 27 ? 34% | 22 ? 47% |
| Response Time Black / White * | 33.6 ? | 25.6 ? 24% | 24 ? 29% | 22 ? 35% | 20 ? 40% |
| PWM Frequency | 595 ? | 806 ? 35% | 50 ? -92% | 200 ? -66% | |
| Screen | -14% | -6% | -3% | -21% | |
| Brightness middle | 244.5 | 213.4 -13% | 220 -10% | 200 -18% | 251 3% |
| Brightness | 232 | 209 -10% | 203 -12% | 198 -15% | 236 2% |
| Brightness Distribution | 80 | 86 8% | 83 4% | 83 4% | 85 6% |
| Black Level * | 0.385 | 0.351 9% | 0.49 -27% | 0.28 27% | 0.44 -14% |
| Contrast | 635 | 608 -4% | 449 -29% | 714 12% | 570 -10% |
| Colorchecker dE 2000 * | 8.62 | 13.35 -55% | 8.95 -4% | 10.63 -23% | 14.58 -69% |
| Colorchecker dE 2000 max. * | 17.38 | 21.79 -25% | 15.89 9% | 15.69 10% | 24.59 -41% |
| Greyscale dE 2000 * | 9.8 | 13.59 -39% | 10.59 -8% | 11.19 -14% | 16.8 -71% |
| Gamma | 2.09 105% | 2.7 81% | 2.51 88% | 1.78 124% | 2.33 94% |
| CCT | 11391 57% | 18870 34% | 12049 54% | 11258 58% | 27039 24% |
| Color Space (Percent of AdobeRGB 1998) | 39.86 | 38.44 -4% | 41 3% | 35 -12% | 35 -12% |
| Color Space (Percent of sRGB) | 57.71 | 56.01 -3% | 65 13% | 56 -3% | 56 -3% |
| Media total (Programa/Opciones) | -2% /
-8% | 9% /
3% | -5% /
-4% | -6% /
-13% |
* ... más pequeño es mejor
Tiempos de respuesta del display
| ↔ Tiempo de respuesta de Negro a Blanco | ||
|---|---|---|
| 33.6 ms ... subida ↗ y bajada ↘ combinada | ↗ 14.8 ms subida | 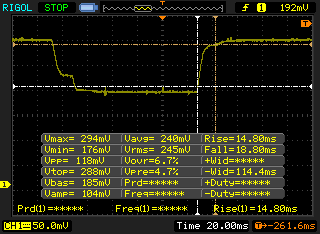 |
| ↘ 18.8 ms bajada | ||
| La pantalla mostró tiempos de respuesta lentos en nuestros tests y podría ser demasiado lenta para los jugones. En comparación, todos los dispositivos de prueba van de ##min### (mínimo) a 240 (máximo) ms. » 89 % de todos los dispositivos son mejores. Eso quiere decir que el tiempo de respuesta es peor que la media (21.5 ms) de todos los dispositivos testados. | ||
| ↔ Tiempo de respuesta 50% Gris a 80% Gris | ||
| 41.2 ms ... subida ↗ y bajada ↘ combinada | ↗ 18.4 ms subida | 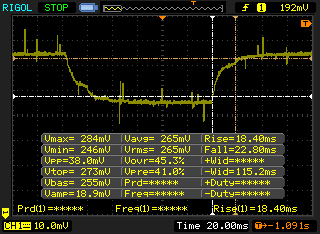 |
| ↘ 22.8 ms bajada | ||
| La pantalla mostró tiempos de respuesta lentos en nuestros tests y podría ser demasiado lenta para los jugones. En comparación, todos los dispositivos de prueba van de ##min### (mínimo) a 636 (máximo) ms. » 62 % de todos los dispositivos son mejores. Eso quiere decir que el tiempo de respuesta es peor que la media (33.7 ms) de todos los dispositivos testados. | ||
Parpadeo de Pantalla / PWM (Pulse-Width Modulation)
| Parpadeo de Pantalla / PWM detectado | 595 Hz | ≤ 99 % de brillo | 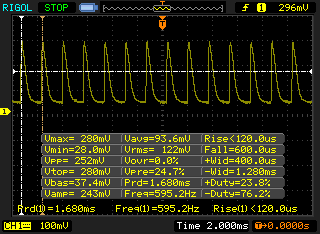 |
La retroiluminación del display parpadea a 595 Hz (seguramente usa PWM - Pulse-Width Modulation) a un brillo del 99 % e inferior. Sobre este nivel de brillo no debería darse parpadeo / PWM. La frecuencia de 595 Hz es bastante alta, por lo que la mayoría de gente sensible al parpadeo no debería ver parpadeo o tener fatiga visual. Comparación: 53 % de todos los dispositivos testados no usaron PWM para atenuar el display. Si se usó, medimos una media de 17900 (mínimo: 5 - máxmo: 3846000) Hz. | |||
| Cinebench R10 | |
| Rendering Multiple CPUs 32Bit | |
| Acer Aspire E5-574-53YZ | |
| Lenovo Ideapad 310-15ISK | |
| HP 250 G4 T6P08ES | |
| Toshiba Satellite C55-C-1NE | |
| HP 15z-ba000 | |
| Rendering Single 32Bit | |
| Lenovo Ideapad 310-15ISK | |
| Acer Aspire E5-574-53YZ | |
| HP 250 G4 T6P08ES | |
| Toshiba Satellite C55-C-1NE | |
| HP 15z-ba000 | |
| Cinebench R11.5 | |
| CPU Single 64Bit | |
| Acer Aspire E5-574-53YZ | |
| HP 250 G4 T6P08ES | |
| Toshiba Satellite C55-C-1NE | |
| HP 15z-ba000 | |
| CPU Multi 64Bit | |
| Acer Aspire E5-574-53YZ | |
| HP 250 G4 T6P08ES | |
| Toshiba Satellite C55-C-1NE | |
| HP 15z-ba000 | |
| Super Pi Mod 1.5 XS 32M - 32M | |
| HP 15z-ba000 | |
| Acer Aspire E5-574-53YZ | |
* ... más pequeño es mejor
| PCMark 7 Score | 3288 puntos | |
| PCMark 8 Home Score Accelerated v2 | 1960 puntos | |
| PCMark 8 Creative Score Accelerated v2 | 2104 puntos | |
| PCMark 8 Work Score Accelerated v2 | 2952 puntos | |
ayuda | ||
| HP 15z-ba000 Adata IM2S3138E-128GM-B | Acer Aspire E5-574-53YZ Toshiba MQ02ABD100H | HP 250 G4 T6P08ES HGST Travelstar 5K1000 HTS541010A9E680 | Lenovo Ideapad 310-15ISK WDC Scorpio Blue WD10JPCX-24UE4T0 | Toshiba Satellite C55-C-1NE Toshiba MQ01ABD100 | |
|---|---|---|---|---|---|
| CrystalDiskMark 3.0 | -89% | -85% | -82% | -87% | |
| Read Seq | 397.9 | 100.8 -75% | 101 -75% | 115.9 -71% | 105.6 -73% |
| Write Seq | 171.4 | 57.4 -67% | 99.6 -42% | 113.3 -34% | 93.4 -46% |
| Read 512 | 367.5 | 31.19 -92% | 38.12 -90% | 39.02 -89% | 31.7 -91% |
| Write 512 | 172.3 | 38.67 -78% | 42.22 -75% | 55.6 -68% | 27.54 -84% |
| Read 4k | 26.11 | 0.509 -98% | 0.522 -98% | 0.44 -98% | 0.374 -99% |
| Write 4k | 52.3 | 0.615 -99% | 1.29 -98% | 1.188 -98% | 0.72 -99% |
| Read 4k QD32 | 164.3 | 0.351 -100% | 1.116 -99% | 1.125 -99% | 0.694 -100% |
| Write 4k QD32 | 132.8 | 0.605 -100% | 1.287 -99% | 1.245 -99% | 0.646 -100% |

| 3DMark 11 | |
| 1280x720 Performance GPU | |
| Acer Aspire E5-574-53YZ | |
| Lenovo Ideapad 310-15ISK | |
| HP 250 G4 T6P08ES | |
| Toshiba Satellite C55-C-1NE | |
| HP 15z-ba000 | |
| Toshiba Portege Z30t-A-10X | |
| Lenovo G70-80 80FF00H0GE | |
| 1280x720 Performance Combined | |
| Acer Aspire E5-574-53YZ | |
| Lenovo Ideapad 310-15ISK | |
| HP 250 G4 T6P08ES | |
| Toshiba Satellite C55-C-1NE | |
| HP 15z-ba000 | |
| Lenovo G70-80 80FF00H0GE | |
| Toshiba Portege Z30t-A-10X | |
| 3DMark | |
| 1280x720 Cloud Gate Standard Graphics | |
| Acer Aspire E5-574-53YZ | |
| Toshiba Satellite C55-C-1NE | |
| HP 250 G4 T6P08ES | |
| Toshiba Portege Z30t-A-10X | |
| Lenovo G70-80 80FF00H0GE | |
| HP 15z-ba000 | |
| 1920x1080 Fire Strike Graphics | |
| Toshiba Satellite C55-C-1NE | |
| Acer Aspire E5-574-53YZ | |
| HP 250 G4 T6P08ES | |
| Toshiba Portege Z30t-A-10X | |
| HP 15z-ba000 | |
| Lenovo G70-80 80FF00H0GE | |
| 3DMark 11 Performance | 837 puntos | |
| 3DMark Cloud Gate Standard Score | 2459 puntos | |
| 3DMark Fire Strike Score | 493 puntos | |
ayuda | ||
| BioShock Infinite | |
| 1920x1080 Ultra Preset, DX11 (DDOF) (ordenar por valor) | |
| HP 15z-ba000 | |
| Acer Aspire E5-574-53YZ | |
| Toshiba Portege Z30t-A-10X | |
| 1366x768 High Preset (ordenar por valor) | |
| HP 15z-ba000 | |
| Acer Aspire E5-574-53YZ | |
| HP 250 G4 T6P08ES | |
| Lenovo Ideapad 310-15ISK | |
| Toshiba Satellite C55-C-1NE | |
| Toshiba Portege Z30t-A-10X | |
| 1366x768 Medium Preset (ordenar por valor) | |
| HP 15z-ba000 | |
| Acer Aspire E5-574-53YZ | |
| HP 250 G4 T6P08ES | |
| Lenovo Ideapad 310-15ISK | |
| Toshiba Satellite C55-C-1NE | |
| Toshiba Portege Z30t-A-10X | |
| 1280x720 Very Low Preset (ordenar por valor) | |
| HP 15z-ba000 | |
| Acer Aspire E5-574-53YZ | |
| HP 250 G4 T6P08ES | |
| Lenovo Ideapad 310-15ISK | |
| Toshiba Satellite C55-C-1NE | |
| Toshiba Portege Z30t-A-10X | |
| Tomb Raider | |
| 1920x1080 Ultra Preset AA:FX AF:16x (ordenar por valor) | |
| HP 15z-ba000 | |
| Toshiba Portege Z30t-A-10X | |
| 1366x768 High Preset AA:FX AF:8x (ordenar por valor) | |
| HP 15z-ba000 | |
| HP 250 G4 T6P08ES | |
| Toshiba Portege Z30t-A-10X | |
| 1366x768 Normal Preset AA:FX AF:4x (ordenar por valor) | |
| HP 15z-ba000 | |
| HP 250 G4 T6P08ES | |
| Toshiba Portege Z30t-A-10X | |
| 1024x768 Low Preset (ordenar por valor) | |
| HP 15z-ba000 | |
| HP 250 G4 T6P08ES | |
| Toshiba Portege Z30t-A-10X | |
| Rise of the Tomb Raider | |
| 1366x768 Medium Preset AF:2x (ordenar por valor) | |
| HP 15z-ba000 | |
| HP 250 G4 T6P08ES | |
| 1024x768 Lowest Preset (ordenar por valor) | |
| HP 15z-ba000 | |
| HP 250 G4 T6P08ES | |
| Metro: Last Light | |
| 1920x1080 Very High (DX11) AF:16x (ordenar por valor) | |
| HP 15z-ba000 | |
| 1366x768 High (DX11) AF:16x (ordenar por valor) | |
| HP 15z-ba000 | |
| Lenovo Ideapad 310-15ISK | |
| 1366x768 Medium (DX10) AF:4x (ordenar por valor) | |
| HP 15z-ba000 | |
| Lenovo Ideapad 310-15ISK | |
| 1024x768 Low (DX10) AF:4x (ordenar por valor) | |
| HP 15z-ba000 | |
| Lenovo Ideapad 310-15ISK | |
| Anno 2070 | |
| 1920x1080 Very High Preset AA:on AF:4x (ordenar por valor) | |
| HP 15z-ba000 | |
| Toshiba Portege Z30t-A-10X | |
| 1366x768 High Preset AA:on AF:2x (ordenar por valor) | |
| HP 15z-ba000 | |
| Toshiba Portege Z30t-A-10X | |
| 1366x768 Medium Preset AA:on (ordenar por valor) | |
| HP 15z-ba000 | |
| Toshiba Portege Z30t-A-10X | |
| 1024x768 Low Preset (ordenar por valor) | |
| HP 15z-ba000 | |
| Toshiba Portege Z30t-A-10X | |
| bajo | medio | alto | ultra | |
| Anno 2070 (2011) | 47.2 | 20.9 | 13.2 | 5.1 |
| Tomb Raider (2013) | 35.7 | 18.7 | 13.9 | 6.2 |
| BioShock Infinite (2013) | 32.9 | 17.7 | 15 | 5.1 |
| Metro: Last Light (2013) | 26.3 | 11.3 | 8.2 | 4 |
| Rise of the Tomb Raider (2016) | 11.9 | 6.7 |
Ruido
| Ocioso |
| 31.6 / 31.6 / 31.6 dB(A) |
| Carga |
| 37.2 / 38.2 dB(A) |
 | ||
30 dB silencioso 40 dB(A) audible 50 dB(A) ruidosamente alto |
||
min: | ||
| HP 15z-ba000 Radeon R4 (Beema), A6-7310, Adata IM2S3138E-128GM-B | Acer Aspire E5-574-53YZ Iris Graphics 550, 6267U, Toshiba MQ02ABD100H | HP 250 G4 T6P08ES Radeon R5 M330, 5200U, HGST Travelstar 5K1000 HTS541010A9E680 | Lenovo Ideapad 310-15ISK GeForce 920MX, 6500U, WDC Scorpio Blue WD10JPCX-24UE4T0 | Toshiba Satellite C55-C-1NE GeForce 920M, 5005U, Toshiba MQ01ABD100 | |
|---|---|---|---|---|---|
| Noise | -1% | -11% | -6% | -3% | |
| off / environment * | 28.6 | 28.8 -1% | 31.2 -9% | 31.2 -9% | 31.3 -9% |
| Idle Minimum * | 31.6 | 31 2% | 33.2 -5% | 32.6 -3% | 32.1 -2% |
| Idle Average * | 31.6 | 31 2% | 33.2 -5% | 32.6 -3% | 32.1 -2% |
| Idle Maximum * | 31.6 | 31 2% | 34.6 -9% | 33.8 -7% | 33.1 -5% |
| Load Average * | 37.2 | 39.1 -5% | 45 -21% | 40.2 -8% | 37.8 -2% |
| Load Maximum * | 38.2 | 41 -7% | 45.2 -18% | 40.4 -6% | 37.7 1% |
* ... más pequeño es mejor
(+) The maximum temperature on the upper side is 28.6 °C / 83 F, compared to the average of 36.9 °C / 98 F, ranging from 21.1 to 71 °C for the class Multimedia.
(±) The bottom heats up to a maximum of 43.2 °C / 110 F, compared to the average of 39.1 °C / 102 F
(+) In idle usage, the average temperature for the upper side is 23.1 °C / 74 F, compared to the device average of 31.2 °C / 88 F.
(+) The palmrests and touchpad are cooler than skin temperature with a maximum of 28.6 °C / 83.5 F and are therefore cool to the touch.
(±) The average temperature of the palmrest area of similar devices was 28.8 °C / 83.8 F (+0.2 °C / 0.3 F).
HP 15z-ba000 audio analysis
(±) | speaker loudness is average but good (72.8 dB)
Bass 100 - 315 Hz
(-) | nearly no bass - on average 23.2% lower than median
(±) | linearity of bass is average (12% delta to prev. frequency)
Mids 400 - 2000 Hz
(+) | balanced mids - only 4.5% away from median
(±) | linearity of mids is average (7.6% delta to prev. frequency)
Highs 2 - 16 kHz
(±) | higher highs - on average 7.1% higher than median
(±) | linearity of highs is average (9.7% delta to prev. frequency)
Overall 100 - 16.000 Hz
(-) | overall sound is not linear (30.3% difference to median)
Compared to same class
» 95% of all tested devices in this class were better, 2% similar, 3% worse
» The best had a delta of 5%, average was 18%, worst was 45%
Compared to all devices tested
» 86% of all tested devices were better, 3% similar, 10% worse
» The best had a delta of 4%, average was 25%, worst was 134%
Apple MacBook 12 (Early 2016) 1.1 GHz audio analysis
(+) | speakers can play relatively loud (83.6 dB)
Bass 100 - 315 Hz
(±) | reduced bass - on average 11.3% lower than median
(±) | linearity of bass is average (14.2% delta to prev. frequency)
Mids 400 - 2000 Hz
(+) | balanced mids - only 2.4% away from median
(+) | mids are linear (5.5% delta to prev. frequency)
Highs 2 - 16 kHz
(+) | balanced highs - only 2% away from median
(+) | highs are linear (4.5% delta to prev. frequency)
Overall 100 - 16.000 Hz
(+) | overall sound is linear (10.2% difference to median)
Compared to same class
» 5% of all tested devices in this class were better, 2% similar, 93% worse
» The best had a delta of 5%, average was 19%, worst was 53%
Compared to all devices tested
» 3% of all tested devices were better, 1% similar, 96% worse
» The best had a delta of 4%, average was 25%, worst was 134%
| Off / Standby | |
| Ocioso | |
| Carga |
|
| HP 15z-ba000 A6-7310, Radeon R4 (Beema), Adata IM2S3138E-128GM-B, TN, 1366x768, 15.60 | Acer Aspire E5-574-53YZ 6267U, Iris Graphics 550, Toshiba MQ02ABD100H, TN, 1920x1080, 15.60 | HP 250 G4 T6P08ES 5200U, Radeon R5 M330, HGST Travelstar 5K1000 HTS541010A9E680, TN LED, 1366x768, 15.60 | Lenovo Ideapad 310-15ISK 6500U, GeForce 920MX, WDC Scorpio Blue WD10JPCX-24UE4T0, TN LED, 1366x768, 15.60 | Toshiba Satellite C55-C-1NE 5005U, GeForce 920M, Toshiba MQ01ABD100, TN, 1366x768, 15.60 | |
|---|---|---|---|---|---|
| Power Consumption | -120% | -26% | -55% | -23% | |
| Idle Minimum * | 5.22 | 11.84 -127% | 4 23% | 7 -34% | 4.2 20% |
| Idle Average * | 5.67 | 14.16 -150% | 6.5 -15% | 8 -41% | 6.6 -16% |
| Idle Maximum * | 7.82 | 14.46 -85% | 7 10% | 8.4 -7% | 7.5 4% |
| Load Average * | 19.67 | 51.69 -163% | 36 -83% | 38.8 -97% | 36.3 -85% |
| Load Maximum * | 26.72 | 46.56 -74% | 43.6 -63% | 52.8 -98% | 36.5 -37% |
* ... más pequeño es mejor
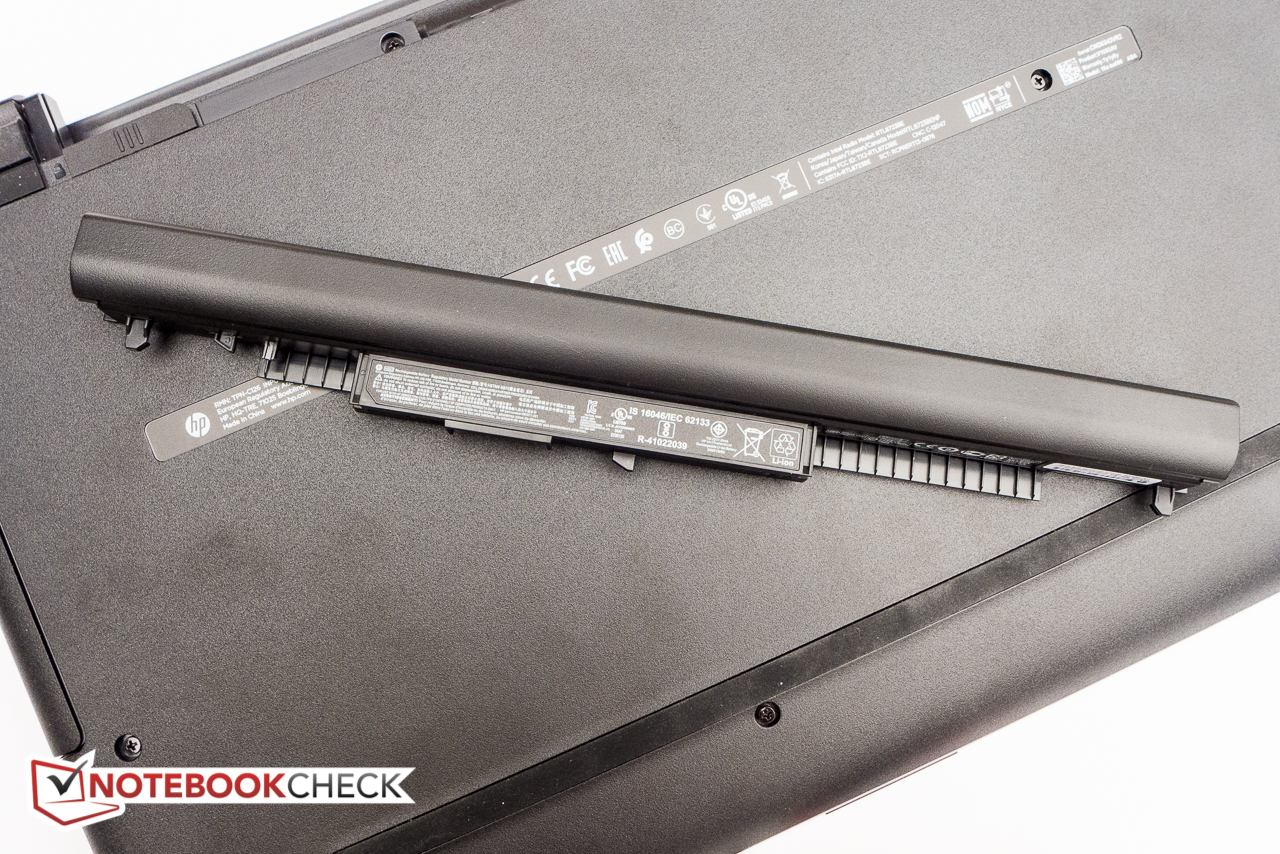
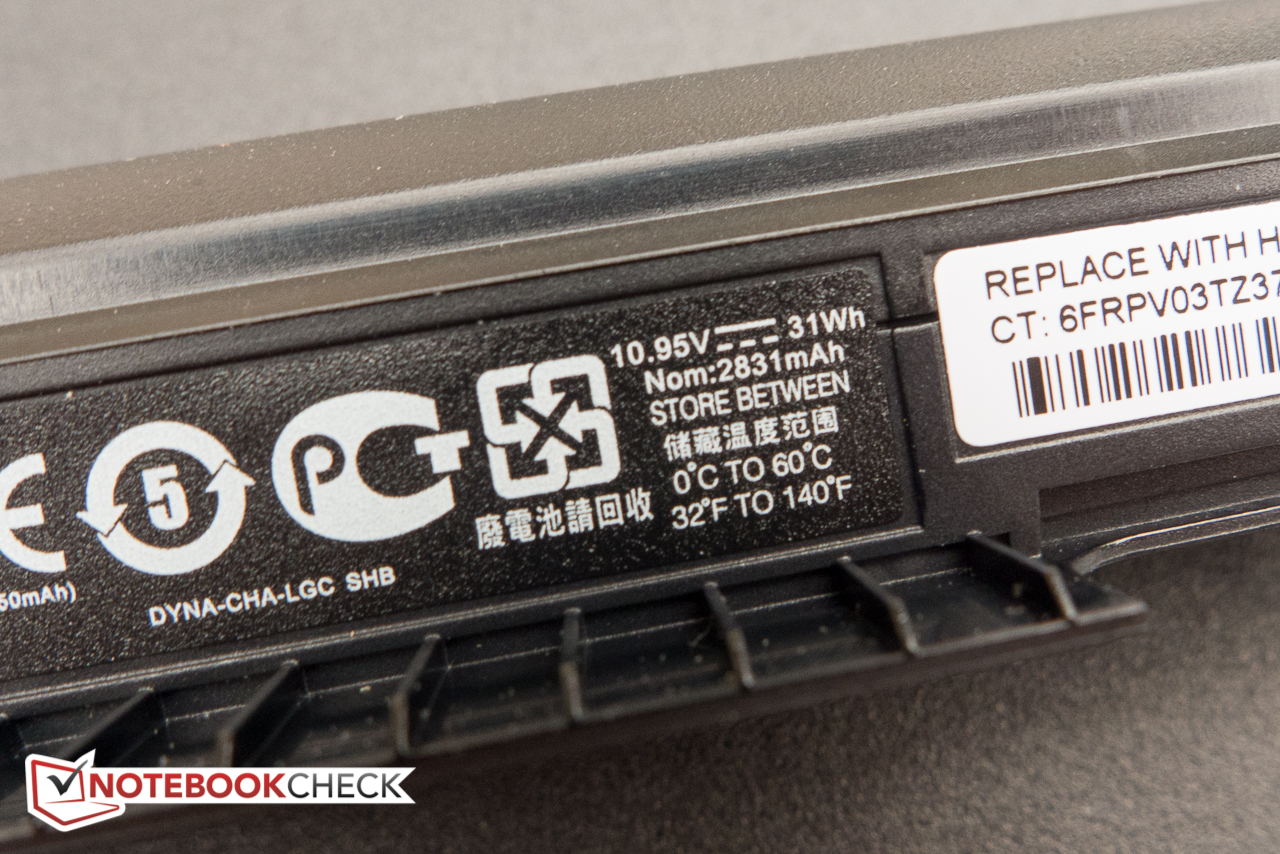
| HP 15z-ba000 A6-7310, Radeon R4 (Beema), 31 Wh | Acer Aspire E5-574-53YZ 6267U, Iris Graphics 550, 37 Wh | HP 250 G4 T6P08ES 5200U, Radeon R5 M330, 41 Wh | Lenovo Ideapad 310-15ISK 6500U, GeForce 920MX, 31 Wh | Toshiba Satellite C55-C-1NE 5005U, GeForce 920M, 44 Wh | |
|---|---|---|---|---|---|
| Duración de Batería | -40% | 23% | 34% | 49% | |
| Reader / Idle | 511 | 273 -47% | 667 31% | ||
| WiFi v1.3 | 247 | 180 -27% | 342 38% | 332 34% | 367 49% |
| Load | 115 | 61 -47% | 115 0% |
Pro
Contra

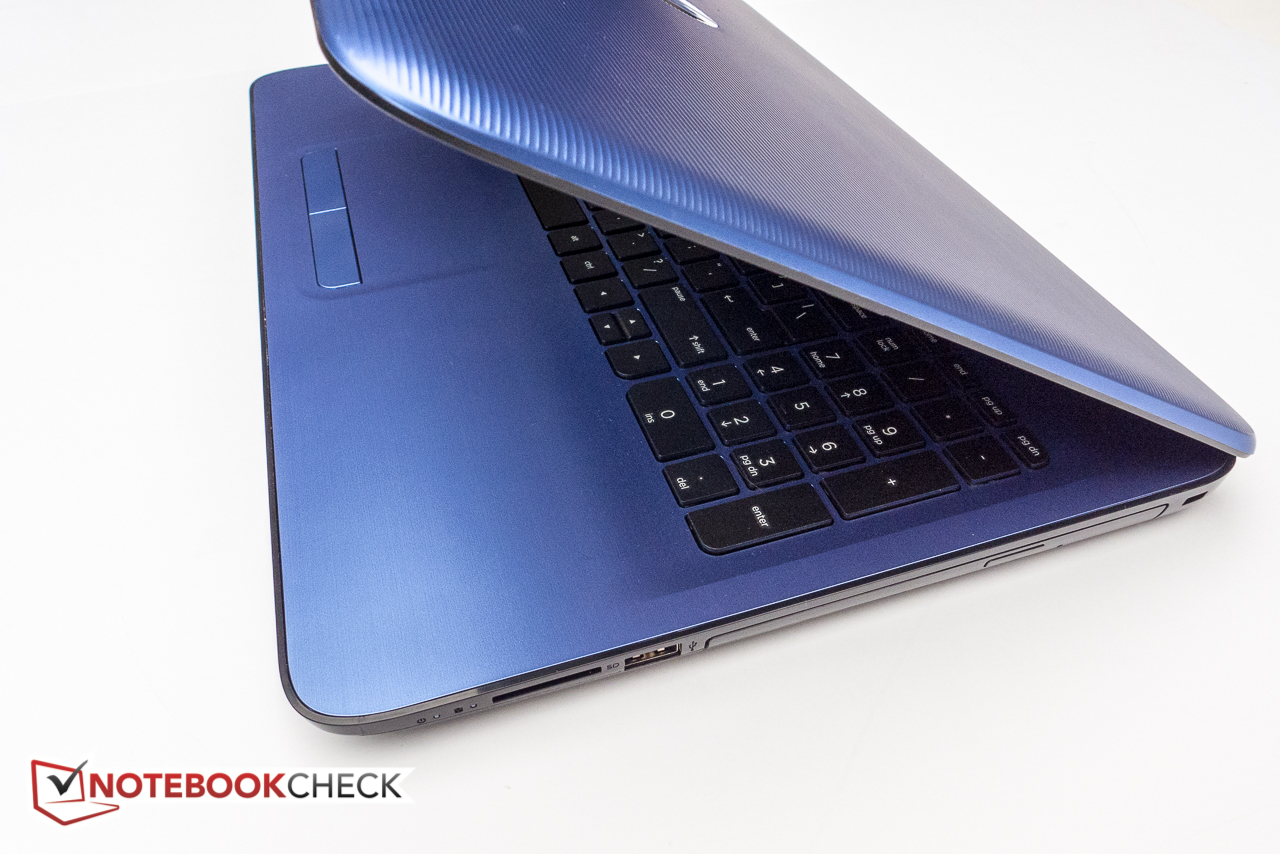
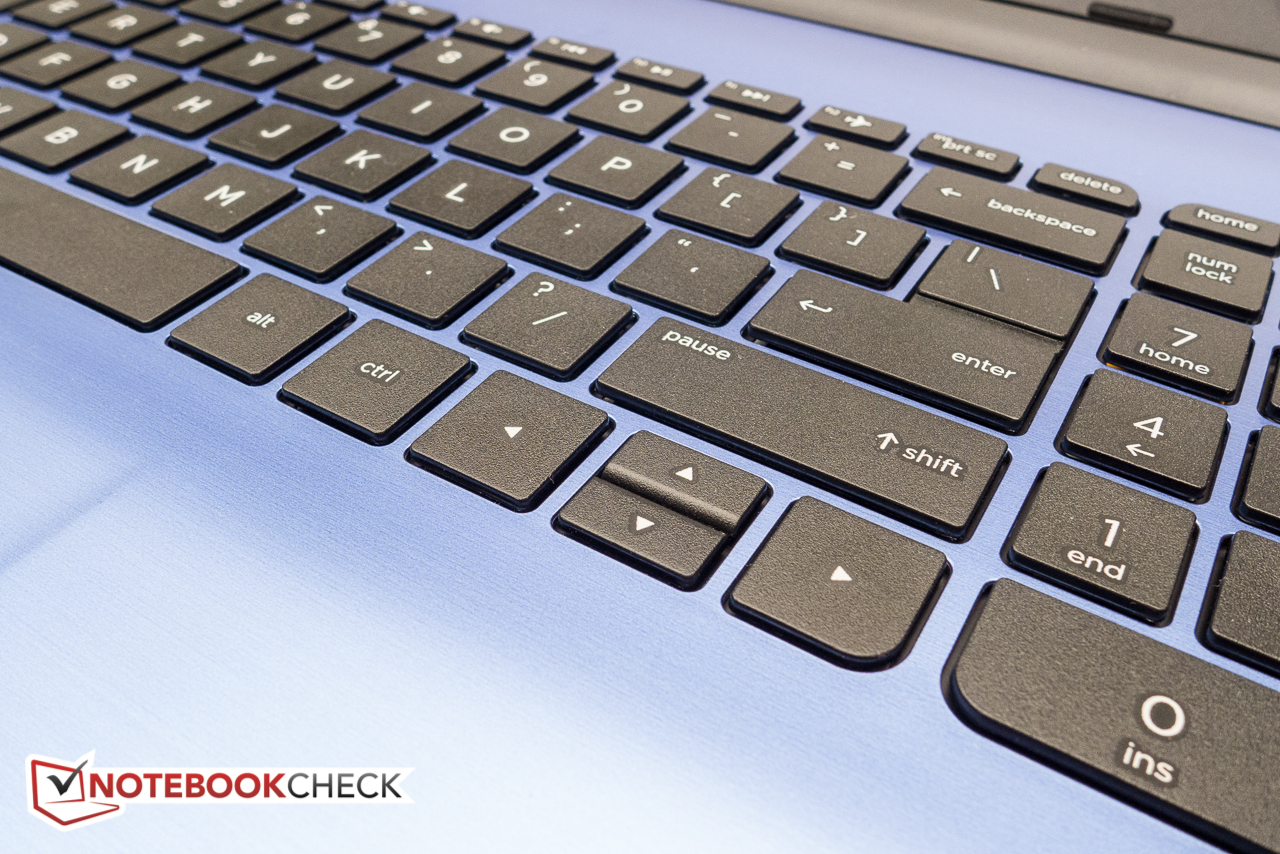
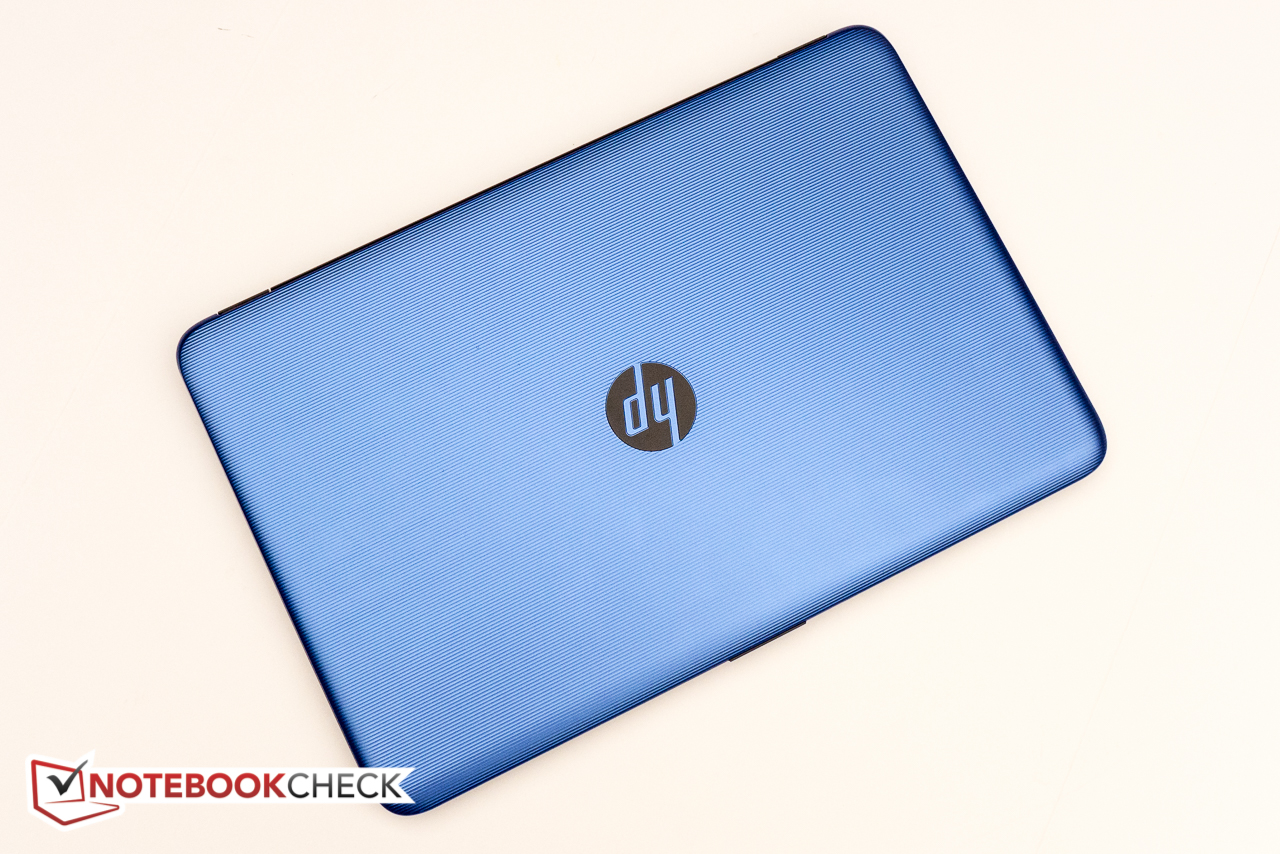
El HP 15z parece atractivo, funciona fresco, aguanta una cantidad de tiempo razonable con su carga y - gracias al SSD - ofrece un rendimiento subjetivo suficiente a pesar de las puntuaciones sintéticas nada estelares. La APU AMD no es ningún relámpago - por lo que agradecemos los 8 GB de RAM y el SSD, que hacen su parte a la hora de mejorar el rendimiento. El display TN es sorprendentemente bueno y bastante billante además. El teclado tampoco decepciona, pero al touchpad hay que habituarse. Basicamente cualquier gráfica integrada Intel dejará atras a la Radeon R4, empero - e incluso las GPUs dedicadas más básicas como la GeForce 920M del Toshiba Satellite C55-C-1NE ofrecen el doble de frame rates que el chip integrado Radeon.
Para tareas básicas como el procesado de textos o ver vídeos, el Hp 15z no es una mala elección. Los Power users y hasta los jugones más casuales deberán buscar en otra parte.
Las versiones del Aspire E5-575G, que ya analizamos - por ejemplo con la CPU Core i5-6200U, 8GB de RAM, 1 TB de HDD, y GPU dedicada GeForce 940MX - se pueden encontrar por unos $500. A menos que HP o los minoristas bajen mucho el precio, el 15z no es precisamente una ganga.
Ésta es una versión acortada del análisis original. Puedes leer el análisis completo en inglés aquí.
HP 15z-ba000
-
10/02/2016 v5.1(old)
Bernhard Pechlaner
Pricecompare
