 Deutsch
 English
 Español
 Français
 Italiano
 Nederlands
 Polski
 Português
 Русский
 Türkçe
 Svenska
 Chinese
 Magyar
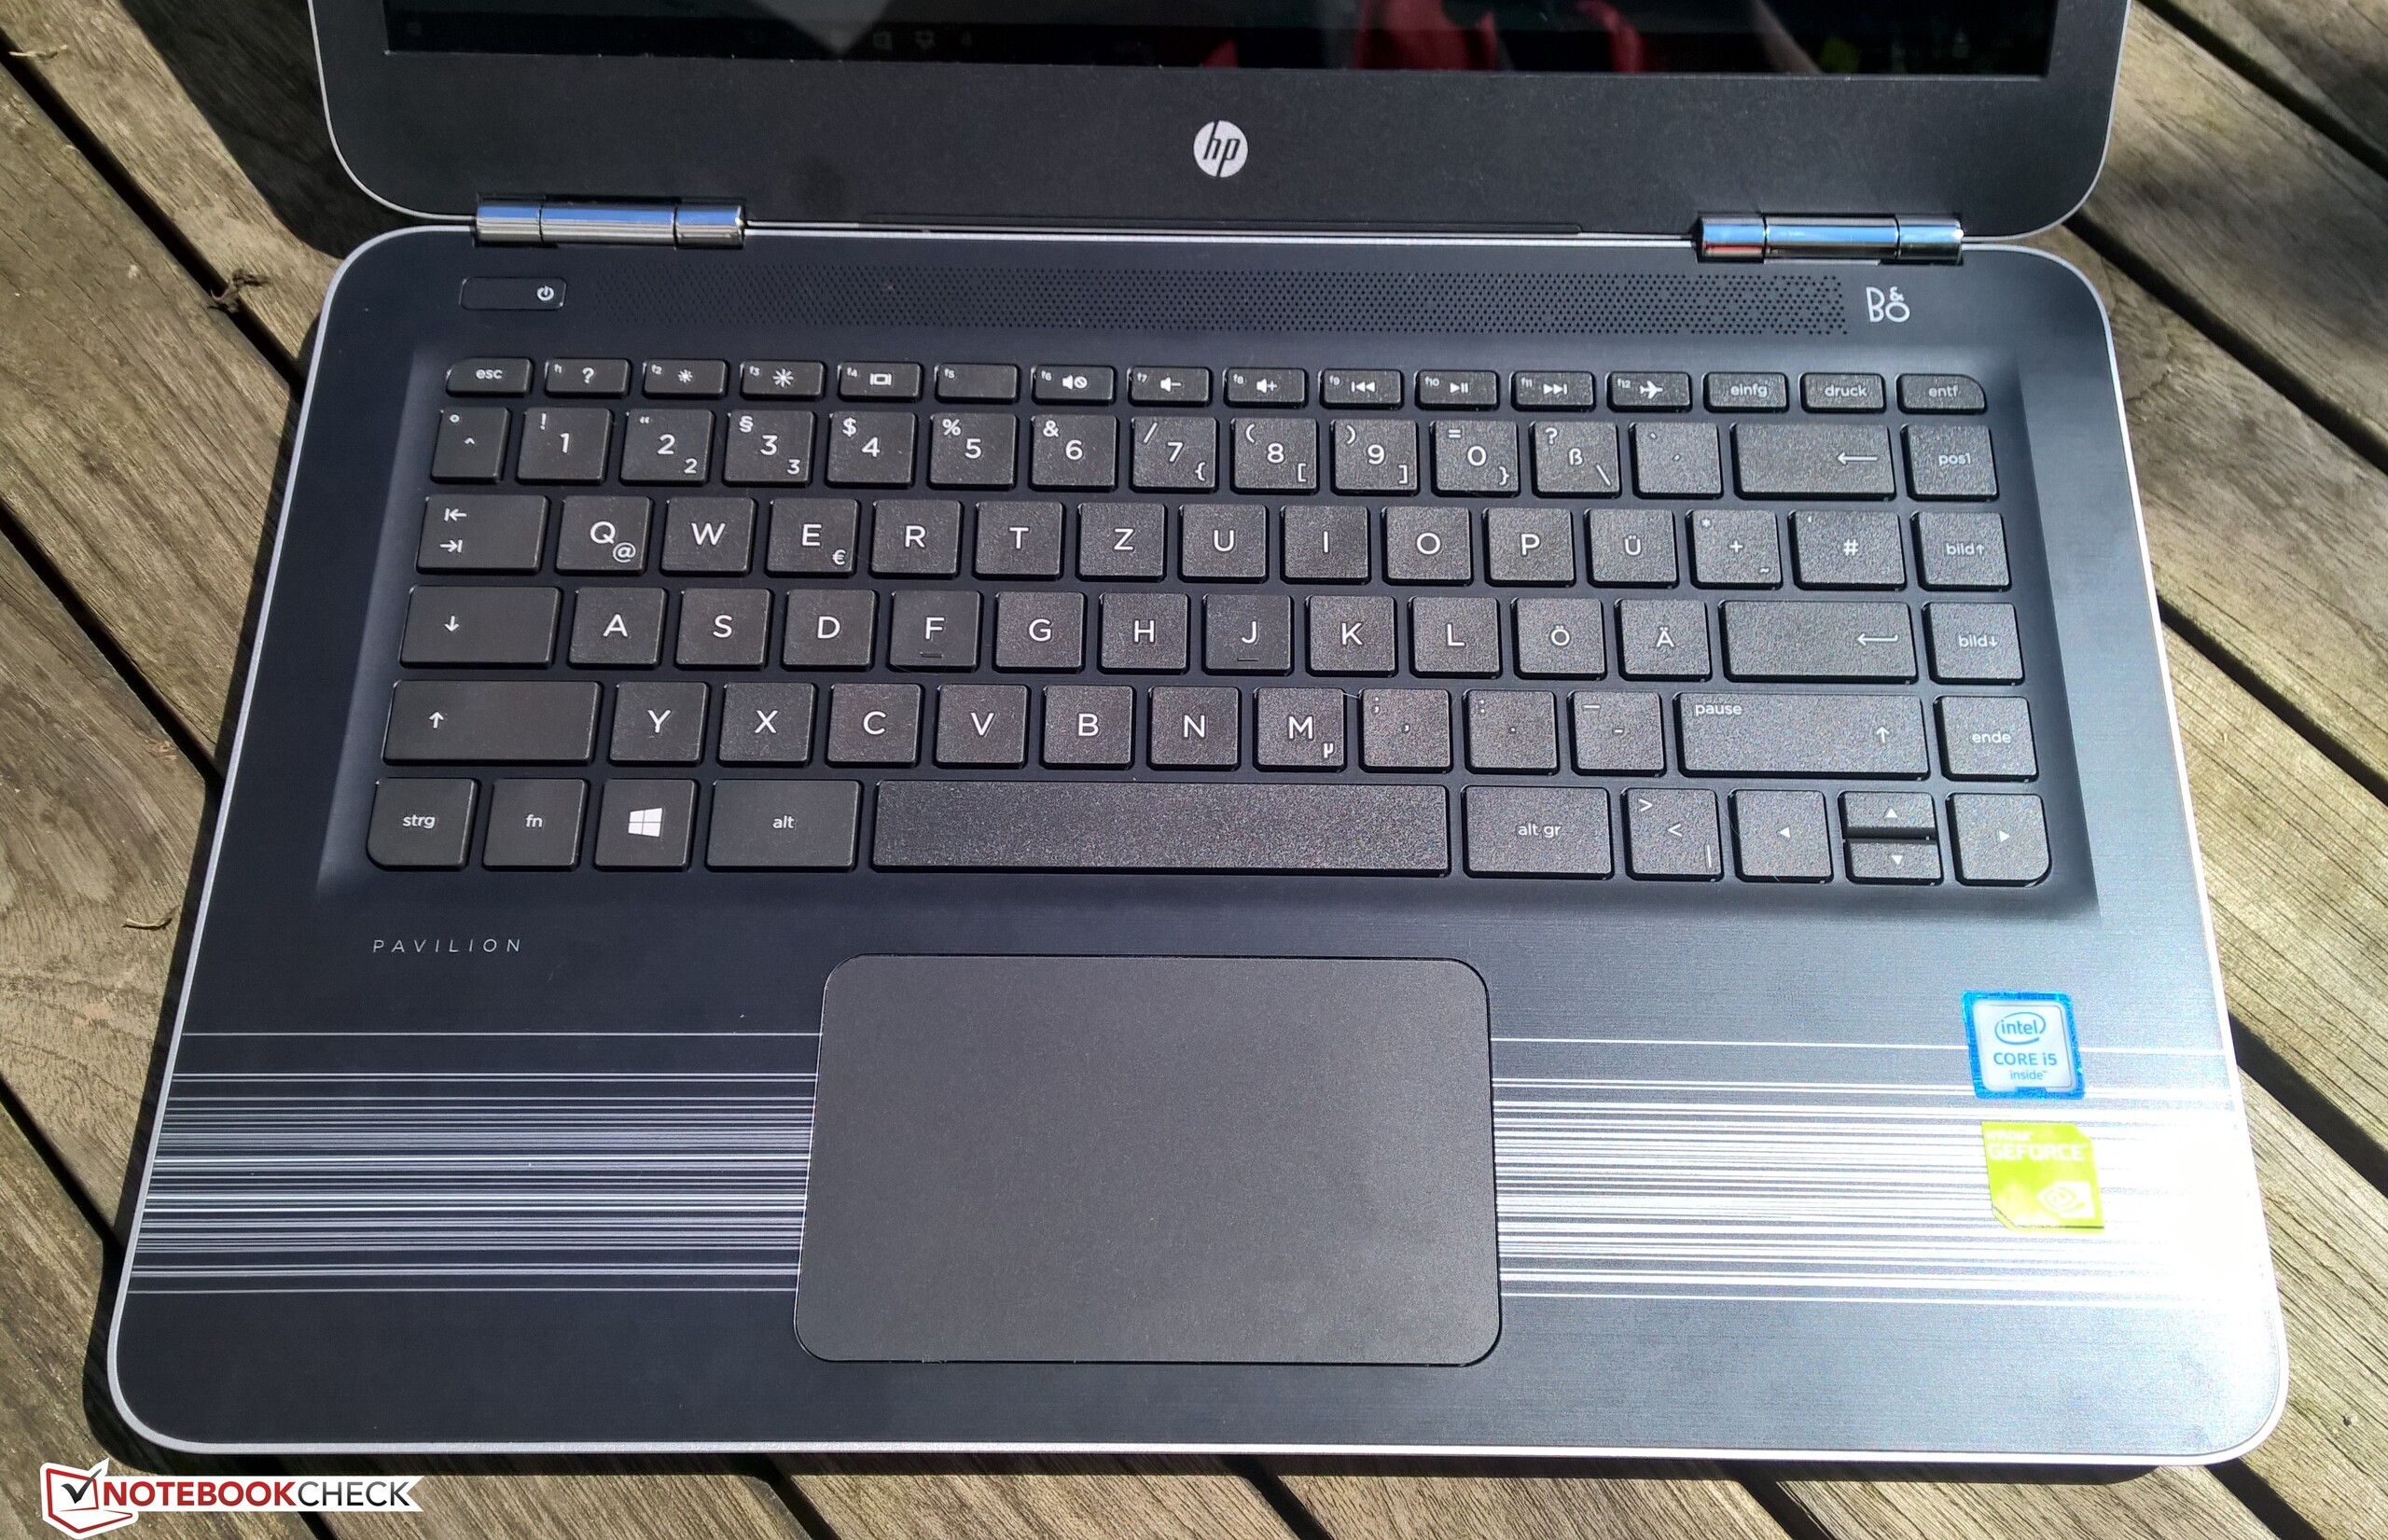
Breve análisis del HP Pavilion 14-al003ng
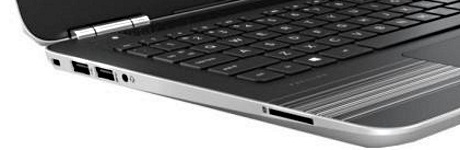
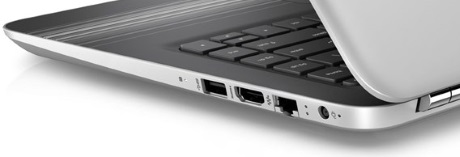
Connectivity
| SD Card Reader | |
| average JPG Copy Test (av. of 3 runs) | |
| Dell XPS 13 2016 9350 (FHD, i7-6560U) | |
| Dell Latitude 12 E7270 | |
| HP Pavilion 14-al003ng | |
| Lenovo Ideapad 500s-14ISK | |
| maximum AS SSD Seq Read Test (1GB) | |
| Dell XPS 13 2016 9350 (FHD, i7-6560U) | |
| Dell Latitude 12 E7270 | |
| Lenovo Ideapad 500s-14ISK | |
| HP Pavilion 14-al003ng | |
| Networking | |
| iperf Server (receive) TCP 1 m | |
| Dell XPS 13 2016 9350 (FHD, i7-6560U) | |
| iperf Client (transmit) TCP 1 m | |
| Dell XPS 13 2016 9350 (FHD, i7-6560U) | |
| |||||||||||||||||||||||||
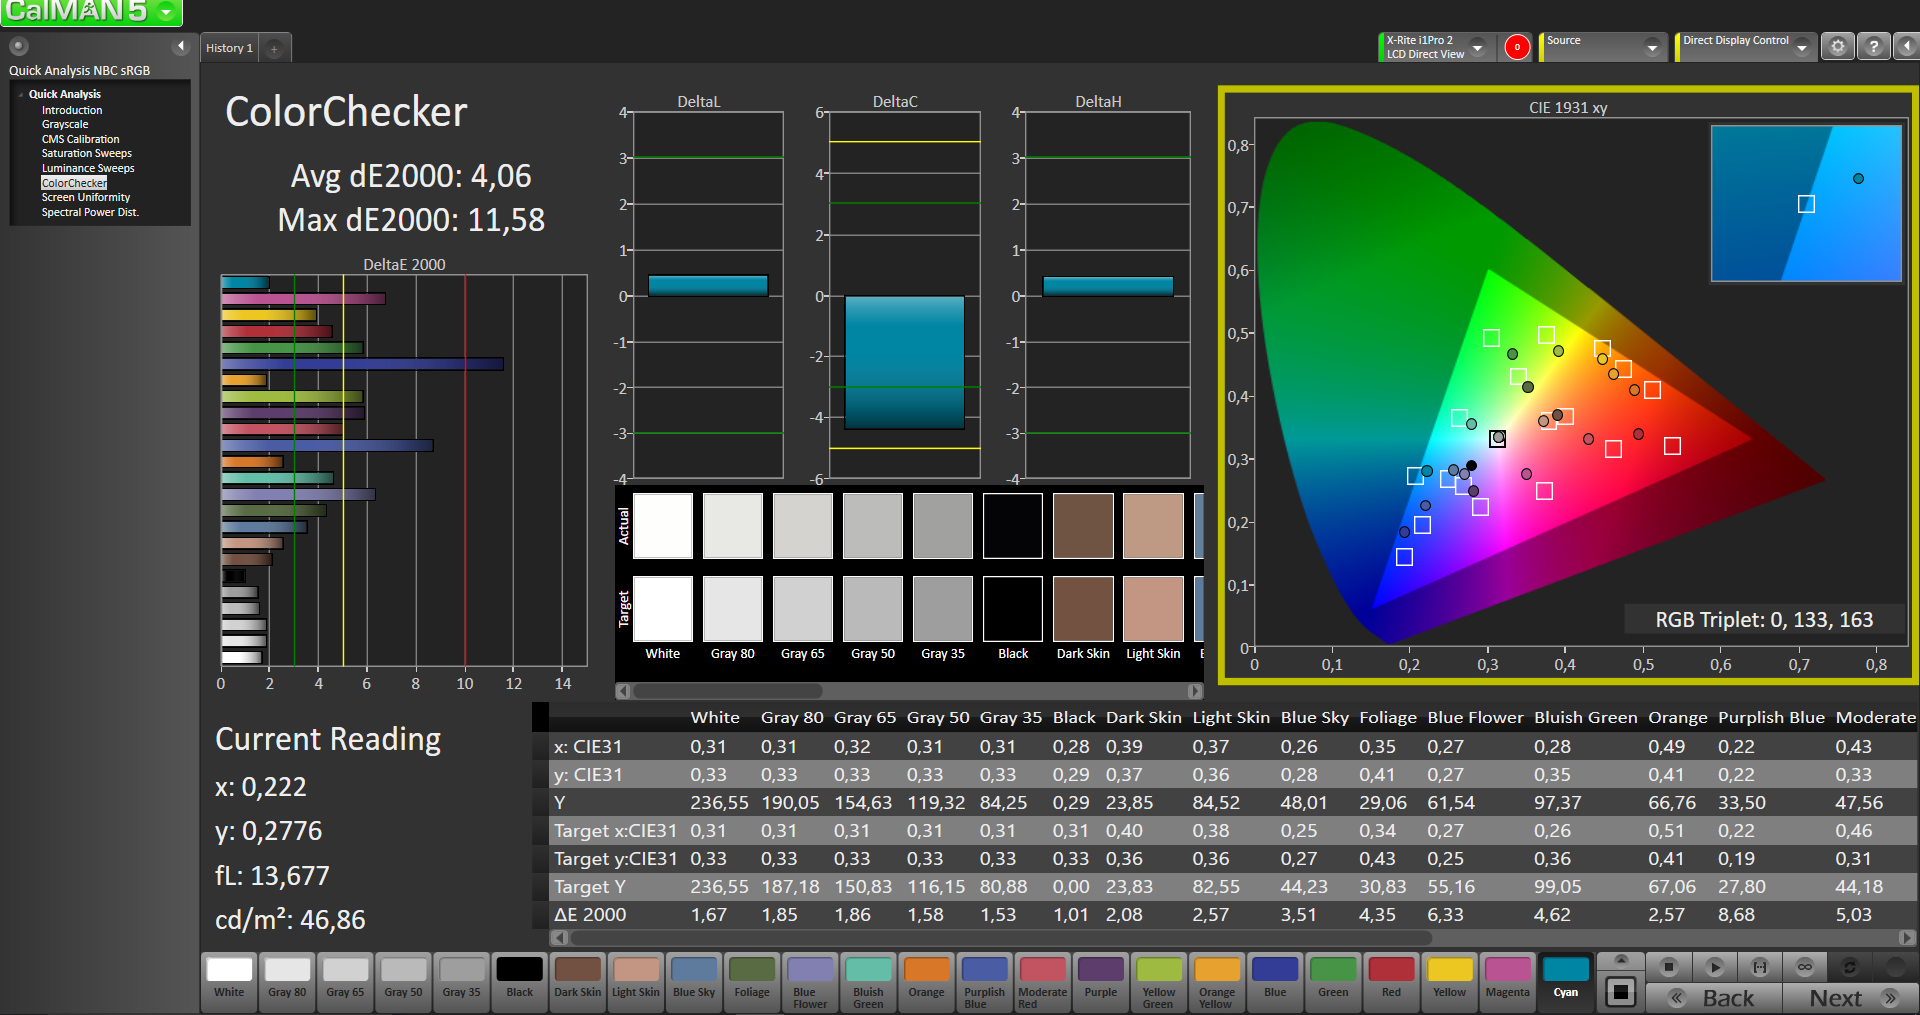
iluminación: 88 %
Brillo con batería: 220 cd/m²
Contraste: 786:1 (Negro: 0.28 cd/m²)
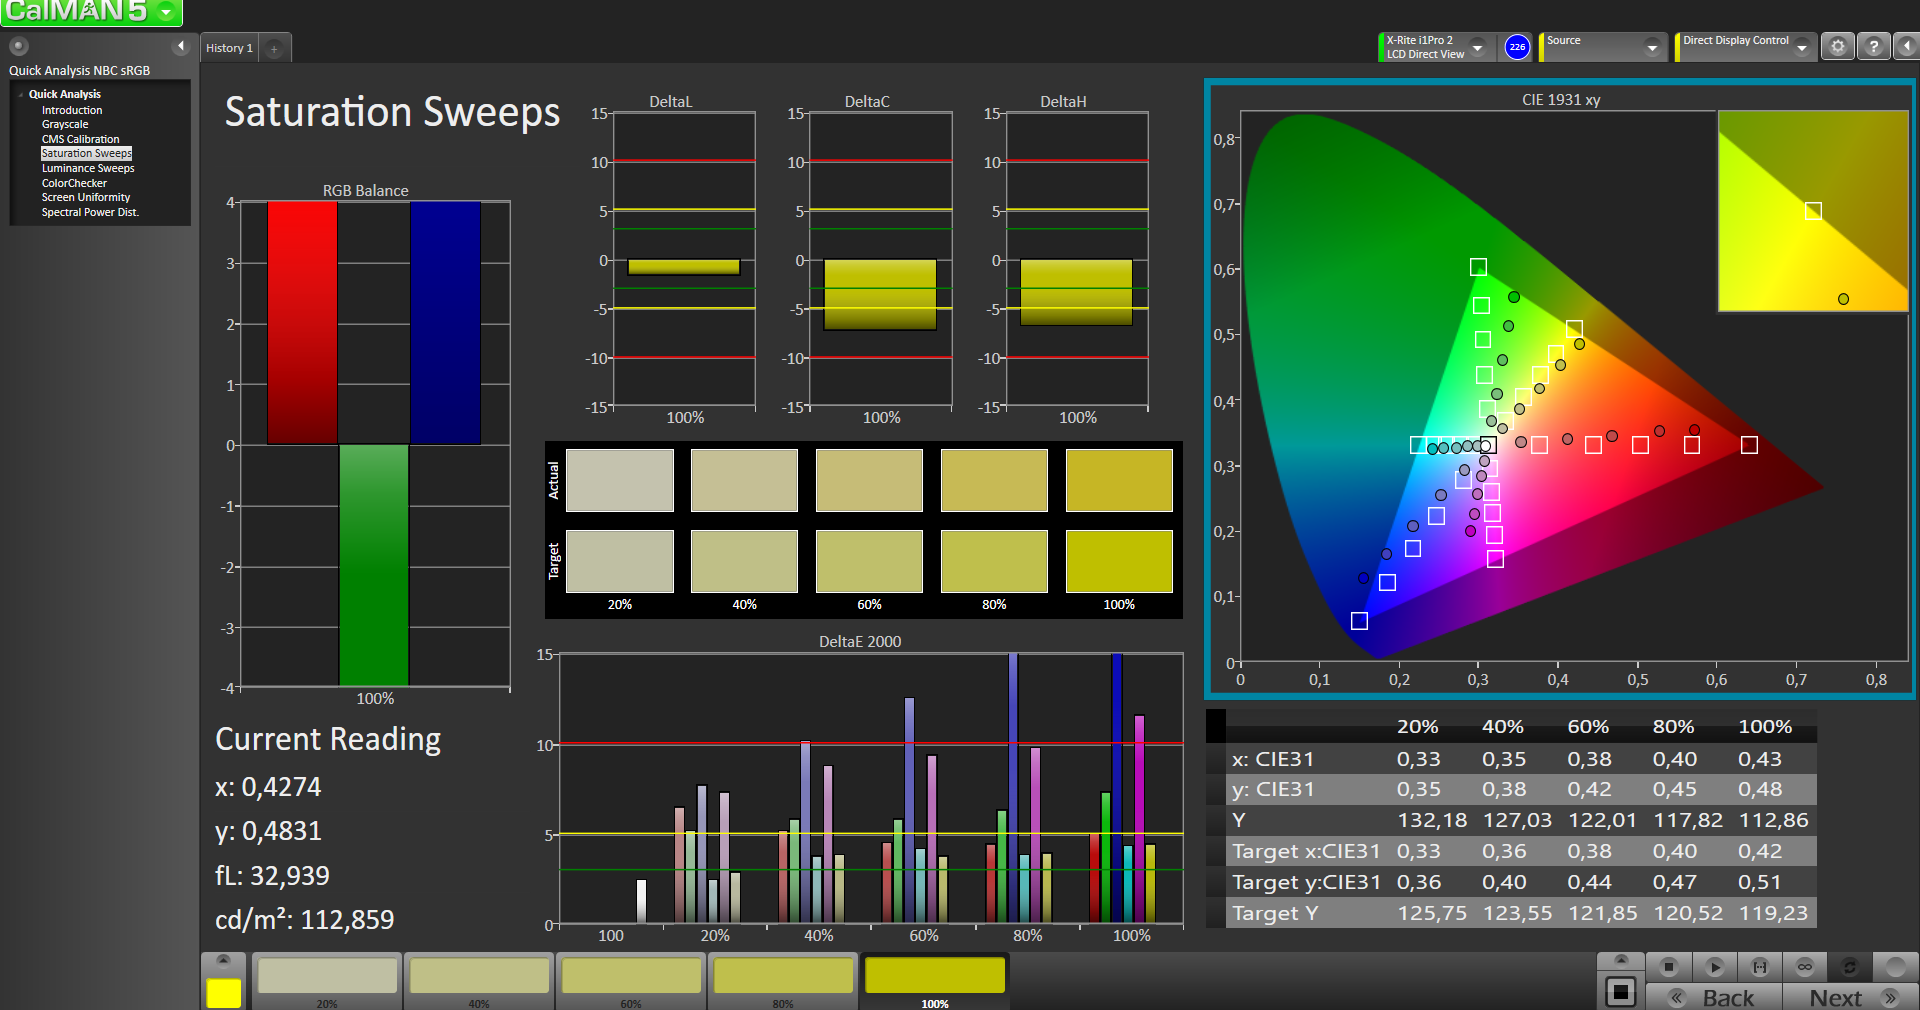
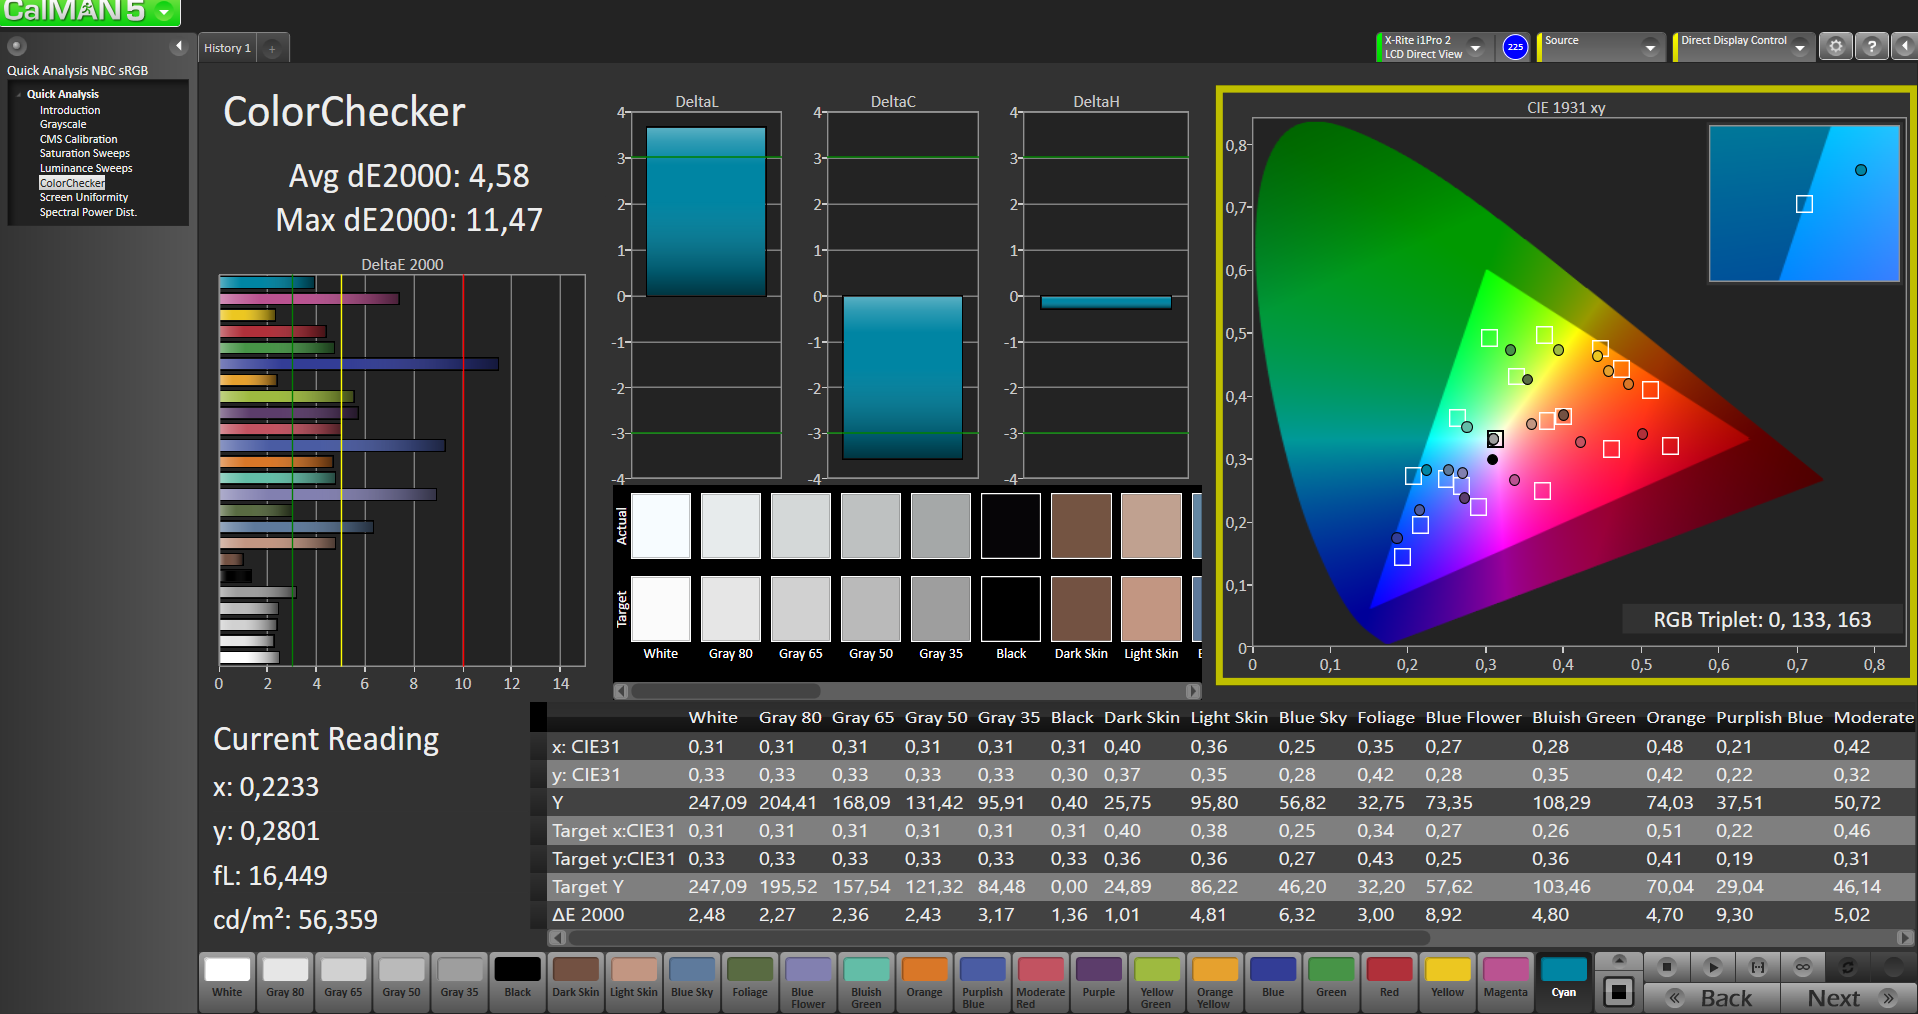
ΔE Color 4.58 | 0.5-29.43 Ø5
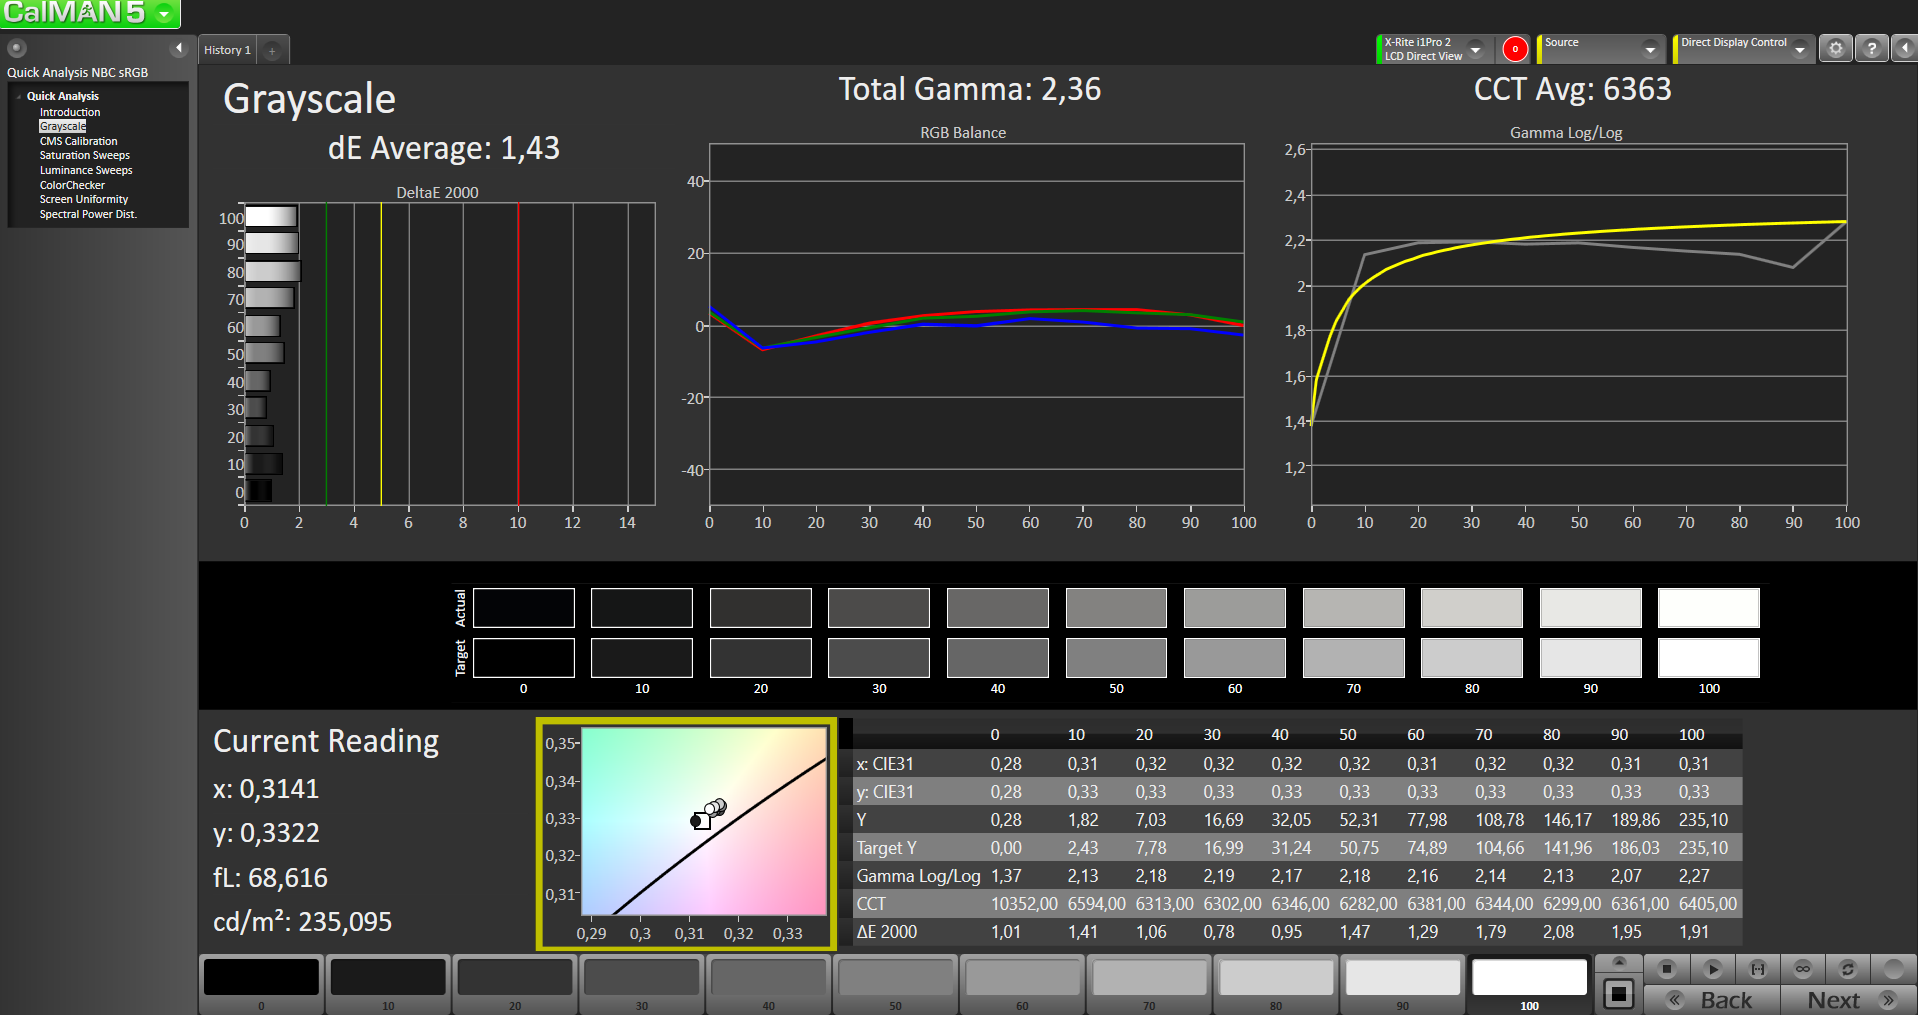
ΔE Greyscale 2.34 | 0.57-98 Ø5.3
54.2% sRGB (Argyll 1.6.3 3D)
34.6% AdobeRGB 1998 (Argyll 1.6.3 3D)
Gamma: 2.26
| HP Pavilion 14-al003ng AUO203D, , 1920x1080, 14.00 | Lenovo Ideapad 500s-14ISK Chi Mei CMN14A7, , 1920x1080, 14.00 | Acer Aspire E5-473G-59QT AU Optronics AUO1B3D, , 1920x1080, 14.00 | Dell XPS 13 2016 9350 (FHD, i7-6560U) Sharp SHP1449 LQ133M1, , 1920x1080, 13.30 | |
|---|---|---|---|---|
| Display | ||||
| Display P3 Coverage | 40.74 | 37.82 | 54.8 | |
| sRGB Coverage | 60.6 | 56.9 | 82.3 | |
| AdobeRGB 1998 Coverage | 42.15 | 39.07 | 56.6 | |
| Response Times | -5% | -8% | ||
| Response Time Grey 50% / Grey 80% * | 36.4 ? | 43 ? -18% | 42.8 ? -18% | |
| Response Time Black / White * | 25.2 ? | 23 ? 9% | 24.8 ? 2% | |
| PWM Frequency | ||||
| Screen | -52% | -71% | 45% | |
| Brightness middle | 220 | 249 13% | 238 8% | 385 75% |
| Brightness | 209 | 235 12% | 228 9% | 350 67% |
| Brightness Distribution | 88 | 87 -1% | 90 2% | 86 -2% |
| Black Level * | 0.28 | 0.44 -57% | 0.54 -93% | 0.17 39% |
| Contrast | 786 | 566 -28% | 441 -44% | 2265 188% |
| Colorchecker dE 2000 * | 4.58 | 9.47 -107% | 10.64 -132% | 4.17 9% |
| Colorchecker dE 2000 max. * | 11.47 | 15.41 -34% | 7.61 34% | |
| Greyscale dE 2000 * | 2.34 | 10.22 -337% | 11.74 -402% | 5.39 -130% |
| Gamma | 2.26 97% | 2.34 94% | 2.42 91% | 2.12 104% |
| CCT | 6661 98% | 11451 57% | 13043 50% | 7404 88% |
| Color Space (Percent of AdobeRGB 1998) | 34.6 | 39 13% | 36 4% | 62.7 81% |
| Color Space (Percent of sRGB) | 54.2 | 57 5% | 57 5% | 99.8 84% |
| Media total (Programa/Opciones) | -29% /
-44% | -71% /
-71% | 19% /
36% |
* ... más pequeño es mejor
Tiempos de respuesta del display
| ↔ Tiempo de respuesta de Negro a Blanco | ||
|---|---|---|
| 25.2 ms ... subida ↗ y bajada ↘ combinada | ↗ 14 ms subida | 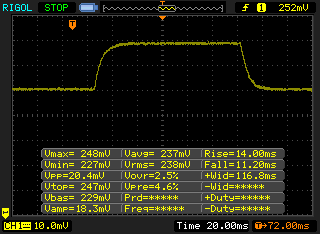 |
| ↘ 11.2 ms bajada | ||
| La pantalla mostró tiempos de respuesta relativamente lentos en nuestros tests pero podría ser demasiado lenta para los jugones. En comparación, todos los dispositivos de prueba van de ##min### (mínimo) a 240 (máximo) ms. » 55 % de todos los dispositivos son mejores. Eso quiere decir que el tiempo de respuesta es peor que la media (21.5 ms) de todos los dispositivos testados. | ||
| ↔ Tiempo de respuesta 50% Gris a 80% Gris | ||
| 36.4 ms ... subida ↗ y bajada ↘ combinada | ↗ 18 ms subida | 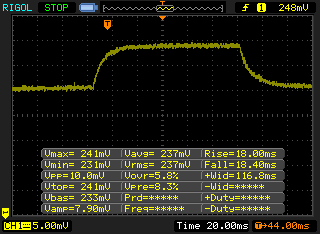 |
| ↘ 18.4 ms bajada | ||
| La pantalla mostró tiempos de respuesta lentos en nuestros tests y podría ser demasiado lenta para los jugones. En comparación, todos los dispositivos de prueba van de ##min### (mínimo) a 636 (máximo) ms. » 46 % de todos los dispositivos son mejores. Eso quiere decir que el tiempo de respuesta es similar al dispositivo testado medio (33.7 ms). | ||
Parpadeo de Pantalla / PWM (Pulse-Width Modulation)
| Parpadeo de Pantalla / PWM no detectado | ||
Comparación: 53 % de todos los dispositivos testados no usaron PWM para atenuar el display. Si se usó, medimos una media de 17915 (mínimo: 5 - máxmo: 3846000) Hz. | ||


| PCMark 8 Home Score Accelerated v2 | 3238 puntos | |
ayuda | ||
| HP Pavilion 14-al003ng SanDisk Z400s 256 GB M.2 2280 | Dell XPS 13 2016 9350 (FHD, i7-6560U) Samsung PM951 NVMe MZ-VLV256D | Lenovo Ideapad 500s-14ISK Samsung PM871 MZYLN256HCHP | Acer Aspire E5-473G-59QT Seagate ST500LM000 Solid State Hybrid Drive | Lenovo ThinkPad T460s-20F9003SGE Samsung CM871 MZ7LF192HCGS | Apple MacBook Pro Retina 13 inch 2015-03 Apple SSD SM0128G | |
|---|---|---|---|---|---|---|
| CrystalDiskMark 3.0 | 99% | 63% | -89% | -47% | 77% | |
| Read Seq | 469.3 | 1131 141% | 507 8% | 113.7 -76% | 446.5 -5% | 1403 199% |
| Write Seq | 309.1 | 311.4 1% | 309.5 0% | 110.1 -64% | 171.1 -45% | 657 113% |
| Read 4k | 14 | 39.63 183% | 36.24 159% | 0.369 -97% | 5.78 -59% | 20.95 50% |
| Write 4k | 73.9 | 133.9 81% | 93.3 26% | 0.762 -99% | 35.47 -52% | 32.43 -56% |
| Read 4k QD32 | 149.5 | 399.7 167% | 394.5 164% | 0.377 -100% | 94.9 -37% | 343.6 130% |
| Write 4k QD32 | 204.6 | 245.6 20% | 241.6 18% | 0.738 -100% | 36.43 -82% | 254.4 24% |

| 3DMark 11 - 1280x720 Performance GPU | |
| HP Pavilion 15-ak003ng | |
| HP Pavilion 14-al003ng | |
| Lenovo Ideapad 500s-14ISK | |
| Apple MacBook Pro Retina 13 inch 2015-03 | |
| Lenovo ThinkPad T460s-20F9003SGE | |
| 3DMark 11 Performance | 2553 puntos | |
ayuda | ||
| bajo | medio | alto | ultra | |
| Dirt Rally (2015) | 106.2 | 34.97 | 26.07 | 14.93 |
Ruido
| Ocioso |
| 29.2 / 29.2 / 30.8 dB(A) |
| Carga |
| 38 / 44.3 dB(A) |
 | ||
30 dB silencioso 40 dB(A) audible 50 dB(A) ruidosamente alto |
||
min: | ||
(±) The maximum temperature on the upper side is 44.1 °C / 111 F, compared to the average of 36.9 °C / 98 F, ranging from 21.1 to 71 °C for the class Multimedia.
(±) The bottom heats up to a maximum of 44.9 °C / 113 F, compared to the average of 39.1 °C / 102 F
(+) In idle usage, the average temperature for the upper side is 30.1 °C / 86 F, compared to the device average of 31.2 °C / 88 F.
(+) The palmrests and touchpad are cooler than skin temperature with a maximum of 29.1 °C / 84.4 F and are therefore cool to the touch.
(±) The average temperature of the palmrest area of similar devices was 28.8 °C / 83.8 F (-0.3 °C / -0.6 F).
| Off / Standby | |
| Ocioso | |
| Carga |
|
Pro
Contra

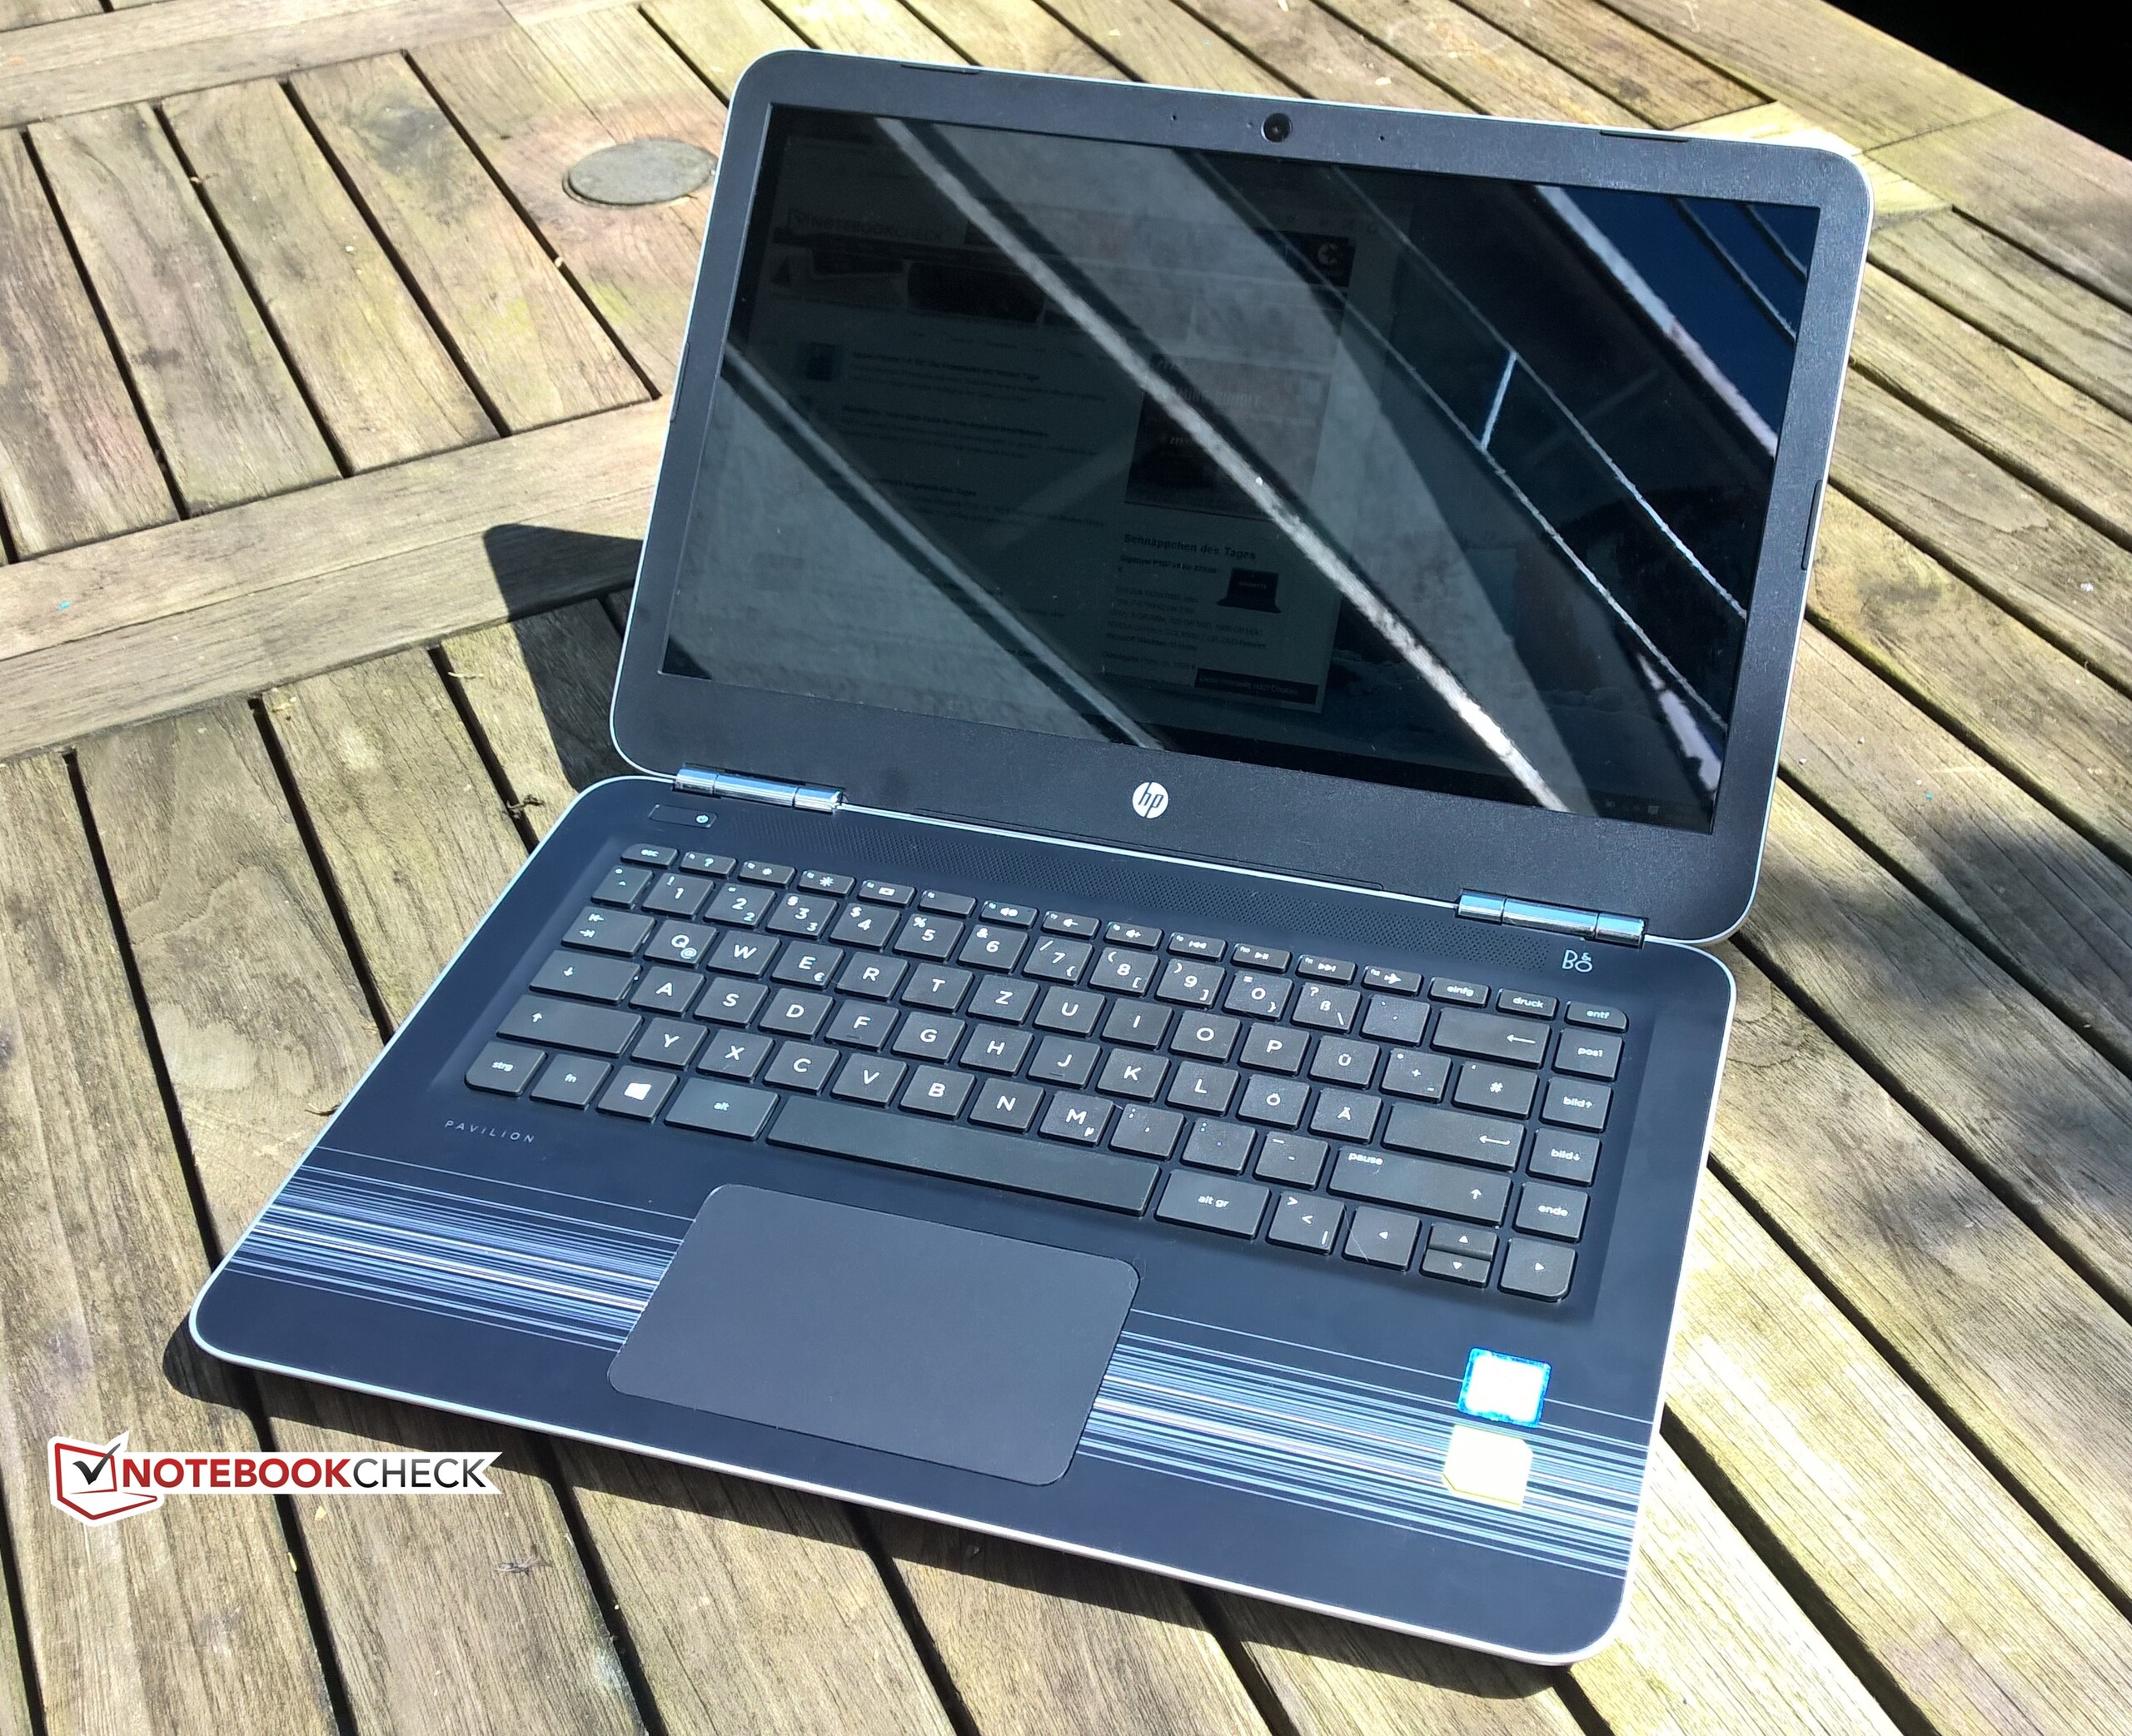
Con el Pavilion 14-al003ng, HP ofrece un surtido. Varios componentes convencen, mientras que otros no tanto. Los pros son, por ejemplo, que el dispositivo ni siquiera se ralentiza en el test de estrés. Hoy día hay dispositivos que no logran eso. Además, los altavoces no son malos, y la GPU Nvidia puede ejecutar con fluidez varios juegos. Lo que es más, el display tiene varias características buenas. En especial la tecnología IPS aumenta la impresión subjetiva de calidad.
Por otro lado, hay también muchos contras. Si bien el display usa tecnología IPS, HP debería haber incorporado un panel algo más brillante y antirreflejos. Los reflejos son a menudo muy molestos y casi imposibilita usar el dispositivo en ambientes iluminados. Por desgracia, la carcasa no parece de gran calidad y el ClickPad tiene varias características molestas. Además, el ventilador es muy molesto, ya que siempre está en marcha y en ocasiones pulsa.
Parece que HP quiere deslumbrar a los clientes con buenas especificaciones. El Pavilion pinta muy bien sobre el papel con SSD, GPU Nvidia, y display FHD IPS. A cambio, HP tiene que hacer recortes en lo básico.
Los aspectos negativos predominan. Sin embargo, el factor decisivo frente a una recomendación del HP Pavilion es el hardware de comunicación. En realidad, ya es imperdonable que HP sólo incluya Fast Ethernet en un portátil de 700 Euros, pero el rendimiento del módulo Wi-Fi integrado es horrible. En un momento en el que Internet se hace más y más importante y descargas muchos contenidos como juegos y películas, su rendimiento es sencillamente insuficiente.
Nota: Descontamos un 3% de la puntuación total por el mal rendimiento del adaptador Wi-Fi.
Ésta es una versión acortada del análisis original. Puedes leer el análisis completo en inglés aquí.
HP Pavilion 14-al003ng
-
08/08/2016 v5.1(old)
Benjamin Herzig