 Deutsch
 English
 Español
 Français
 Italiano
 Nederlands
 Polski
 Português
 Русский
 Türkçe
 Svenska
 Chinese
 Magyar
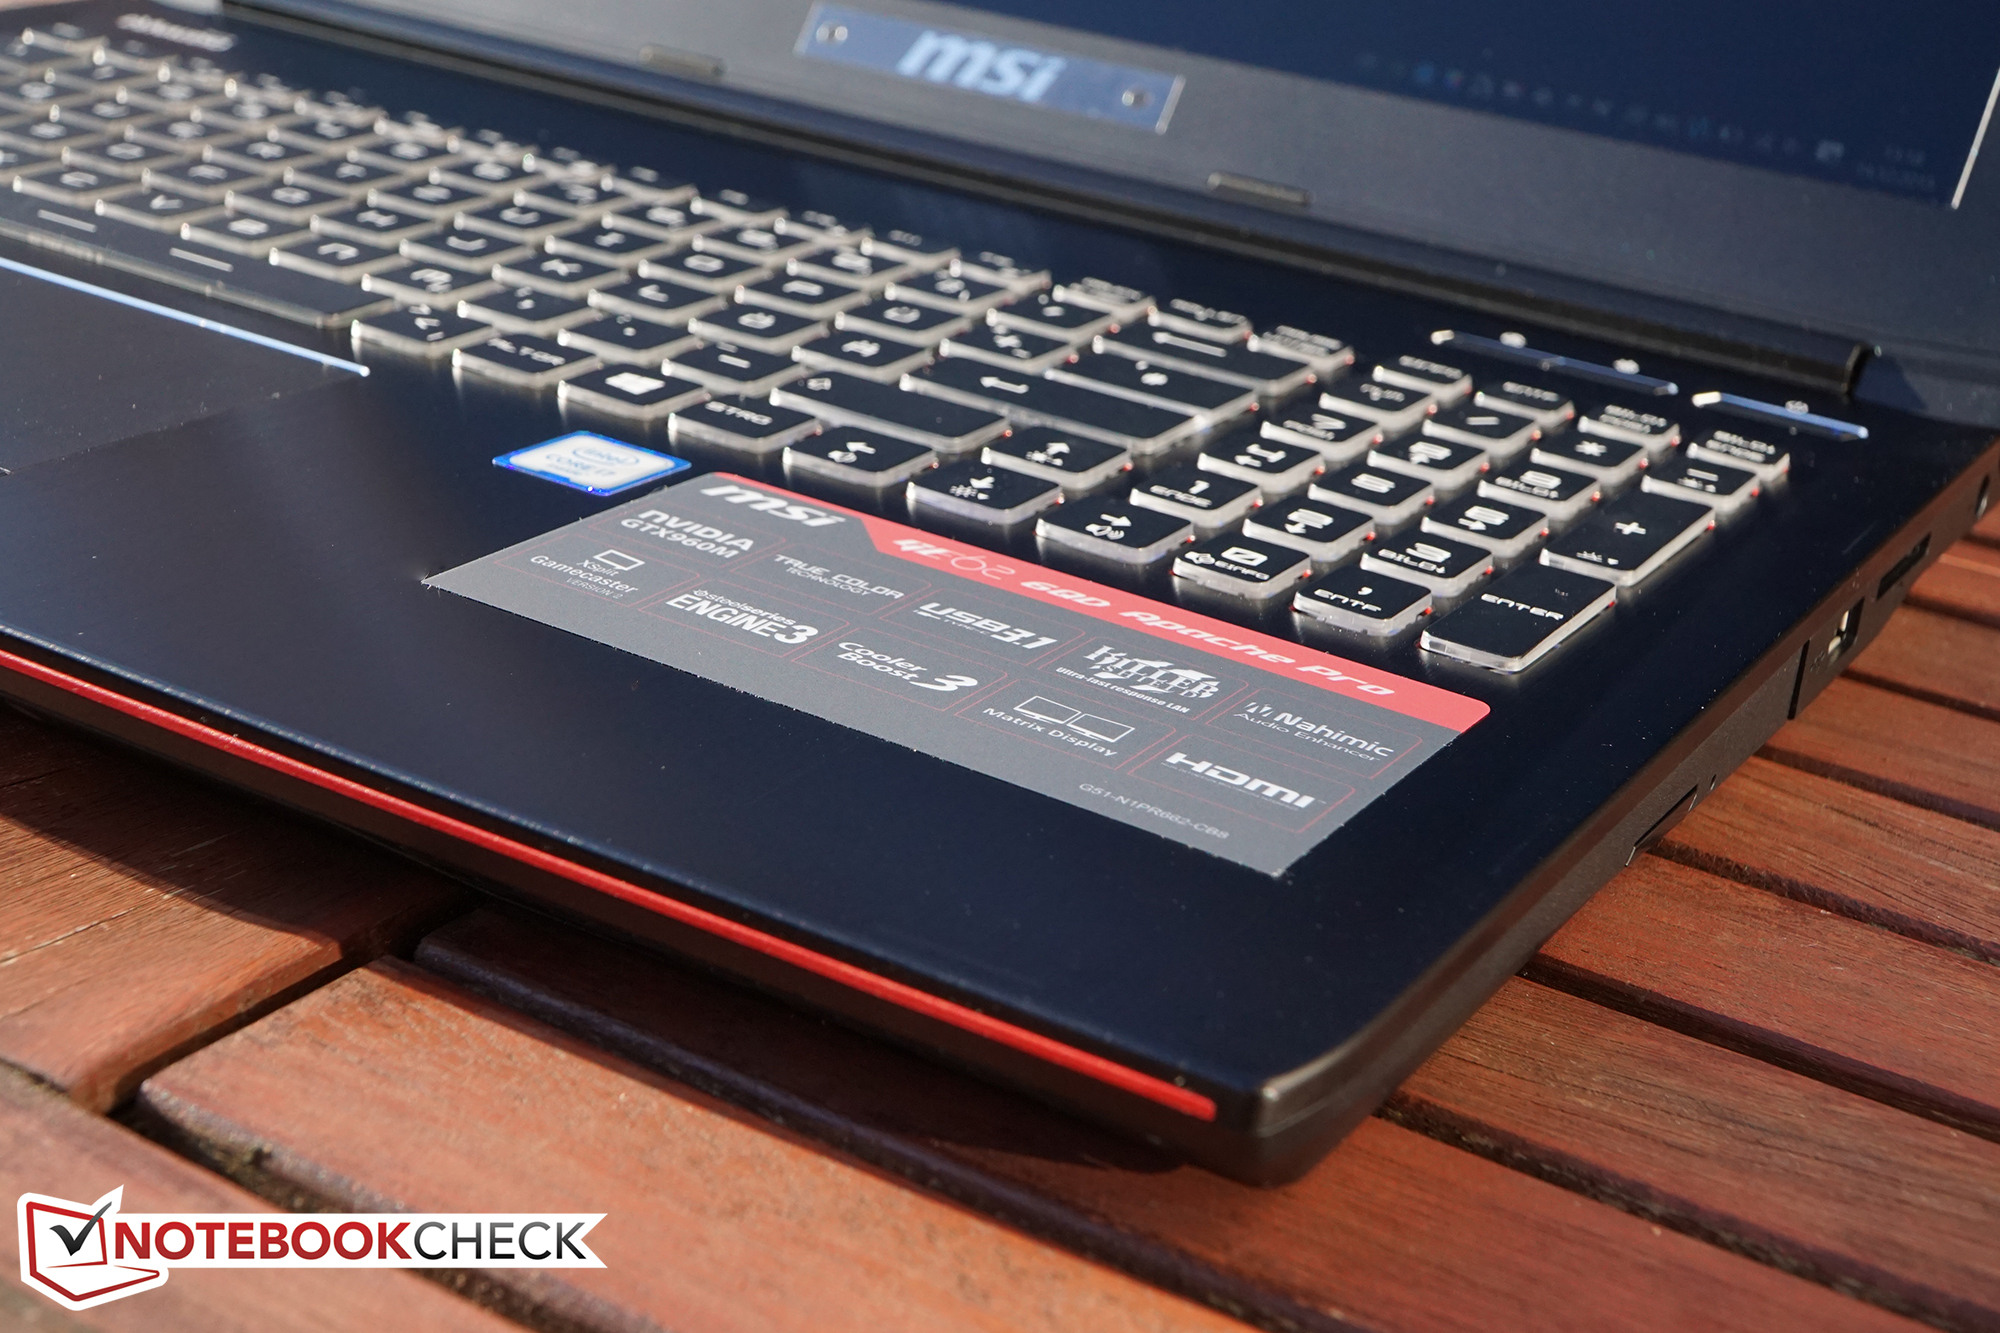
Breve análisis del MSI GE62 6QD Apache Pro


| |||||||||||||||||||||||||
iluminación: 88 %
Brillo con batería: 300 cd/m²
Contraste: 938:1 (Negro: 0.32 cd/m²)
ΔE Color 3.51 | 0.5-29.43 Ø5
ΔE Greyscale 2.52 | 0.57-98 Ø5.3
86% sRGB (Argyll 1.6.3 3D)
56% AdobeRGB 1998 (Argyll 1.6.3 3D)
62.5% AdobeRGB 1998 (Argyll 2.2.0 3D)
85.6% sRGB (Argyll 2.2.0 3D)
64.5% Display P3 (Argyll 2.2.0 3D)
Gamma: 2.38
| MSI GE62-6QD16H11 LG Philips LP156WF6 | MSI GE62-2QFUi716H11 Samsung SDC4852 | Nexoc G515 II LG Philips LP156WF4-SPL1 (LGD044F) | Lenovo Ideapad Y700 15ISK 80NW LG Philips | Dell Inspiron 15 7559 LG Philips LGD04D9 / 156UD2 / Dell P/N: 53FC4 | Alienware 15 R2 (Skylake) Samsung 4NDDJ_156HL (SDC4C48) | |
|---|---|---|---|---|---|---|
| Display | -14% | -36% | -36% | 2% | -34% | |
| Display P3 Coverage | 64.5 | 52.2 -19% | 38.59 -40% | 38.55 -40% | 63.4 -2% | 40.3 -38% |
| sRGB Coverage | 85.6 | 78.7 -8% | 57.8 -32% | 57.6 -33% | 90 5% | 60.2 -30% |
| AdobeRGB 1998 Coverage | 62.5 | 54 -14% | 39.88 -36% | 39.86 -36% | 64.6 3% | 41.67 -33% |
| Response Times | -11% | 1% | -31% | |||
| Response Time Grey 50% / Grey 80% * | 31 ? | 40.8 ? -32% | 32 ? -3% | 48.8 ? -57% | ||
| Response Time Black / White * | 27 ? | 24 ? 11% | 26 ? 4% | 28 ? -4% | ||
| PWM Frequency | 58.1 | 200 ? | ||||
| Screen | -22% | -35% | -45% | -35% | -39% | |
| Brightness middle | 300 | 268 -11% | 232 -23% | 258.6 -14% | 276 -8% | 180 -40% |
| Brightness | 291 | 227 -22% | 216 -26% | 242 -17% | 273 -6% | 179 -38% |
| Brightness Distribution | 88 | 74 -16% | 82 -7% | 88 0% | 85 -3% | 83 -6% |
| Black Level * | 0.32 | 0.39 -22% | 0.3 6% | 0.277 13% | 0.78 -144% | 0.19 41% |
| Contrast | 938 | 687 -27% | 773 -18% | 934 0% | 354 -62% | 947 1% |
| Colorchecker dE 2000 * | 3.51 | 4.12 -17% | 6.26 -78% | 8.1 -131% | 4.05 -15% | 6.74 -92% |
| Colorchecker dE 2000 max. * | 8.72 | |||||
| Greyscale dE 2000 * | 2.52 | 3.65 -45% | 4.98 -98% | 7.23 -187% | 4.68 -86% | 6.44 -156% |
| Gamma | 2.38 92% | 2.5 88% | 2.25 98% | 1.99 111% | 2.55 86% | 2.29 96% |
| CCT | 6759 96% | 6423 101% | 6968 93% | 6567 99% | 6871 95% | 6465 101% |
| Color Space (Percent of AdobeRGB 1998) | 56 | 49 -12% | 37 -34% | 36.5 -35% | 58 4% | 38 -32% |
| Color Space (Percent of sRGB) | 86 | 58 -33% | 57.2 -33% | 90 5% | 60 -30% | |
| Media total (Programa/Opciones) | -18% /
-19% | -36% /
-35% | -31% /
-38% | -11% /
-22% | -35% /
-37% |
* ... más pequeño es mejor
Tiempos de respuesta del display
| ↔ Tiempo de respuesta de Negro a Blanco | ||
|---|---|---|
| 27 ms ... subida ↗ y bajada ↘ combinada | ↗ 8 ms subida | 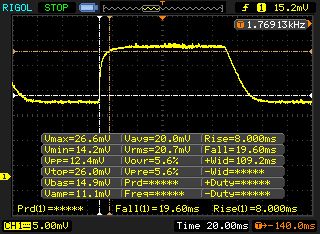 |
| ↘ 19 ms bajada | ||
| La pantalla mostró tiempos de respuesta relativamente lentos en nuestros tests pero podría ser demasiado lenta para los jugones. En comparación, todos los dispositivos de prueba van de ##min### (mínimo) a 240 (máximo) ms. » 63 % de todos los dispositivos son mejores. Eso quiere decir que el tiempo de respuesta es peor que la media (21.5 ms) de todos los dispositivos testados. | ||
| ↔ Tiempo de respuesta 50% Gris a 80% Gris | ||
| 31 ms ... subida ↗ y bajada ↘ combinada | ↗ 11 ms subida |  |
| ↘ 20 ms bajada | ||
| La pantalla mostró tiempos de respuesta lentos en nuestros tests y podría ser demasiado lenta para los jugones. En comparación, todos los dispositivos de prueba van de ##min### (mínimo) a 636 (máximo) ms. » 35 % de todos los dispositivos son mejores. Eso quiere decir que el tiempo de respuesta es similar al dispositivo testado medio (33.8 ms). | ||
Parpadeo de Pantalla / PWM (Pulse-Width Modulation)
| Parpadeo de Pantalla / PWM no detectado | 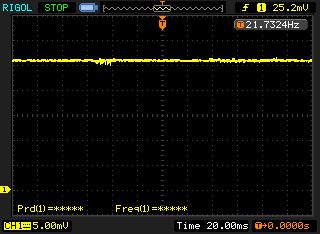 | ||
Comparación: 53 % de todos los dispositivos testados no usaron PWM para atenuar el display. Si se usó, medimos una media de 17933 (mínimo: 5 - máxmo: 3846000) Hz. | |||

| Cinebench R15 | |
| CPU Multi 64Bit (ordenar por valor) | |
| MSI GE62-6QD16H11 | |
| Nexoc G515 II | |
| Dell Inspiron 15 7559 | |
| Lenovo Ideapad Y700 15ISK 80NW | |
| MSI GE62-2QEUi716H21BW | |
| MSI GE62-2QFUi716H11 | |
| Alienware 15 R2 (Skylake) | |
| CPU Single 64Bit (ordenar por valor) | |
| MSI GE62-6QD16H11 | |
| Nexoc G515 II | |
| Dell Inspiron 15 7559 | |
| Lenovo Ideapad Y700 15ISK 80NW | |
| MSI GE62-2QEUi716H21BW | |
| MSI GE62-2QFUi716H11 | |
| Alienware 15 R2 (Skylake) | |
| Cinebench R11.5 | |
| CPU Multi 64Bit (ordenar por valor) | |
| MSI GE62-6QD16H11 | |
| Nexoc G515 II | |
| Dell Inspiron 15 7559 | |
| Lenovo Ideapad Y700 15ISK 80NW | |
| MSI GE62-2QEUi716H21BW | |
| MSI GE62-2QFUi716H11 | |
| Alienware 15 R2 (Skylake) | |
| CPU Single 64Bit (ordenar por valor) | |
| MSI GE62-6QD16H11 | |
| Nexoc G515 II | |
| Dell Inspiron 15 7559 | |
| Lenovo Ideapad Y700 15ISK 80NW | |
| MSI GE62-2QEUi716H21BW | |
| MSI GE62-2QFUi716H11 | |
| Alienware 15 R2 (Skylake) | |
| Cinebench R10 | |
| Rendering Multiple CPUs 32Bit (ordenar por valor) | |
| MSI GE62-6QD16H11 | |
| Nexoc G515 II | |
| Dell Inspiron 15 7559 | |
| Lenovo Ideapad Y700 15ISK 80NW | |
| MSI GE62-2QEUi716H21BW | |
| MSI GE62-2QFUi716H11 | |
| Rendering Single 32Bit (ordenar por valor) | |
| MSI GE62-6QD16H11 | |
| Nexoc G515 II | |
| Dell Inspiron 15 7559 | |
| Lenovo Ideapad Y700 15ISK 80NW | |
| MSI GE62-2QEUi716H21BW | |
| MSI GE62-2QFUi716H11 | |
| PCMark 7 Score | 5839 puntos | |
| PCMark 8 Home Score Accelerated v2 | 3703 puntos | |
| PCMark 8 Creative Score Accelerated v2 | 4610 puntos | |
| PCMark 8 Work Score Accelerated v2 | 4797 puntos | |
ayuda | ||
| PCMark 7 - Score (ordenar por valor) | |
| MSI GE62-6QD16H11 | |
| Nexoc G515 II | |
| Lenovo Ideapad Y700 15ISK 80NW | |
| Dell Inspiron 15 7559 | |
| MSI GE62-2QEUi716H21BW | |
| MSI GE62-2QFUi716H11 | |
| Alienware 15 R2 (Skylake) | |
| PCMark 8 | |
| Home Score Accelerated v2 (ordenar por valor) | |
| MSI GE62-6QD16H11 | |
| Nexoc G515 II | |
| Lenovo Ideapad Y700 15ISK 80NW | |
| Dell Inspiron 15 7559 | |
| MSI GE62-2QEUi716H21BW | |
| MSI GE62-2QEUi716H21BW | |
| MSI GE62-2QFUi716H11 | |
| Alienware 15 R2 (Skylake) | |
| Creative Score Accelerated v2 (ordenar por valor) | |
| MSI GE62-6QD16H11 | |
| Lenovo Ideapad Y700 15ISK 80NW | |
| MSI GE62-2QEUi716H21BW | |
| MSI GE62-2QEUi716H21BW | |
| MSI GE62-2QFUi716H11 | |
| Alienware 15 R2 (Skylake) | |
| Work Score Accelerated v2 (ordenar por valor) | |
| MSI GE62-6QD16H11 | |
| Nexoc G515 II | |
| Lenovo Ideapad Y700 15ISK 80NW | |
| Dell Inspiron 15 7559 | |
| MSI GE62-2QEUi716H21BW | |
| MSI GE62-2QEUi716H21BW | |
| MSI GE62-2QFUi716H11 | |
| Alienware 15 R2 (Skylake) | |

| MSI GE62-6QD16H11 Samsung SSD 850 EVO M.2 250 GB | Nexoc G515 II Samsung SM951 MZHPV256HDGL m.2 PCI-e | Lenovo Ideapad Y700 15ISK 80NW Samsung MZNLN128HCGR-000L2 | Dell Inspiron 15 7559 SK hynix SC300 M.2 | MSI GE62-2QEUi716H21BW Kingston RBU-SNS8100S3256GD1 | |
|---|---|---|---|---|---|
| AS SSD | 103% | 12% | -33% | 6% | |
| Seq Read | 500 | 1863 273% | 492 -2% | 509 2% | 502 0% |
| Seq Write | 449.1 | 1174 161% | 151 -66% | 202 -55% | 329.6 -27% |
| 4K Read | 21.05 | 39.56 88% | 34.29 63% | 25.01 19% | 33.07 57% |
| 4K Write | 72.9 | 92.6 27% | 94 29% | 59.3 -19% | 67.7 -7% |
| Access Time Read * | 0.168 | 0.053 68% | 0.094 44% | 0.106 37% | 0.099 41% |
| Access Time Write * | 0.041 | 0.041 -0% | 0.039 5% | 0.116 -183% | 0.052 -27% |
* ... más pequeño es mejor
| 3DMark 11 Performance | 5865 puntos | |
| 3DMark Ice Storm Standard Score | 69304 puntos | |
| 3DMark Cloud Gate Standard Score | 17764 puntos | |
| 3DMark Fire Strike Score | 4018 puntos | |
ayuda | ||
| 3DMark 11 - 1280x720 Performance (ordenar por valor) | |
| MSI GE62-6QD16H11 | |
| Nexoc G515 II | |
| Lenovo Ideapad Y700 15ISK 80NW | |
| Dell Inspiron 15 7559 | |
| MSI GE62-2QEUi716H21BW | |
| MSI GE62-2QFUi716H11 | |
| Alienware 15 R2 (Skylake) | |
| 3DMark | |
| 1280x720 Cloud Gate Standard Score (ordenar por valor) | |
| MSI GE62-6QD16H11 | |
| Nexoc G515 II | |
| Lenovo Ideapad Y700 15ISK 80NW | |
| Dell Inspiron 15 7559 | |
| MSI GE62-2QEUi716H21BW | |
| MSI GE62-2QFUi716H11 | |
| Alienware 15 R2 (Skylake) | |
| 1920x1080 Fire Strike Score (ordenar por valor) | |
| MSI GE62-6QD16H11 | |
| Nexoc G515 II | |
| Lenovo Ideapad Y700 15ISK 80NW | |
| Dell Inspiron 15 7559 | |
| MSI GE62-2QEUi716H21BW | |
| MSI GE62-2QFUi716H11 | |
| Alienware 15 R2 (Skylake) | |
| bajo | medio | alto | ultra | |
| Tomb Raider (2013) | 171 | 156.7 | 108.9 | 52.9 |
| Dirt Rally (2015) | 213.1 | 104.7 | 72.4 | 34.36 |
| The Witcher 3 (2015) | 83.6 | 52.3 | 27.4 | 15.2 |
| Metal Gear Solid V (2015) | 59.9 | 59.9 | 59.6 | 40.3 |
| Fallout 4 (2015) | 98.8 | 68.6 | 33.52 | 25.8 |
| Tomb Raider | |
| 1366x768 High Preset AA:FX AF:8x (ordenar por valor) | |
| MSI GE62-6QD16H11 | |
| Lenovo Ideapad Y700 15ISK 80NW | |
| MSI GE62-2QEUi716H21BW | |
| MSI GE62-2QFUi716H11 | |
| Alienware 15 R2 (Skylake) | |
| 1920x1080 Ultra Preset AA:FX AF:16x (ordenar por valor) | |
| MSI GE62-6QD16H11 | |
| Lenovo Ideapad Y700 15ISK 80NW | |
| MSI GE62-2QEUi716H21BW | |
| MSI GE62-2QFUi716H11 | |
| Alienware 15 R2 (Skylake) | |
| The Witcher 3 | |
| 1366x768 Medium Graphics & Postprocessing (ordenar por valor) | |
| MSI GE62-6QD16H11 | |
| Nexoc G515 II | |
| 1920x1080 High Graphics & Postprocessing (Nvidia HairWorks Off) (ordenar por valor) | |
| MSI GE62-6QD16H11 | |
| Nexoc G515 II | |
| Alienware 15 R2 (Skylake) | |
Ruido
| Ocioso |
| 33 / 34 / 38 dB(A) |
| HDD |
| 34 dB(A) |
| DVD |
| 39 / dB(A) |
| Carga |
| 42 / 46 dB(A) |
 | ||
30 dB silencioso 40 dB(A) audible 50 dB(A) ruidosamente alto |
||
min: | ||
| MSI GE62-6QD16H11 6700HQ, GeForce GTX 960M | Nexoc G515 II 6700HQ, GeForce GTX 960M | Lenovo Ideapad Y700 15ISK 80NW 6700HQ, GeForce GTX 960M | Dell Inspiron 15 7559 6700HQ, GeForce GTX 960M | MSI GE62-2QEUi716H21BW 4720HQ, GeForce GTX 965M | Alienware 15 R2 (Skylake) 6700HQ, GeForce GTX 980M | |
|---|---|---|---|---|---|---|
| Noise | 9% | 6% | 3% | 2% | 1% | |
| Idle Minimum * | 33 | 29.4 11% | 30.4 8% | 32.6 1% | 29.2 12% | 33.6 -2% |
| Idle Average * | 34 | 30.2 11% | 30.5 10% | 32.6 4% | 32.6 4% | 33.8 1% |
| Idle Maximum * | 38 | 35.6 6% | 33.3 12% | 32.6 14% | 35 8% | 34 11% |
| Load Average * | 42 | 39.8 5% | 41.4 1% | 40.5 4% | 42.6 -1% | 39.3 6% |
| Load Maximum * | 46 | 41.6 10% | 47 -2% | 49.1 -7% | 52.4 -14% | 51.4 -12% |
* ... más pequeño es mejor
(-) The maximum temperature on the upper side is 53.3 °C / 128 F, compared to the average of 40.4 °C / 105 F, ranging from 21.2 to 68.8 °C for the class Gaming.
(-) The bottom heats up to a maximum of 49.3 °C / 121 F, compared to the average of 43.2 °C / 110 F
(±) In idle usage, the average temperature for the upper side is 36.7 °C / 98 F, compared to the device average of 33.8 °C / 93 F.
(-) The palmrests and touchpad can get very hot to the touch with a maximum of 49.5 °C / 121.1 F.
(-) The average temperature of the palmrest area of similar devices was 28.9 °C / 84 F (-20.6 °C / -37.1 F).
| MSI GE62-6QD16H11 6700HQ, GeForce GTX 960M | Nexoc G515 II 6700HQ, GeForce GTX 960M | Lenovo Ideapad Y700 15ISK 80NW 6700HQ, GeForce GTX 960M | Dell Inspiron 15 7559 6700HQ, GeForce GTX 960M | MSI GE62-2QEUi716H21BW 4720HQ, GeForce GTX 965M | MSI GE62-2QFUi716H11 4720HQ, GeForce GTX 970M | Alienware 15 R2 (Skylake) 6700HQ, GeForce GTX 980M | |
|---|---|---|---|---|---|---|---|
| Heat | -6% | 22% | 10% | 6% | 8% | 9% | |
| Maximum Upper Side * | 53.3 | 56.8 -7% | 43.8 18% | 54 -1% | 49.9 6% | 53.4 -0% | 48 10% |
| Maximum Bottom * | 49.3 | 62 -26% | 47.8 3% | 53.4 -8% | 43.7 11% | 43.3 12% | 57.3 -16% |
| Idle Upper Side * | 41.2 | 39.6 4% | 27.4 33% | 30.4 26% | 37.1 10% | 34.7 16% | 31.9 23% |
| Idle Bottom * | 40.8 | 39.1 4% | 26.8 34% | 31.3 23% | 41.5 -2% | 39.6 3% | 33.4 18% |
* ... más pequeño es mejor
| Off / Standby | |
| Ocioso | |
| Carga |
|
| MSI GE62-6QD16H11 6700HQ, GeForce GTX 960M | Nexoc G515 II 6700HQ, GeForce GTX 960M | Dell Inspiron 15 7559 6700HQ, GeForce GTX 960M | MSI GE62-2QEUi716H21BW 4720HQ, GeForce GTX 965M | MSI GE62-2QFUi716H11 4720HQ, GeForce GTX 970M | Alienware 15 R2 (Skylake) 6700HQ, GeForce GTX 980M | |
|---|---|---|---|---|---|---|
| Power Consumption | 29% | 32% | 14% | 12% | 16% | |
| Idle Minimum * | 20 | 11.2 44% | 9.4 53% | 15 25% | 14.7 26% | 11.4 43% |
| Idle Average * | 24 | 14.6 39% | 14.4 40% | 20.8 13% | 20.9 13% | 16.5 31% |
| Idle Maximum * | 30 | 21.8 27% | 15 50% | 25.4 15% | 25.6 15% | 22 27% |
| Load Average * | 97 | 78.3 19% | 102 -5% | 91.8 5% | 101 -4% | 94.2 3% |
| Load Maximum * | 155 | 132.6 14% | 120 23% | 136 12% | 138.8 10% | 192.2 -24% |
* ... más pequeño es mejor
| MSI GE62-6QD16H11 53 Wh | Nexoc G515 II 62 Wh | Lenovo Ideapad Y700 15ISK 80NW 60 Wh | Dell Inspiron 15 7559 74 Wh | MSI GE62-2QEUi716H21BW 51 Wh | MSI GE62-2QFUi716H11 51 Wh | Alienware 15 R2 (Skylake) 96 Wh | |
|---|---|---|---|---|---|---|---|
| Duración de Batería | 79% | 140% | 123% | 20% | 15% | 210% | |
| Reader / Idle | 184 | 617 235% | 709 285% | 267 45% | 234 27% | 769 318% | |
| H.264 | 137 | 160 17% | 165 20% | 456 233% | |||
| WiFi v1.3 | 149 | 249 67% | 353 137% | 232 56% | 162 9% | 446 199% | |
| Load | 60 | 114 90% | 88 47% | 76 27% | 59 -2% | 63 5% | 114 90% |
| WiFi | 179 |
Pro
Contra
En realidad empezó bien. Nuestro modelo de pruebas hace una buena labor en las categorías de valoración "duras" incluso si la actualización Skylake está lejos de alcanzar el superior rendimiento que prometía MSI. Sin embargo, los jugones encontrarán una característica importantísima:
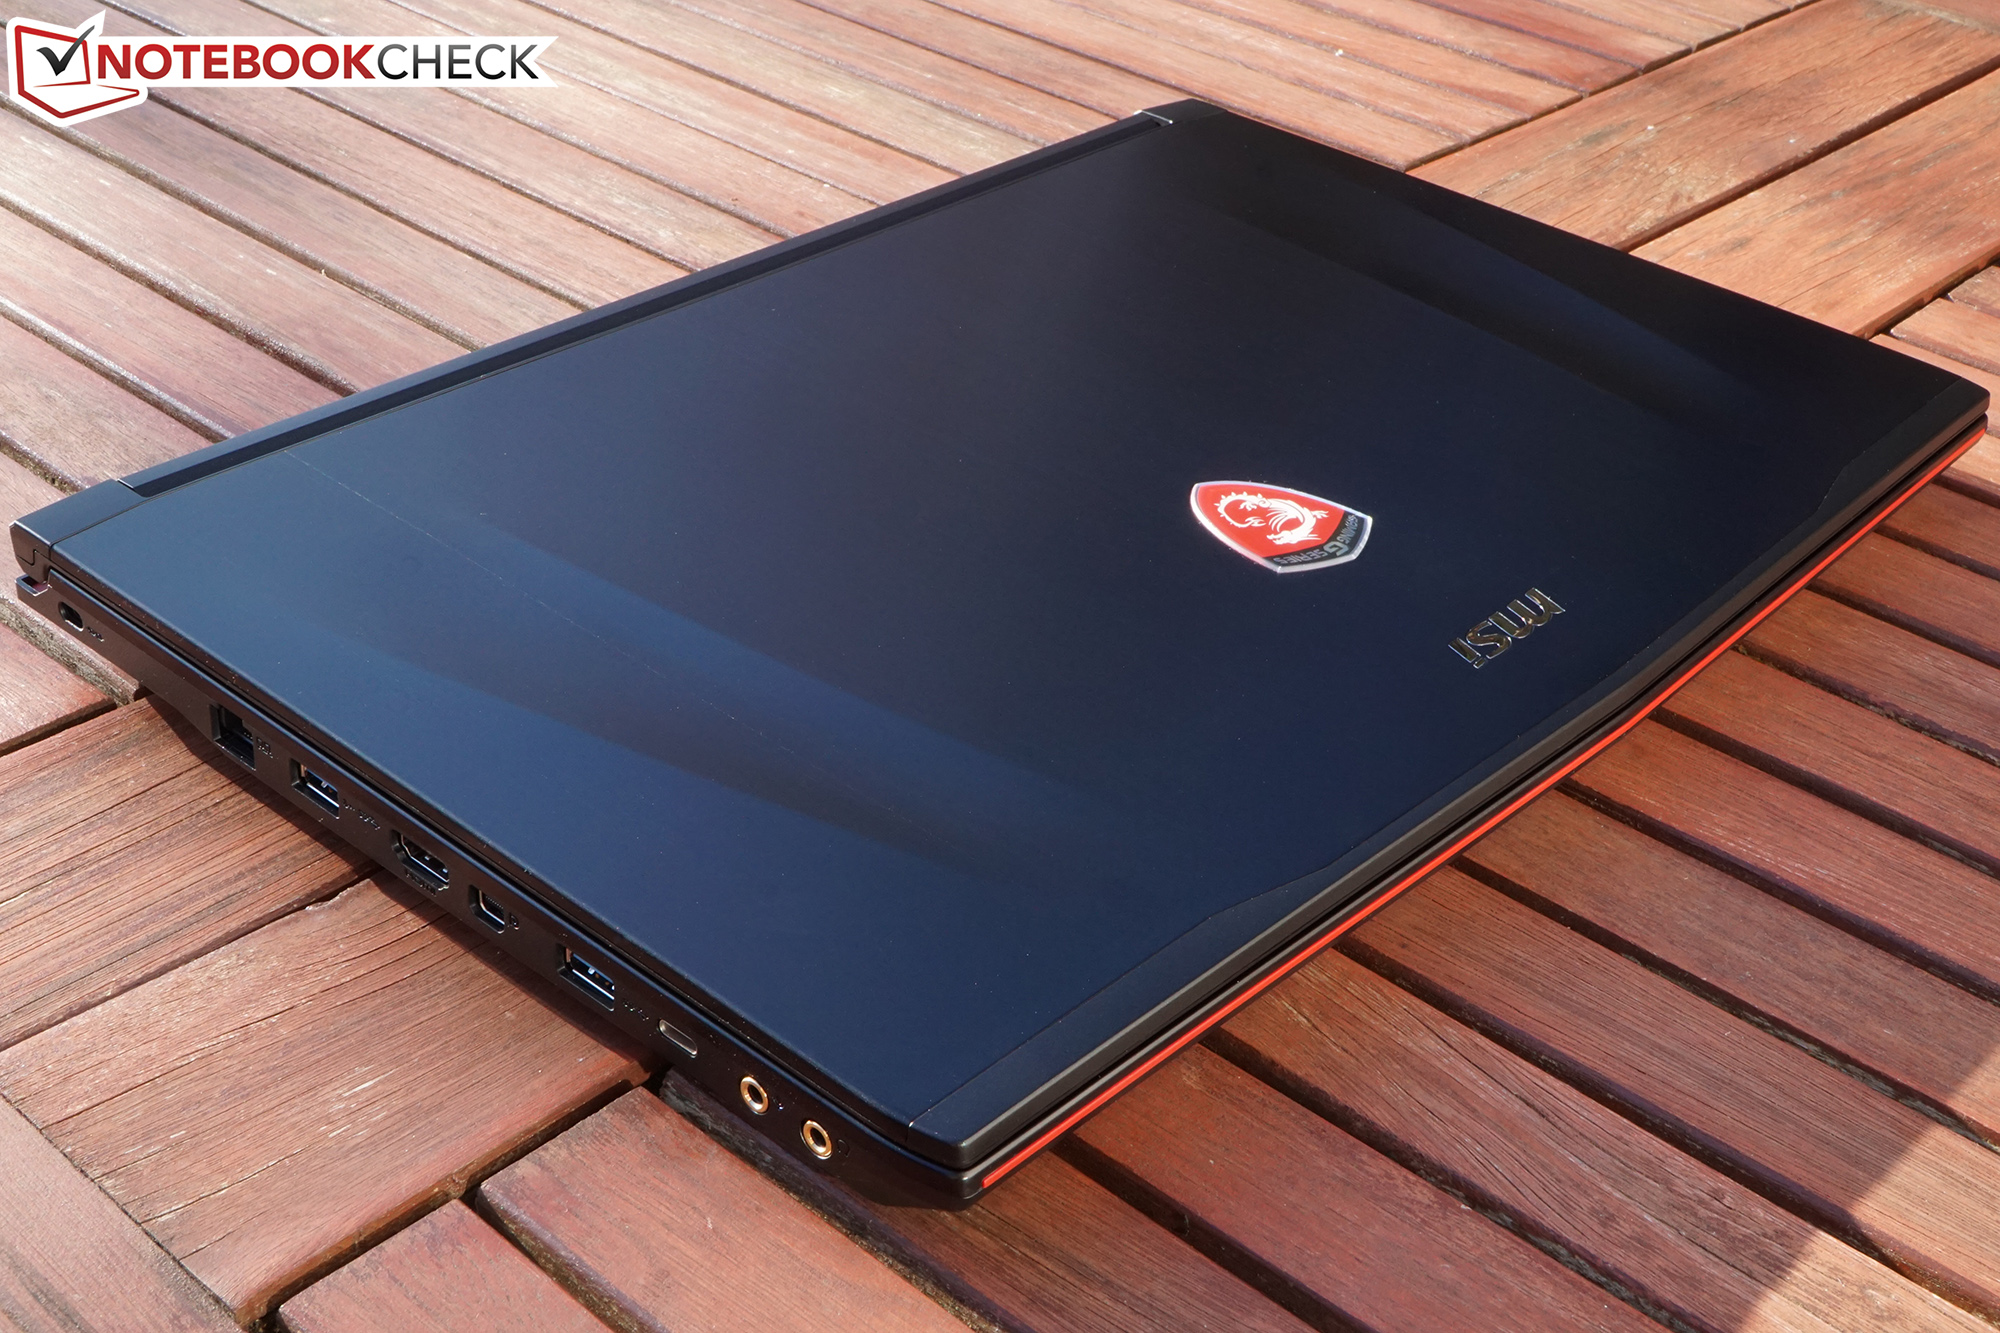
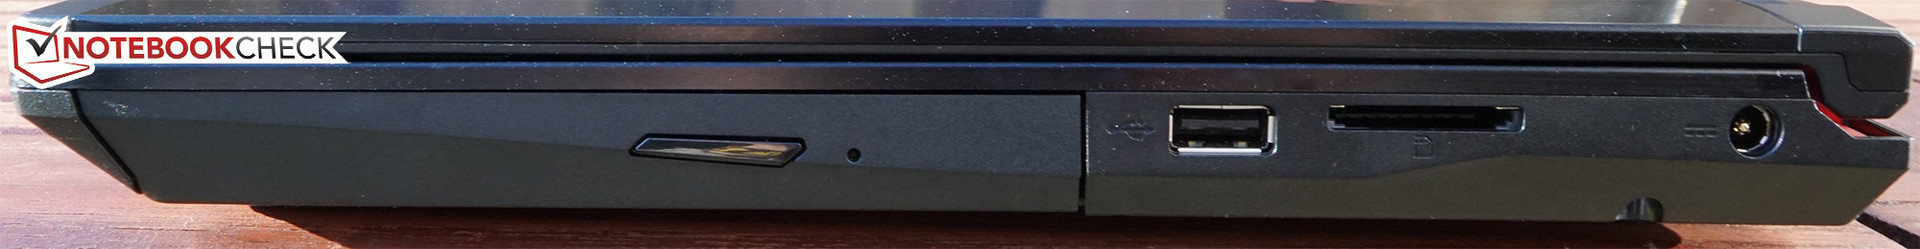
El principal punto fuerte del MSI GE62 6QD es su pantalla Full HD que deja atrás a los rivales en prácticamente todas las categorías de valoración. El modelo de pruebas está al menos a la par con sus rivales en términos de potencia de juego y rendimiento rutinario. El nuevo puerto USB 3.1 port no es un argumento de compra principal, pero ciertamente contribuye a hacer el dispositivo a prueba del paso del tiempo.
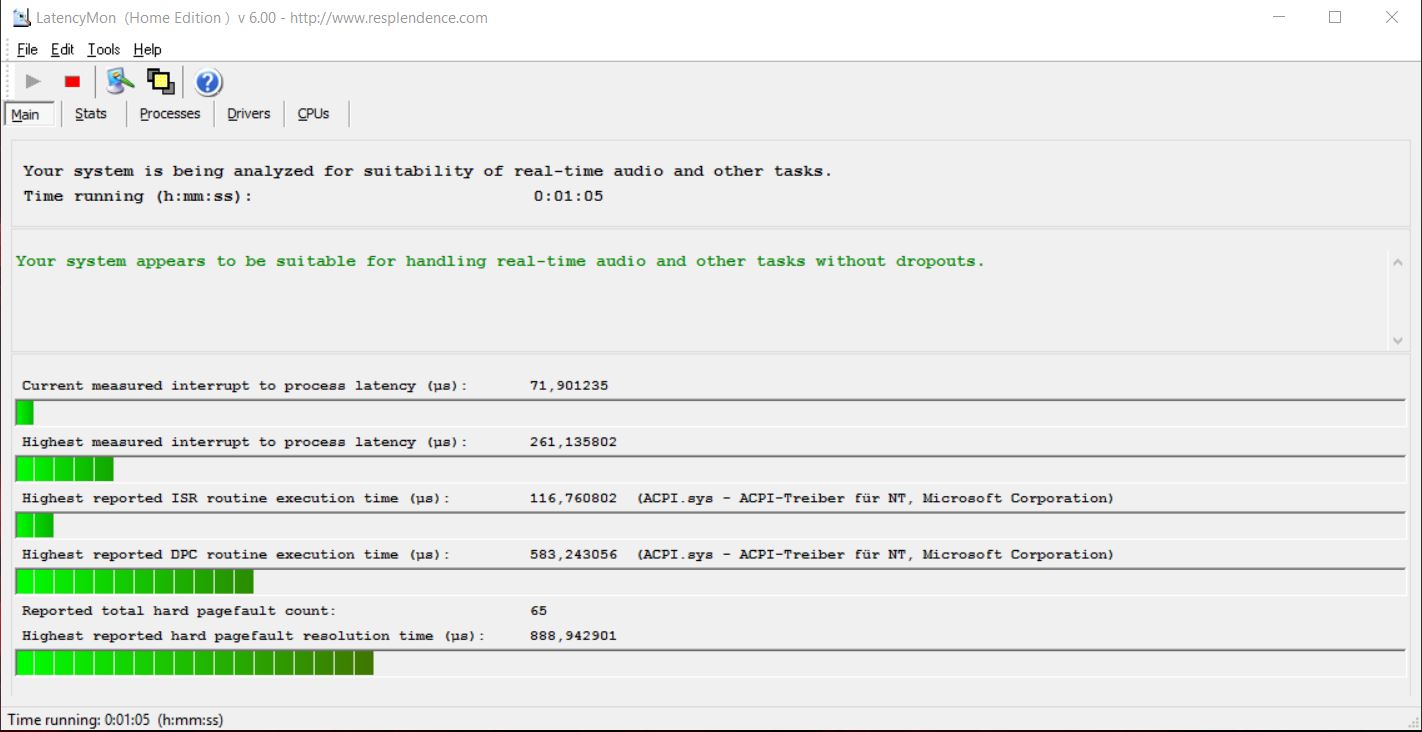
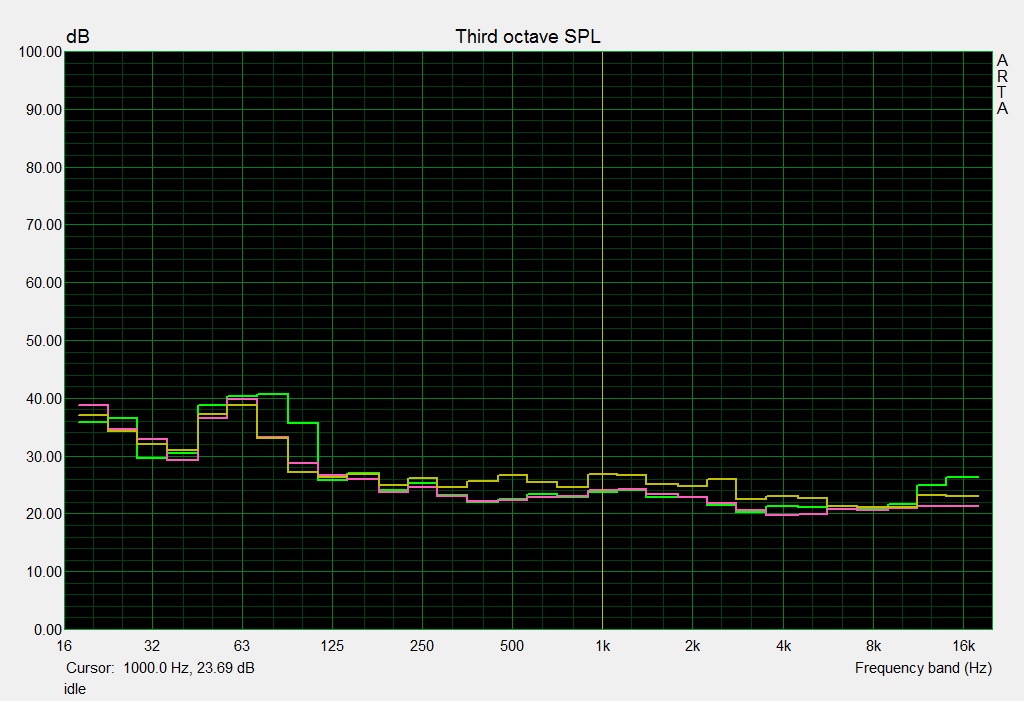
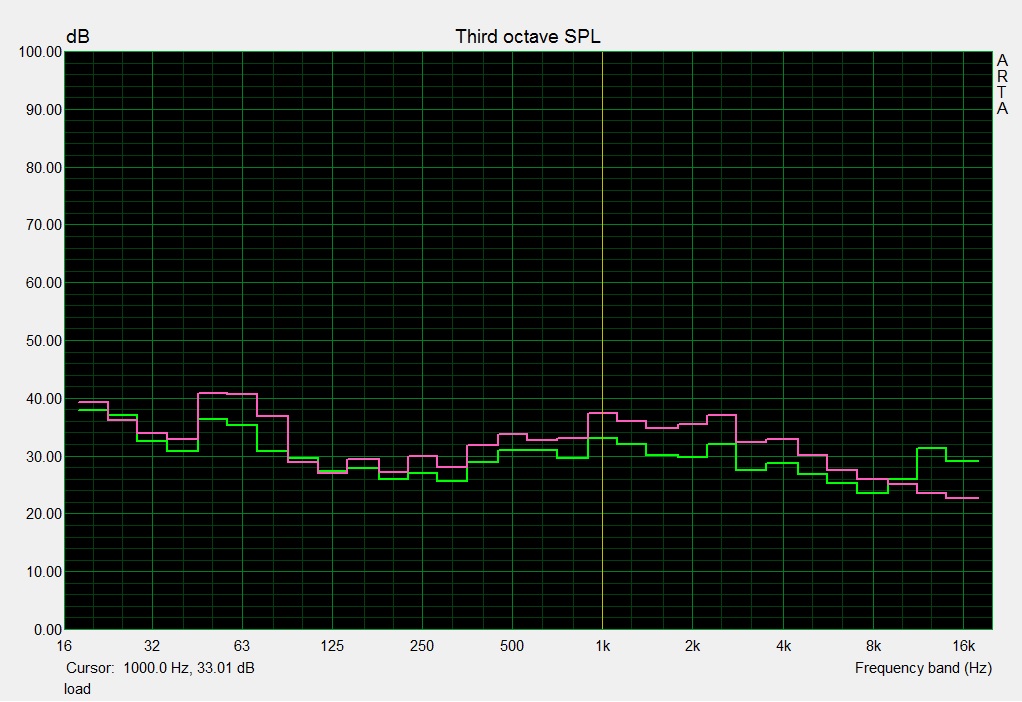
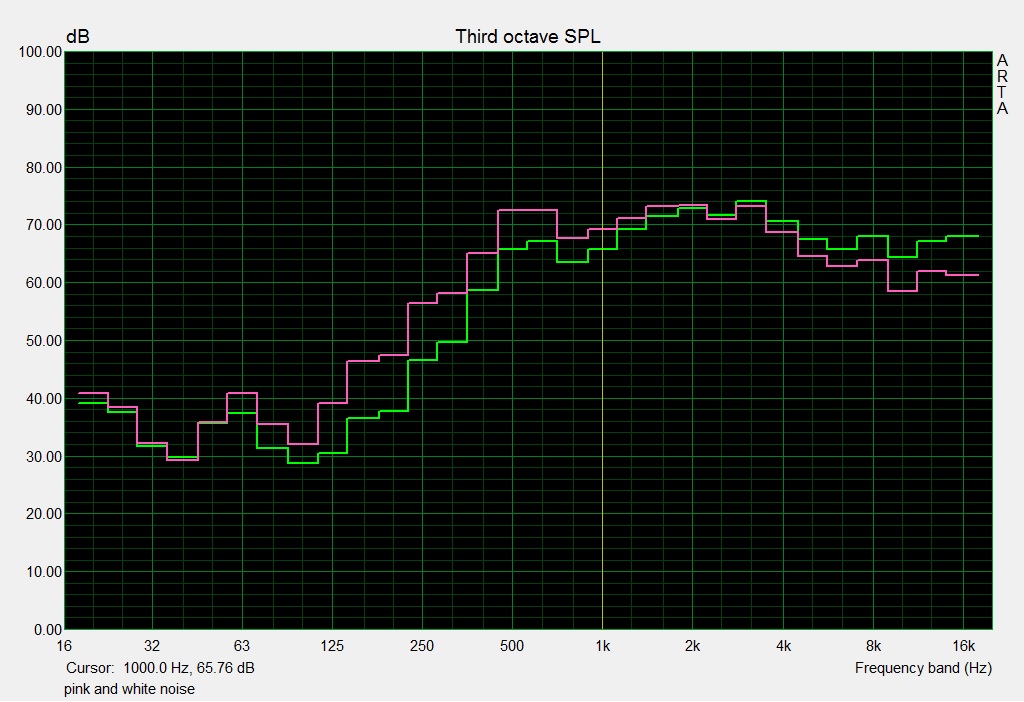
Por desgracia, nuestro modelo de pruebas comete una serie de errores en las valoraciones "secundarias". Muchos están interconectados: Un consumo de energía exorbitante así como escaso aguante de batería indican que los componentes de ventilación han ido a peor respecto a los predecesores Haswell. Aunque el desarrollo de ruido es satisfactorio, el ruido de bobina puede resultar molesto según la tolerancia personal.
Lo que hace cuestionable si la compra del MSI GE62 6QD merece la pena es que los predecesores siguen en las tiendas. La pantalla FHD sería el principal argumento para la renovación; que sepamos hay otro panel instalado en la versión HD de los modelos Haswell (para comparar: análisis del iBuyPower GE62), que queda muy por detrás en calidad. La nueva CPU Skylake no tiene ventajas en juego, y los anteriores modelos GE62 toman el liderato en el aguante de batería y el consumo de energía. Sobre todo, estos últimos también desarrollan un rendimiento de juego considerablemente superior gracias a GPUs más rápidas.
Sólo queda disponible un limitado número de GE62 2QF con GTX 970M, y también tienen un precio más alto que los casi 1600 Euros del sucesor 6QF en algunos casos. El GE62 2QE con GTX 965M se vende por unos 1450 Euros; esta oferta parece bastante atractiva a la vista de los 1500 Euros de nuestro modelo de pruebas. Los compradores que busquen un sistema actualizado y equilibrado con procesador Skylake pueden encontrar algo en la competencia. La versión SSD del Nexoc G515 II está a partir de 1250 Euros; el Dell Inspiron 15 7559 ya empieza en 1100 Euros (con SSHD).
Ésta es una versión acortada del análisis original. Puedes leer el análisis completo en inglés aquí.
MSI GE62-6QD16H11
-
02/16/2016 v5(old)
Oliver Moebel