 Deutsch
 English
 Español
 Français
 Italiano
 Nederlands
 Polski
 Português
 Русский
 Türkçe
 Svenska
 Chinese
 Magyar
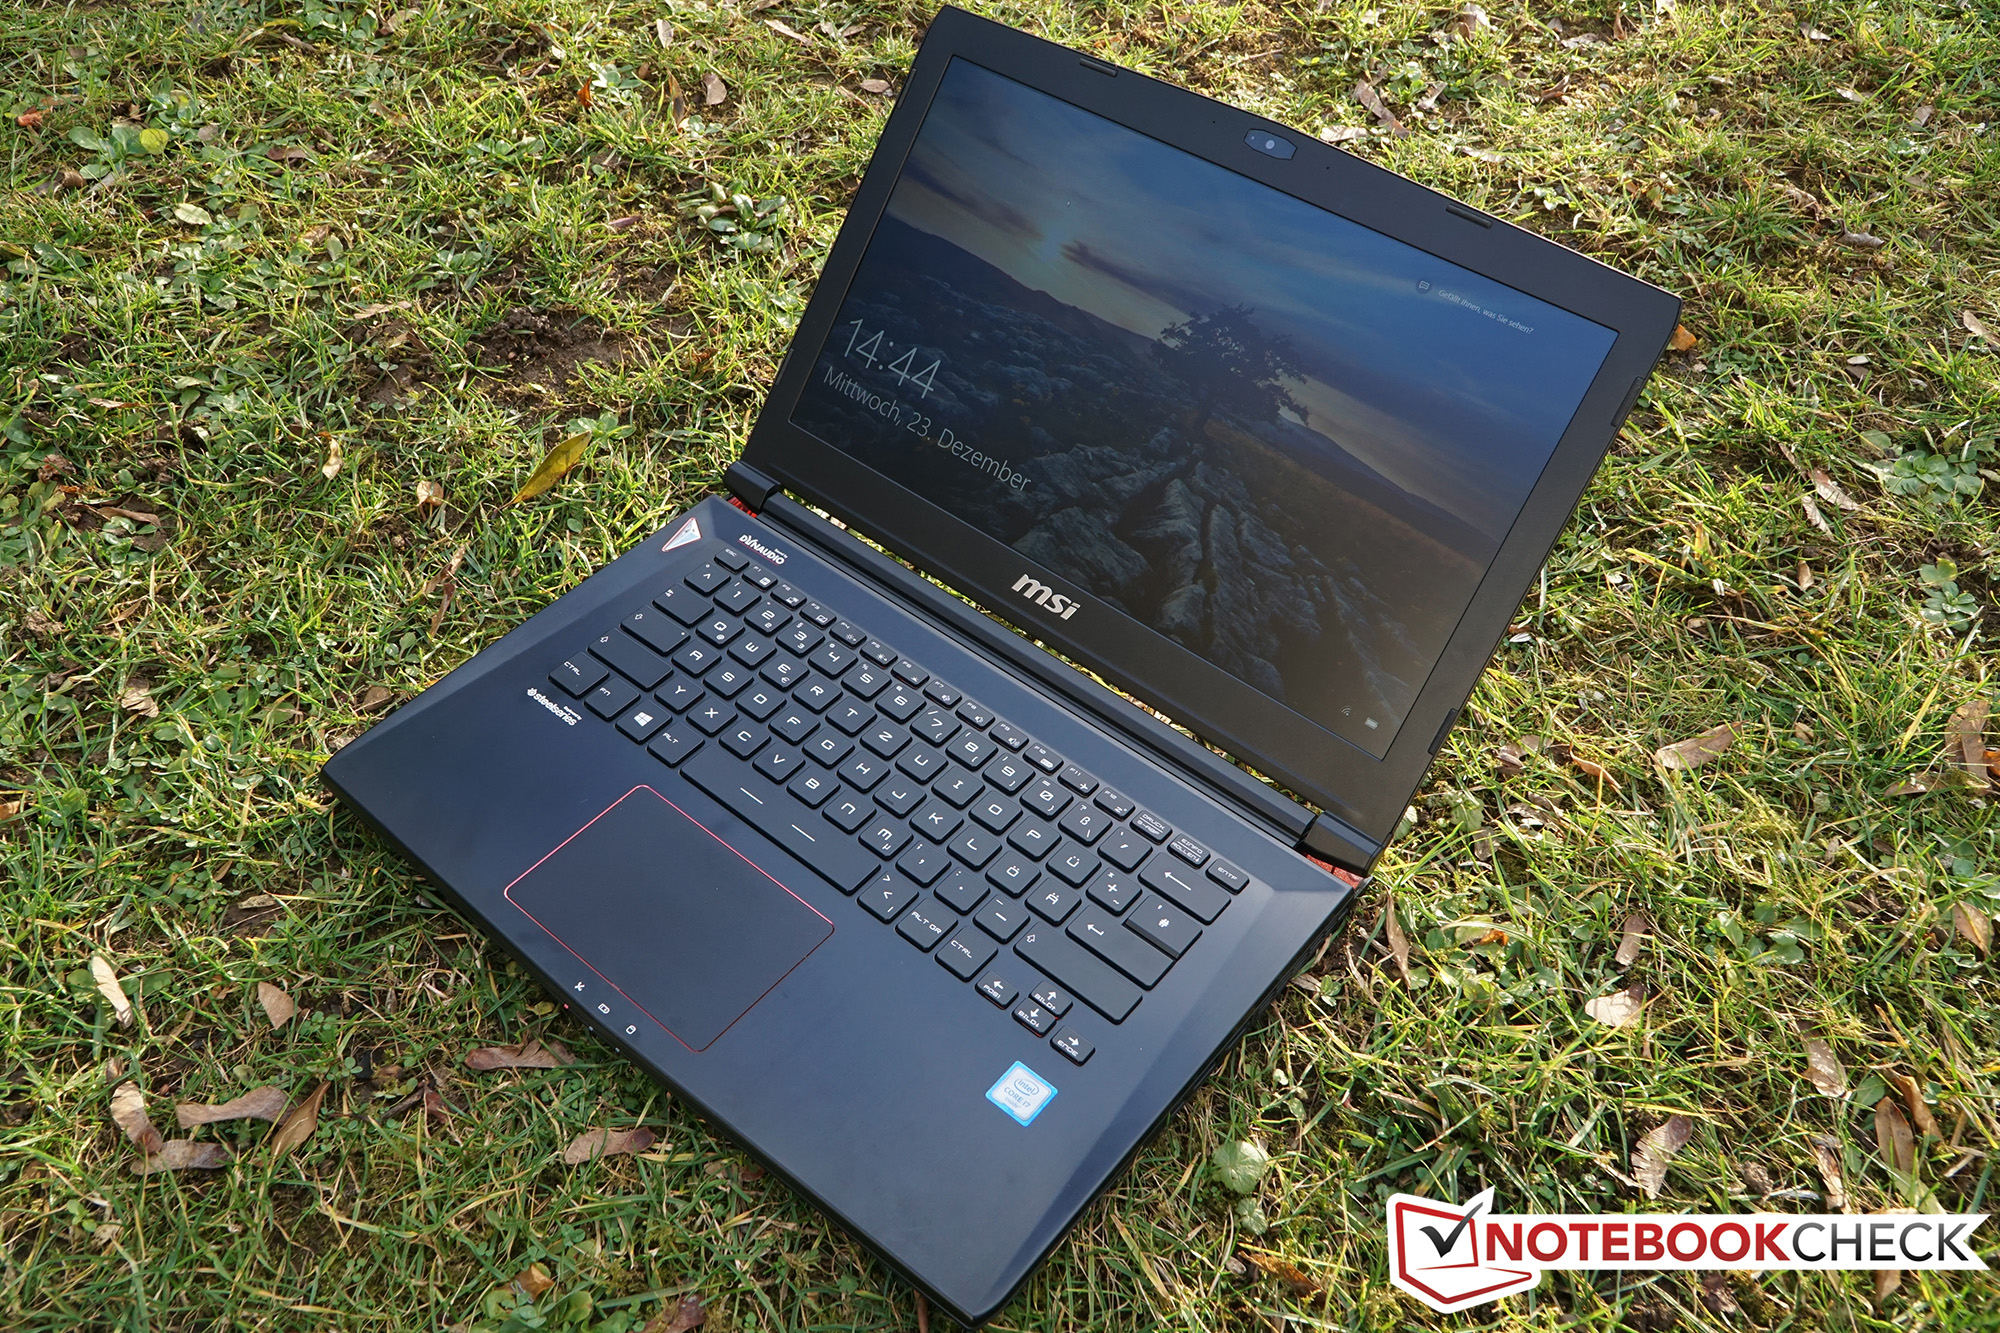
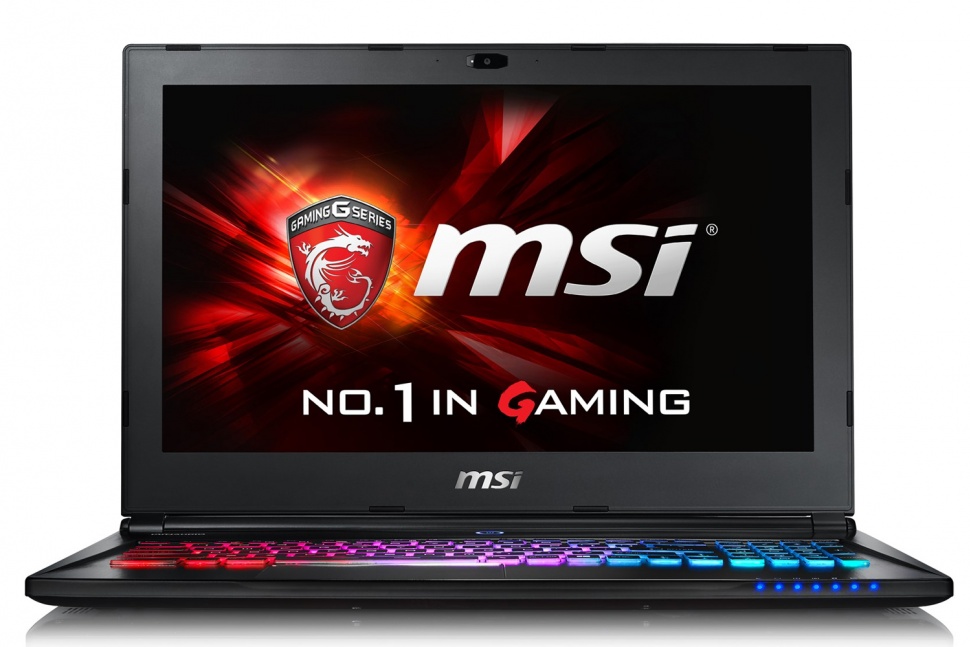
Breve análisis del MSI GS40 6QE Phantom


| |||||||||||||||||||||||||
iluminación: 88 %
Brillo con batería: 304 cd/m²
Contraste: 822:1 (Negro: 0.37 cd/m²)
ΔE Color 7.47 | 0.5-29.43 Ø5
ΔE Greyscale 6.51 | 0.57-98 Ø5.3
86% sRGB (Argyll 1.6.3 3D)
56% AdobeRGB 1998 (Argyll 1.6.3 3D)
62.6% AdobeRGB 1998 (Argyll 2.2.0 3D)
85.7% sRGB (Argyll 2.2.0 3D)
66.2% Display P3 (Argyll 2.2.0 3D)
Gamma: 3.71
| MSI GS40-6QE16H11 LG Philips LP140WF3-SPD1 (LGD046D), IPS, 14.00, 1920x1080 | SCHENKER XMG P406 LG Philips 140WF1 (LGD040A), IPS, 14.00, 1920x1080 | Gigabyte P34W V3 AU Optronics B140HAN01.1, IPS, 14.00, 1920x1080 | SCHENKER XMG C405 AU Optronics B140HAN01.1 (AUO113ED), AHVA, 14.00, 1920x1080 | Asus Zenbook UX303UB-R4100T ChiMei N133HSE-EA3, IPS, 13.30, 1920x1080 | Alienware 15 R2 (Skylake) Samsung 4NDDJ_156HL (SDC4C48), IPS, 15.60, 1920x1080 | |
|---|---|---|---|---|---|---|
| Display | -2% | 7% | 4% | 6% | -34% | |
| Display P3 Coverage | 66.2 | 66.2 0% | 69.4 5% | 66.8 1% | 66.9 1% | 40.3 -39% |
| sRGB Coverage | 85.7 | 82.8 -3% | 92.6 8% | 89.6 5% | 92.3 8% | 60.2 -30% |
| AdobeRGB 1998 Coverage | 62.6 | 60.5 -3% | 67.4 8% | 65.6 5% | 67.6 8% | 41.67 -33% |
| Response Times | -56% | -86% | -40% | |||
| Response Time Grey 50% / Grey 80% * | 31 ? | 56 ? -81% | 68 ? -119% | 48.8 ? -57% | ||
| Response Time Black / White * | 23 ? | 30 ? -30% | 35 ? -52% | 28 ? -22% | ||
| PWM Frequency | 178 ? | 200 ? | ||||
| Screen | 15% | -1% | 7% | 20% | -8% | |
| Brightness middle | 304 | 282 -7% | 305.4 0% | 280 -8% | 385 27% | 180 -41% |
| Brightness | 282 | 266 -6% | 277 -2% | 267 -5% | 394 40% | 179 -37% |
| Brightness Distribution | 88 | 81 -8% | 84 -5% | 85 -3% | 89 1% | 83 -6% |
| Black Level * | 0.37 | 0.22 41% | 0.72 -95% | 0.32 14% | 0.41 -11% | 0.19 49% |
| Contrast | 822 | 1282 56% | 424 -48% | 875 6% | 939 14% | 947 15% |
| Colorchecker dE 2000 * | 7.47 | 4.98 33% | 2.81 62% | 4.75 36% | 3.84 49% | 6.74 10% |
| Greyscale dE 2000 * | 6.51 | 4.08 37% | 1.92 71% | 5.91 9% | 3.79 42% | 6.44 1% |
| Gamma | 3.71 59% | 2.51 88% | 2.21 100% | 2.52 87% | 2.23 99% | 2.29 96% |
| CCT | 7840 83% | 5877 111% | 6384 102% | 5742 113% | 6499 100% | 6465 101% |
| Color Space (Percent of AdobeRGB 1998) | 56 | 54 -4% | 60.4 8% | 59 5% | 60 7% | 38 -32% |
| Color Space (Percent of sRGB) | 86 | 83 -3% | 92 7% | 60 -30% | ||
| Colorchecker dE 2000 max. * | 10.2 | |||||
| Media total (Programa/Opciones) | -14% /
2% | 3% /
1% | 6% /
6% | -20% /
2% | -27% /
-18% |
* ... más pequeño es mejor
Tiempos de respuesta del display
| ↔ Tiempo de respuesta de Negro a Blanco | ||
|---|---|---|
| 23 ms ... subida ↗ y bajada ↘ combinada | ↗ 5 ms subida | 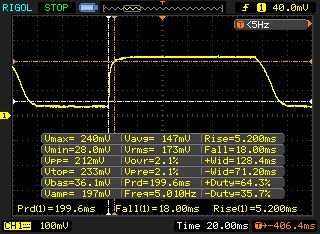 |
| ↘ 18 ms bajada | ||
| La pantalla mostró buenos tiempos de respuesta en nuestros tests pero podría ser demasiado lenta para los jugones competitivos. En comparación, todos los dispositivos de prueba van de ##min### (mínimo) a 240 (máximo) ms. » 45 % de todos los dispositivos son mejores. Eso quiere decir que el tiempo de respuesta es similar al dispositivo testado medio (21.5 ms). | ||
| ↔ Tiempo de respuesta 50% Gris a 80% Gris | ||
| 31 ms ... subida ↗ y bajada ↘ combinada | ↗ 12 ms subida | 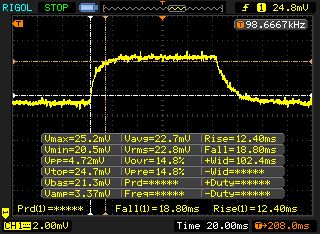 |
| ↘ 19 ms bajada | ||
| La pantalla mostró tiempos de respuesta lentos en nuestros tests y podría ser demasiado lenta para los jugones. En comparación, todos los dispositivos de prueba van de ##min### (mínimo) a 636 (máximo) ms. » 35 % de todos los dispositivos son mejores. Eso quiere decir que el tiempo de respuesta es similar al dispositivo testado medio (33.8 ms). | ||
Parpadeo de Pantalla / PWM (Pulse-Width Modulation)
| Parpadeo de Pantalla / PWM no detectado | 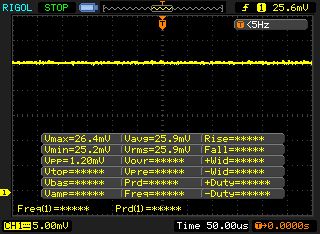 | ||
Comparación: 53 % de todos los dispositivos testados no usaron PWM para atenuar el display. Si se usó, medimos una media de 17942 (mínimo: 5 - máxmo: 3846000) Hz. | |||
| Cinebench R15 | |
| CPU Multi 64Bit (ordenar por valor) | |
| MSI GS40-6QE16H11 | |
| SCHENKER XMG P406 | |
| Gigabyte P34W V3 | |
| SCHENKER XMG C405 | |
| Asus Zenbook UX303UB-R4100T | |
| Alienware 15 R2 (Skylake) | |
| MSI GT72S 6QF | |
| CPU Single 64Bit (ordenar por valor) | |
| MSI GS40-6QE16H11 | |
| SCHENKER XMG P406 | |
| Gigabyte P34W V3 | |
| SCHENKER XMG C405 | |
| Asus Zenbook UX303UB-R4100T | |
| Alienware 15 R2 (Skylake) | |
| MSI GT72S 6QF | |
| Cinebench R11.5 | |
| CPU Multi 64Bit (ordenar por valor) | |
| MSI GS40-6QE16H11 | |
| SCHENKER XMG P406 | |
| Gigabyte P34W V3 | |
| SCHENKER XMG C405 | |
| Asus Zenbook UX303UB-R4100T | |
| Alienware 15 R2 (Skylake) | |
| MSI GT72S 6QF | |
| CPU Single 64Bit (ordenar por valor) | |
| MSI GS40-6QE16H11 | |
| SCHENKER XMG P406 | |
| Gigabyte P34W V3 | |
| SCHENKER XMG C405 | |
| Asus Zenbook UX303UB-R4100T | |
| Alienware 15 R2 (Skylake) | |
| MSI GT72S 6QF | |
| PCMark 7 Score | 5451 puntos | |
| PCMark 8 Home Score Accelerated v2 | 3776 puntos | |
| PCMark 8 Creative Score Accelerated v2 | 4742 puntos | |
| PCMark 8 Work Score Accelerated v2 | 4831 puntos | |
ayuda | ||
| PCMark 7 - Score (ordenar por valor) | |
| MSI GS40-6QE16H11 | |
| SCHENKER XMG P406 | |
| Gigabyte P34W V3 | |
| Asus Zenbook UX303UB-R4100T | |
| Alienware 15 R2 (Skylake) | |
| PCMark 8 | |
| Home Score Accelerated v2 (ordenar por valor) | |
| MSI GS40-6QE16H11 | |
| SCHENKER XMG P406 | |
| Gigabyte P34W V3 | |
| SCHENKER XMG C405 | |
| Asus Zenbook UX303UB-R4100T | |
| Alienware 15 R2 (Skylake) | |
| Creative Score Accelerated v2 (ordenar por valor) | |
| MSI GS40-6QE16H11 | |
| Gigabyte P34W V3 | |
| SCHENKER XMG C405 | |
| Asus Zenbook UX303UB-R4100T | |
| Alienware 15 R2 (Skylake) | |
| Work Score Accelerated v2 (ordenar por valor) | |
| MSI GS40-6QE16H11 | |
| SCHENKER XMG P406 | |
| Gigabyte P34W V3 | |
| SCHENKER XMG C405 | |
| Asus Zenbook UX303UB-R4100T | |
| Alienware 15 R2 (Skylake) | |

| MSI GS40-6QE16H11 Samsung MZFLV128 NVMe | SCHENKER XMG P406 Samsung SM951 MZHPV256HDGL m.2 PCI-e | Gigabyte P34W V3 Lite-On LMT-128L9M | SCHENKER XMG C405 Crucial M550 CT256M550SSD3 | Asus Zenbook UX303UB-R4100T Micron M600 MTFDDAK512MBF | Alienware 15 R2 (Skylake) Samsung PM951 NVMe MZ-VLV256D | |
|---|---|---|---|---|---|---|
| CrystalDiskMark 3.0 | 20% | -48% | -36% | -44% | -19% | |
| Read Seq | 1332 | 1634 23% | 504 -62% | 517 -61% | 484.2 -64% | 1213 -9% |
| Write Seq | 687 | 1290 88% | 337.4 -51% | 496.6 -28% | 444.9 -35% | 306 -55% |
| Read 4k | 49.57 | 43.82 -12% | 33.13 -33% | 33.03 -33% | 28.74 -42% | 42.62 -14% |
| Write 4k | 138.8 | 110.3 -21% | 75 -46% | 111.3 -20% | 90.5 -35% | 143.7 4% |
| AS SSD | 165% | 64% | 98% | 62% | ||
| Seq Read | 1834 | 1875 2% | 487 -73% | 523 -71% | 514 -72% | |
| Seq Write | 289.1 | 1252 333% | 322.9 12% | 475.6 65% | 399.9 38% | |
| 4K Read | 45.54 | 39.68 -13% | 30.97 -32% | 30.61 -33% | 26.51 -42% | |
| 4K Write | 102.4 | 92 -10% | 67.9 -34% | 97.6 -5% | 76.1 -26% | |
| 4K-64 Read | 738 | 707 -4% | 366.8 -50% | 384.8 -48% | 308.1 -58% | |
| 4K-64 Write | 34.73 | 351.2 911% | 256.3 638% | 304.5 777% | 254 631% | |
| Access Time Read * | 0.062 | 0.061 2% | 0.094 -52% | 0.063 -2% | 0.11 -77% | |
| Access Time Write * | 4.234 | 0.042 99% | 0.054 99% | 0.046 99% | 0.064 98% | |
| Media total (Programa/Opciones) | 93% /
117% | 8% /
26% | 31% /
53% | 9% /
26% | -19% /
-19% |
* ... más pequeño es mejor
| 3DMark 11 Performance | 9544 puntos | |
| 3DMark Ice Storm Standard Score | 87313 puntos | |
| 3DMark Cloud Gate Standard Score | 21133 puntos | |
| 3DMark Fire Strike Score | 6530 puntos | |
ayuda | ||
| 3DMark | |
| 1920x1080 Fire Strike Score (ordenar por valor) | |
| MSI GS40-6QE16H11 | |
| SCHENKER XMG P406 | |
| Gigabyte P55 V4 | |
| Gigabyte P34W V3 | |
| SCHENKER XMG C405 | |
| Asus Zenbook UX303UB-R4100T | |
| Alienware 15 R2 (Skylake) | |
| 1280x720 Cloud Gate Standard Score (ordenar por valor) | |
| MSI GS40-6QE16H11 | |
| SCHENKER XMG P406 | |
| Gigabyte P55 V4 | |
| Gigabyte P34W V3 | |
| SCHENKER XMG C405 | |
| Asus Zenbook UX303UB-R4100T | |
| Alienware 15 R2 (Skylake) | |
| 3DMark 11 - 1280x720 Performance (ordenar por valor) | |
| MSI GS40-6QE16H11 | |
| SCHENKER XMG P406 | |
| Gigabyte P55 V4 | |
| Gigabyte P34W V3 | |
| SCHENKER XMG C405 | |
| Asus Zenbook UX303UB-R4100T | |
| Alienware 15 R2 (Skylake) | |
| bajo | medio | alto | ultra | |
| Tomb Raider (2013) | 307.5 | 270.3 | 185 | 86.6 |
| The Witcher 3 (2015) | 134.5 | 84.6 | 38.9 | 26.4 |
| Fallout 4 (2015) | 135.5 | 101.3 | 53.5 | 43.7 |
| Tomb Raider - 1920x1080 Ultra Preset AA:FX AF:16x (ordenar por valor) | |
| MSI GS40-6QE16H11 | |
| Gigabyte P34W V3 | |
| SCHENKER XMG C405 | |
| Asus Zenbook UX303UB-R4100T | |
| Alienware 15 R2 (Skylake) | |
| The Witcher 3 | |
| 1920x1080 High Graphics & Postprocessing (Nvidia HairWorks Off) (ordenar por valor) | |
| MSI GS40-6QE16H11 | |
| Alienware 15 R2 (Skylake) | |
| 1920x1080 Ultra Graphics & Postprocessing (HBAO+) (ordenar por valor) | |
| MSI GS40-6QE16H11 | |
| Alienware 15 R2 (Skylake) | |
| Fallout 4 | |
| 1920x1080 High Preset AA:T AF:16x (ordenar por valor) | |
| MSI GS40-6QE16H11 | |
| SCHENKER XMG P406 | |
| Asus Zenbook UX303UB-R4100T | |
| 1920x1080 Ultra Preset AA:T AF:16x (ordenar por valor) | |
| MSI GS40-6QE16H11 | |
| SCHENKER XMG P406 | |
| Asus Zenbook UX303UB-R4100T | |
Ruido
| Ocioso |
| 33 / 34 / 38 dB(A) |
| HDD |
| 34 dB(A) |
| Carga |
| 44 / 52 dB(A) |
 | ||
30 dB silencioso 40 dB(A) audible 50 dB(A) ruidosamente alto |
||
min: | ||
| MSI GS40-6QE16H11 GeForce GTX 970M, 6700HQ | SCHENKER XMG P406 GeForce GTX 970M, 6700HQ | Gigabyte P34W V3 GeForce GTX 970M, 4720HQ | SCHENKER XMG C405 GeForce GTX 965M, 4720HQ | Asus Zenbook UX303UB-R4100T GeForce 940M, 6500U | Alienware 15 R2 (Skylake) GeForce GTX 980M, 6700HQ | |
|---|---|---|---|---|---|---|
| Noise | 1% | -2% | -4% | 15% | 4% | |
| Idle Minimum * | 33 | 30 9% | 34.2 -4% | 29.2 12% | 31.5 5% | 33.6 -2% |
| Idle Average * | 34 | 32 6% | 34.3 -1% | 34.6 -2% | 31.5 7% | 33.8 1% |
| Idle Maximum * | 38 | 40 -5% | 38 -0% | 38.8 -2% | 31.5 17% | 34 11% |
| Load Average * | 44 | 47 -7% | 43.8 -0% | 54 -23% | 35.9 18% | 39.3 11% |
| Load Maximum * | 52 | 51 2% | 55 -6% | 54.4 -5% | 38.2 27% | 51.4 1% |
* ... más pequeño es mejor
(-) The maximum temperature on the upper side is 57.4 °C / 135 F, compared to the average of 40.4 °C / 105 F, ranging from 21.2 to 68.8 °C for the class Gaming.
(-) The bottom heats up to a maximum of 68.8 °C / 156 F, compared to the average of 43.2 °C / 110 F
(±) In idle usage, the average temperature for the upper side is 34.1 °C / 93 F, compared to the device average of 33.8 °C / 93 F.
(+) The palmrests and touchpad are reaching skin temperature as a maximum (35.3 °C / 95.5 F) and are therefore not hot.
(-) The average temperature of the palmrest area of similar devices was 28.9 °C / 84 F (-6.4 °C / -11.5 F).
| MSI GS40-6QE16H11 GeForce GTX 970M, 6700HQ | SCHENKER XMG P406 GeForce GTX 970M, 6700HQ | Gigabyte P34W V3 GeForce GTX 970M, 4720HQ | SCHENKER XMG C405 GeForce GTX 965M, 4720HQ | Asus Zenbook UX303UB-R4100T GeForce 940M, 6500U | Alienware 15 R2 (Skylake) GeForce GTX 980M, 6700HQ | |
|---|---|---|---|---|---|---|
| Heat | 4% | 9% | 4% | 24% | 16% | |
| Maximum Upper Side * | 57.4 | 55 4% | 45.2 21% | 47.8 17% | 56.6 1% | 48 16% |
| Maximum Bottom * | 68.8 | 58.7 15% | 56.8 17% | 60.4 12% | 54.3 21% | 57.3 17% |
| Idle Upper Side * | 36.3 | 36.9 -2% | 34.6 5% | 37.7 -4% | 24 34% | 31.9 12% |
| Idle Bottom * | 41.2 | 41.7 -1% | 43.6 -6% | 44.8 -9% | 24.2 41% | 33.4 19% |
* ... más pequeño es mejor
| Off / Standby | |
| Ocioso | |
| Carga |
|
| MSI GS40-6QE16H11 GeForce GTX 970M, 6700HQ | SCHENKER XMG P406 GeForce GTX 970M, 6700HQ | MSI GS60-6QE4K16H21 GeForce GTX 970M, 6700HQ | SCHENKER XMG C405 GeForce GTX 965M, 4720HQ | Asus Zenbook UX303UB-R4100T GeForce 940M, 6500U | Alienware 15 R2 (Skylake) GeForce GTX 980M, 6700HQ | |
|---|---|---|---|---|---|---|
| Power Consumption | -5% | -26% | -28% | 59% | -8% | |
| Idle Minimum * | 10 | 12 -20% | 17 -70% | 15.8 -58% | 3.2 68% | 11.4 -14% |
| Idle Average * | 14 | 16 -14% | 22 -57% | 22.8 -63% | 7.6 46% | 16.5 -18% |
| Idle Maximum * | 24 | 22 8% | 28 -17% | 27.3 -14% | 8 67% | 22 8% |
| Load Average * | 90 | 90 -0% | 91 -1% | 106.8 -19% | 47 48% | 94.2 -5% |
| Load Maximum * | 172 | 170 1% | 149 13% | 152 12% | 55 68% | 192.2 -12% |
* ... más pequeño es mejor
| MSI GS40-6QE16H11 GeForce GTX 970M, 6700HQ, 61 Wh | SCHENKER XMG P406 GeForce GTX 970M, 6700HQ, 45 Wh | MSI GS60-6QE4K16H21 GeForce GTX 970M, 6700HQ, 47 Wh | SCHENKER XMG C405 GeForce GTX 965M, 4720HQ, 61 Wh | Asus Zenbook UX303UB-R4100T GeForce 940M, 6500U, 50 Wh | Alienware 15 R2 (Skylake) GeForce GTX 980M, 6700HQ, 96 Wh | |
|---|---|---|---|---|---|---|
| Duración de Batería | -9% | -26% | -21% | 98% | 84% | |
| Reader / Idle | 313 | 275 -12% | 213 -32% | 997 219% | 769 146% | |
| H.264 | 302 | 413 37% | 456 51% | |||
| WiFi v1.3 | 297 | 197 -34% | 157 -47% | 236 -21% | 410 38% | 446 50% |
| Load | 60 | 72 20% | 61 2% | 118 97% | 114 90% |
Pro
Contra
El GS40 es un buen equilibrio entre rendimiento y dimensiones compactas. Los pocos defectos son principalmente resultado del concepto "Mini-Max", pero son tolerables. El rendimiento (de juego) queda fuera de toda duda – el GS40 hasta puede vérselas con juegos muy exigentes. El display es impresionante, el consumo de energía razonable y la duración de batería está bastante bien.
El ligero peso afecta la estabilidad del chasis, que se flexiona rápidamente bajo presión (incl. el tecleo). A los ventiladores les cuesta disipar el calor – ¿quizá deberían ir a una velocidad regular en vez de pulsar? Eso mejoraría definitivamente el desarrollo del ruido.
Pero esto no logra cambiar nuestra buenísima impresión general del GS40. No hay muchas alternativas de 14", al menos si quieres características modernas como una CPU Skylake, RAM DDR4 y USB 3.1. Esto podría cambiar bastante rápido (análisis del Schenker XMG P406 proximamente), pero por ahora sólo podrías tener sistemas más pequeños pero menos potentes, o comprar un portátil de juego más pesado de 15" o incluso 17".
A unos 1700 Euros, el GS40 no es ninguna ganga, pero el precio es similar al de los rivales.
Ésta es una versión acortada del análisis original. Puedes leer el análisis completo en inglés aquí.
MSI GS40-6QE16H11
-
03/08/2016 v5(old)
Oliver Moebel
Pricecompare
