 Deutsch
 English
 Español
 Français
 Italiano
 Nederlands
 Polski
 Português
 Русский
 Türkçe
 Svenska
 Chinese
 Magyar
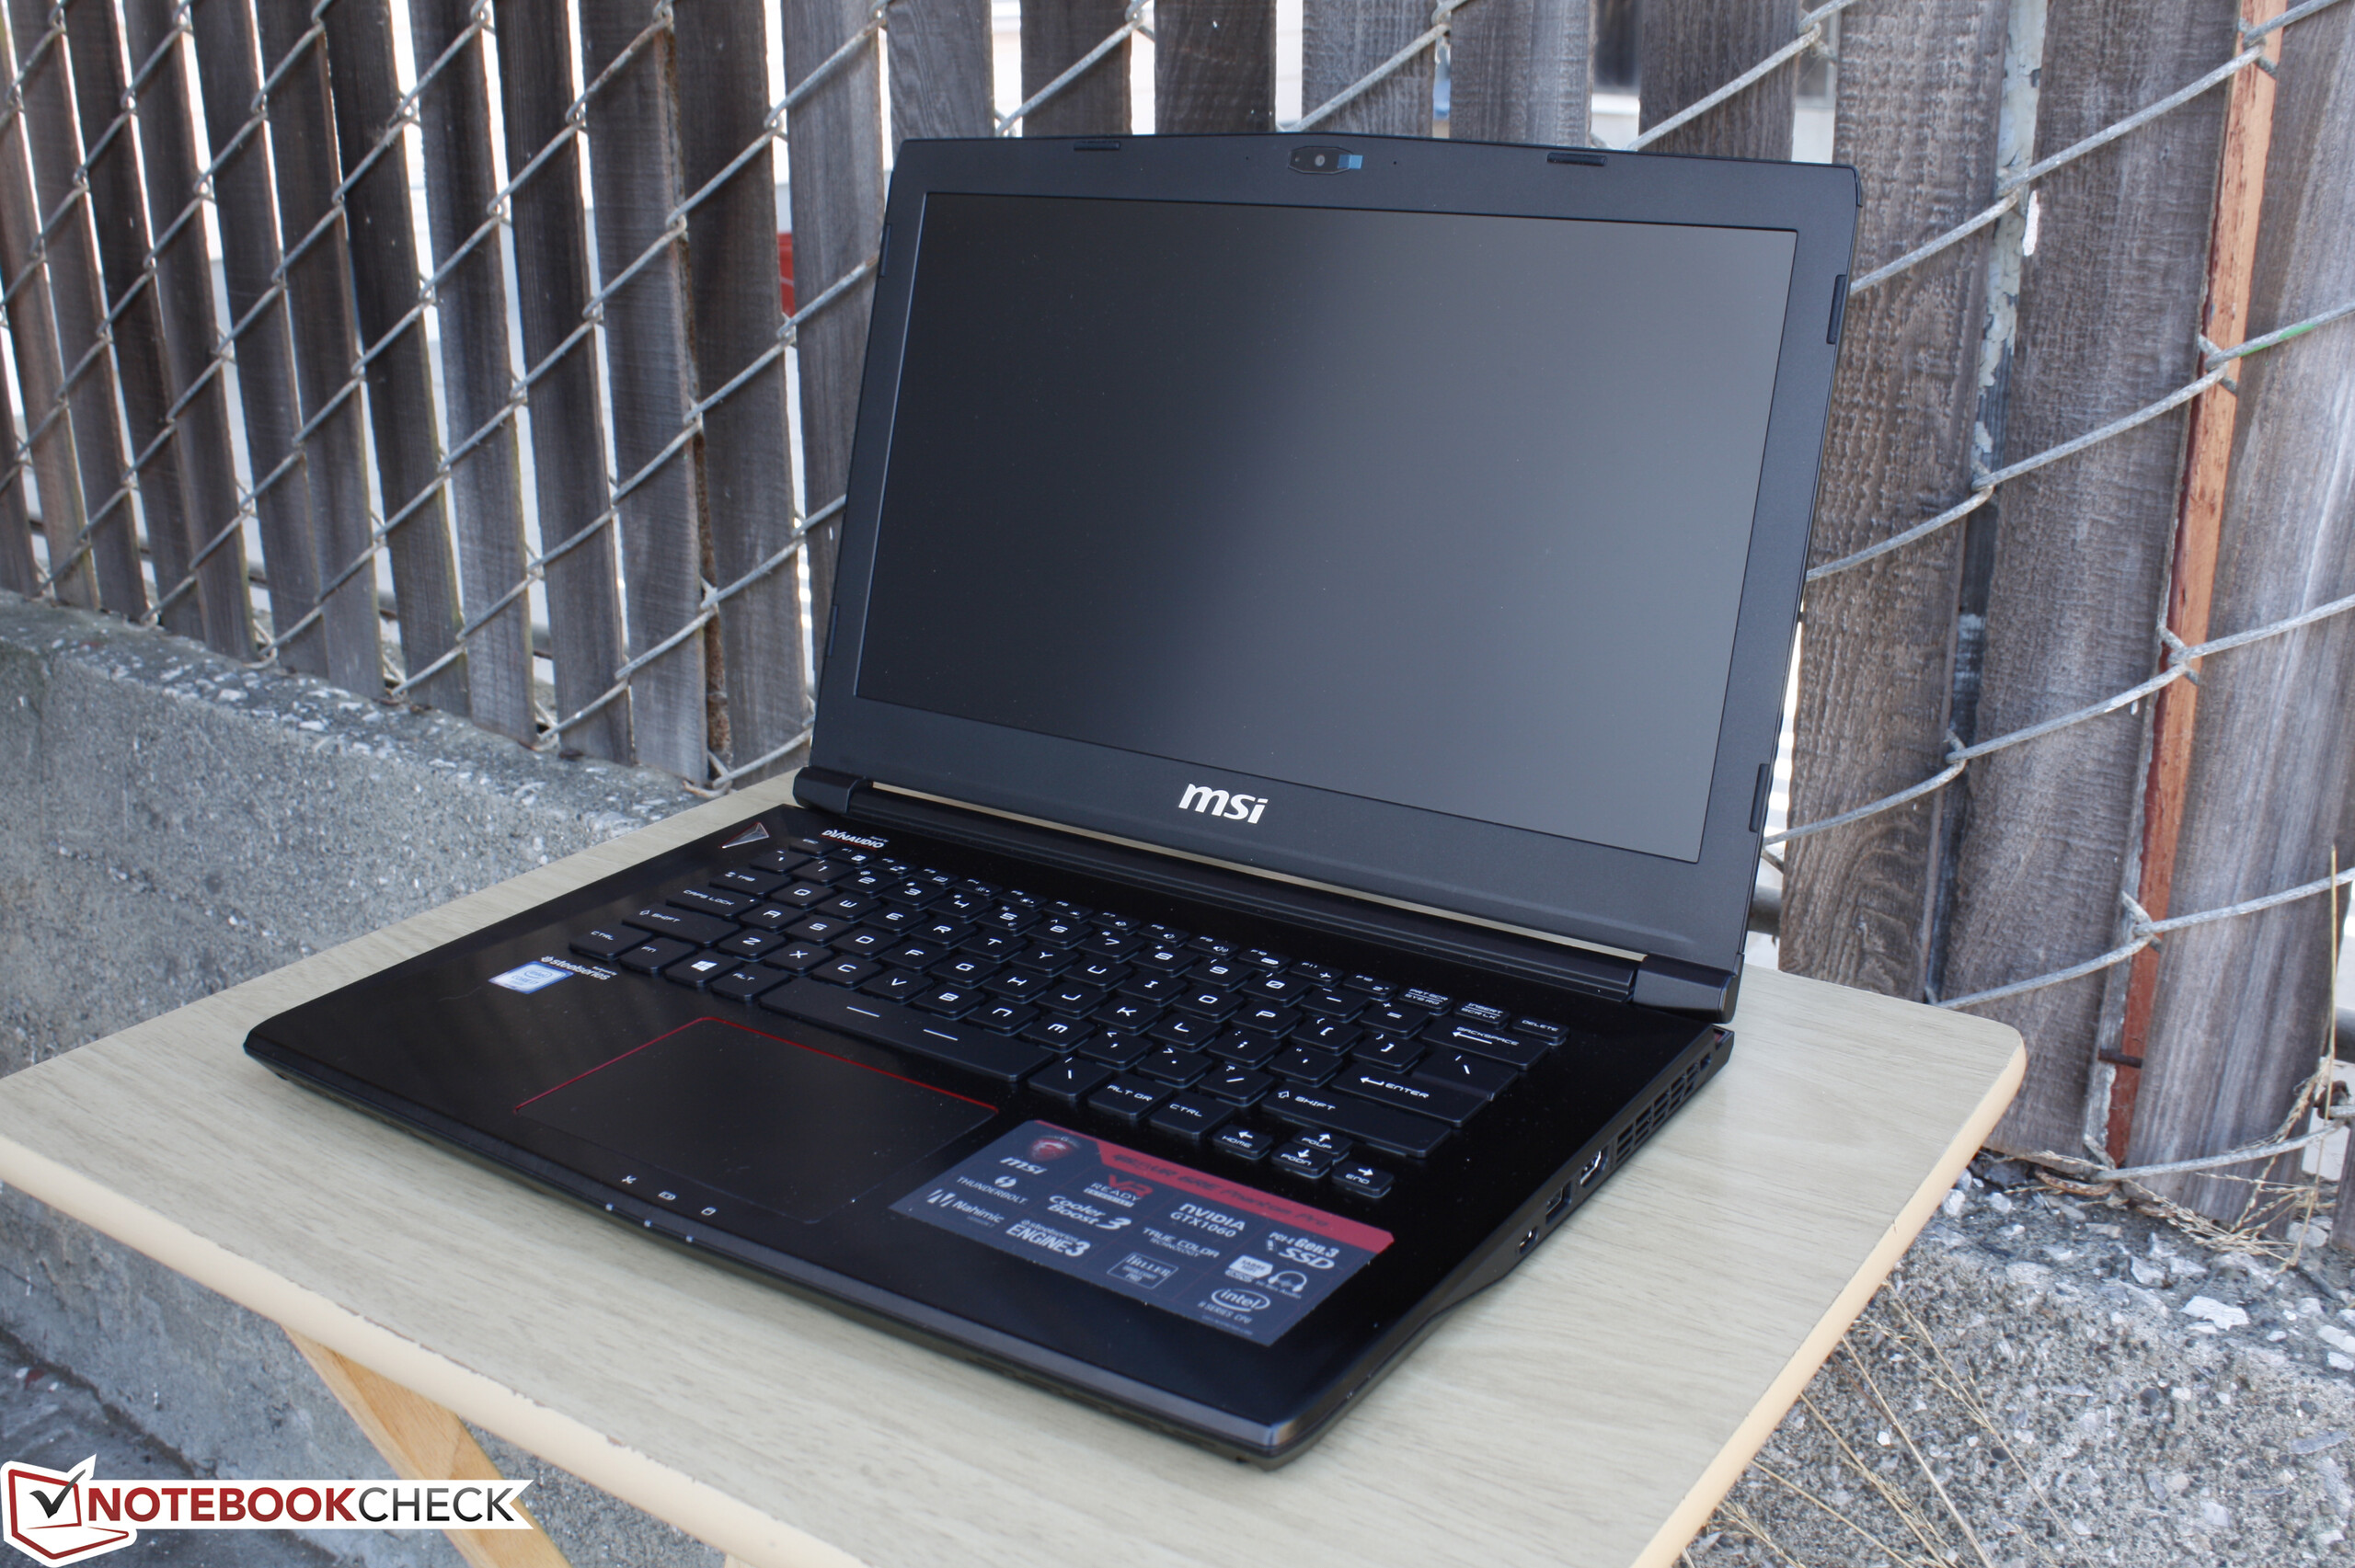
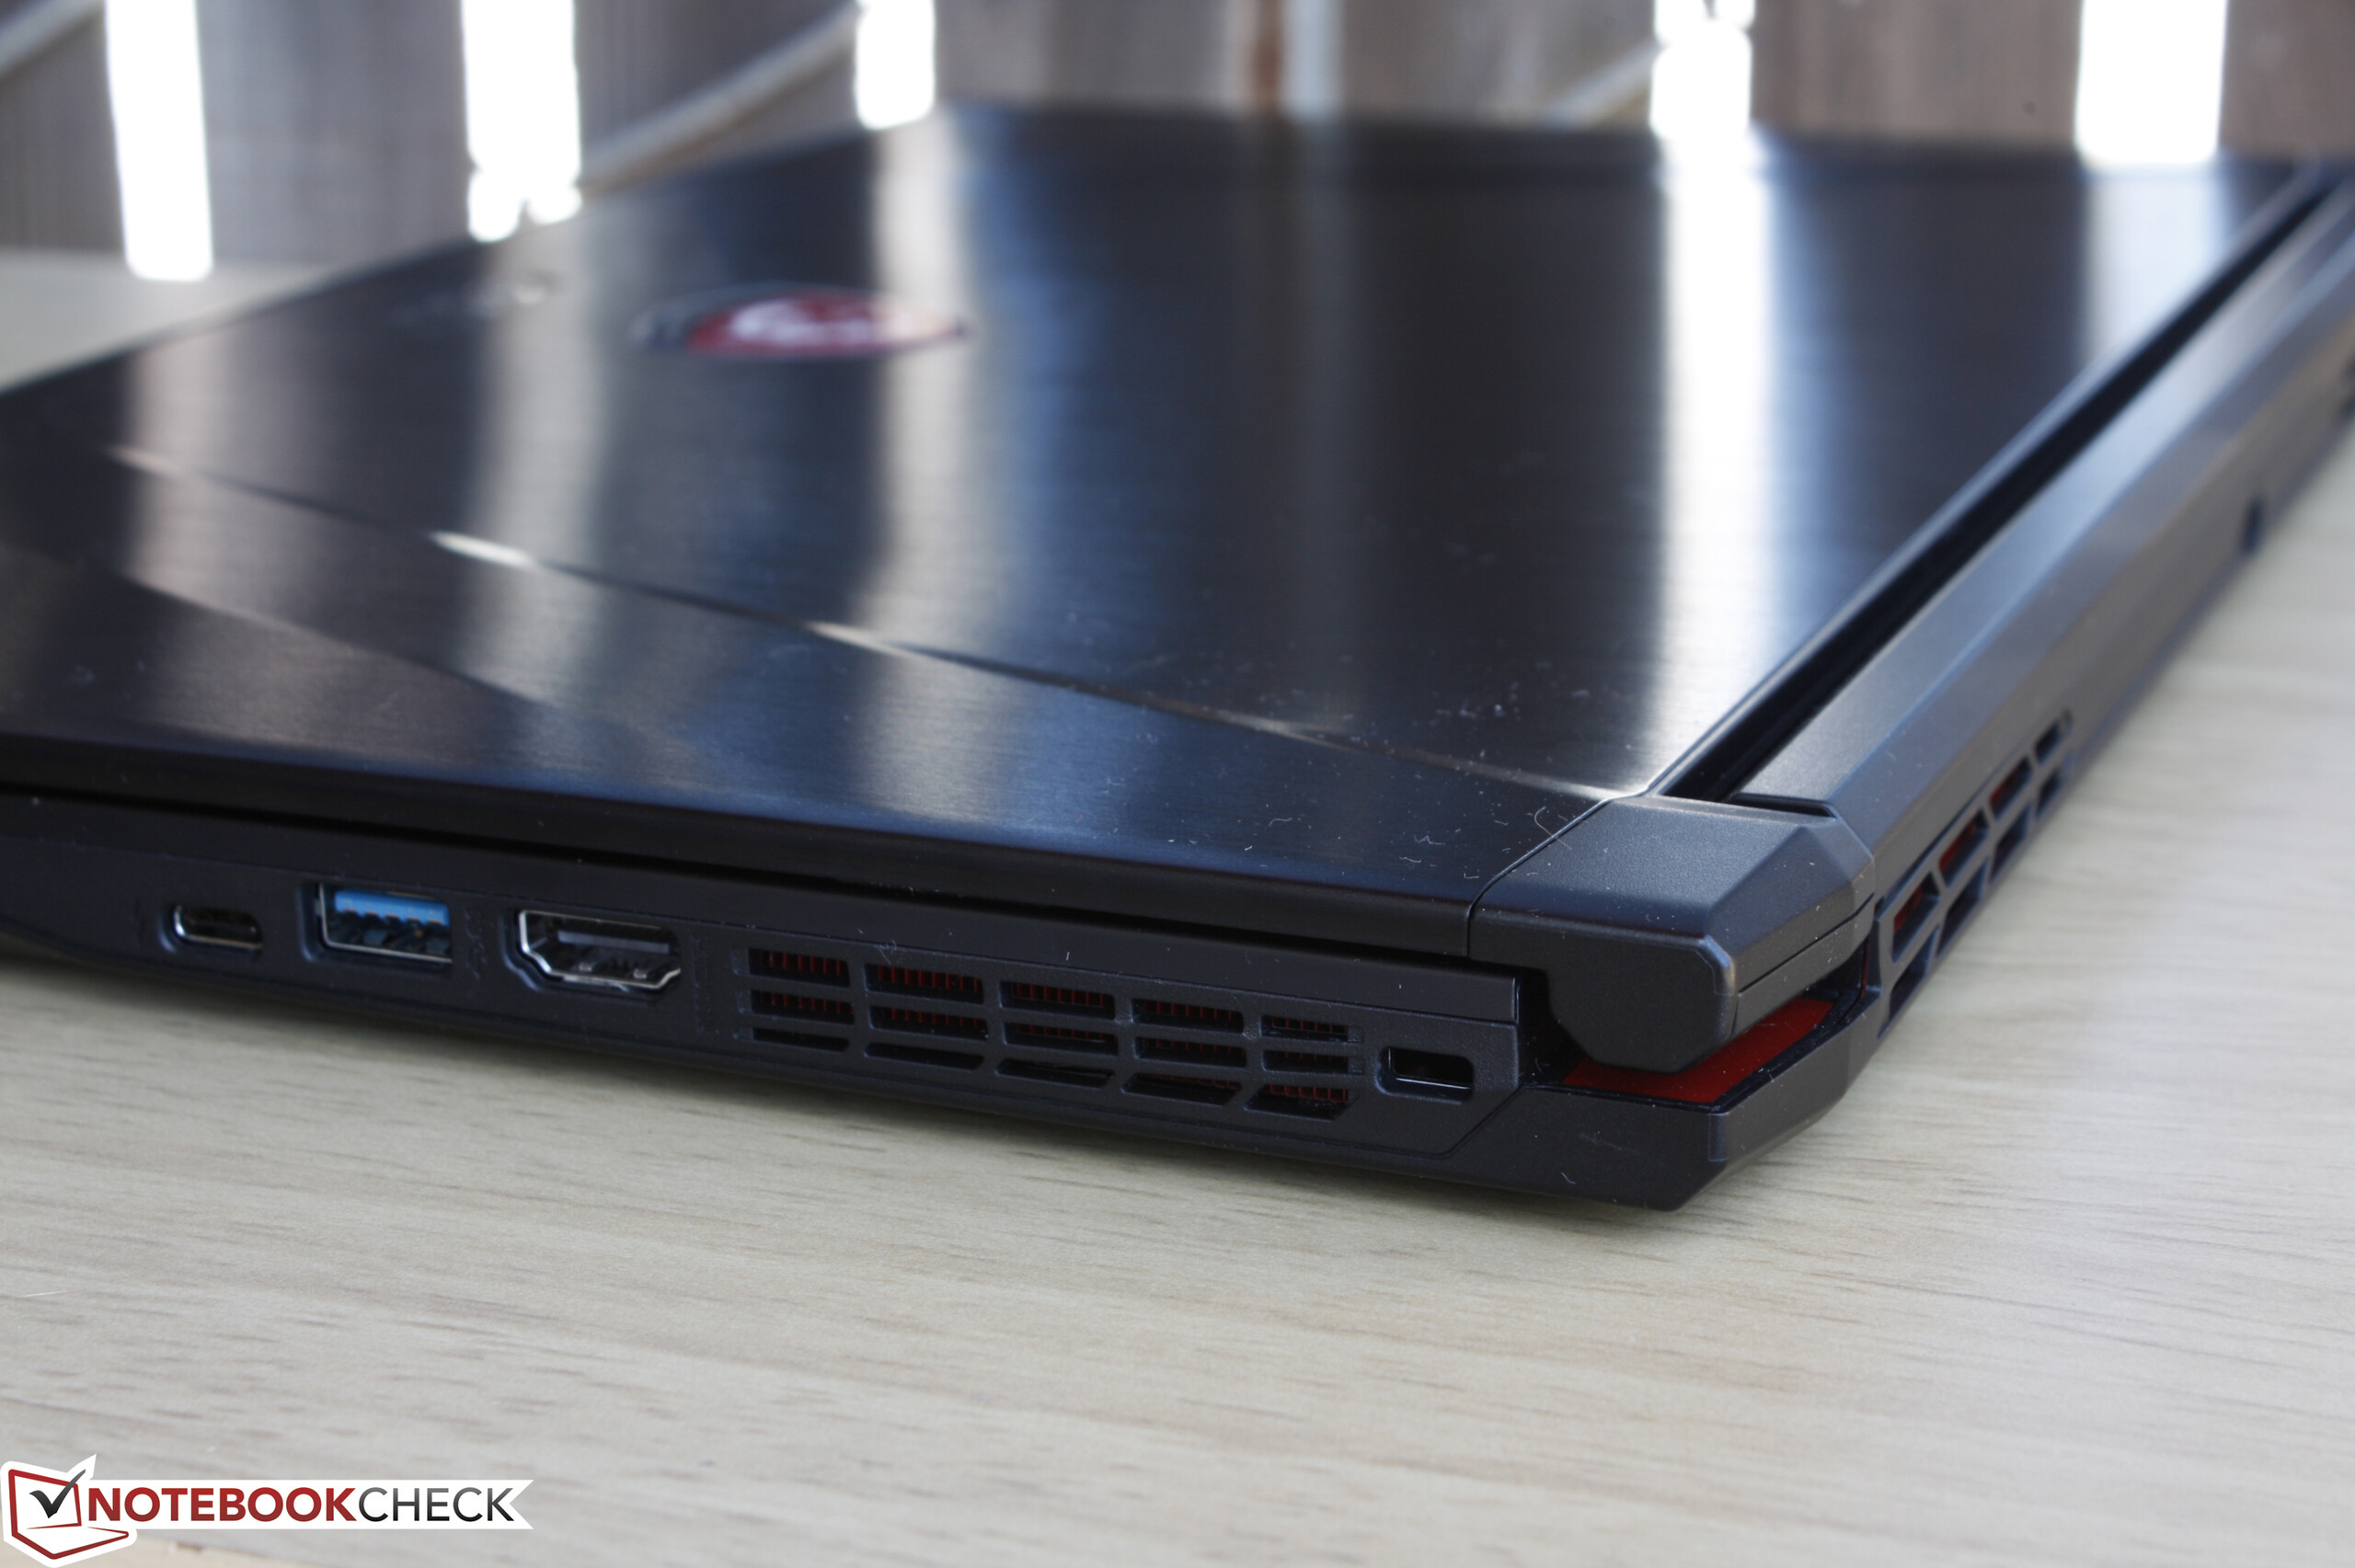
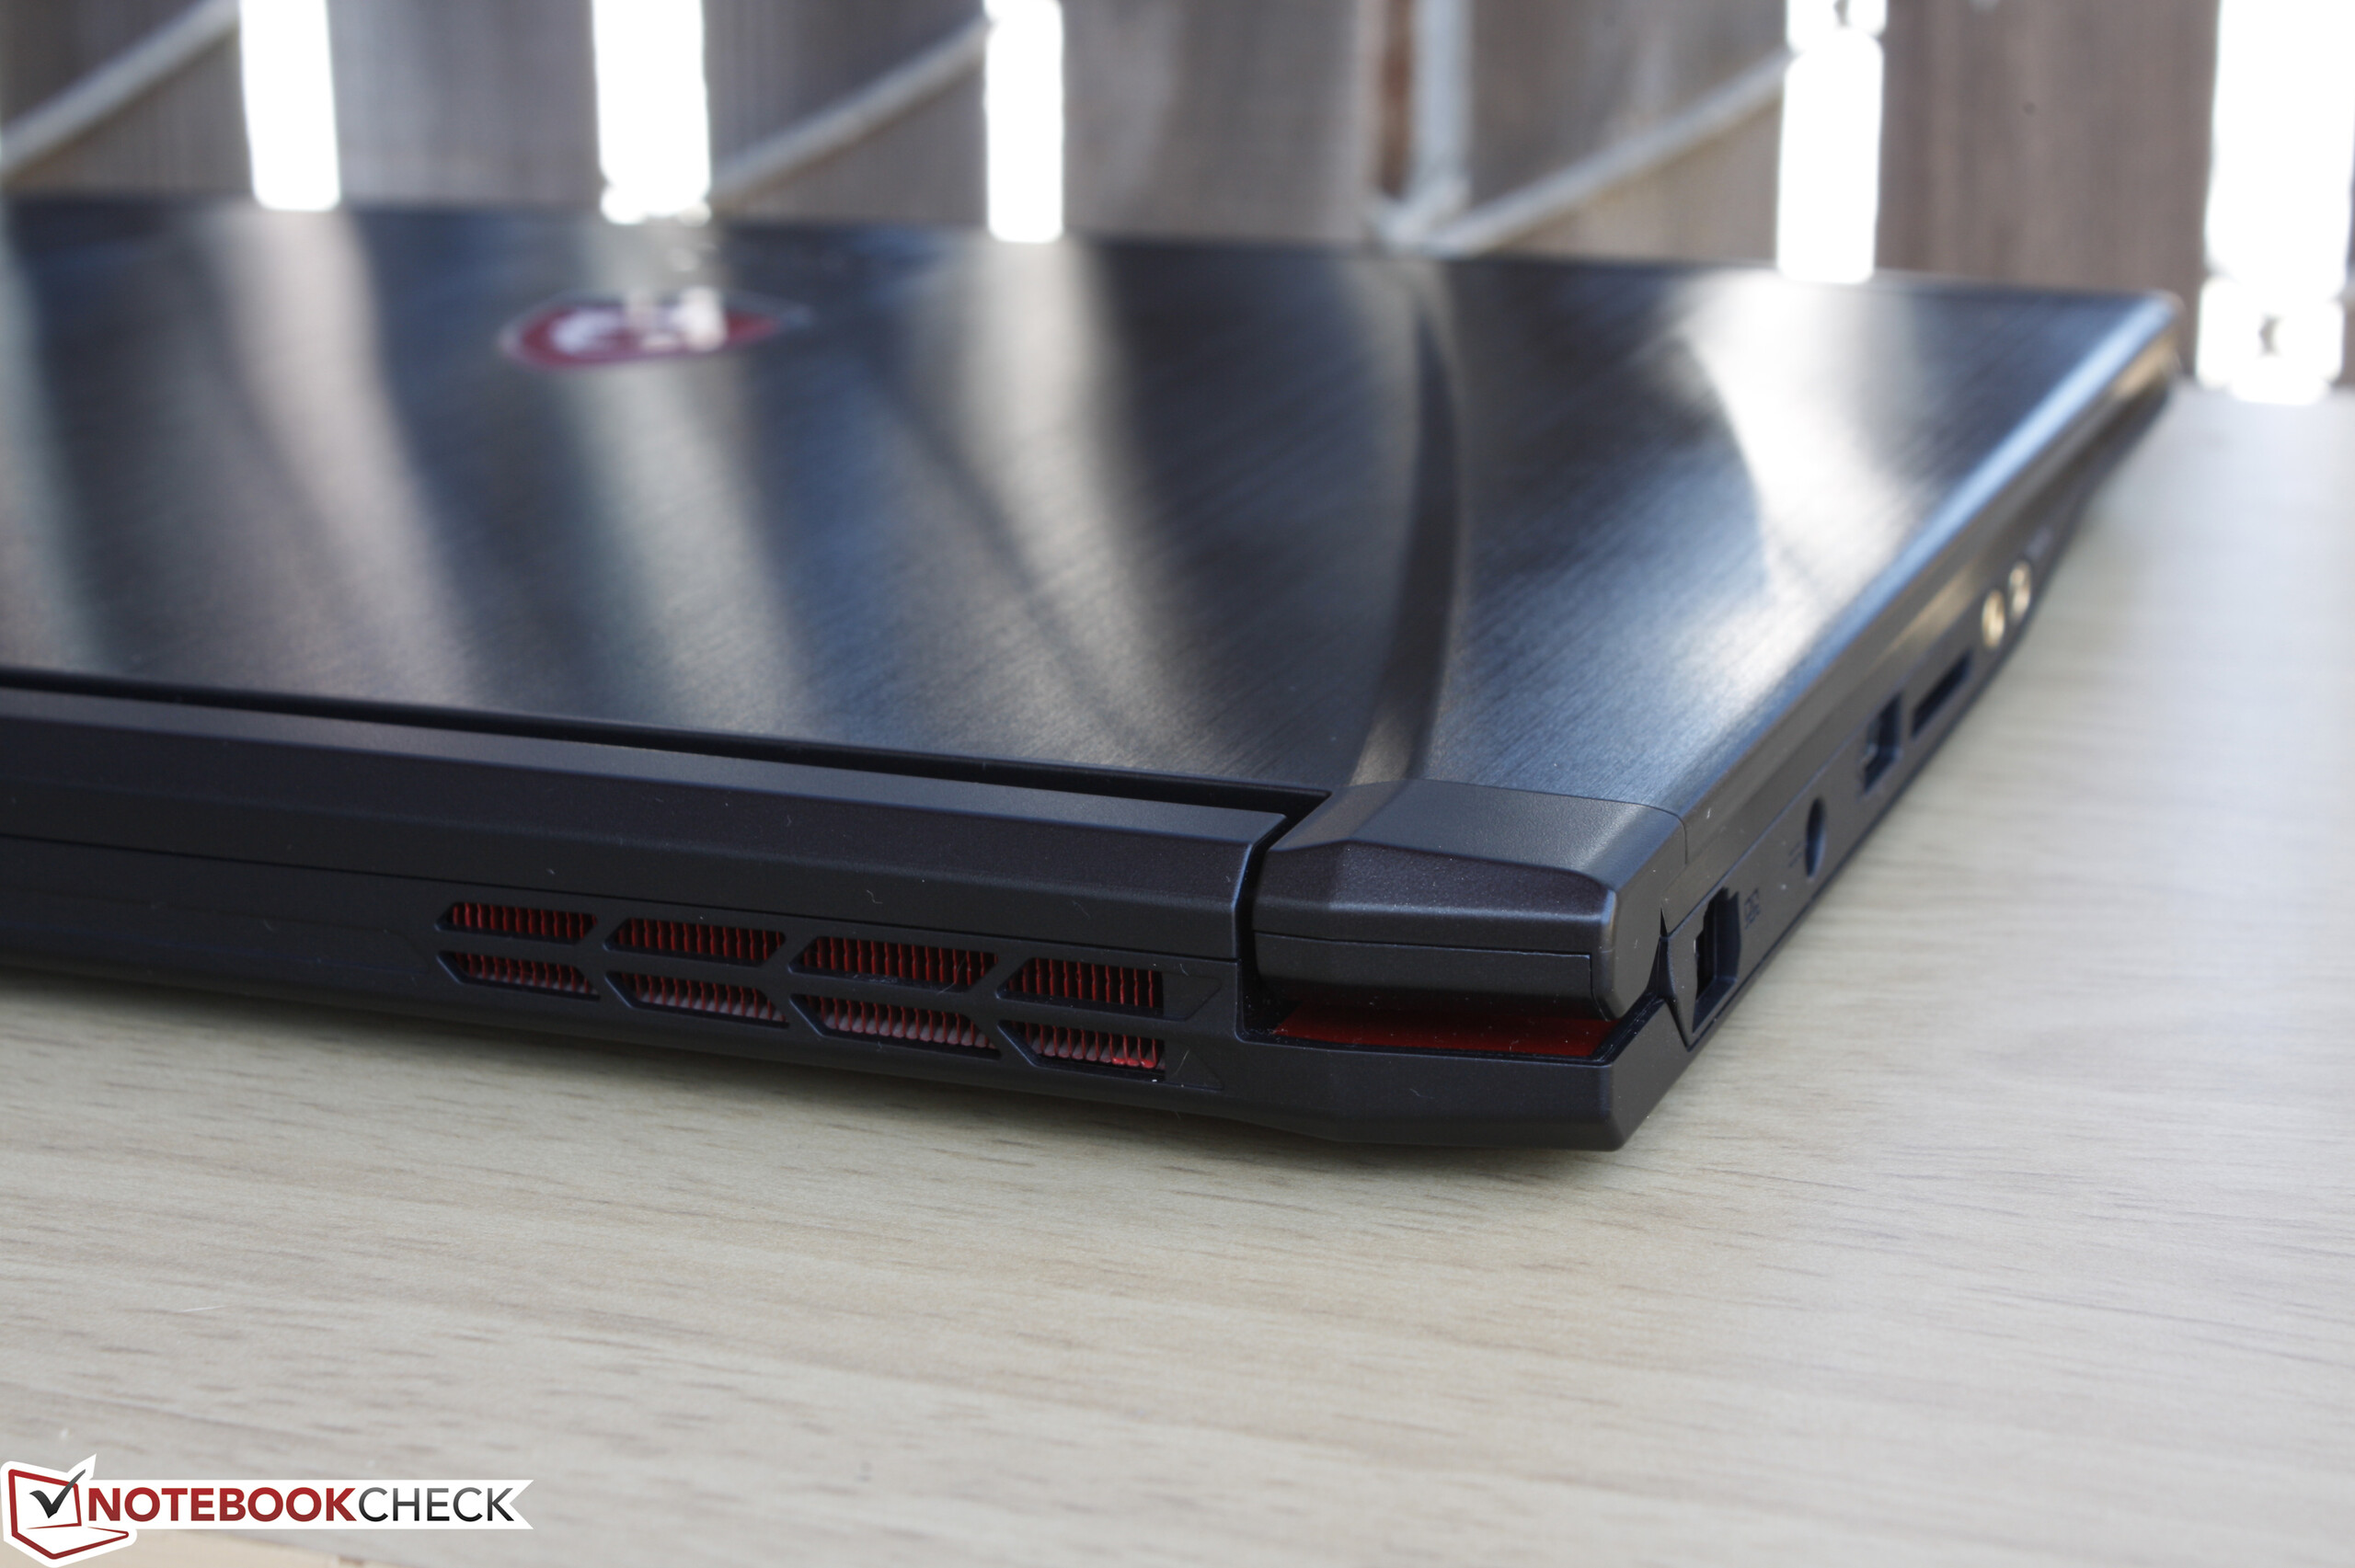
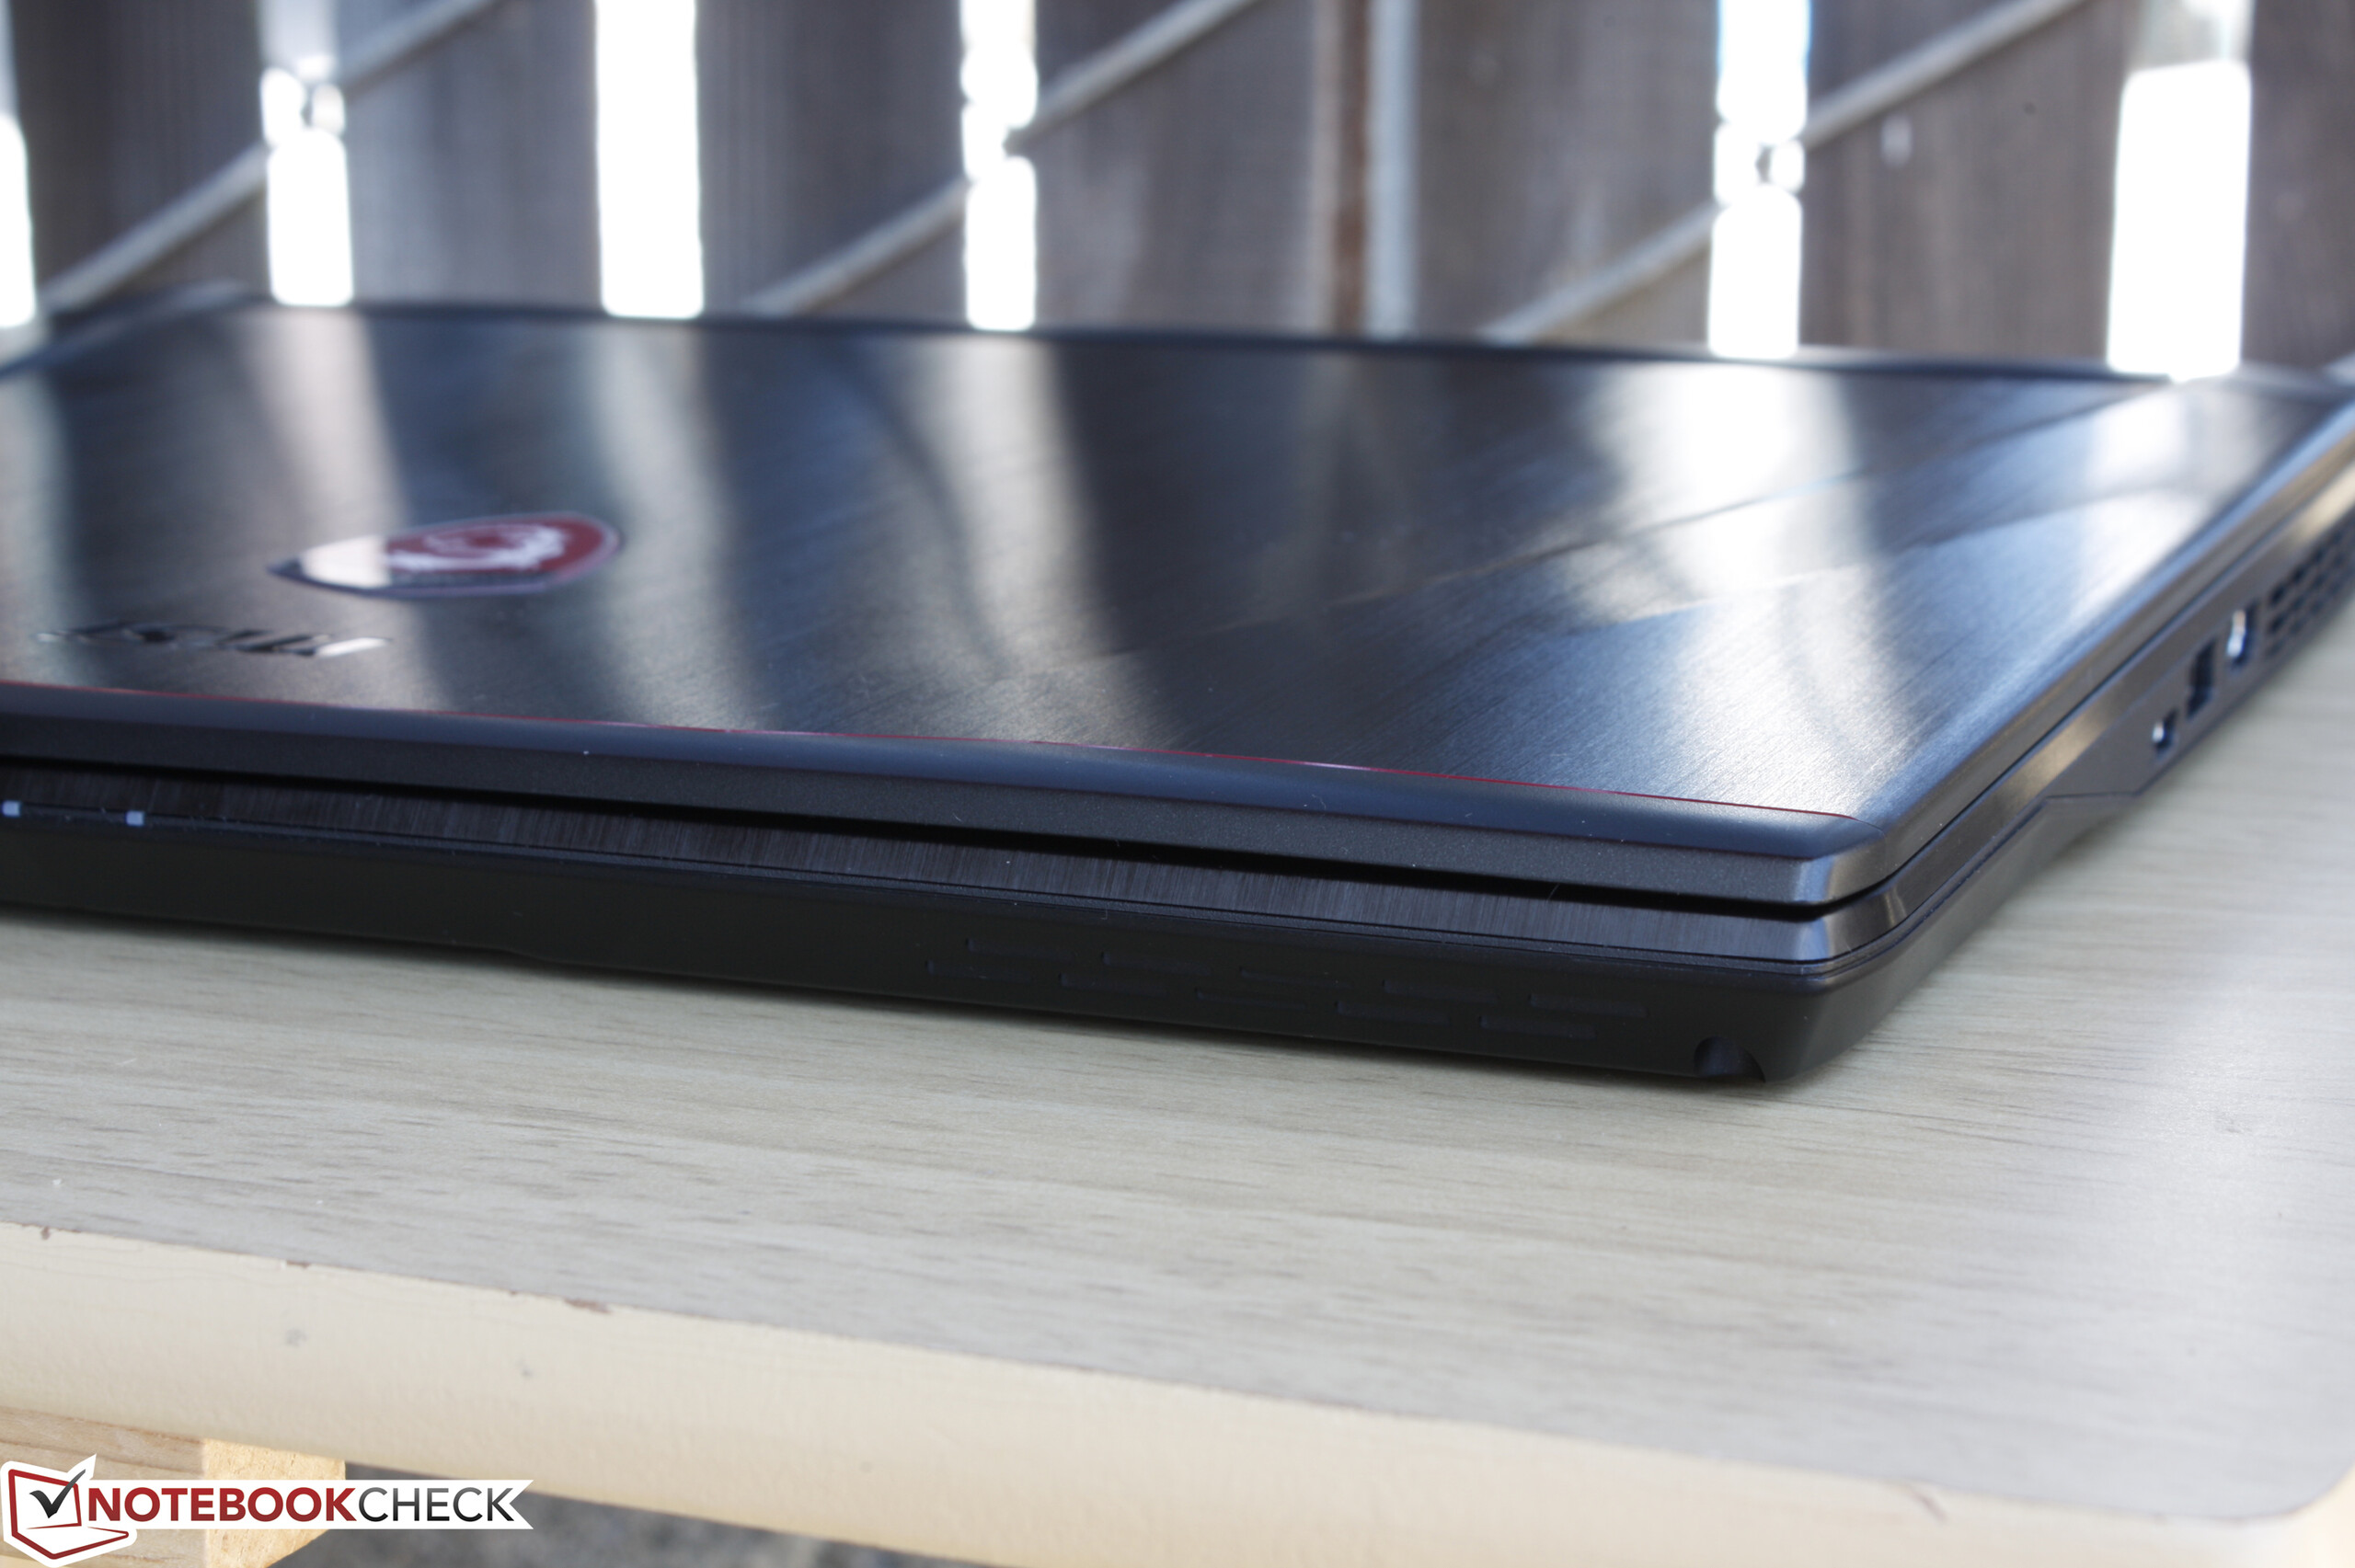
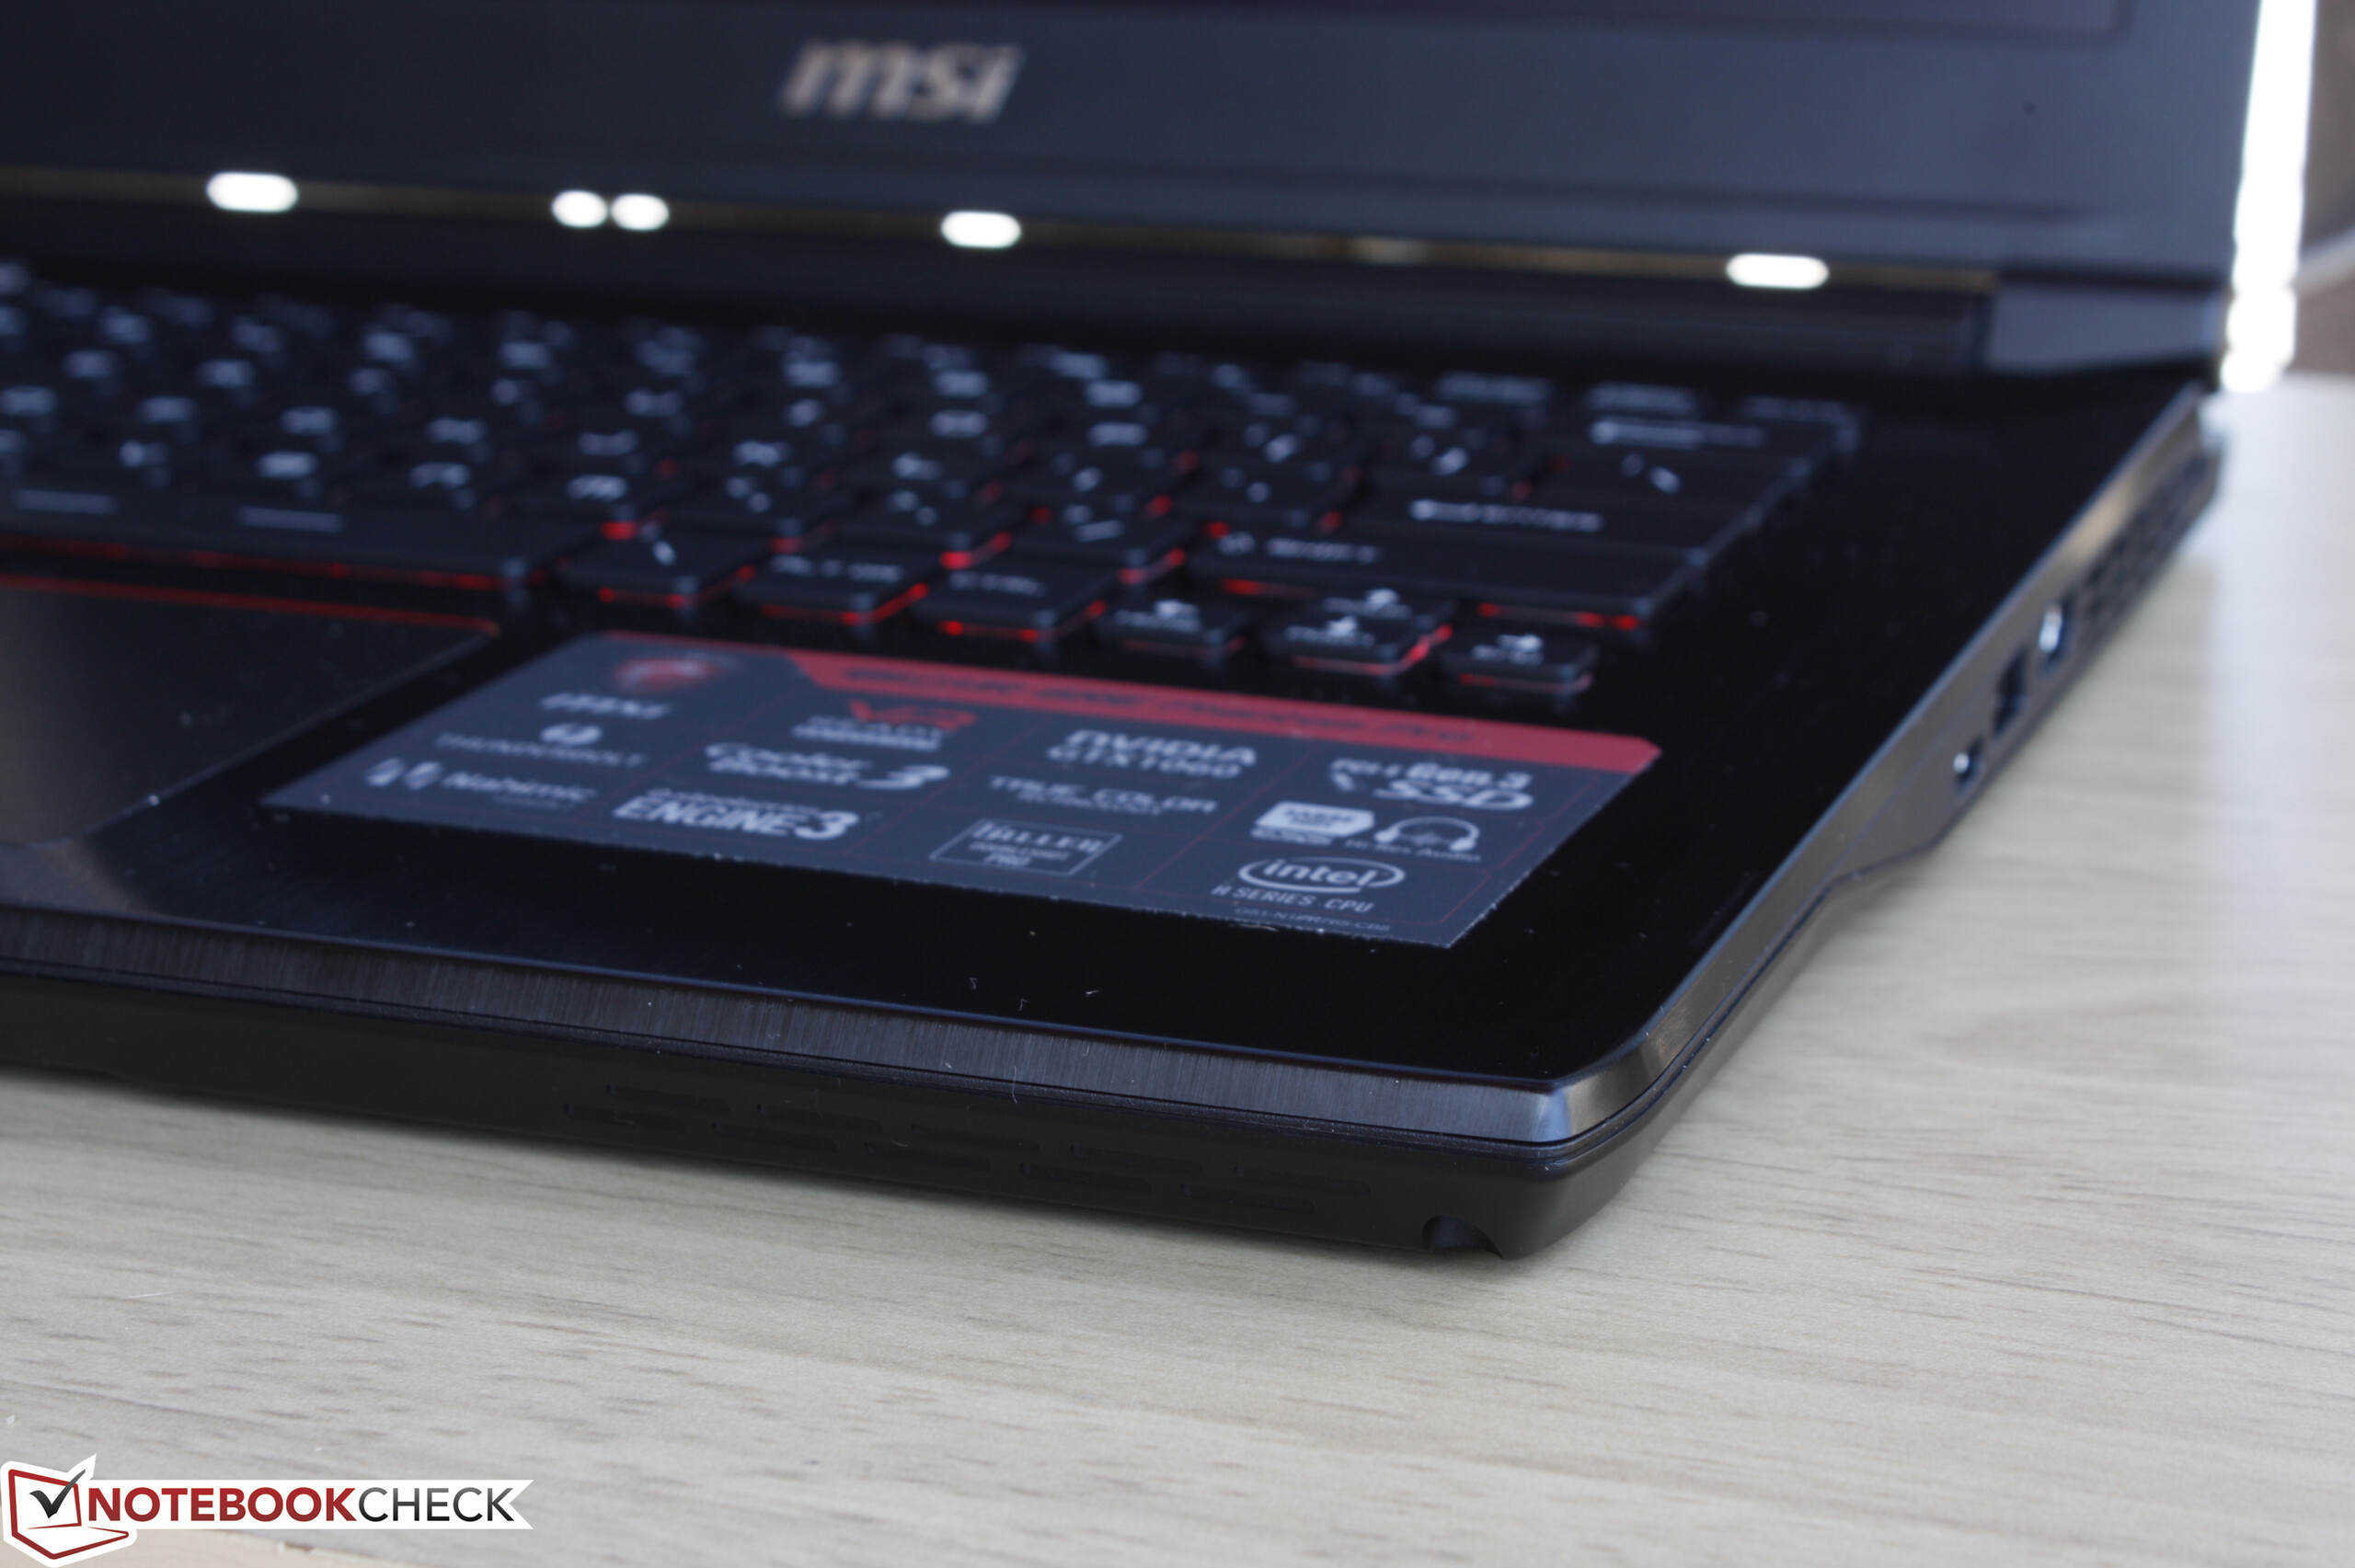
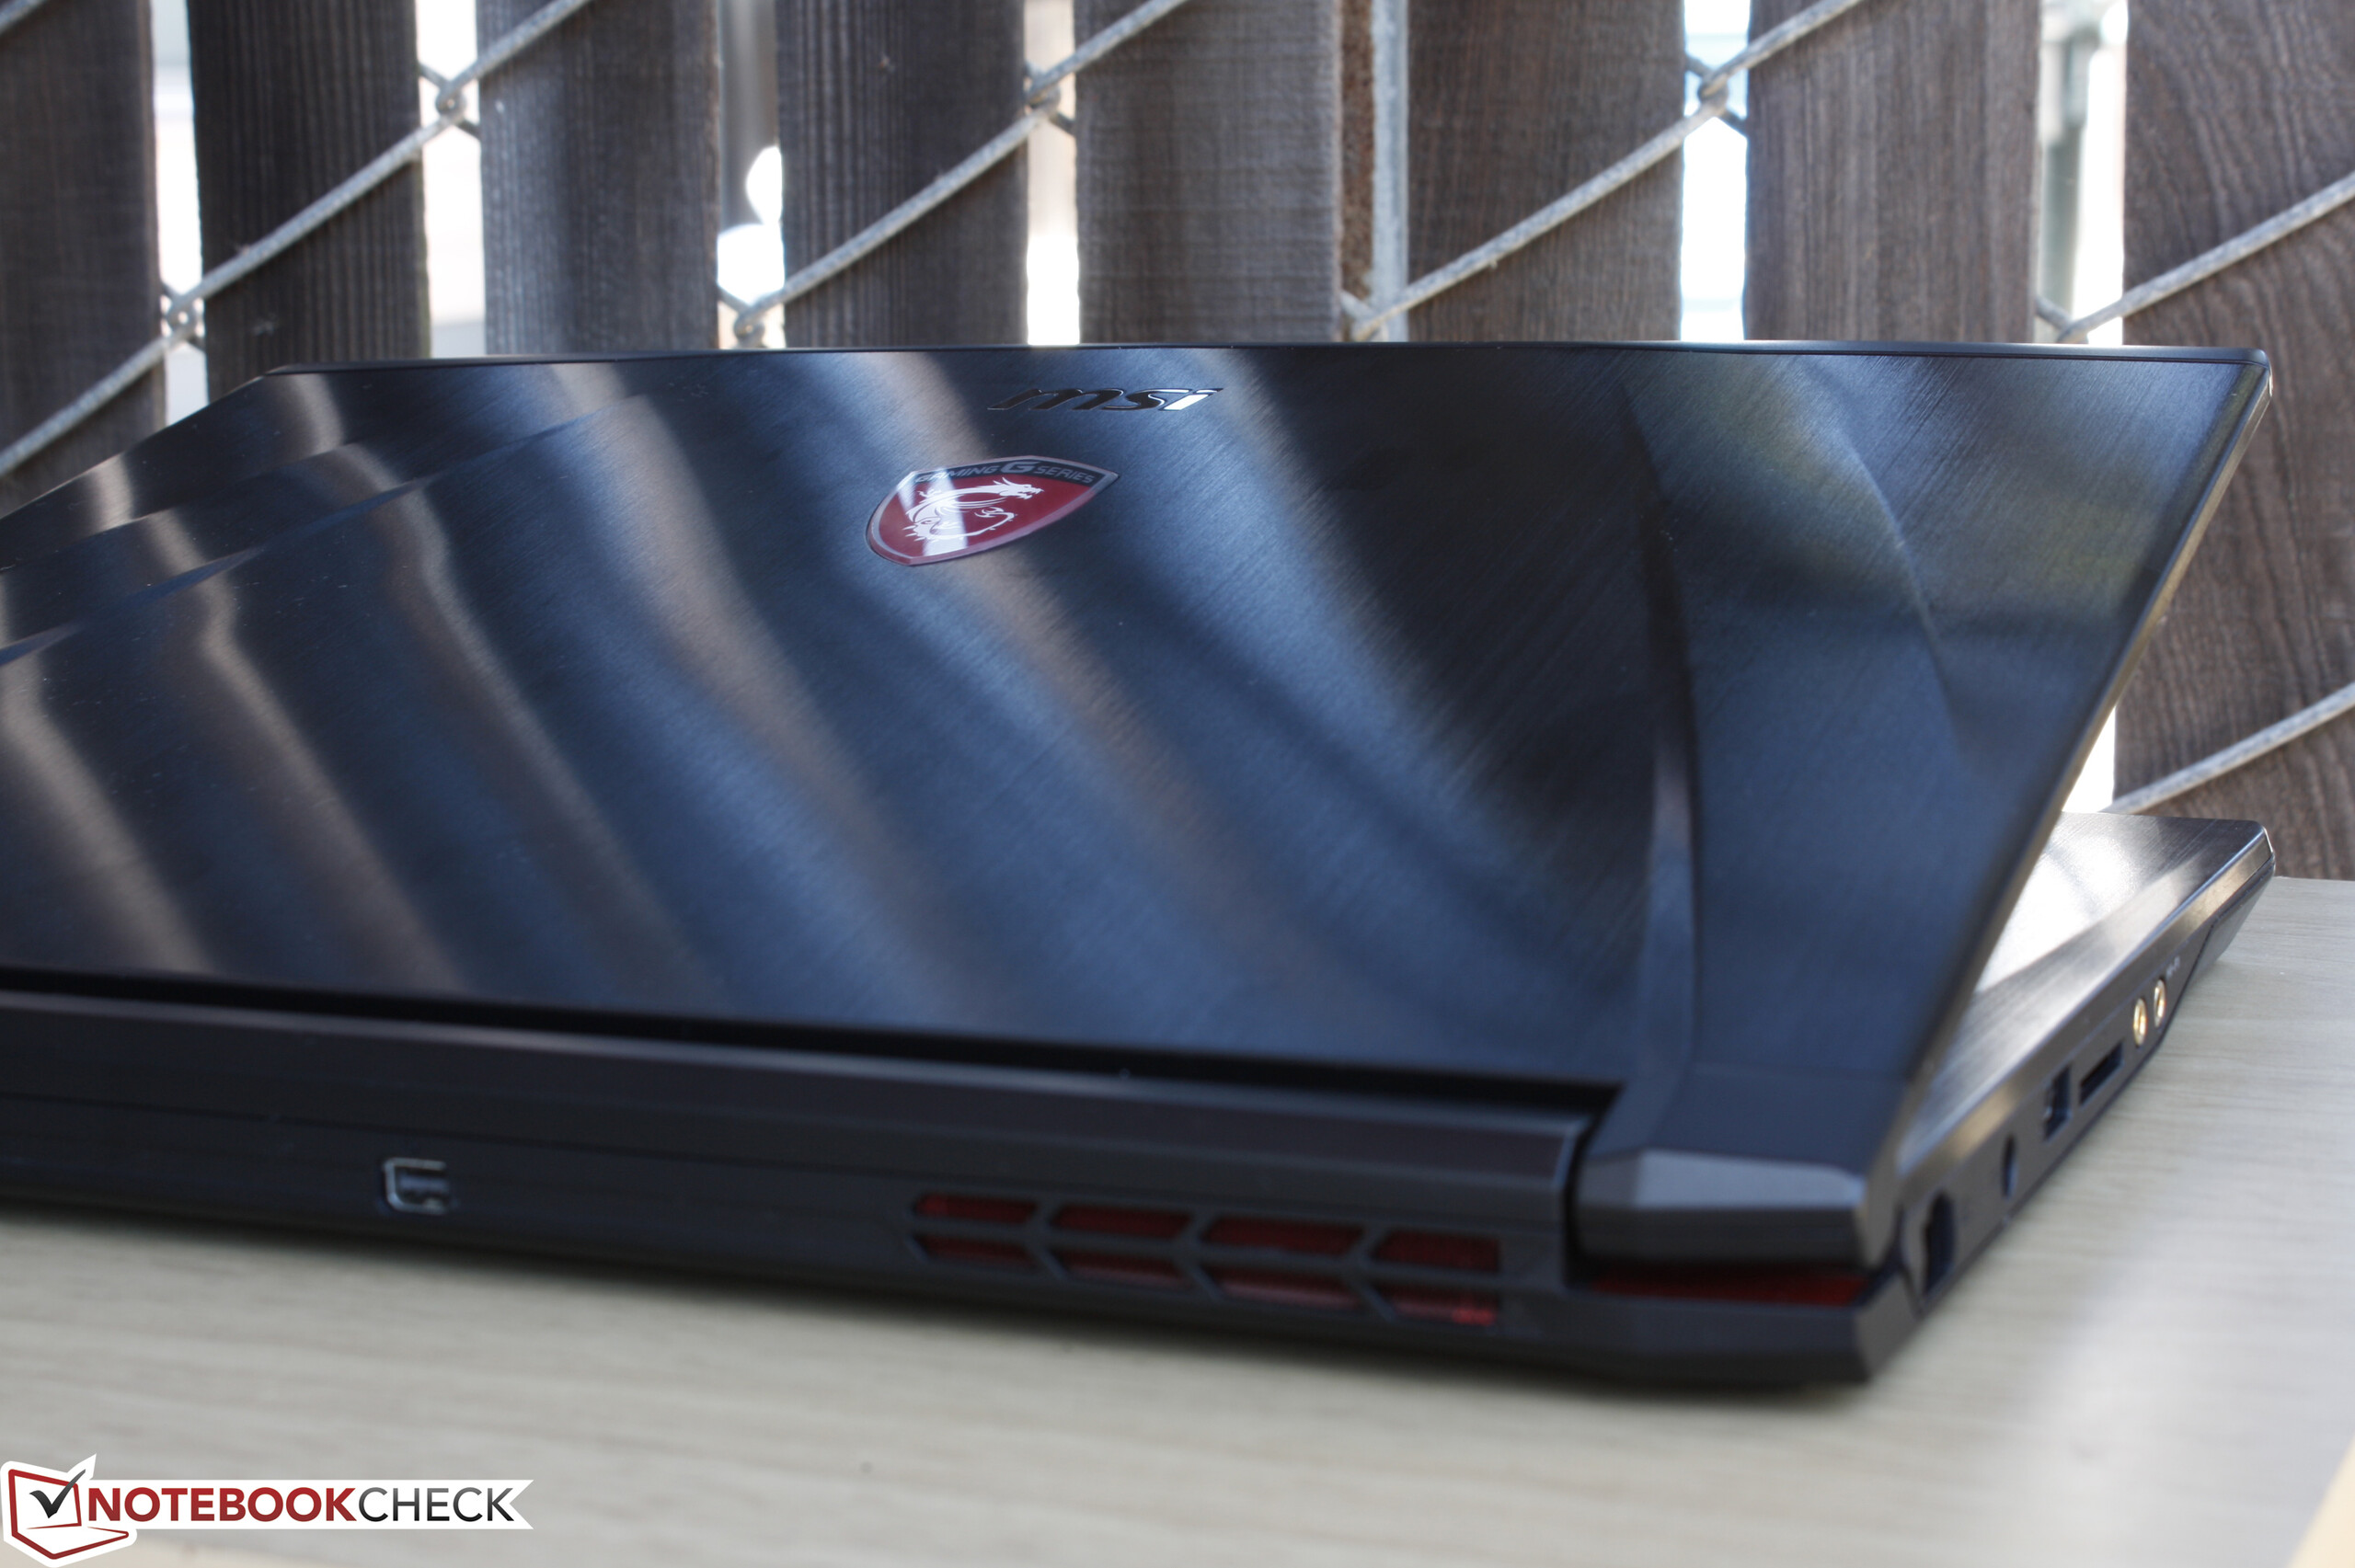
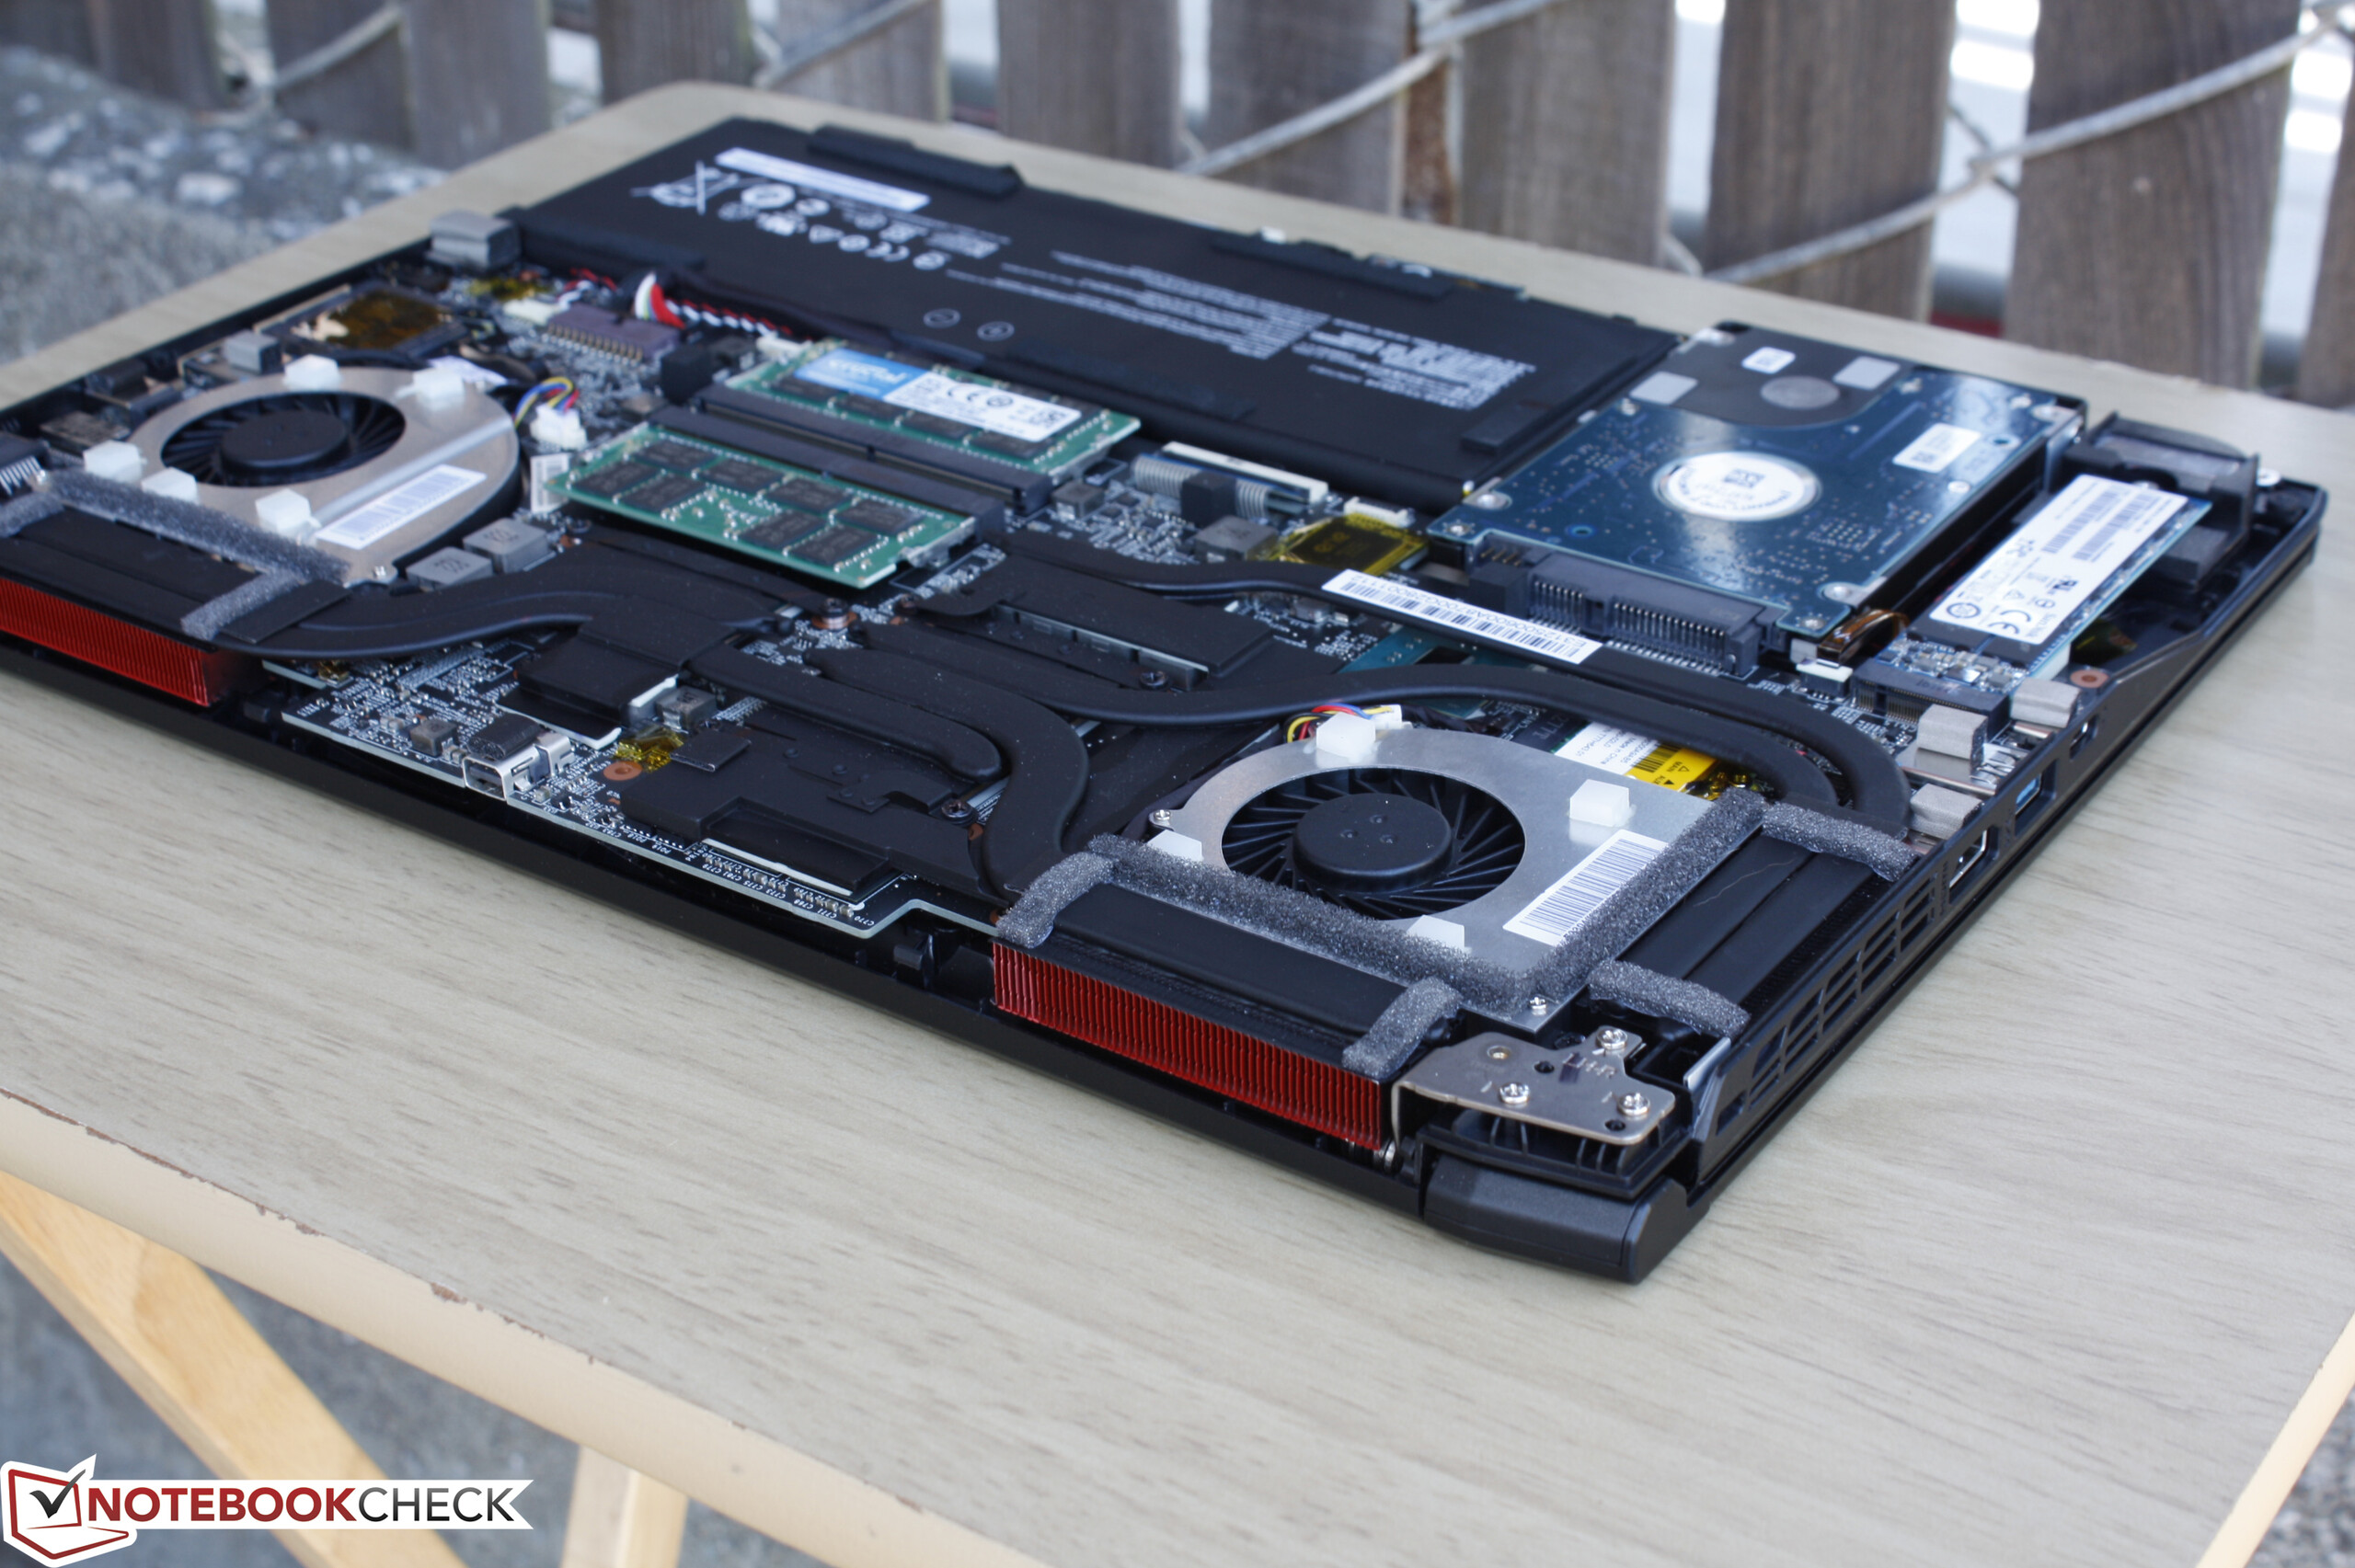
Breve análisis del MSI GS43VR 6RE Phantom Pro
| SD Card Reader | |
| average JPG Copy Test (av. of 3 runs) | |
| Alienware 17 R3 (A17-9935) | |
| MSI GS73VR 6RF | |
| MSI GS43VR 6RE-006US | |
| maximum AS SSD Seq Read Test (1GB) | |
| Alienware 17 R3 (A17-9935) | |
| MSI GS73VR 6RF | |
| MSI GS43VR 6RE-006US | |
| Networking | |
| iperf Server (receive) TCP 1 m 512KB | |
| MSI GS43VR 6RE-006US | |
| iperf Client (transmit) TCP 1 m 512KB | |
| MSI GS43VR 6RE-006US | |
| |||||||||||||||||||||||||
iluminación: 83 %
Brillo con batería: 288.4 cd/m²
Contraste: 824:1 (Negro: 0.35 cd/m²)
ΔE Color 2.61 | 0.5-29.43 Ø5
ΔE Greyscale 1.18 | 0.57-98 Ø5.3
86.4% sRGB (Argyll 1.6.3 3D)
56.4% AdobeRGB 1998 (Argyll 1.6.3 3D)
63.1% AdobeRGB 1998 (Argyll 2.2.0 3D)
86.4% sRGB (Argyll 2.2.0 3D)
65.5% Display P3 (Argyll 2.2.0 3D)
Gamma: 2.24
| MSI GS43VR 6RE-006US Name: LG Philips LP140WF3-SPD1, ID: LGD046D, IPS, 14.00, 1920x1080 | Gigabyte P34W v5 IPS, 14.00, 2560x1440 | MSI GS40-6QE16H11 LG Philips LP140WF3-SPD1 (LGD046D), IPS, 14.00, 1920x1080 | Aorus X3 Plus v5 IPS, 13.90, 3200x1800 | Razer Blade 14 2015 IPS, 14.00, 3200x1800 | |
|---|---|---|---|---|---|
| Display | -16% | -0% | 9% | 11% | |
| Display P3 Coverage | 65.5 | 51.4 -22% | 66.2 1% | 67.9 4% | 70.3 7% |
| sRGB Coverage | 86.4 | 76.6 -11% | 85.7 -1% | 98.2 14% | 97.1 12% |
| AdobeRGB 1998 Coverage | 63.1 | 52.8 -16% | 62.6 -1% | 69.2 10% | 71.1 13% |
| Response Times | -17% | 4% | -80% | ||
| Response Time Grey 50% / Grey 80% * | 31.6 ? | 41.2 ? -30% | 31 ? 2% | 52.4 ? -66% | |
| Response Time Black / White * | 24.4 ? | 25.4 ? -4% | 23 ? 6% | 47.2 ? -93% | |
| PWM Frequency | 198 ? | ||||
| Screen | -11% | -70% | -27% | -50% | |
| Brightness middle | 288.4 | 277.8 -4% | 304 5% | 394.8 37% | 318.4 10% |
| Brightness | 282 | 270 -4% | 282 0% | 370 31% | 311 10% |
| Brightness Distribution | 83 | 83 0% | 88 6% | 79 -5% | 78 -6% |
| Black Level * | 0.35 | 0.38 -9% | 0.37 -6% | 0.293 16% | 0.416 -19% |
| Contrast | 824 | 731 -11% | 822 0% | 1347 63% | 765 -7% |
| Colorchecker dE 2000 * | 2.61 | 2.71 -4% | 7.47 -186% | 4.8 -84% | 3.67 -41% |
| Colorchecker dE 2000 max. * | 7.34 | 5.47 25% | |||
| Greyscale dE 2000 * | 1.18 | 2.11 -79% | 6.51 -452% | 5.04 -327% | 5.41 -358% |
| Gamma | 2.24 98% | 2.19 100% | 3.71 59% | 2.26 97% | 2.26 97% |
| CCT | 6506 100% | 6314 103% | 7840 83% | 7343 89% | 7118 91% |
| Color Space (Percent of AdobeRGB 1998) | 56.4 | 48.5 -14% | 56 -1% | 63.4 12% | 64.64 15% |
| Color Space (Percent of sRGB) | 86.4 | 76.9 -11% | 86 0% | 98.1 14% | |
| Media total (Programa/Opciones) | -15% /
-13% | -22% /
-45% | -33% /
-27% | -20% /
-33% |
* ... más pequeño es mejor
Tiempos de respuesta del display
| ↔ Tiempo de respuesta de Negro a Blanco | ||
|---|---|---|
| 24.4 ms ... subida ↗ y bajada ↘ combinada | ↗ 5.2 ms subida | 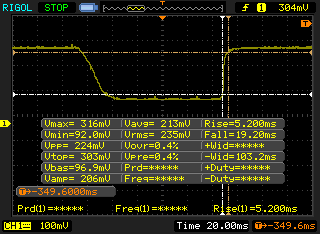 |
| ↘ 19.2 ms bajada | ||
| La pantalla mostró buenos tiempos de respuesta en nuestros tests pero podría ser demasiado lenta para los jugones competitivos. En comparación, todos los dispositivos de prueba van de ##min### (mínimo) a 240 (máximo) ms. » 52 % de todos los dispositivos son mejores. Eso quiere decir que el tiempo de respuesta es peor que la media (21.5 ms) de todos los dispositivos testados. | ||
| ↔ Tiempo de respuesta 50% Gris a 80% Gris | ||
| 31.6 ms ... subida ↗ y bajada ↘ combinada | ↗ 10.4 ms subida | 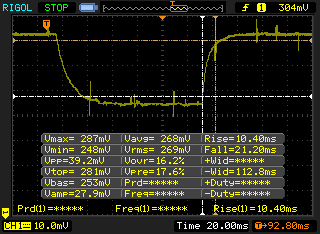 |
| ↘ 21.2 ms bajada | ||
| La pantalla mostró tiempos de respuesta lentos en nuestros tests y podría ser demasiado lenta para los jugones. En comparación, todos los dispositivos de prueba van de ##min### (mínimo) a 636 (máximo) ms. » 36 % de todos los dispositivos son mejores. Eso quiere decir que el tiempo de respuesta es similar al dispositivo testado medio (33.7 ms). | ||
Parpadeo de Pantalla / PWM (Pulse-Width Modulation)
| Parpadeo de Pantalla / PWM no detectado | 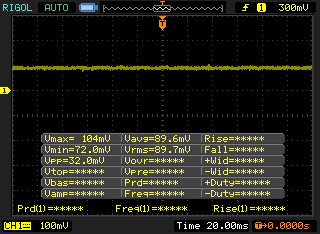 | ||
Comparación: 53 % de todos los dispositivos testados no usaron PWM para atenuar el display. Si se usó, medimos una media de 17924 (mínimo: 5 - máxmo: 3846000) Hz. | |||
| Cinebench R10 | |
| Rendering Multiple CPUs 32Bit | |
| DogHouse Systems Mobius SS | |
| Gigabyte P55 V4 | |
| MSI GS43VR 6RE-006US | |
| Lenovo IdeaPad Y50 | |
| Rendering Single 32Bit | |
| DogHouse Systems Mobius SS | |
| Gigabyte P55 V4 | |
| Lenovo IdeaPad Y50 | |
| MSI GS43VR 6RE-006US | |
| wPrime 2.10 - 1024m | |
| Lenovo IdeaPad Y50 | |
| MSI GS43VR 6RE-006US | |
| Gigabyte P55 V4 | |
| DogHouse Systems Mobius SS | |
| Super Pi Mod 1.5 XS 32M - 32M | |
| MSI GS43VR 6RE-006US | |
| Gigabyte P55 V4 | |
| Lenovo IdeaPad Y50 | |
| DogHouse Systems Mobius SS | |
* ... más pequeño es mejor
| PCMark 8 | |
| Home Score Accelerated v2 | |
| Eurocom Sky DLX7 | |
| MSI GS43VR 6RE-006US | |
| Gigabyte P34W v5 | |
| Razer Blade 14 2015 | |
| Work Score Accelerated v2 | |
| MSI GS43VR 6RE-006US | |
| Gigabyte P34W v5 | |
| Eurocom Sky DLX7 | |
| Razer Blade 14 2015 | |
| Creative Score Accelerated v2 | |
| Eurocom Sky DLX7 | |
| MSI GS43VR 6RE-006US | |
| Gigabyte P34W v5 | |
| Razer Blade 14 2015 | |
| PCMark 8 Home Score Accelerated v2 | 4016 puntos | |
| PCMark 8 Creative Score Accelerated v2 | 4954 puntos | |
| PCMark 8 Work Score Accelerated v2 | 4796 puntos | |
ayuda | ||
| MSI GS43VR 6RE-006US SanDisk SD8SN8U1T001122 | Gigabyte P34W v5 Samsung SSD 950 Pro 512GB m.2 NVMe | MSI GS40-6QE16H11 Samsung MZFLV128 NVMe | Aorus X3 Plus v5 Samsung SM951 MZVPV512HDGL m.2 PCI-e | Razer Blade 14 2015 Lite-On IT L8T-256L9G | |
|---|---|---|---|---|---|
| CrystalDiskMark 3.0 | 338% | 196% | 307% | 66% | |
| Read Seq | 335.3 | 2269 577% | 1332 297% | 1529 356% | 496.6 48% |
| Write Seq | 299 | 1524 410% | 687 130% | 1565 423% | 418.6 40% |
| Read 512 | 223 | 937 320% | 936 320% | 929 317% | 371 66% |
| Write 512 | 246.7 | 1483 501% | 650 163% | 1536 523% | 392.6 59% |
| Read 4k | 17.68 | 53.8 204% | 49.57 180% | 51.7 192% | 31.25 77% |
| Write 4k | 35.31 | 167.3 374% | 138.8 293% | 147.2 317% | 64.4 82% |
| Read 4k QD32 | 247.4 | 622 151% | 559 126% | 636 157% | 357.6 45% |
| Write 4k QD32 | 156.3 | 418.9 168% | 247.3 58% | 421.4 170% | 323.2 107% |

| 3DMark | |
| 1920x1080 Fire Strike Graphics | |
| MSI GT73VR-6RE16SR451 | |
| Asus G701VO-CS74K | |
| MSI GS43VR 6RE-006US | |
| Aorus X5S v5 | |
| Asus Strix GL502VT-DS74 | |
| HP Pavilion 15 UHD T9Y85AV | |
| Fire Strike Extreme Graphics | |
| Asus G701VO-CS74K | |
| MSI GS43VR 6RE-006US | |
| Aorus X5S v5 | |
| Asus Strix GL502VT-DS74 | |
| HP Pavilion 15 UHD T9Y85AV | |
| 3840x2160 Fire Strike Ultra Graphics | |
| MSI GT73VR-6RE16SR451 | |
| Asus G701VO-CS74K | |
| MSI GS43VR 6RE-006US | |
| Aorus X5S v5 | |
| HP Pavilion 15 UHD T9Y85AV | |
| 3DMark 11 | |
| 1280x720 Performance GPU | |
| MSI GT73VR-6RE16SR451 | |
| Asus G701VO-CS74K | |
| MSI GS43VR 6RE-006US | |
| Aorus X5S v5 | |
| Asus Strix GL502VT-DS74 | |
| HP Pavilion 15 UHD T9Y85AV | |
| 1280x720 Performance Combined | |
| MSI GT73VR-6RE16SR451 | |
| Asus G701VO-CS74K | |
| MSI GS43VR 6RE-006US | |
| Asus Strix GL502VT-DS74 | |
| Aorus X5S v5 | |
| HP Pavilion 15 UHD T9Y85AV | |
| 3DMark 11 Performance | 12462 puntos | |
| 3DMark Ice Storm Standard Score | 83301 puntos | |
| 3DMark Cloud Gate Standard Score | 23391 puntos | |
| 3DMark Fire Strike Score | 9814 puntos | |
| 3DMark Fire Strike Extreme Score | 5170 puntos | |
ayuda | ||
| BioShock Infinite - 1920x1080 Ultra Preset, DX11 (DDOF) | |
| Asus G752VS-XB78K | |
| Asus G701VO-CS74K | |
| MSI GS43VR 6RE-006US | |
| Asus Strix GL502VY-DS71 | |
| Asus Strix GL502VT-DS74 | |
| HP Pavilion 15 UHD T9Y85AV | |
| Metro: Last Light - 1920x1080 Very High (DX11) AF:16x | |
| Asus G701VO-CS74K | |
| MSI GS43VR 6RE-006US | |
| Asus Strix GL502VT-DS74 | |
| HP Pavilion 15 UHD T9Y85AV | |
| Thief - 1920x1080 Very High Preset AA:FXAA & High SS AF:8x | |
| Asus G752VS-XB78K | |
| Asus G701VO-CS74K | |
| MSI GS43VR 6RE-006US | |
| Asus Strix GL502VY-DS71 | |
| Asus Strix GL502VT-DS74 | |
| HP Pavilion 15 UHD T9Y85AV | |
| Batman: Arkham Knight - 1920x1080 High / On AA:SM AF:16x | |
| Asus G752VS-XB78K | |
| Asus G701VO-CS74K | |
| MSI GS43VR 6RE-006US | |
| Asus Strix GL502VT-DS74 | |
| HP Pavilion 15 UHD T9Y85AV | |
| Fallout 4 - 1920x1080 Ultra Preset AA:T AF:16x | |
| Asus G701VO-CS74K | |
| MSI GS43VR 6RE-006US | |
| Asus Strix GL502VY-DS71 | |
| Asus Strix GL502VT-DS74 | |
| HP Pavilion 15 UHD T9Y85AV | |
| Rise of the Tomb Raider - 1920x1080 Very High Preset AA:FX AF:16x | |
| Asus G752VS-XB78K | |
| MSI GS43VR 6RE-006US | |
| Asus G701VO-CS74K | |
| Asus Strix GL502VY-DS71 | |
| Asus Strix GL502VT-DS74 | |
| HP Pavilion 15 UHD T9Y85AV | |
| Doom - 1920x1080 Ultra Preset AA:SM | |
| Asus G701VO-CS74K | |
| MSI GS43VR 6RE-006US | |
| Asus Strix GL502VY-DS71 | |
| Overwatch - 1920x1080 Epic (Render Scale 100 %) AA:SM AF:16x | |
| Asus G701VO-CS74K | |
| MSI GS43VR 6RE-006US | |
| Asus Strix GL502VY-DS71 | |
| HP Pavilion 15 UHD T9Y85AV | |
| bajo | medio | alto | ultra | |
| Guild Wars 2 (2012) | 50.1 | |||
| BioShock Infinite (2013) | 102.1 | |||
| Metro: Last Light (2013) | 78.6 | |||
| Thief (2014) | 65.6 | |||
| Batman: Arkham Knight (2015) | 80 | 58 | ||
| Metal Gear Solid V (2015) | 60 | |||
| Fallout 4 (2015) | 68.5 | |||
| Rise of the Tomb Raider (2016) | 66.8 | |||
| Doom (2016) | 77.8 | |||
| Overwatch (2016) | 106.7 |
Ruido
| Ocioso |
| 32 / 32 / 33.5 dB(A) |
| Carga |
| 50 / 51.5 dB(A) |
 | ||
30 dB silencioso 40 dB(A) audible 50 dB(A) ruidosamente alto |
||
min: | ||
| MSI GS43VR 6RE-006US GeForce GTX 1060 Mobile, 6700HQ, SanDisk SD8SN8U1T001122 | Gigabyte P34W v5 GeForce GTX 970M, 6700HQ, Samsung SSD 950 Pro 512GB m.2 NVMe | MSI GS40-6QE16H11 GeForce GTX 970M, 6700HQ, Samsung MZFLV128 NVMe | Aorus X3 Plus v5 GeForce GTX 970M, 6700HQ, Samsung SM951 MZVPV512HDGL m.2 PCI-e | Razer Blade 14 2015 GeForce GTX 970M, 4720HQ, Lite-On IT L8T-256L9G | |
|---|---|---|---|---|---|
| Noise | 2% | -2% | 3% | 5% | |
| off / environment * | 29.1 | ||||
| Idle Minimum * | 32 | 31.6 1% | 33 -3% | 32.1 -0% | 29.7 7% |
| Idle Average * | 32 | 31.6 1% | 34 -6% | 32.4 -1% | 29.9 7% |
| Idle Maximum * | 33.5 | 32.5 3% | 38 -13% | 32.5 3% | 30 10% |
| Load Average * | 50 | 46.5 7% | 44 12% | 40.1 20% | 42.1 16% |
| Load Maximum * | 51.5 | 52.5 -2% | 52 -1% | 54.6 -6% | 59 -15% |
* ... más pequeño es mejor
(-) The maximum temperature on the upper side is 55.6 °C / 132 F, compared to the average of 40.4 °C / 105 F, ranging from 21.2 to 68.8 °C for the class Gaming.
(-) The bottom heats up to a maximum of 62.4 °C / 144 F, compared to the average of 43.2 °C / 110 F
(+) In idle usage, the average temperature for the upper side is 30.5 °C / 87 F, compared to the device average of 33.8 °C / 93 F.
(+) The palmrests and touchpad are reaching skin temperature as a maximum (32.2 °C / 90 F) and are therefore not hot.
(-) The average temperature of the palmrest area of similar devices was 28.9 °C / 84 F (-3.3 °C / -6 F).
MSI GS43VR 6RE-006US audio analysis
(±) | speaker loudness is average but good (76.7 dB)
Bass 100 - 315 Hz
(-) | nearly no bass - on average 17.5% lower than median
(±) | linearity of bass is average (12% delta to prev. frequency)
Mids 400 - 2000 Hz
(+) | balanced mids - only 3.9% away from median
(±) | linearity of mids is average (9.5% delta to prev. frequency)
Highs 2 - 16 kHz
(±) | higher highs - on average 6.4% higher than median
(±) | linearity of highs is average (8.5% delta to prev. frequency)
Overall 100 - 16.000 Hz
(±) | linearity of overall sound is average (28.9% difference to median)
Compared to same class
» 94% of all tested devices in this class were better, 2% similar, 5% worse
» The best had a delta of 6%, average was 18%, worst was 132%
Compared to all devices tested
» 84% of all tested devices were better, 3% similar, 13% worse
» The best had a delta of 4%, average was 25%, worst was 134%
Apple MacBook 12 (Early 2016) 1.1 GHz audio analysis
(+) | speakers can play relatively loud (83.6 dB)
Bass 100 - 315 Hz
(±) | reduced bass - on average 11.3% lower than median
(±) | linearity of bass is average (14.2% delta to prev. frequency)
Mids 400 - 2000 Hz
(+) | balanced mids - only 2.4% away from median
(+) | mids are linear (5.5% delta to prev. frequency)
Highs 2 - 16 kHz
(+) | balanced highs - only 2% away from median
(+) | highs are linear (4.5% delta to prev. frequency)
Overall 100 - 16.000 Hz
(+) | overall sound is linear (10.2% difference to median)
Compared to same class
» 5% of all tested devices in this class were better, 2% similar, 93% worse
» The best had a delta of 5%, average was 19%, worst was 53%
Compared to all devices tested
» 3% of all tested devices were better, 1% similar, 96% worse
» The best had a delta of 4%, average was 25%, worst was 134%
| Off / Standby | |
| Ocioso | |
| Carga |
|
| MSI GS43VR 6RE-006US 6700HQ, GeForce GTX 1060 Mobile, SanDisk SD8SN8U1T001122, IPS, 1920x1080, 14.00 | MSI GT72VR 6RE-015US 6700HQ, GeForce GTX 1070 Mobile, SanDisk SD8SNAT256G1122, IPS, 1920x1080, 17.30 | MSI GS40-6QE16H11 6700HQ, GeForce GTX 970M, Samsung MZFLV128 NVMe, IPS, 1920x1080, 14.00 | Acer Predator 17 G9-792-71EF 6700HQ, GeForce GTX 980M, Samsung SSD PM871 MZNLN512HCJH, IPS, 3840x2160, 17.30 | HP Pavilion 15 UHD T9Y85AV 6700HQ, GeForce GTX 960M, SanDisk Z400s SD8SNAT-128G, IPS, 3840x2160, 15.60 | |
|---|---|---|---|---|---|
| Power Consumption | -51% | 6% | -22% | 25% | |
| Idle Minimum * | 12.1 | 22.3 -84% | 10 17% | 14 -16% | 8.3 31% |
| Idle Average * | 19 | 27.3 -44% | 14 26% | 24 -26% | 14.8 22% |
| Idle Maximum * | 19.5 | 30 -54% | 24 -23% | 32 -64% | 16.8 14% |
| Load Average * | 106.7 | 152.2 -43% | 90 16% | 108 -1% | 71 33% |
| Load Maximum * | 159 | 204.2 -28% | 172 -8% | 164 -3% | 119.2 25% |
* ... más pequeño es mejor
| MSI GS43VR 6RE-006US 6700HQ, GeForce GTX 1060 Mobile, 61 Wh | Gigabyte P34W v5 6700HQ, GeForce GTX 970M, 61 Wh | MSI GS40-6QE16H11 6700HQ, GeForce GTX 970M, 61 Wh | Aorus X3 Plus v5 6700HQ, GeForce GTX 970M, 73 Wh | Razer Blade 14 2015 4720HQ, GeForce GTX 970M, 71 Wh | |
|---|---|---|---|---|---|
| Duración de Batería | -28% | -18% | -10% | -21% | |
| Reader / Idle | 577 | 392 -32% | 313 -46% | 481 -17% | 380 -34% |
| WiFi v1.3 | 261 | 232 -11% | 297 14% | 305 17% | 222 -15% |
| Load | 78 | 47 -40% | 60 -23% | 55 -29% | 66 -15% |
Pro
Contra

Concluimos que el GS40 era un "buen equilibrio entre rendimiento y dimensiones compactas", pero la entrada de Pascal implica que los usuarios ya no tienen que sacrificar tanto rendimiento en un diseño más pequeño. Era de locos pensar que jugar en 1080p60 con ajustes máximos sería posible en un 14" incluso hace un año, y aquí estamos con un portátil que es literalmente la mitad de grande que la anterior generación de portátiles de juego Maxwell con un rendimiento gráfico que supera al de la GTX 980M.
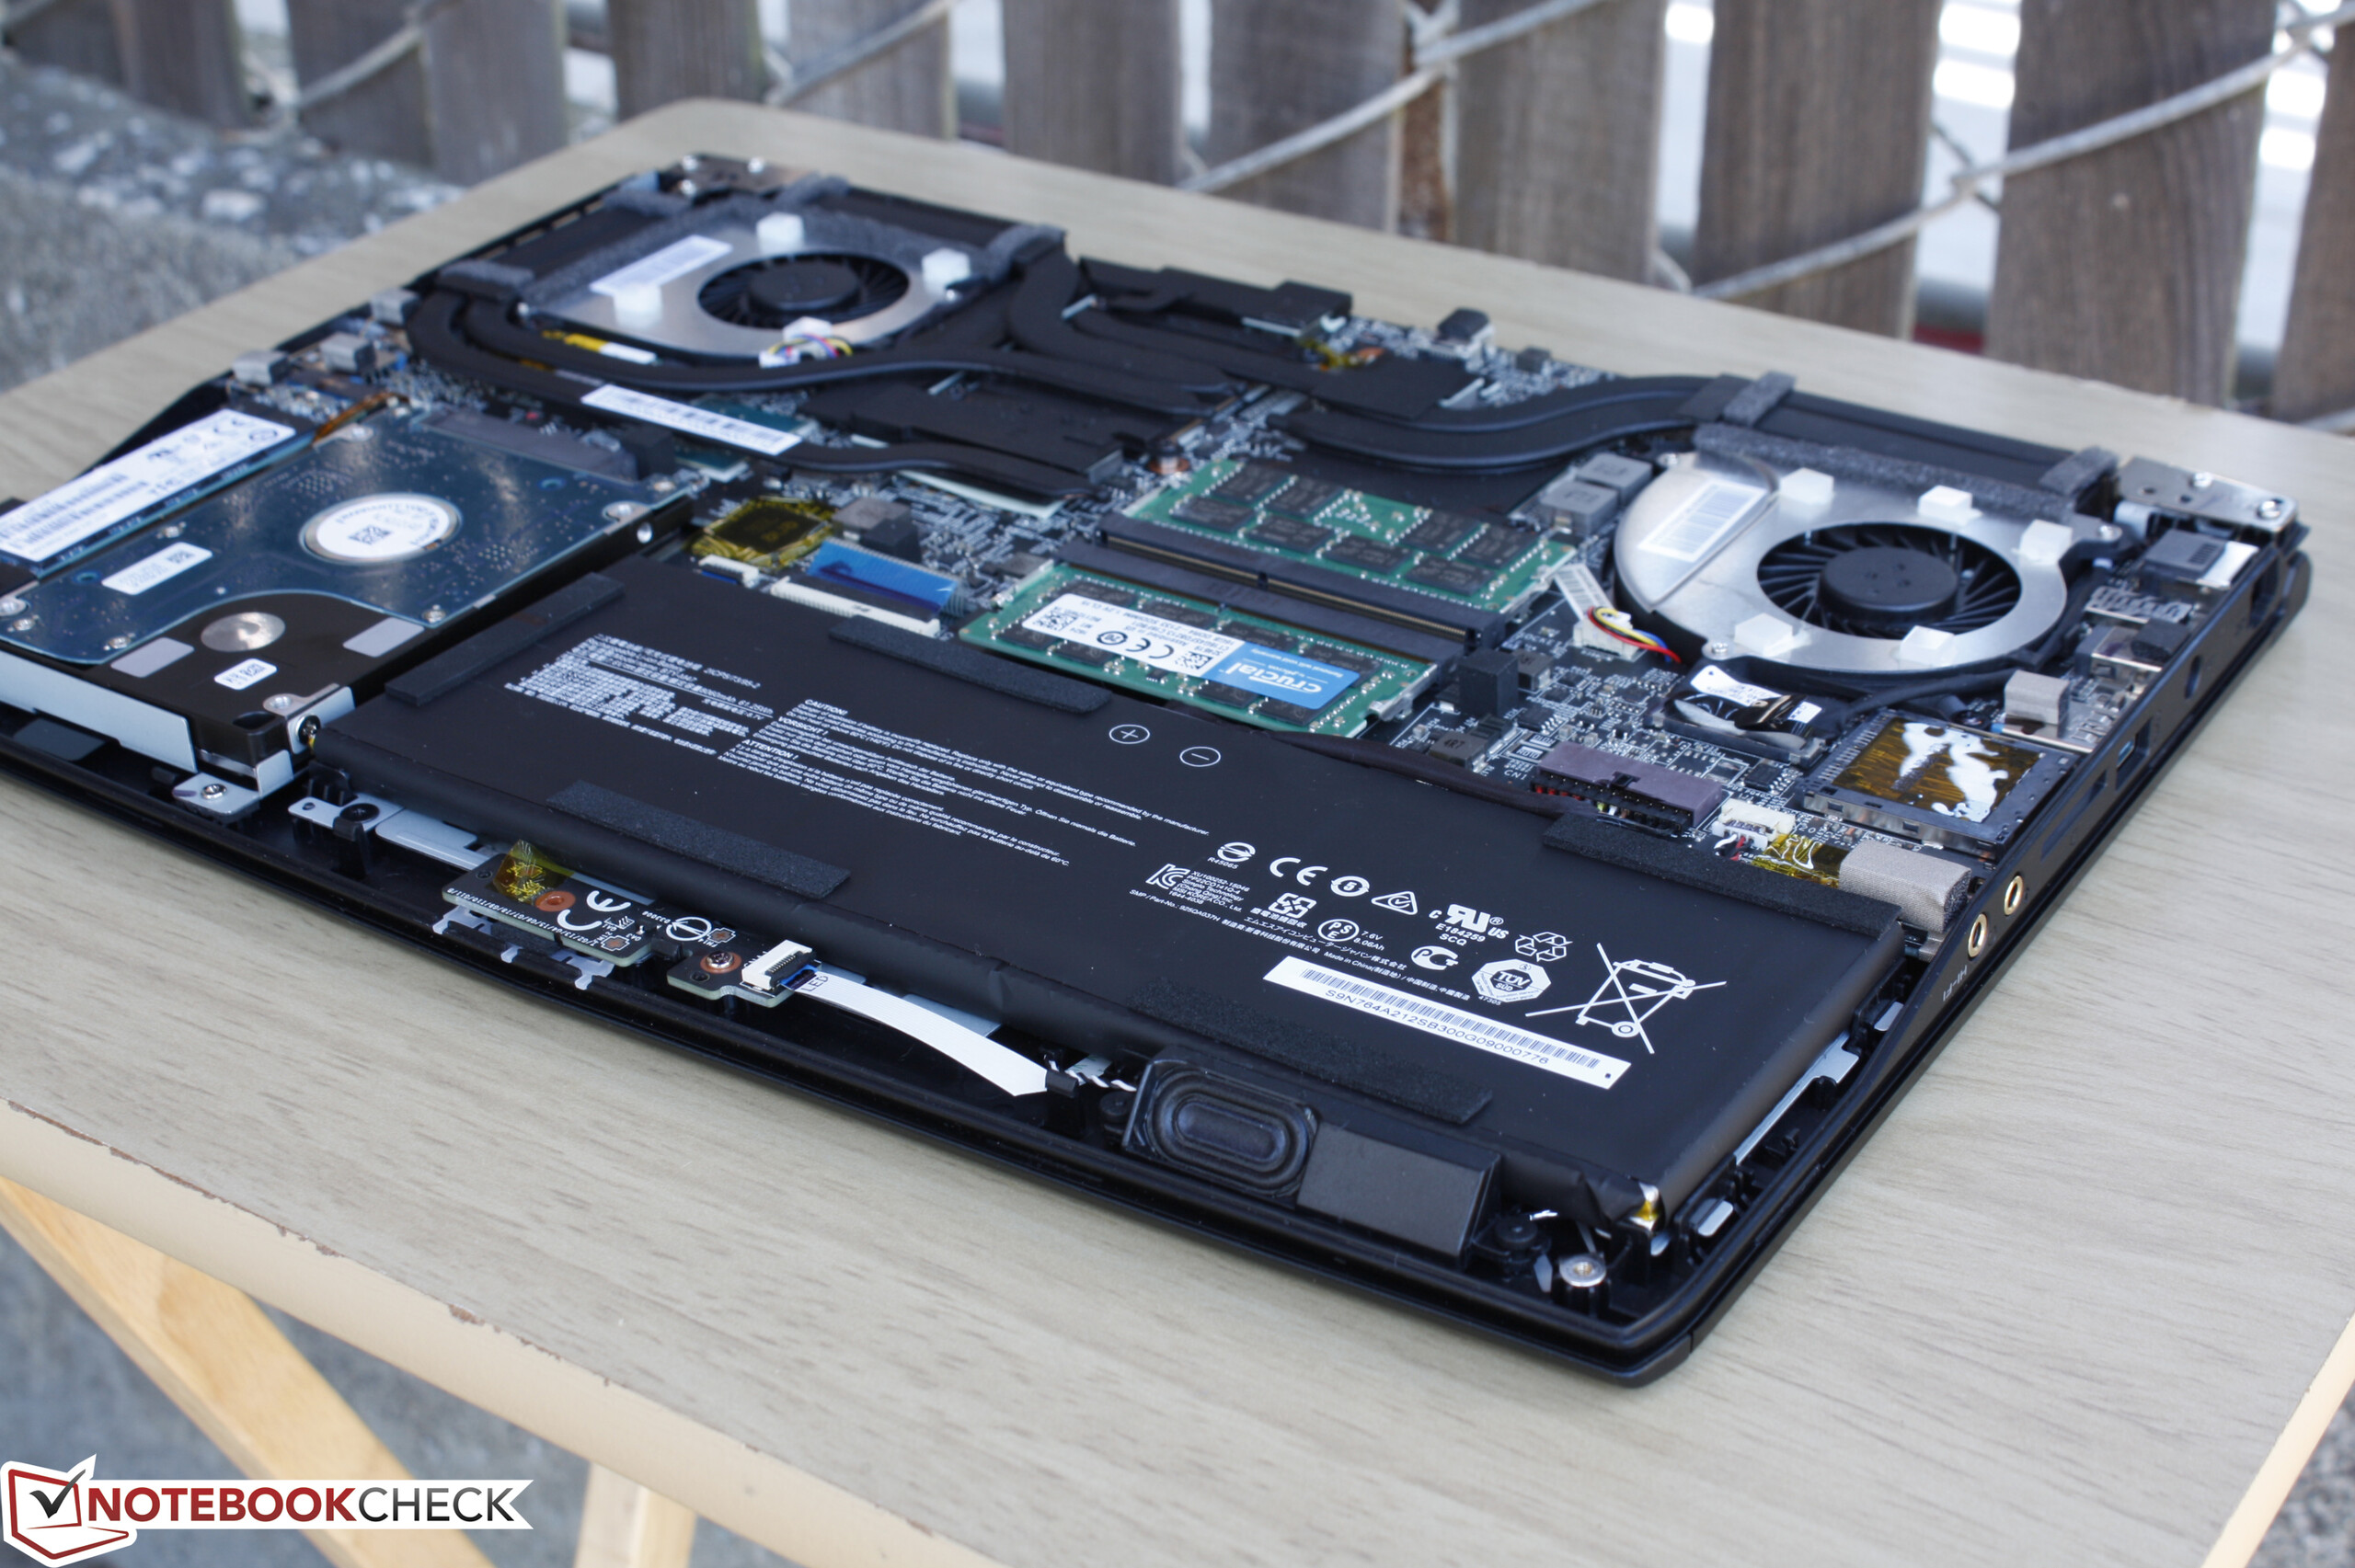
Los defectos siguen siendo los habituales para los diseños pequeños y delgados: Ruido de ventilador, menos características, y mayores temperaturas. En este aspecto, el GS43VR no ofrece mejoras significativas respecto al GS40 ya que no va precisamente más fresco, quedo, o siquiera aguanta más que el modelo saliente. De hecho, nuestras mediciones muestran que el GS43VR es tan ruidoso si no más durante el juego con temperaturas de GPU superando los 80ºC.
Nos gustaría ver un sistema de ventilación revisado para futuras iteraciones de la serie GS de 14". Si bien el teclado es bueno tal cual está, una base más rígida lo haría aún mejor. Nos damos cuenta de que no es posible tener G-Sync con Optimus, pero tener la opción de paneles de más resolución o incluso de soporte para displays G-Sync externos podrían aumentar la versatilidad tanto del sistema en casa como en marcha.
El GS43VR sólo se recomiendao si valoras la portabilidad por encima de todo lo demás. De otro modo, sistemas más grandes y resistentes como GT72VR o GE62VR con la misma GPU son más frescos y quedos y traen más características en el mismo segmento de precios.
Ésta es una versión acortada del análisis original. Puedes leer el análisis completo en inglés aquí.
MSI GS43VR 6RE-006US
-
09/08/2016 v5.1(old)
Allen Ngo
Pricecompare
