 Deutsch
 English
 Español
 Français
 Italiano
 Nederlands
 Polski
 Português
 Русский
 Türkçe
 Svenska
 Chinese
 Magyar
Breve análisis del MSI GS60 6QE Ghost Pro


| |||||||||||||||||||||||||
iluminación: 78 %
Brillo con batería: 212 cd/m²
Contraste: 433:1 (Negro: 0.49 cd/m²)
ΔE Color 7.8 | 0.5-29.43 Ø5
ΔE Greyscale 5.23 | 0.57-98 Ø5.3
80% sRGB (Argyll 1.6.3 3D)
50% AdobeRGB 1998 (Argyll 1.6.3 3D)
54.8% AdobeRGB 1998 (Argyll 2.2.0 3D)
80% sRGB (Argyll 2.2.0 3D)
53.1% Display P3 (Argyll 2.2.0 3D)
Gamma: 3.05
| MSI GS60-6QE4K16H21 Samsung 156FL02-P01 (SDC424B) | MSI GS60 2QE Ghost Pro 4K (2QEUi716SR51G) Samsung SDC4852 | SCHENKER XMG P506 Samsung 156HL01-102 (SDC324C) | Acer Predator 15 G9-591-74ZV LG LP156WF6-SPP1 (LGD04D5) | |
|---|---|---|---|---|
| Display | -6% | 23% | 15% | |
| Display P3 Coverage | 53.1 | 49.93 -6% | 66.4 25% | 66 24% |
| sRGB Coverage | 80 | 75.2 -6% | 96 20% | 85.8 7% |
| AdobeRGB 1998 Coverage | 54.8 | 51.6 -6% | 68.6 25% | 62.7 14% |
| Response Times | 13% | |||
| Response Time Grey 50% / Grey 80% * | 40 ? | 31 ? 22% | ||
| Response Time Black / White * | 26 ? | 25 ? 4% | ||
| PWM Frequency | 1316 ? | |||
| Screen | 20% | 36% | 39% | |
| Brightness middle | 212 | 241 14% | 310 46% | 310 46% |
| Brightness | 197 | 228 16% | 299 52% | 287 46% |
| Brightness Distribution | 78 | 87 12% | 84 8% | 86 10% |
| Black Level * | 0.49 | 0.45 8% | 0.35 29% | 0.36 27% |
| Contrast | 433 | 536 24% | 886 105% | 861 99% |
| Colorchecker dE 2000 * | 7.8 | 3.73 52% | 4.1 47% | 3.83 51% |
| Greyscale dE 2000 * | 5.23 | 3.23 38% | 5.7 -9% | 2.53 52% |
| Gamma | 3.05 72% | 2.3 96% | 2.53 87% | 2.42 91% |
| CCT | 6693 97% | 6610 98% | 7454 87% | 6934 94% |
| Color Space (Percent of AdobeRGB 1998) | 50 | 47 -6% | 63 26% | 56 12% |
| Color Space (Percent of sRGB) | 80 | 96 20% | 86 8% | |
| Media total (Programa/Opciones) | 7% /
13% | 30% /
33% | 22% /
30% |
* ... más pequeño es mejor
Tiempos de respuesta del display
| ↔ Tiempo de respuesta de Negro a Blanco | ||
|---|---|---|
| 26 ms ... subida ↗ y bajada ↘ combinada | ↗ 8 ms subida | 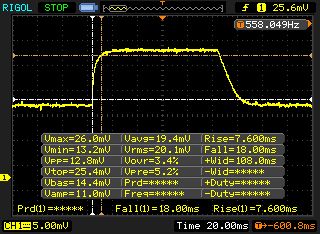 |
| ↘ 18 ms bajada | ||
| La pantalla mostró tiempos de respuesta relativamente lentos en nuestros tests pero podría ser demasiado lenta para los jugones. En comparación, todos los dispositivos de prueba van de ##min### (mínimo) a 240 (máximo) ms. » 57 % de todos los dispositivos son mejores. Eso quiere decir que el tiempo de respuesta es peor que la media (21.5 ms) de todos los dispositivos testados. | ||
| ↔ Tiempo de respuesta 50% Gris a 80% Gris | ||
| 40 ms ... subida ↗ y bajada ↘ combinada | ↗ 12 ms subida | 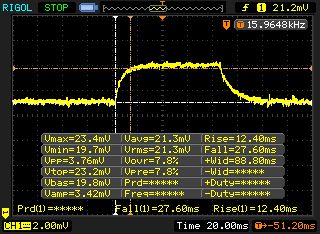 |
| ↘ 28 ms bajada | ||
| La pantalla mostró tiempos de respuesta lentos en nuestros tests y podría ser demasiado lenta para los jugones. En comparación, todos los dispositivos de prueba van de ##min### (mínimo) a 636 (máximo) ms. » 56 % de todos los dispositivos son mejores. Eso quiere decir que el tiempo de respuesta es peor que la media (33.7 ms) de todos los dispositivos testados. | ||
Parpadeo de Pantalla / PWM (Pulse-Width Modulation)
| Parpadeo de Pantalla / PWM detectado | 1316 Hz | ≤ 20 % de brillo | 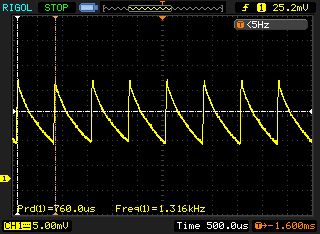 |
La retroiluminación del display parpadea a 1316 Hz (seguramente usa PWM - Pulse-Width Modulation) a un brillo del 20 % e inferior. Sobre este nivel de brillo no debería darse parpadeo / PWM. La frecuencia de 1316 Hz es bastante alta, por lo que la mayoría de gente sensible al parpadeo no debería ver parpadeo o tener fatiga visual. Comparación: 53 % de todos los dispositivos testados no usaron PWM para atenuar el display. Si se usó, medimos una media de 17900 (mínimo: 5 - máxmo: 3846000) Hz. | |||
| PCMark 7 Score | 5941 puntos | |
| PCMark 8 Home Score Accelerated v2 | 3134 puntos | |
ayuda | ||
| PCMark 7 - Score (ordenar por valor) | |
| MSI GS60-6QE4K16H21 | |
| MSI GS60 2QE Ghost Pro 4K (2QEUi716SR51G) | |
| SCHENKER XMG P506 | |
| Acer Predator 15 G9-591-74ZV | |
| HP Pavilion 15-ak003ng | |
| MSI GE62-6QD16H11 | |

| 3DMark 11 Performance | 9536 puntos | |
| 3DMark Ice Storm Standard Score | 75735 puntos | |
| 3DMark Cloud Gate Standard Score | 13453 puntos | |
| 3DMark Fire Strike Score | 5982 puntos | |
ayuda | ||
| 3DMark 11 - 1280x720 Performance (ordenar por valor) | |
| MSI GS60-6QE4K16H21 | |
| MSI GS60 2QE Ghost Pro 4K (2QEUi716SR51G) | |
| Asus G752VT | |
| MSI GE72-6QF8H11 | |
| MSI GS70 6QE-036XPL | |
| SCHENKER XMG P506 | |
| 3DMark - 1920x1080 Fire Strike Score (ordenar por valor) | |
| MSI GS60-6QE4K16H21 | |
| MSI GS60 2QE Ghost Pro 4K (2QEUi716SR51G) | |
| Asus G752VT | |
| MSI GE72-6QF8H11 | |
| MSI GS70 6QE-036XPL | |
| SCHENKER XMG P506 | |
| bajo | medio | alto | ultra | 4K | |
| Watch Dogs (2014) | 92.6 | 81.4 | 49.4 | 34 | |
| Middle-earth: Shadow of Mordor (2014) | 157.7 | 125.4 | 69 | 52.4 | |
| Alien: Isolation (2014) | 217 | 176.2 | 111.3 | 78.1 | |
| Dragon Age: Inquisition (2014) | 148.2 | 123.1 | 55.4 | 37.2 | |
| FIFA 16 (2015) | 240.5 | 211.3 | 176.2 | ||
| Anno 2205 (2015) | 133.4 | 113.6 | 54.7 | 17 | 19.8 |
| Fallout 4 (2015) | 135.2 | 103.4 | 55.5 | 44.6 | 18.6 |
| Star Wars Battlefront (2015) | 191.8 | 141.9 | 70.1 | 60.2 | 19 |
| Rainbow Six Siege (2015) | 228.6 | 150.1 | 82.8 | 62.8 | 25.2 |
| Dragon Age: Inquisition | |
| 1920x1080 High Graphics Quality (ordenar por valor) | |
| MSI GS60-6QE4K16H21 | |
| MSI GS60 2QE Ghost Pro 4K (2QEUi716SR51G) | |
| MSI GS70-2QE16SR51 | |
| 1920x1080 Ultra Graphics Quality AA:2x MS (ordenar por valor) | |
| MSI GS60-6QE4K16H21 | |
| MSI GS60 2QE Ghost Pro 4K (2QEUi716SR51G) | |
| MSI GS70-2QE16SR51 | |
| Watch Dogs | |
| 1920x1080 High Overall Quality, High Textures AA:2x MS (ordenar por valor) | |
| MSI GS60-6QE4K16H21 | |
| MSI GS60 2QE Ghost Pro 4K (2QEUi716SR51G) | |
| SCHENKER XMG P505 | |
| 1920x1080 Ultra Overall Quality, Ultra Textures AA:4x MS (ordenar por valor) | |
| MSI GS60-6QE4K16H21 | |
| MSI GS60 2QE Ghost Pro 4K (2QEUi716SR51G) | |
| SCHENKER XMG P505 | |
| Star Wars Battlefront | |
| 1920x1080 High Preset AA:FX (ordenar por valor) | |
| MSI GS60-6QE4K16H21 | |
| Schenker W504 | |
| 1920x1080 Ultra Preset AA:FX (ordenar por valor) | |
| MSI GS60-6QE4K16H21 | |
| Schenker W504 | |
| Fallout 4 | |
| 1920x1080 High Preset AA:T AF:16x (ordenar por valor) | |
| MSI GS60-6QE4K16H21 | |
| Schenker W504 | |
| 1920x1080 Ultra Preset AA:T AF:16x (ordenar por valor) | |
| MSI GS60-6QE4K16H21 | |
| Schenker W504 | |
Ruido
| Ocioso |
| 35 / 36 / 37 dB(A) |
| Carga |
| 40 / 50 dB(A) |
 | ||
30 dB silencioso 40 dB(A) audible 50 dB(A) ruidosamente alto |
||
min: | ||
| MSI GS60-6QE4K16H21 GeForce GTX 970M, 6700HQ | MSI GS60 2QE Ghost Pro 4K (2QEUi716SR51G) GeForce GTX 970M, 4720HQ | SCHENKER XMG P506 GeForce GTX 970M, 6700HQ | Acer Predator 15 G9-591-74ZV GeForce GTX 980M, 6700HQ | |
|---|---|---|---|---|
| Noise | -1% | 3% | -1% | |
| Idle Minimum * | 35 | 32.6 7% | 30.8 12% | 31 11% |
| Idle Average * | 36 | 34.8 3% | 32.8 9% | 32 11% |
| Idle Maximum * | 37 | 38 -3% | 35.9 3% | 42 -14% |
| Load Average * | 40 | 43.4 -9% | 42.2 -6% | 47 -18% |
| Load Maximum * | 50 | 52 -4% | 51 -2% | 48 4% |
* ... más pequeño es mejor
(-) The maximum temperature on the upper side is 51.4 °C / 125 F, compared to the average of 40.4 °C / 105 F, ranging from 21.2 to 68.8 °C for the class Gaming.
(-) The bottom heats up to a maximum of 68.9 °C / 156 F, compared to the average of 43.2 °C / 110 F
(+) In idle usage, the average temperature for the upper side is 26.3 °C / 79 F, compared to the device average of 33.8 °C / 93 F.
(-) The palmrests and touchpad can get very hot to the touch with a maximum of 41.3 °C / 106.3 F.
(-) The average temperature of the palmrest area of similar devices was 28.9 °C / 84 F (-12.4 °C / -22.3 F).
| MSI GS60-6QE4K16H21 GeForce GTX 970M, 6700HQ | MSI GS60 2QE Ghost Pro 4K (2QEUi716SR51G) GeForce GTX 970M, 4720HQ | SCHENKER XMG P506 GeForce GTX 970M, 6700HQ | Acer Predator 15 G9-591-74ZV GeForce GTX 980M, 6700HQ | |
|---|---|---|---|---|
| Heat | -4% | -2% | 3% | |
| Maximum Upper Side * | 51.4 | 48 7% | 49.3 4% | 49.8 3% |
| Maximum Bottom * | 68.9 | 65.1 6% | 60.4 12% | 59.2 14% |
| Idle Upper Side * | 27.1 | 29.9 -10% | 31.4 -16% | 32.2 -19% |
| Idle Bottom * | 30.4 | 36.1 -19% | 32.3 -6% | 26.9 12% |
* ... más pequeño es mejor
| Off / Standby | |
| Ocioso | |
| Carga |
|
| Battery Runtime - WiFi Websurfing (ordenar por valor) | |
| MSI GS60-6QE4K16H21 | |
| MSI GS40-6QE16H11 | |
| MSI GS70-6QE16H21 | |
| MSI GE72-6QF8H11 | |
Pro
Contra
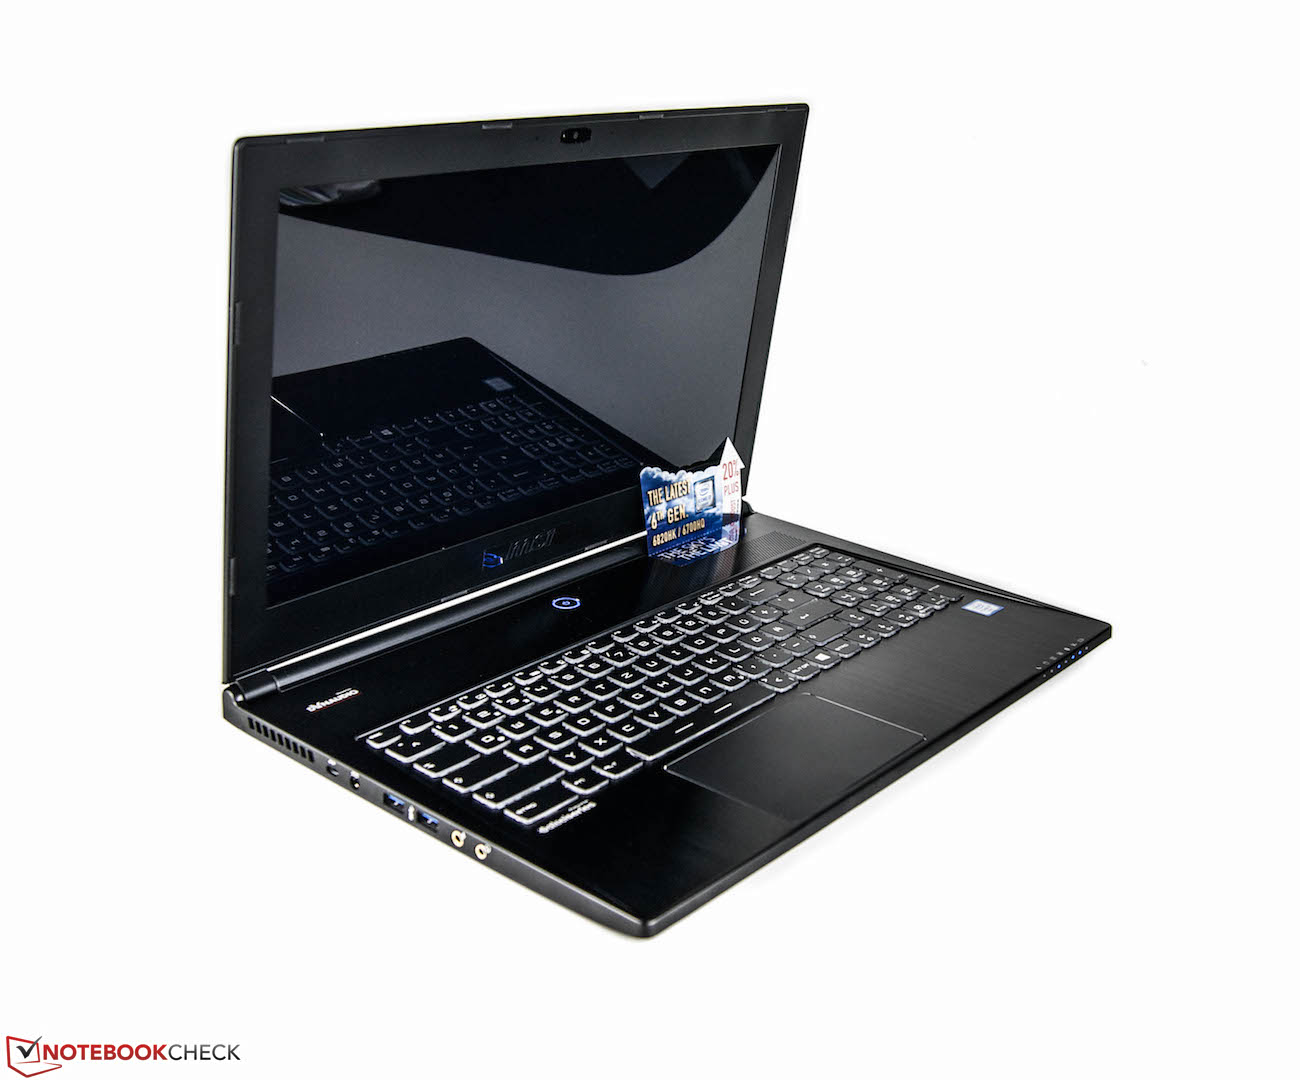
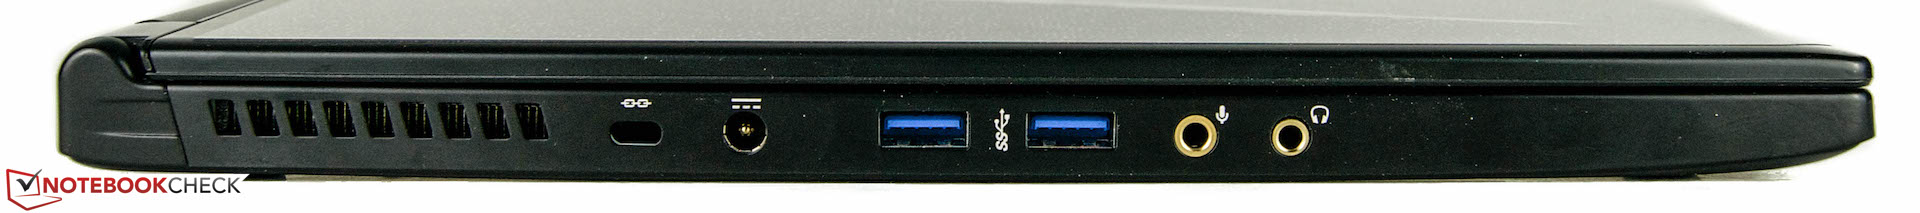
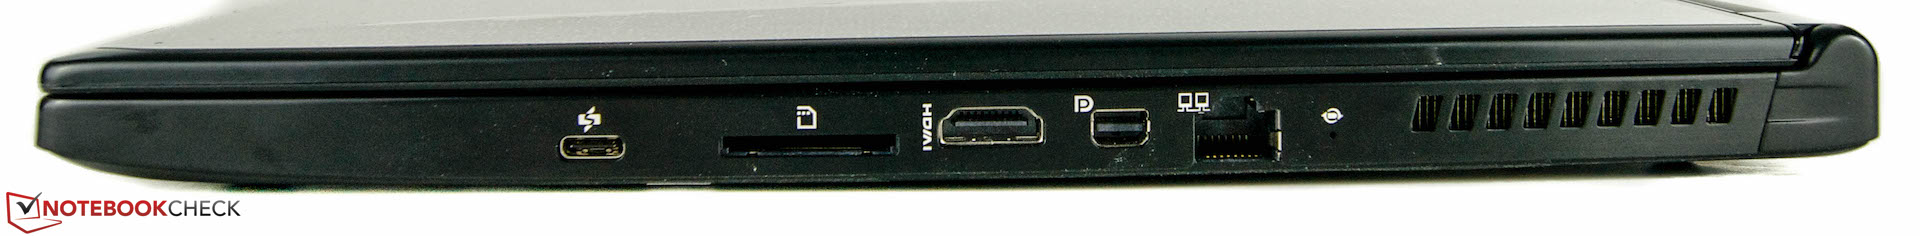
De nuevo, MSI ofrece un portátil de juego delgado y de bonito diseño. Afortunadamente, la versión actual incluye un puerto USB 3.1 port. La segunda nueva característica es la RAM DDR4. Sin embargo, nuestro foco principal fue el procesador Skylake, que logra resultados sólidos en general. No hay, empero, un beneficio real de rendimiento.
Aunque el nuevo modelo no viene con un array RAID-0 de múltiples SSDs, tanto el nuevo procesador como la RAM DDR4 resultan en unas puntuaciones de sistema ligeramente mayores.
Por desgracia, aparte de esas nuevas características no vemos ninguna mejora en los problemas ya conocidos: El display es bastante oscuro y el valor de negro es demasiado elevado, lo que quiere decir que no podemos disfrutar completamente de la resolución 4K.
De nuevo, la versión actual del MSI GS60 es un compañero de juego interesante y potente. Gracias a los sofisticados materiales y al esbelto diseño, siempre puedes transportar el portátil de gama alta.
Esperamos que el fabricante haga algo con estos problemas en futuras iteraciones. Seguimos recomendando dar un vistazo a los rivales. El Acer Predator 15 a 2200 Euros ofrece un aguante de batería inmenso y es hasta más potente. El Schenker XMG P506 también es un competidor digno. También tendrás un buen portátil si aún logras encontrar un modelo económico de la serie Haswell.
Ésta es una versión acortada del análisis original. Puedes leer el análisis completo en inglés aquí.
MSI GS60-6QE4K16H21
-
03/08/2016 v5(old)
Nino Ricchizzi
Pricecompare
