 Deutsch
 English
 Español
 Français
 Italiano
 Nederlands
 Polski
 Português
 Русский
 Türkçe
 Svenska
 Chinese
 Magyar
Breve análisis del MSI GS70 6QE Stealth Pro

| |||||||||||||||||||||||||
iluminación: 85 %
Brillo con batería: 172 cd/m²
Contraste: 662:1 (Negro: 0.26 cd/m²)
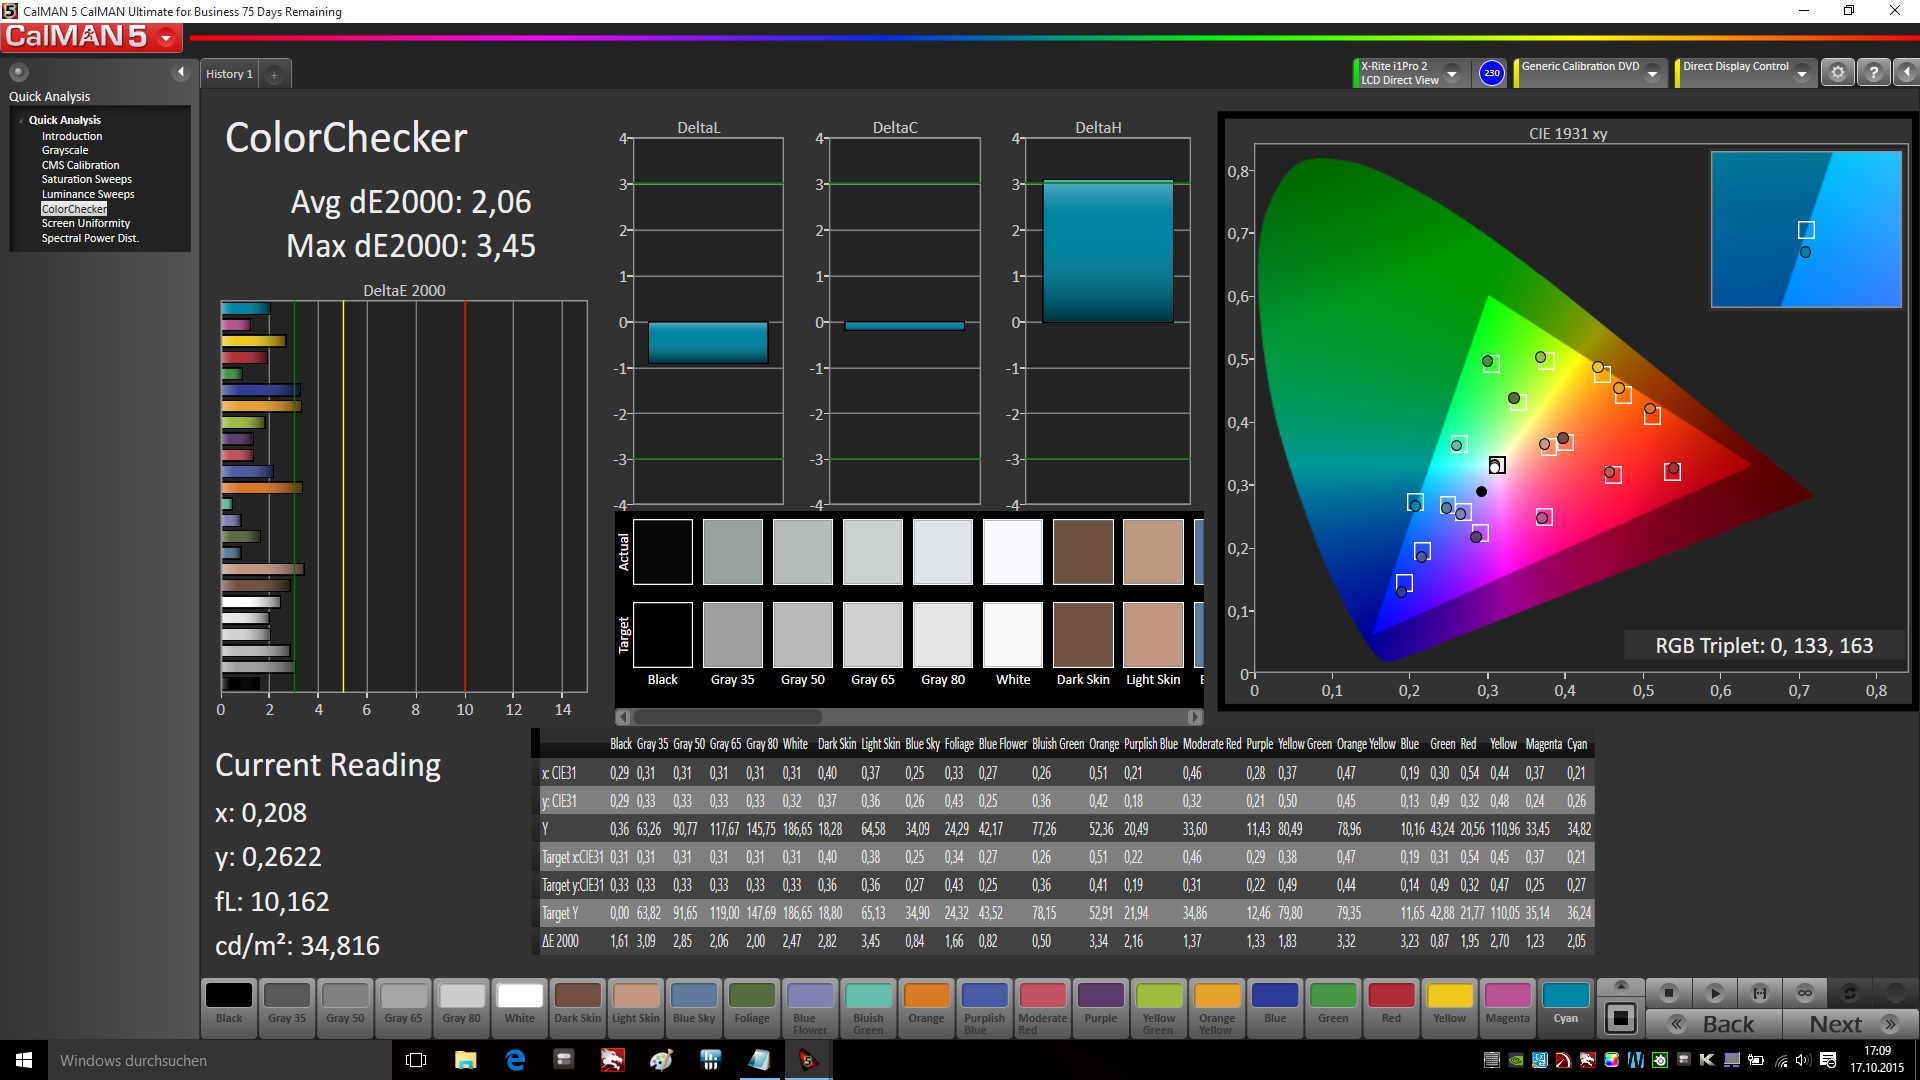
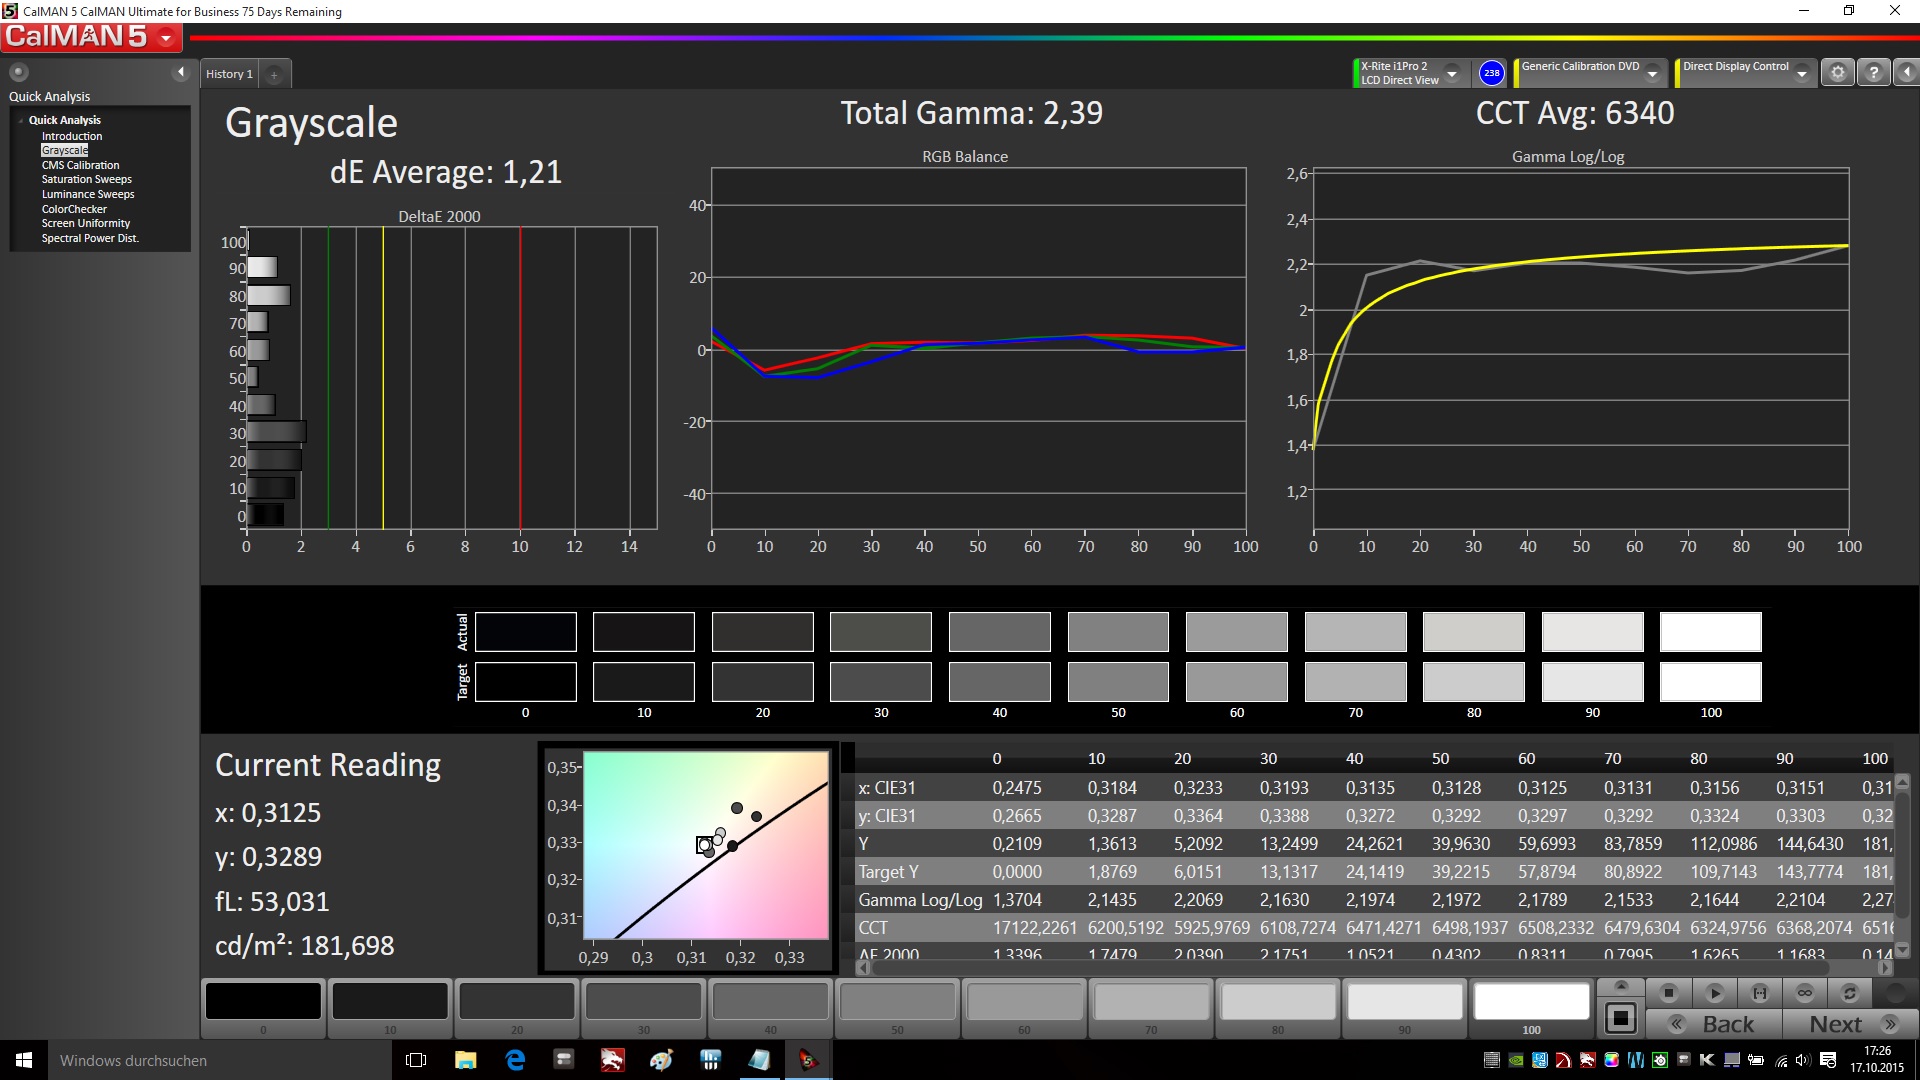
ΔE Color 2.06 | 0.5-29.43 Ø5
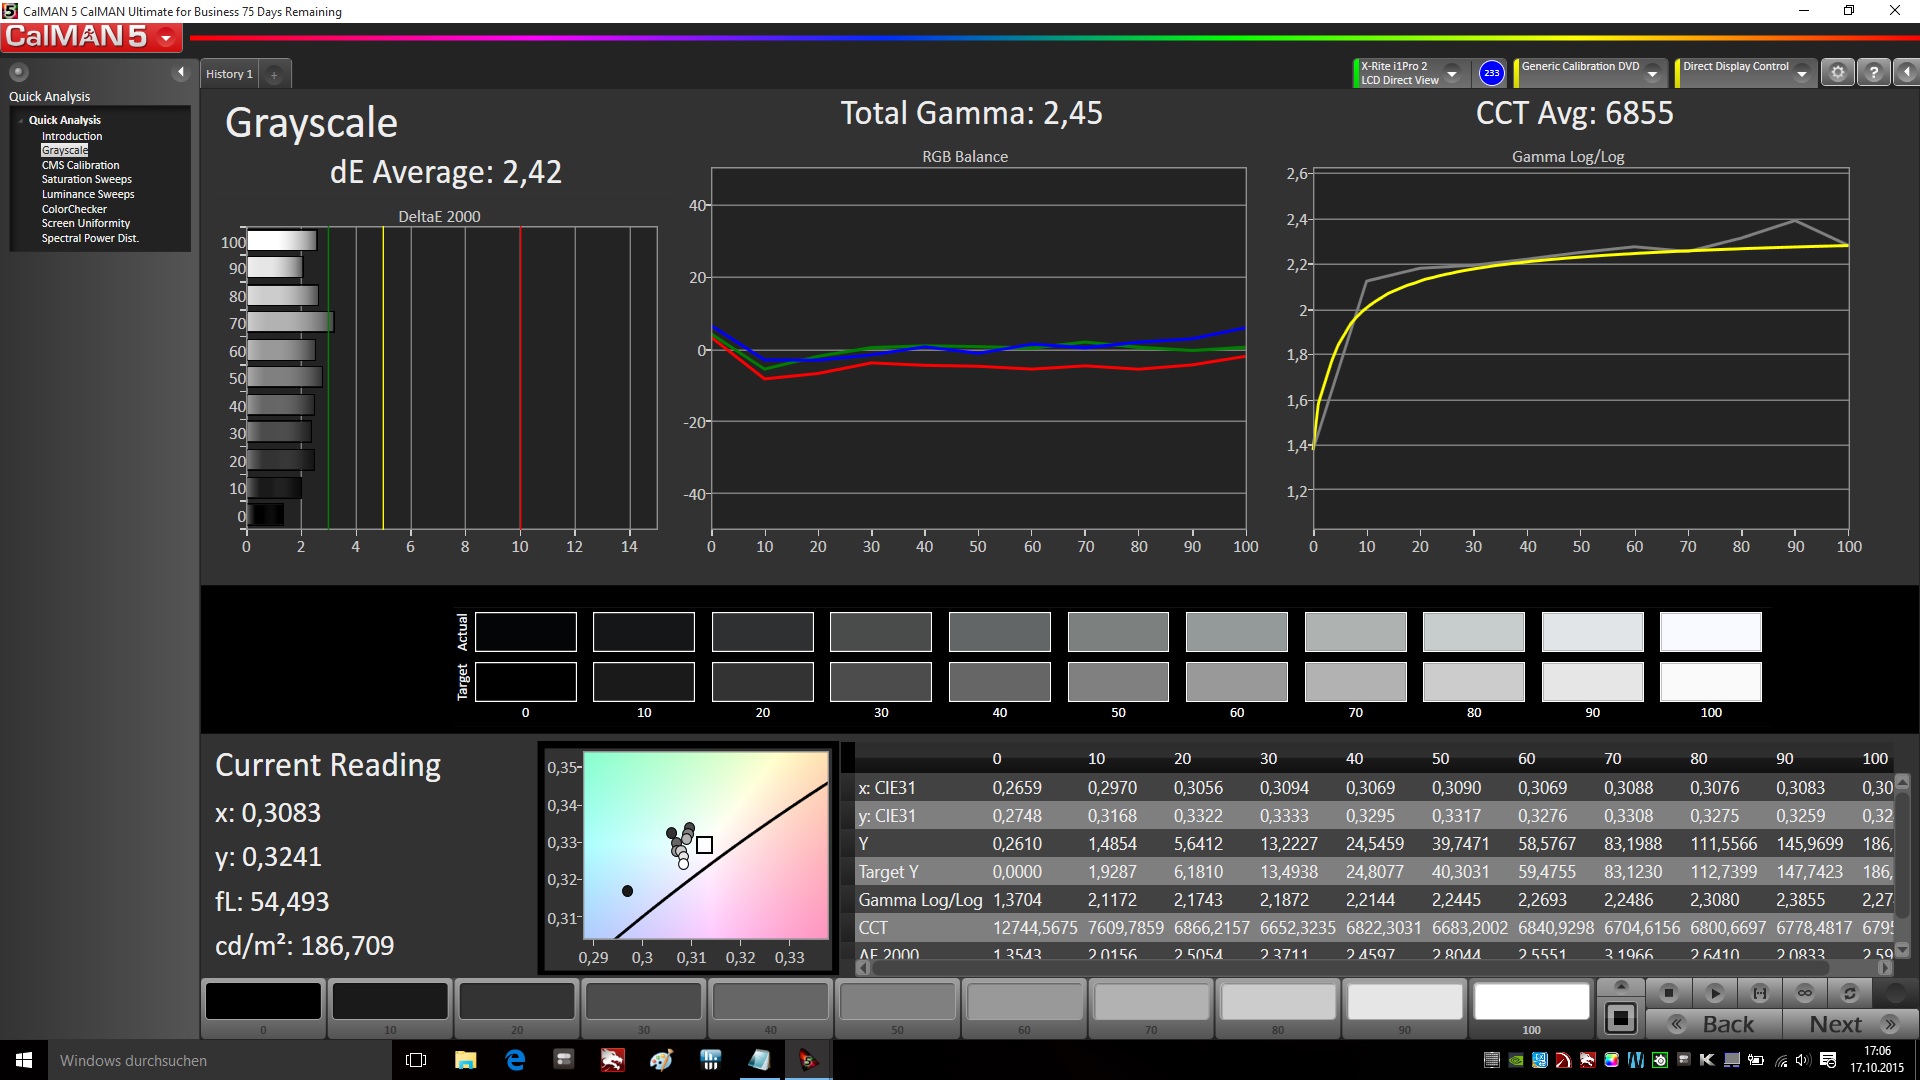
ΔE Greyscale 2.42 | 0.57-98 Ø5.3
97% sRGB (Argyll 1.6.3 3D)
62% AdobeRGB 1998 (Argyll 1.6.3 3D)
67.6% AdobeRGB 1998 (Argyll 2.2.0 3D)
97.3% sRGB (Argyll 2.2.0 3D)
67% Display P3 (Argyll 2.2.0 3D)
Gamma: 2.45

| MSI GS70-6QE16H21 Chi Mei N173HGE-E11 (CMN1735) | MSI GS70-2QE16SR51 CMN N173HGE-E11 | SCHENKER XMG A706 LG Philips LP173WF4-SPD1 | SCHENKER XMG P706 LG LP173WF4-SPD1 | Medion Erazer X7615-MD99293 CMN N173HGE-E11 (CMN1735) | Acer Aspire V Nitro 7-791G-70TW LG Philips LGD0469 ÖP173WF4-SPF1 | |
|---|---|---|---|---|---|---|
| Display | -10% | -8% | -7% | -0% | -3% | |
| Display P3 Coverage | 67 | 61.1 -9% | 66.4 -1% | 66.9 0% | 66.7 0% | 70.1 5% |
| sRGB Coverage | 97.3 | 85 -13% | 83.8 -14% | 84.6 -13% | 95.7 -2% | 87.5 -10% |
| AdobeRGB 1998 Coverage | 67.6 | 62.1 -8% | 61.3 -9% | 61.8 -9% | 68.5 1% | 63.9 -5% |
| Screen | -52% | 0% | -9% | -84% | -32% | |
| Brightness middle | 172 | 251 46% | 344 100% | 306 78% | 263 53% | 347 102% |
| Brightness | 161 | 249 55% | 322 100% | 302 88% | 244 52% | 326 102% |
| Brightness Distribution | 85 | 84 -1% | 88 4% | 90 6% | 83 -2% | 90 6% |
| Black Level * | 0.26 | 0.28 -8% | 0.3 -15% | 0.34 -31% | 0.27 -4% | 0.409 -57% |
| Contrast | 662 | 896 35% | 1147 73% | 900 36% | 974 47% | 848 28% |
| Colorchecker dE 2000 * | 2.06 | 11.19 -443% | 4.8 -133% | 5.49 -167% | 12.24 -494% | 6.81 -231% |
| Greyscale dE 2000 * | 2.42 | 4.57 -89% | 4.91 -103% | 3.97 -64% | 12.17 -403% | 7.27 -200% |
| Gamma | 2.45 90% | 2.38 92% | 2.37 93% | 2.15 102% | 3.55 62% | 2.4 92% |
| CCT | 6855 95% | 14550 45% | 6796 96% | 6163 105% | 15589 42% | 7546 86% |
| Color Space (Percent of AdobeRGB 1998) | 62 | 55 -11% | 55 -11% | 55.5 -10% | 62 0% | 57 -8% |
| Color Space (Percent of sRGB) | 97 | 84 -13% | 84.5 -13% | 96 -1% | ||
| Media total (Programa/Opciones) | -31% /
-41% | -4% /
-2% | -8% /
-8% | -42% /
-63% | -18% /
-24% |
* ... más pequeño es mejor
| Cinebench R15 | |
| CPU Multi 64Bit (ordenar por valor) | |
| MSI GS70-6QE16H21 | |
| MSI GS70-2QE16SR51 | |
| SCHENKER XMG A706 | |
| SCHENKER XMG P706 | |
| Medion Erazer X7615-MD99293 | |
| Acer Aspire V Nitro 7-791G-70TW | |
| CPU Single 64Bit (ordenar por valor) | |
| MSI GS70-6QE16H21 | |
| MSI GS70-2QE16SR51 | |
| SCHENKER XMG A706 | |
| SCHENKER XMG P706 | |
| Medion Erazer X7615-MD99293 | |
| Acer Aspire V Nitro 7-791G-70TW | |
| Cinebench R11.5 | |
| CPU Multi 64Bit (ordenar por valor) | |
| MSI GS70-6QE16H21 | |
| MSI GS70-2QE16SR51 | |
| SCHENKER XMG A706 | |
| SCHENKER XMG P706 | |
| Medion Erazer X7615-MD99293 | |
| Acer Aspire V Nitro 7-791G-70TW | |
| CPU Single 64Bit (ordenar por valor) | |
| MSI GS70-6QE16H21 | |
| MSI GS70-2QE16SR51 | |
| SCHENKER XMG A706 | |
| SCHENKER XMG P706 | |
| Medion Erazer X7615-MD99293 | |
| Acer Aspire V Nitro 7-791G-70TW | |
| Cinebench R10 | |
| Rendering Multiple CPUs 32Bit (ordenar por valor) | |
| MSI GS70-6QE16H21 | |
| SCHENKER XMG A706 | |
| SCHENKER XMG P706 | |
| Acer Aspire V Nitro 7-791G-70TW | |
| Rendering Single 32Bit (ordenar por valor) | |
| MSI GS70-6QE16H21 | |
| SCHENKER XMG A706 | |
| SCHENKER XMG P706 | |
| Acer Aspire V Nitro 7-791G-70TW | |
| Geekbench 3 | |
| 32 Bit Single-Core Score (ordenar por valor) | |
| MSI GS70-6QE16H21 | |
| SCHENKER XMG A706 | |
| SCHENKER XMG P706 | |
| 32 Bit Multi-Core Score (ordenar por valor) | |
| MSI GS70-6QE16H21 | |
| SCHENKER XMG A706 | |
| SCHENKER XMG P706 | |
| Sunspider - 1.0 Total Score (ordenar por valor) | |
| MSI GS70-6QE16H21 | |
| MSI GS70-2QE16SR51 | |
| SCHENKER XMG A706 | |
| SCHENKER XMG P706 | |
| Acer Aspire V Nitro 7-791G-70TW | |
| Mozilla Kraken 1.1 - Total (ordenar por valor) | |
| MSI GS70-6QE16H21 | |
| MSI GS70-2QE16SR51 | |
| SCHENKER XMG A706 | |
| SCHENKER XMG P706 | |
| Octane V2 - Total Score (ordenar por valor) | |
| MSI GS70-6QE16H21 | |
| MSI GS70-2QE16SR51 | |
| SCHENKER XMG A706 | |
| SCHENKER XMG P706 | |
| Peacekeeper - --- (ordenar por valor) | |
| MSI GS70-6QE16H21 | |
| SCHENKER XMG A706 | |
| SCHENKER XMG P706 | |
* ... más pequeño es mejor
| PCMark 7 Score | 5912 puntos | |
| PCMark 8 Home Score Accelerated v2 | 4002 puntos | |
| PCMark 8 Creative Score Accelerated v2 | 4873 puntos | |
| PCMark 8 Work Score Accelerated v2 | 5043 puntos | |
ayuda | ||
| PCMark 7 - Score (ordenar por valor) | |
| MSI GS70-6QE16H21 | |
| MSI GS70-2QE16SR51 | |
| SCHENKER XMG A706 | |
| SCHENKER XMG P706 | |
| Medion Erazer X7615-MD99293 | |
| Acer Aspire V Nitro 7-791G-70TW | |
| PCMark 8 - Home Score Accelerated v2 (ordenar por valor) | |
| MSI GS70-6QE16H21 | |
| MSI GS70-2QE16SR51 | |
| SCHENKER XMG A706 | |
| SCHENKER XMG P706 | |

| MSI GS70-6QE16H21 Toshiba HG6 THNSNJ256G8NU | MSI GS70-2QE16SR51 Toshiba HG6 THNSNJ256GMCU | SCHENKER XMG A706 Samsung SSD 850 EVO M.2 250 GB | SCHENKER XMG P706 Samsung SM951 MZHPV512HDGL m.2 PCI-e | Medion Erazer X7615-MD99293 Samsung SSD PM851 128 GB MZMTE128HMGR | Acer Aspire V Nitro 7-791G-70TW Kingston RBU-SNS8100S3256GD | |
|---|---|---|---|---|---|---|
| AS SSD | 147% | 108% | 291% | 37% | 51% | |
| Seq Read | 501 | 1024 104% | 504 1% | 1863 272% | 479.3 -4% | 474.2 -5% |
| Seq Write | 109.7 | 643 486% | 469.7 328% | 1273 1060% | 132.9 21% | 320.3 192% |
| 4K Read | 20.85 | 21 1% | 35.54 70% | 39.93 92% | 32.6 56% | 28.33 36% |
| 4K Write | 55 | 72 31% | 77.7 41% | 95.3 73% | 90.7 65% | 61.7 12% |
| 4K-64 Read | 329.5 | 605 84% | 337 2% | 889 170% | 325.7 -1% | 192.3 -42% |
| 4K-64 Write | 60.4 | 314 420% | 267 342% | 392.1 549% | 99.4 65% | 151.5 151% |
| Access Time Read * | 0.139 | 0.12 14% | 0.087 37% | 0.05 64% | 0.076 45% | 0.089 36% |
| Access Time Write * | 0.075 | 0.05 33% | 0.046 39% | 0.042 44% | 0.04 47% | 0.055 27% |
* ... más pequeño es mejor
| 3DMark 06 Standard Score | 25361 puntos | |
| 3DMark 11 Performance | 9421 puntos | |
| 3DMark Ice Storm Standard Score | 74841 puntos | |
| 3DMark Cloud Gate Standard Score | 20408 puntos | |
| 3DMark Fire Strike Score | 6555 puntos | |
ayuda | ||
| 3DMark 11 - 1280x720 Performance (ordenar por valor) | |
| MSI GS70-6QE16H21 | |
| MSI GS70-2QE16SR51 | |
| SCHENKER XMG A706 | |
| SCHENKER XMG P706 | |
| Medion Erazer X7615-MD99293 | |
| Acer Aspire V Nitro 7-791G-70TW | |
| 3DMark | |
| 1280x720 Ice Storm Standard Score (ordenar por valor) | |
| MSI GS70-6QE16H21 | |
| MSI GS70-2QE16SR51 | |
| SCHENKER XMG A706 | |
| Medion Erazer X7615-MD99293 | |
| Acer Aspire V Nitro 7-791G-70TW | |
| 1280x720 Cloud Gate Standard Score (ordenar por valor) | |
| MSI GS70-6QE16H21 | |
| MSI GS70-2QE16SR51 | |
| SCHENKER XMG A706 | |
| Medion Erazer X7615-MD99293 | |
| Acer Aspire V Nitro 7-791G-70TW | |
| 1920x1080 Fire Strike Score (ordenar por valor) | |
| MSI GS70-6QE16H21 | |
| MSI GS70-2QE16SR51 | |
| SCHENKER XMG A706 | |
| SCHENKER XMG P706 | |
| Medion Erazer X7615-MD99293 | |
| Acer Aspire V Nitro 7-791G-70TW | |
| bajo | medio | alto | ultra | |
| Tomb Raider (2013) | 273.4 | 189 | 86.7 | |
| Thief (2014) | 80 | 76.1 | 47.8 | |
| GRID: Autosport (2014) | 123.9 | 99.3 | 78.4 | |
| The Witcher 3 (2015) | 83 | 46.7 | 25.4 | |
| Batman: Arkham Knight (2015) | 99 | 52 | 51 | |
| Metal Gear Solid V (2015) | 60 | 60 | 60 | |
| Mad Max (2015) | 160.2 | 81.6 | 75.3 | |
| World of Warships (2015) | 112.5 | 93.6 | 81 |
| Tomb Raider - 1920x1080 Ultra Preset AA:FX AF:16x (ordenar por valor) | |
| MSI GS70-6QE16H21 | |
| MSI GS70-2QE16SR51 | |
| SCHENKER XMG A706 | |
| SCHENKER XMG P706 | |
| Acer Aspire V Nitro 7-791G-70TW | |
| Thief - 1920x1080 Very High Preset AA:FXAA & High SS AF:8x (ordenar por valor) | |
| MSI GS70-6QE16H21 | |
| MSI GS70-2QE16SR51 | |
| SCHENKER XMG A706 | |
| SCHENKER XMG P706 | |
| GRID: Autosport - 1920x1080 Ultra Preset AA:4x MS (ordenar por valor) | |
| MSI GS70-6QE16H21 | |
| SCHENKER XMG A706 | |
| Medion Erazer X7615-MD99293 | |
| Acer Aspire V Nitro 7-791G-70TW | |
| The Witcher 3 - 1920x1080 High Graphics & Postprocessing (Nvidia HairWorks Off) (ordenar por valor) | |
| MSI GS70-6QE16H21 | |
| Medion Erazer X7615-MD99293 | |
| Batman: Arkham Knight - 1920x1080 High / On AA:SM AF:16x (ordenar por valor) | |
| MSI GS70-6QE16H21 | |
| SCHENKER XMG A706 | |
| Medion Erazer X7615-MD99293 | |
| Metal Gear Solid V - 1920x1080 Extra High / On (ordenar por valor) | |
| MSI GS70-6QE16H21 | |
| SCHENKER XMG A706 | |
| Mad Max - 1920x1080 Very High Preset AF:12x (ordenar por valor) | |
| MSI GS70-6QE16H21 | |
| SCHENKER XMG A706 | |
| World of Warships - 1920x1080 Very High Preset AA:High FX AF:16x (ordenar por valor) | |
| MSI GS70-6QE16H21 | |
| SCHENKER XMG A706 | |
| SCHENKER XMG P706 | |
Ruido
| Ocioso |
| 30.8 / 31.2 / 36.6 dB(A) |
| HDD |
| 31 dB(A) |
| Carga |
| 41.8 / 53 dB(A) |
 | ||
30 dB silencioso 40 dB(A) audible 50 dB(A) ruidosamente alto |
||
min: | ||
| MSI GS70-6QE16H21 6700HQ, GeForce GTX 970M | MSI GS70-2QE16SR51 4720HQ, GeForce GTX 970M | SCHENKER XMG A706 6700HQ, GeForce GTX 960M | SCHENKER XMG P706 6820HK, GeForce GTX 980M | Medion Erazer X7615-MD99293 4720HQ, GeForce GTX 965M | Acer Aspire V Nitro 7-791G-70TW 4720HQ, GeForce GTX 960M | |
|---|---|---|---|---|---|---|
| Noise | -6% | 6% | 6% | -5% | 0% | |
| Idle Minimum * | 30.8 | 29.6 4% | 29.2 5% | 30.9 -0% | 29.5 4% | 29.6 4% |
| Idle Average * | 31.2 | 34.4 -10% | 30.4 3% | 31.2 -0% | 31 1% | 32.1 -3% |
| Idle Maximum * | 36.6 | 39.4 -8% | 37.3 -2% | 31.2 15% | 40.8 -11% | 35.4 3% |
| Load Average * | 41.8 | 47.2 -13% | 39.8 5% | 40.5 3% | 47.6 -14% | 47.3 -13% |
| Load Maximum * | 53 | 55.8 -5% | 42.2 20% | 47 11% | 54.4 -3% | 48.1 9% |
* ... más pequeño es mejor
(-) The maximum temperature on the upper side is 53.8 °C / 129 F, compared to the average of 40.4 °C / 105 F, ranging from 21.2 to 68.8 °C for the class Gaming.
(-) The bottom heats up to a maximum of 65.4 °C / 150 F, compared to the average of 43.2 °C / 110 F
(±) In idle usage, the average temperature for the upper side is 32.9 °C / 91 F, compared to the device average of 33.8 °C / 93 F.
(-) The palmrests and touchpad can get very hot to the touch with a maximum of 45.1 °C / 113.2 F.
(-) The average temperature of the palmrest area of similar devices was 28.9 °C / 84 F (-16.2 °C / -29.2 F).
| MSI GS70-6QE16H21 6700HQ, GeForce GTX 970M | MSI GS70-2QE16SR51 4720HQ, GeForce GTX 970M | SCHENKER XMG A706 6700HQ, GeForce GTX 960M | SCHENKER XMG P706 6820HK, GeForce GTX 980M | Medion Erazer X7615-MD99293 4720HQ, GeForce GTX 965M | Acer Aspire V Nitro 7-791G-70TW 4720HQ, GeForce GTX 960M | |
|---|---|---|---|---|---|---|
| Heat | -6% | 2% | 21% | -3% | 14% | |
| Maximum Upper Side * | 53.8 | 56.3 -5% | 53.7 -0% | 44 18% | 58.8 -9% | 49.6 8% |
| Maximum Bottom * | 65.4 | 68.6 -5% | 61.1 7% | 42.3 35% | 69.2 -6% | 51.7 21% |
| Idle Upper Side * | 36.3 | 37.9 -4% | 37.5 -3% | 31.7 13% | 35.2 3% | 29.5 19% |
| Idle Bottom * | 36.3 | 39.8 -10% | 35.5 2% | 29.9 18% | 36.5 -1% | 33 9% |
* ... más pequeño es mejor
| Off / Standby | |
| Ocioso | |
| Carga |
|
| MSI GS70-6QE16H21 6700HQ, GeForce GTX 970M | MSI GS70-2QE16SR51 4720HQ, GeForce GTX 970M | SCHENKER XMG A706 6700HQ, GeForce GTX 960M | SCHENKER XMG P706 6820HK, GeForce GTX 980M | Medion Erazer X7615-MD99293 4720HQ, GeForce GTX 965M | Acer Aspire V Nitro 7-791G-70TW 4720HQ, GeForce GTX 960M | |
|---|---|---|---|---|---|---|
| Power Consumption | -3% | 36% | 6% | 14% | 36% | |
| Idle Minimum * | 16.5 | 15.7 5% | 5.4 67% | 12 27% | 9 45% | 5.8 65% |
| Idle Average * | 23.1 | 21.7 6% | 11 52% | 17.9 23% | 15.2 34% | 13.1 43% |
| Idle Maximum * | 26.1 | 26.3 -1% | 16.5 37% | 19.3 26% | 26.6 -2% | 14.5 44% |
| Load Average * | 95.8 | 108.7 -13% | 77.8 19% | 97.7 -2% | 99 -3% | 98 -2% |
| Load Maximum * | 146.4 | 166.9 -14% | 137.7 6% | 213 -45% | 155.8 -6% | 104.9 28% |
* ... más pequeño es mejor
| MSI GS70-6QE16H21 56 Wh | MSI GS70-2QE16SR51 60 Wh | SCHENKER XMG A706 62 Wh | SCHENKER XMG P706 60 Wh | Medion Erazer X7615-MD99293 56 Wh | Acer Aspire V Nitro 7-791G-70TW 53 Wh | |
|---|---|---|---|---|---|---|
| Duración de Batería | 25% | 111% | 36% | 15% | 13% | |
| Reader / Idle | 238 | 308 29% | 709 198% | 297 25% | 339 42% | |
| H.264 | 154 | 234 52% | 281 82% | 220 43% | ||
| WiFi v1.3 | 180 | 327 82% | 220 22% | 198 10% | 204 13% | |
| Load | 64 | 61 -5% | 116 81% | 97 52% | 59 -8% | |
| WiFi | 211 |
Pro
Contra
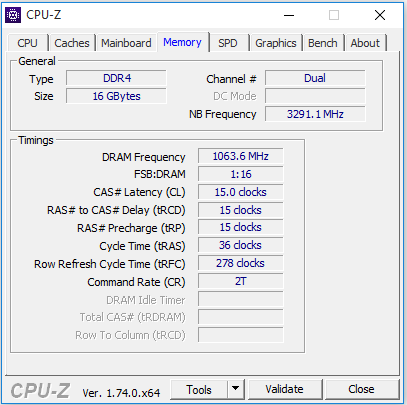
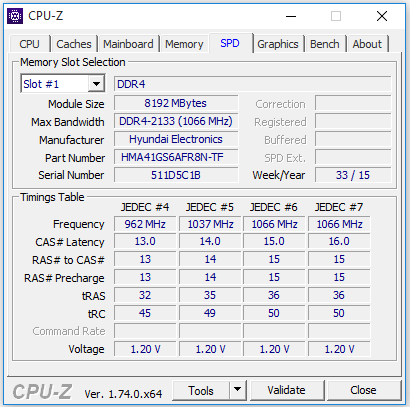
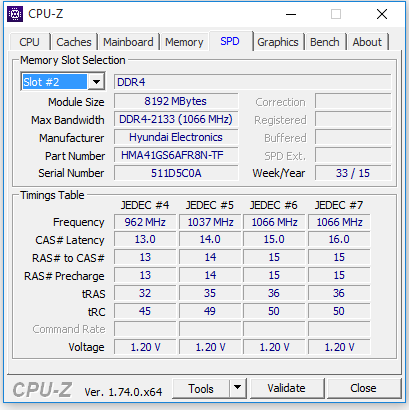
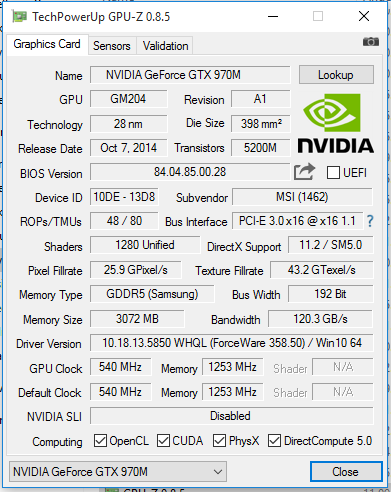
El MSI GS70 ofrece un potente procesador y una GPU de alto rendimiento. Juntos, esos componentes hardware convierten el ordenador en un portátil de juego que puede vérselas con cualquier título del mercado actual. Toda la tecnología está contenida en una carcasa delgada. No es sorprendente, pues, que el portátil no sea uno de los modelos más silenciosos - el hardware tiene que ventilarse adecuadamente. Un SSD se asegura de que el sistema vaya rápido. La unidad se puede reemplazar por un modelo bastante más rápido, ya que la ranura M.2 del ordenador se conecta por PCI Express x4. Para dar al usuario mucho espacio de almacenamiento, MSI también instaló un HDD de 2.5".
El display del portátil es un panel TN que mantiene el contenido del display sin distorsión desde una serie razonablemente amplia de ángulos de visión. En lo tocante a paneles TN, es uno de los mejores modelos; normalmente no vemos ángulos tan amplios en este tipo de display. El contraste del panel es aceptable, pero su brillo máximo es muy bajo. La culpa de esto último la tiene el perfil de color preinstalado.
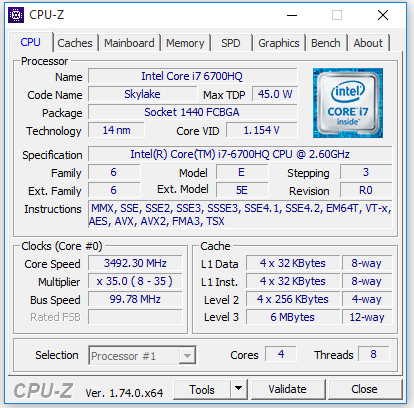
Por último, querríamos dar un rápido vistazo al procesador Skylake. Comparado con su predecesor Haswell, sólo ofrece un aumento mínimo de rendimiento de CPU (menos del 5%). Es más notable el menor consumo de energía del Skylake GS70 bajo carga. A resultas, los ventiladores no tienen que girar tan rápido. Sorprendentemente, los valores de uso de energía en inactivo no son inferiores. De hecho, la duración del batería del nuevo GS70 es definitivamente peor, lo que también prueba que el ordenador requiere más energía que su hermano Haswell en nuestros tests de duración de batería. Las diferencias en la duración de la batería no se explican por completo por la menor capacidad de la batería del Skylake GS70 (56 Wh vs. 60 Wh).
Con todo, el procesador Skylake del nuevo GS70 ofrece algunas ventajas, si bien también crea algunos defectos. Pero en el reino de los portátiles de juego las mejoras de ergonomía tienen más peso que un declive de duración de batería. Como los valores de consumo de energía y niveles de ruido del Skylake GS70 son ambos más reducidos, el nuevo ordenador dejará a algunos clientes con los nervios más tranquilos... y una cartera más ligera.
Ésta es una versión acortada del análisis original. Puedes leer el análisis completo en inglés aquí.
MSI GS70-6QE16H21
-
03/08/2016 v5(old)
Sascha Mölck