 Deutsch
 English
 Español
 Français
 Italiano
 Nederlands
 Polski
 Português
 Русский
 Türkçe
 Svenska
 Chinese
 Magyar
Breve análisis del MSI GS73VR 7RF (7700HQ, GTX 1060, 4K)
| SD Card Reader | |
| average JPG Copy Test (av. of 3 runs) | |
| Aorus X7 v6 | |
| Gigabyte Aero 15 | |
| Asus Strix GL702VSK | |
| MSI GS73VR 7RF | |
| MSI GS73VR 6RF | |
| Acer Aspire V17 Nitro BE VN7-793G-52XN | |
| maximum AS SSD Seq Read Test (1GB) | |
| Gigabyte Aero 15 | |
| Aorus X7 v6 | |
| Asus Strix GL702VSK | |
| MSI GS73VR 6RF | |
| MSI GS73VR 7RF | |
| Acer Aspire V17 Nitro BE VN7-793G-52XN | |
| Networking | |
| iperf3 transmit AX12 | |
| Acer Aspire V17 Nitro BE VN7-793G-52XN | |
| MSI GS73VR 7RF | |
| Aorus X7 v6 | |
| Asus Strix GL702VSK | |
| Gigabyte Aero 15 | |
| iperf3 receive AX12 | |
| Gigabyte Aero 15 | |
| Asus Strix GL702VSK | |
| MSI GS73VR 7RF | |
| Acer Aspire V17 Nitro BE VN7-793G-52XN | |
| Aorus X7 v6 | |
| |||||||||||||||||||||||||
iluminación: 86 %
Brillo con batería: 371.1 cd/m²
Contraste: 884:1 (Negro: 0.42 cd/m²)
ΔE Color 4.5 | 0.5-29.43 Ø5
ΔE Greyscale 3.1 | 0.57-98 Ø5.3
97% sRGB (Argyll 1.6.3 3D)
61% AdobeRGB 1998 (Argyll 1.6.3 3D)
66.4% AdobeRGB 1998 (Argyll 2.2.0 3D)
96.8% sRGB (Argyll 2.2.0 3D)
64.2% Display P3 (Argyll 2.2.0 3D)
Gamma: 2.17
| MSI GS73VR 7RF AU Optronics AUO109B, IPS, 17.30, 3840x2160 | MSI GS73VR 6RF TN LED, 17.30, 1920x1080 | Asus Strix GL702VSK AU Optronics AUO119D, IPS, 17.30, 1920x1080 | Acer Aspire V17 Nitro BE VN7-793G-52XN AUO B173HAN01.0, a-Si TFT-LCD, WLED, 17.30, 1920x1080 | Aorus X7 v6 B173QTN01.0 (AUO1096), TN LED, 17.30, 2560x1440 | Gigabyte Aero 15 N156HCA-EA1 (CMN15D7), IPS, 15.60, 1920x1080 | |
|---|---|---|---|---|---|---|
| Display | 23% | -7% | -3% | -9% | -1% | |
| Display P3 Coverage | 64.2 | 90 40% | 61.3 -5% | 64 0% | 60.9 -5% | 65.2 2% |
| sRGB Coverage | 96.8 | 99.9 3% | 86.7 -10% | 90.2 -7% | 84.2 -13% | 92.5 -4% |
| AdobeRGB 1998 Coverage | 66.4 | 83.6 26% | 62.3 -6% | 65.4 -2% | 61.2 -8% | 66.5 0% |
| Response Times | 45% | 22% | 3% | 40% | -18% | |
| Response Time Grey 50% / Grey 80% * | 38 ? | 28 ? 26% | 21.2 ? 44% | 36 ? 5% | 31 ? 18% | 42.8 ? -13% |
| Response Time Black / White * | 26 ? | 9.6 ? 63% | 26 ? -0% | 26 ? -0% | 10 ? 62% | 32 ? -23% |
| PWM Frequency | 26000 ? | |||||
| Screen | 15% | 9% | -1% | -31% | -11% | |
| Brightness middle | 371.1 | 337.2 -9% | 316.5 -15% | 346 -7% | 343 -8% | 320 -14% |
| Brightness | 343 | 315 -8% | 306 -11% | 307 -10% | 312 -9% | 316 -8% |
| Brightness Distribution | 86 | 86 0% | 93 8% | 84 -2% | 80 -7% | 90 5% |
| Black Level * | 0.42 | 0.308 27% | 0.21 50% | 0.26 38% | 0.5 -19% | 0.36 14% |
| Contrast | 884 | 1095 24% | 1507 70% | 1331 51% | 686 -22% | 889 1% |
| Colorchecker dE 2000 * | 4.5 | 2.96 34% | 4.2 7% | 4.32 4% | 7.33 -63% | 4.62 -3% |
| Colorchecker dE 2000 max. * | 9.7 | 5.45 44% | 7.1 27% | 8.05 17% | 10.79 -11% | 9.75 -1% |
| Greyscale dE 2000 * | 3.1 | 2.57 17% | 3.9 -26% | 5.76 -86% | 7.6 -145% | 6 -94% |
| Gamma | 2.17 101% | 2.25 98% | 2.19 100% | 2.35 94% | 2.19 100% | 2.46 89% |
| CCT | 7120 91% | 7114 91% | 7242 90% | 6447 101% | 9024 72% | 6761 96% |
| Color Space (Percent of AdobeRGB 1998) | 61 | 74.3 22% | 56 -8% | 59 -3% | 55 -10% | 60 -2% |
| Color Space (Percent of sRGB) | 97 | 100 3% | 86 -11% | 90 -7% | 84 -13% | 92 -5% |
| Media total (Programa/Opciones) | 28% /
21% | 8% /
8% | -0% /
-1% | 0% /
-17% | -10% /
-10% |
* ... más pequeño es mejor
Tiempos de respuesta del display
| ↔ Tiempo de respuesta de Negro a Blanco | ||
|---|---|---|
| 26 ms ... subida ↗ y bajada ↘ combinada | ↗ 16 ms subida | 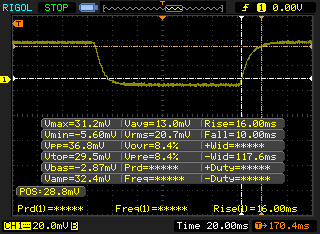 |
| ↘ 10 ms bajada | ||
| La pantalla mostró tiempos de respuesta relativamente lentos en nuestros tests pero podría ser demasiado lenta para los jugones. En comparación, todos los dispositivos de prueba van de ##min### (mínimo) a 240 (máximo) ms. » 57 % de todos los dispositivos son mejores. Eso quiere decir que el tiempo de respuesta es peor que la media (21.5 ms) de todos los dispositivos testados. | ||
| ↔ Tiempo de respuesta 50% Gris a 80% Gris | ||
| 38 ms ... subida ↗ y bajada ↘ combinada | ↗ 19.6 ms subida | 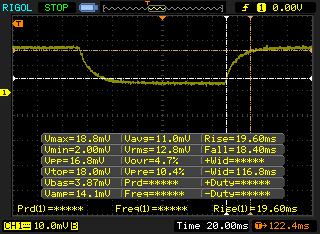 |
| ↘ 18.4 ms bajada | ||
| La pantalla mostró tiempos de respuesta lentos en nuestros tests y podría ser demasiado lenta para los jugones. En comparación, todos los dispositivos de prueba van de ##min### (mínimo) a 636 (máximo) ms. » 49 % de todos los dispositivos son mejores. Eso quiere decir que el tiempo de respuesta es peor que la media (33.7 ms) de todos los dispositivos testados. | ||
Parpadeo de Pantalla / PWM (Pulse-Width Modulation)
| Parpadeo de Pantalla / PWM no detectado | 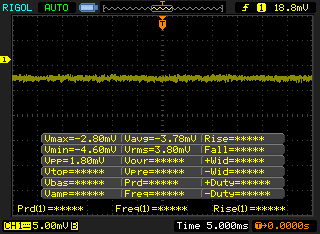 | ||
Comparación: 53 % de todos los dispositivos testados no usaron PWM para atenuar el display. Si se usó, medimos una media de 17924 (mínimo: 5 - máxmo: 3846000) Hz. | |||
| Cinebench R10 | |
| Rendering Multiple CPUs 32Bit | |
| Asus Strix GL702VSK | |
| MSI GS73VR 6RF | |
| Acer Aspire V17 Nitro BE VN7-793G-52XN | |
| Rendering Single 32Bit | |
| Asus Strix GL702VSK | |
| MSI GS73VR 6RF | |
| Acer Aspire V17 Nitro BE VN7-793G-52XN | |
| wPrime 2.10 - 1024m | |
| MSI GS73VR 7RF | |
| MSI GS73VR 6RF | |
| Asus Strix GL702VSK | |
* ... más pequeño es mejor
| PCMark 8 | |
| Home Score Accelerated v2 | |
| Asus Strix GL702VSK | |
| Gigabyte Aero 15 | |
| MSI GS73VR 6RF | |
| Acer Aspire V17 Nitro BE VN7-793G-52XN | |
| MSI GS73VR 7RF | |
| Work Score Accelerated v2 | |
| Gigabyte Aero 15 | |
| Acer Aspire V17 Nitro BE VN7-793G-52XN | |
| Asus Strix GL702VSK | |
| MSI GS73VR 6RF | |
| MSI GS73VR 7RF | |
| Creative Score Accelerated v2 | |
| MSI GS73VR 7RF | |
| MSI GS73VR 6RF | |
| Acer Aspire V17 Nitro BE VN7-793G-52XN | |
| PCMark 8 Home Score Accelerated v2 | 3581 puntos | |
| PCMark 8 Creative Score Accelerated v2 | 5225 puntos | |
| PCMark 8 Work Score Accelerated v2 | 4259 puntos | |
ayuda | ||
| MSI GS73VR 7RF Samsung SM961 MZVKW512HMJP m.2 PCI-e | MSI GS73VR 6RF SanDisk SD8SN8U1T001122 | Asus Strix GL702VSK HGST Travelstar 7K1000 HTS721010A9E630 | Acer Aspire V17 Nitro BE VN7-793G-52XN SK Hynix HFS256G39TND-N210A | Aorus X7 v6 Toshiba NVMe THNSN5512GPU7 | Gigabyte Aero 15 Lite-On CX2-8B512-Q11 | |
|---|---|---|---|---|---|---|
| CrystalDiskMark 3.0 | -63% | -97% | -48% | 28% | 19% | |
| Read Seq | 2459 | 334.3 -86% | 78.3 -97% | 493.1 -80% | 1499 -39% | 1769 -28% |
| Write Seq | 1609 | 319 -80% | 75.5 -95% | 270.2 -83% | 1411 -12% | 1133 -30% |
| Read 512 | 445.2 | 242.3 -46% | 34 -92% | 325.8 -27% | 966 117% | 891 100% |
| Write 512 | 748 | 254.4 -66% | 43.9 -94% | 267.8 -64% | 1103 47% | 1069 43% |
| Read 4k | 48.5 | 20.3 -58% | 0.5 -99% | 28.4 -41% | 44.33 -9% | 44.7 -8% |
| Write 4k | 131.5 | 42.51 -68% | 1.1 -99% | 76.2 -42% | 155.5 18% | 123.3 -6% |
| Read 4k QD32 | 454.1 | 251.6 -45% | 1.1 -100% | 344.6 -24% | 696 53% | 645 42% |
| Write 4k QD32 | 355.3 | 167.1 -53% | 1.1 -100% | 267 -25% | 531 49% | 490.5 38% |

| 3DMark 11 | |
| 1280x720 Performance GPU | |
| Aorus X7 v6 | |
| Asus Strix GL702VSK | |
| MSI GS73VR 6RF | |
| Acer Aspire V17 Nitro BE VN7-793G-52XN | |
| MSI GS73VR 7RF | |
| Gigabyte Aero 15 | |
| 1280x720 Performance Combined | |
| Aorus X7 v6 | |
| Gigabyte Aero 15 | |
| MSI GS73VR 7RF | |
| MSI GS73VR 6RF | |
| Asus Strix GL702VSK | |
| Acer Aspire V17 Nitro BE VN7-793G-52XN | |
| 3DMark | |
| 1280x720 Cloud Gate Standard Graphics | |
| Aorus X7 v6 | |
| Gigabyte Aero 15 | |
| Asus Strix GL702VSK | |
| MSI GS73VR 6RF | |
| Acer Aspire V17 Nitro BE VN7-793G-52XN | |
| MSI GS73VR 7RF | |
| 1920x1080 Fire Strike Graphics | |
| Asus Strix GL702VSK | |
| Aorus X7 v6 | |
| MSI GS73VR 6RF | |
| MSI GS73VR 7RF | |
| Gigabyte Aero 15 | |
| Acer Aspire V17 Nitro BE VN7-793G-52XN | |
| 1920x1080 Ice Storm Extreme Graphics | |
| Asus Strix GL702VSK | |
| MSI GS73VR 6RF | |
| Acer Aspire V17 Nitro BE VN7-793G-52XN | |
| MSI GS73VR 7RF | |
| 3DMark 11 Performance | 12579 puntos | |
| 3DMark Ice Storm Standard Score | 28688 puntos | |
| 3DMark Cloud Gate Standard Score | 20795 puntos | |
| 3DMark Fire Strike Score | 9675 puntos | |
| 3DMark Fire Strike Extreme Score | 5100 puntos | |
ayuda | ||
| BioShock Infinite - 1920x1080 Ultra Preset, DX11 (DDOF) (ordenar por valor) | |
| MSI GS73VR 7RF | |
| MSI GS73VR 6RF | |
| Asus Strix GL702VSK | |
| Acer Aspire V17 Nitro BE VN7-793G-52XN | |
| Metro: Last Light - 1920x1080 Very High (DX11) AF:16x (ordenar por valor) | |
| MSI GS73VR 7RF | |
| MSI GS73VR 6RF | |
| Asus Strix GL702VSK | |
| Thief - 1920x1080 Very High Preset AA:FXAA & High SS AF:8x (ordenar por valor) | |
| MSI GS73VR 7RF | |
| MSI GS73VR 6RF | |
| Asus Strix GL702VSK | |
| The Witcher 3 - 1920x1080 Ultra Graphics & Postprocessing (HBAO+) (ordenar por valor) | |
| MSI GS73VR 7RF | |
| Asus Strix GL702VSK | |
| Acer Aspire V17 Nitro BE VN7-793G-52XN | |
| Gigabyte Aero 15 | |
| Fallout 4 - 1920x1080 Ultra Preset AA:T AF:16x (ordenar por valor) | |
| MSI GS73VR 7RF | |
| MSI GS73VR 6RF | |
| Asus Strix GL702VSK | |
| Rise of the Tomb Raider | |
| 1920x1080 Very High Preset AA:FX AF:16x (ordenar por valor) | |
| MSI GS73VR 7RF | |
| MSI GS73VR 6RF | |
| Asus Strix GL702VSK | |
| Acer Aspire V17 Nitro BE VN7-793G-52XN | |
| Aorus X7 v6 | |
| 3840x2160 High Preset AA:FX AF:4x (ordenar por valor) | |
| MSI GS73VR 7RF | |
| Hitman 2016 - 1920x1080 Ultra / On AA:SM AF:16x (ordenar por valor) | |
| MSI GS73VR 7RF | |
| Ashes of the Singularity | |
| 1920x1080 high (ordenar por valor) | |
| MSI GS73VR 7RF | |
| Asus Strix GL702VSK | |
| 3840x2160 crazy (ordenar por valor) | |
| MSI GS73VR 7RF | |
| Doom | |
| 1920x1080 Ultra Preset AA:SM (ordenar por valor) | |
| MSI GS73VR 7RF | |
| MSI GS73VR 6RF | |
| Asus Strix GL702VSK | |
| Aorus X7 v6 | |
| 3840x2160 High Preset AA:FX (ordenar por valor) | |
| MSI GS73VR 7RF | |
| Deus Ex Mankind Divided - 1920x1080 Ultra Preset AA:2xMS AF:8x (ordenar por valor) | |
| MSI GS73VR 7RF | |
| Aorus X7 v6 | |
| Mafia 3 - 1920x1080 High Preset (ordenar por valor) | |
| MSI GS73VR 7RF | |
| Asus Strix GL702VSK | |
| Civilization VI | |
| 1920x1080 Ultra Preset AA:4xMS (ordenar por valor) | |
| MSI GS73VR 7RF | |
| 3840x2160 High Preset (ordenar por valor) | |
| MSI GS73VR 7RF | |
| bajo | medio | alto | ultra | 4K | |
| BioShock Infinite (2013) | 134 | ||||
| Metro: Last Light (2013) | 76 | ||||
| Thief (2014) | 60 | ||||
| The Witcher 3 (2015) | 41 | ||||
| Fallout 4 (2015) | 71 | ||||
| Rise of the Tomb Raider (2016) | 51 | 16 | |||
| Hitman 2016 (2016) | 57 | ||||
| Ashes of the Singularity (2016) | 54 | 24 | |||
| Doom (2016) | 89 | 30 | |||
| Deus Ex Mankind Divided (2016) | 30 | ||||
| Mafia 3 (2016) | 47 | ||||
| Civilization VI (2016) | 43 | 37 |
Ruido
| Ocioso |
| 30.8 / 30.8 / 30.9 dB(A) |
| Carga |
| 42.2 / 48.6 dB(A) |
 | ||
30 dB silencioso 40 dB(A) audible 50 dB(A) ruidosamente alto |
||
min: | ||
| MSI GS73VR 7RF GeForce GTX 1060 Mobile, i7-7700HQ, Samsung SM961 MZVKW512HMJP m.2 PCI-e | MSI GS73VR 6RF GeForce GTX 1060 Mobile, 6700HQ, SanDisk SD8SN8U1T001122 | Asus Strix GL702VSK GeForce GTX 1070 Mobile, i7-7700HQ, HGST Travelstar 7K1000 HTS721010A9E630 | Acer Aspire V17 Nitro BE VN7-793G-52XN GeForce GTX 1060 Mobile, i5-7300HQ, SK Hynix HFS256G39TND-N210A | Aorus X7 v6 GeForce GTX 1070 Mobile, 6820HK, Toshiba NVMe THNSN5512GPU7 | Gigabyte Aero 15 GeForce GTX 1060 Mobile, i7-7700HQ, Lite-On CX2-8B512-Q11 | |
|---|---|---|---|---|---|---|
| Noise | -5% | 1% | 4% | -12% | -3% | |
| off / environment * | 28.1 | 28.4 -1% | 28.6 -2% | 30.7 -9% | 30 -7% | 31 -10% |
| Idle Minimum * | 30.8 | 31.9 -4% | 30.6 1% | 30.7 -0% | 33 -7% | 32 -4% |
| Idle Average * | 30.8 | 32 -4% | 30.6 1% | 30.7 -0% | 35 -14% | 33 -7% |
| Idle Maximum * | 30.9 | 34 -10% | 30.6 1% | 31.4 -2% | 40 -29% | 34 -10% |
| Load Average * | 42.2 | 47 -11% | 39.8 6% | 32.1 24% | 43 -2% | 39 8% |
| Witcher 3 ultra * | 44.4 | 42.8 4% | 43 3% | |||
| Load Maximum * | 48.6 | 49.4 -2% | 48 1% | 42.8 12% | 54 -11% | 50 -3% |
* ... más pequeño es mejor
(-) The maximum temperature on the upper side is 50.2 °C / 122 F, compared to the average of 40.4 °C / 105 F, ranging from 21.2 to 68.8 °C for the class Gaming.
(-) The bottom heats up to a maximum of 55.6 °C / 132 F, compared to the average of 43.2 °C / 110 F
(+) In idle usage, the average temperature for the upper side is 25.2 °C / 77 F, compared to the device average of 33.8 °C / 93 F.
(+) Playing The Witcher 3, the average temperature for the upper side is 28.2 °C / 83 F, compared to the device average of 33.8 °C / 93 F.
(+) The palmrests and touchpad are cooler than skin temperature with a maximum of 30.8 °C / 87.4 F and are therefore cool to the touch.
(±) The average temperature of the palmrest area of similar devices was 28.9 °C / 84 F (-1.9 °C / -3.4 F).
MSI GS73VR 7RF audio analysis
(+) | speakers can play relatively loud (82 dB)
Bass 100 - 315 Hz
(-) | nearly no bass - on average 18.1% lower than median
(±) | linearity of bass is average (13.2% delta to prev. frequency)
Mids 400 - 2000 Hz
(±) | higher mids - on average 5.2% higher than median
(±) | linearity of mids is average (8.3% delta to prev. frequency)
Highs 2 - 16 kHz
(±) | higher highs - on average 7.9% higher than median
(±) | linearity of highs is average (8.9% delta to prev. frequency)
Overall 100 - 16.000 Hz
(±) | linearity of overall sound is average (26.2% difference to median)
Compared to same class
» 91% of all tested devices in this class were better, 2% similar, 7% worse
» The best had a delta of 6%, average was 18%, worst was 132%
Compared to all devices tested
» 77% of all tested devices were better, 5% similar, 18% worse
» The best had a delta of 4%, average was 25%, worst was 134%
Asus Strix GL702VSK audio analysis
(±) | speaker loudness is average but good (78.9 dB)
Bass 100 - 315 Hz
(±) | reduced bass - on average 8.8% lower than median
(±) | linearity of bass is average (14.3% delta to prev. frequency)
Mids 400 - 2000 Hz
(+) | balanced mids - only 1.5% away from median
(+) | mids are linear (5.9% delta to prev. frequency)
Highs 2 - 16 kHz
(±) | higher highs - on average 8.2% higher than median
(±) | linearity of highs is average (14.2% delta to prev. frequency)
Overall 100 - 16.000 Hz
(±) | linearity of overall sound is average (22.3% difference to median)
Compared to same class
» 77% of all tested devices in this class were better, 7% similar, 17% worse
» The best had a delta of 6%, average was 18%, worst was 132%
Compared to all devices tested
» 60% of all tested devices were better, 7% similar, 34% worse
» The best had a delta of 4%, average was 25%, worst was 134%
| Off / Standby | |
| Ocioso | |
| Carga |
|
| MSI GS73VR 7RF i7-7700HQ, GeForce GTX 1060 Mobile, Samsung SM961 MZVKW512HMJP m.2 PCI-e, IPS, 3840x2160, 17.30 | MSI GS73VR 6RF 6700HQ, GeForce GTX 1060 Mobile, SanDisk SD8SN8U1T001122, TN LED, 1920x1080, 17.30 | Asus Strix GL702VSK i7-7700HQ, GeForce GTX 1070 Mobile, HGST Travelstar 7K1000 HTS721010A9E630, IPS, 1920x1080, 17.30 | Acer Aspire V17 Nitro BE VN7-793G-52XN i5-7300HQ, GeForce GTX 1060 Mobile, SK Hynix HFS256G39TND-N210A, a-Si TFT-LCD, WLED, 1920x1080, 17.30 | Aorus X7 v6 6820HK, GeForce GTX 1070 Mobile, Toshiba NVMe THNSN5512GPU7, TN LED, 2560x1440, 17.30 | Gigabyte Aero 15 i7-7700HQ, GeForce GTX 1060 Mobile, Lite-On CX2-8B512-Q11, IPS, 1920x1080, 15.60 | |
|---|---|---|---|---|---|---|
| Power Consumption | -32% | -23% | 26% | -53% | 15% | |
| Idle Minimum * | 14.2 | 22.6 -59% | 20.9 -47% | 7.8 45% | 29 -104% | 12 15% |
| Idle Average * | 23.5 | 32.7 -39% | 22.9 3% | 13.3 43% | 31 -32% | 15 36% |
| Idle Maximum * | 23.8 | 32.8 -38% | 23.1 3% | 16.6 30% | 38 -60% | 20 16% |
| Load Average * | 90.9 | 114.7 -26% | 147.2 -62% | 73 20% | 111 -22% | 82 10% |
| Witcher 3 ultra * | 116 | 118 -2% | 111 4% | |||
| Load Maximum * | 171.6 | 167.9 2% | 188.1 -10% | 140 18% | 253 -47% | 161 6% |
* ... más pequeño es mejor
| MSI GS73VR 7RF i7-7700HQ, GeForce GTX 1060 Mobile, 65 Wh | MSI GS73VR 6RF 6700HQ, GeForce GTX 1060 Mobile, 65 Wh | Asus Strix GL702VSK i7-7700HQ, GeForce GTX 1070 Mobile, 76 Wh | Acer Aspire V17 Nitro BE VN7-793G-52XN i5-7300HQ, GeForce GTX 1060 Mobile, 69 Wh | Aorus X7 v6 6820HK, GeForce GTX 1070 Mobile, 94 Wh | Gigabyte Aero 15 i7-7700HQ, GeForce GTX 1060 Mobile, 94.24 Wh | |
|---|---|---|---|---|---|---|
| Duración de Batería | 23% | 25% | 123% | 12% | 125% | |
| Reader / Idle | 301 | 353 17% | 306 2% | 618 105% | 638 112% | |
| WiFi v1.3 | 163 | 213 31% | 203 25% | 374 129% | 182 12% | 422 159% |
| Load | 55 | 66 20% | 81 47% | 130 136% | 112 104% |
Pro
Contra
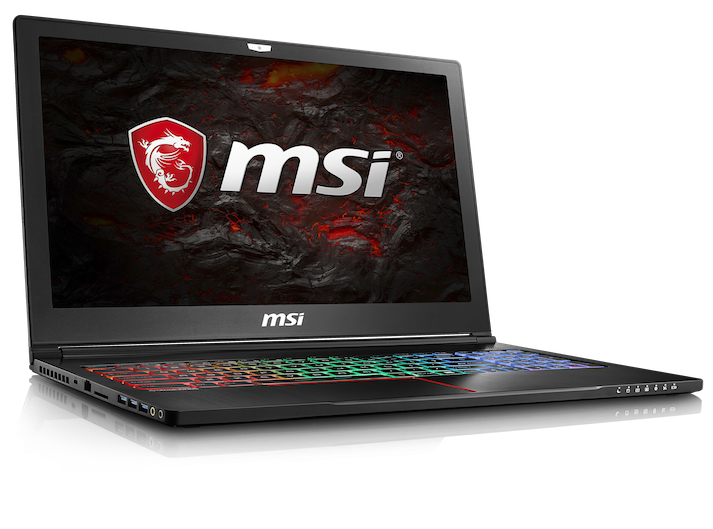
El MSI GS73VR 7RF no es tanto una mejora como un refinamiento. Dónde el 6RF fue un ajuste de la línea delgado-y-ligero 17.3" de MSI, el 7RF es la compleción de esa idea. Como tal, mejora sobre los positivos de su predecesor, pero también mantiene los contras. Seguimos celebrando el excelente teclado, el chasis premium, y el excelente rendimiento de juego. Sin embargo, la dificil mantenibilidad, los terriblemente ruidosos ventiladores, y lo apretado de los puertos siguen siendo defectos. Súmale un comportamiento consistentemente defectuoso durante nuestro tiempo de pruebas y nos deja con sentimientos encontrados sobre el 7RF.
La pantalla es un poco de todo. Colores y calidad de imagen son geniales, pero la resolución 4K es innecesaria. Si bien es una buena opción, básicamente es un truco. Los componentes internos son más adecuados para jugar a Full HD, y la alta resolución crea más problemas de los que resuelve. Los creadores de contenido y amantes del cine seguramente adorarán el panel UHD, pero el resto de usuarios seguramente nunca notará la diferencia. La opción del panel Full HD es la elección que recomendamos a los jugones, ya que exige menos al sistema, aumenta el aguante de batería, y reduce el coste.
El GS73VR 7RF es un competente portátil que hace muchas cosas muy bien. Ofrece un rendimiento excelente en un paquete muy delgado. Sin embargo, el mercado para portátiles gaming delgados-y-ligeros ha explotado en los recientes años. Otras compañías también ofrecen portátiles potentes y portables, como Razer, Gigabyte, y Asus. Si bien aún no hay un portátil gaming compacto perfecto, no hay escasez de opciones de las que elegir.
El GS73VR 7RF ofrece algunas mejoras tangibles respecto a sus predecesores, sí, pero son marginales como mucho. El GS73VR 6RF es casi tan bueno y puede encontrarse nuevo o usado por mucho menos. Otras opciones tales como el Gigabyte Aero 15, ofrecen un rendimiento similar por el mismo dinero o menos a la vez que mejoran aspectos que podrían importar más a los jugones.
El MSI GS73VR 7RF es una buena máquina, pero la lastran muchas trabas menores y algunas importantes. Si bien es un buen portátil en general, hay mejores opciones disponibles.
Ésta es una versión acortada del análisis original. Puedes leer el análisis completo en inglés aquí.
MSI GS73VR 7RF
-
06/13/2017 v6(old)
Sam Medley
Pricecompare
