Notebookcheck Logo

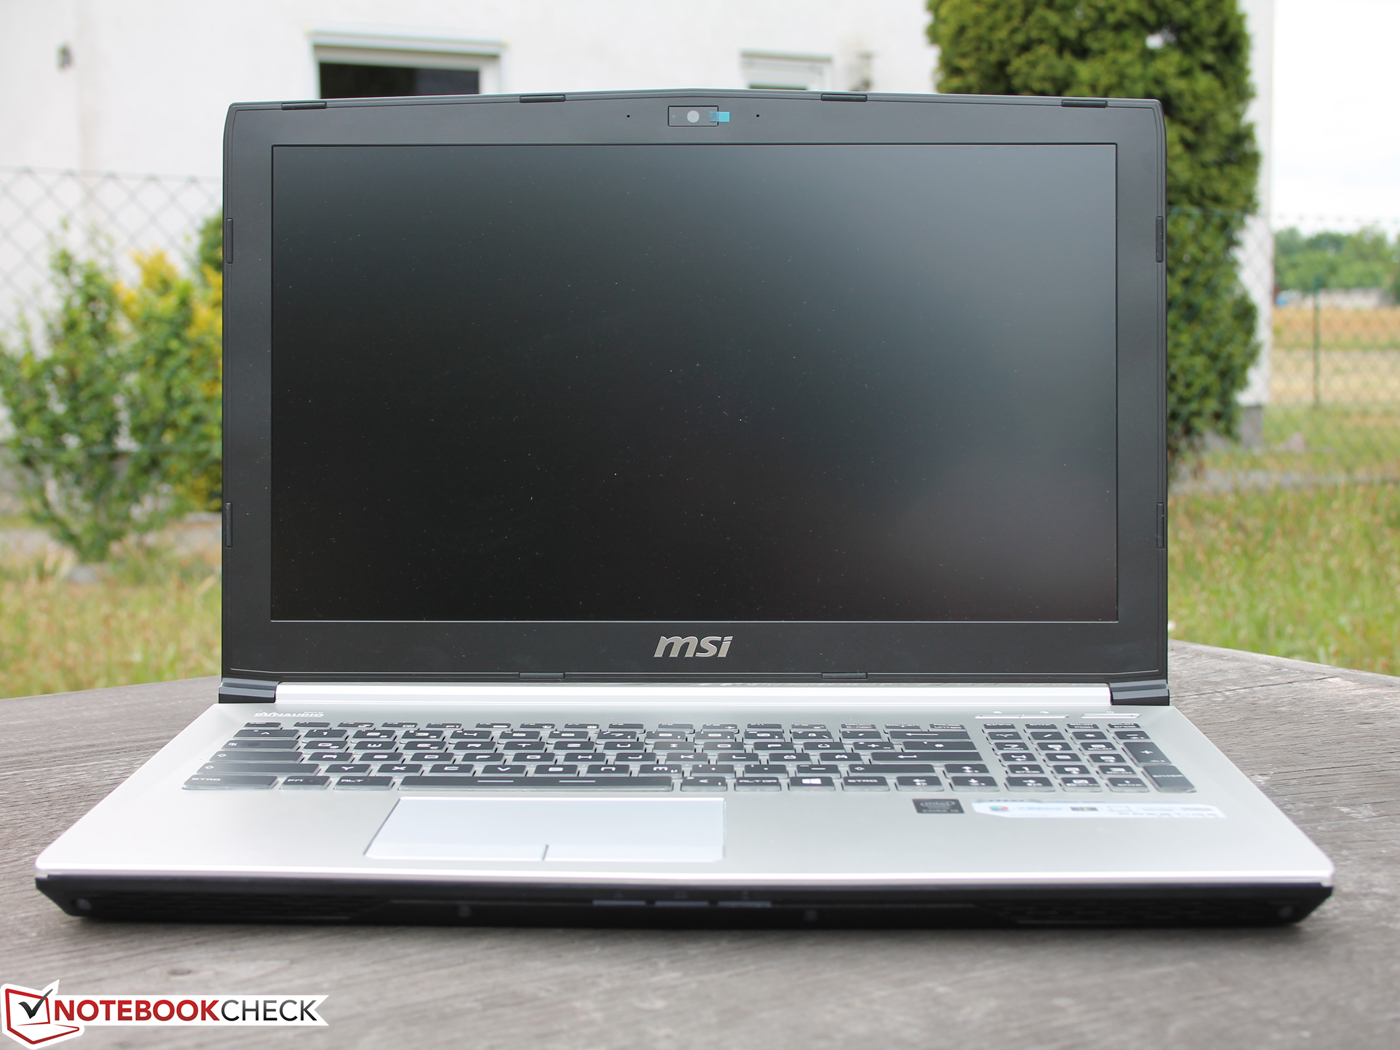
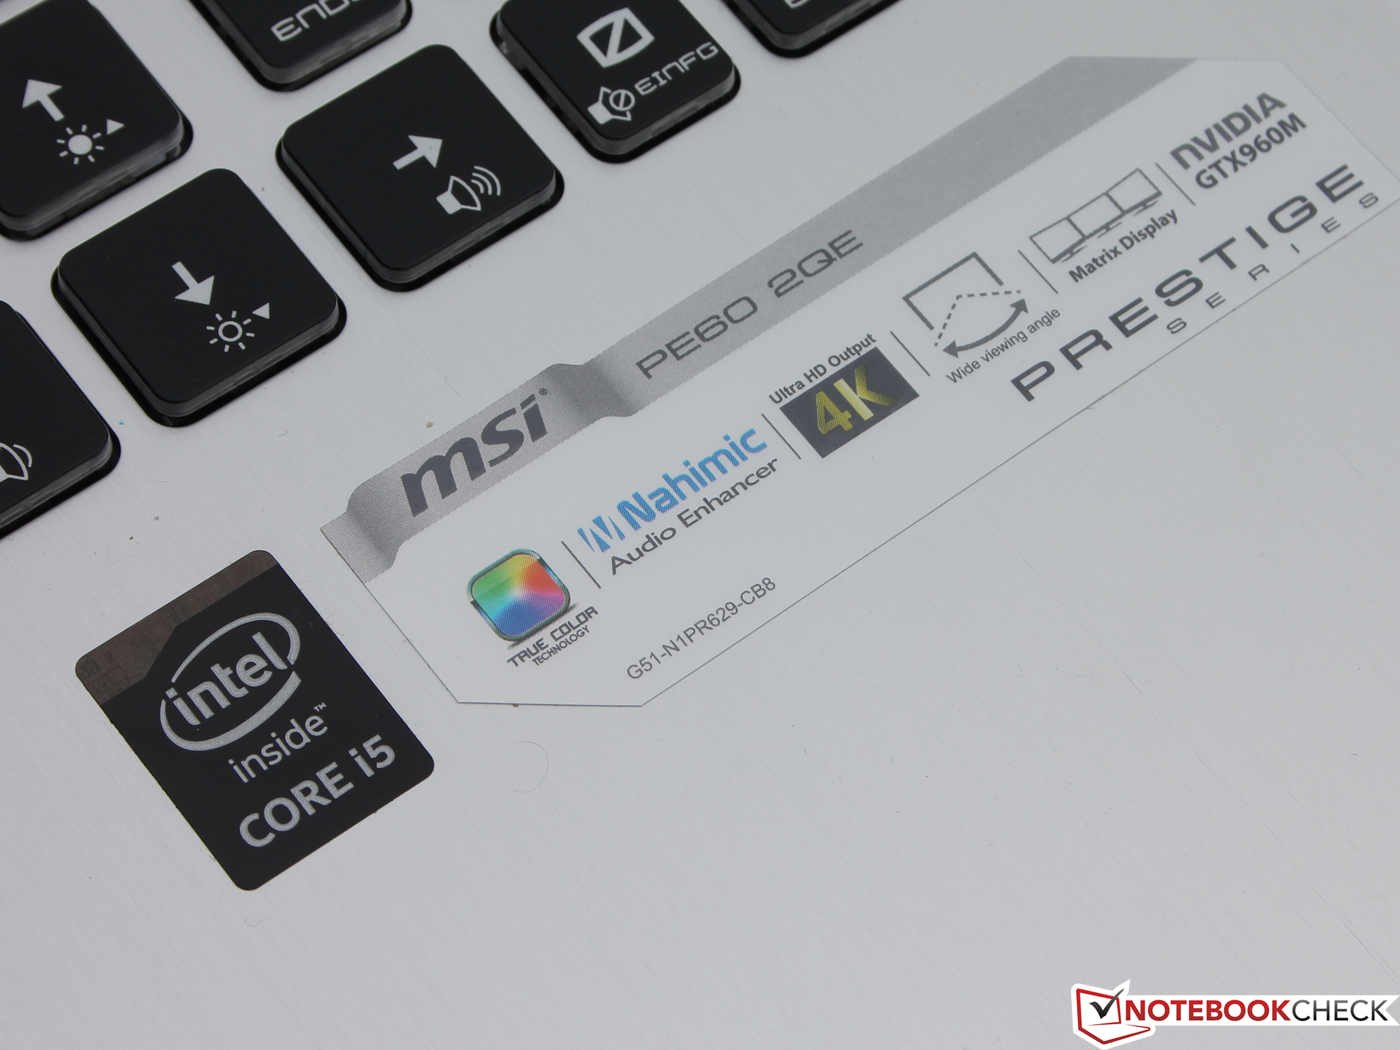
Breve análisis del MSI PE60 2QE Prestige

Elvis. Genial voz, rendimiento atractivo y el mejor valor de entretenimiento. La serie Prestige busca impresionar a los usuarios domésticos y business con sus características de lujo. ¿Lo logrará con las herramientas estándar? El fabricante ha eliminado el clásico "teclado" vulnerable MSI, una sabia decisión que nos alegra.
MSI PE60-2QEi581 (PE60 Serie)
Procesador
Intel Core i5-4210H 2 x 2.9 - 3.5 GHz, Haswell
Adaptador gráfico
NVIDIA GeForce GTX 960M - 2048 MB VRAM, Núcleo: 1202 MHz, Memoría: 1253 MHz, GDDR5, ForceWare 347.26, Optimus HD Graphics 4600
Memoría
8 GB 
, monocanal PC3-12800
pantalla
15.60 pulgadas 16:9, 1920 x 1080 pixels 141 PPI, SAMSUNG LTN156HL01, IPS, True Color, True Color: 6 perfiles de color incl. sRGB, 72% NTSC, lustroso: no
Placa base
Intel HM87 (Lynx Point)
Disco duro
HGST Travelstar 7K1000 HTS721010A9E630, 1000 GB 
, 7200 rpm, + ranura SSD (M.2), 870 GB libre
Tarjeta de sonido
Intel Lynx Point PCH - High Definition Audio Controller
Conexiones
1 USB 2.0, 3 USB 3.0, 1 HDMI, 1 DisplayPort, 1 Kensington Lock, Audio Conexiones: micrófono, salida de línea independiente, Card Reader: SD/SDHC/SDXC
Equipamento de red
Qualcomm Killer e2200 PCI-E Gigabit Ethernet Controller (10/100/1000MBit/s), Intel Dual Band Wireless-AC 3160 (a/b/g/n = Wi-Fi 4/ac = Wi-Fi 5/), Bluetooth 4.0
Unidad óptica
HL-DT-ST DVDRAM GUB0N
Tamaño
Alto x ancho x profundidad (en mm): 27 x 383 x 260
Battería
42 Wh Litio-Ion, 6 celdas, ión-litio
Sistema Operativo
Microsoft Windows 8.1 64 Bit
Camera
Webcam: 1.3 MP 1280x720
Características adicionales
Altavoces: Dynaudio, Nahimic Audio Enhancer, 4 altavoces bidireccionales y subwoofer, Teclado: SteelSeries, Luz de Teclado: si, Shortcut Manager, True Color, Killer Network Manager, Norton Internet Security (prueba), 36 Meses Garantía
Peso
2.318 kg, Suministro de Electricidad: 563 g
Precio
1129 Euros
Note: The manufacturer may use components from different suppliers including display panels, drives or memory sticks with similar specifications.


DVD multi-burner, USB 2.0, 3-in-1 card reader (SD/SDHC/SDXC), power socket
Kensington Lock, RJ45 Ethernet, USB 3.0, HDMI, mini-DisplayPort, 2x USB 3.0, (gold-plated) microphone and headphone
276
cd/m²
290
cd/m²
280
cd/m²
279
cd/m²
300
cd/m²
281
cd/m²
281
cd/m²
271
cd/m²
282
cd/m²
Temperatura del cuarto
SAMSUNG LTN156HL01 tested with X-Rite i1Pro 2
Máximo: 300 cd/m² (Nits) Médio: 282.2 cd/m²
iluminación: 90 %
Brillo con batería: 251 cd/m²
Contraste: 857:1 (Negro: 0.35 cd/m²)
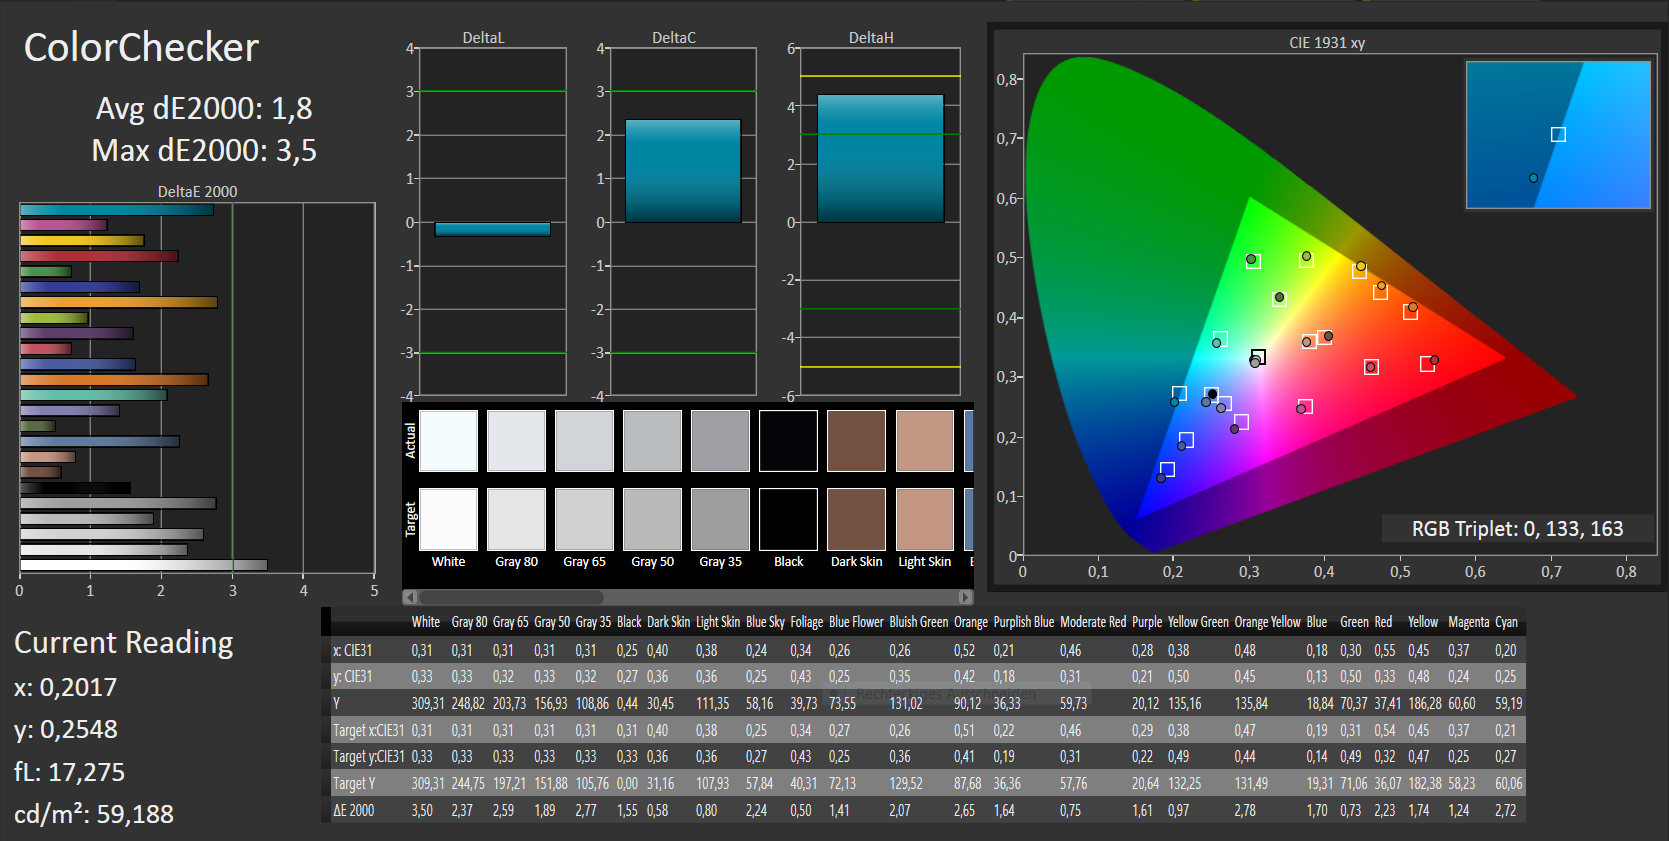
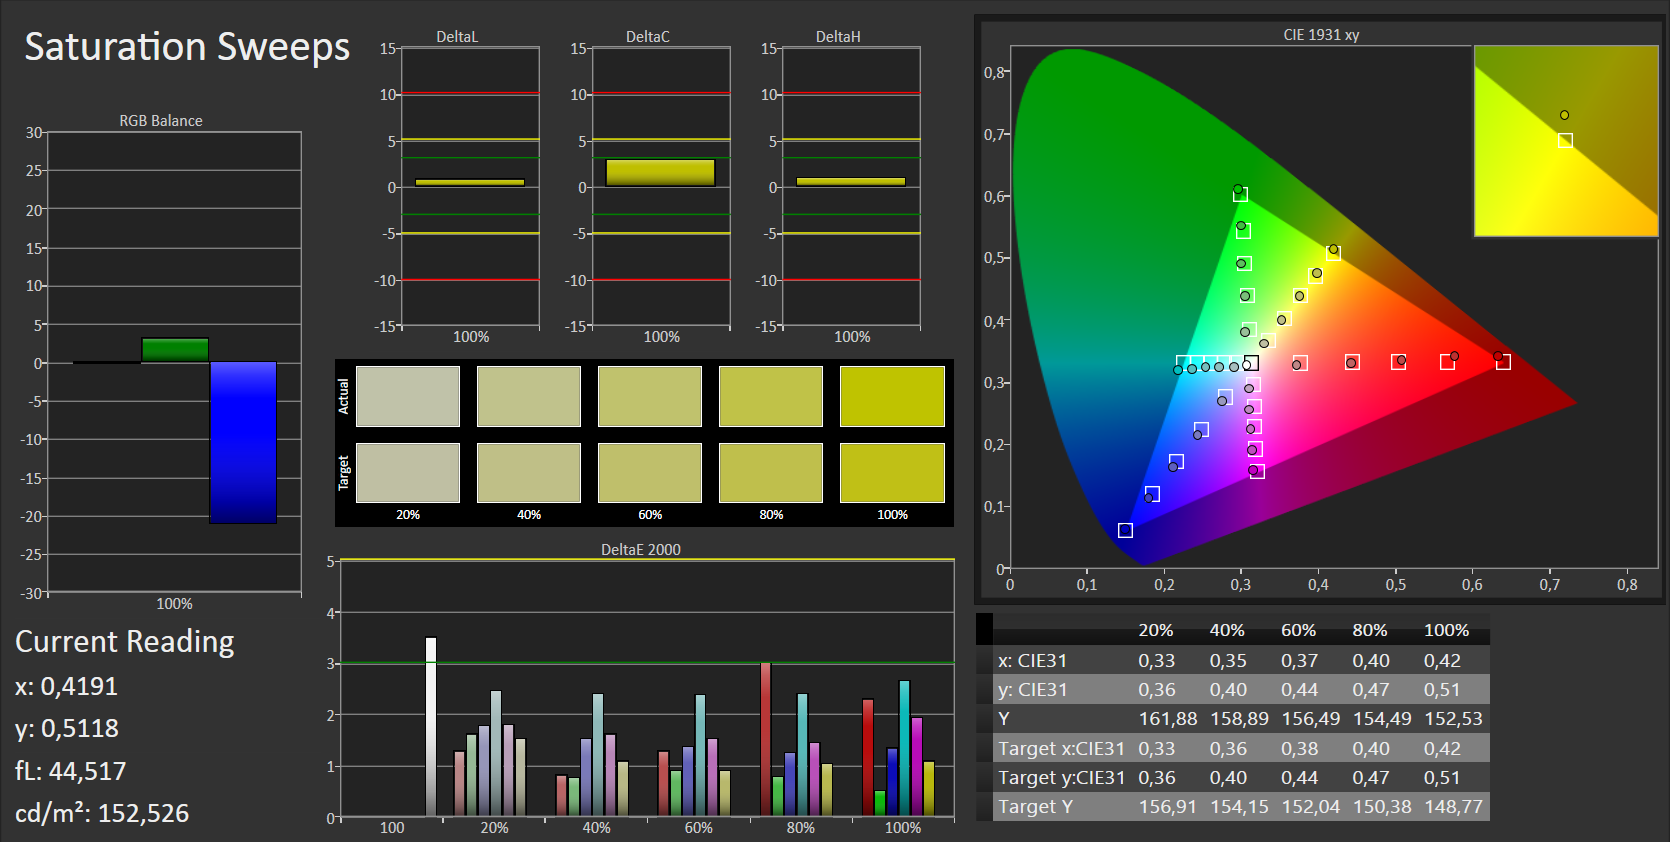
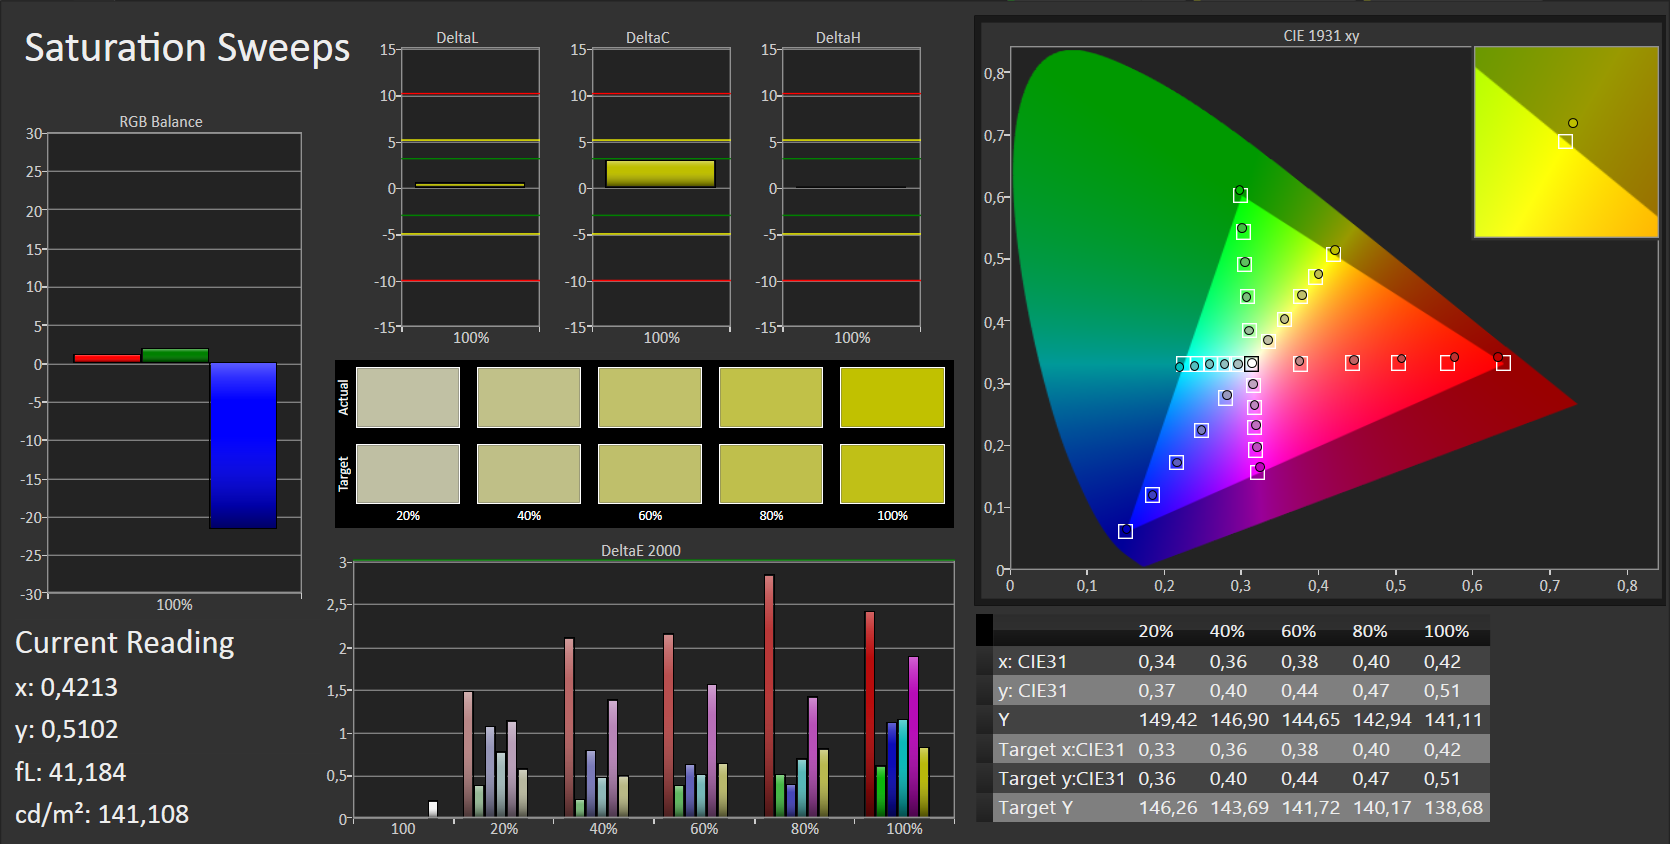
ΔE Color 1.8 | 0.5-29.43 Ø5
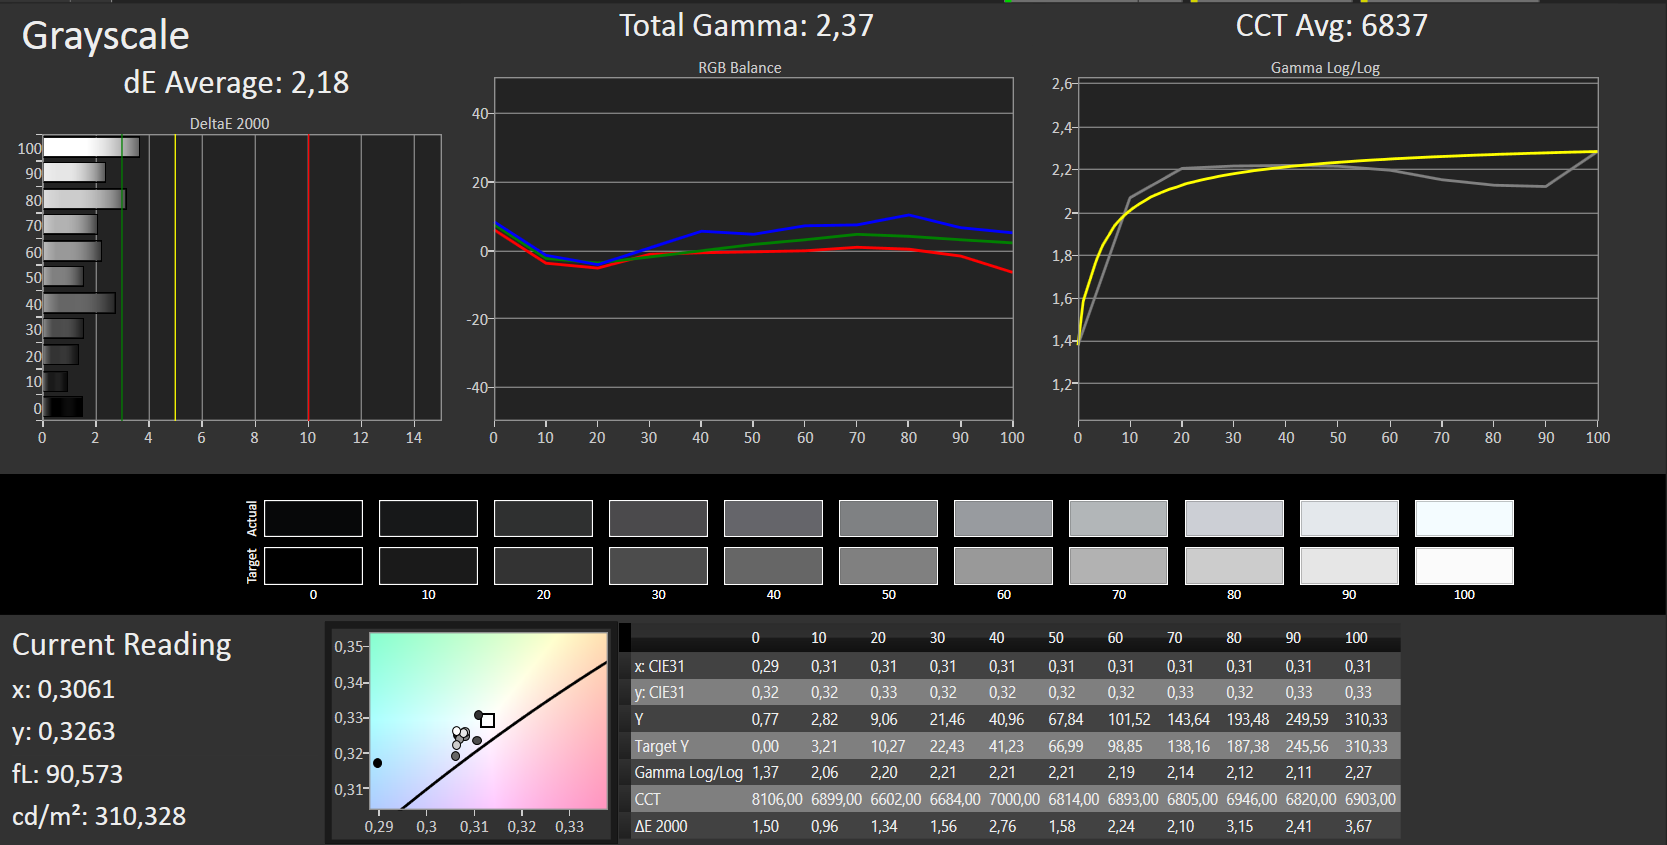
ΔE Greyscale 2.18 | 0.57-98 Ø5.3
97% sRGB (Argyll 1.6.3 3D)
64% AdobeRGB 1998 (Argyll 1.6.3 3D)
69.8% AdobeRGB 1998 (Argyll 2.2.0 3D)
97% sRGB (Argyll 2.2.0 3D)
67.6% Display P3 (Argyll 2.2.0 3D)
Gamma: 2.37
MSI PE60-2QEi581
GeForce GTX 960M, 4210H, HGST Travelstar 7K1000 HTS721010A9E630
Acer Aspire VN7-591G-727P
GeForce GTX 960M, 4720HQ, Toshiba HG6 THNSNJ256G8NU
Asus N551JK-CN166H
GeForce GTX 850M, 4200H, HGST Travelstar 5K1000 HTS541010A9E680
Asus UX501JW-DS71T
GeForce GTX 960M, 4720HQ, Samsung SSD SM951 512 GB MZHPV512HDGL
Toshiba Satellite P50t-B-10T
Radeon R9 M265X, 4710HQ, Toshiba MQ01ABD100
Dell XPS 15 (9530-0538)
GeForce GT 750M, 4712HQ, Lite-On LMT-512L9M
Display
-13%
-0%
-25%
-5%
-3%
Display P3 Coverage
67.6
64.9
-4%
67.3
0%
50.2
-26%
64.1
-5%
64.9
-4%
sRGB Coverage
97
66.9
-31%
96.7
0%
75
-23%
92.3
-5%
96.1
-1%
AdobeRGB 1998 Coverage
69.8
66.9
-4%
69.4
-1%
51.8
-26%
65.5
-6%
66.9
-4%
Screen
-30%
-61%
-68%
10%
-2%
Brightness middle
300
322
7%
323
8%
278.1
-7%
255
-15%
349
16%
Brightness
282
325
15%
312
11%
281
0%
248
-12%
365
29%
Brightness Distribution
90
90
0%
83
-8%
89
-1%
88
-2%
87
-3%
Black Level *
0.35
0.37
-6%
0.38
-9%
0.293
16%
0.18
49%
0.282
19%
Contrast
857
870
2%
850
-1%
949
11%
1417
65%
1238
44%
Colorchecker dE 2000 *
1.8
3.77
-109%
7.4
-311%
8.78
-388%
2
-11%
2.65
-47%
Greyscale dE 2000 *
2.18
5.36
-146%
6.24
-186%
6.29
-189%
1.61
26%
3.77
-73%
Gamma
2.37 93%
2.39 92%
2.98 74%
2.25 98%
2.37 93%
2.41 91%
CCT
6837 95%
7163 91%
8098 80%
6197 105%
6462 101%
6786 96%
Color Space (Percent of AdobeRGB 1998)
64
61
-5%
69
8%
48.31
-25%
60
-6%
61.02
-5%
Color Space (Percent of sRGB)
97
72.54
-25%
92.1
-5%
96.1
-1%
Media total (Programa/Opciones)
-22% / -26%
-31% / -44%
-47% / -57%
3% / 6%
-3% / -3%

* ... más pequeño es mejor

Grayscale: MSI sRGB profile
Grayscale: calibrated as per sRGB
ColorChecker: MSI sRGB profile
ColorChecker: calibrated as per sRGB
Saturation Sweeps: MSI sRGB profile
Saturation Sweeps: calibrated as per sRGB
 
Cinebench R11.5
CPU Single 64Bit (ordenar por valor)
MSI PE60-2QEi581
GeForce GTX 960M, 4210H, HGST Travelstar 7K1000 HTS721010A9E630
1.5 Points
Acer Aspire VN7-591G-727P
GeForce GTX 960M, 4720HQ, Toshiba HG6 THNSNJ256G8NU
1.56 Points +4%
Asus N551JK-CN166H
GeForce GTX 850M, 4200H, HGST Travelstar 5K1000 HTS541010A9E680
1.46 Points -3%
Asus UX501JW-DS71T
GeForce GTX 960M, 4720HQ, Samsung SSD SM951 512 GB MZHPV512HDGL
1.54 Points +3%
Toshiba Satellite P50t-B-10T
Radeon R9 M265X, 4710HQ, Toshiba MQ01ABD100
1.48 Points -1%
Dell XPS 15 (9530-0538)
GeForce GT 750M, 4712HQ, Lite-On LMT-512L9M
1.44 Points -4%
CPU Multi 64Bit (ordenar por valor)
MSI PE60-2QEi581
GeForce GTX 960M, 4210H, HGST Travelstar 7K1000 HTS721010A9E630
3.64 Points
Acer Aspire VN7-591G-727P
GeForce GTX 960M, 4720HQ, Toshiba HG6 THNSNJ256G8NU
7.07 Points +94%
Asus N551JK-CN166H
GeForce GTX 850M, 4200H, HGST Travelstar 5K1000 HTS541010A9E680
3.5 Points -4%
Asus UX501JW-DS71T
GeForce GTX 960M, 4720HQ, Samsung SSD SM951 512 GB MZHPV512HDGL
6.44 Points +77%
Toshiba Satellite P50t-B-10T
Radeon R9 M265X, 4710HQ, Toshiba MQ01ABD100
6.8 Points +87%
Dell XPS 15 (9530-0538)
GeForce GT 750M, 4712HQ, Lite-On LMT-512L9M
6.4 Points +76%
Cinebench R15
CPU Single 64Bit (ordenar por valor)
MSI PE60-2QEi581
GeForce GTX 960M, 4210H, HGST Travelstar 7K1000 HTS721010A9E630
131 Points
Acer Aspire VN7-591G-727P
GeForce GTX 960M, 4720HQ, Toshiba HG6 THNSNJ256G8NU
138 Points +5%
Asus N551JK-CN166H
GeForce GTX 850M, 4200H, HGST Travelstar 5K1000 HTS541010A9E680
130 Points -1%
Asus UX501JW-DS71T
GeForce GTX 960M, 4720HQ, Samsung SSD SM951 512 GB MZHPV512HDGL
137 Points +5%
Toshiba Satellite P50t-B-10T
Radeon R9 M265X, 4710HQ, Toshiba MQ01ABD100
133 Points +2%
Dell XPS 15 (9530-0538)
GeForce GT 750M, 4712HQ, Lite-On LMT-512L9M
125 Points -5%
CPU Multi 64Bit (ordenar por valor)
MSI PE60-2QEi581
GeForce GTX 960M, 4210H, HGST Travelstar 7K1000 HTS721010A9E630
324 Points
Acer Aspire VN7-591G-727P
GeForce GTX 960M, 4720HQ, Toshiba HG6 THNSNJ256G8NU
642 Points +98%
Asus N551JK-CN166H
GeForce GTX 850M, 4200H, HGST Travelstar 5K1000 HTS541010A9E680
323 Points 0%
Asus UX501JW-DS71T
GeForce GTX 960M, 4720HQ, Samsung SSD SM951 512 GB MZHPV512HDGL
579 Points +79%
Toshiba Satellite P50t-B-10T
Radeon R9 M265X, 4710HQ, Toshiba MQ01ABD100
611 Points +89%
Dell XPS 15 (9530-0538)
GeForce GT 750M, 4712HQ, Lite-On LMT-512L9M
565 Points +74%
Cinebench R10 Rendering Single 32Bit
5055
Cinebench R11.5 CPU Single 64Bit
1.5 Points
Cinebench R11.5 CPU Multi 64Bit
3.64 Points
Cinebench R11.5 OpenGL 64Bit
55.8 fps
Cinebench R15 CPU Single 64Bit
131 Points
Cinebench R15 CPU Multi 64Bit
324 Points
Cinebench R15 OpenGL 64Bit
55.7 fps
Cinebench R15 Ref. Match 64Bit
99.6 %
ayuda
MSI PE60-2QEi581
GeForce GTX 960M, 4210H, HGST Travelstar 7K1000 HTS721010A9E630
Acer Aspire VN7-591G-727P
GeForce GTX 960M, 4720HQ, Toshiba HG6 THNSNJ256G8NU
Asus N551JK-CN166H
GeForce GTX 850M, 4200H, HGST Travelstar 5K1000 HTS541010A9E680
Asus UX501JW-DS71T
GeForce GTX 960M, 4720HQ, Samsung SSD SM951 512 GB MZHPV512HDGL
Toshiba Satellite P50t-B-10T
Radeon R9 M265X, 4710HQ, Toshiba MQ01ABD100
Dell XPS 15 (9530-0538)
GeForce GT 750M, 4712HQ, Lite-On LMT-512L9M
PCMark 7
83%
29%
86%
25%
47%
Score
3275
5804
77%
4131
26%
6087
86%
5010
53%
5549
69%
Productivity
2014
5144
155%
3494
73%
2035
1%
2782
38%
Creativity
6313
10418
65%
7266
15%
7924
26%
10028
59%
Computation
14944
19805
33%
15092
1%
17704
18%
17929
20%
PCMark 8
-9%
-4%
-4%
9%
Work Score Accelerated v2
4169
3601
-14%
3881
-7%
3944
-5%
Home Score Accelerated v2
3114
3019
-3%
3113
0%
3064
-2%
3386
9%
Media total (Programa/Opciones)
37% / 52%
13% / 18%
41% / 26%
17% / 21%
47% / 47%
PCMark 7 Score
3275 puntos
PCMark 8 Home Score Accelerated v2
3114 puntos
PCMark 8 Work Score Accelerated v2
4169 puntos
ayuda
MSI PE60-2QEi581
GeForce GTX 960M, 4210H, HGST Travelstar 7K1000 HTS721010A9E630
Acer Aspire VN7-591G-727P
GeForce GTX 960M, 4720HQ, Toshiba HG6 THNSNJ256G8NU
Asus N551JK-CN166H
GeForce GTX 850M, 4200H, HGST Travelstar 5K1000 HTS541010A9E680
Asus UX501JW-DS71T
GeForce GTX 960M, 4720HQ, Samsung SSD SM951 512 GB MZHPV512HDGL
Toshiba Satellite P50t-B-10T
Radeon R9 M265X, 4710HQ, Toshiba MQ01ABD100
Dell XPS 15 (9530-0538)
GeForce GT 750M, 4712HQ, Lite-On LMT-512L9M
CrystalDiskMark 3.0
1948%
-35%
4343%
2811%
Read 4k
0.63
18.74
2875%
0.326
-48%
43.38
6786%
32.41
5044%
Write 4k
1.2
54.2
4417%
0.768
-36%
107
8817%
70.2
5750%
Read Seq
140.4
521
271%
102.3
-27%
1362
870%
485.2
246%
Write Seq
140.1
460.2
228%
102.3
-27%
1400
899%
425.4
204%
HGST Travelstar 7K1000 HTS721010A9E630
Tasa de Transferencia Mínima: 21.4 MB/s
Tasa de Transferencia Máxima: 147.7 MB/s
Tasa de Transferencia Promedio: 110 MB/s
Tiempo de Acceso: 18 ms
Velocidad de Ráfagas: 240.8 MB/s
Uso de CPU: 2.7 %
3DMark
1920x1080 Fire Strike Score (ordenar por valor)
MSI PE60-2QEi581
3778 Points
Acer Aspire VN7-591G-727P
3914 Points +4%
Asus N551JK-CN166H
2675 Points -29%
Asus UX501JW-DS71T
3801 Points +1%
Toshiba Satellite P50t-B-10T
1585 Points -58%
Dell XPS 15 (9530-0538)
2049 Points -46%
1920x1080 Fire Strike Combined (ordenar por valor)
MSI PE60-2QEi581
1649 Points
Acer Aspire VN7-591G-727P
1669 Points +1%
Asus N551JK-CN166H
1028 Points -38%
Asus UX501JW-DS71T
1694 Points +3%
Toshiba Satellite P50t-B-10T
661 Points -60%
Dell XPS 15 (9530-0538)
837 Points -49%
1920x1080 Fire Strike Graphics (ordenar por valor)
MSI PE60-2QEi581
4355 Points
Acer Aspire VN7-591G-727P
4173 Points -4%
Asus N551JK-CN166H
3054 Points -30%
Asus UX501JW-DS71T
4063 Points -7%
Toshiba Satellite P50t-B-10T
1619 Points -63%
Dell XPS 15 (9530-0538)
2141 Points -51%
1920x1080 Fire Strike Physics (ordenar por valor)
MSI PE60-2QEi581
4713 Points
Acer Aspire VN7-591G-727P
9467 Points +101%
Asus N551JK-CN166H
4846 Points +3%
Asus UX501JW-DS71T
7728 Points +64%
Toshiba Satellite P50t-B-10T
9226 Points +96%
Dell XPS 15 (9530-0538)
8315 Points +76%
1280x720 Cloud Gate Standard Score (ordenar por valor)
MSI PE60-2QEi581
10596 Points
Acer Aspire VN7-591G-727P
16151 Points +52%
Asus N551JK-CN166H
9818 Points -7%
Asus UX501JW-DS71T
13410 Points +27%
Toshiba Satellite P50t-B-10T
9555 Points -10%
Dell XPS 15 (9530-0538)
10521 Points -1%
1280x720 Cloud Gate Standard Graphics (ordenar por valor)
MSI PE60-2QEi581
28308 Points
Acer Aspire VN7-591G-727P
27352 Points -3%
Asus N551JK-CN166H
21589 Points -24%
Asus UX501JW-DS71T
22468 Points -21%
Toshiba Satellite P50t-B-10T
10995 Points -61%
Dell XPS 15 (9530-0538)
13691 Points -52%
1280x720 Cloud Gate Standard Physics (ordenar por valor)
MSI PE60-2QEi581
3322 Points
Acer Aspire VN7-591G-727P
6638 Points +100%
Asus N551JK-CN166H
3376 Points +2%
Asus UX501JW-DS71T
5562 Points +67%
Toshiba Satellite P50t-B-10T
6552 Points +97%
Dell XPS 15 (9530-0538)
5812 Points +75%
3DMark 11
1280x720 Performance (ordenar por valor)
MSI PE60-2QEi581
4999 Points
Acer Aspire VN7-591G-727P
5398 Points +8%
Asus N551JK-CN166H
4255 Points -15%
Asus UX501JW-DS71T
5342 Points +7%
Dell XPS 15 (9530-0538)
2971 Points -41%
1280x720 Performance GPU (ordenar por valor)
MSI PE60-2QEi581
5405 Points
Acer Aspire VN7-591G-727P
5901 Points +9%
Asus N551JK-CN166H
4369 Points -19%
Asus UX501JW-DS71T
5095 Points -6%
Dell XPS 15 (9530-0538)
2718 Points -50%
1280x720 Performance Physics (ordenar por valor)
MSI PE60-2QEi581
4010 Points
Acer Aspire VN7-591G-727P
8097 Points +102%
Asus N551JK-CN166H
4163 Points +4%
Asus UX501JW-DS71T
7188 Points +79%
Dell XPS 15 (9530-0538)
7538 Points +88%
1280x720 Performance Combined (ordenar por valor)
MSI PE60-2QEi581
4190 Points
Acer Aspire VN7-591G-727P
5153 Points +23%
Asus N551JK-CN166H
3662 Points -13%
Asus UX501JW-DS71T
5230 Points +25%
Dell XPS 15 (9530-0538)
2459 Points -41%

Leyenda

 
MSI PE60-2QEi581 Intel Core i5-4210H, NVIDIA GeForce GTX 960M, HGST Travelstar 7K1000 HTS721010A9E630
 
Acer Aspire VN7-591G-727P Intel Core i7-4720HQ, NVIDIA GeForce GTX 960M, Toshiba HG6 THNSNJ256G8NU
 
Asus N551JK-CN166H Intel Core i5-4200H, NVIDIA GeForce GTX 850M, HGST Travelstar 5K1000 HTS541010A9E680
 
Asus UX501JW-DS71T Intel Core i7-4720HQ, NVIDIA GeForce GTX 960M, Samsung SSD SM951 512 GB MZHPV512HDGL
 
Toshiba Satellite P50t-B-10T Intel Core i7-4710HQ, AMD Radeon R9 M265X, Toshiba MQ01ABD100
 
Dell XPS 15 (9530-0538) Intel Core i7-4712HQ, NVIDIA GeForce GT 750M, Lite-On LMT-512L9M
3DMark 11 Performance
4999 puntos
3DMark Ice Storm Standard Score
51289 puntos
3DMark Cloud Gate Standard Score
10596 puntos
3DMark Fire Strike Score
3778 puntos
ayuda
Alien: Isolation
1366x768 Medium, On (AA & SSAO Off), Shadow Map 1024 AF:4x (ordenar por valor)
MSI PE60-2QEi581
GeForce GTX 960M, 4210H, HGST Travelstar 7K1000 HTS721010A9E630
109 fps
1920x1080 High, On, Shadow Map 1536, Standard SSAO AA:FX AF:8x (ordenar por valor)
MSI PE60-2QEi581
GeForce GTX 960M, 4210H, HGST Travelstar 7K1000 HTS721010A9E630
62 fps
1920x1080 Ultra, On, Shadow Map 2048, HDAO AA:2x SM AF:16x (ordenar por valor)
MSI PE60-2QEi581
GeForce GTX 960M, 4210H, HGST Travelstar 7K1000 HTS721010A9E630
46.5 fps
F1 2014
1366x768 Medium Preset (ordenar por valor)
MSI PE60-2QEi581
GeForce GTX 960M, 4210H, HGST Travelstar 7K1000 HTS721010A9E630
83 fps
Acer Aspire VN7-591G-727P
GeForce GTX 960M, 4720HQ, Toshiba HG6 THNSNJ256G8NU
118 fps +42%
1920x1080 High Preset (ordenar por valor)
MSI PE60-2QEi581
GeForce GTX 960M, 4210H, HGST Travelstar 7K1000 HTS721010A9E630
72 fps
Acer Aspire VN7-591G-727P
GeForce GTX 960M, 4720HQ, Toshiba HG6 THNSNJ256G8NU
115 fps +60%
1920x1080 Ultra Preset AA:4x MS (ordenar por valor)
MSI PE60-2QEi581
GeForce GTX 960M, 4210H, HGST Travelstar 7K1000 HTS721010A9E630
62 fps
Acer Aspire VN7-591G-727P
GeForce GTX 960M, 4720HQ, Toshiba HG6 THNSNJ256G8NU
87 fps +40%
Evolve
1366x768 Medium Graphics Quality (ordenar por valor)
MSI PE60-2QEi581
GeForce GTX 960M, 4210H, HGST Travelstar 7K1000 HTS721010A9E630
65.6 fps
Acer Aspire VN7-591G-727P
GeForce GTX 960M, 4720HQ, Toshiba HG6 THNSNJ256G8NU
63 fps -4%
1920x1080 High Graphics Quality AA:FX (ordenar por valor)
MSI PE60-2QEi581
GeForce GTX 960M, 4210H, HGST Travelstar 7K1000 HTS721010A9E630
35.5 fps
Acer Aspire VN7-591G-727P
GeForce GTX 960M, 4720HQ, Toshiba HG6 THNSNJ256G8NU
34.7 fps -2%
1920x1080 Very High Graphics Quality AA:1TX SM (ordenar por valor)
MSI PE60-2QEi581
GeForce GTX 960M, 4210H, HGST Travelstar 7K1000 HTS721010A9E630
31.1 fps
Acer Aspire VN7-591G-727P
GeForce GTX 960M, 4720HQ, Toshiba HG6 THNSNJ256G8NU
30.4 fps -2%
bajo medio alto ultra
Alien: Isolation (2014) 109 62 46.5
F1 2014 (2014) 83 72 62
Evolve (2015) 65.6 35.5 31.1
MSI PE60-2QEi581
GeForce GTX 960M, 4210H, HGST Travelstar 7K1000 HTS721010A9E630
Acer Aspire VN7-591G-727P
GeForce GTX 960M, 4720HQ, Toshiba HG6 THNSNJ256G8NU
Asus N551JK-CN166H
GeForce GTX 850M, 4200H, HGST Travelstar 5K1000 HTS541010A9E680
Asus UX501JW-DS71T
GeForce GTX 960M, 4720HQ, Samsung SSD SM951 512 GB MZHPV512HDGL
Toshiba Satellite P50t-B-10T
Radeon R9 M265X, 4710HQ, Toshiba MQ01ABD100
Dell XPS 15 (9530-0538)
GeForce GT 750M, 4712HQ, Lite-On LMT-512L9M
Noise
5%
3%
5%
1%
4%
Idle Minimum *
32.8
30
9%
32.1
2%
31.2
5%
32.4
1%
29.6
10%
Idle Average *
32.8
32.2
2%
32.9
-0%
31.3
5%
33.4
-2%
31.6
4%
Idle Maximum *
35.4
35
1%
33.7
5%
33.4
6%
33.4
6%
31.6
11%
Load Average *
42.3
41.7
1%
42
1%
38.6
9%
44.5
-5%
45.4
-7%
Load Maximum *
47.4
42.6
10%
44.8
5%
46.5
2%
44.4
6%
45.4
4%

* ... más pequeño es mejor

Ruido

Ocioso
32.8 / 32.8 / 35.4 dB(A)
HDD
33.6 dB(A)
DVD
37.7 / dB(A)
Carga
42.3 / 47.4 dB(A)
  red to green bar
 
 
30 dB
silencioso
40 dB(A)
audible
50 dB(A)
ruidosamente alto
 
min: dark, med: mid, max: light   Voltcraft sl-320 (15 cm de distancia)
MSI PE60-2QEi581
GeForce GTX 960M, 4210H, HGST Travelstar 7K1000 HTS721010A9E630
Acer Aspire VN7-591G-727P
GeForce GTX 960M, 4720HQ, Toshiba HG6 THNSNJ256G8NU
Asus N551JK-CN166H
GeForce GTX 850M, 4200H, HGST Travelstar 5K1000 HTS541010A9E680
Asus UX501JW-DS71T
GeForce GTX 960M, 4720HQ, Samsung SSD SM951 512 GB MZHPV512HDGL
Toshiba Satellite P50t-B-10T
Radeon R9 M265X, 4710HQ, Toshiba MQ01ABD100
Dell XPS 15 (9530-0538)
GeForce GT 750M, 4712HQ, Lite-On LMT-512L9M
Heat
-21%
17%
-1%
5%
-27%
Maximum Upper Side *
45.5
53
-16%
39.4
13%
42.2
7%
43.5
4%
51.8
-14%
Maximum Bottom *
37.5
53.2
-42%
37.6
-0%
48.6
-30%
46
-23%
64.6
-72%
Idle Upper Side *
35.8
38.6
-8%
28.7
20%
33.2
7%
28
22%
38.4
-7%
Idle Bottom *
38.7
45.9
-19%
26.1
33%
34.4
11%
32.8
15%
44.4
-15%

* ... más pequeño es mejor

Carga Máx.
 41.1 °C42.6 °C41.3 °C 
 36.6 °C45.5 °C38.1 °C 
 31.6 °C38.8 °C29.1 °C 
Máximo: 45.5 °C
Médio: 38.3 °C
36.2 °C33.3 °C35.4 °C
27.8 °C36.1 °C36.5 °C
25.7 °C27.6 °C37.5 °C
Máximo: 37.5 °C
Médio: 32.9 °C
Conector de corriente  55.2 °C | Temperatura del cuarto 22.9 °C | Voltcraft IR-360
(-) The average temperature for the upper side under maximal load is 38.3 °C / 101 F, compared to the average of 31.2 °C / 88 F for the devices in the class Multimedia.
(-) The maximum temperature on the upper side is 45.5 °C / 114 F, compared to the average of 36.9 °C / 98 F, ranging from 21.1 to 71 °C for the class Multimedia.
(+) The bottom heats up to a maximum of 37.5 °C / 100 F, compared to the average of 39.1 °C / 102 F
(±) In idle usage, the average temperature for the upper side is 32.2 °C / 90 F, compared to the device average of 31.2 °C / 88 F.
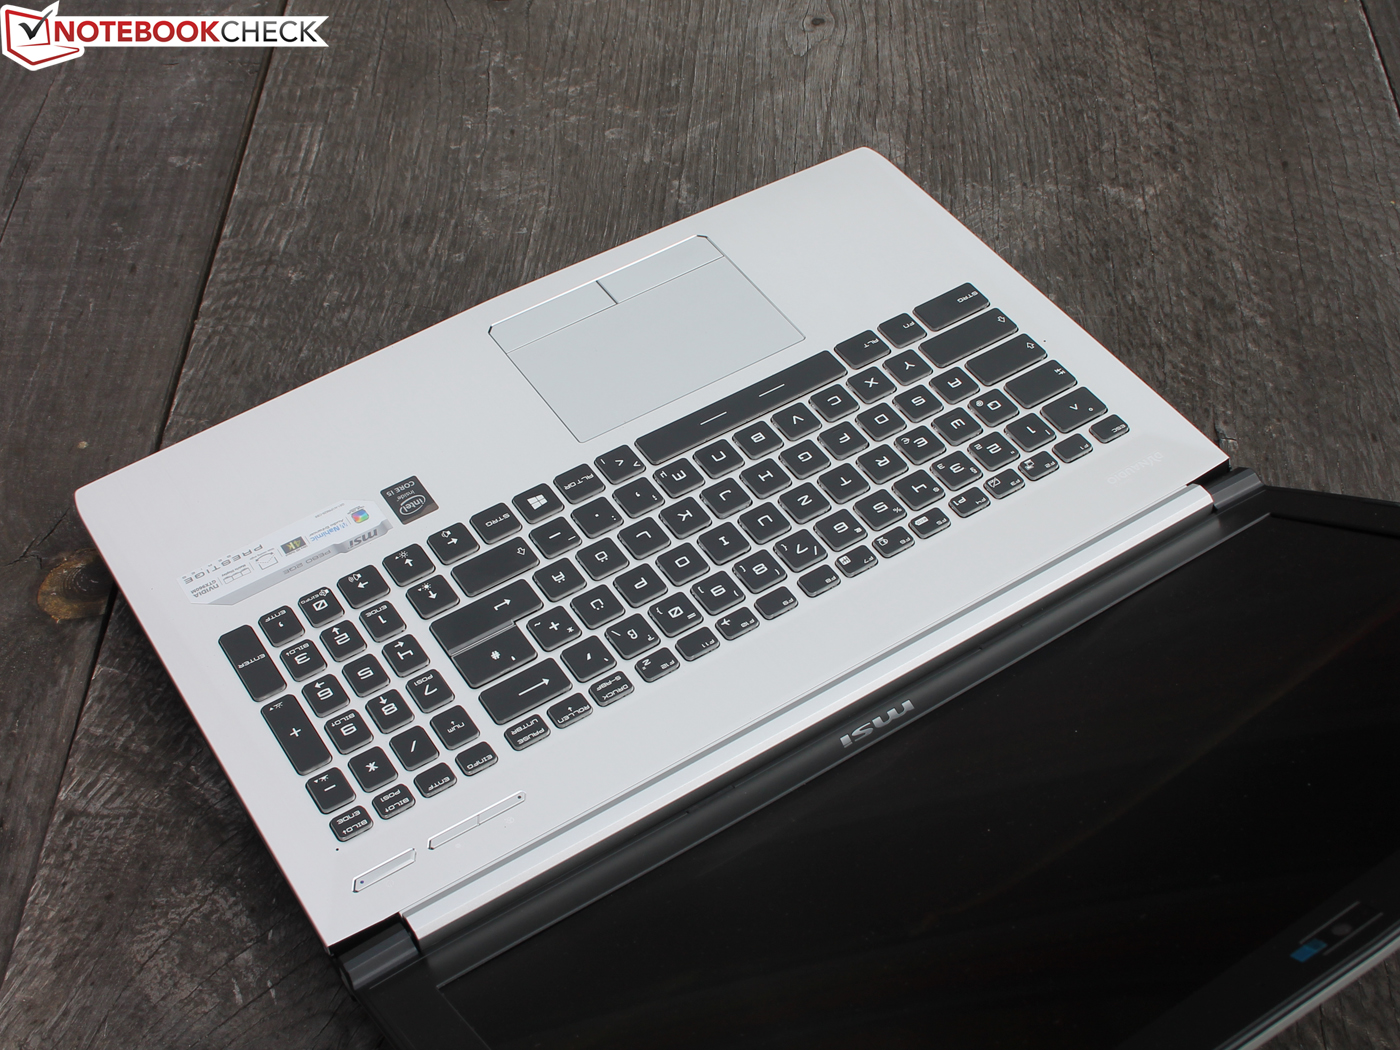
(±) The palmrests and touchpad can get very hot to the touch with a maximum of 38.8 °C / 101.8 F.
(-) The average temperature of the palmrest area of similar devices was 28.8 °C / 83.8 F (-10 °C / -18 F).
MSI PE60-2QEi581
GeForce GTX 960M, 4210H, HGST Travelstar 7K1000 HTS721010A9E630
Acer Aspire VN7-591G-727P
GeForce GTX 960M, 4720HQ, Toshiba HG6 THNSNJ256G8NU
Asus N551JK-CN166H
GeForce GTX 850M, 4200H, HGST Travelstar 5K1000 HTS541010A9E680
Toshiba Satellite P50t-B-10T
Radeon R9 M265X, 4710HQ, Toshiba MQ01ABD100
Dell XPS 15 (9530-0538)
GeForce GT 750M, 4712HQ, Lite-On LMT-512L9M
Power Consumption
10%
39%
28%
22%
Idle Minimum *
21.8
16.2
26%
8.6
61%
12.8
41%
14.6
33%
Idle Average *
26.1
20.2
23%
12
54%
18.8
28%
19.6
25%
Idle Maximum *
26.6
22.8
14%
13
51%
19
29%
19.8
26%
Load Average *
88.5
96.4
-9%
72.2
18%
66.7
25%
92
-4%
Load Maximum *
119.7
126.9
-6%
104
13%
99.1
17%
85.8
28%

* ... más pequeño es mejor

Consumo de corriente
Off / Standbydarklight 0.1 / 0.4 Watt
Ociosodarkmidlight 21.8 / 26.1 / 26.6 Watt
Carga midlight 88.5 / 119.7 Watt
 color bar
Clave: min: dark, med: mid, max: light        Voltcraft VC 960
Currently we use the Metrahit Energy, a professional single phase power quality and energy measurement digital multimeter, for our measurements. Find out more about it here. All of our test methods can be found here.
Duración de Batería
WiFi v1.3 (ordenar por valor)
MSI PE60-2QEi581
GeForce GTX 960M, 4210H, HGST Travelstar 7K1000 HTS721010A9E630
168 min
Acer Aspire VN7-591G-727P
GeForce GTX 960M, 4720HQ, Toshiba HG6 THNSNJ256G8NU
166 min
Asus UX501JW-DS71T
GeForce GTX 960M, 4720HQ, Samsung SSD SM951 512 GB MZHPV512HDGL
263 min
Dell XPS 15 (9530-0538)
GeForce GT 750M, 4712HQ, Lite-On LMT-512L9M
314 min
WiFi (ordenar por valor)
Asus N551JK-CN166H
GeForce GTX 850M, 4200H, HGST Travelstar 5K1000 HTS541010A9E680
271 min
Toshiba Satellite P50t-B-10T
Radeon R9 M265X, 4710HQ, Toshiba MQ01ABD100
152 min
Tiempo de Ejecución de la Batería
Ocioso (sin WLAN, min brillo)
5h 45min
WiFi Websurfing
2h 48min
Carga (máximo brillo)
1h 25min

Pro

+ Espacio de color sRGB
+ Contraste y ángulos de visión
+ Gran rendimiento de sistema
+ Fuerte uso del Turbo
+ Fuerte respuesta del teclado
+ Unidad óptica
+ Decentes altavoces con subwoofer
+ Interfaces especiales (audio, DisplayPort)
+ Ranura vacía M.2 para SSD
+ Adecuado para jugar a juegos actuales

Contra

- Webcam inútil
- Base de plástico simple
- Fuerte repiqueteo de las teclas de ratón
- Poco aguante de batería
MSI PE60 2QE Prestige. Modelo de pruebas cortesía de Cyberport

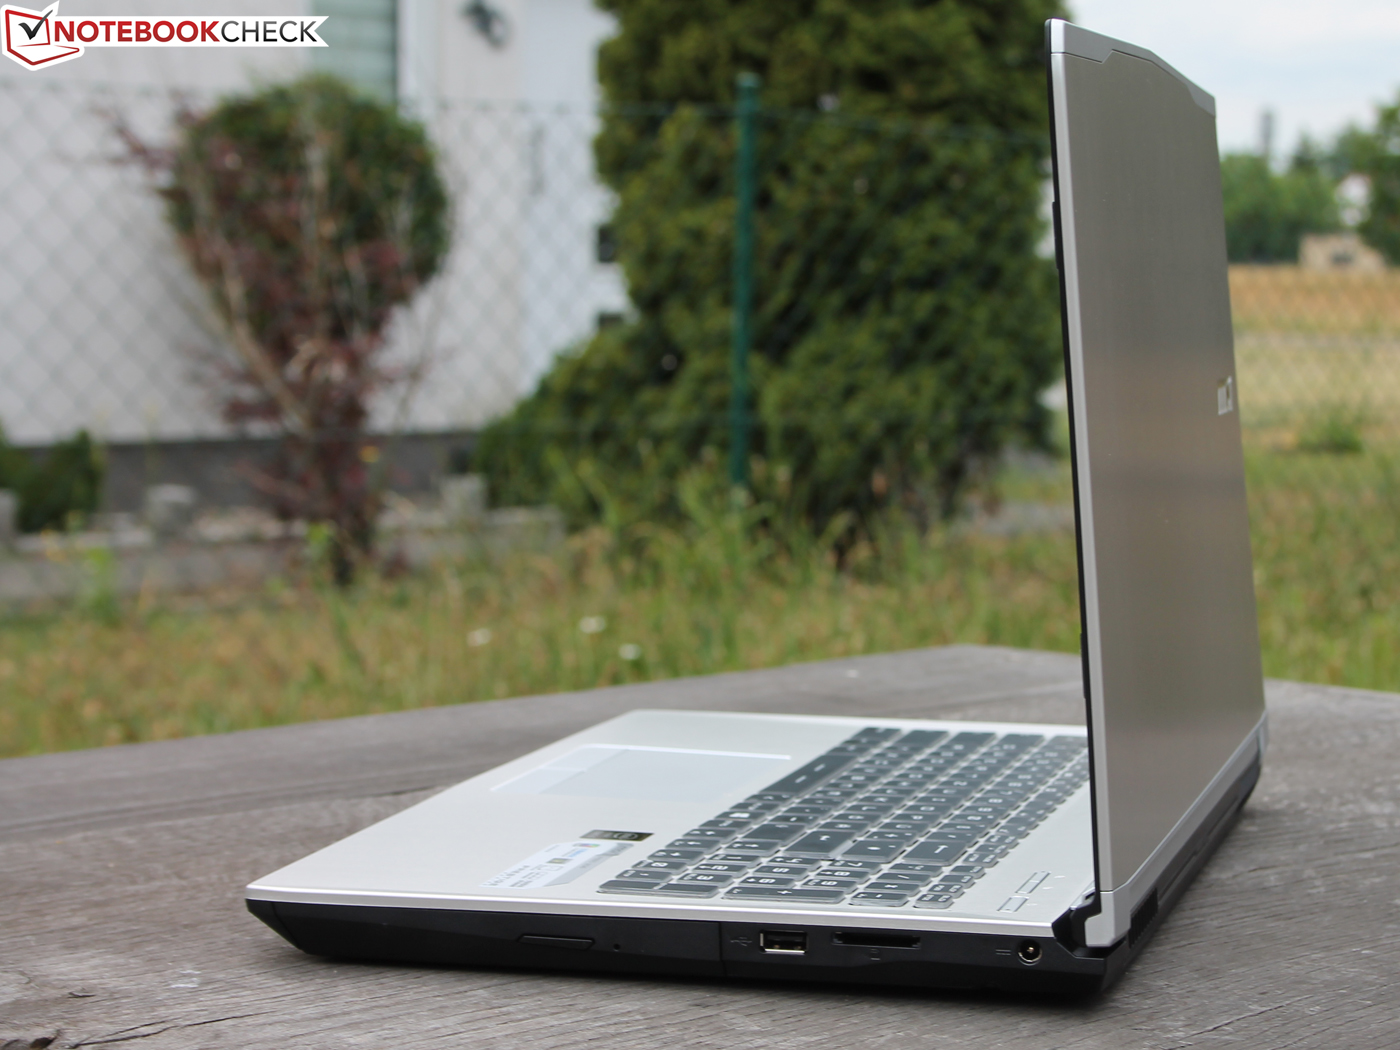
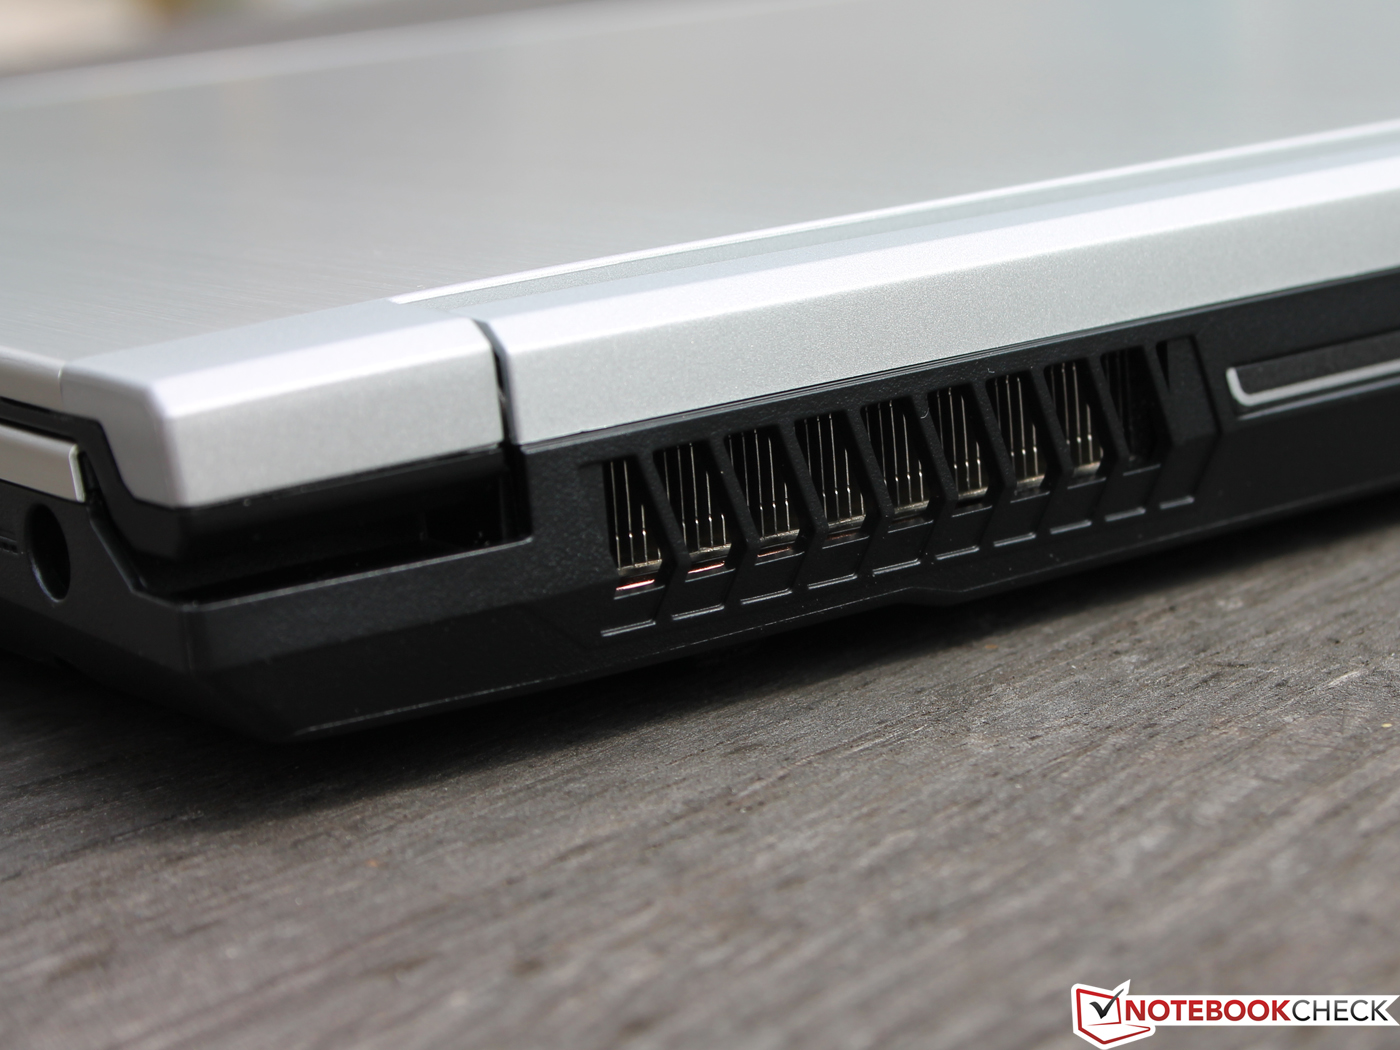
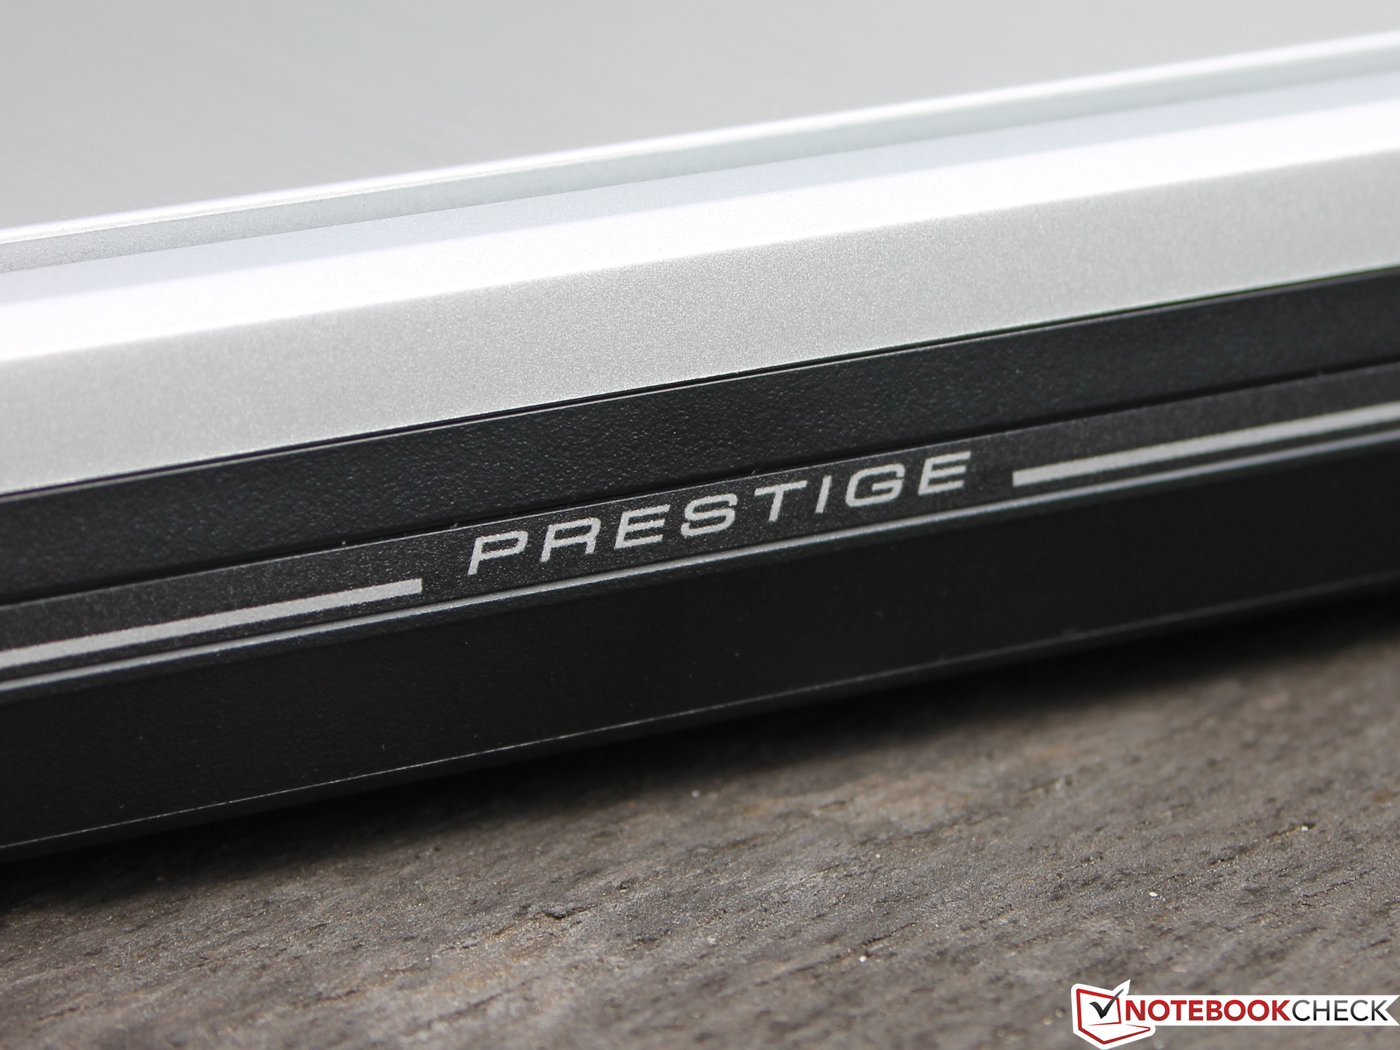
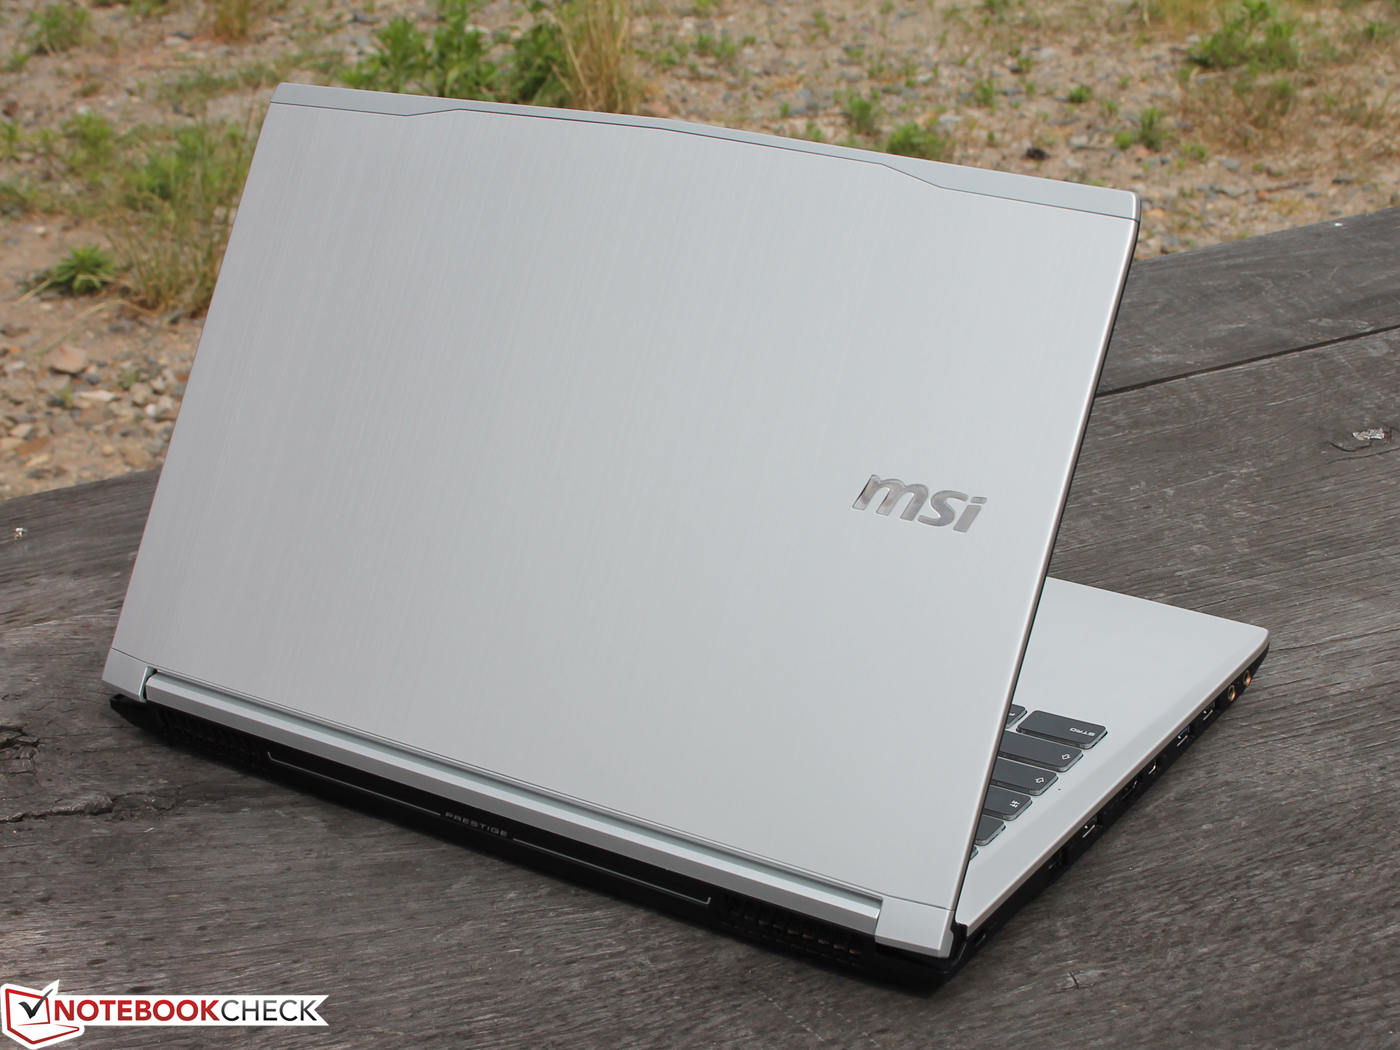
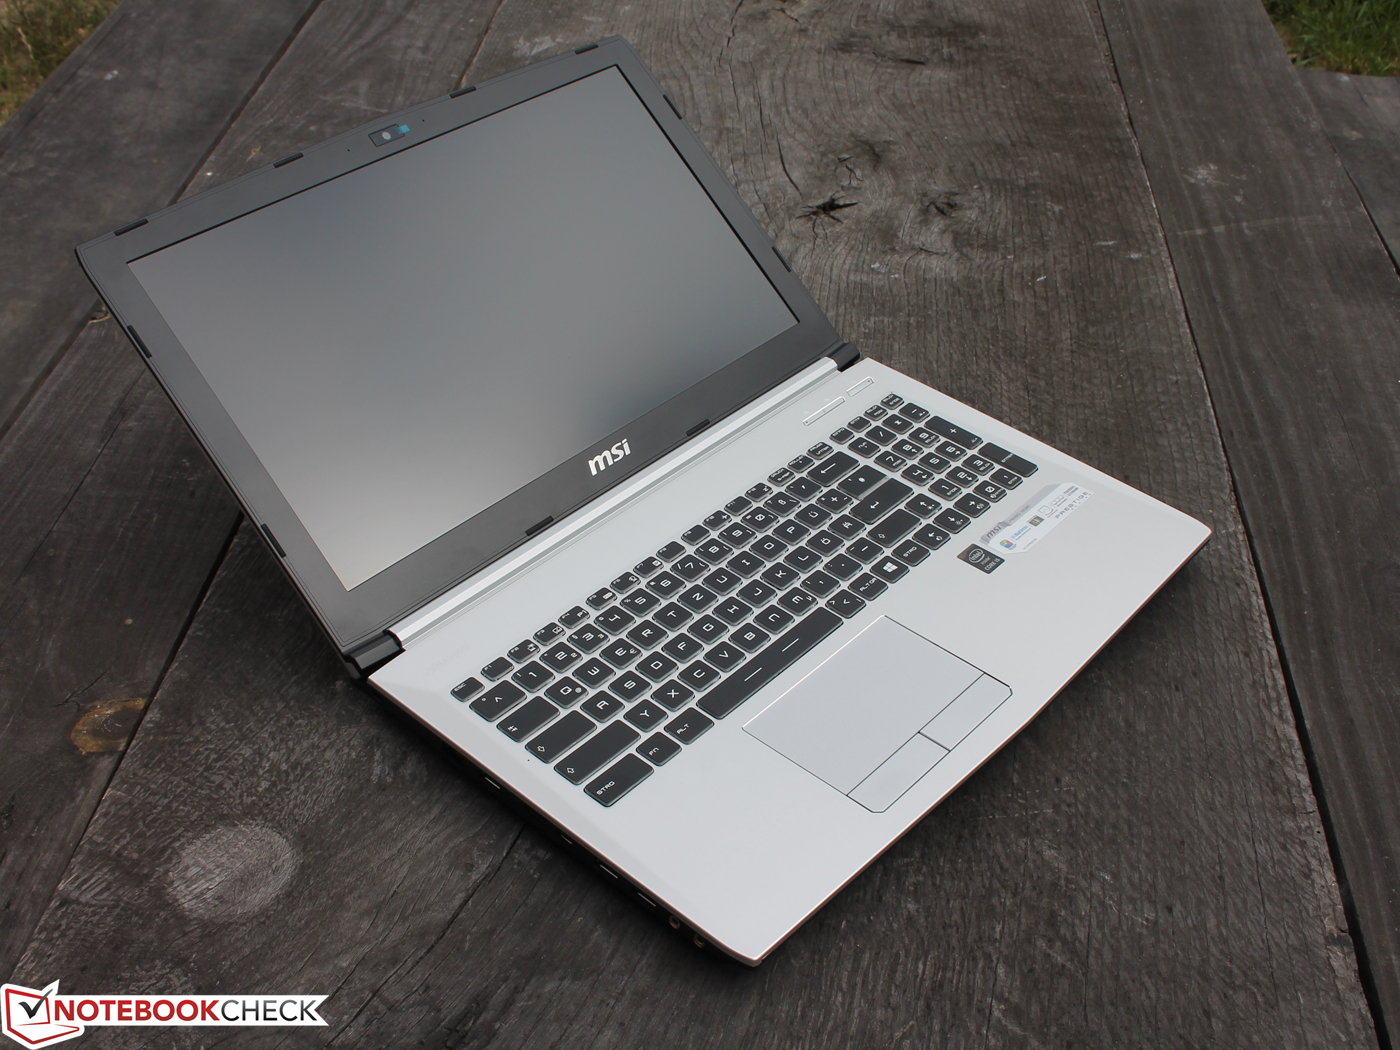
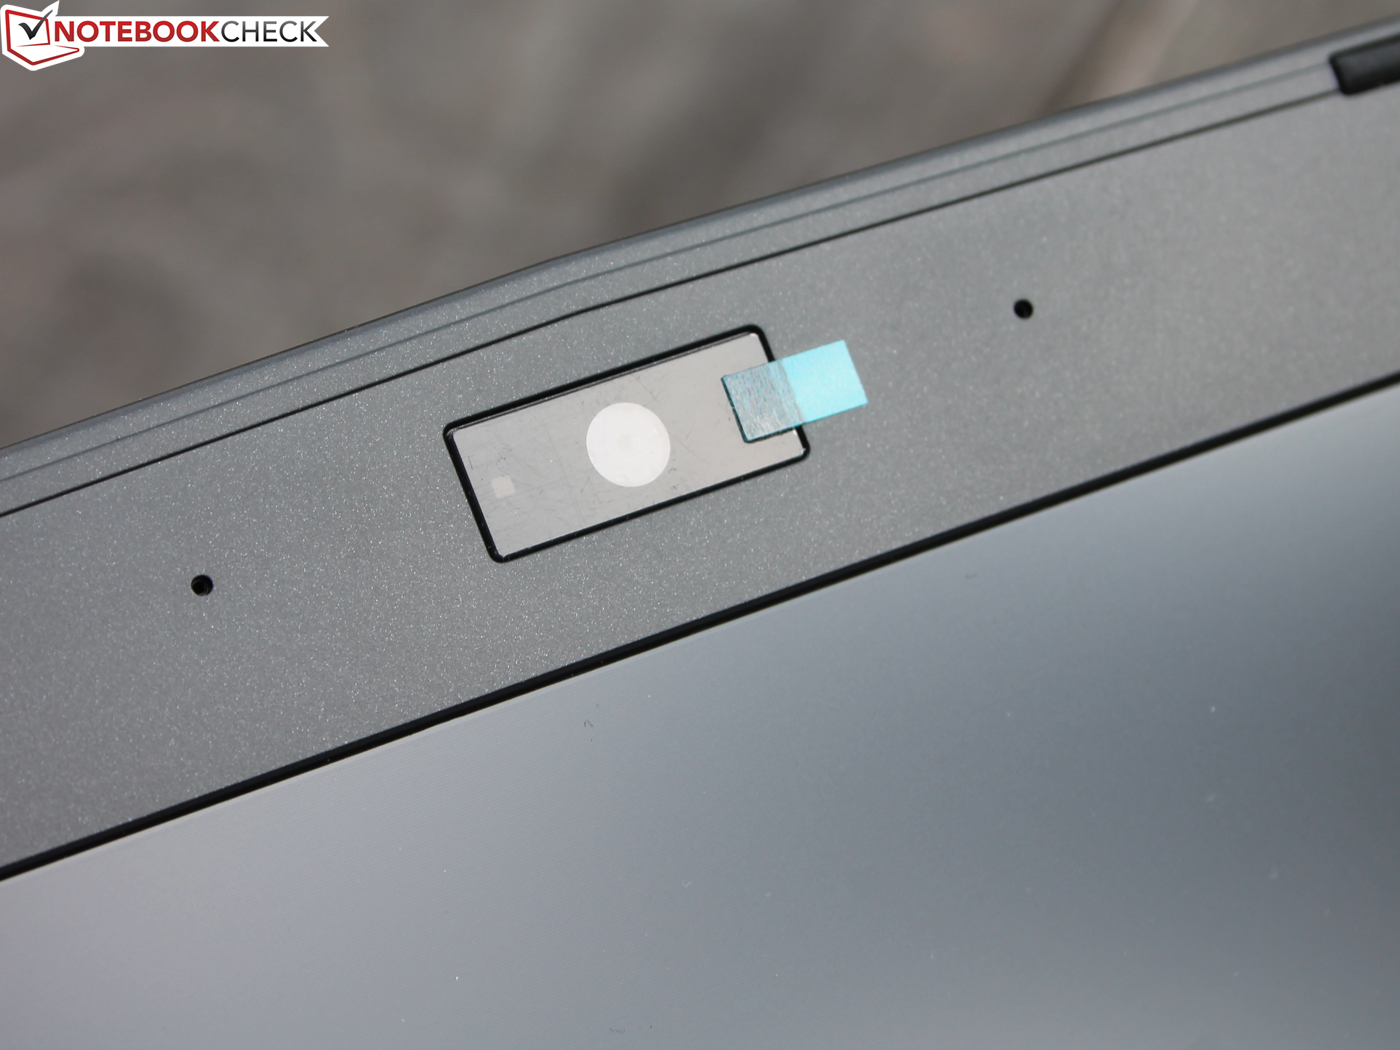
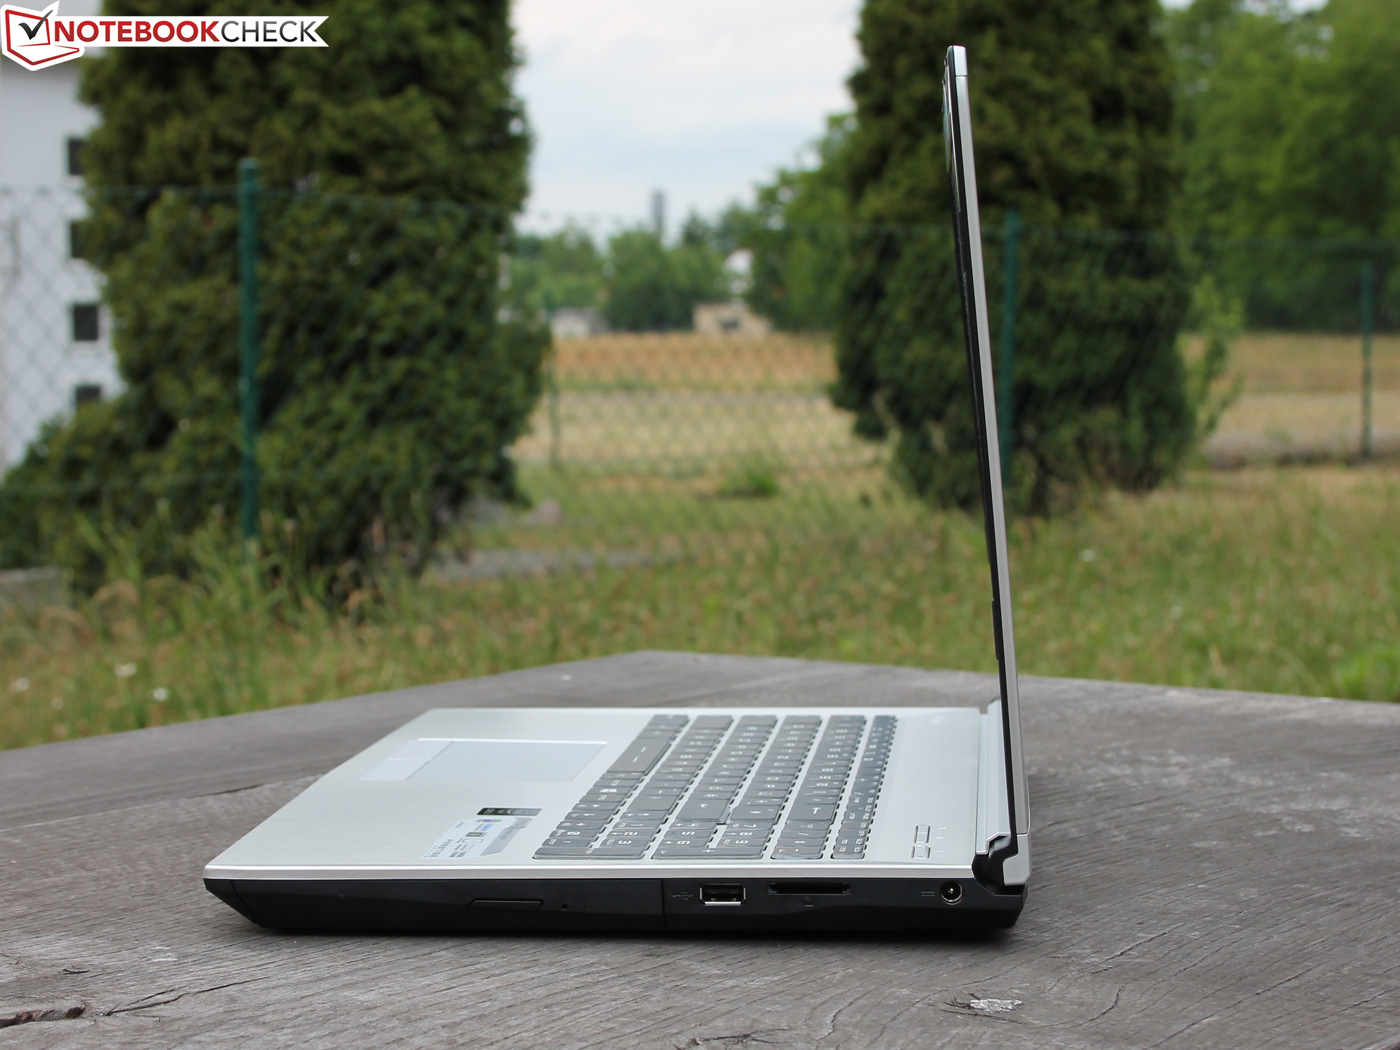
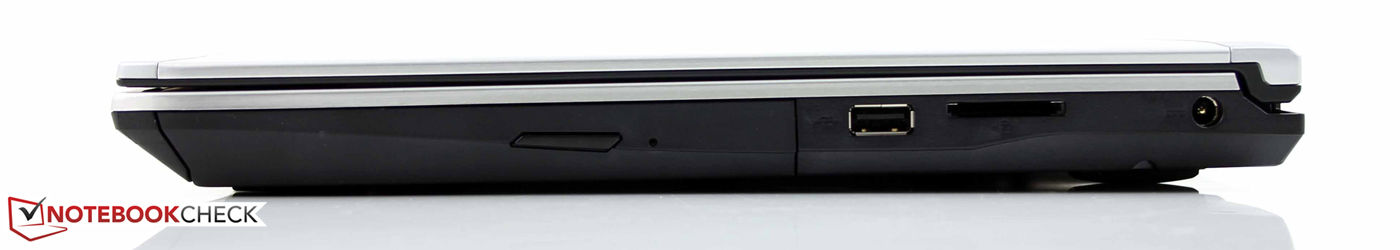
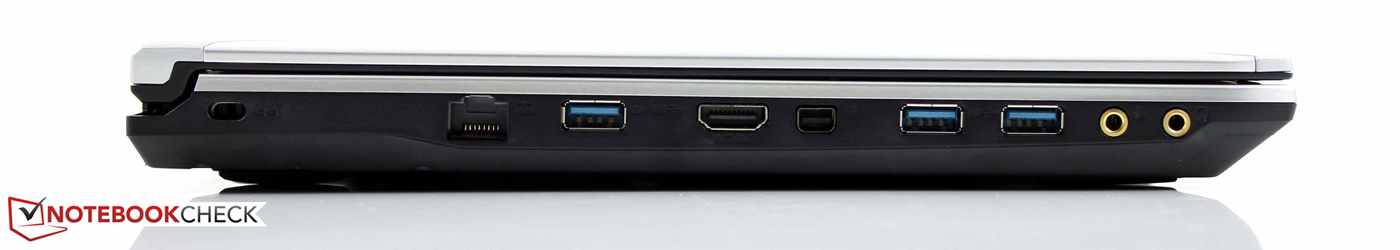
MSI se ha esforzado mucho en ganar cuota de mercado del sector de portátiles premium de gama alta con su serie Prestige. La pantalla PLS de Samsung con la cobertura sRGB y ángulos de visión de primera y superficie mate es uno de sus mayores activos. La adecuabilidad para jugar juegos actuales en configuraciones altas y un sorprendentemente potente rendimiento de sistema con un HDD de 7200-rpm siguen el mismo camino. El sistema de ventilación de doble ventilador asegura temperaturas moderadas  a un nivel de ruido aceptable. Sin embargo, el consumo en inactivo es bastante mayor que el de la competencia. Por otro lado, los altavoces altavoces de 4 vías y el subwoofer son dignos de un auténtico portátil multimedia (perfil Nahimic Audio). Lo mismo va por la diversidad de interfaces (DisplayPort, 2 clavijas de audio chapadas en oro), pero no por la escasa calidad de imagen de la webcam. Hasta se puede hacer mantenimiento al compacto PE60, y se puede, por ejemplo, añadir un SSD a su ranura M.2.

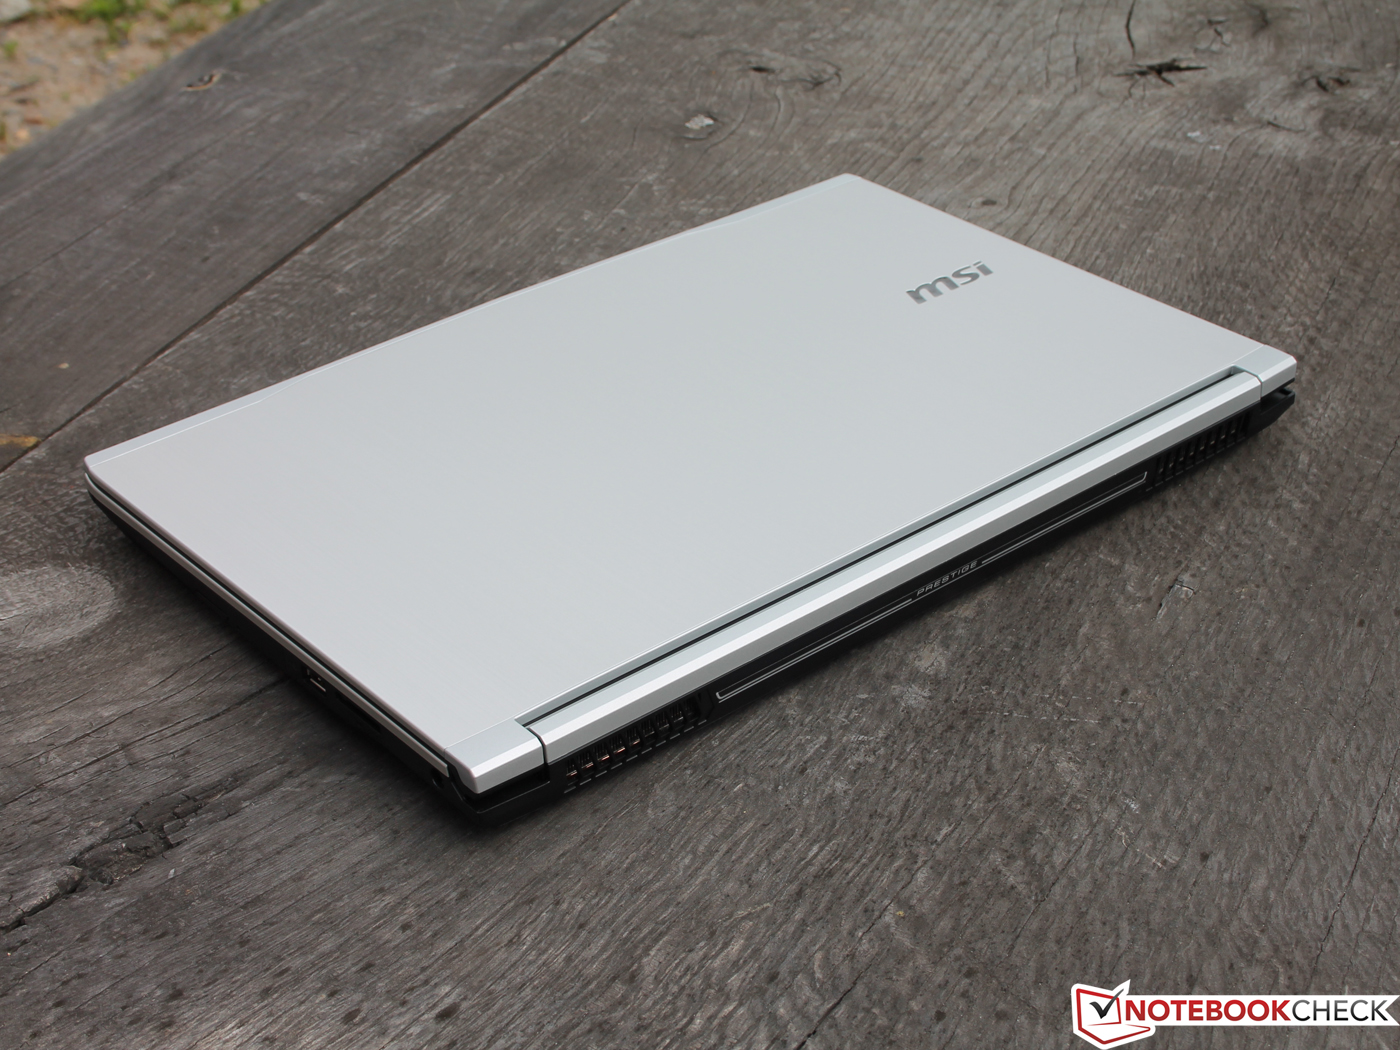
El chasis de plástico relativamente sencillo y el escaso aguante de la batería de menos de 3 hroas son los defectos. El ZenBook UX501 y el Dell XPS 15 tienen una clara ventaja aquí. El XPS 15 no ganará la comparación con su antiquísima GeForce GT 750M. El ZenBook Pro UX501 es bastante más caro con un precio inicial de 1600 Euros. Así, Acer Aspire VN7-591G Black Edition (1600 Euros, 4K; configuración FHD mucho más barata, GTX 860M), Asus N551JK(desde 990 Euros, GTX 850M), y Toshiba Satellite P50t-B-10T (1400 Euros, 4K, Radeon R9 M265X) son probablemente los rivales más atractivos.

Ésta es una versión acortada del análisis original. Puedes leer el análisis completo en inglés aquí.

MSI PE60-2QEi581 - 03/25/2016 v5(old)
Sebastian Jentsch

Acabado
87 / 98 → 89%
Teclado
90%
Ratón
72%
Conectividad
59 / 81 → 72%
Peso
61 / 20-67 → 87%
Battería
68%
Pantalla
92%
Rendimiento de juegos
77 / 85 → 91%
Rendimiento de la Aplicación
68 / 92 → 74%
Temperatura
89%
Ruido
75 / 95 → 79%
Audio
75%
Cámara
31 / 85 → 37%
Médio
73%
83%
Multimedia - media ponderada

Pricecompare

Please share our article, every link counts!
Sebastian Jentsch, 2015-07- 4 (Update: 2015-07- 4)