 Deutsch
 English
 Español
 Français
 Italiano
 Nederlands
 Polski
 Português
 Русский
 Türkçe
 Svenska
 Chinese
 Magyar
Breve análisis del portátil Asus ASUSPRO Advanced B8430UA-FA0084E

| |||||||||||||||||||||||||
iluminación: 87 %
Brillo con batería: 213 cd/m²
Contraste: 525:1 (Negro: 0.4 cd/m²)
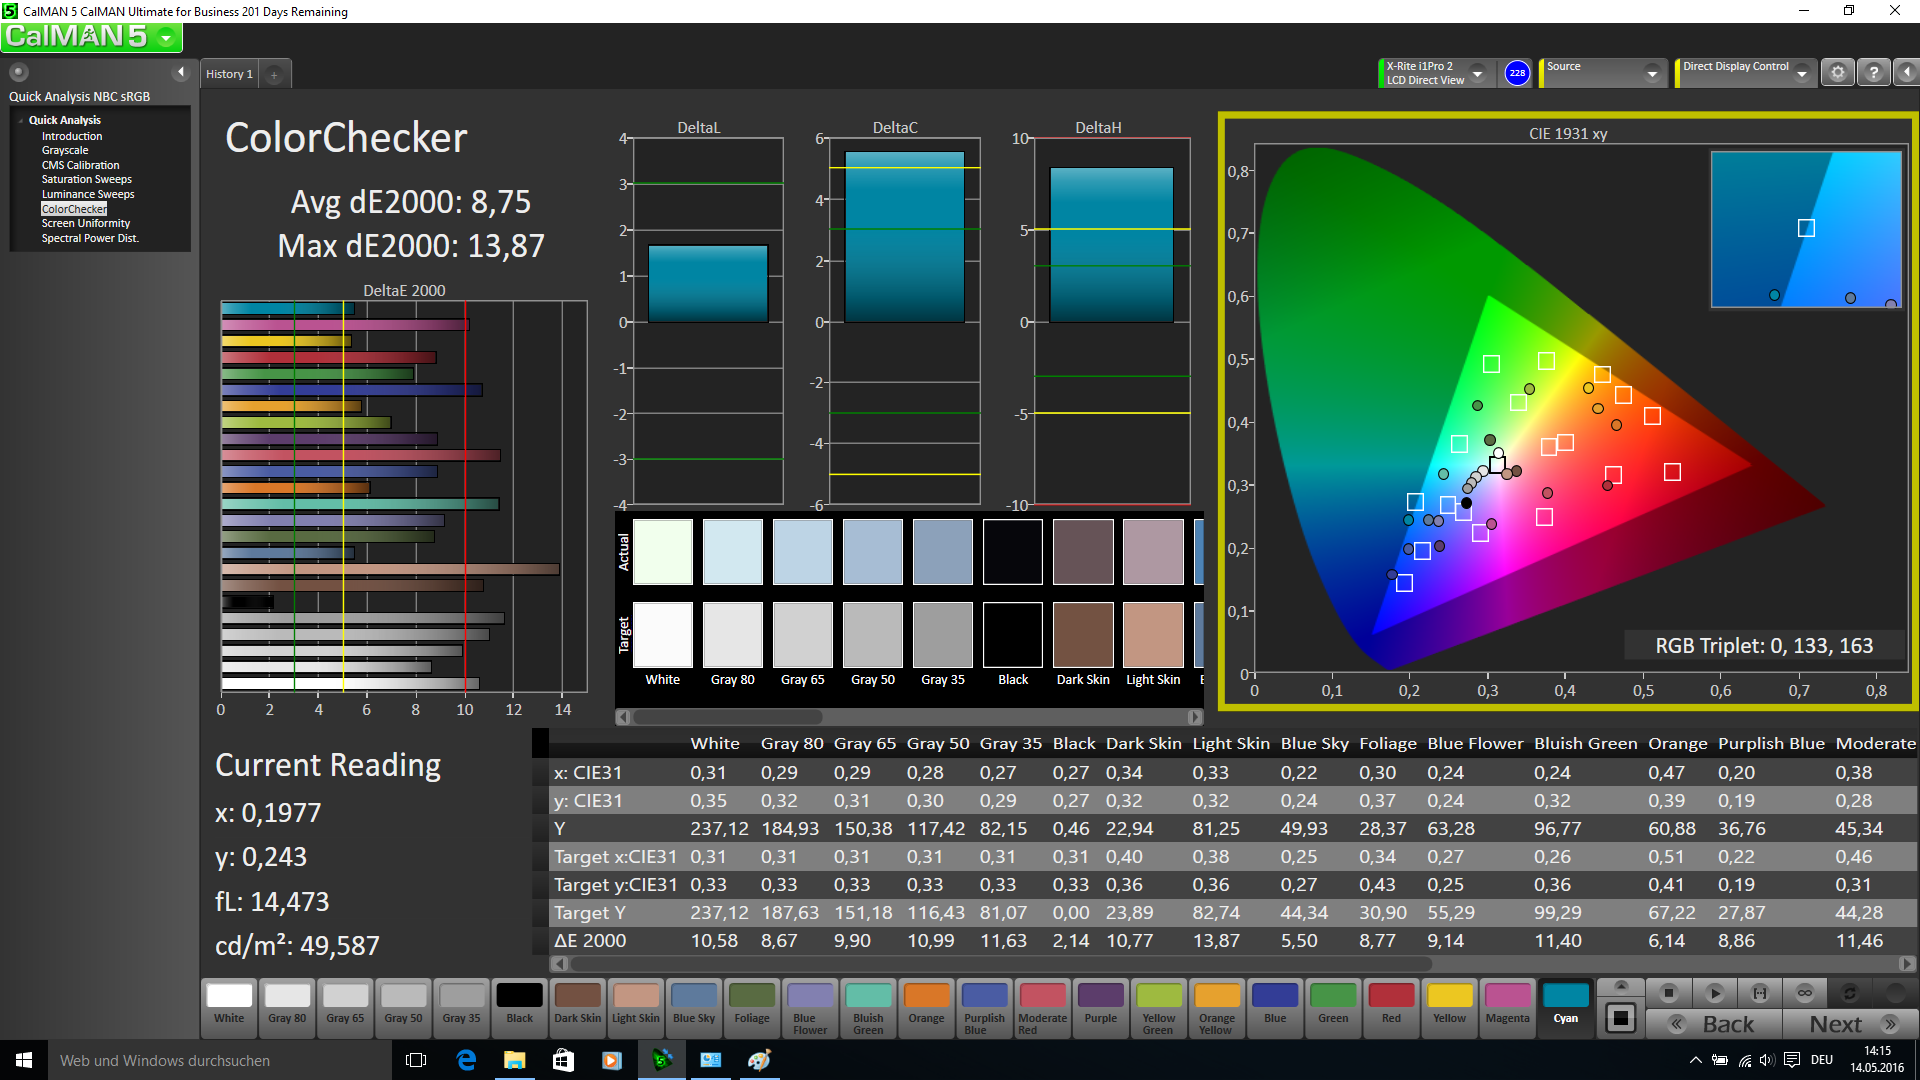
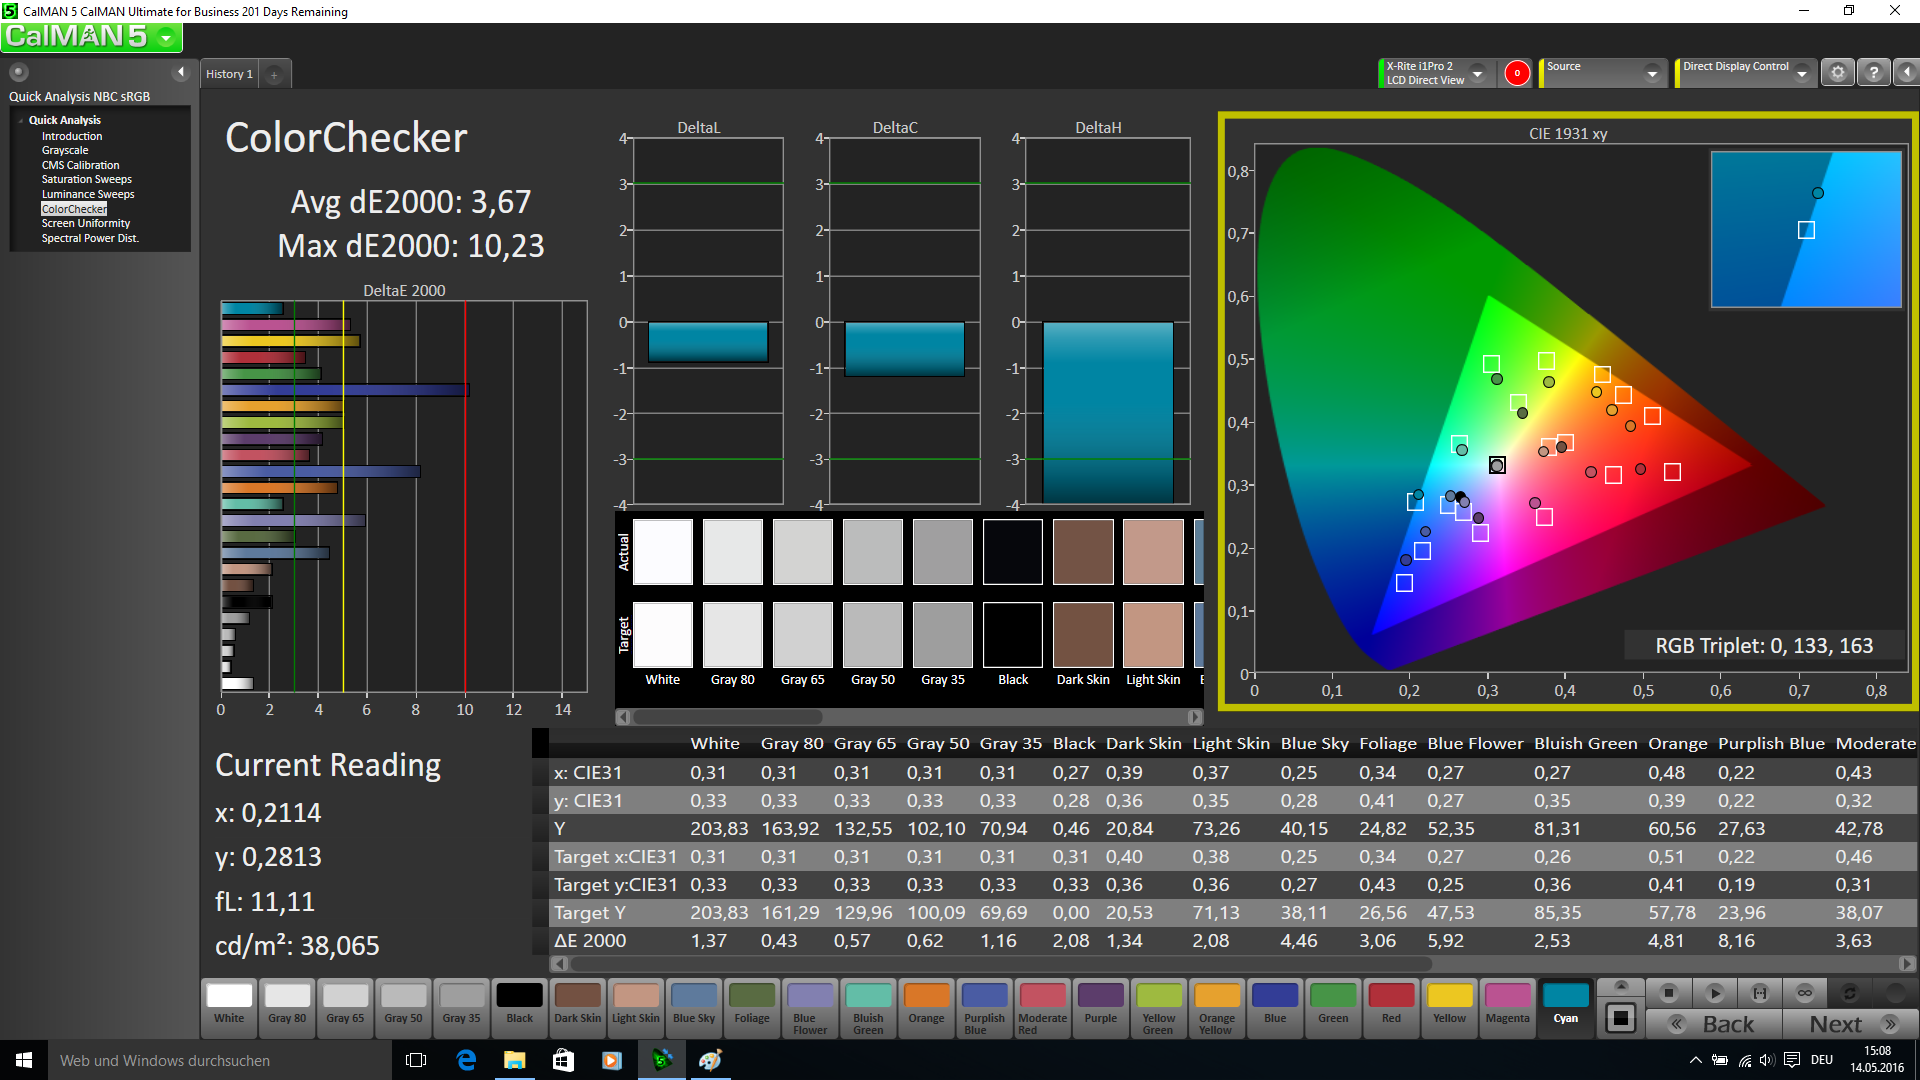
ΔE Color 8.75 | 0.5-29.43 Ø5
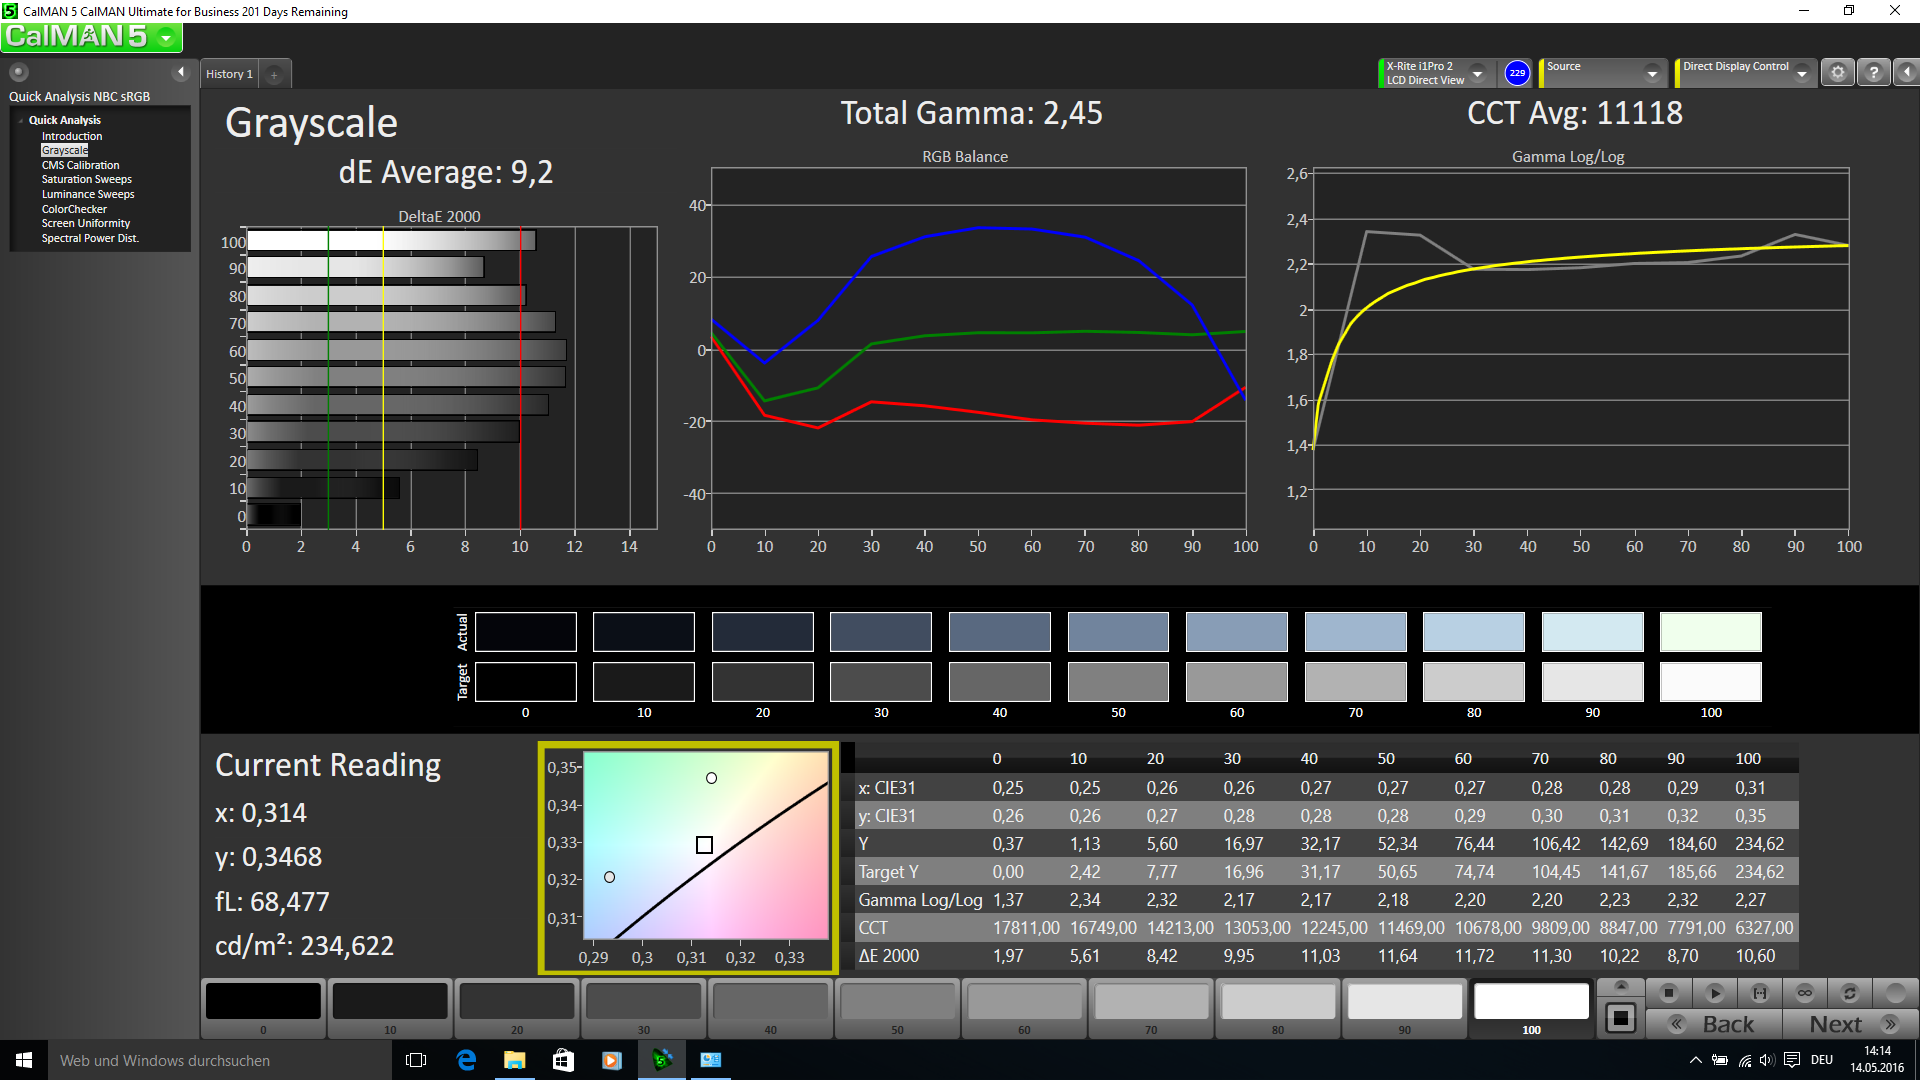
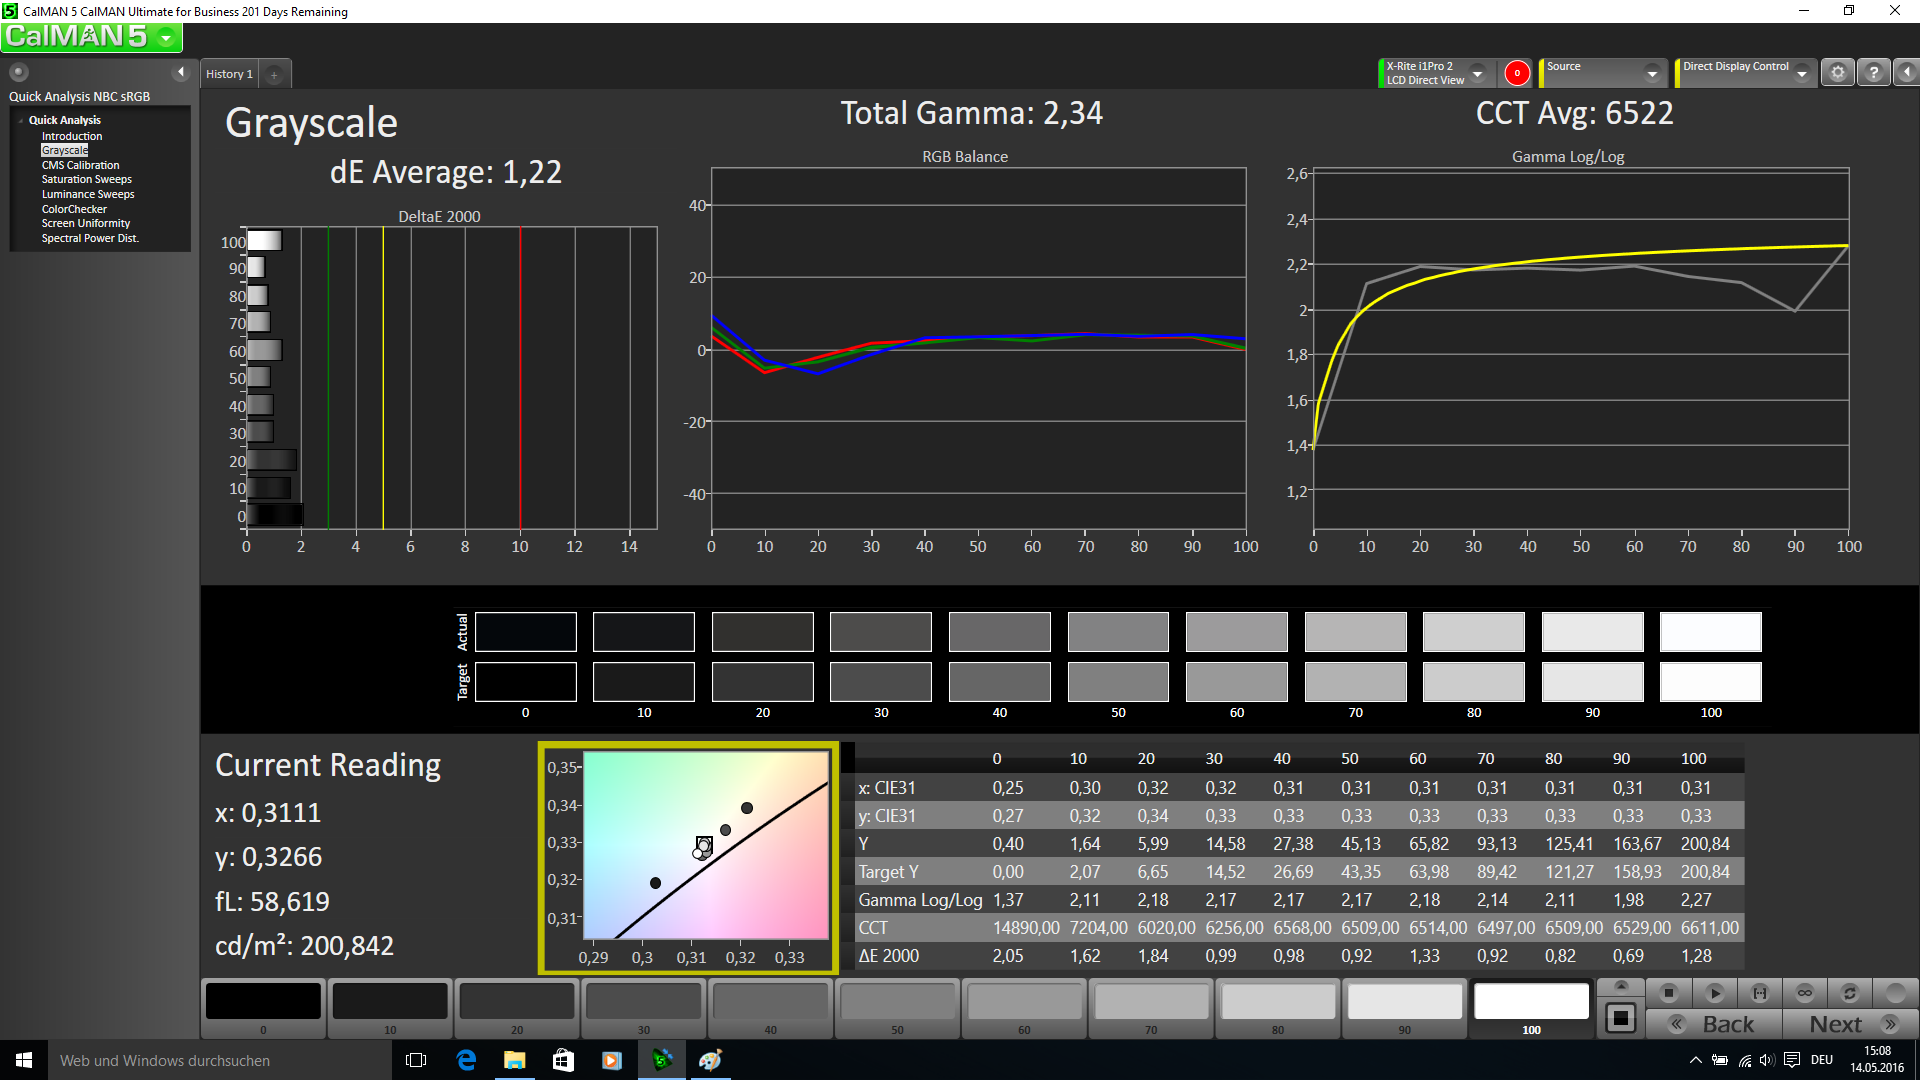
ΔE Greyscale 9.2 | 0.57-98 Ø5.3
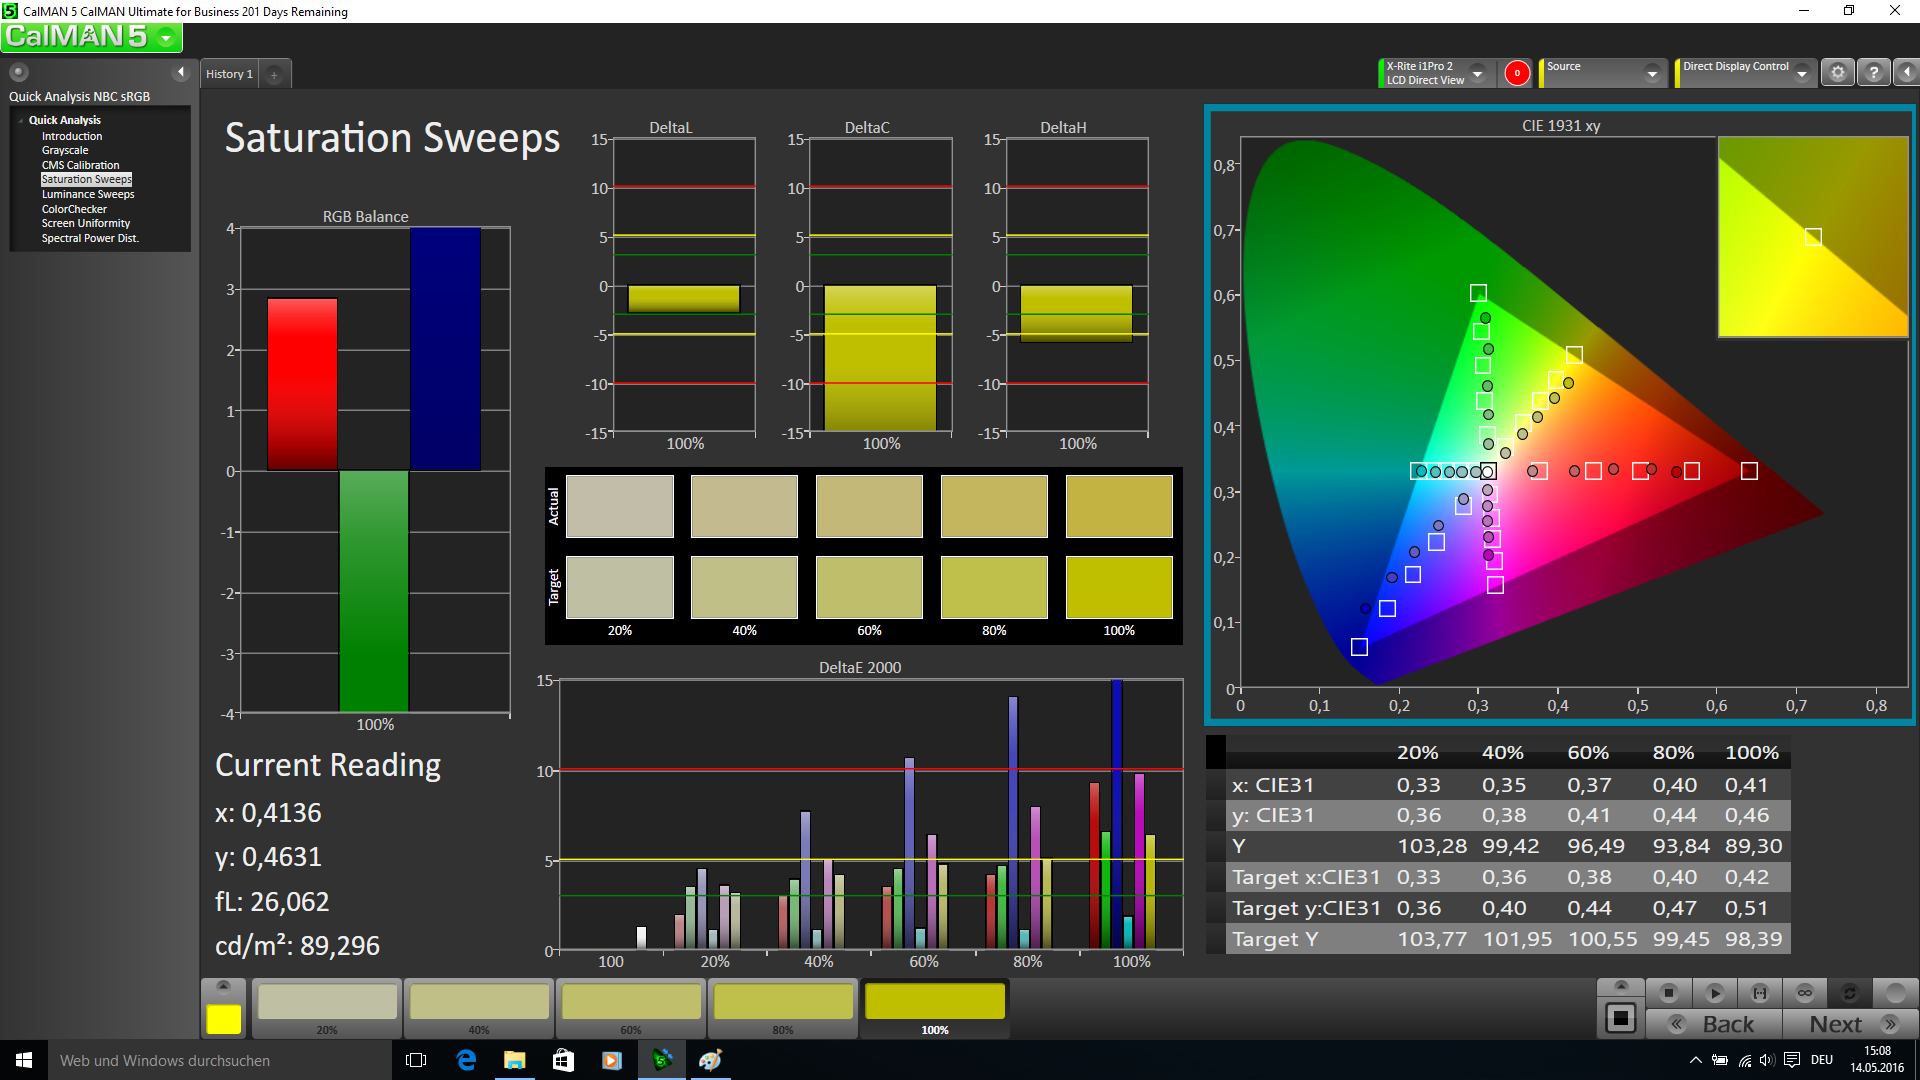
57.96% sRGB (Argyll 1.6.3 3D)
37.46% AdobeRGB 1998 (Argyll 1.6.3 3D)
40.63% AdobeRGB 1998 (Argyll 2.2.0 3D)
58.1% sRGB (Argyll 2.2.0 3D)
39.25% Display P3 (Argyll 2.2.0 3D)
Gamma: 2.45
| Asus ASUSPRO Advanced B8430UA-FA0084E TN WLED, 1920x1080 | Asus ASUSPRO Advanced BU401LA-CZ020G TN-Panel, 1600x900 | Lenovo ThinkPad L460-20FVS01400 IPS, 1920x1080 | Dell Latitude 14 E5470 TN, 1366x768 | HP EliteBook 840 G3 T9X59ET#ABD TN LED, 1920x1080 | Lenovo ThinkPad T460s-20F9003SGE IPS, 1920x1080 | Lenovo ThinkPad T460-20FN003LGE IPS, 1920x1080 | |
|---|---|---|---|---|---|---|---|
| Display | 20% | 8% | 3% | 25% | 6% | 7% | |
| Display P3 Coverage | 39.25 | 46.98 20% | 42.2 8% | 40.06 2% | 48.93 25% | 41.65 6% | 42.09 7% |
| sRGB Coverage | 58.1 | 69.8 20% | 62.3 7% | 60.3 4% | 73.7 27% | 61.6 6% | 62 7% |
| AdobeRGB 1998 Coverage | 40.63 | 48.67 20% | 43.72 8% | 41.42 2% | 50.5 24% | 43.14 6% | 43.6 7% |
| Response Times | -23% | -36% | -10% | -19% | -9% | ||
| Response Time Grey 50% / Grey 80% * | 42 ? | 44.4 ? -6% | 56.8 ? -35% | 43 ? -2% | 42 ? -0% | 42.4 ? -1% | |
| Response Time Black / White * | 21.2 ? | 29.6 ? -40% | 28.8 ? -36% | 25 ? -18% | 29.2 ? -38% | 24.8 ? -17% | |
| PWM Frequency | 204 ? | ||||||
| Screen | -2% | 19% | -16% | 10% | 20% | 14% | |
| Brightness middle | 210 | 216 3% | 245 17% | 229 9% | 366 74% | 226 8% | 230 10% |
| Brightness | 207 | 209 1% | 225 9% | 207 0% | 336 62% | 211 2% | 216 4% |
| Brightness Distribution | 87 | 89 2% | 83 -5% | 80 -8% | 87 0% | 89 2% | 85 -2% |
| Black Level * | 0.4 | 0.436 -9% | 0.24 40% | 0.69 -73% | 0.65 -63% | 0.22 45% | 0.26 35% |
| Contrast | 525 | 495 -6% | 1021 94% | 332 -37% | 563 7% | 1027 96% | 885 69% |
| Colorchecker dE 2000 * | 8.75 | 9.63 -10% | 6.89 21% | 10.16 -16% | 10.26 -17% | 6.44 26% | 7.32 16% |
| Colorchecker dE 2000 max. * | 13.87 | 17.62 -27% | 17.18 -24% | 17.18 -24% | 18.14 -31% | ||
| Greyscale dE 2000 * | 9.2 | 10.72 -17% | 6.45 30% | 10.87 -18% | 11.51 -25% | 5.87 36% | 6.98 24% |
| Gamma | 2.45 90% | 2.49 88% | 2.46 89% | 2.41 91% | 2.4 92% | 2.37 93% | 2.5 88% |
| CCT | 11118 58% | 12873 50% | 6857 95% | 12881 50% | 12725 51% | 6856 95% | 6683 97% |
| Color Space (Percent of AdobeRGB 1998) | 37.46 | 44.8 20% | 40.1 7% | 38.4 3% | 47 25% | 39.58 6% | 39.97 7% |
| Color Space (Percent of sRGB) | 57.96 | 61.8 7% | 60.4 4% | 74 28% | 61.15 6% | 61.55 6% | |
| Media total (Programa/Opciones) | 9% /
4% | 1% /
11% | -16% /
-15% | 8% /
11% | 2% /
12% | 4% /
9% |
* ... más pequeño es mejor

Tiempos de respuesta del display
| ↔ Tiempo de respuesta de Negro a Blanco | ||
|---|---|---|
| 21.2 ms ... subida ↗ y bajada ↘ combinada | ↗ 16.8 ms subida | 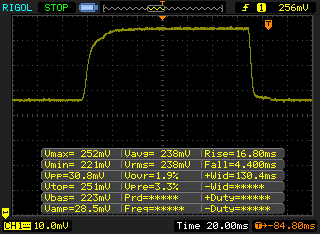 |
| ↘ 4.4 ms bajada | ||
| La pantalla mostró buenos tiempos de respuesta en nuestros tests pero podría ser demasiado lenta para los jugones competitivos. En comparación, todos los dispositivos de prueba van de ##min### (mínimo) a 240 (máximo) ms. » 41 % de todos los dispositivos son mejores. Eso quiere decir que el tiempo de respuesta es similar al dispositivo testado medio (21.5 ms). | ||
| ↔ Tiempo de respuesta 50% Gris a 80% Gris | ||
| 42 ms ... subida ↗ y bajada ↘ combinada | ↗ 22.4 ms subida |  |
| ↘ 19.6 ms bajada | ||
| La pantalla mostró tiempos de respuesta lentos en nuestros tests y podría ser demasiado lenta para los jugones. En comparación, todos los dispositivos de prueba van de ##min### (mínimo) a 636 (máximo) ms. » 63 % de todos los dispositivos son mejores. Eso quiere decir que el tiempo de respuesta es peor que la media (33.7 ms) de todos los dispositivos testados. | ||
Parpadeo de Pantalla / PWM (Pulse-Width Modulation)
| Parpadeo de Pantalla / PWM no detectado | ||
Comparación: 53 % de todos los dispositivos testados no usaron PWM para atenuar el display. Si se usó, medimos una media de 17900 (mínimo: 5 - máxmo: 3846000) Hz. | ||


| Cinebench R10 | |
| Rendering Single CPUs 64Bit (ordenar por valor) | |
| Asus ASUSPRO Advanced B8430UA-FA0084E | |
| Asus ASUSPRO Advanced BU401LA-CZ020G | |
| Dell Latitude 14 E5470 | |
| Rendering Multiple CPUs 64Bit (ordenar por valor) | |
| Asus ASUSPRO Advanced B8430UA-FA0084E | |
| Asus ASUSPRO Advanced BU401LA-CZ020G | |
| Dell Latitude 14 E5470 | |
* ... más pequeño es mejor

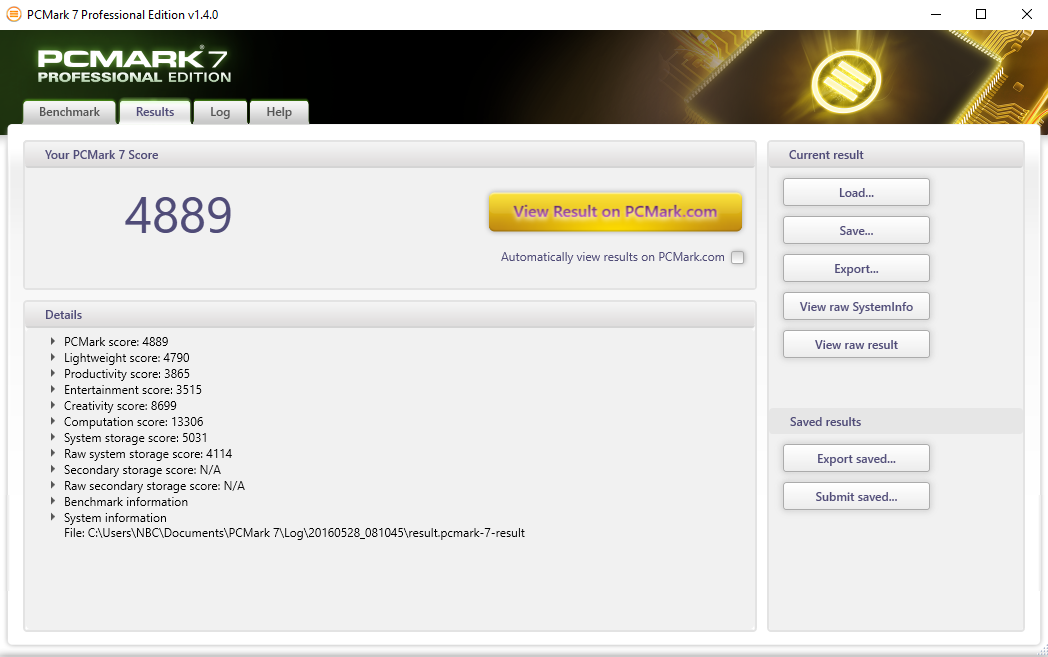
| PCMark 7 Score | 4889 puntos | |
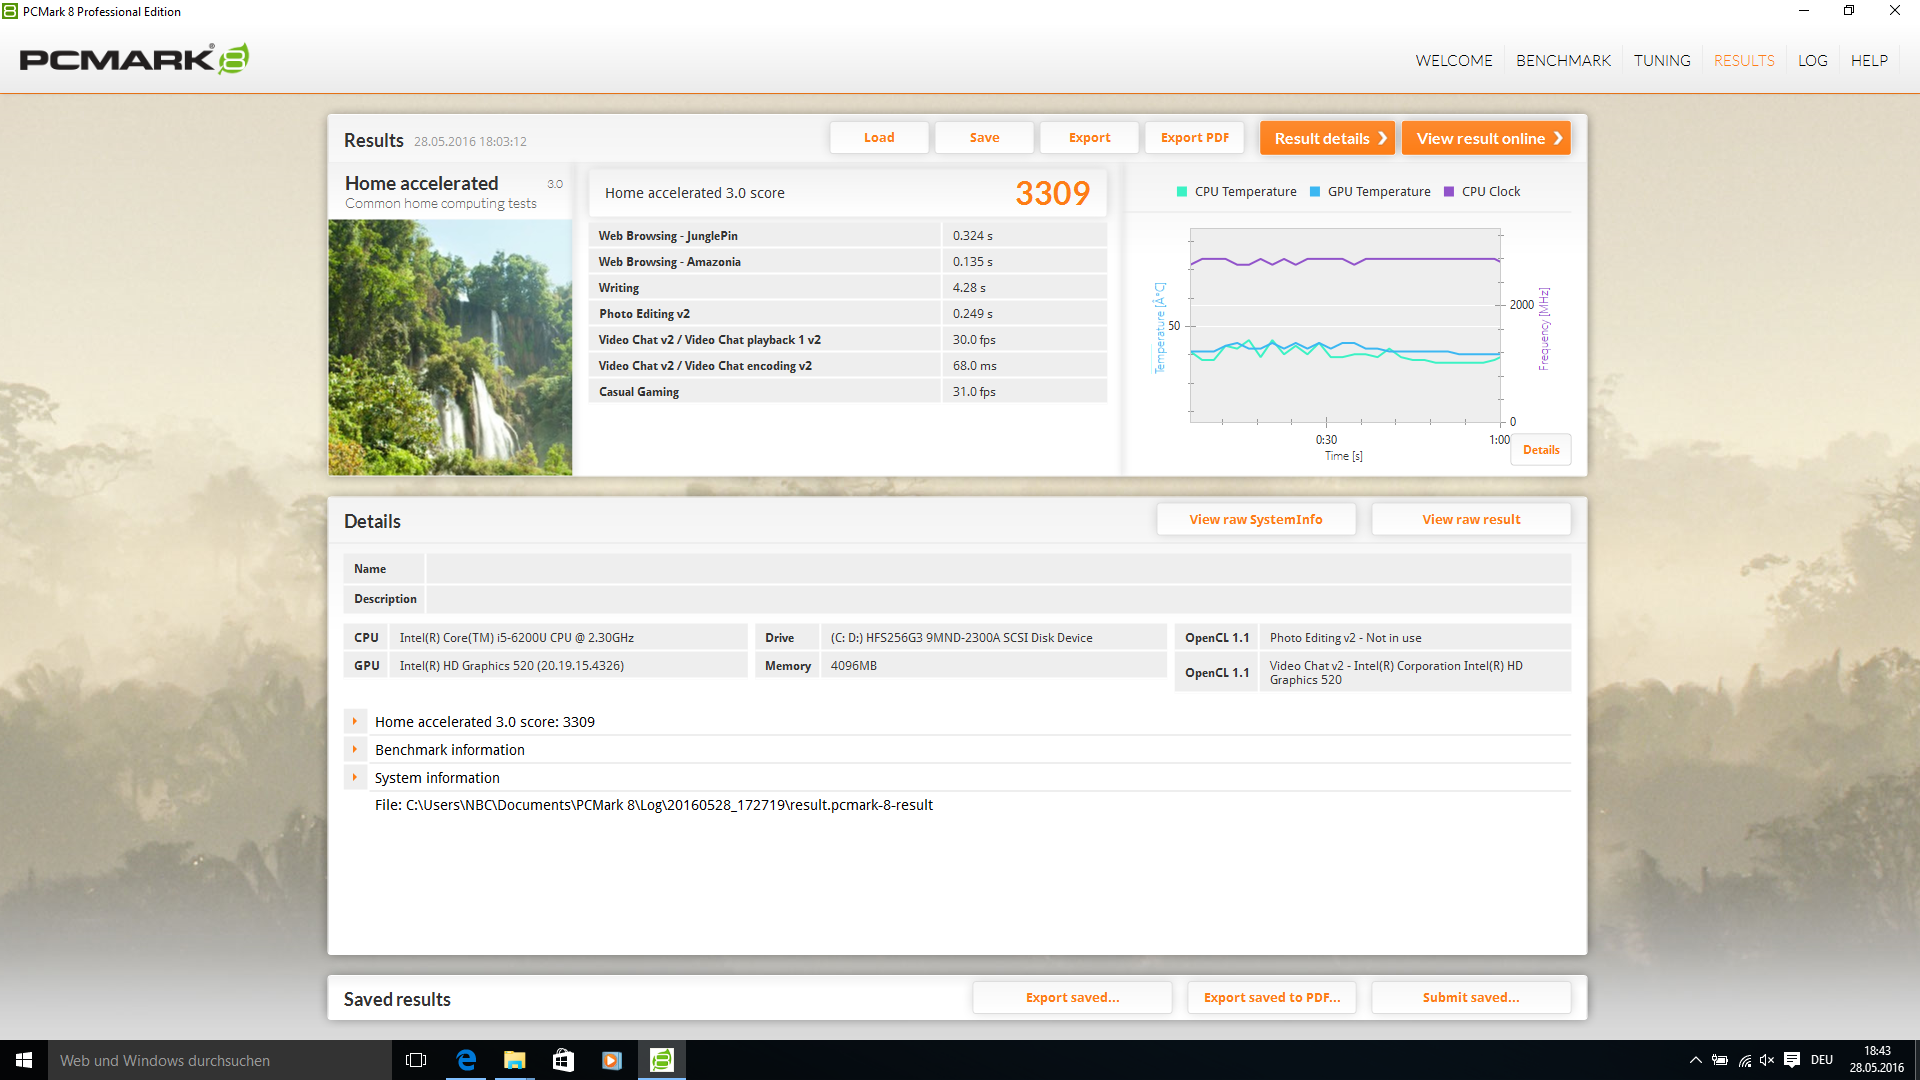
| PCMark 8 Home Score Accelerated v2 | 3309 puntos | |
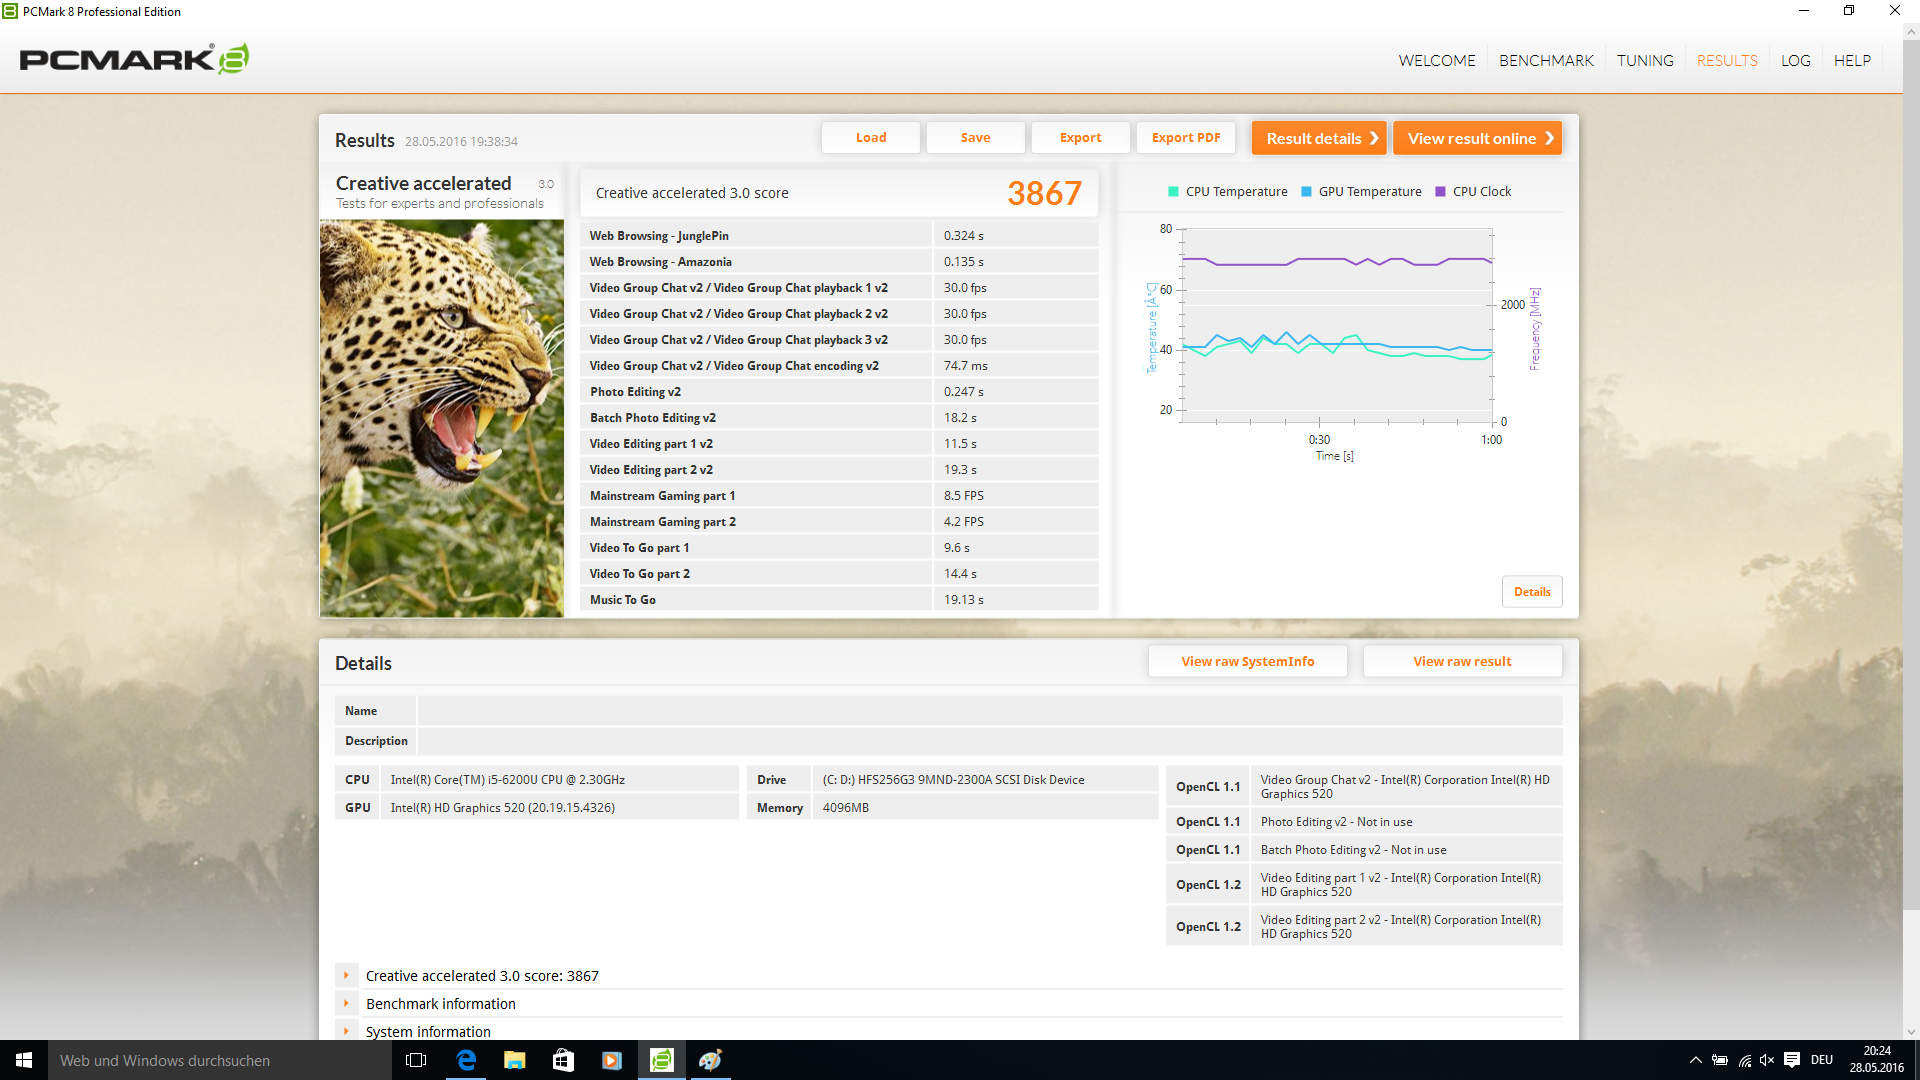
| PCMark 8 Creative Score Accelerated v2 | 3867 puntos | |
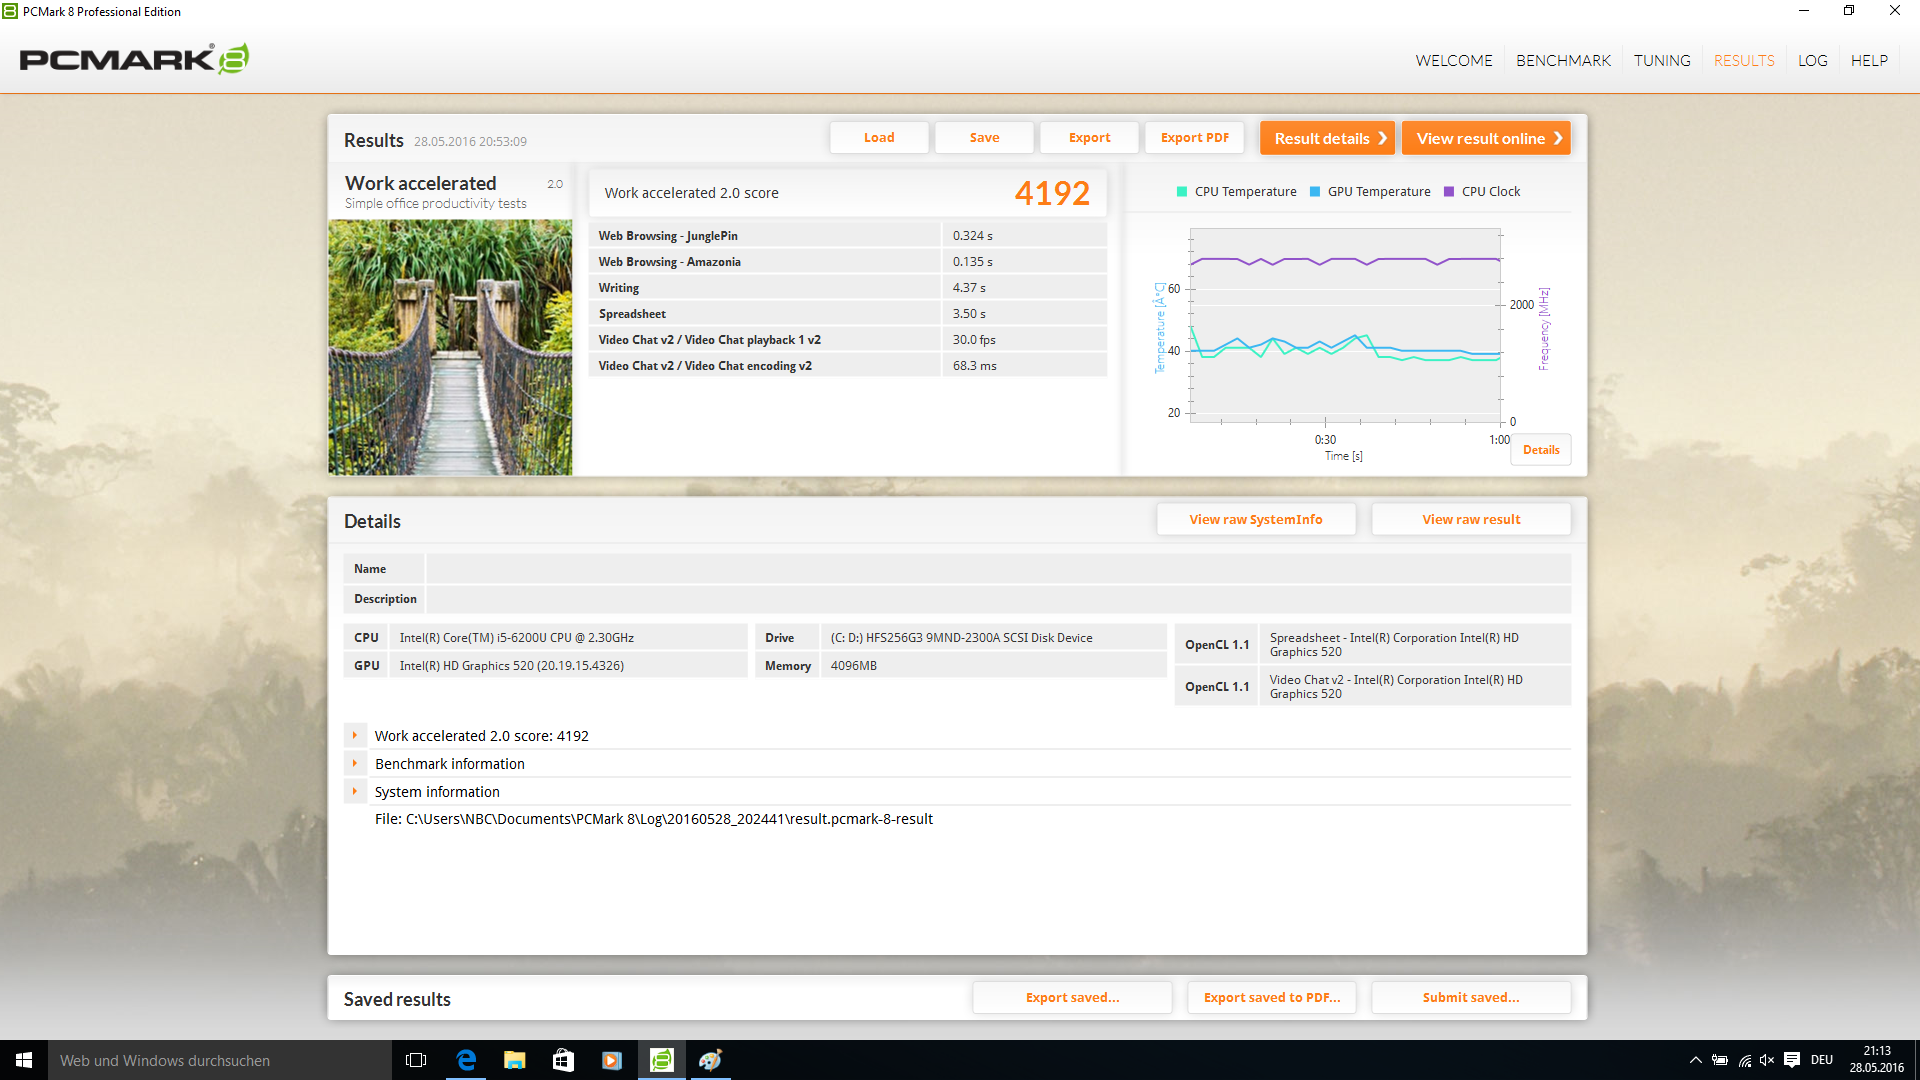
| PCMark 8 Work Score Accelerated v2 | 4192 puntos | |
ayuda | ||


| 3DMark 06 - 1280x1024 Standard Score AA:0x AF:0x (ordenar por valor) | |
| Asus ASUSPRO Advanced B8430UA-FA0084E | |
| Lenovo ThinkPad L460-20FVS01400 | |
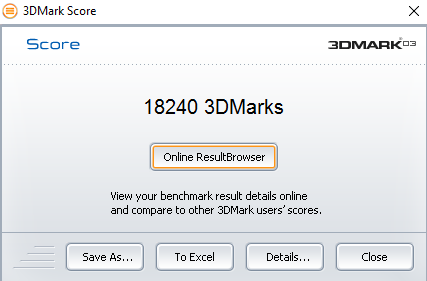
| 3DMark 03 Standard | 18240 puntos | |
| 3DMark 06 Standard Score | 8656 puntos | |
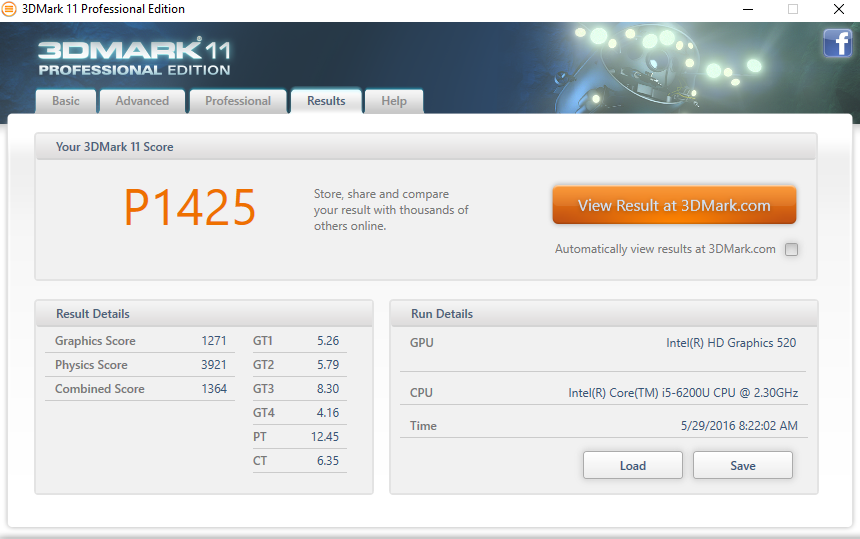
| 3DMark 11 Performance | 1425 puntos | |
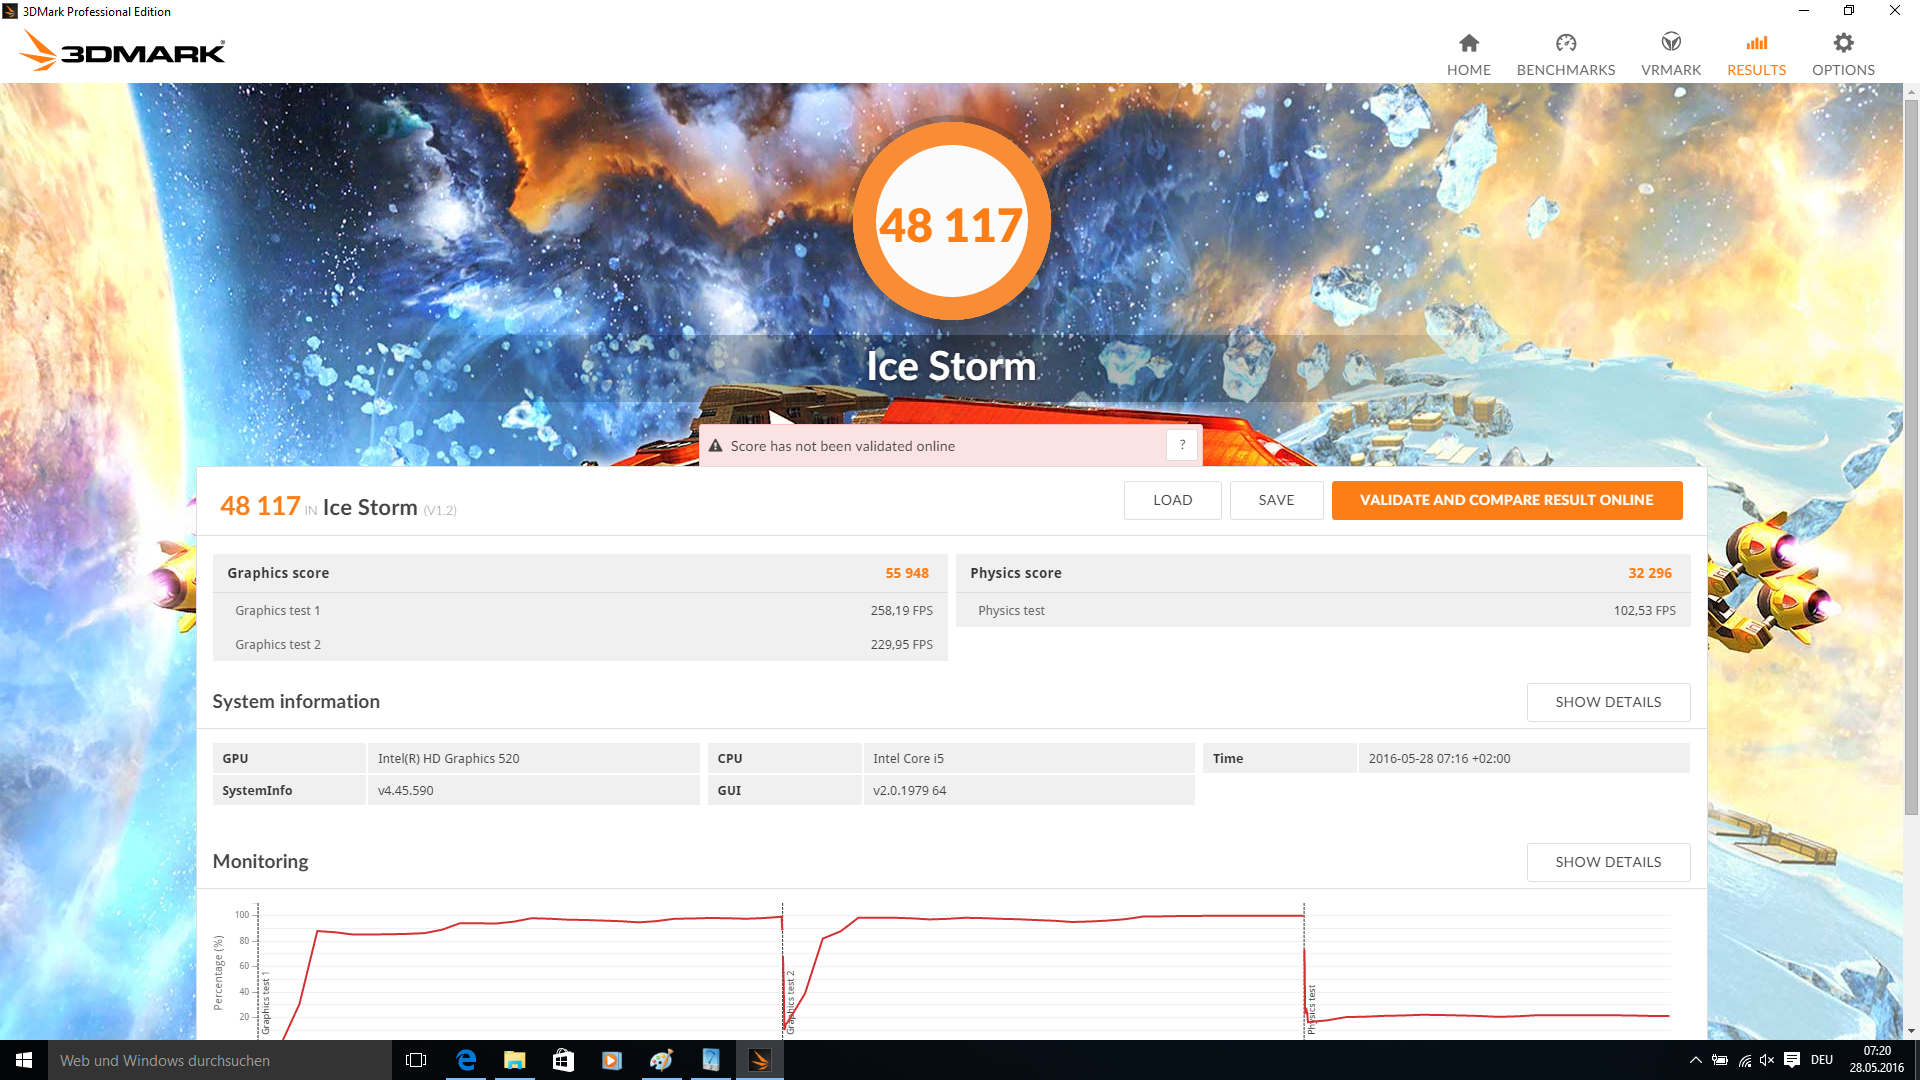
| 3DMark Ice Storm Standard Score | 48117 puntos | |
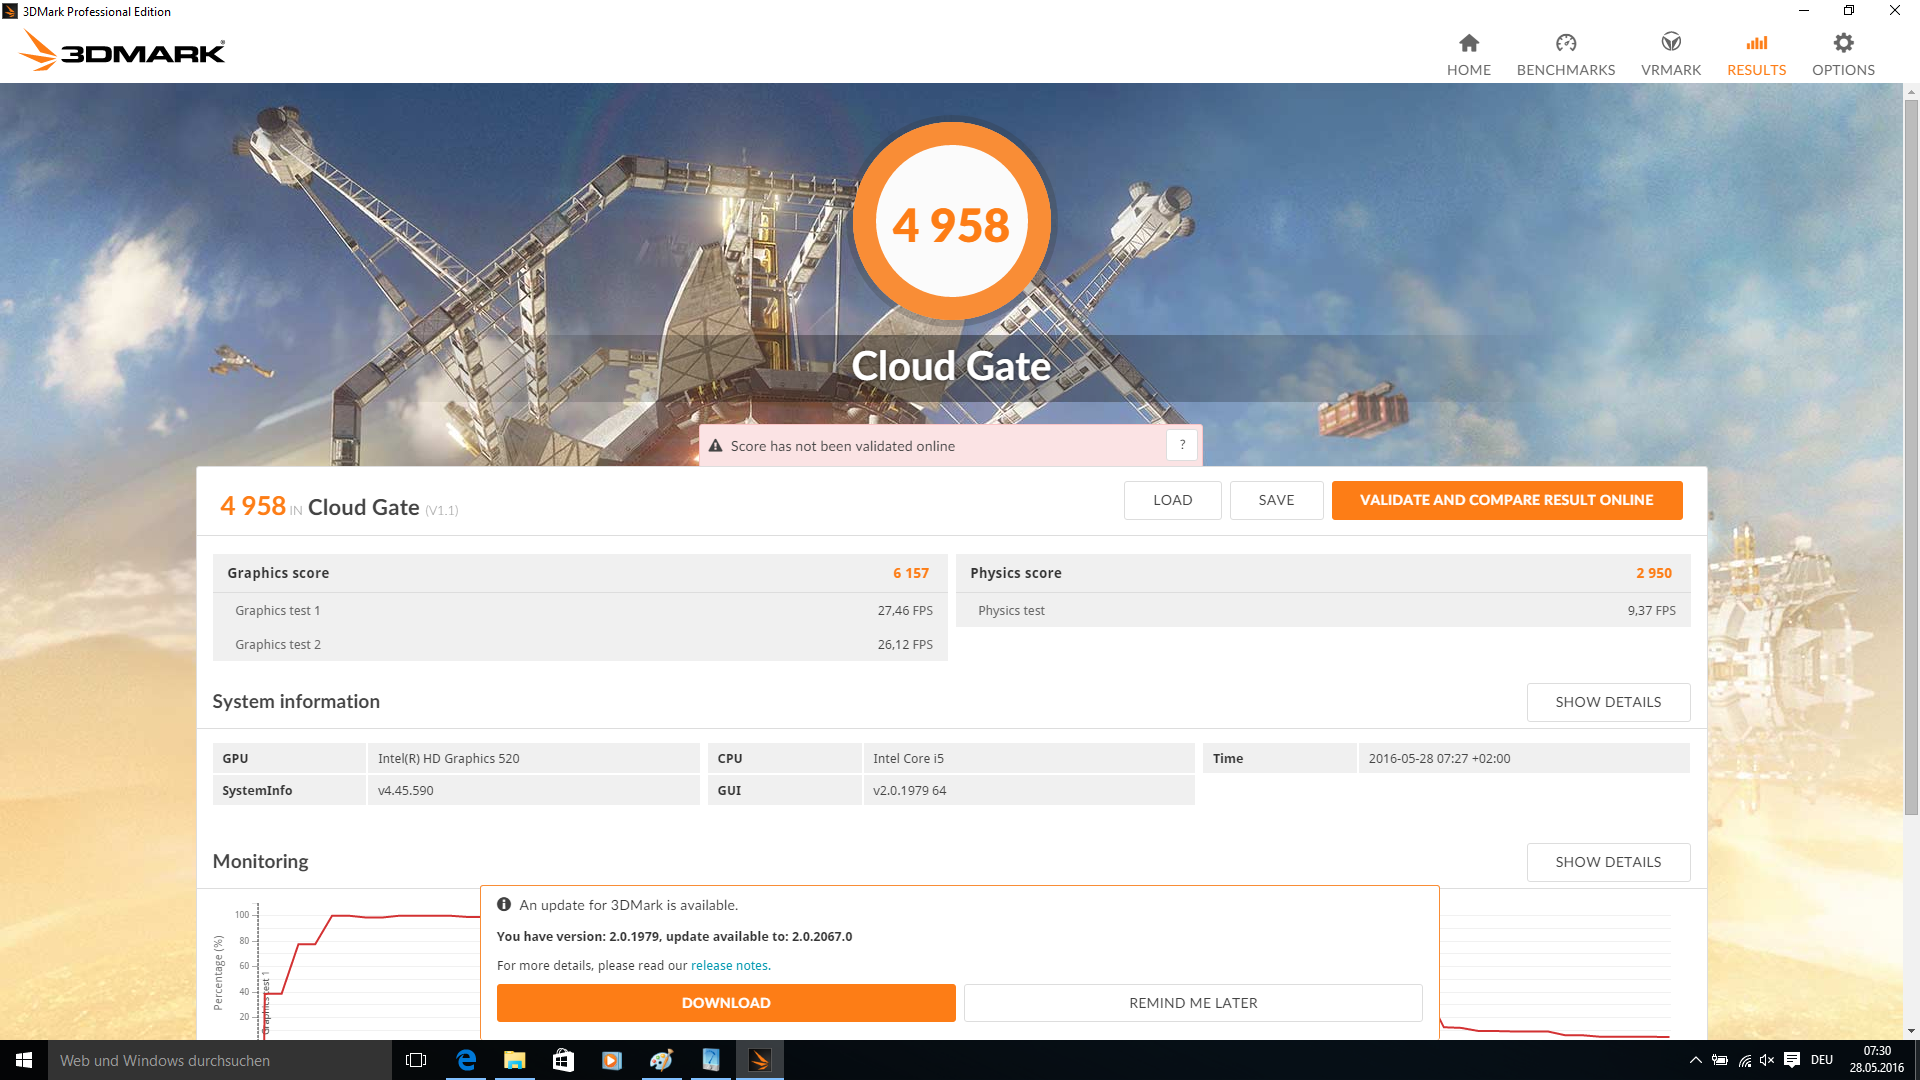
| 3DMark Cloud Gate Standard Score | 4958 puntos | |
| 3DMark Fire Strike Score | 707 puntos | |
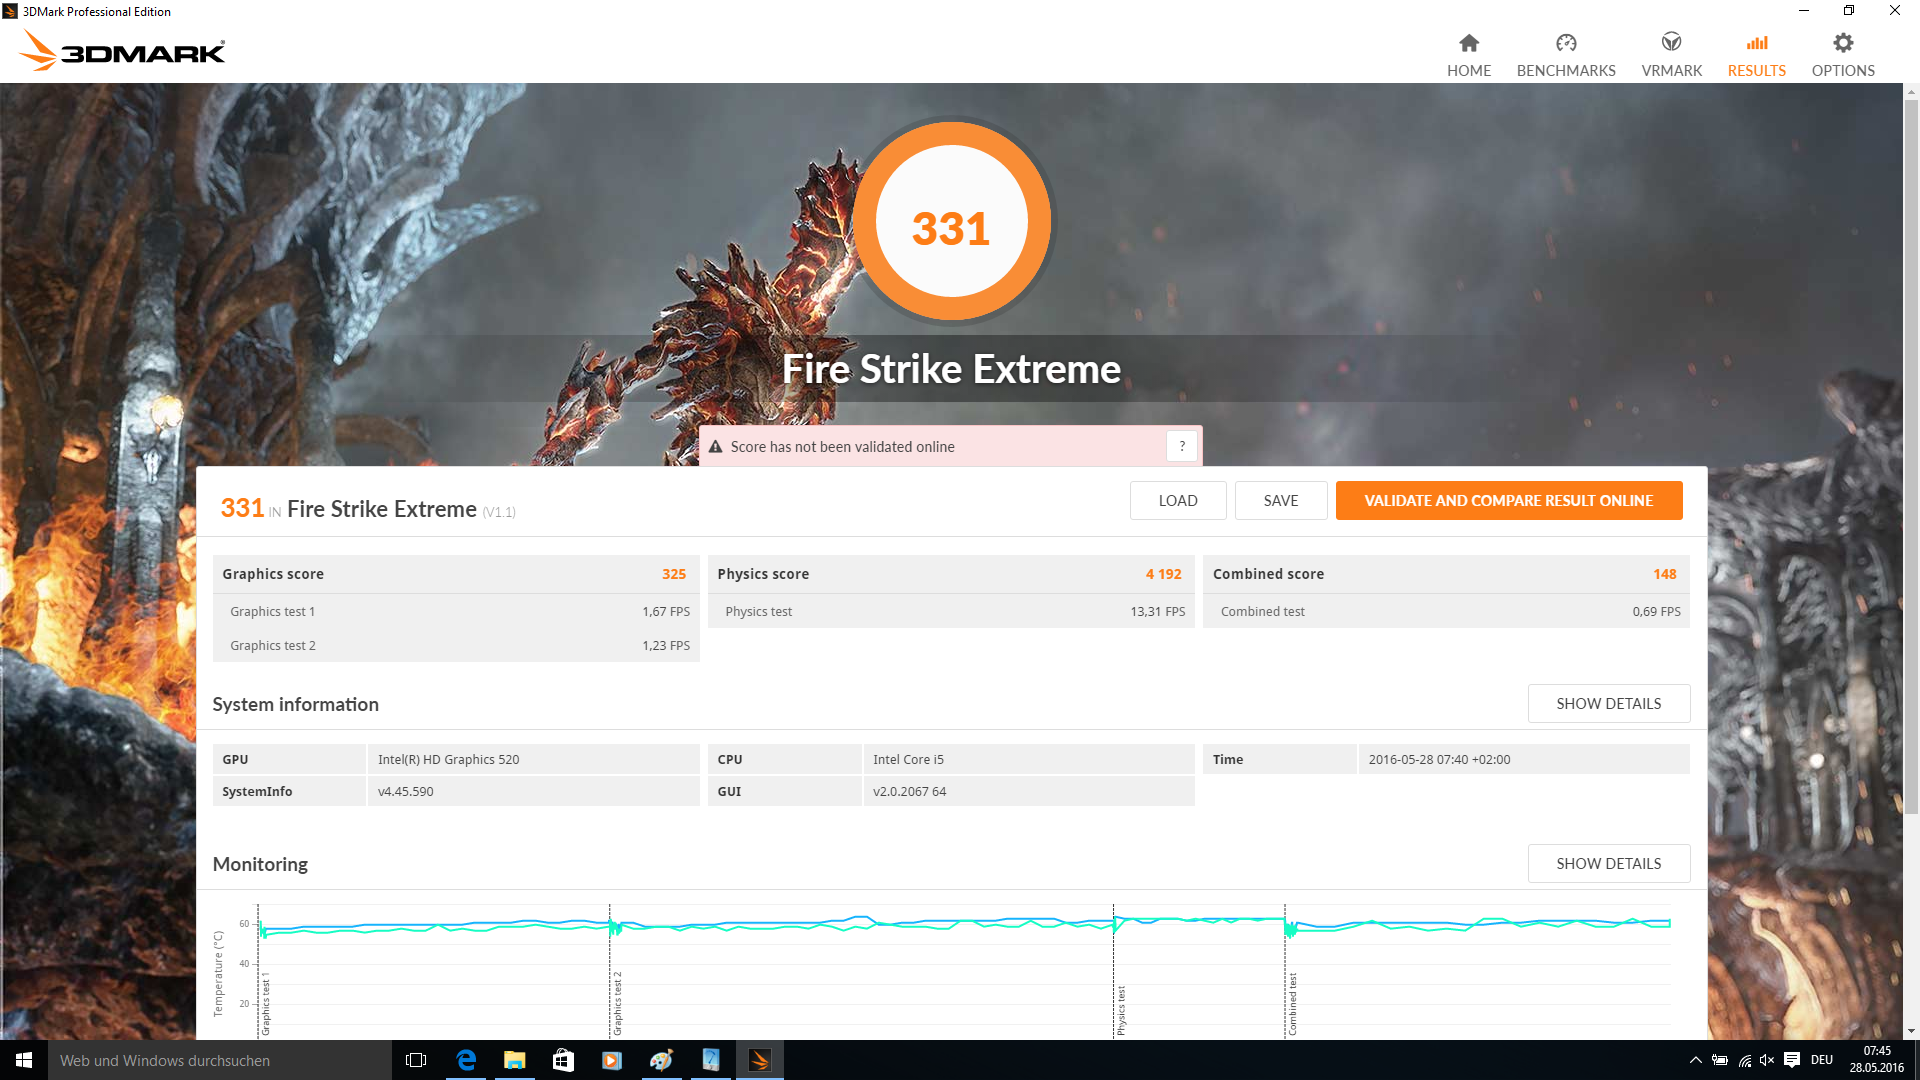
| 3DMark Fire Strike Extreme Score | 331 puntos | |
ayuda | ||
| bajo | medio | alto | ultra | |
| BioShock Infinite (2013) | 44.04 | 23.58 | 19.79 | 5.82 |
| Battlefield 4 (2013) | 40.9 | 24.1 | 18.7 | |
| Rise of the Tomb Raider (2016) | 17.8 | 11.9 | 7.2 |
Ruido
| Ocioso |
| 28.8 / 28.8 / 28.8 dB(A) |
| Carga |
| 34.7 / 36.1 dB(A) |
 | ||
30 dB silencioso 40 dB(A) audible 50 dB(A) ruidosamente alto |
||
min: | ||
| Asus ASUSPRO Advanced B8430UA-FA0084E Intel Core i5-6200U, HD Graphics 520 | Asus ASUSPRO Advanced BU401LA-CZ020G Intel Core i7-4650U, HD Graphics 5000 | Lenovo ThinkPad L460-20FVS01400 Intel Core i7-6500U, Radeon R5 M330 | Dell Latitude 14 E5470 Intel Core i5-6300U, HD Graphics 520 | HP EliteBook 840 G3 T9X59ET#ABD Intel Core i7-6500U, HD Graphics 520 | Lenovo ThinkPad T460s-20F9003SGE Intel Core i5-6200U, HD Graphics 520 | Lenovo ThinkPad T460-20FN003LGE Intel Core i5-6200U, HD Graphics 520 | |
|---|---|---|---|---|---|---|---|
| Noise | -2% | -0% | 0% | -9% | 0% | -1% | |
| off / environment * | 28.8 | 29.2 -1% | 29.2 -1% | 31.2 -8% | 29.1 -1% | 29 -1% | |
| Idle Minimum * | 28.8 | 29.3 -2% | 29.2 -1% | 29.2 -1% | 31.2 -8% | 29.1 -1% | 29 -1% |
| Idle Average * | 28.8 | 29.3 -2% | 29.2 -1% | 29.2 -1% | 32.1 -11% | 29.1 -1% | 29 -1% |
| Idle Maximum * | 28.8 | 30.9 -7% | 29.2 -1% | 29.2 -1% | 33.1 -15% | 29.1 -1% | 29 -1% |
| Load Average * | 34.7 | 33.1 5% | 32.5 6% | 32.1 7% | 36.2 -4% | 32.3 7% | 34.2 1% |
| Load Maximum * | 36.1 | 37.3 -3% | 37.2 -3% | 36.8 -2% | 37.8 -5% | 36.6 -1% | 37.8 -5% |
* ... más pequeño es mejor
(±) The maximum temperature on the upper side is 40.1 °C / 104 F, compared to the average of 34.2 °C / 94 F, ranging from 21.2 to 62.5 °C for the class Office.
(±) The bottom heats up to a maximum of 41.8 °C / 107 F, compared to the average of 36.7 °C / 98 F
(+) In idle usage, the average temperature for the upper side is 28.8 °C / 84 F, compared to the device average of 29.5 °C / 85 F.
(+) The palmrests and touchpad are cooler than skin temperature with a maximum of 30.7 °C / 87.3 F and are therefore cool to the touch.
(-) The average temperature of the palmrest area of similar devices was 27.7 °C / 81.9 F (-3 °C / -5.4 F).
| Asus ASUSPRO Advanced B8430UA-FA0084E HD Graphics 520, 6200U, Hynix HFS256G39MND | Asus ASUSPRO Advanced BU401LA-CZ020G HD Graphics 5000, 4650U, Liteonit LCS-256M6S | Lenovo ThinkPad L460-20FVS01400 Radeon R5 M330, 6500U, Toshiba HG6 THNSFJ256GCSU | Dell Latitude 14 E5470 HD Graphics 520, 6300U, Liteon L8H-256V2G | HP EliteBook 840 G3 T9X59ET#ABD HD Graphics 520, 6500U, Samsung SSD PM851 256 GB MZNTE256HMHP | Lenovo ThinkPad T460s-20F9003SGE HD Graphics 520, 6200U, Samsung CM871 MZ7LF192HCGS | Lenovo ThinkPad T460-20FN003LGE HD Graphics 520, 6200U, Toshiba HG6 THNSFJ256GCSU | |
|---|---|---|---|---|---|---|---|
| Power Consumption | 4% | -4% | 15% | 6% | 6% | 6% | |
| Idle Minimum * | 4.2 | 4.1 2% | 3.1 26% | 3.5 17% | 3.8 10% | 3.7 12% | 3.5 17% |
| Idle Average * | 6.5 | 7.1 -9% | 6.3 3% | 5.3 18% | 6.3 3% | 6.8 -5% | 6.7 -3% |
| Idle Maximum * | 7.2 | 7.3 -1% | 7.9 -10% | 6 17% | 6.8 6% | 7.3 -1% | 7.3 -1% |
| Load Average * | 29.2 | 28.9 1% | 29.5 -1% | 26.3 10% | 34.4 -18% | 26.3 10% | 28.2 3% |
| Load Maximum * | 41 | 29.3 29% | 57.3 -40% | 36.6 11% | 28.3 31% | 34.6 16% | 34.6 16% |
* ... más pequeño es mejor
| Off / Standby | |
| Ocioso | |
| Carga |
|
| Asus ASUSPRO Advanced B8430UA-FA0084E 48 Wh | Asus ASUSPRO Advanced BU401LA-CZ020G 53 Wh | Lenovo ThinkPad L460-20FVS01400 48 Wh | Dell Latitude 14 E5470 62 Wh | HP EliteBook 840 G3 T9X59ET#ABD 46 Wh | Lenovo ThinkPad T460s-20F9003SGE 49 Wh | Lenovo ThinkPad T460-20FN003LGE 46 Wh | |
|---|---|---|---|---|---|---|---|
| Duración de Batería | -7% | 22% | 75% | 29% | 23% | 15% | |
| Reader / Idle | 716 | 699 -2% | 1153 61% | 1304 82% | 1020 42% | 915 28% | 953 33% |
| H.264 | 336 | 296 -12% | 431 28% | 645 92% | 534 59% | 512 52% | |
| WiFi v1.3 | 344 | 425 24% | 667 94% | 453 32% | 395 15% | 338 -2% | |
| Load | 129 | 120 -7% | 97 -25% | 172 33% | 146 13% | 116 -10% | 98 -24% |
| WiFi | 310 |
Pro
Contra
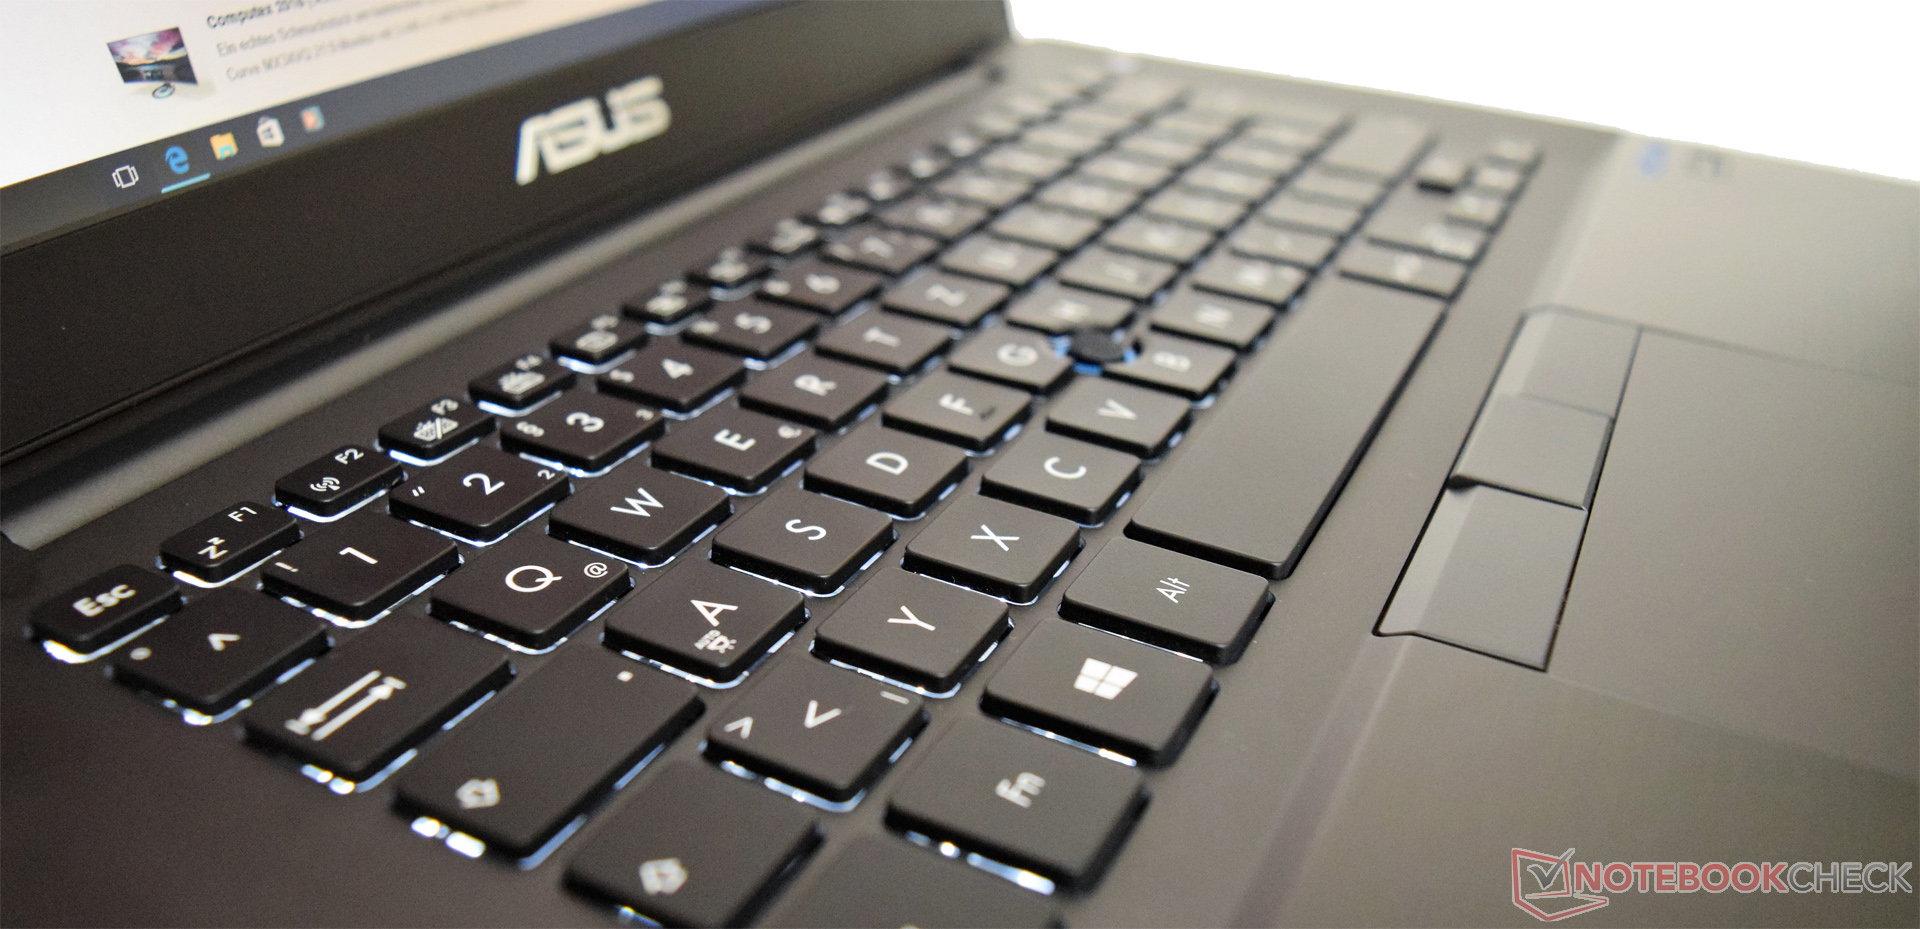
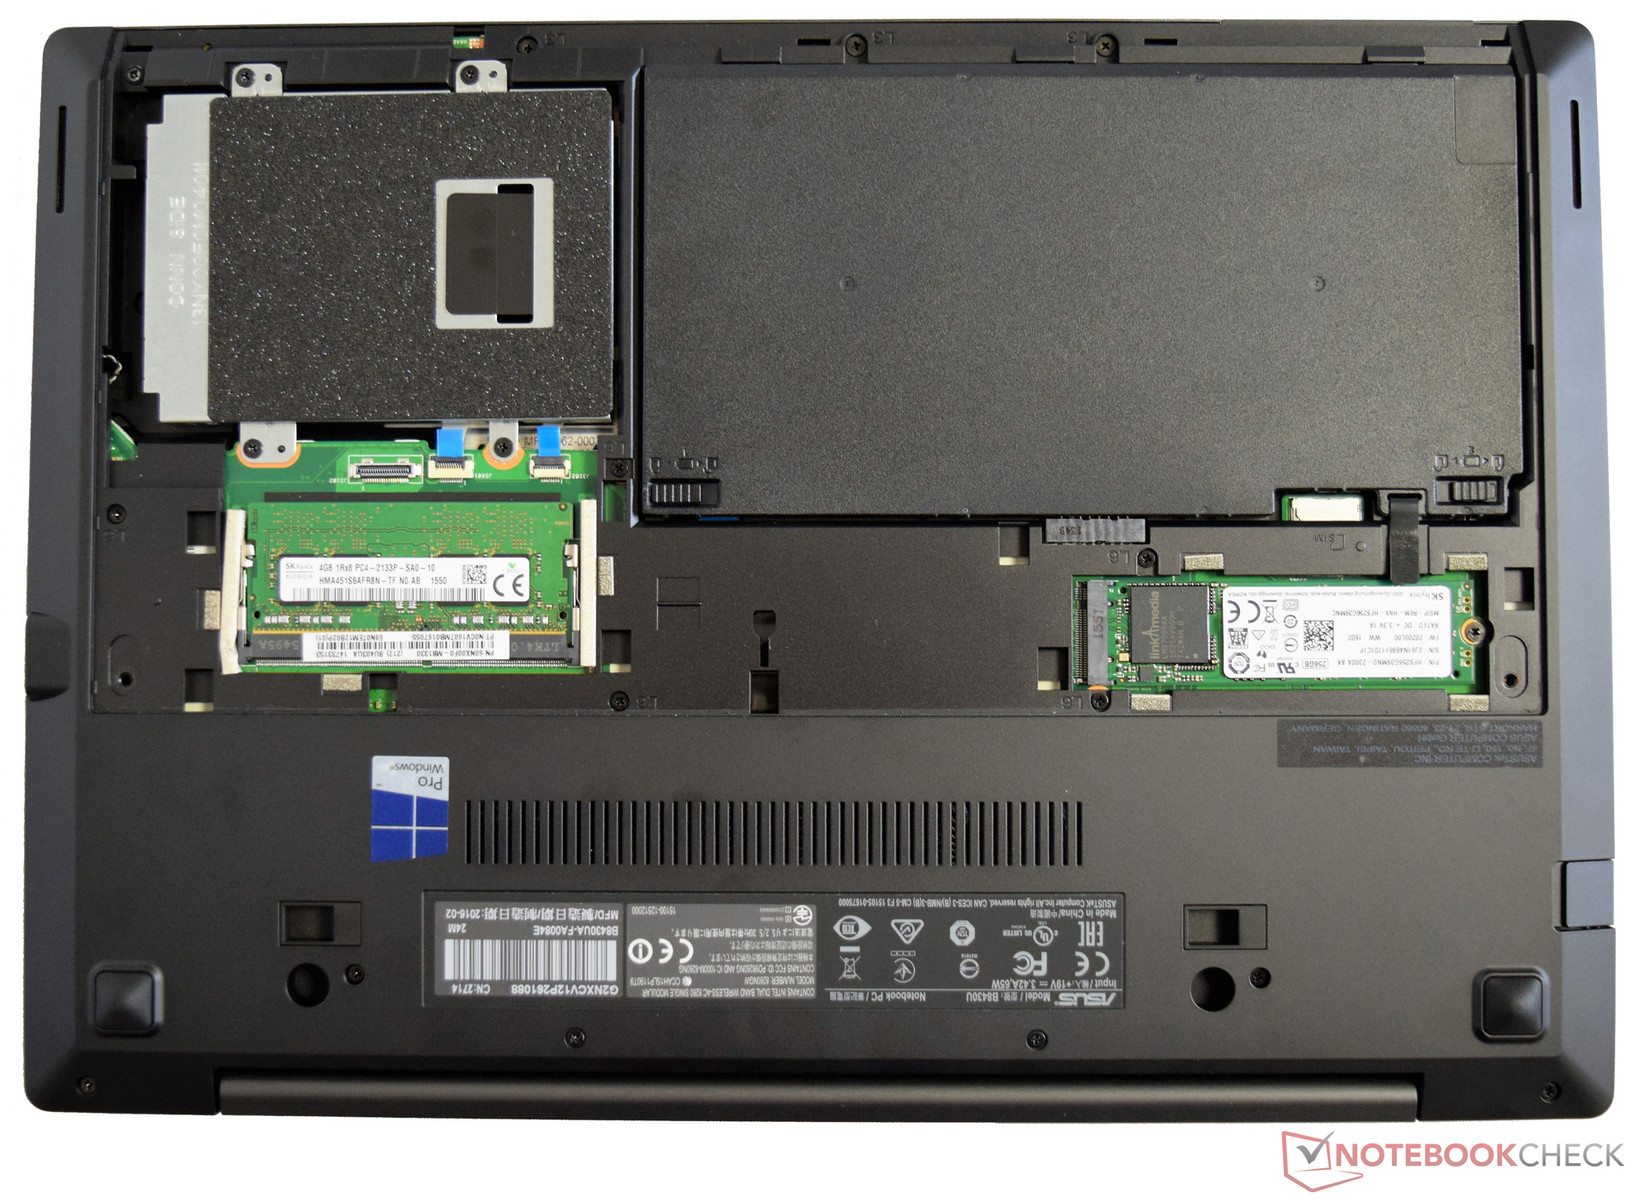
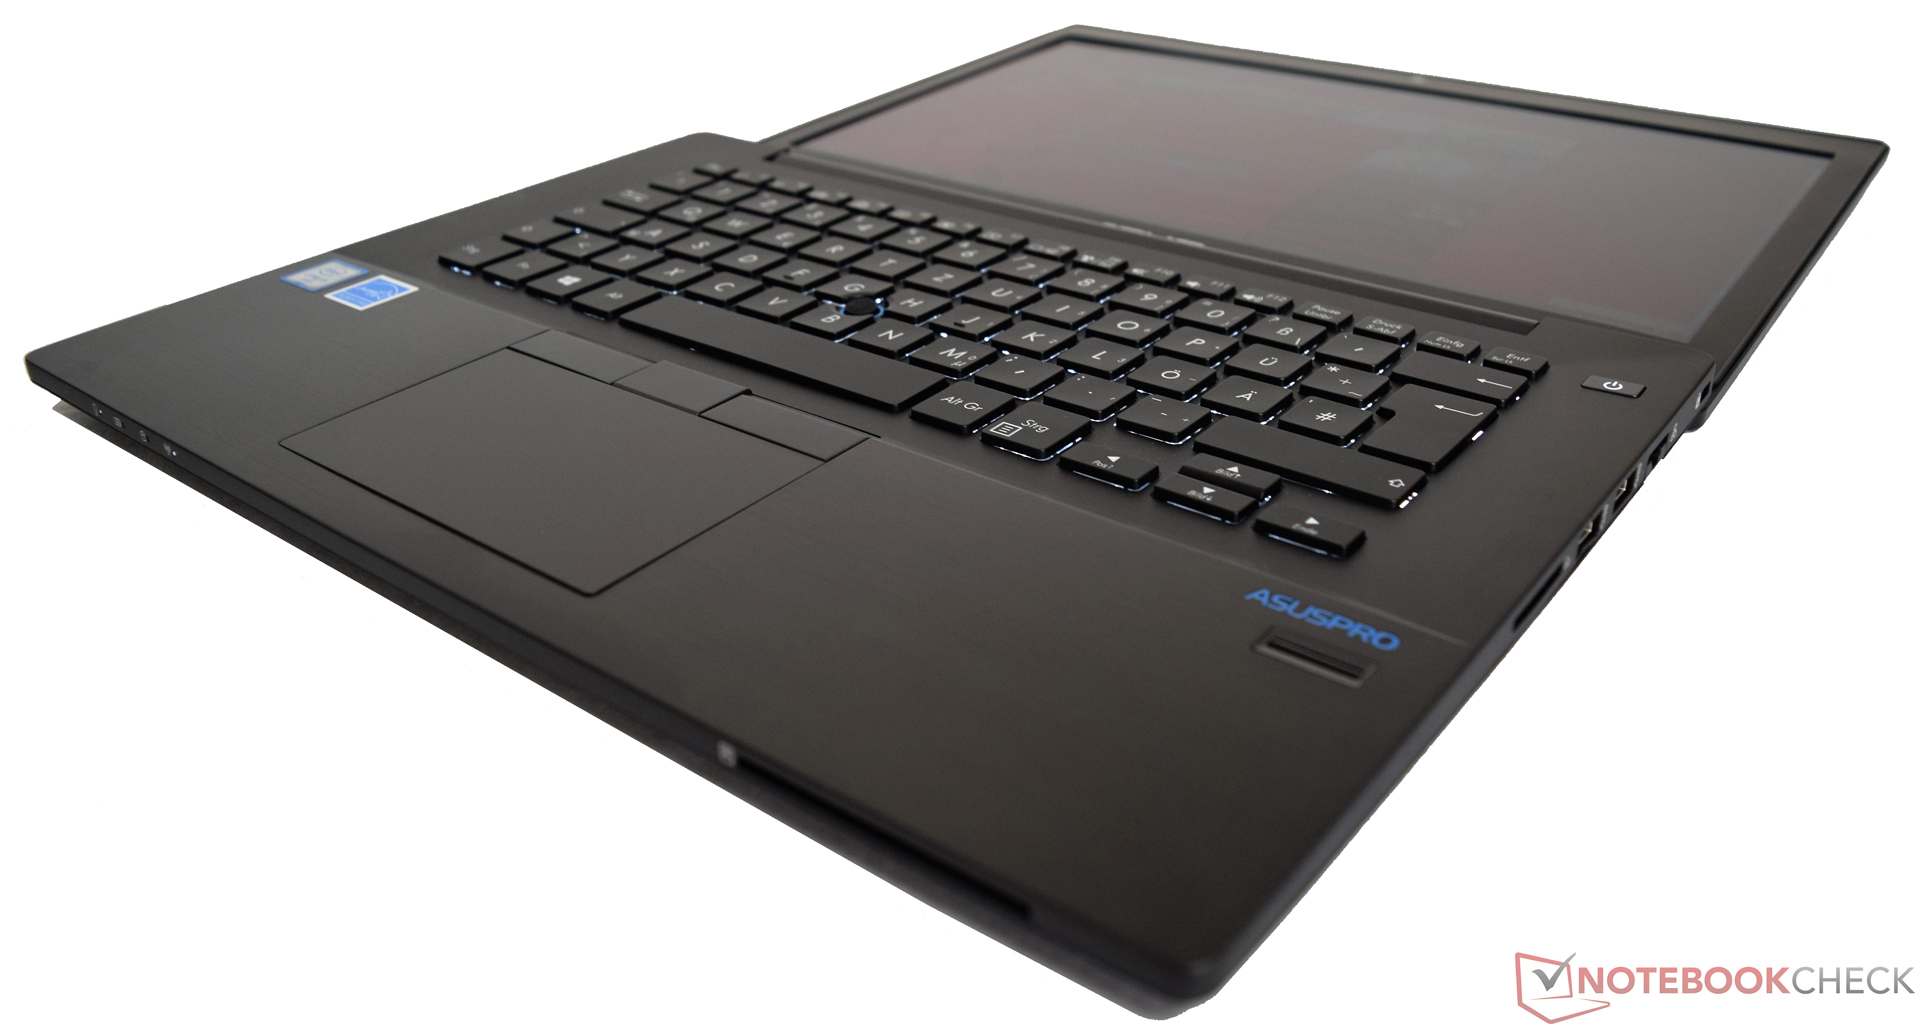
El AsusPro Advanced B8430UA es un portátil de negocios de 14 pulgadas bueno y resistente. Gracias a los modernos componentes, el rendimiento se ha incrementado respecto a su predecesor. El bajo peso asegura buena movilidad y el precio de menos de 1000 euros es muy tentador. El buen rendimiento del sistema es un importante aspecto cuando usas el dispositivo todos los días, así que la inclusión de SSD tiene bastante sentido ya que es el componente que tiene más efecto en el rendimiento.
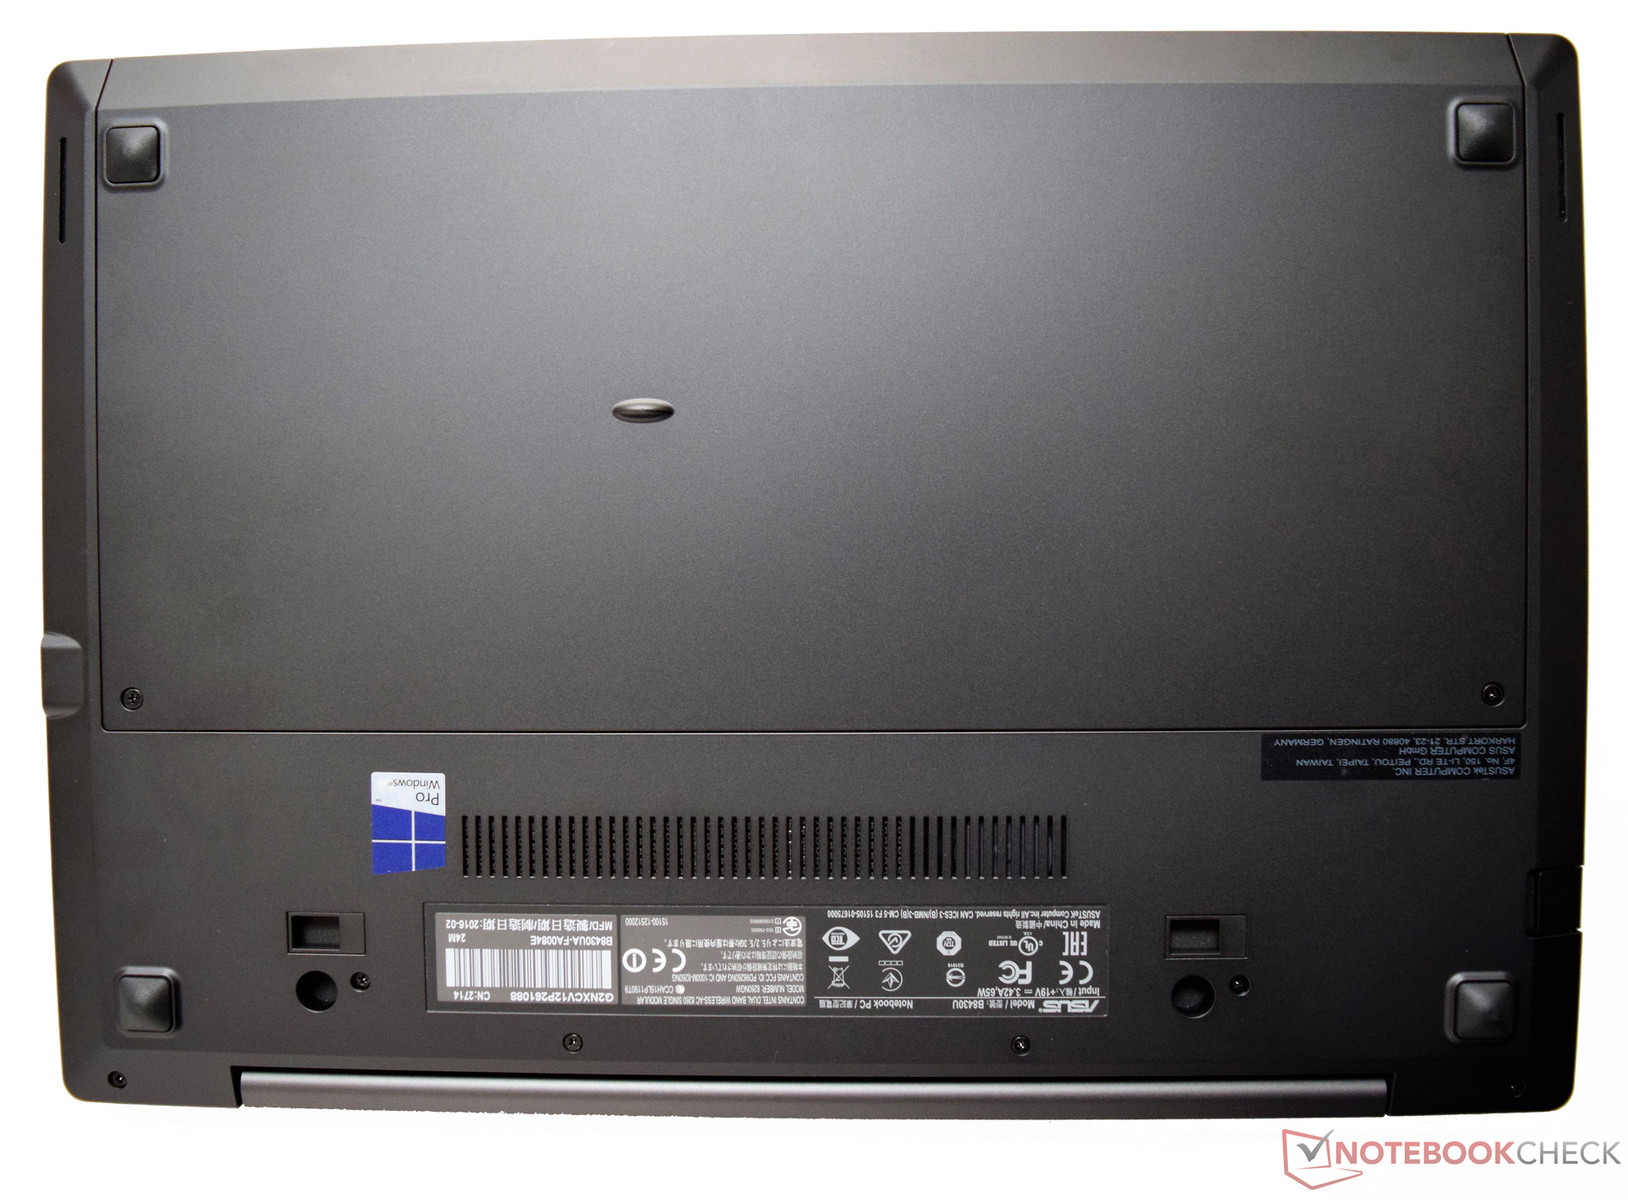
El chasis robusto y discreto contiene una configuración de componentes equilibrada - todo por un atractivo precio de 1000 euros.
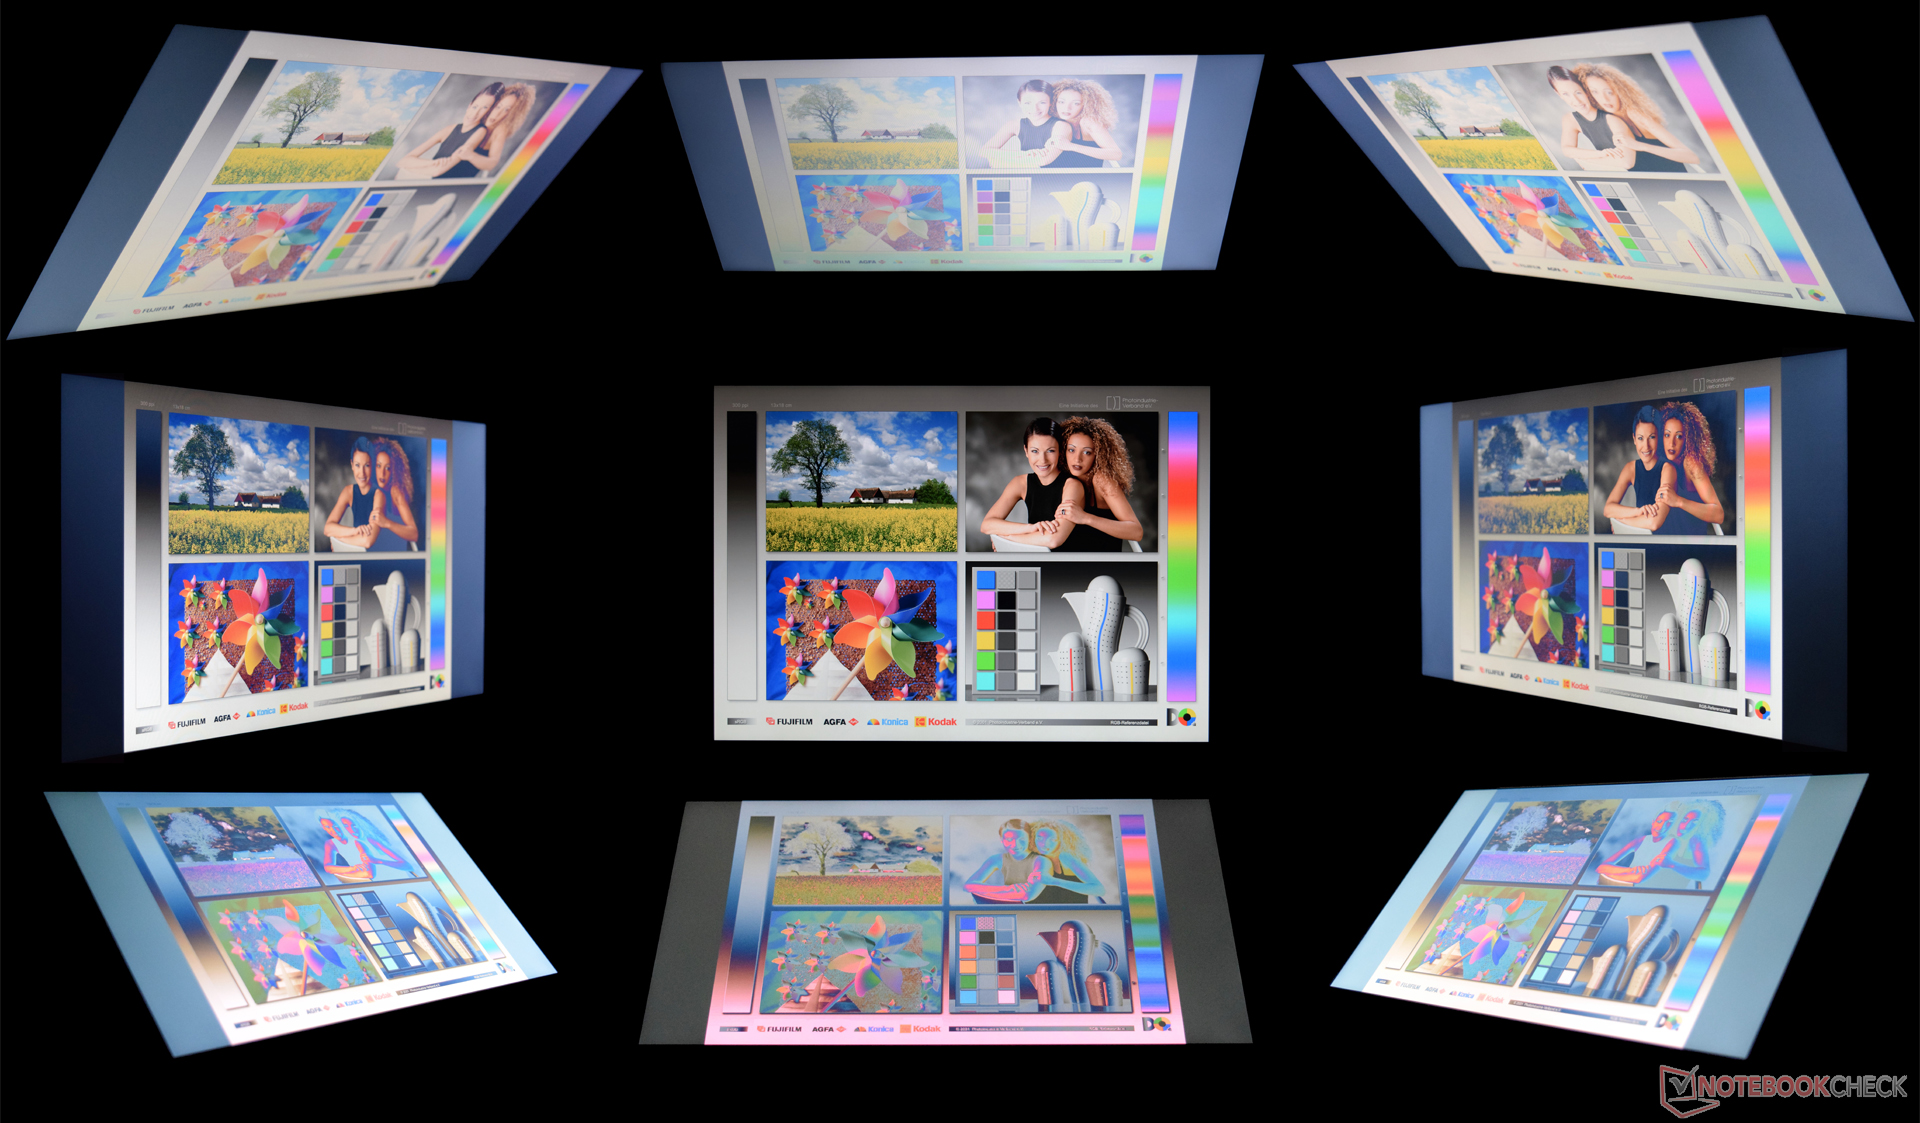
Nos ha decepcionado un poco la pantalla, que consigue buenos angulos de visión a pesar de usar tecnología TN, pero no satisface nuestras exigencias respecto a luminosidad. Los pequeños altavoces estéreo tampoco resultan convincentes. El rendimiento de la unidad de prueba no es suficiente para juegos 3D modernos, pero no es necesario debido al publico al que se orienta el producto
Si no quieres prescindir de juegos, tienes que comprar un portátil GPU dedicada. Nos han gustado los buenos dispositivos de entrada, que son cruciales para un dispositivo de oficina, así como la buena duración de batería. El AsusPro Advanced es un buen sucesor del AsusPro Advanced BU401LA.
Ésta es una versión acortada del análisis original. Puedes leer el análisis completo en inglés aquí.
Asus ASUSPRO Advanced B8430UA-FA0084E
-
07/03/2016 v5.1(old)
Sebastian Bade
Pricecompare
