 Deutsch
 English
 Español
 Français
 Italiano
 Nederlands
 Polski
 Português
 Русский
 Türkçe
 Svenska
 Chinese
 Magyar
Breve análisis del portátil Asus ROG GL753VE (7700HQ, 1050 Ti)
| SD Card Reader | |
| average JPG Copy Test (av. of 3 runs) | |
| Nexoc G739 | |
| Asus Strix GL753VD-GC045T | |
| Lenovo Legion Y520-15IKBN-80WK001KUS | |
| Asus GL753VE-DS74 | |
| MSI GE72 7RE-046 | |
| Acer Aspire Nitro BE VN7-793G-5811 | |
| Dell Inspiron 15 7000 7567 | |
| maximum AS SSD Seq Read Test (1GB) | |
| Asus GL753VE-DS74 | |
| Lenovo Legion Y520-15IKBN-80WK001KUS | |
| Nexoc G739 | |
| Asus Strix GL753VD-GC045T | |
| MSI GE72 7RE-046 | |
| Dell Inspiron 15 7000 7567 | |
| Acer Aspire Nitro BE VN7-793G-5811 | |
| |||||||||||||||||||||||||
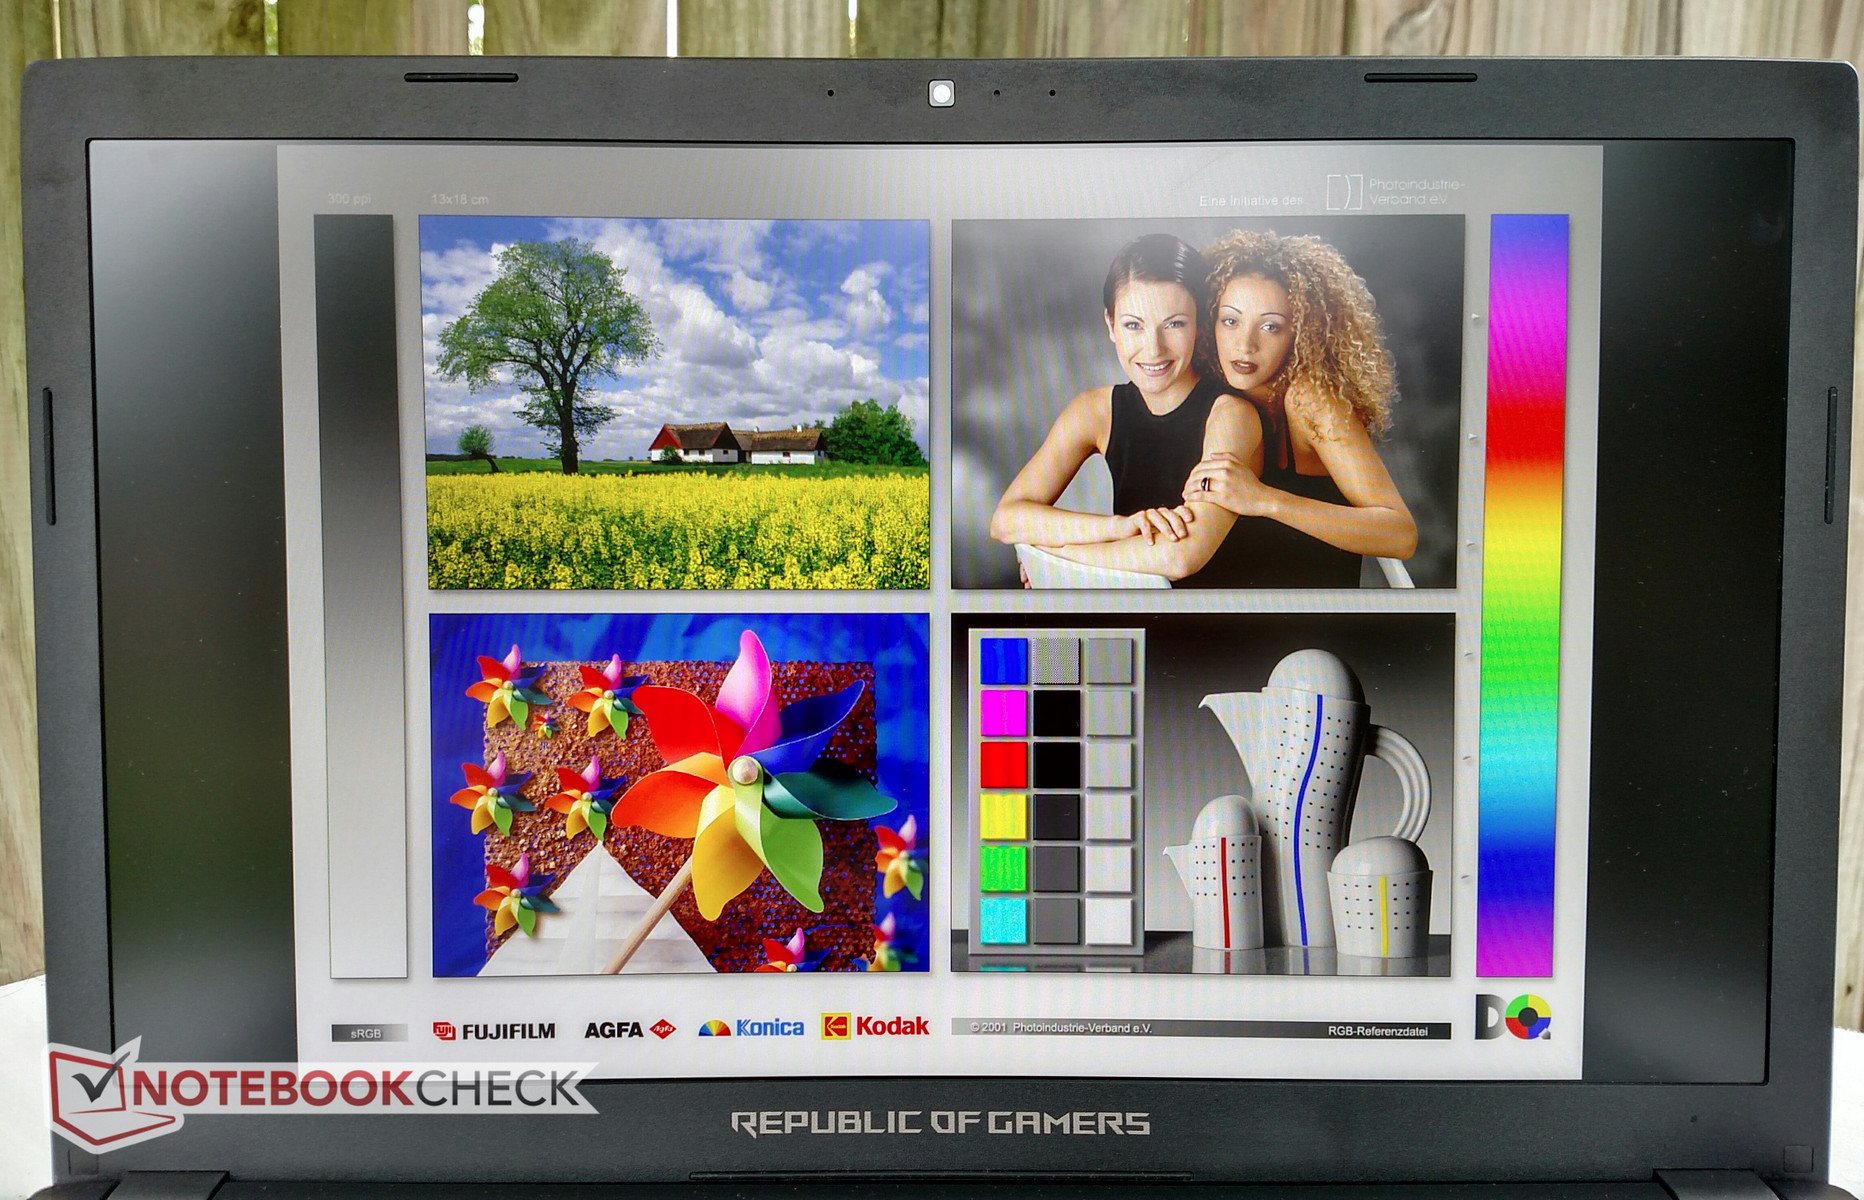
iluminación: 90 %
Brillo con batería: 366 cd/m²
Contraste: 1046:1 (Negro: 0.35 cd/m²)
ΔE Color 4.4 | 0.5-29.43 Ø5
ΔE Greyscale 3 | 0.57-98 Ø5.3
86% sRGB (Argyll 1.6.3 3D)
56% AdobeRGB 1998 (Argyll 1.6.3 3D)
Gamma: 2.1
| Asus GL753VE-DS74 LG Philips LP173WF4-SPF3, IPS, 17.30, 1920x1080 | Asus Strix GL753VD-GC045T LP173WF4-SPF3, LED IPS, 17.30, 1920x1080 | Acer Aspire Nitro BE VN7-793G-5811 AU Optronics, IPS, 17.30, 1920x1080 | Nexoc G739 CMN1738, IPS, 17.30, 1920x1080 | MSI GE72 7RE-046 N173HHE-G32 (CMN1747), TN LED, 17.30, 1920x1080 | Dell Inspiron 15 7000 7567 AU Optronics AUO38ED B156HTN 28H80, TN, 15.60, 1920x1080 | Lenovo Legion Y520-15IKBN-80WK001KUS LP156WF6-SPK3, IPS, 15.60, 1920x1080 | |
|---|---|---|---|---|---|---|---|
| Display | |||||||
| Display P3 Coverage | 67.1 | 63.1 | 66.7 | 90.7 | 36.42 | ||
| sRGB Coverage | 84.8 | 86.5 | 91 | 99.9 | 54.9 | ||
| AdobeRGB 1998 Coverage | 62 | 63.3 | 66.4 | 85.2 | 37.62 | ||
| Response Times | -12% | -15% | -26% | 42% | -32% | -64% | |
| Response Time Grey 50% / Grey 80% * | 36 ? | 33.2 ? 8% | 38 ? -6% | 45 ? -25% | 27 ? 25% | 36 ? -0% | 58.8 ? -63% |
| Response Time Black / White * | 22 ? | 28.8 ? -31% | 27 ? -23% | 28 ? -27% | 9 ? 59% | 36 ? -64% | 36 ? -64% |
| PWM Frequency | 450 ? | 21550 ? | |||||
| Screen | -15% | -0% | 3% | -15% | -88% | -46% | |
| Brightness middle | 366 | 349 -5% | 301 -18% | 312 -15% | 253 -31% | 246 -33% | 239 -35% |
| Brightness | 348 | 337 -3% | 270 -22% | 304 -13% | 230 -34% | 235 -32% | 244 -30% |
| Brightness Distribution | 90 | 91 1% | 79 -12% | 85 -6% | 86 -4% | 75 -17% | 88 -2% |
| Black Level * | 0.35 | 0.58 -66% | 0.38 -9% | 0.23 34% | 0.24 31% | 0.55 -57% | 0.35 -0% |
| Contrast | 1046 | 602 -42% | 792 -24% | 1357 30% | 1054 1% | 447 -57% | 683 -35% |
| Colorchecker dE 2000 * | 4.4 | 4.5 -2% | 3.49 21% | 4.19 5% | 5.01 -14% | 10.97 -149% | 7.3 -66% |
| Colorchecker dE 2000 max. * | 9.7 | 10.2 -5% | 7.49 23% | 8.7 10% | 10.4 -7% | 24.7 -155% | |
| Greyscale dE 2000 * | 3 | 3.3 -10% | 1.88 37% | 3.72 -24% | 7.26 -142% | 14.25 -375% | 4.9 -63% |
| Gamma | 2.1 105% | 2.15 102% | 2.35 94% | 2.29 96% | 2.09 105% | 1.83 120% | 2.19 100% |
| CCT | 6362 102% | 6103 107% | 6587 99% | 7104 91% | 6329 103% | 11200 58% | 7332 89% |
| Color Space (Percent of AdobeRGB 1998) | 56 | 55.7 -1% | 56 0% | 59 5% | 76 36% | 35 -37% | 35 -37% |
| Color Space (Percent of sRGB) | 86 | 75.7 -12% | 86 0% | 91 6% | 100 16% | 55 -36% | 55 -36% |
| Media total (Programa/Opciones) | -14% /
-14% | -8% /
-3% | -12% /
-2% | 14% /
-5% | -60% /
-78% | -55% /
-49% |
* ... más pequeño es mejor
Tiempos de respuesta del display
| ↔ Tiempo de respuesta de Negro a Blanco | ||
|---|---|---|
| 22 ms ... subida ↗ y bajada ↘ combinada | ↗ 12.4 ms subida | 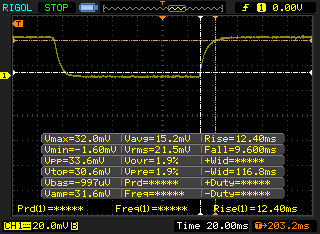 |
| ↘ 9.6 ms bajada | ||
| La pantalla mostró buenos tiempos de respuesta en nuestros tests pero podría ser demasiado lenta para los jugones competitivos. En comparación, todos los dispositivos de prueba van de ##min### (mínimo) a 240 (máximo) ms. » 42 % de todos los dispositivos son mejores. Eso quiere decir que el tiempo de respuesta es similar al dispositivo testado medio (21.5 ms). | ||
| ↔ Tiempo de respuesta 50% Gris a 80% Gris | ||
| 36 ms ... subida ↗ y bajada ↘ combinada | ↗ 18.4 ms subida | 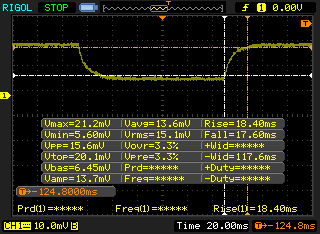 |
| ↘ 17.6 ms bajada | ||
| La pantalla mostró tiempos de respuesta lentos en nuestros tests y podría ser demasiado lenta para los jugones. En comparación, todos los dispositivos de prueba van de ##min### (mínimo) a 636 (máximo) ms. » 44 % de todos los dispositivos son mejores. Eso quiere decir que el tiempo de respuesta es similar al dispositivo testado medio (33.7 ms). | ||
Parpadeo de Pantalla / PWM (Pulse-Width Modulation)
| Parpadeo de Pantalla / PWM no detectado | 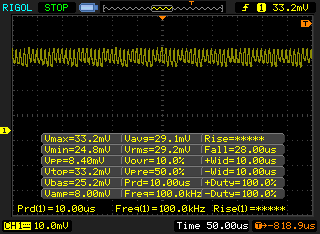 | ||
Comparación: 53 % de todos los dispositivos testados no usaron PWM para atenuar el display. Si se usó, medimos una media de 17900 (mínimo: 5 - máxmo: 3846000) Hz. | |||
| Cinebench R15 | |
| CPU Single 64Bit | |
| Aorus x3 Plus v7 | |
| Aorus X7 v6 AO-S107Q716-PL-005 | |
| Dell Inspiron 15 7000 7567 | |
| Asus GL753VE-DS74 | |
| Asus Strix GL753VD-GC045T | |
| MSI GT80 Titan SLI | |
| Acer Predator 17 G9-793-77LG | |
| Acer Aspire Nitro BE VN7-793G-5811 | |
| CPU Multi 64Bit | |
| Aorus x3 Plus v7 | |
| Aorus X7 v6 AO-S107Q716-PL-005 | |
| Asus Strix GL753VD-GC045T | |
| Asus GL753VE-DS74 | |
| MSI GT80 Titan SLI | |
| Dell Inspiron 15 7000 7567 | |
| Acer Predator 17 G9-793-77LG | |
| Acer Aspire Nitro BE VN7-793G-5811 | |
| Cinebench R11.5 | |
| CPU Single 64Bit | |
| Aorus x3 Plus v7 | |
| Asus Strix GL753VD-GC045T | |
| MSI GT80 Titan SLI | |
| Asus GL753VE-DS74 | |
| CPU Multi 64Bit | |
| Aorus x3 Plus v7 | |
| Asus Strix GL753VD-GC045T | |
| Asus GL753VE-DS74 | |
| MSI GT80 Titan SLI | |
| Cinebench R10 | |
| Rendering Multiple CPUs 32Bit | |
| Aorus x3 Plus v7 | |
| Asus GL753VE-DS74 | |
| MSI GT80 Titan SLI | |
| Acer Aspire Nitro BE VN7-793G-5811 | |
| Rendering Single 32Bit | |
| Aorus x3 Plus v7 | |
| Asus GL753VE-DS74 | |
| MSI GT80 Titan SLI | |
| Acer Aspire Nitro BE VN7-793G-5811 | |
| wPrime 2.10 - 1024m | |
| Aorus x3 Plus v7 | |
| Asus GL753VE-DS74 | |
| Aorus X7 v6 AO-S107Q716-PL-005 | |
* ... más pequeño es mejor
| PCMark 8 | |
| Home Score Accelerated v2 | |
| Nexoc G739 | |
| Asus Strix GL753VD-GC045T | |
| Dell Inspiron 15 7000 7567 | |
| Acer Aspire Nitro BE VN7-793G-5811 | |
| Asus GL753VE-DS74 | |
| Work Score Accelerated v2 | |
| Nexoc G739 | |
| Asus GL753VE-DS74 | |
| Dell Inspiron 15 7000 7567 | |
| Acer Aspire Nitro BE VN7-793G-5811 | |
| Creative Score Accelerated v2 | |
| Nexoc G739 | |
| Asus GL753VE-DS74 | |
| Acer Aspire Nitro BE VN7-793G-5811 | |
| PCMark 8 Home Score Accelerated v2 | 3570 puntos | |
| PCMark 8 Creative Score Accelerated v2 | 4243 puntos | |
| PCMark 8 Work Score Accelerated v2 | 5171 puntos | |
ayuda | ||
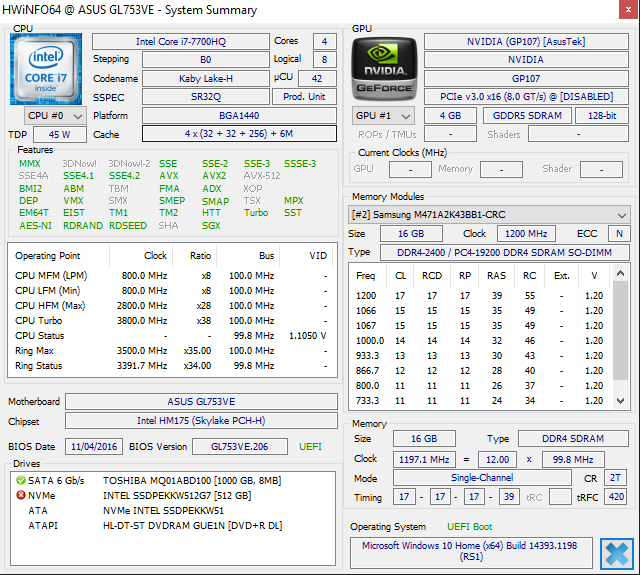
| Asus GL753VE-DS74 Intel SSD 600p SSDPEKKW512G7 | Asus Strix GL753VD-GC045T Micron SSD 1100 (MTFDDAV256TBN) | Acer Aspire Nitro BE VN7-793G-5811 Seagate Mobile HDD 1TB ST1000LM035 | Nexoc G739 Samsung PM961 MZVLW256HEHP | MSI GE72 7RE-046 Toshiba HG6 THNSNJ256G8NY | Dell Inspiron 15 7000 7567 Intel SSDSCKKF256H6 | Lenovo Legion Y520-15IKBN-80WK001KUS Samsung PM961 MZVLW256HEHP | |
|---|---|---|---|---|---|---|---|
| CrystalDiskMark 3.0 | 27% | -91% | 221% | 64% | 37% | 178% | |
| Read Seq | 1049 | 475.7 -55% | 117.6 -89% | 1666 59% | 540 -49% | 485.8 -54% | 2170 107% |
| Write Seq | 584 | 419.1 -28% | 109.1 -81% | 1192 104% | 495.7 -15% | 422.8 -28% | 1202 106% |
| Read 512 | 583 | 336.1 -42% | 39.93 -93% | 857 47% | 455.1 -22% | 338.9 -42% | 786 35% |
| Write 512 | 458 | 346.6 -24% | 98.6 -78% | 827 81% | 481.4 5% | 304 -34% | 822 79% |
| Read 4k | 14.1 | 24.7 75% | 0.435 -97% | 60.7 330% | 22.7 61% | 27.11 92% | 58.9 318% |
| Write 4k | 108 | 76.8 -29% | 3.152 -97% | 154.5 43% | 112.9 5% | 85.4 -21% | 146.4 36% |
| Read 4k QD32 | 57.8 | 247.6 328% | 1.008 -98% | 636 1000% | 372.5 544% | 279.6 384% | 457.7 692% |
| Write 4k QD32 | 264 | 234.9 -11% | 4.705 -98% | 544 106% | 212.9 -19% | 255.1 -3% | 392.9 49% |

| 3DMark Ice Storm Standard Score | 62164 puntos | |
| 3DMark Cloud Gate Standard Score | 20619 puntos | |
| 3DMark Fire Strike Score | 6584 puntos | |
| 3DMark Fire Strike Extreme Score | 3495 puntos | |
ayuda | ||
| BioShock Infinite - 1920x1080 Ultra Preset, DX11 (DDOF) (ordenar por valor) | |
| Asus GL753VE-DS74 | |
| Dell Inspiron 15 7000 7567 | |
| Lenovo Legion Y520-15IKBN-80WK001KUS | |
| HP Pavilion 17 FHD V3A33AV | |
| Metro: Last Light - 1920x1080 Very High (DX11) AF:16x (ordenar por valor) | |
| Asus GL753VE-DS74 | |
| Asus Strix GL753VD-GC045T | |
| HP Pavilion 17 FHD V3A33AV | |
| Thief - 1920x1080 Very High Preset AA:FXAA & High SS AF:8x (ordenar por valor) | |
| Asus GL753VE-DS74 | |
| HP Pavilion 17 FHD V3A33AV | |
| The Witcher 3 - 1920x1080 Ultra Graphics & Postprocessing (HBAO+) (ordenar por valor) | |
| Asus GL753VE-DS74 | |
| Asus Strix GL753VD-GC045T | |
| Lenovo Legion Y520-15IKBN-80WK001KUS | |
| Acer Aspire V17 Nitro BE VN7-793G-706L | |
| Fallout 4 - 1920x1080 Ultra Preset AA:T AF:16x (ordenar por valor) | |
| Asus GL753VE-DS74 | |
| Asus Strix GL753VD-GC045T | |
| Acer Aspire V17 Nitro BE VN7-793G-706L | |
| HP Pavilion 17 FHD V3A33AV | |
| Rise of the Tomb Raider - 1920x1080 Very High Preset AA:FX AF:16x (ordenar por valor) | |
| Asus GL753VE-DS74 | |
| Asus Strix GL753VD-GC045T | |
| Dell Inspiron 15 7000 7567 | |
| Lenovo Legion Y520-15IKBN-80WK001KUS | |
| Acer Aspire V17 Nitro BE VN7-793G-706L | |
| HP Pavilion 17 FHD V3A33AV | |
| Ashes of the Singularity - 1920x1080 high (ordenar por valor) | |
| Asus GL753VE-DS74 | |
| Asus Strix GL753VD-GC045T | |
| Doom - 1920x1080 Ultra Preset AA:SM (ordenar por valor) | |
| Asus GL753VE-DS74 | |
| Asus Strix GL753VD-GC045T | |
| Dell Inspiron 15 7000 7567 | |
| HP Omen 17-w010ng | |
| Mafia 3 - 1920x1080 High Preset (ordenar por valor) | |
| Asus GL753VE-DS74 | |
| Asus Strix GL753VD-GC045T | |
| Dell Inspiron 15 7000 7567 | |
| bajo | medio | alto | ultra | |
| BioShock Infinite (2013) | 97 | |||
| Metro: Last Light (2013) | 59 | |||
| Thief (2014) | 50 | |||
| The Witcher 3 (2015) | 32 | |||
| Fallout 4 (2015) | 44 | |||
| Rise of the Tomb Raider (2016) | 37 | |||
| Ashes of the Singularity (2016) | 36 | |||
| Doom (2016) | 62 | |||
| Mafia 3 (2016) | 31 |
(+) The maximum temperature on the upper side is 35.8 °C / 96 F, compared to the average of 40.4 °C / 105 F, ranging from 21.2 to 68.8 °C for the class Gaming.
(+) The bottom heats up to a maximum of 36.4 °C / 98 F, compared to the average of 43.2 °C / 110 F
(+) In idle usage, the average temperature for the upper side is 21.5 °C / 71 F, compared to the device average of 33.8 °C / 93 F.
(+) Playing The Witcher 3, the average temperature for the upper side is 28 °C / 82 F, compared to the device average of 33.8 °C / 93 F.
(+) The palmrests and touchpad are cooler than skin temperature with a maximum of 27.2 °C / 81 F and are therefore cool to the touch.
(±) The average temperature of the palmrest area of similar devices was 28.9 °C / 84 F (+1.7 °C / 3 F).
Ruido
| Ocioso |
| 33.3 / 33.3 / 33.4 dB(A) |
| Carga |
| 42.6 / 46.8 dB(A) |
 | ||
30 dB silencioso 40 dB(A) audible 50 dB(A) ruidosamente alto |
||
min: | ||
| Asus GL753VE-DS74 GeForce GTX 1050 Ti Mobile, i7-7700HQ, Intel SSD 600p SSDPEKKW512G7 | Asus Strix GL753VD-GC045T GeForce GTX 1050 Mobile, i7-7700HQ, Micron SSD 1100 (MTFDDAV256TBN) | Acer Aspire Nitro BE VN7-793G-5811 GeForce GTX 1050 Ti Mobile, i5-7300HQ, Seagate Mobile HDD 1TB ST1000LM035 | Nexoc G739 GeForce GTX 1050 Ti Mobile, i7-7700HQ, Samsung PM961 MZVLW256HEHP | MSI GE72 7RE-046 GeForce GTX 1050 Ti Mobile, i7-7700HQ, Toshiba HG6 THNSNJ256G8NY | Dell Inspiron 15 7000 7567 GeForce GTX 1050 Ti Mobile, i7-7700HQ, Intel SSDSCKKF256H6 | Lenovo Legion Y520-15IKBN-80WK001KUS GeForce GTX 1050 Ti Mobile, i7-7700HQ, Samsung PM961 MZVLW256HEHP | |
|---|---|---|---|---|---|---|---|
| Noise | -3% | 10% | -3% | -3% | 1% | 8% | |
| off / environment * | 29.1 | 28.8 1% | 29.7 -2% | 30 -3% | 30 -3% | 30.3 -4% | 27.7 5% |
| Idle Minimum * | 33.3 | 33.9 -2% | 30.2 9% | 31 7% | 34 -2% | 30.9 7% | 30.5 8% |
| Idle Average * | 33.3 | 33.9 -2% | 30.2 9% | 32 4% | 35 -5% | 30.9 7% | 30.5 8% |
| Idle Maximum * | 33.4 | 37.8 -13% | 30.6 8% | 38 -14% | 36 -8% | 31 7% | 30.6 8% |
| Load Average * | 42.6 | 42.7 -0% | 33.8 21% | 44 -3% | 41 4% | 46.5 -9% | 40 6% |
| Witcher 3 ultra * | 46.8 | 39.5 16% | 40 15% | ||||
| Load Maximum * | 46.8 | 47.4 -1% | 42.6 9% | 50 -7% | 49 -5% | 46.8 -0% | 42.6 9% |
* ... más pequeño es mejor
Acer Aspire Nitro BE VN7-793G-5811 audio analysis
(±) | speaker loudness is average but good (72 dB)
Bass 100 - 315 Hz
(±) | reduced bass - on average 6.9% lower than median
(+) | bass is linear (5.5% delta to prev. frequency)
Mids 400 - 2000 Hz
(+) | balanced mids - only 4.5% away from median
(+) | mids are linear (6.3% delta to prev. frequency)
Highs 2 - 16 kHz
(+) | balanced highs - only 1.1% away from median
(+) | highs are linear (3.5% delta to prev. frequency)
Overall 100 - 16.000 Hz
(+) | overall sound is linear (11.5% difference to median)
Compared to same class
» 11% of all tested devices in this class were better, 4% similar, 85% worse
» The best had a delta of 5%, average was 18%, worst was 45%
Compared to all devices tested
» 5% of all tested devices were better, 2% similar, 93% worse
» The best had a delta of 4%, average was 25%, worst was 134%
MSI GE72 7RE-046 audio analysis
(+) | speakers can play relatively loud (91 dB)
Bass 100 - 315 Hz
(-) | nearly no bass - on average 17.2% lower than median
(±) | linearity of bass is average (9.2% delta to prev. frequency)
Mids 400 - 2000 Hz
(+) | balanced mids - only 3.3% away from median
(+) | mids are linear (4.7% delta to prev. frequency)
Highs 2 - 16 kHz
(+) | balanced highs - only 3.3% away from median
(+) | highs are linear (4% delta to prev. frequency)
Overall 100 - 16.000 Hz
(+) | overall sound is linear (13.7% difference to median)
Compared to same class
» 19% of all tested devices in this class were better, 6% similar, 75% worse
» The best had a delta of 6%, average was 18%, worst was 132%
Compared to all devices tested
» 12% of all tested devices were better, 3% similar, 85% worse
» The best had a delta of 4%, average was 25%, worst was 134%
| Off / Standby | |
| Ocioso | |
| Carga |
|
| Asus GL753VE-DS74 i7-7700HQ, GeForce GTX 1050 Ti Mobile, Intel SSD 600p SSDPEKKW512G7, IPS, 1920x1080, 17.30 | Asus Strix GL753VD-GC045T i7-7700HQ, GeForce GTX 1050 Mobile, Micron SSD 1100 (MTFDDAV256TBN), LED IPS, 1920x1080, 17.30 | Acer Aspire Nitro BE VN7-793G-5811 i5-7300HQ, GeForce GTX 1050 Ti Mobile, Seagate Mobile HDD 1TB ST1000LM035, IPS, 1920x1080, 17.30 | Nexoc G739 i7-7700HQ, GeForce GTX 1050 Ti Mobile, Samsung PM961 MZVLW256HEHP, IPS, 1920x1080, 17.30 | MSI GE72 7RE-046 i7-7700HQ, GeForce GTX 1050 Ti Mobile, Toshiba HG6 THNSNJ256G8NY, TN LED, 1920x1080, 17.30 | Dell Inspiron 15 7000 7567 i7-7700HQ, GeForce GTX 1050 Ti Mobile, Intel SSDSCKKF256H6, TN, 1920x1080, 15.60 | Lenovo Legion Y520-15IKBN-80WK001KUS i7-7700HQ, GeForce GTX 1050 Ti Mobile, Samsung PM961 MZVLW256HEHP, IPS, 1920x1080, 15.60 | |
|---|---|---|---|---|---|---|---|
| Power Consumption | -5% | -10% | -30% | -58% | 21% | 4% | |
| Idle Minimum * | 7.5 | 6.2 17% | 8.7 -16% | 7 7% | 14 -87% | 4.4 41% | 8.5 -13% |
| Idle Average * | 11.3 | 12.2 -8% | 12.4 -10% | 14 -24% | 20 -77% | 6.8 40% | 9.1 19% |
| Idle Maximum * | 11.8 | 14.8 -25% | 15.4 -31% | 23 -95% | 25 -112% | 8.3 30% | 9.7 18% |
| Load Average * | 82.1 | 84.9 -3% | 73 11% | 82 -0% | 82 -0% | 81 1% | 79.9 3% |
| Witcher 3 ultra * | 96.3 | 98 -2% | 97.7 -1% | ||||
| Load Maximum * | 116.6 | 120.7 -4% | 130 -11% | 163 -40% | 135 -16% | 127 -9% | 121.5 -4% |
* ... más pequeño es mejor
| Asus GL753VE-DS74 i7-7700HQ, GeForce GTX 1050 Ti Mobile, 48 Wh | Asus Strix GL753VD-GC045T i7-7700HQ, GeForce GTX 1050 Mobile, 48 Wh | Acer Aspire Nitro BE VN7-793G-5811 i5-7300HQ, GeForce GTX 1050 Ti Mobile, 52.5 Wh | Nexoc G739 i7-7700HQ, GeForce GTX 1050 Ti Mobile, 62 Wh | MSI GE72 7RE-046 i7-7700HQ, GeForce GTX 1050 Ti Mobile, 51.4 Wh | Dell Inspiron 15 7000 7567 i7-7700HQ, GeForce GTX 1050 Ti Mobile, 74 Wh | Lenovo Legion Y520-15IKBN-80WK001KUS i7-7700HQ, GeForce GTX 1050 Ti Mobile, 45 Wh | |
|---|---|---|---|---|---|---|---|
| Duración de Batería | 2% | 18% | 71% | -22% | 121% | -1% | |
| Reader / Idle | 520 | 515 -1% | 613 18% | 1174 126% | 509 -2% | ||
| WiFi v1.3 | 235 | 261 11% | 278 18% | 288 23% | 184 -22% | 622 165% | 240 2% |
| Load | 47 | 45 -4% | 128 172% | 81 72% | 46 -2% |
Pro
Contra
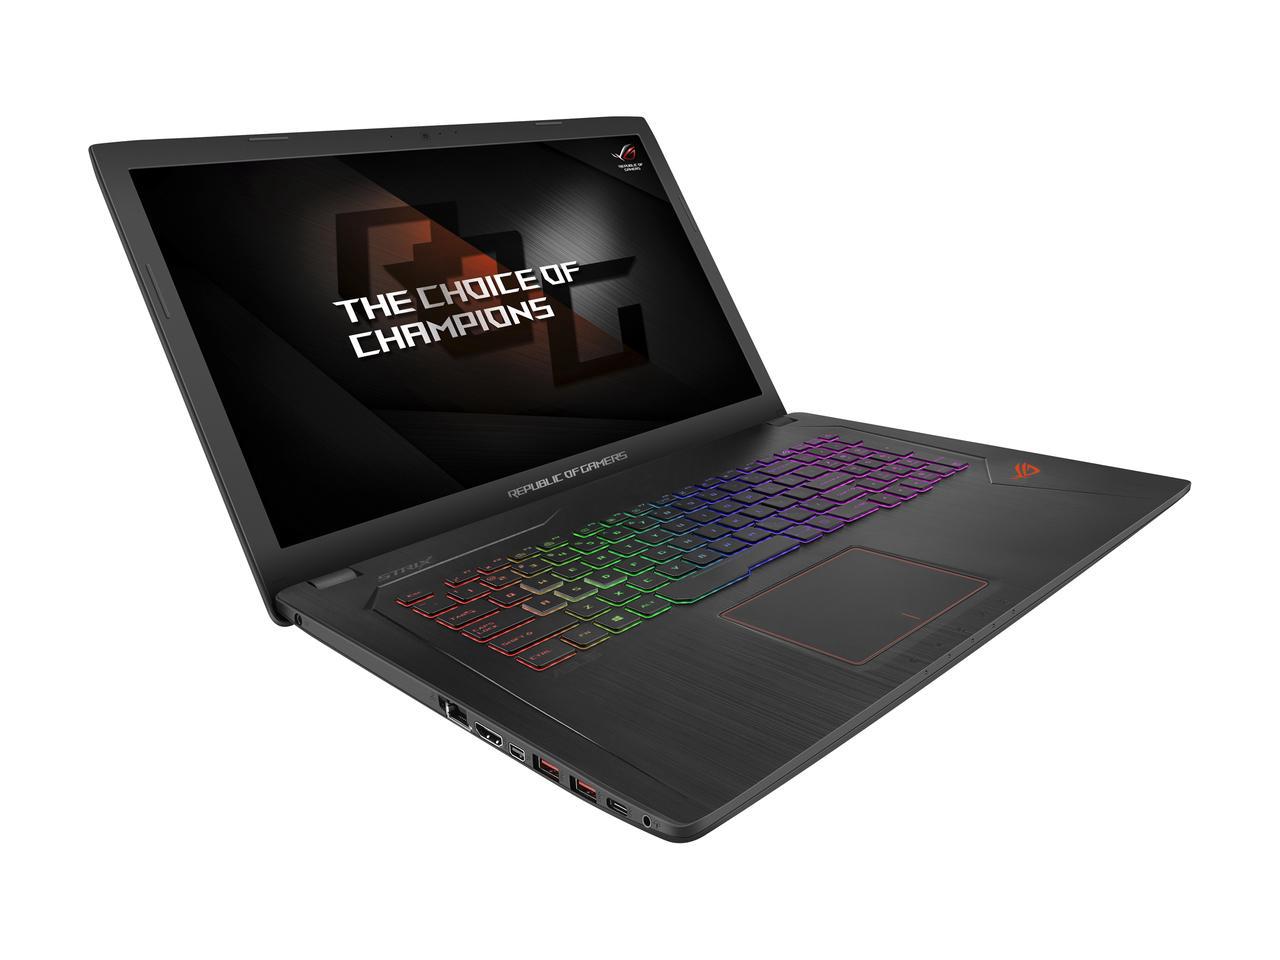

Después de todo esto, ¿Qué queda que decir sobre el GL753VE? Asus ha creado un portátil muy bien equilibrado, y su enfoque multiuso destaca aquí. Hay algunos pros de este modelo en particular de la linea ROG: La GTX 1050 Ti puede soportar juegos a 1080p sin consumir mucho o generar mucho calor, gestiona bien sus temperaturas y ruido de sistema y usar la pantalla es una maravilla.
Aunque hay algunos inconvenientes. La CPU no llega a utilizar todo su potencial bajo carga, lo que puede echar atrás a algunos usuarios. Aunque supongamos que esto está hecho para gestionar las emisiones, sigue siendo un golpe contra el dispositivo. El pobre posicionamiento de puertos del GL753VD sigue presente en esta variante. Quizás la peor parte sea su precio. Este modelo está a $1,400 y el modelo base a $1,300, su elevado precio puede ser difícil de aceptar. Hay portátiles que ofrecen características similares por un precio mucho menor.
El Dell Inspiron 7000 y el Lenovo Legion Y520 dan bastante guerra. Aunque son mucho más simples y más pequeños, ofrecen una relación precio/rendimiento irresistible que es difícil de batir. Los precios de estos dos portátiles han bajado y se pueden encontrar en oferta fácilmente, lo que mejora esta opción.
Subiendo el precio, el Asus GL753VE ofrece unos extras muy buenos. La pantalla es brillante y preciosa, el teclado es excelente (¡Y tiene iluminación RGB!) y el paquete en general está bien afinado y equilibrado. Como sea, para gamers con poco presupuesto hay opciones mucho mas baratas disponibles que ofrecen un rendimiento similar o mejor.
Los usuarios a los que no les importe sacrificar algunos detalles deben pasar del Asus GL753VE, pero aquellos que prefieran gastar un poco más por un paquete más completo deberían quedar contentos con este portátil.
Ésta es una versión acortada del análisis original. Puedes leer el análisis completo en inglés aquí.
Asus GL753VE-DS74
-
05/29/2017 v6(old)
Sam Medley
Pricecompare
