 Deutsch
 English
 Español
 Français
 Italiano
 Nederlands
 Polski
 Português
 Русский
 Türkçe
 Svenska
 Chinese
 Magyar
Breve análisis del portátil HP Omen 17 (GTX 1060)


| SD Card Reader | |
| average JPG Copy Test (av. of 3 runs) | |
| Gigabyte P57X v6 | |
| HP Omen 17-w110ng | |
| HP Omen 17-w100ng | |
| Asus GL702VM-GC102D | |
| MSI GS73VR 6RF | |
| maximum AS SSD Seq Read Test (1GB) | |
| Gigabyte P57X v6 | |
| HP Omen 17-w110ng | |
| HP Omen 17-w100ng | |
| Asus GL702VM-GC102D | |
| MSI GS73VR 6RF | |
| Networking | |
| iperf3 receive AX12 | |
| HP Omen 17-w110ng | |
| HP Omen 17-w100ng | |
| iperf3 transmit AX12 | |
| HP Omen 17-w110ng | |
| HP Omen 17-w100ng | |
| |||||||||||||||||||||||||
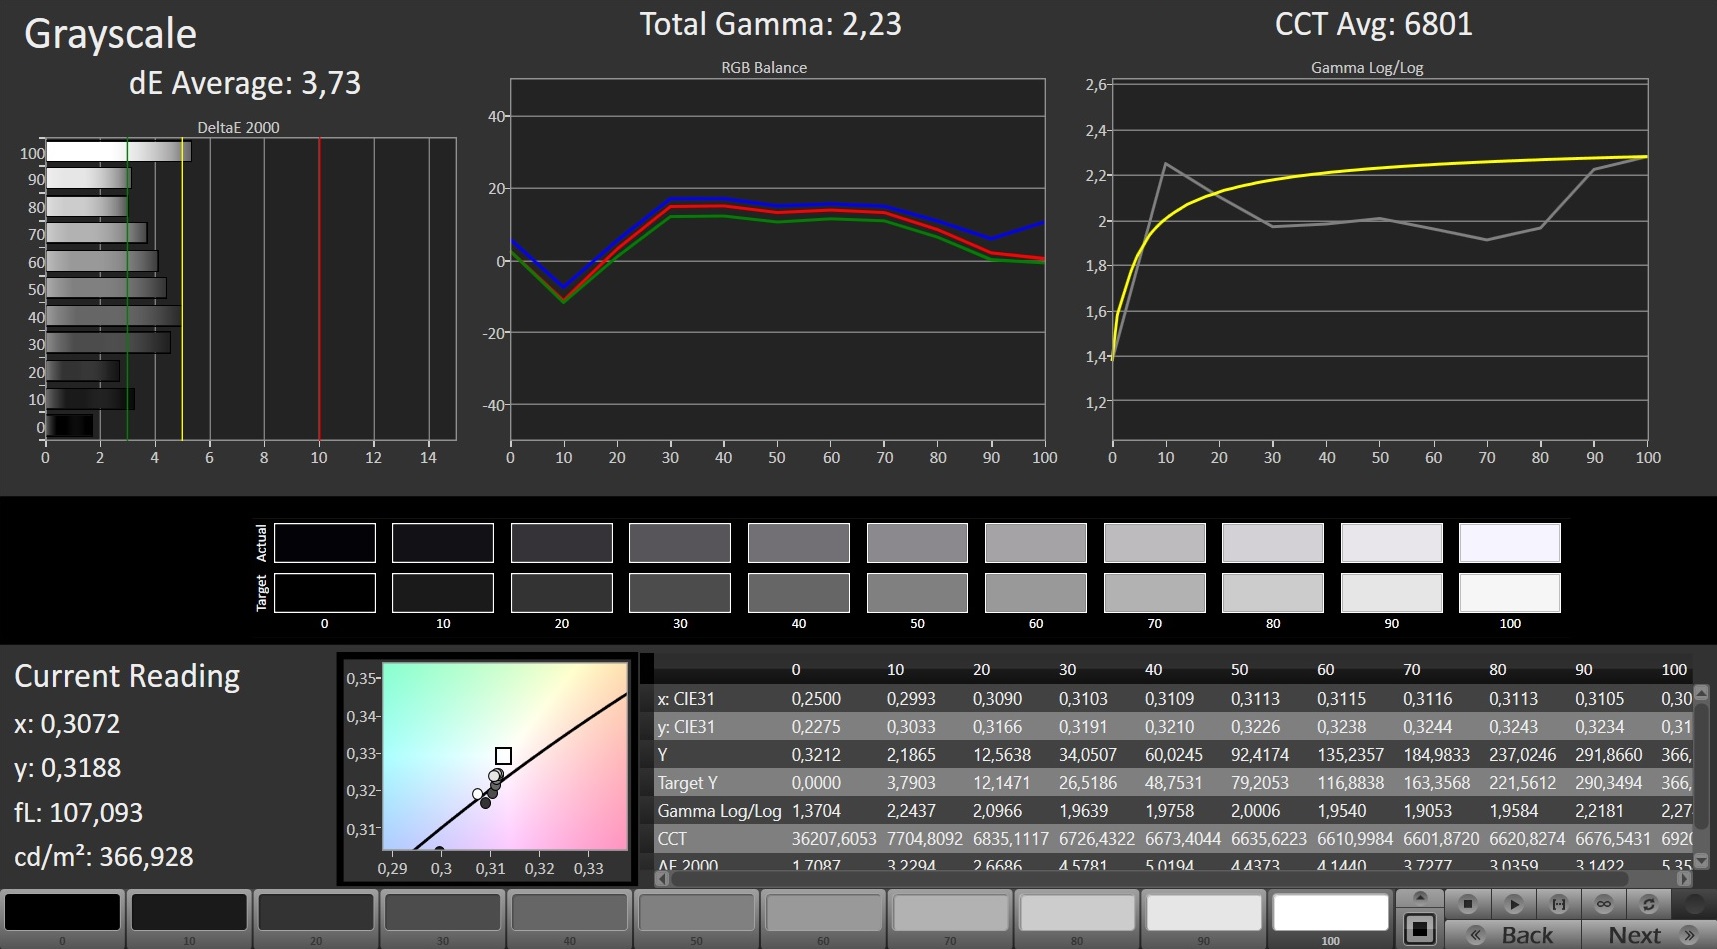
iluminación: 84 %
Brillo con batería: 342 cd/m²
Contraste: 1069:1 (Negro: 0.32 cd/m²)
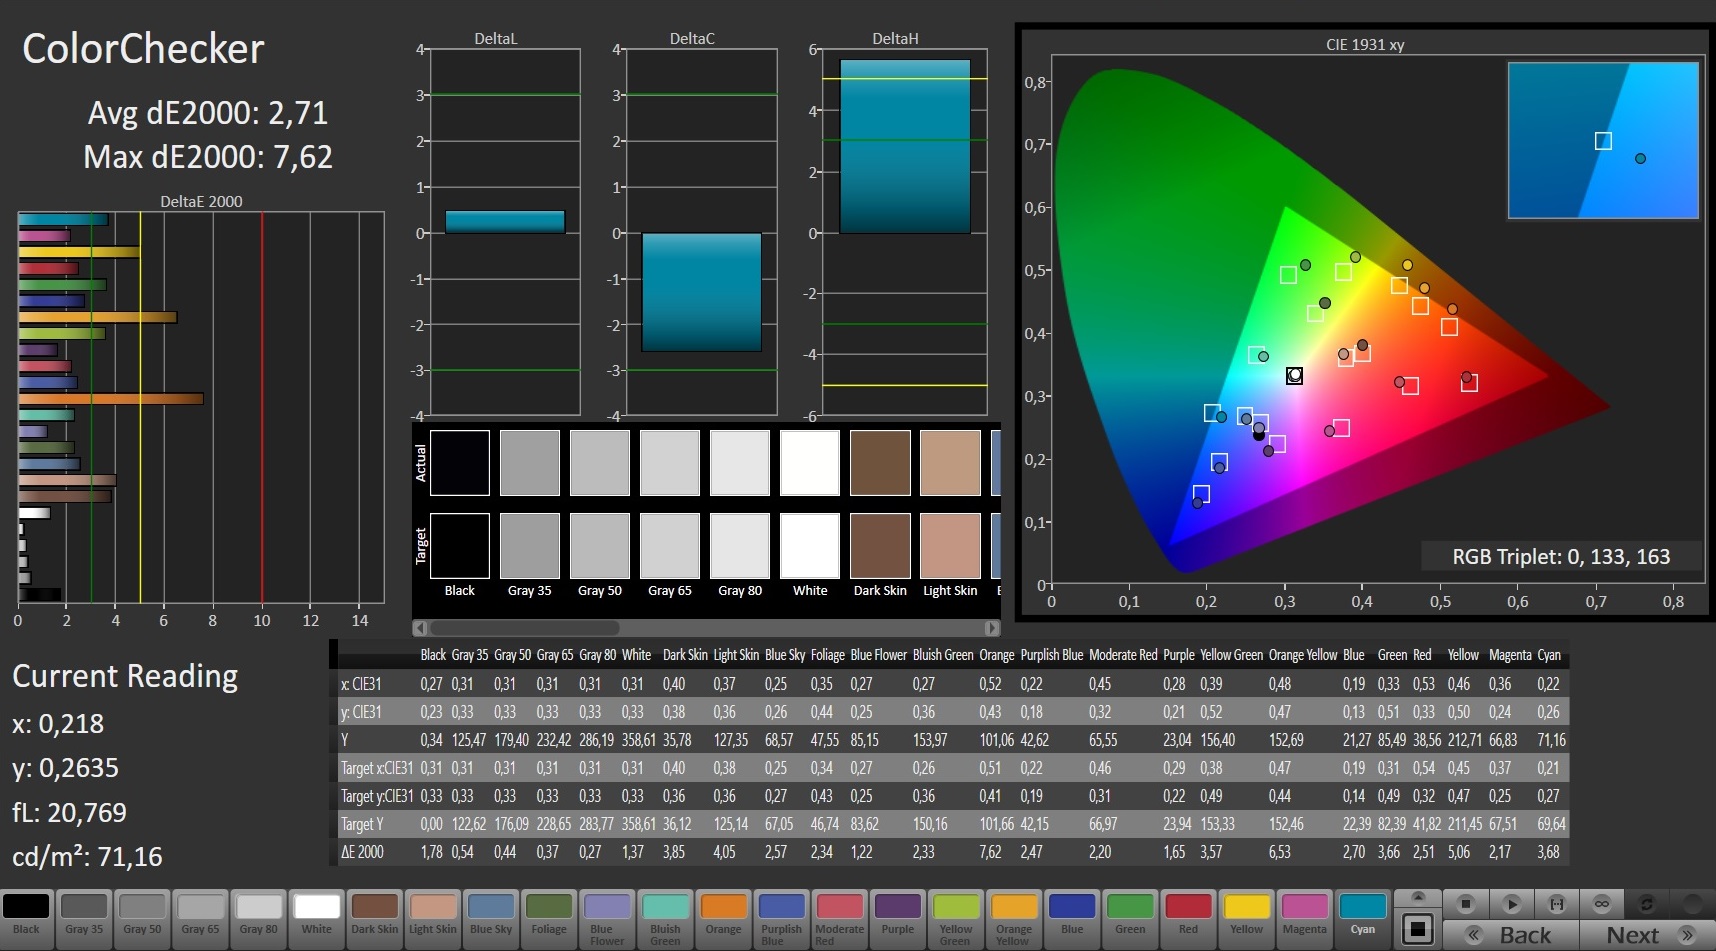
ΔE Color 4.35 | 0.5-29.43 Ø5
ΔE Greyscale 3.73 | 0.57-98 Ø5.3
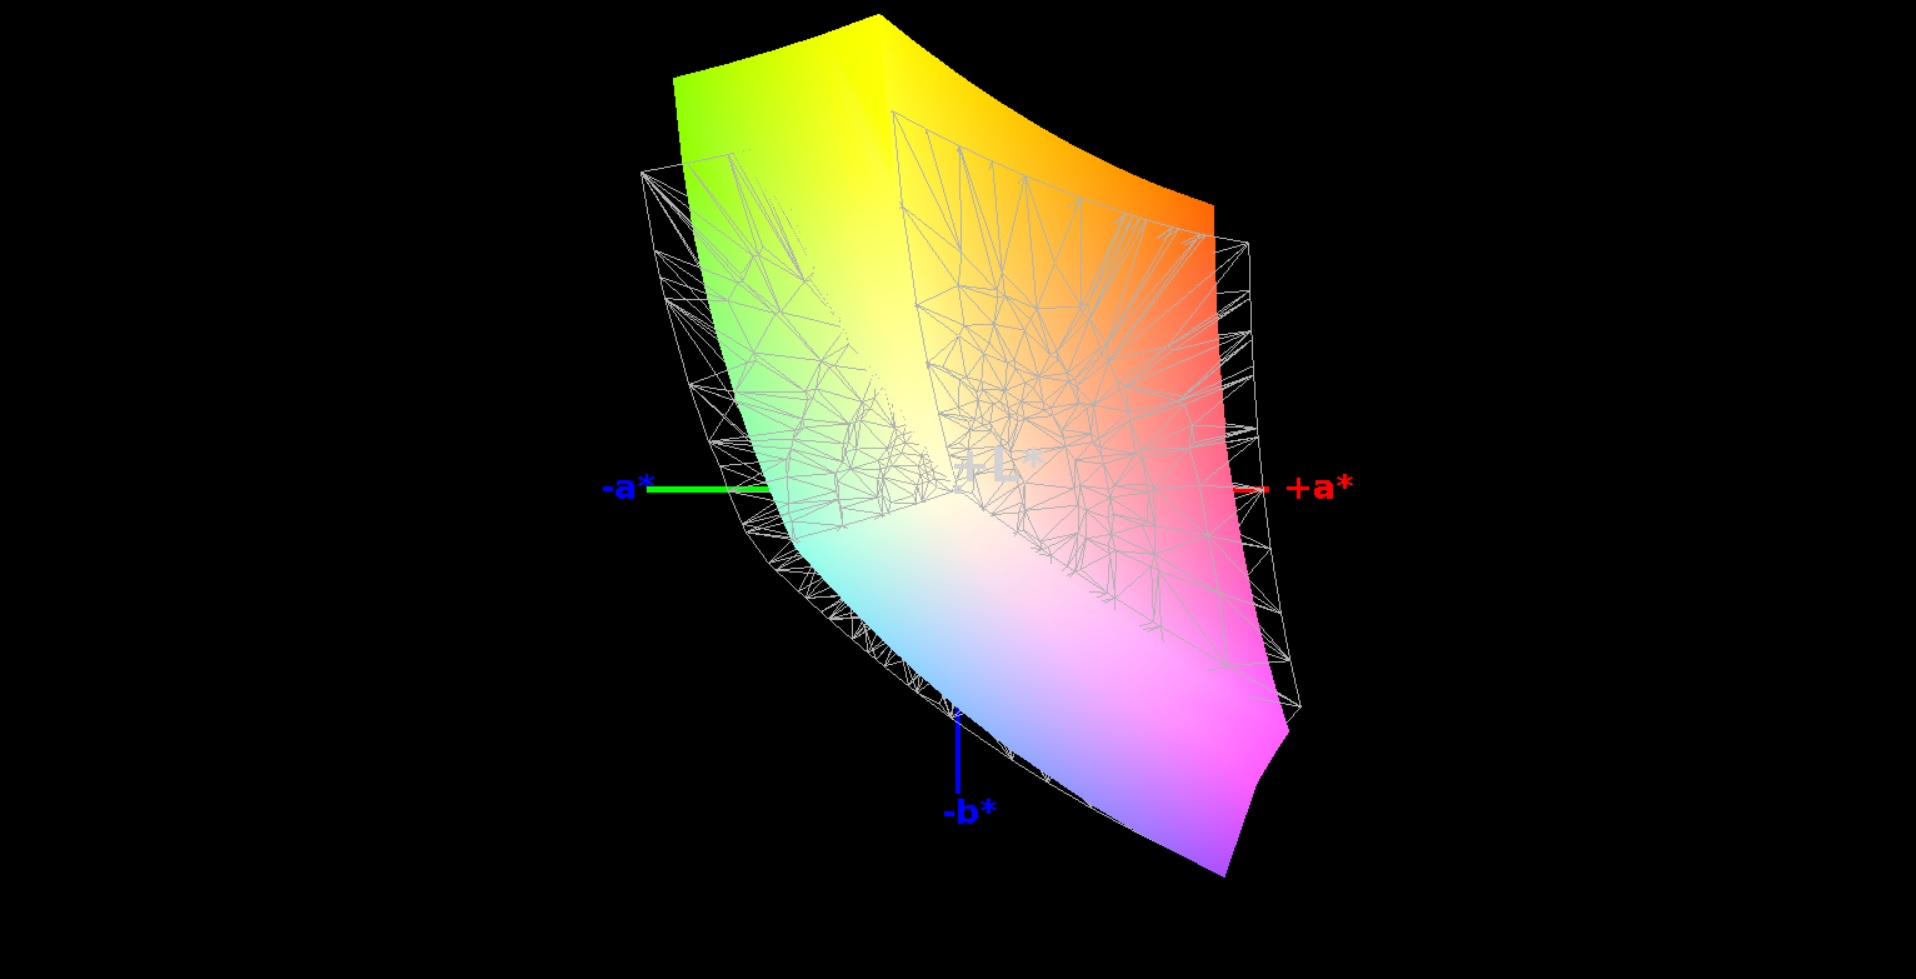
86% sRGB (Argyll 1.6.3 3D)
57% AdobeRGB 1998 (Argyll 1.6.3 3D)
63.3% AdobeRGB 1998 (Argyll 2.2.0 3D)
86.6% sRGB (Argyll 2.2.0 3D)
67.2% Display P3 (Argyll 2.2.0 3D)
Gamma: 2.23
| HP Omen 17-w100ng LG Philips LGD046E, 1920x1080 | Asus GL702VM-GC102D LG Philips LP173WF4-SPF3, 1920x1080 | MSI GS73VR 6RF 1920x1080 | Gigabyte P57X v6 LGD0469, 1920x1080 | HP Omen 17-w110ng LG Philips LGD046E, 1920x1080 | |
|---|---|---|---|---|---|
| Display | -3% | 27% | 1% | -2% | |
| Display P3 Coverage | 67.2 | 65.1 -3% | 90 34% | 68 1% | 66.6 -1% |
| sRGB Coverage | 86.6 | 83.5 -4% | 99.9 15% | 87.5 1% | 84.1 -3% |
| AdobeRGB 1998 Coverage | 63.3 | 61.1 -3% | 83.6 32% | 64 1% | 61.5 -3% |
| Response Times | -1% | 41% | 1% | -1% | |
| Response Time Grey 50% / Grey 80% * | 35 ? | 38 ? -9% | 28 ? 20% | 33.6 ? 4% | 37 ? -6% |
| Response Time Black / White * | 25 ? | 23 ? 8% | 9.6 ? 62% | 25.6 ? -2% | 24 ? 4% |
| PWM Frequency | |||||
| Screen | -28% | 15% | -10% | 2% | |
| Brightness middle | 342 | 326 -5% | 337.2 -1% | 329.2 -4% | 362 6% |
| Brightness | 331 | 312 -6% | 315 -5% | 321 -3% | 342 3% |
| Brightness Distribution | 84 | 91 8% | 86 2% | 93 11% | 87 4% |
| Black Level * | 0.32 | 0.5 -56% | 0.308 4% | 0.267 17% | 0.31 3% |
| Contrast | 1069 | 652 -39% | 1095 2% | 1233 15% | 1168 9% |
| Colorchecker dE 2000 * | 4.35 | 6.3 -45% | 2.96 32% | 5.93 -36% | 4.5 -3% |
| Colorchecker dE 2000 max. * | 9.24 | 11.69 -27% | 5.45 41% | 11.07 -20% | 9.31 -1% |
| Greyscale dE 2000 * | 3.73 | 7.37 -98% | 2.57 31% | 6.72 -80% | 3.48 7% |
| Gamma | 2.23 99% | 2.37 93% | 2.25 98% | 2.12 104% | 2.23 99% |
| CCT | 6801 96% | 7116 91% | 7114 91% | 7611 85% | 6144 106% |
| Color Space (Percent of AdobeRGB 1998) | 57 | 55 -4% | 74.3 30% | 57 0% | 55 -4% |
| Color Space (Percent of sRGB) | 86 | 83 -3% | 100 16% | 87 1% | 84 -2% |
| Media total (Programa/Opciones) | -11% /
-19% | 28% /
21% | -3% /
-6% | -0% /
1% |
* ... más pequeño es mejor
Parpadeo de Pantalla / PWM (Pulse-Width Modulation)
| Parpadeo de Pantalla / PWM no detectado | 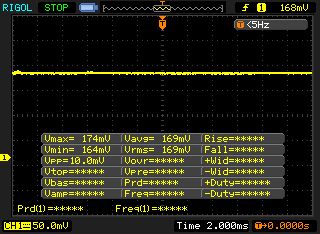 | ||
Comparación: 53 % de todos los dispositivos testados no usaron PWM para atenuar el display. Si se usó, medimos una media de 17924 (mínimo: 5 - máxmo: 3846000) Hz. | |||


Tiempos de respuesta del display
| ↔ Tiempo de respuesta de Negro a Blanco | ||
|---|---|---|
| 25 ms ... subida ↗ y bajada ↘ combinada | ↗ 4 ms subida | 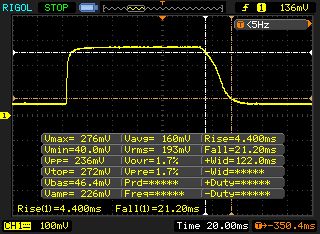 |
| ↘ 21 ms bajada | ||
| La pantalla mostró tiempos de respuesta relativamente lentos en nuestros tests pero podría ser demasiado lenta para los jugones. En comparación, todos los dispositivos de prueba van de ##min### (mínimo) a 240 (máximo) ms. » 53 % de todos los dispositivos son mejores. Eso quiere decir que el tiempo de respuesta es peor que la media (21.5 ms) de todos los dispositivos testados. | ||
| ↔ Tiempo de respuesta 50% Gris a 80% Gris | ||
| 35 ms ... subida ↗ y bajada ↘ combinada | ↗ 14 ms subida |  |
| ↘ 21 ms bajada | ||
| La pantalla mostró tiempos de respuesta lentos en nuestros tests y podría ser demasiado lenta para los jugones. En comparación, todos los dispositivos de prueba van de ##min### (mínimo) a 636 (máximo) ms. » 42 % de todos los dispositivos son mejores. Eso quiere decir que el tiempo de respuesta es similar al dispositivo testado medio (33.7 ms). | ||

| Cinebench R15 | |
| CPU Single 64Bit | |
| HP Omen 17-w110ng | |
| Gigabyte P57X v6 | |
| Acer Aspire V Nitro VN7-792G-55SF | |
| MSI GS73VR 6RF | |
| Asus GL702VM-GC102D | |
| HP Omen 17-w100ng | |
| Dell XPS 15 2016 9550 | |
| CPU Multi 64Bit | |
| HP Omen 17-w110ng | |
| Asus GL702VM-GC102D | |
| MSI GS73VR 6RF | |
| Gigabyte P57X v6 | |
| Acer Aspire V Nitro VN7-792G-55SF | |
| HP Omen 17-w100ng | |
| Dell XPS 15 2016 9550 | |
| Cinebench R10 | |
| Rendering Multiple CPUs 32Bit | |
| HP Omen 17-w110ng | |
| Asus GL702VM-GC102D | |
| MSI GS73VR 6RF | |
| Acer Aspire V Nitro VN7-792G-55SF | |
| HP Omen 17-w100ng | |
| Dell XPS 15 2016 9550 | |
| Rendering Single 32Bit | |
| HP Omen 17-w110ng | |
| Asus GL702VM-GC102D | |
| Acer Aspire V Nitro VN7-792G-55SF | |
| MSI GS73VR 6RF | |
| HP Omen 17-w100ng | |
| Dell XPS 15 2016 9550 | |
| Geekbench 3 | |
| 32 Bit Single-Core Score | |
| Acer Aspire V Nitro VN7-792G-55SF | |
| HP Omen 17-w100ng | |
| Asus GL702VM-GC102D | |
| 32 Bit Multi-Core Score | |
| Asus GL702VM-GC102D | |
| Acer Aspire V Nitro VN7-792G-55SF | |
| HP Omen 17-w100ng | |
| Geekbench 4.0 | |
| 64 Bit Single-Core Score | |
| HP Omen 17-w100ng | |
| Asus GL702VM-GC102D | |
| 64 Bit Multi-Core Score | |
| Asus GL702VM-GC102D | |
| HP Omen 17-w100ng | |
| JetStream 1.1 - Total Score | |
| HP Omen 17-w110ng | |
| Gigabyte P57X v6 | |
| Asus GL702VM-GC102D | |
| MSI GS73VR 6RF | |
| HP Omen 17-w100ng | |
| Acer Aspire V Nitro VN7-792G-55SF | |
| PCMark 7 Score | 5990 puntos | |
| PCMark 8 Home Score Accelerated v2 | 4711 puntos | |
| PCMark 8 Creative Score Accelerated v2 | 6858 puntos | |
| PCMark 8 Work Score Accelerated v2 | 5252 puntos | |
ayuda | ||
| PCMark 8 | |
| Home Score Accelerated v2 | |
| HP Omen 17-w110ng | |
| HP Omen 17-w100ng | |
| Asus GL702VM-GC102D | |
| Gigabyte P57X v6 | |
| MSI GS73VR 6RF | |
| Work Score Accelerated v2 | |
| HP Omen 17-w110ng | |
| HP Omen 17-w100ng | |
| Gigabyte P57X v6 | |
| Asus GL702VM-GC102D | |
| MSI GS73VR 6RF | |

| HP Omen 17-w100ng SanDisk Z400s SD8SNAT-128G | Asus GL702VM-GC102D HGST Travelstar 7K1000 HTS721010A9E630 | MSI GS73VR 6RF SanDisk SD8SN8U1T001122 | Gigabyte P57X v6 Transcend MTS800 256GB M.2 (TS256GMTS800) | HP Omen 17-w110ng Samsung PM951 NVMe MZVLV256 | |
|---|---|---|---|---|---|
| CrystalDiskMark 3.0 | -80% | 13% | 43% | 122% | |
| Read Seq | 495 | 134.6 -73% | 334.3 -32% | 481.7 -3% | 1156 134% |
| Write Seq | 180.2 | 130.6 -28% | 319 77% | 315.4 75% | 294.9 64% |
| Read 512 | 315.5 | 44.85 -86% | 242.3 -23% | 303.1 -4% | 616 95% |
| Write 512 | 172.4 | 63.3 -63% | 254.4 48% | 314.4 82% | 294.7 71% |
| Read 4k | 20.25 | 0.602 -97% | 20.3 0% | 25.93 28% | 42.7 111% |
| Write 4k | 76.1 | 1.146 -98% | 42.51 -44% | 84.6 11% | 153.3 101% |
| Read 4k QD32 | 141.6 | 1.106 -99% | 251.6 78% | 273.9 93% | 600 324% |
| Write 4k QD32 | 170.8 | 1.186 -99% | 167.1 -2% | 274.9 61% | 295.3 73% |
| 3DMark 06 Standard Score | 24318 puntos | |
| 3DMark 11 Performance | 10805 puntos | |
| 3DMark Ice Storm Standard Score | 111645 puntos | |
| 3DMark Cloud Gate Standard Score | 15394 puntos | |
| 3DMark Fire Strike Score | 8654 puntos | |
| 3DMark Fire Strike Extreme Score | 4806 puntos | |
| 3DMark Time Spy Score | 3339 puntos | |
ayuda | ||
| 3DMark | |
| 1280x720 Cloud Gate Standard Graphics | |
| HP Omen 17-w110ng | |
| Gigabyte P57X v6 | |
| Asus GL702VM-GC102D | |
| HP Omen 17-w100ng | |
| MSI GS73VR 6RF | |
| 1920x1080 Fire Strike Graphics | |
| HP Omen 17-w110ng | |
| MSI GS73VR 6RF | |
| HP Omen 17-w100ng | |
| Asus GL702VM-GC102D | |
| 3DMark 11 - 1280x720 Performance GPU | |
| Gigabyte P57X v6 | |
| HP Omen 17-w110ng | |
| MSI GS73VR 6RF | |
| HP Omen 17-w100ng | |
| Asus GL702VM-GC102D | |
| BioShock Infinite - 1920x1080 Ultra Preset, DX11 (DDOF) | |
| Gigabyte P57X v6 | |
| HP Omen 17-w110ng | |
| MSI GS73VR 6RF | |
| HP Omen 17-w100ng | |
| Asus GL702VM-GC102D | |
| SCHENKER XMG P507 | |
| Razer Blade (2016) FHD | |
| Battlefield 4 - 1920x1080 Ultra Preset AA:4x MS | |
| HP Omen 17-w100ng | |
| Asus GL702VM-GC102D | |
| Razer Blade (2016) FHD | |
| SCHENKER XMG P507 | |
| Battlefield 1 - 1920x1080 Ultra Preset AA:T | |
| HP Omen 17-w110ng | |
| Asus GL702VM-GC102D | |
| HP Omen 17-w100ng | |
| Anno 2205 - 1920x1080 High Preset AA:4x | |
| SCHENKER XMG P507 | |
| Razer Blade (2016) FHD | |
| HP Omen 17-w100ng | |
| bajo | medio | alto | ultra | |
| Tomb Raider (2013) | 290.5 | 289.2 | 274.9 | 140 |
| BioShock Infinite (2013) | 197.8 | 176.2 | 164.8 | 99.1 |
| Battlefield 4 (2013) | 188.8 | 172.8 | 155.7 | 101.5 |
| Anno 2205 (2015) | 81.9 | 75 | 64.7 | 30.2 |
| Just Cause 3 (2015) | 94.6 | 83 | 76.7 | 70.4 |
| Far Cry Primal (2016) | 94 | 82 | 73 | 59 |
| Deus Ex Mankind Divided (2016) | 97.1 | 93 | 56.5 | 29.2 |
| FIFA 17 (2016) | 276.7 | 270.8 | 222.5 | 227.3 |
| Battlefield 1 (2016) | 136.4 | 117.5 | 86.6 | 78.5 |
| Civilization VI (2016) | 58.1 | 47.1 | 43 | 42.8 |
| Titanfall 2 (2016) | 143.5 | 143.5 | 89.7 | 80 |
Ruido
| Ocioso |
| 35 / 36 / 37 dB(A) |
| Carga |
| 44 / 54 dB(A) |
 | ||
30 dB silencioso 40 dB(A) audible 50 dB(A) ruidosamente alto |
||
min: | ||
| HP Omen 17-w100ng 6300HQ, GeForce GTX 1060 Mobile | Asus GL702VM-GC102D 6700HQ, GeForce GTX 1060 Mobile | MSI GS73VR 6RF 6700HQ, GeForce GTX 1060 Mobile | Gigabyte P57X v6 6700HQ, GeForce GTX 1070 Mobile | HP Omen 17-w110ng 6700HQ, GeForce GTX 1070 Mobile | |
|---|---|---|---|---|---|
| Noise | 10% | 6% | 4% | 4% | |
| off / environment * | 31 | 30.5 2% | 28.4 8% | 29.7 4% | 30 3% |
| Idle Minimum * | 35 | 31.4 10% | 31.9 9% | 33.2 5% | 33 6% |
| Idle Average * | 36 | 31.4 13% | 32 11% | 33.2 8% | 34 6% |
| Idle Maximum * | 37 | 31.5 15% | 34 8% | 33.2 10% | 35 5% |
| Load Average * | 44 | 40.9 7% | 47 -7% | 47.5 -8% | 45 -2% |
| Load Maximum * | 54 | 46.2 14% | 49.4 9% | 52.5 3% | 52 4% |
* ... más pequeño es mejor
(±) The maximum temperature on the upper side is 41.5 °C / 107 F, compared to the average of 40.4 °C / 105 F, ranging from 21.2 to 68.8 °C for the class Gaming.
(-) The bottom heats up to a maximum of 45.5 °C / 114 F, compared to the average of 43.2 °C / 110 F
(+) In idle usage, the average temperature for the upper side is 28.7 °C / 84 F, compared to the device average of 33.8 °C / 93 F.
(+) The palmrests and touchpad are reaching skin temperature as a maximum (33.5 °C / 92.3 F) and are therefore not hot.
(-) The average temperature of the palmrest area of similar devices was 28.9 °C / 84 F (-4.6 °C / -8.3 F).
| HP Omen 17-w100ng 6300HQ, GeForce GTX 1060 Mobile | Asus GL702VM-GC102D 6700HQ, GeForce GTX 1060 Mobile | MSI GS73VR 6RF 6700HQ, GeForce GTX 1060 Mobile | Gigabyte P57X v6 6700HQ, GeForce GTX 1070 Mobile | HP Omen 17-w110ng 6700HQ, GeForce GTX 1070 Mobile | |
|---|---|---|---|---|---|
| Heat | -11% | -9% | -24% | -4% | |
| Maximum Upper Side * | 41.5 | 53.1 -28% | 50.8 -22% | 59 -42% | 45 -8% |
| Maximum Bottom * | 45.5 | 44.9 1% | 60 -32% | 66 -45% | 54.3 -19% |
| Idle Upper Side * | 31.8 | 32.9 -3% | 27.4 14% | 33.2 -4% | 29.6 7% |
| Idle Bottom * | 29.6 | 33.4 -13% | 28.8 3% | 30.6 -3% | 28.6 3% |
* ... más pequeño es mejor
HP Omen 17-w100ng audio analysis
(+) | speakers can play relatively loud (87 dB)
Bass 100 - 315 Hz
(-) | nearly no bass - on average 23.9% lower than median
(±) | linearity of bass is average (12.3% delta to prev. frequency)
Mids 400 - 2000 Hz
(+) | balanced mids - only 2.2% away from median
(+) | mids are linear (4.6% delta to prev. frequency)
Highs 2 - 16 kHz
(+) | balanced highs - only 4.6% away from median
(+) | highs are linear (4.5% delta to prev. frequency)
Overall 100 - 16.000 Hz
(±) | linearity of overall sound is average (16.6% difference to median)
Compared to same class
» 40% of all tested devices in this class were better, 7% similar, 53% worse
» The best had a delta of 6%, average was 18%, worst was 132%
Compared to all devices tested
» 24% of all tested devices were better, 5% similar, 71% worse
» The best had a delta of 4%, average was 25%, worst was 134%
Asus GL702VM-GC102D audio analysis
(-) | not very loud speakers (64 dB)
Bass 100 - 315 Hz
(±) | reduced bass - on average 7.7% lower than median
(±) | linearity of bass is average (14% delta to prev. frequency)
Mids 400 - 2000 Hz
(+) | balanced mids - only 1.5% away from median
(+) | mids are linear (6.3% delta to prev. frequency)
Highs 2 - 16 kHz
(±) | reduced highs - on average 5.3% lower than median
(±) | linearity of highs is average (9.8% delta to prev. frequency)
Overall 100 - 16.000 Hz
(±) | linearity of overall sound is average (16.7% difference to median)
Compared to same class
» 40% of all tested devices in this class were better, 10% similar, 50% worse
» The best had a delta of 6%, average was 18%, worst was 132%
Compared to all devices tested
» 24% of all tested devices were better, 7% similar, 70% worse
» The best had a delta of 4%, average was 25%, worst was 134%
| Off / Standby | |
| Ocioso | |
| Carga |
|
| HP Omen 17-w100ng 6300HQ, GeForce GTX 1060 Mobile | Asus GL702VM-GC102D 6700HQ, GeForce GTX 1060 Mobile | MSI GS73VR 6RF 6700HQ, GeForce GTX 1060 Mobile | Gigabyte P57X v6 6700HQ, GeForce GTX 1070 Mobile | HP Omen 17-w110ng 6700HQ, GeForce GTX 1070 Mobile | |
|---|---|---|---|---|---|
| Power Consumption | 3% | -35% | -40% | -19% | |
| Idle Minimum * | 17 | 15.6 8% | 22.6 -33% | 18.4 -8% | 19 -12% |
| Idle Average * | 22 | 20.2 8% | 32.7 -49% | 22.8 -4% | 25 -14% |
| Idle Maximum * | 29 | 21.4 26% | 32.8 -13% | 24 17% | 31 -7% |
| Load Average * | 72 | 90 -25% | 114.7 -59% | 175.5 -144% | 90 -25% |
| Load Maximum * | 141 | 147 -4% | 167.9 -19% | 229.5 -63% | 193 -37% |
* ... más pequeño es mejor
| HP Omen 17-w100ng 6300HQ, GeForce GTX 1060 Mobile, 95.8 Wh | Asus GL702VM-GC102D 6700HQ, GeForce GTX 1060 Mobile, 76 Wh | MSI GS73VR 6RF 6700HQ, GeForce GTX 1060 Mobile, 65 Wh | Gigabyte P57X v6 6700HQ, GeForce GTX 1070 Mobile, 75.81 Wh | HP Omen 17-w110ng 6700HQ, GeForce GTX 1070 Mobile, 95 Wh | |
|---|---|---|---|---|---|
| Duración de Batería | -31% | -43% | -32% | -25% | |
| Reader / Idle | 543 | 353 -35% | 353 -35% | 418 -23% | 432 -20% |
| H.264 | 313 | 262 -16% | 233 -26% | ||
| WiFi v1.3 | 363 | 250 -31% | 213 -41% | 201 -45% | 247 -32% |
| Load | 145 | 87 -40% | 66 -54% | 103 -29% | 115 -21% |
Pro
Contra
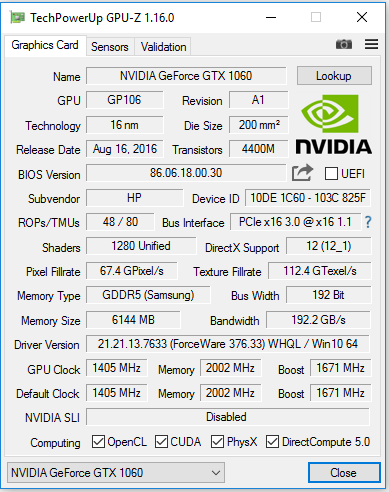
El modelo básico de la gama Omen no tiene CPU Core i7 sino que ofrece "solo" un Core i5-6300HQ. Por tanto el comprador "solo" tiene que desembolsar 1300 euros. Sin embargo el procesador instalado tiene potencia más que suficiente para los escenarios comunes. El 6300HQ junto a la unidad gráfica GeForce GTX 1060 renderiza casi todos los juegos actuales en resolución Full HD en ajustes altos e, incluso, a veces máximos. La tecnología G-Sync asegura una reproducción de imagen fluida en la pantalla de 75 Hz.
Con el Omen 17 w100ng, HP lanza un equlibrado modelo de gama de entrada en el mundo de los portátiles para juegos.
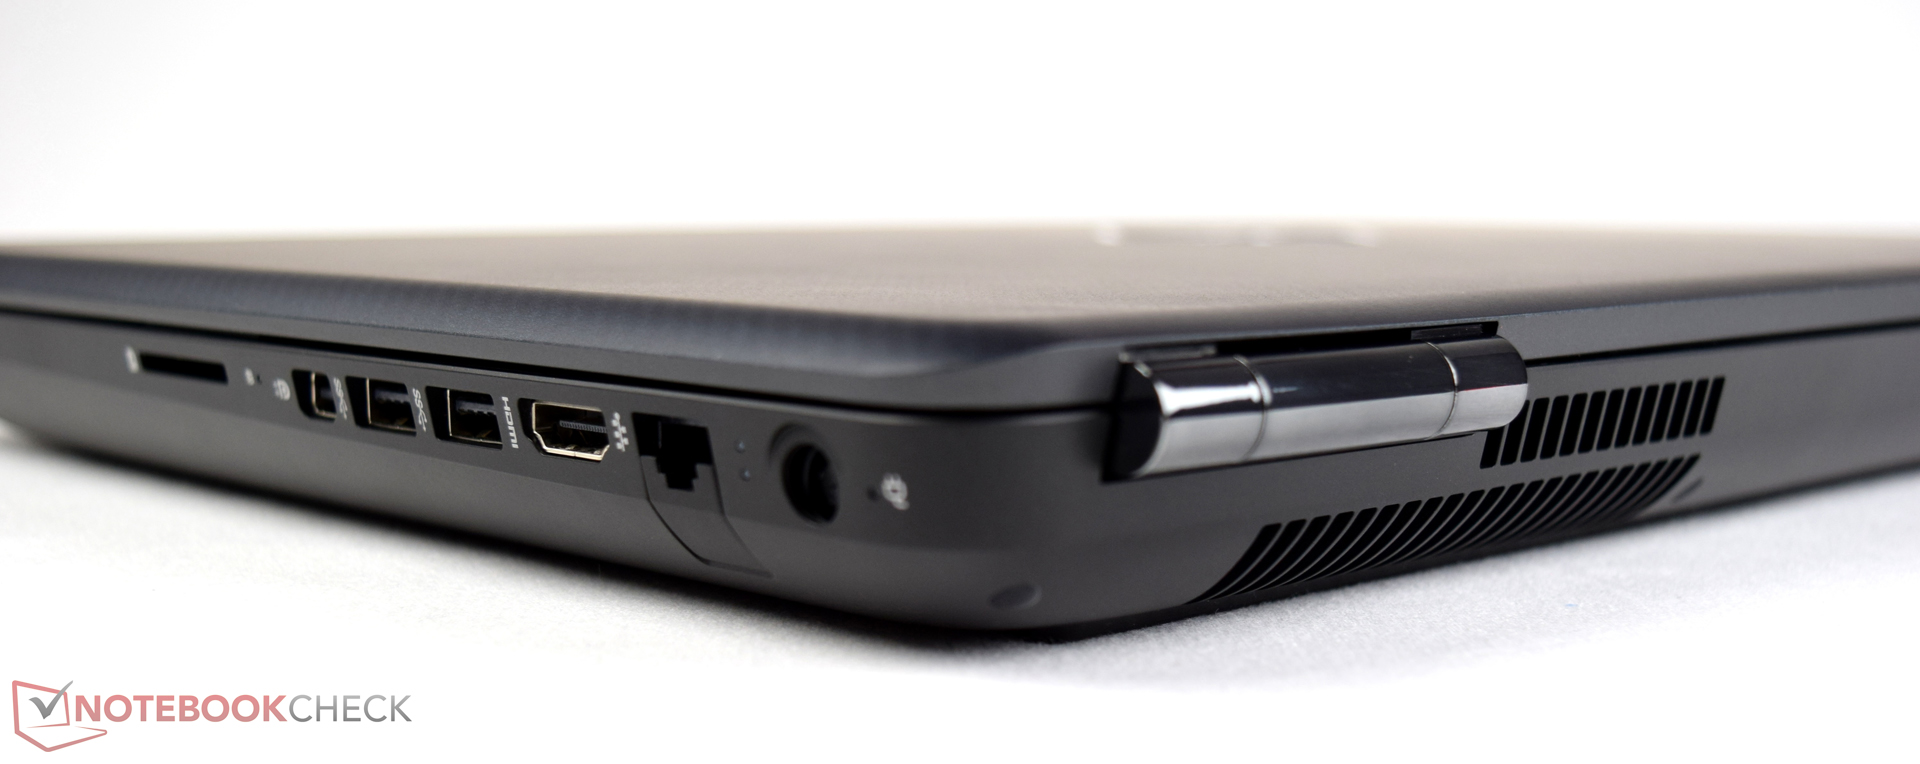
El Omen tiene no obstante puntos de mejora: HP debería, por ejemplo, mejorar el ruido generado. El portátil genera más ruido del necesario. El sistema de refrigeración parece haber sido diseñado para la combinación de Core i7-6700 y GeForce GTX 1070. Una actualización de la BIOS podría mejorar las cosas. El portátil tampoco ofrece puertos USB 3.1 Gen2 o Thunderbolt 3, que es lo que se esperaría en un portátil actual de este precio.
Ésta es una versión acortada del análisis original. Puedes leer el análisis completo en inglés aquí.
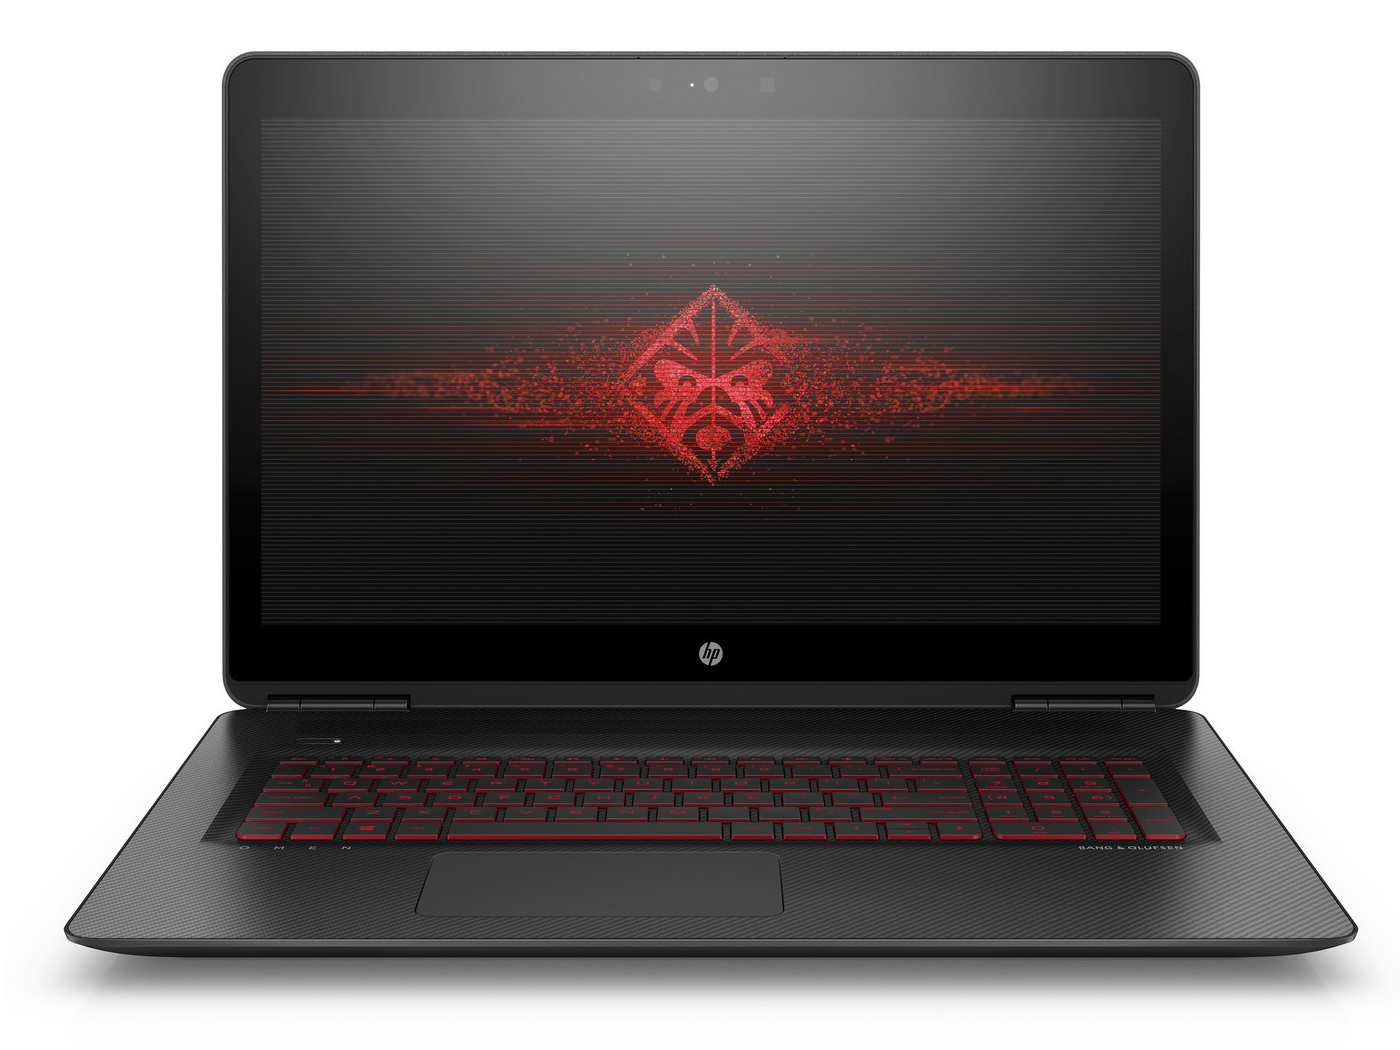
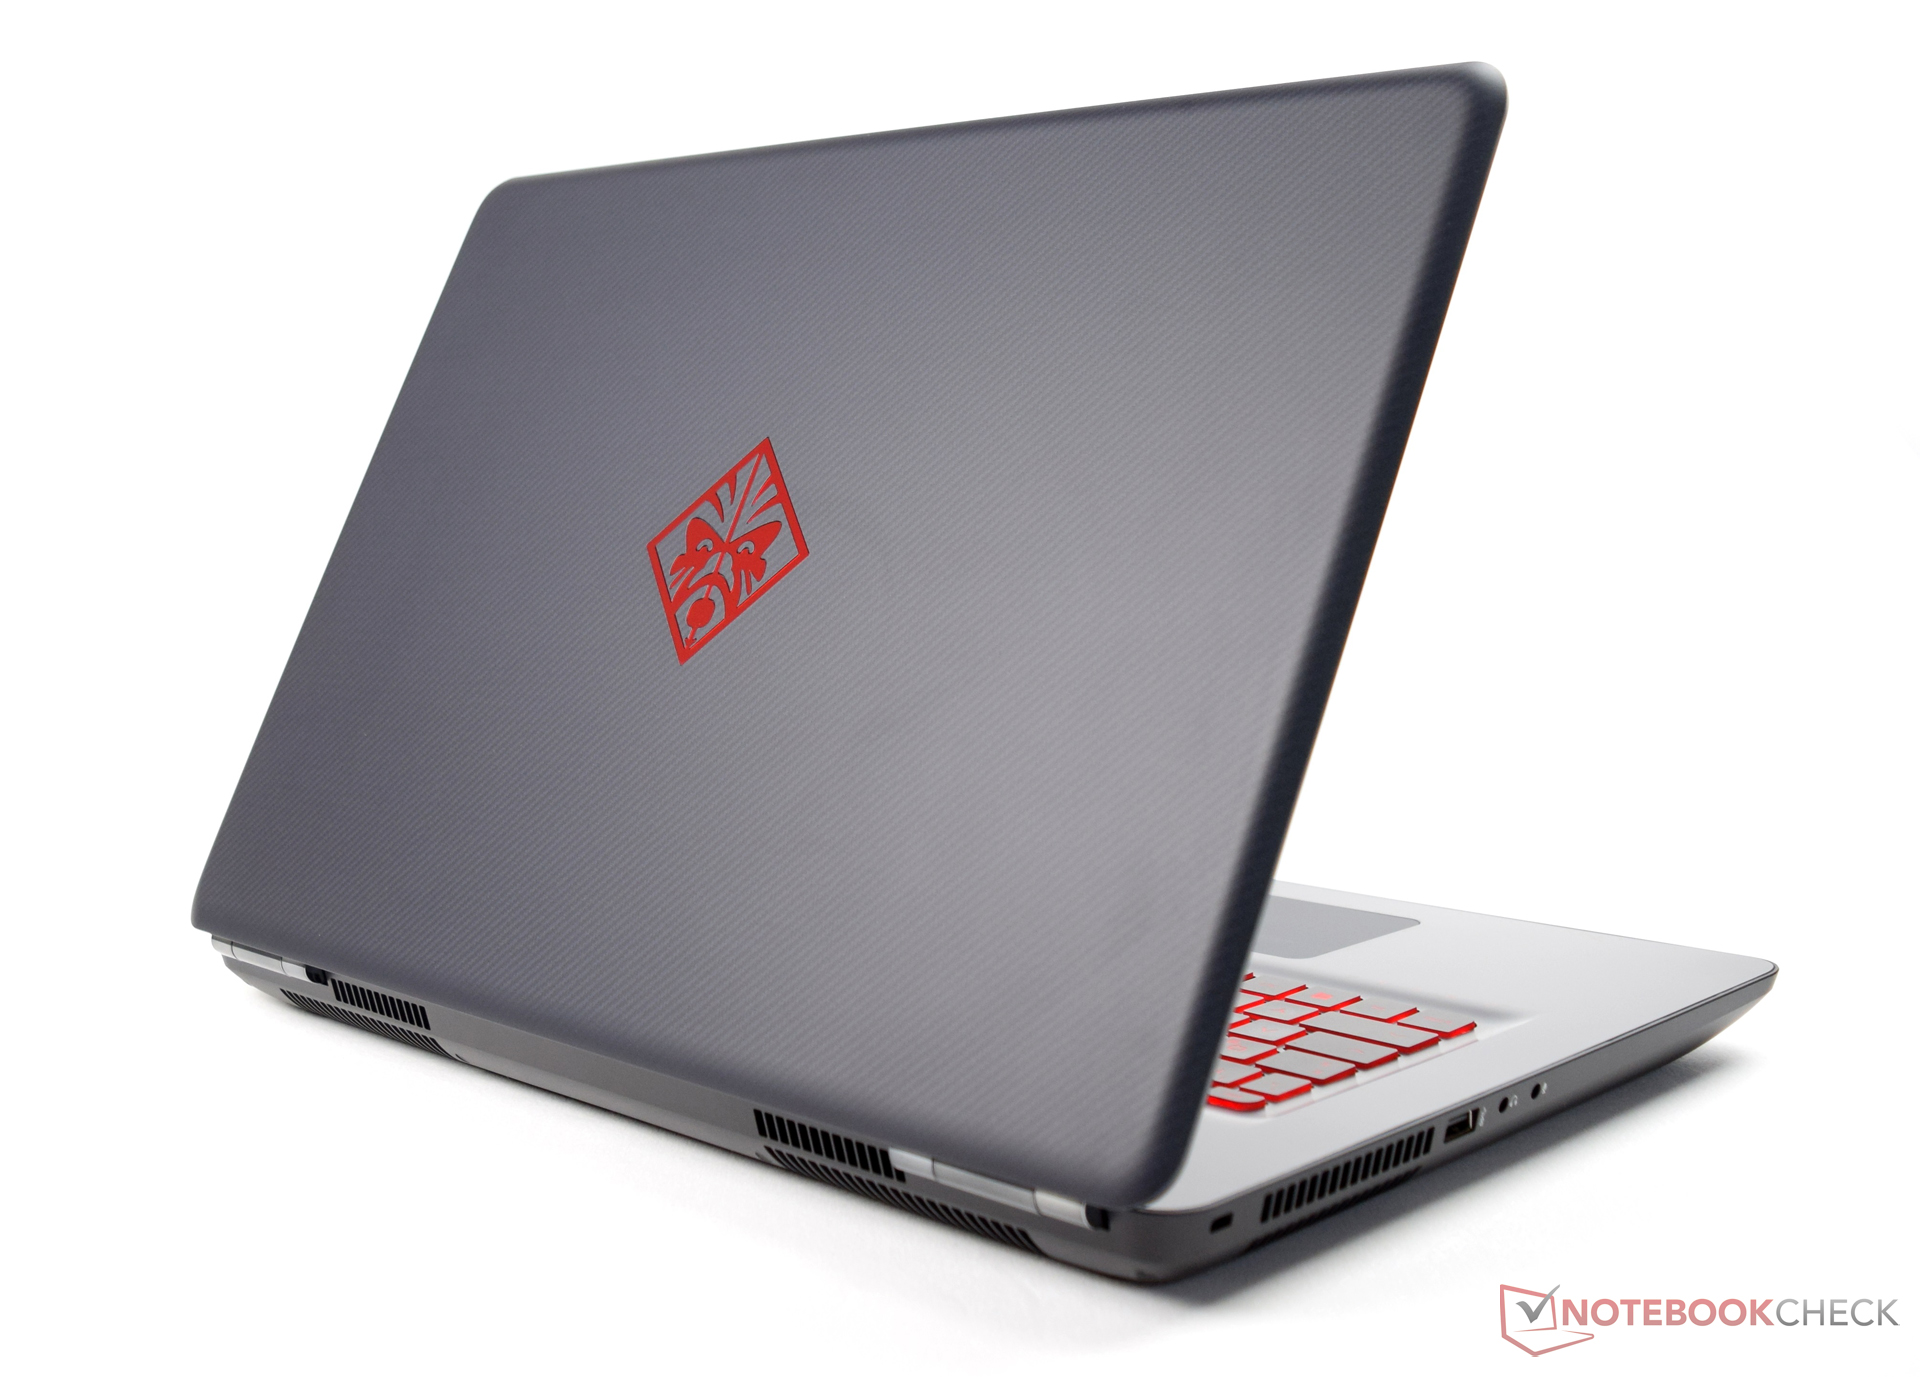
HP Omen 17-w100ng
-
01/18/2017 v6(old)
Sascha Mölck