 Deutsch
 English
 Español
 Français
 Italiano
 Nederlands
 Polski
 Português
 Русский
 Türkçe
 Svenska
 Chinese
 Magyar
Breve análisis del portátil Lenovo Legion Y520-15IKBN (7300HQ, GTX 1050 Ti, FHD)
| Networking | |
| iperf3 transmit AX12 | |
| Medion Erazer X6603 | |
| Acer Aspire VX5-591G-75C4 VX15 | |
| Acer Nitro 5 AN515-51-788E | |
| HP Omen 15-ax213ng | |
| Asus FX502VM-AS73 | |
| Lenovo Legion Y520-15IKBN 80WK0042GE | |
| Dell Inspiron 15 7000 7567 Gaming (Core i5-7300HQ, GTX 1050) | |
| Lenovo Legion Y520-15IKBN-80WK001KUS | |
| iperf3 receive AX12 | |
| HP Omen 15-ax213ng | |
| Acer Nitro 5 AN515-51-788E | |
| Asus FX502VM-AS73 | |
| Acer Aspire VX5-591G-75C4 VX15 | |
| Medion Erazer X6603 | |
| Dell Inspiron 15 7000 7567 Gaming (Core i5-7300HQ, GTX 1050) | |
| Lenovo Legion Y520-15IKBN-80WK001KUS | |
| Lenovo Legion Y520-15IKBN 80WK0042GE | |
| |||||||||||||||||||||||||
iluminación: 91 %
Brillo con batería: 281 cd/m²
Contraste: 726:1 (Negro: 0.39 cd/m²)
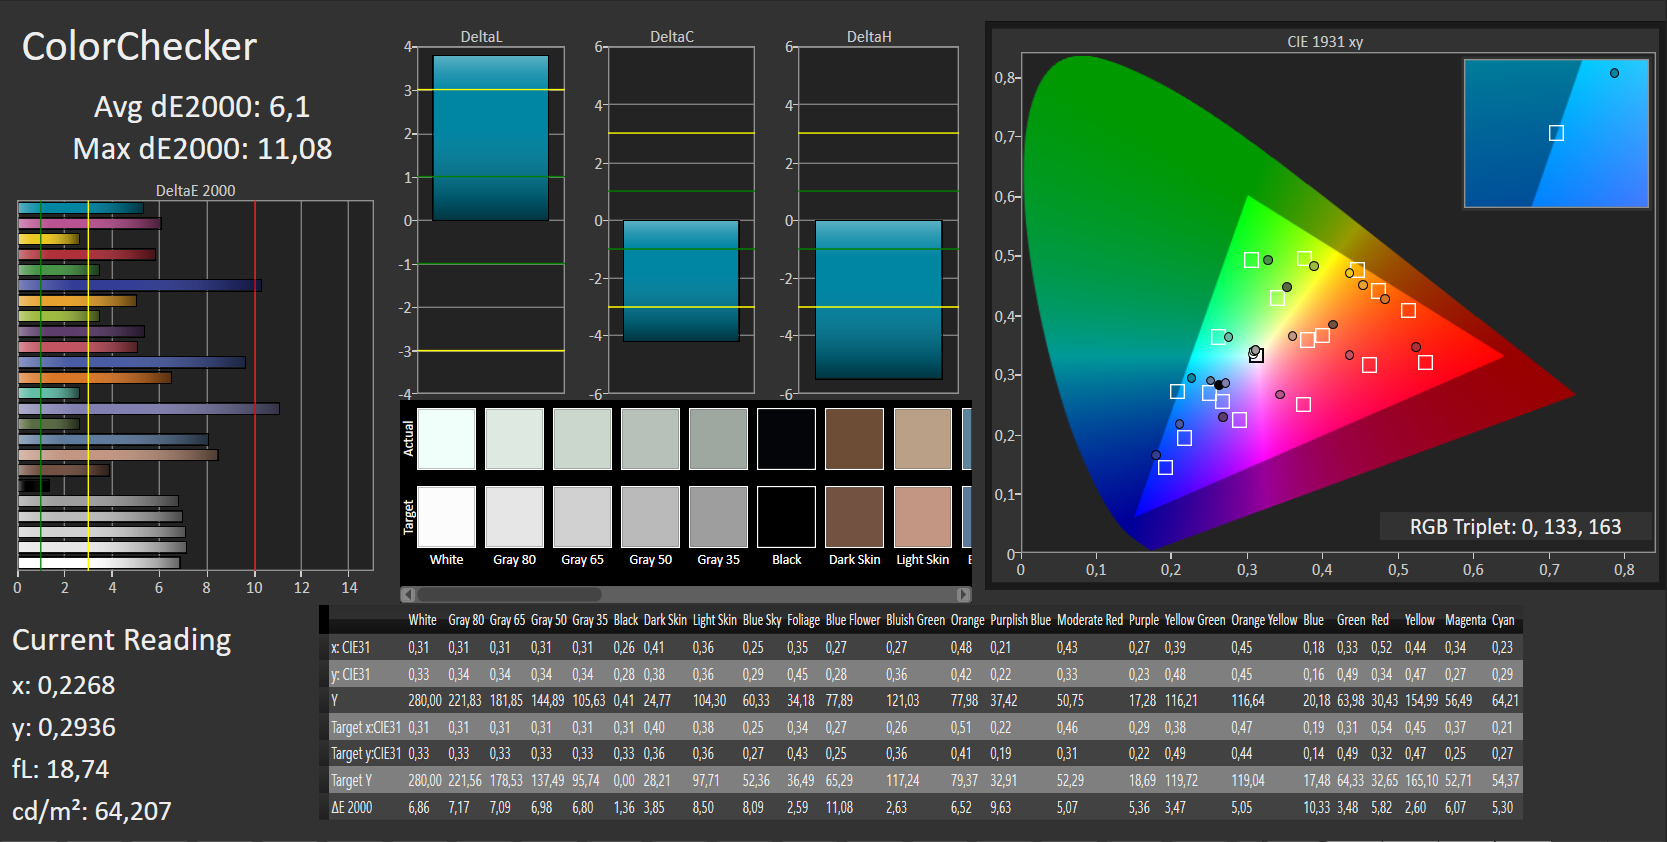
ΔE Color 6.1 | 0.5-29.43 Ø5
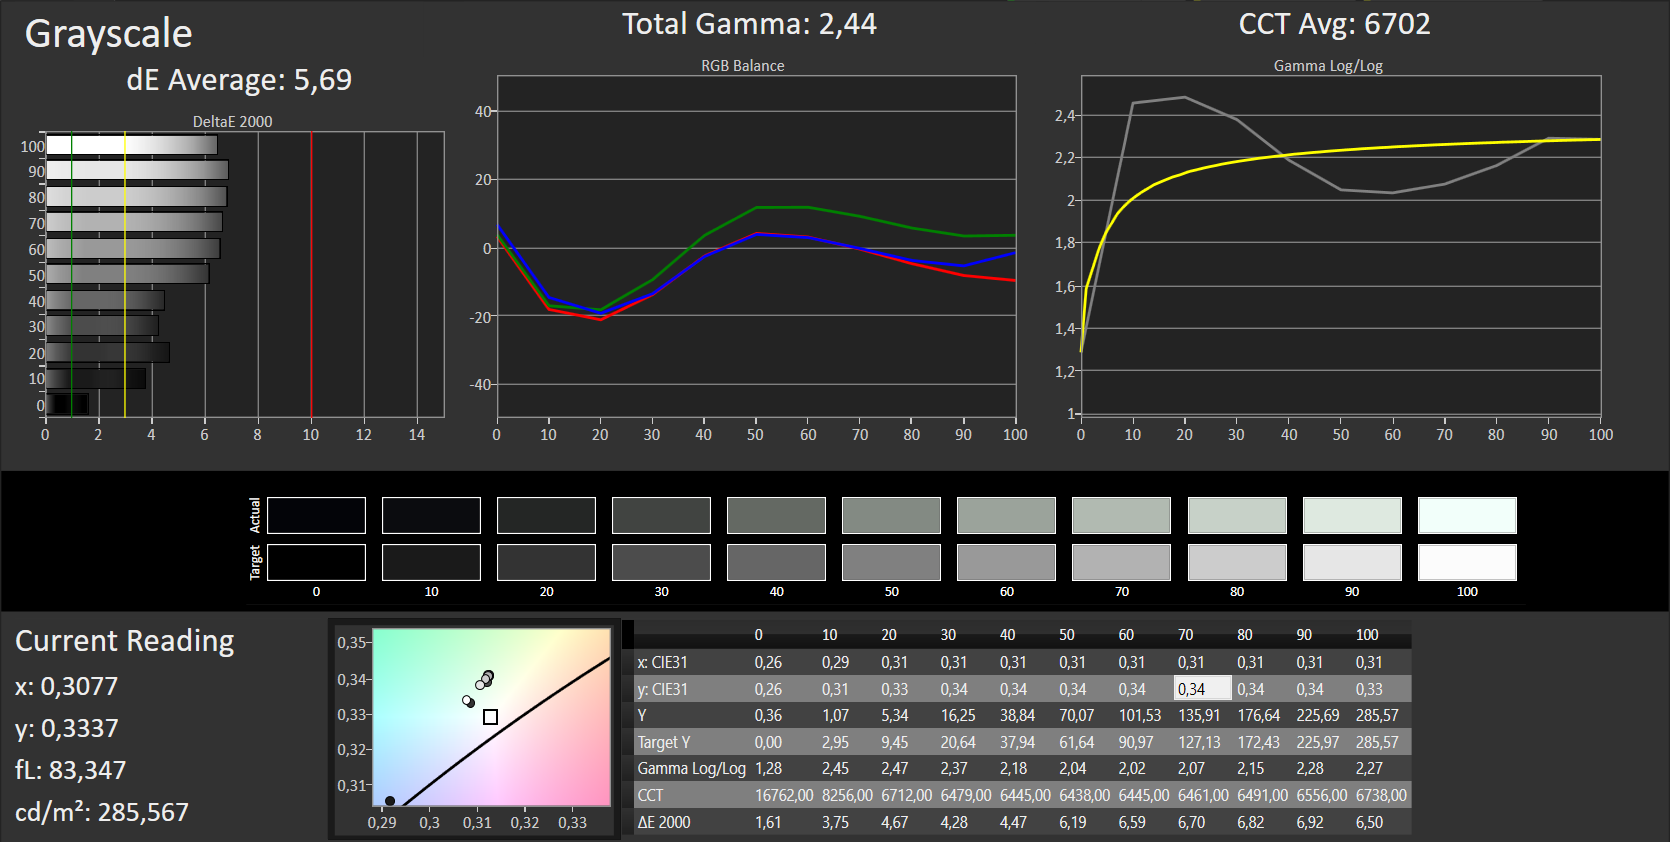
ΔE Greyscale 5.69 | 0.57-98 Ø5.3
58% sRGB (Argyll 1.6.3 3D)
37% AdobeRGB 1998 (Argyll 1.6.3 3D)
40.34% AdobeRGB 1998 (Argyll 2.2.0 3D)
58.4% sRGB (Argyll 2.2.0 3D)
39.01% Display P3 (Argyll 2.2.0 3D)
Gamma: 2.44
| Lenovo Legion Y520-15IKBN 80WK0042GE IPS, 1920x1080, 15.60 | Lenovo Legion Y520-15IKBN-80WK001KUS IPS, 1920x1080, 15.60 | HP Omen 15-ax213ng IPS, 1920x1080, 15.60 | Acer Aspire VX5-591G-75C4 VX15 IPS, 1920x1080, 15.60 | Dell Inspiron 15 7000 7567 Gaming (Core i5-7300HQ, GTX 1050) TN, 1920x1080, 15.60 | Asus FX502VM-AS73 TN LED, 1920x1080, 15.60 | Acer Nitro 5 AN515-51-788E IPS, 1920x1080, 15.60 | |
|---|---|---|---|---|---|---|---|
| Display | -1% | 0% | -2% | -2% | 7% | ||
| Display P3 Coverage | 39.01 | 38.59 -1% | 38.88 0% | 38.2 -2% | 38.28 -2% | 41.7 7% | |
| sRGB Coverage | 58.4 | 58 -1% | 58.2 0% | 57.5 -2% | 56.9 -3% | 62.2 7% | |
| AdobeRGB 1998 Coverage | 40.34 | 39.87 -1% | 40.2 0% | 39.47 -2% | 39.47 -2% | 43.17 7% | |
| Response Times | -24% | -3% | 33% | 6% | 25% | 17% | |
| Response Time Grey 50% / Grey 80% * | 39 ? | 58.8 ? -51% | 42 ? -8% | 22 ? 44% | 36.8 ? 6% | 28.4 ? 27% | 35 ? 10% |
| Response Time Black / White * | 29 ? | 36 ? -24% | 28 ? 3% | 23 ? 21% | 27.6 ? 5% | 22.4 ? 23% | 22 ? 24% |
| PWM Frequency | 21000 ? | 21550 ? 3% | |||||
| Screen | -17% | 17% | 8% | -50% | -18% | 11% | |
| Brightness middle | 283 | 239 -16% | 230 -19% | 281 -1% | 242.2 -14% | 209.5 -26% | 276 -2% |
| Brightness | 281 | 244 -13% | 228 -19% | 257 -9% | 235 -16% | 205 -27% | 265 -6% |
| Brightness Distribution | 91 | 88 -3% | 88 -3% | 85 -7% | 88 -3% | 92 1% | 91 0% |
| Black Level * | 0.39 | 0.35 10% | 0.21 46% | 0.32 18% | 0.69 -77% | 0.69 -77% | 0.25 36% |
| Contrast | 726 | 683 -6% | 1095 51% | 878 21% | 351 -52% | 304 -58% | 1104 52% |
| Colorchecker dE 2000 * | 6.1 | 7.3 -20% | 4.01 34% | 5.16 15% | 11.6 -90% | 4.7 23% | 5.06 17% |
| Colorchecker dE 2000 max. * | 11.08 | 24.7 -123% | 7.26 34% | 9.09 18% | 19.4 -75% | 19.7 -78% | 10.13 9% |
| Greyscale dE 2000 * | 5.69 | 4.9 14% | 3.18 44% | 4.57 20% | 15.7 -176% | 1.8 68% | 6.25 -10% |
| Gamma | 2.44 90% | 2.19 100% | 2.52 87% | 2.59 85% | 1.57 140% | 2.23 99% | 1.76 125% |
| CCT | 6702 97% | 7332 89% | 6814 95% | 6931 94% | 11662 56% | 6975 93% | 6873 95% |
| Color Space (Percent of AdobeRGB 1998) | 37 | 35 -5% | 37 0% | 37 0% | 39.47 7% | 36.2 -2% | 40 8% |
| Color Space (Percent of sRGB) | 58 | 55 -5% | 58 0% | 58 0% | 57.55 -1% | 56.6 -2% | 62 7% |
| Media total (Programa/Opciones) | -21% /
-18% | 4% /
11% | 14% /
9% | -15% /
-33% | 2% /
-9% | 12% /
11% |
* ... más pequeño es mejor
Parpadeo de Pantalla / PWM (Pulse-Width Modulation)
| Parpadeo de Pantalla / PWM detectado | 21000 Hz | ≤ 90 % de brillo | 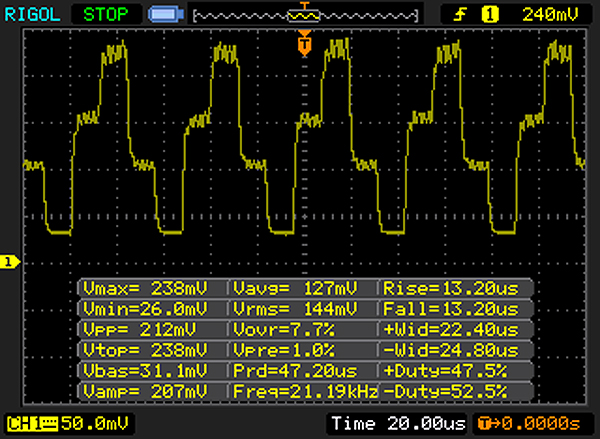 |
La retroiluminación del display parpadea a 21000 Hz (seguramente usa PWM - Pulse-Width Modulation) a un brillo del 90 % e inferior. Sobre este nivel de brillo no debería darse parpadeo / PWM. La frecuencia de 21000 Hz es bastante alta, por lo que la mayoría de gente sensible al parpadeo no debería ver parpadeo o tener fatiga visual. Comparación: 53 % de todos los dispositivos testados no usaron PWM para atenuar el display. Si se usó, medimos una media de 17900 (mínimo: 5 - máxmo: 3846000) Hz. | |||
Tiempos de respuesta del display
| ↔ Tiempo de respuesta de Negro a Blanco | ||
|---|---|---|
| 29 ms ... subida ↗ y bajada ↘ combinada | ↗ 16 ms subida | 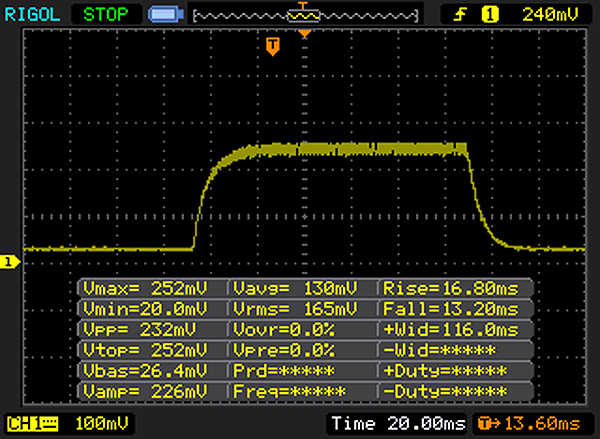 |
| ↘ 13 ms bajada | ||
| La pantalla mostró tiempos de respuesta relativamente lentos en nuestros tests pero podría ser demasiado lenta para los jugones. En comparación, todos los dispositivos de prueba van de ##min### (mínimo) a 240 (máximo) ms. » 73 % de todos los dispositivos son mejores. Eso quiere decir que el tiempo de respuesta es peor que la media (21.5 ms) de todos los dispositivos testados. | ||
| ↔ Tiempo de respuesta 50% Gris a 80% Gris | ||
| 39 ms ... subida ↗ y bajada ↘ combinada | ↗ 21 ms subida | 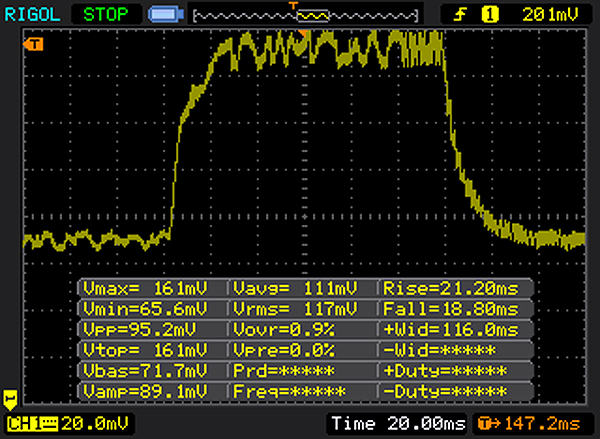 |
| ↘ 18 ms bajada | ||
| La pantalla mostró tiempos de respuesta lentos en nuestros tests y podría ser demasiado lenta para los jugones. En comparación, todos los dispositivos de prueba van de ##min### (mínimo) a 636 (máximo) ms. » 53 % de todos los dispositivos son mejores. Eso quiere decir que el tiempo de respuesta es peor que la media (33.7 ms) de todos los dispositivos testados. | ||

| Cinebench R15 | |
| CPU Single 64Bit | |
| Acer Nitro 5 AN515-51-788E | |
| Acer Nitro 5 AN515-51-788E (CoolBoost on) | |
| HP Omen 15-ax213ng | |
| Lenovo Legion Y520-15IKBN-80WK001KUS | |
| Acer Aspire VX5-591G-75C4 VX15 | |
| Medion Erazer X6603 | |
| Acer Aspire VX15 VX5-591G-589S | |
| Lenovo Legion Y520-15IKBN 80WK0042GE | |
| Asus FX502VM-AS73 | |
| Dell Inspiron 15 7000 7567 Gaming (Core i5-7300HQ, GTX 1050) | |
| CPU Multi 64Bit | |
| HP Omen 15-ax213ng | |
| Medion Erazer X6603 | |
| Acer Nitro 5 AN515-51-788E (CoolBoost on) | |
| Acer Nitro 5 AN515-51-788E | |
| Asus FX502VM-AS73 | |
| Acer Aspire VX5-591G-75C4 VX15 | |
| Lenovo Legion Y520-15IKBN-80WK001KUS | |
| Lenovo Legion Y520-15IKBN 80WK0042GE | |
| Dell Inspiron 15 7000 7567 Gaming (Core i5-7300HQ, GTX 1050) | |
| Acer Aspire VX15 VX5-591G-589S | |
| Cinebench R11.5 | |
| CPU Multi 64Bit | |
| HP Omen 15-ax213ng | |
| Medion Erazer X6603 | |
| Asus FX502VM-AS73 | |
| Acer Nitro 5 AN515-51-788E | |
| Lenovo Legion Y520-15IKBN-80WK001KUS | |
| Dell Inspiron 15 7000 7567 Gaming (Core i5-7300HQ, GTX 1050) | |
| Lenovo Legion Y520-15IKBN 80WK0042GE | |
| CPU Single 64Bit | |
| HP Omen 15-ax213ng | |
| Lenovo Legion Y520-15IKBN-80WK001KUS | |
| Medion Erazer X6603 | |
| Acer Nitro 5 AN515-51-788E | |
| Asus FX502VM-AS73 | |
| Lenovo Legion Y520-15IKBN 80WK0042GE | |
| Dell Inspiron 15 7000 7567 Gaming (Core i5-7300HQ, GTX 1050) | |
| Cinebench R10 | |
| Rendering Multiple CPUs 32Bit | |
| Acer Nitro 5 AN515-51-788E | |
| Medion Erazer X6603 | |
| Asus FX502VM-AS73 | |
| Acer Aspire VX15 VX5-591G-589S | |
| Lenovo Legion Y520-15IKBN 80WK0042GE | |
| Dell Inspiron 15 7000 7567 Gaming (Core i5-7300HQ, GTX 1050) | |
| Rendering Single 32Bit | |
| Acer Nitro 5 AN515-51-788E | |
| Medion Erazer X6603 | |
| Asus FX502VM-AS73 | |
| Acer Aspire VX15 VX5-591G-589S | |
| Lenovo Legion Y520-15IKBN 80WK0042GE | |
| Dell Inspiron 15 7000 7567 Gaming (Core i5-7300HQ, GTX 1050) | |
| Geekbench 3 | |
| 32 Bit Multi-Core Score | |
| Acer Nitro 5 AN515-51-788E | |
| Lenovo Legion Y520-15IKBN 80WK0042GE | |
| Acer Aspire VX15 VX5-591G-589S | |
| 32 Bit Single-Core Score | |
| Acer Nitro 5 AN515-51-788E | |
| Acer Aspire VX15 VX5-591G-589S | |
| Lenovo Legion Y520-15IKBN 80WK0042GE | |
| Geekbench 4.0 | |
| 64 Bit Multi-Core Score | |
| Acer Nitro 5 AN515-51-788E | |
| Lenovo Legion Y520-15IKBN 80WK0042GE | |
| Acer Aspire VX15 VX5-591G-589S | |
| 64 Bit Single-Core Score | |
| Acer Nitro 5 AN515-51-788E | |
| Lenovo Legion Y520-15IKBN 80WK0042GE | |
| Acer Aspire VX15 VX5-591G-589S | |
| Geekbench 4.4 | |
| 64 Bit Multi-Core Score | |
| Acer Nitro 5 AN515-51-788E | |
| Lenovo Legion Y520-15IKBN 80WK0042GE | |
| Acer Aspire VX15 VX5-591G-589S | |
| 64 Bit Single-Core Score | |
| Acer Nitro 5 AN515-51-788E | |
| Lenovo Legion Y520-15IKBN 80WK0042GE | |
| Acer Aspire VX15 VX5-591G-589S | |
| JetStream 1.1 - Total Score | |
| Medion Erazer X6603 (Edge 38.14393.1066.0) | |
| HP Omen 15-ax213ng (Edge 40.15063.0.0) | |
| Lenovo Legion Y520-15IKBN-80WK001KUS | |
| Acer Nitro 5 AN515-51-788E (Edge 40) | |
| Acer Aspire VX15 VX5-591G-589S (Edge 38) | |
| Lenovo Legion Y520-15IKBN 80WK0042GE (Edge 40) | |
| Asus FX502VM-AS73 (Edge 38.14393.0.0) | |
| PCMark 7 Score | 5555 puntos | |
| PCMark 8 Home Score Accelerated v2 | 3651 puntos | |
| PCMark 8 Creative Score Accelerated v2 | 4608 puntos | |
| PCMark 8 Work Score Accelerated v2 | 4746 puntos | |
| PCMark 10 Score | 3995 puntos | |
ayuda | ||
| PCMark 8 | |
| Home Score Accelerated v2 | |
| Asus FX502VM-AS73 | |
| Acer Nitro 5 AN515-51-788E | |
| HP Omen 15-ax213ng | |
| Medion Erazer X6603 | |
| Acer Aspire VX15 VX5-591G-589S | |
| Lenovo Legion Y520-15IKBN 80WK0042GE | |
| Dell Inspiron 15 7000 7567 Gaming (Core i5-7300HQ, GTX 1050) | |
| Acer Aspire VX5-591G-75C4 VX15 | |
| Work Score Accelerated v2 | |
| Medion Erazer X6603 | |
| Acer Nitro 5 AN515-51-788E | |
| Dell Inspiron 15 7000 7567 Gaming (Core i5-7300HQ, GTX 1050) | |
| Lenovo Legion Y520-15IKBN 80WK0042GE | |
| Acer Aspire VX5-591G-75C4 VX15 | |
| HP Omen 15-ax213ng | |
| Asus FX502VM-AS73 | |

| Lenovo Legion Y520-15IKBN 80WK0042GE Samsung PM961 NVMe MZVLW128HEGR | Lenovo Legion Y520-15IKBN-80WK001KUS Samsung PM961 MZVLW256HEHP | HP Omen 15-ax213ng Samsung PM961 MZVLW256HEHP | Dell Inspiron 15 7000 7567 Gaming (Core i5-7300HQ, GTX 1050) Toshiba MQ02ABD100H | Asus FX502VM-AS73 SK Hynix HFS256G39TND-N210A | Acer Aspire VX15 VX5-591G-589S Hynix HFS128G39TND | Acer Nitro 5 AN515-51-788E Intel SSD 600p SSDPEKKW256G7 | |
|---|---|---|---|---|---|---|---|
| CrystalDiskMark 3.0 | 74% | 91% | -96% | -46% | -38% | 28% | |
| Read Seq | 2127 | 2170 2% | 1657 -22% | 84.7 -96% | 503 -76% | 510 -76% | 945 -56% |
| Write Seq | 796 | 1202 51% | 1208 52% | 65.4 -92% | 138.2 -83% | 137.6 -83% | 559 -30% |
| Read 512 | 455.6 | 786 73% | 806 77% | 19.86 -96% | 343.5 -25% | 362.1 -21% | 639 40% |
| Write 512 | 196.7 | 822 318% | 807 310% | 28.43 -86% | 137.8 -30% | 137.2 -30% | 561 185% |
| Read 4k | 46.07 | 58.9 28% | 62.6 36% | 0.531 -99% | 29.36 -36% | 35.18 -24% | 24.24 -47% |
| Write 4k | 154.8 | 146.4 -5% | 176.9 14% | 0.481 -100% | 70.9 -54% | 104.8 -32% | 122.7 -21% |
| Read 4k QD32 | 480.9 | 457.7 -5% | 650 35% | 1.105 -100% | 369.9 -23% | 375.8 -22% | 288.5 -40% |
| Write 4k QD32 | 170.6 | 392.9 130% | 557 226% | 0.505 -100% | 99.7 -42% | 138.1 -19% | 504 195% |
| 3DMark 06 Standard Score | 23891 puntos | |
| 3DMark 11 Performance | 8596 puntos | |
| 3DMark Ice Storm Standard Score | 108099 puntos | |
| 3DMark Cloud Gate Standard Score | 16084 puntos | |
| 3DMark Fire Strike Score | 6447 puntos | |
| 3DMark Fire Strike Extreme Score | 3450 puntos | |
| 3DMark Time Spy Score | 2427 puntos | |
ayuda | ||
| 3DMark 11 - 1280x720 Performance GPU | |
| Asus FX502VM-AS73 | |
| HP Omen 15-ax213ng | |
| Lenovo Legion Y520-15IKBN 80WK0042GE | |
| Acer Aspire VX5-591G-75C4 VX15 | |
| Medion Erazer X6603 | |
| Acer Nitro 5 AN515-51-788E | |
| Acer Nitro 5 AN515-51-788E | |
| Dell Inspiron 15 7000 7567 Gaming (Core i5-7300HQ, GTX 1050) | |
| Acer Aspire VX15 VX5-591G-589S | |
| 3DMark | |
| 1280x720 Cloud Gate Standard Graphics | |
| Asus FX502VM-AS73 | |
| Lenovo Legion Y520-15IKBN 80WK0042GE | |
| Lenovo Legion Y520-15IKBN-80WK001KUS | |
| Medion Erazer X6603 | |
| Acer Nitro 5 AN515-51-788E | |
| Acer Nitro 5 AN515-51-788E | |
| HP Omen 15-ax213ng | |
| Acer Aspire VX5-591G-75C4 VX15 | |
| Dell Inspiron 15 7000 7567 Gaming (Core i5-7300HQ, GTX 1050) | |
| 1920x1080 Fire Strike Graphics | |
| Asus FX502VM-AS73 | |
| HP Omen 15-ax213ng | |
| Lenovo Legion Y520-15IKBN 80WK0042GE | |
| Acer Aspire VX5-591G-75C4 VX15 | |
| Medion Erazer X6603 | |
| Acer Nitro 5 AN515-51-788E | |
| Acer Nitro 5 AN515-51-788E | |
| Lenovo Legion Y520-15IKBN-80WK001KUS | |
| Dell Inspiron 15 7000 7567 Gaming (Core i5-7300HQ, GTX 1050) | |
| bajo | medio | alto | ultra | |
| Tomb Raider (2013) | 309.9 | 288.7 | 198.4 | 93.1 |
| BioShock Infinite (2013) | 222.2 | 188.5 | 165.2 | 70 |
| The Witcher 3 (2015) | 116.7 | 86.1 | 47.8 | 25.6 |
| BioShock Infinite - 1920x1080 Ultra Preset, DX11 (DDOF) | |
| Asus FX502VM-AS73 | |
| Acer Nitro 5 AN515-51-788E | |
| Lenovo Legion Y520-15IKBN-80WK001KUS | |
| Medion Erazer X6603 | |
| HP Omen 15-ax213ng | |
| Lenovo Legion Y520-15IKBN 80WK0042GE | |
| Dell Inspiron 15 7000 7567 Gaming (Core i5-7300HQ, GTX 1050) | |
| Acer Aspire VX15 VX5-591G-589S | |
| The Witcher 3 - 1920x1080 High Graphics & Postprocessing (Nvidia HairWorks Off) | |
| HP Omen 15-ax213ng | |
| Lenovo Legion Y520-15IKBN 80WK0042GE | |
| Acer Nitro 5 AN515-51-788E | |
| Acer Aspire VX5-591G-75C4 VX15 | |
| Dell Inspiron 15 7000 7567 Gaming (Core i5-7300HQ, GTX 1050) | |
Ruido
| Ocioso |
| 31.9 / 31.9 / 31.9 dB(A) |
| Carga |
| 34.6 / 41.7 dB(A) |
 | ||
30 dB silencioso 40 dB(A) audible 50 dB(A) ruidosamente alto |
||
min: | ||
| Lenovo Legion Y520-15IKBN 80WK0042GE i5-7300HQ, GeForce GTX 1050 Ti Mobile | Lenovo Legion Y520-15IKBN-80WK001KUS i7-7700HQ, GeForce GTX 1050 Ti Mobile | HP Omen 15-ax213ng i7-7700HQ, GeForce GTX 1050 Ti Mobile | Dell Inspiron 15 7000 7567 Gaming (Core i5-7300HQ, GTX 1050) i5-7300HQ, GeForce GTX 1050 Mobile | Asus FX502VM-AS73 i7-7700HQ, GeForce GTX 1060 Mobile | Acer Aspire VX15 VX5-591G-589S i5-7300HQ, GeForce GTX 1050 Mobile | Acer Nitro 5 AN515-51-788E i7-7700HQ, GeForce GTX 1050 Ti Mobile | |
|---|---|---|---|---|---|---|---|
| Noise | 0% | -15% | -5% | -7% | 6% | -3% | |
| off / environment * | 30.6 | 27.7 9% | 30 2% | 28 8% | 28.7 6% | 30 2% | 30.6 -0% |
| Idle Minimum * | 31.9 | 30.5 4% | 32 -0% | 31.6 1% | 30.6 4% | 30 6% | 30.6 4% |
| Idle Average * | 31.9 | 30.5 4% | 34 -7% | 31.8 -0% | 30.6 4% | 30 6% | 30.7 4% |
| Idle Maximum * | 31.9 | 30.6 4% | 36 -13% | 31.8 -0% | 31 3% | 31.1 3% | 30.7 4% |
| Load Average * | 34.6 | 40 -16% | 48 -39% | 36.3 -5% | 46.2 -34% | 31.3 10% | 43 -24% |
| Witcher 3 ultra * | 39.3 | 40 -2% | 49 -25% | 46.3 -18% | 39.7 -1% | ||
| Load Maximum * | 41.7 | 42.6 -2% | 51 -22% | 49 -18% | 52.3 -25% | 38.9 7% | 45.8 -10% |
* ... más pequeño es mejor
(+) The maximum temperature on the upper side is 39.6 °C / 103 F, compared to the average of 40.4 °C / 105 F, ranging from 21.2 to 68.8 °C for the class Gaming.
(+) The bottom heats up to a maximum of 38.4 °C / 101 F, compared to the average of 43.2 °C / 110 F
(+) In idle usage, the average temperature for the upper side is 21.1 °C / 70 F, compared to the device average of 33.8 °C / 93 F.
(±) Playing The Witcher 3, the average temperature for the upper side is 33.5 °C / 92 F, compared to the device average of 33.8 °C / 93 F.
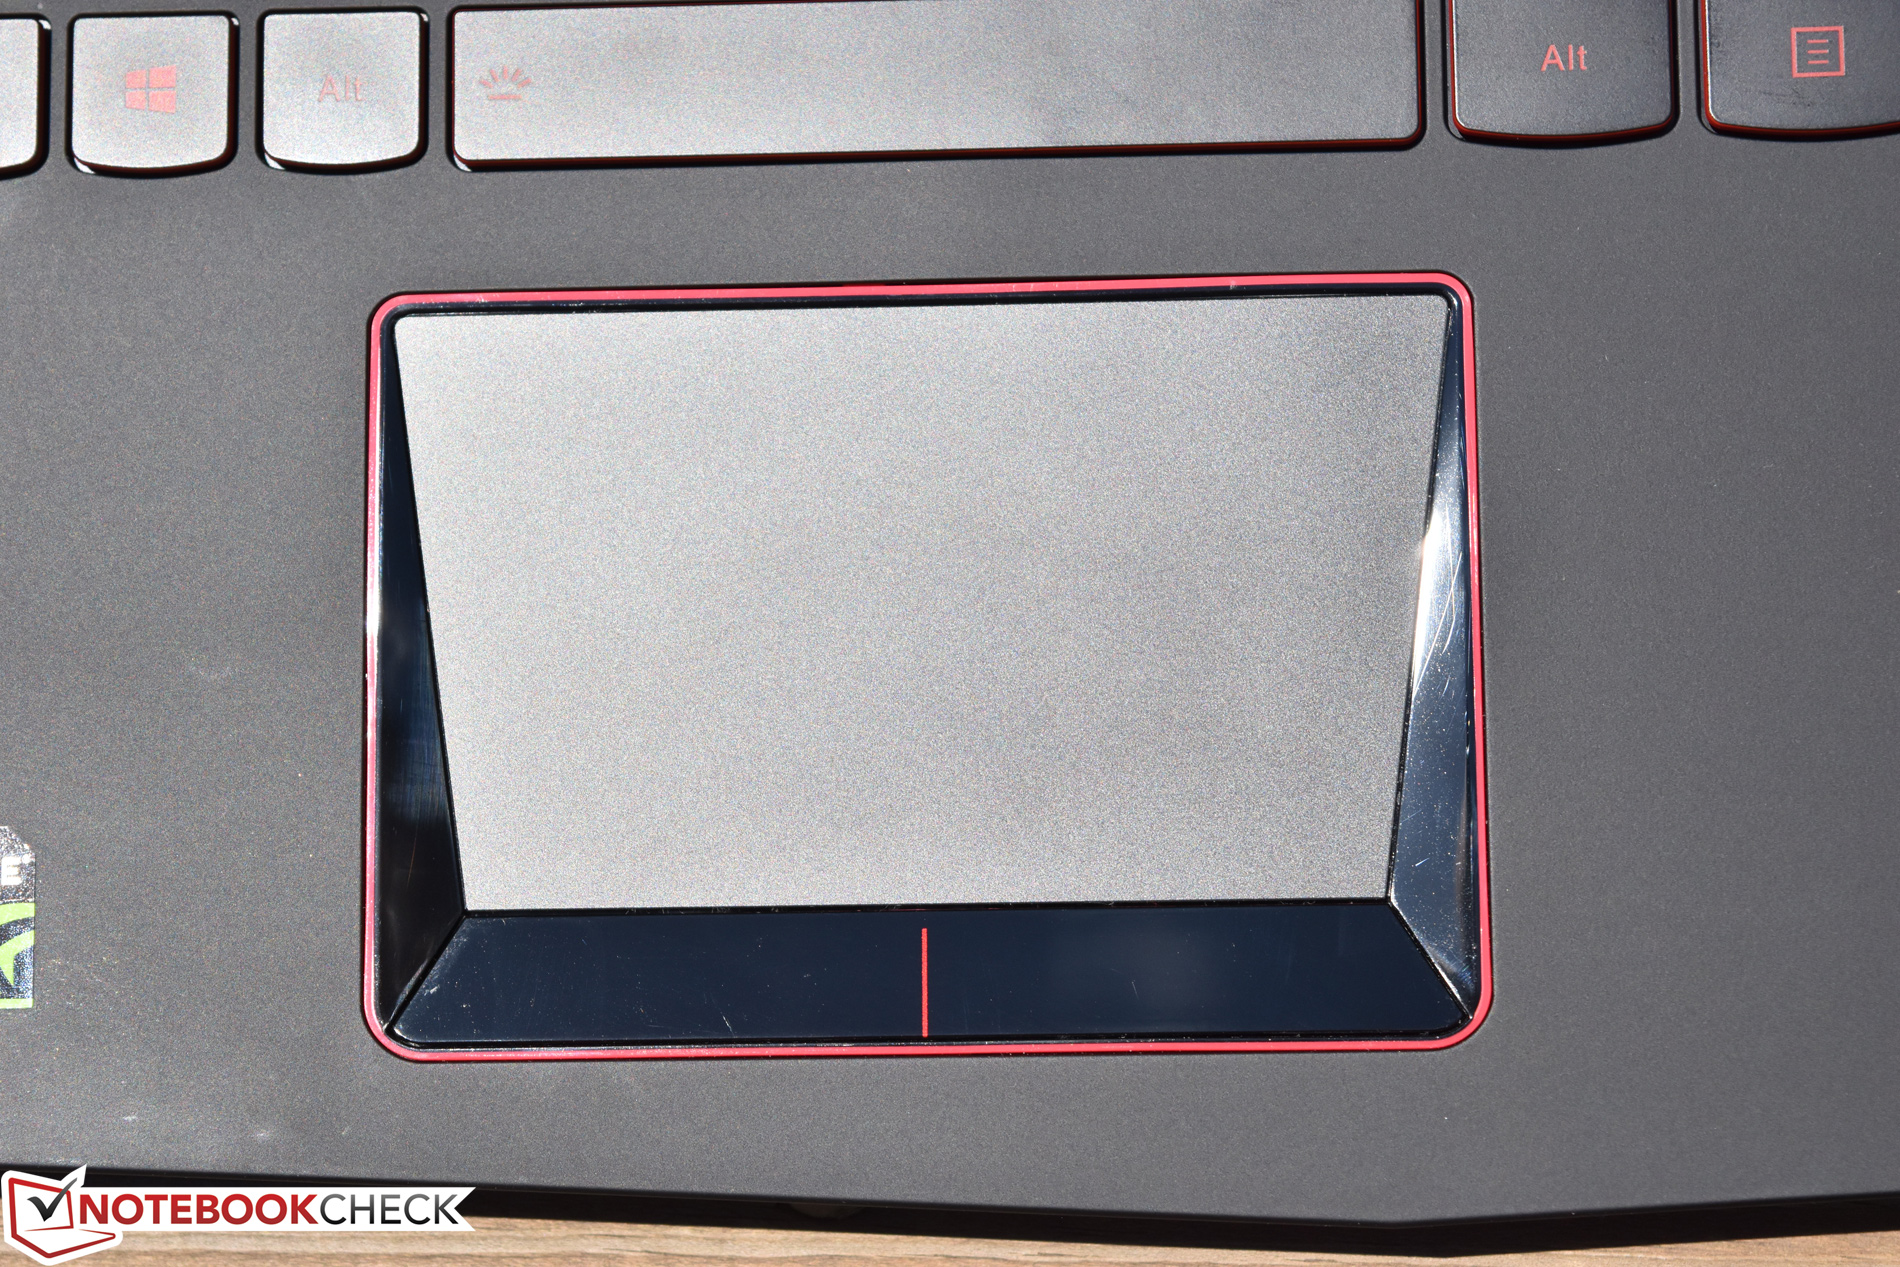
(+) The palmrests and touchpad are reaching skin temperature as a maximum (32.9 °C / 91.2 F) and are therefore not hot.
(-) The average temperature of the palmrest area of similar devices was 28.9 °C / 84 F (-4 °C / -7.2 F).
| Lenovo Legion Y520-15IKBN 80WK0042GE i5-7300HQ, GeForce GTX 1050 Ti Mobile | Lenovo Legion Y520-15IKBN-80WK001KUS i7-7700HQ, GeForce GTX 1050 Ti Mobile | HP Omen 15-ax213ng i7-7700HQ, GeForce GTX 1050 Ti Mobile | Dell Inspiron 15 7000 7567 Gaming (Core i5-7300HQ, GTX 1050) i5-7300HQ, GeForce GTX 1050 Mobile | Asus FX502VM-AS73 i7-7700HQ, GeForce GTX 1060 Mobile | Acer Aspire VX15 VX5-591G-589S i5-7300HQ, GeForce GTX 1050 Mobile | Acer Nitro 5 AN515-51-788E i7-7700HQ, GeForce GTX 1050 Ti Mobile | |
|---|---|---|---|---|---|---|---|
| Heat | -28% | -34% | -22% | -38% | -25% | -13% | |
| Maximum Upper Side * | 39.6 | 46.8 -18% | 52.4 -32% | 47.2 -19% | 53.2 -34% | 47.2 -19% | 41.1 -4% |
| Maximum Bottom * | 38.4 | 55.8 -45% | 54.2 -41% | 43.2 -13% | 56.8 -48% | 42.2 -10% | 38.8 -1% |
| Idle Upper Side * | 22.8 | 27.6 -21% | 30.5 -34% | 28.6 -25% | 28.8 -26% | 31.8 -39% | 28.7 -26% |
| Idle Bottom * | 22.1 | 28.4 -29% | 28.2 -28% | 29 -31% | 31.4 -42% | 29.5 -33% | 26.9 -22% |
* ... más pequeño es mejor
Lenovo Legion Y520-15IKBN 80WK0042GE audio analysis
(-) | not very loud speakers (65.8 dB)
Bass 100 - 315 Hz
(-) | nearly no bass - on average 16.9% lower than median
(±) | linearity of bass is average (13.9% delta to prev. frequency)
Mids 400 - 2000 Hz
(+) | balanced mids - only 4.6% away from median
(±) | linearity of mids is average (8.8% delta to prev. frequency)
Highs 2 - 16 kHz
(+) | balanced highs - only 3.6% away from median
(±) | linearity of highs is average (12.7% delta to prev. frequency)
Overall 100 - 16.000 Hz
(±) | linearity of overall sound is average (22.6% difference to median)
Compared to same class
» 79% of all tested devices in this class were better, 5% similar, 16% worse
» The best had a delta of 6%, average was 18%, worst was 132%
Compared to all devices tested
» 62% of all tested devices were better, 6% similar, 32% worse
» The best had a delta of 4%, average was 25%, worst was 134%
Apple MacBook 12 (Early 2016) 1.1 GHz audio analysis
(+) | speakers can play relatively loud (83.6 dB)
Bass 100 - 315 Hz
(±) | reduced bass - on average 11.3% lower than median
(±) | linearity of bass is average (14.2% delta to prev. frequency)
Mids 400 - 2000 Hz
(+) | balanced mids - only 2.4% away from median
(+) | mids are linear (5.5% delta to prev. frequency)
Highs 2 - 16 kHz
(+) | balanced highs - only 2% away from median
(+) | highs are linear (4.5% delta to prev. frequency)
Overall 100 - 16.000 Hz
(+) | overall sound is linear (10.2% difference to median)
Compared to same class
» 5% of all tested devices in this class were better, 2% similar, 93% worse
» The best had a delta of 5%, average was 19%, worst was 53%
Compared to all devices tested
» 3% of all tested devices were better, 1% similar, 96% worse
» The best had a delta of 4%, average was 25%, worst was 134%
| Off / Standby | |
| Ocioso | |
| Carga |
|
| Lenovo Legion Y520-15IKBN 80WK0042GE i5-7300HQ, GeForce GTX 1050 Ti Mobile | Lenovo Legion Y520-15IKBN-80WK001KUS i7-7700HQ, GeForce GTX 1050 Ti Mobile | HP Omen 15-ax213ng i7-7700HQ, GeForce GTX 1050 Ti Mobile | Dell Inspiron 15 7000 7567 Gaming (Core i5-7300HQ, GTX 1050) i5-7300HQ, GeForce GTX 1050 Mobile | Asus FX502VM-AS73 i7-7700HQ, GeForce GTX 1060 Mobile | Acer Aspire VX15 VX5-591G-589S i5-7300HQ, GeForce GTX 1050 Mobile | Acer Nitro 5 AN515-51-788E i7-7700HQ, GeForce GTX 1050 Ti Mobile | |
|---|---|---|---|---|---|---|---|
| Power Consumption | -20% | -33% | -26% | -87% | -30% | -5% | |
| Idle Minimum * | 5.2 | 8.5 -63% | 6 -15% | 9.1 -75% | 14.9 -187% | 8.4 -62% | 4.1 21% |
| Idle Average * | 8.3 | 9.1 -10% | 11 -33% | 10.3 -24% | 15.1 -82% | 13.1 -58% | 6.9 17% |
| Idle Maximum * | 10.1 | 9.7 4% | 18 -78% | 13 -29% | 15.2 -50% | 14.2 -41% | 9.5 6% |
| Load Average * | 62.7 | 79.9 -27% | 81 -29% | 75.6 -21% | 105.8 -69% | 50 20% | 83 -32% |
| Witcher 3 ultra * | 94 | 97.7 -4% | 90 4% | 83.8 11% | 108 -15% | ||
| Load Maximum * | 100 | 121.5 -22% | 146 -46% | 115.2 -15% | 148.8 -49% | 111 -11% | 126 -26% |
* ... más pequeño es mejor
| Lenovo Legion Y520-15IKBN 80WK0042GE i5-7300HQ, GeForce GTX 1050 Ti Mobile, 45 Wh | Lenovo Legion Y520-15IKBN-80WK001KUS i7-7700HQ, GeForce GTX 1050 Ti Mobile, 45 Wh | HP Omen 15-ax213ng i7-7700HQ, GeForce GTX 1050 Ti Mobile, 63.3 Wh | Acer Aspire VX5-591G-75C4 VX15 i7-7700HQ, GeForce GTX 1050 Ti Mobile, 52.5 Wh | Dell Inspiron 15 7000 7567 Gaming (Core i5-7300HQ, GTX 1050) i5-7300HQ, GeForce GTX 1050 Mobile, 74 Wh | Asus FX502VM-AS73 i7-7700HQ, GeForce GTX 1060 Mobile, 64 Wh | Medion Erazer X6603 i7-7700HQ, GeForce GTX 1050 Ti Mobile, 45 Wh | Acer Aspire VX15 VX5-591G-589S i5-7300HQ, GeForce GTX 1050 Mobile, 52.5 Wh | Acer Nitro 5 AN515-51-788E i7-7700HQ, GeForce GTX 1050 Ti Mobile, 48 Wh | |
|---|---|---|---|---|---|---|---|---|---|
| Duración de Batería | -29% | 13% | -17% | 69% | -25% | -31% | 6% | 16% | |
| Reader / Idle | 634 | 509 -20% | 765 21% | 322 -49% | 1091 72% | 363 -43% | 340 -46% | 893 41% | |
| H.264 | 272 | 196 -28% | 227 -17% | 309 14% | |||||
| WiFi v1.3 | 310 | 240 -23% | 428 38% | 302 -3% | 569 84% | 277 -11% | 257 -17% | 330 6% | 400 29% |
| Load | 81 | 46 -43% | 97 20% | 81 0% | 122 51% | 64 -21% | 46 -43% | 63 -22% |
Pro
Contra
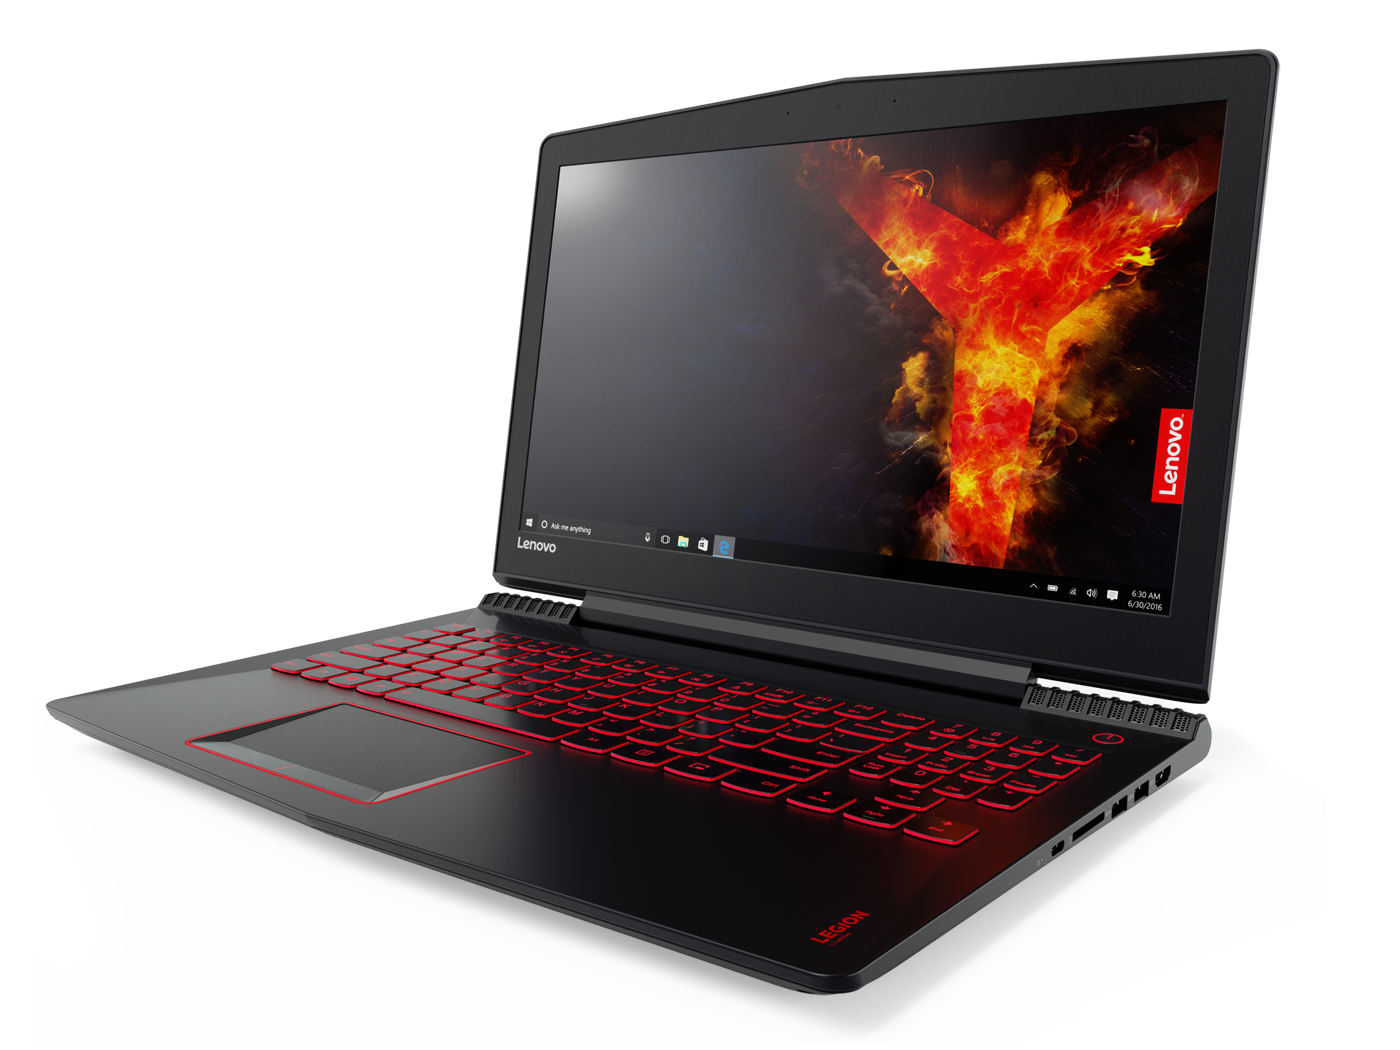
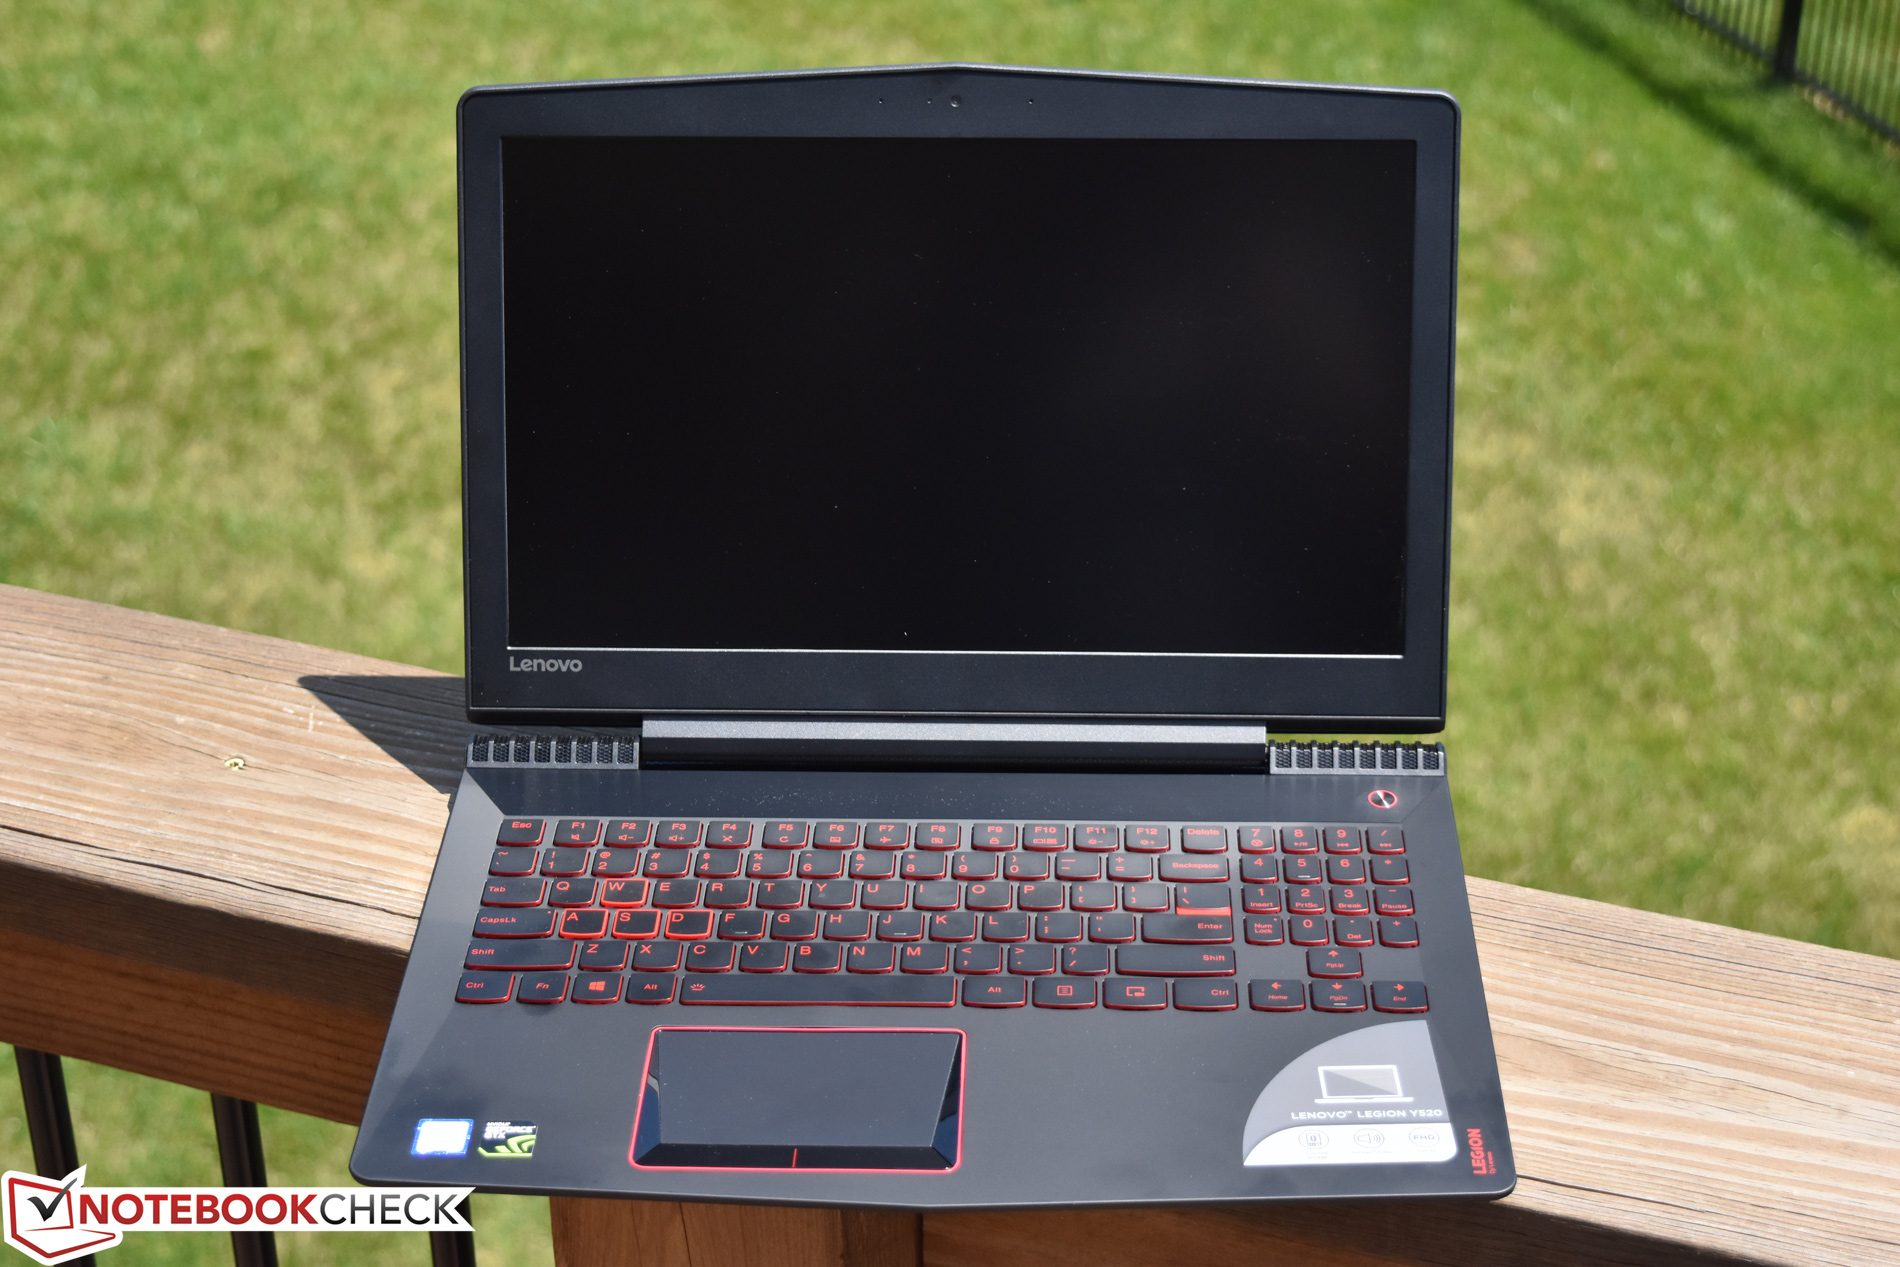
Con el Lenovo Legion Y520 80WK0042GE consigues un portátil de 15,6 " con procesador quadcore Kaby-Lake y un núcleo gráfico GeForce GTX 1050 Ti a bordo. El hardware hace que la mayoría de los juegos se vean sin problemas en altas resoluciones y en configuraciones de media a alta calidad. A juegos que requieren de mucha energía hay que bajarles la resolución y/o de los ajustes de calidad. El ordenador no se calienta demasiado a ningún nivel de carga, y se ejecuta en su mayor parte en silencio, al menos mientras está inactivo .
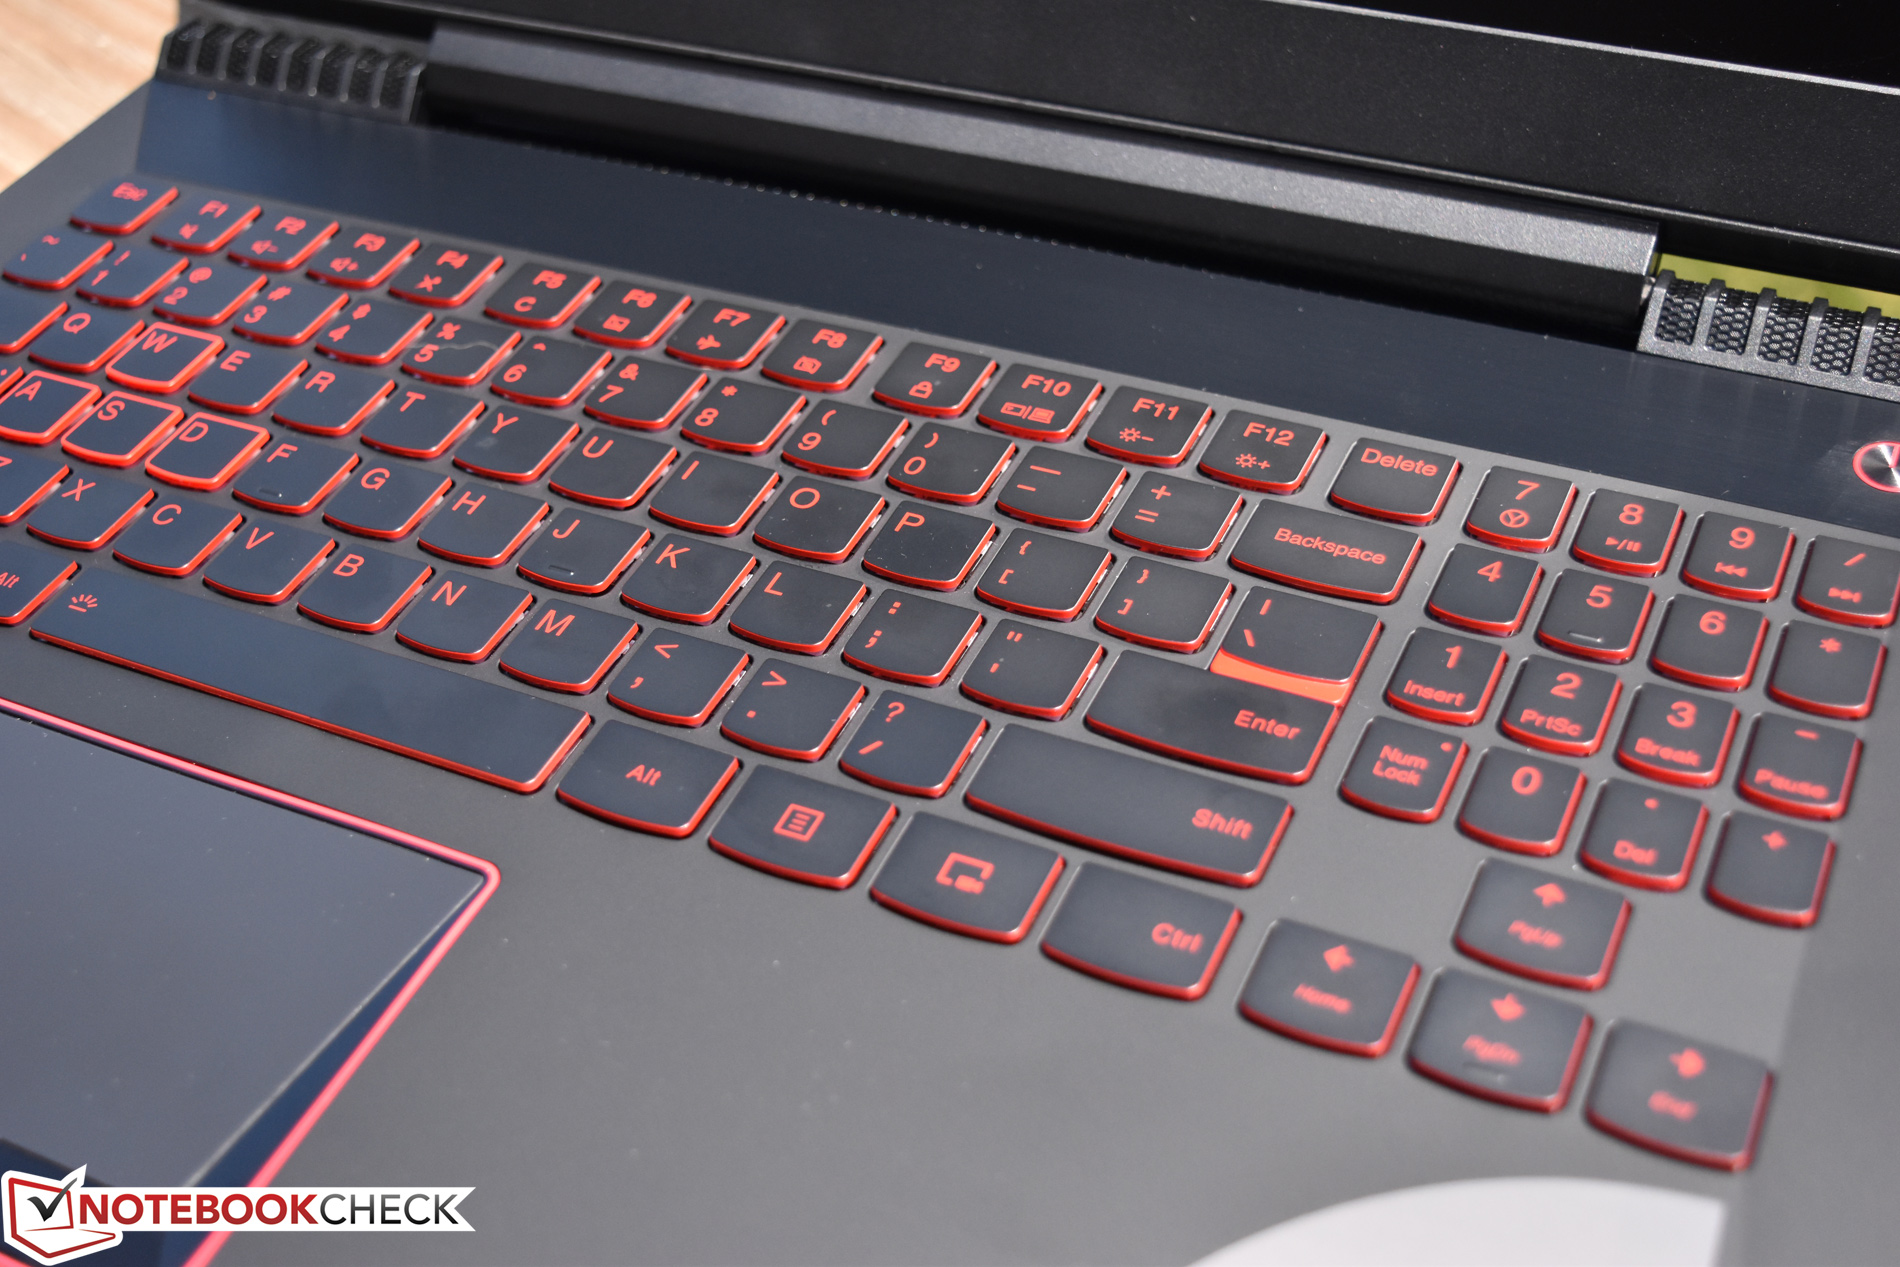
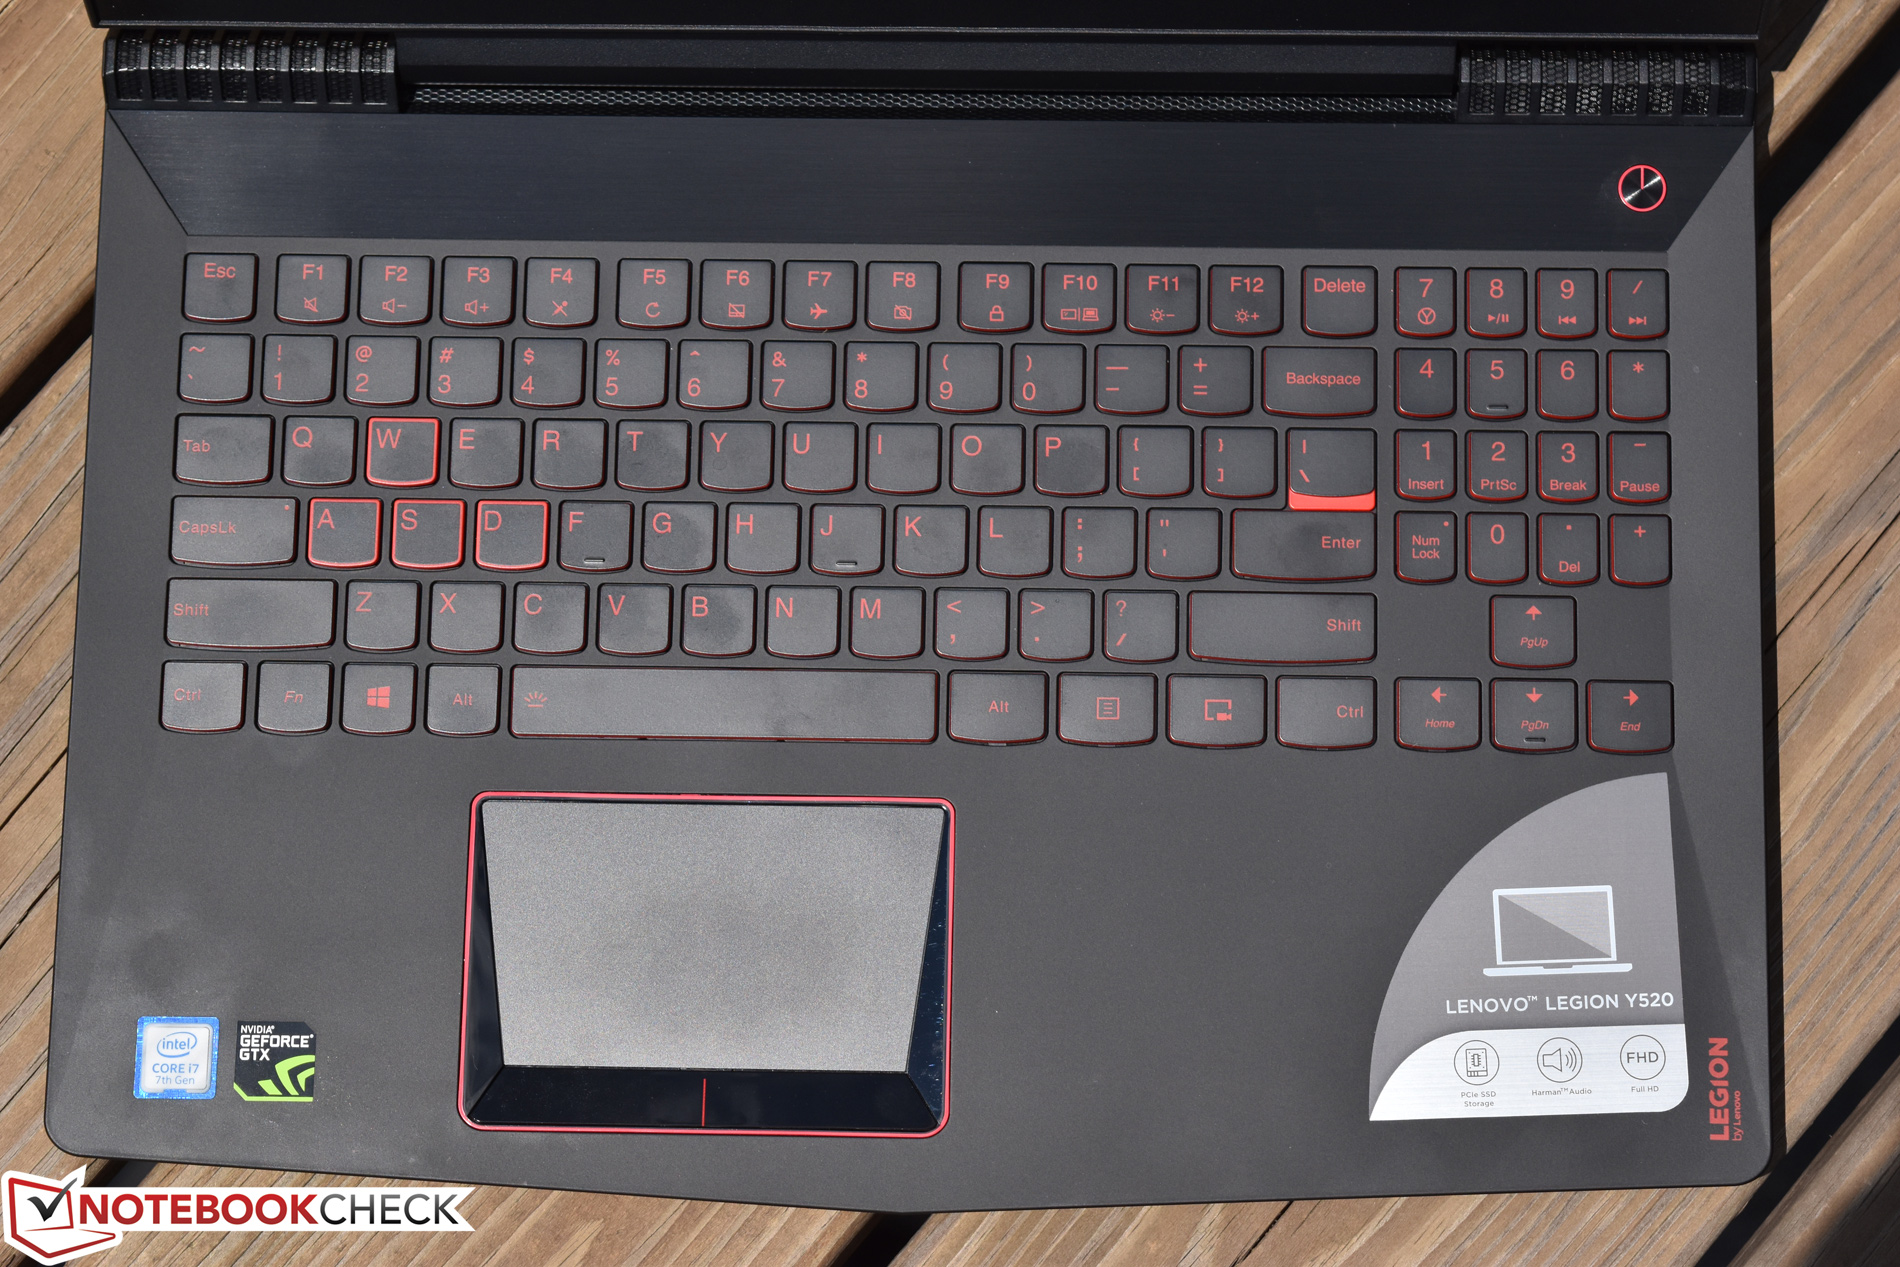
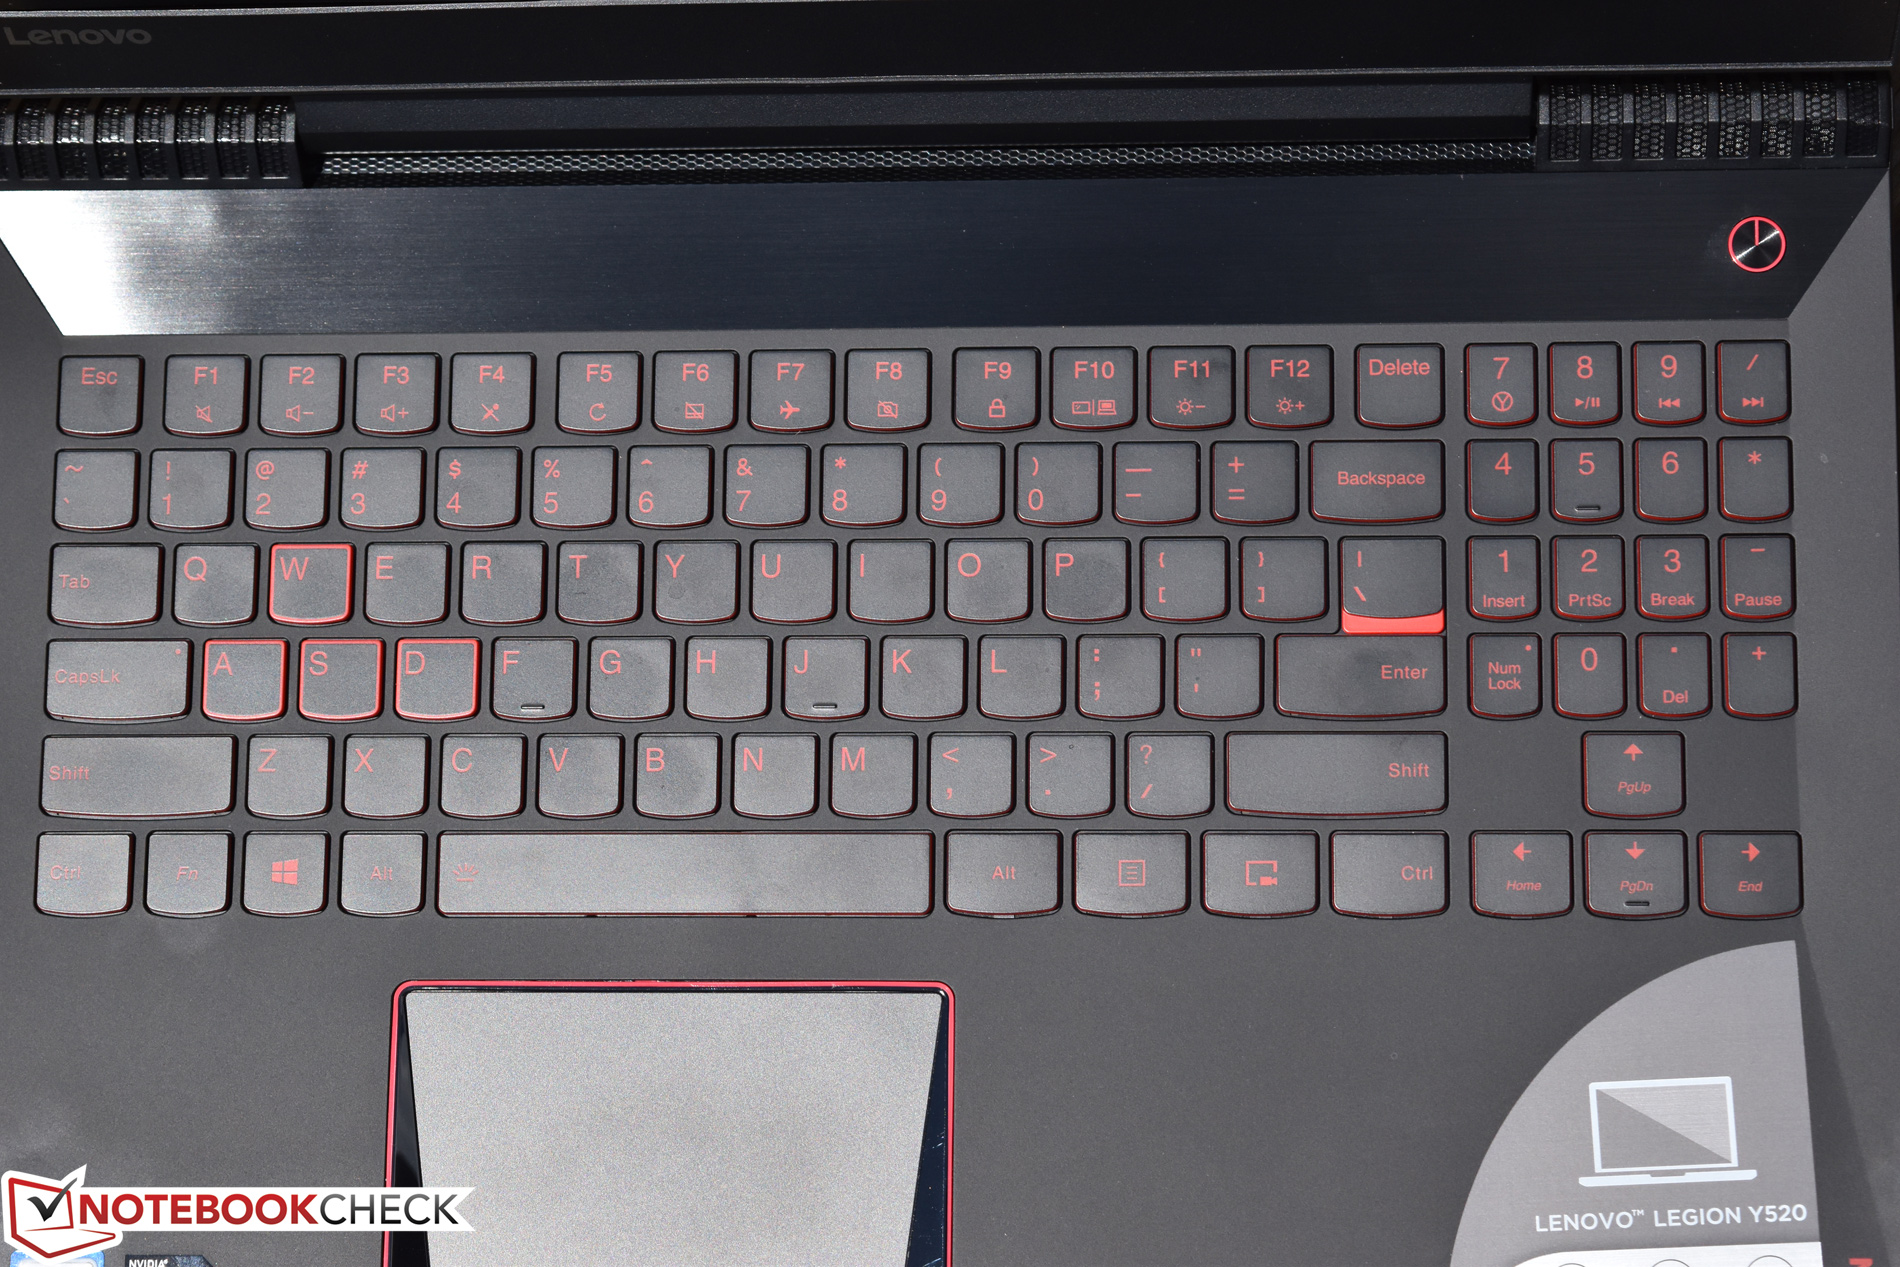
Con el Legion Y520-15IKBN, Lenovo trae un portátil gaming básico bien equipado.
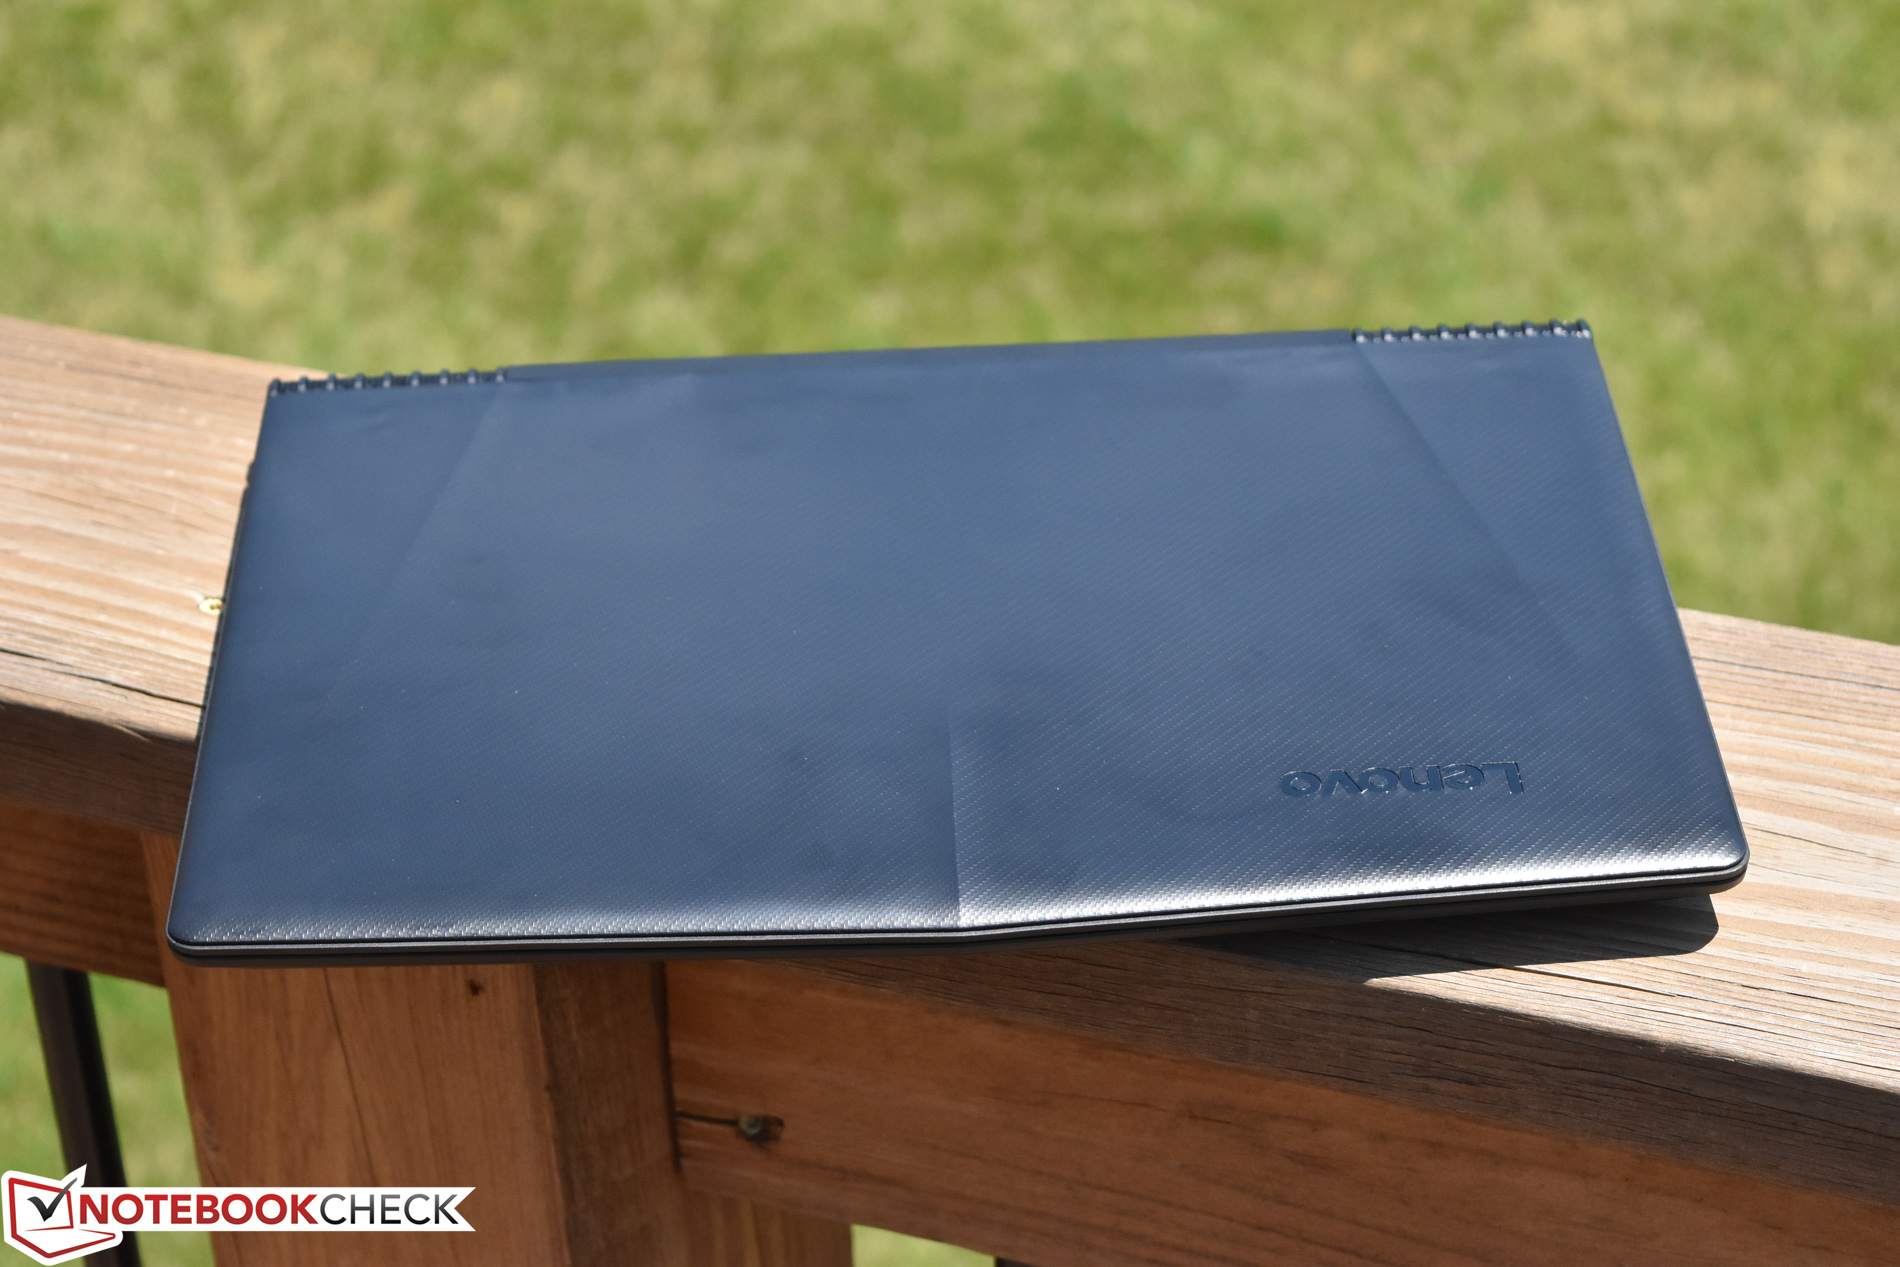
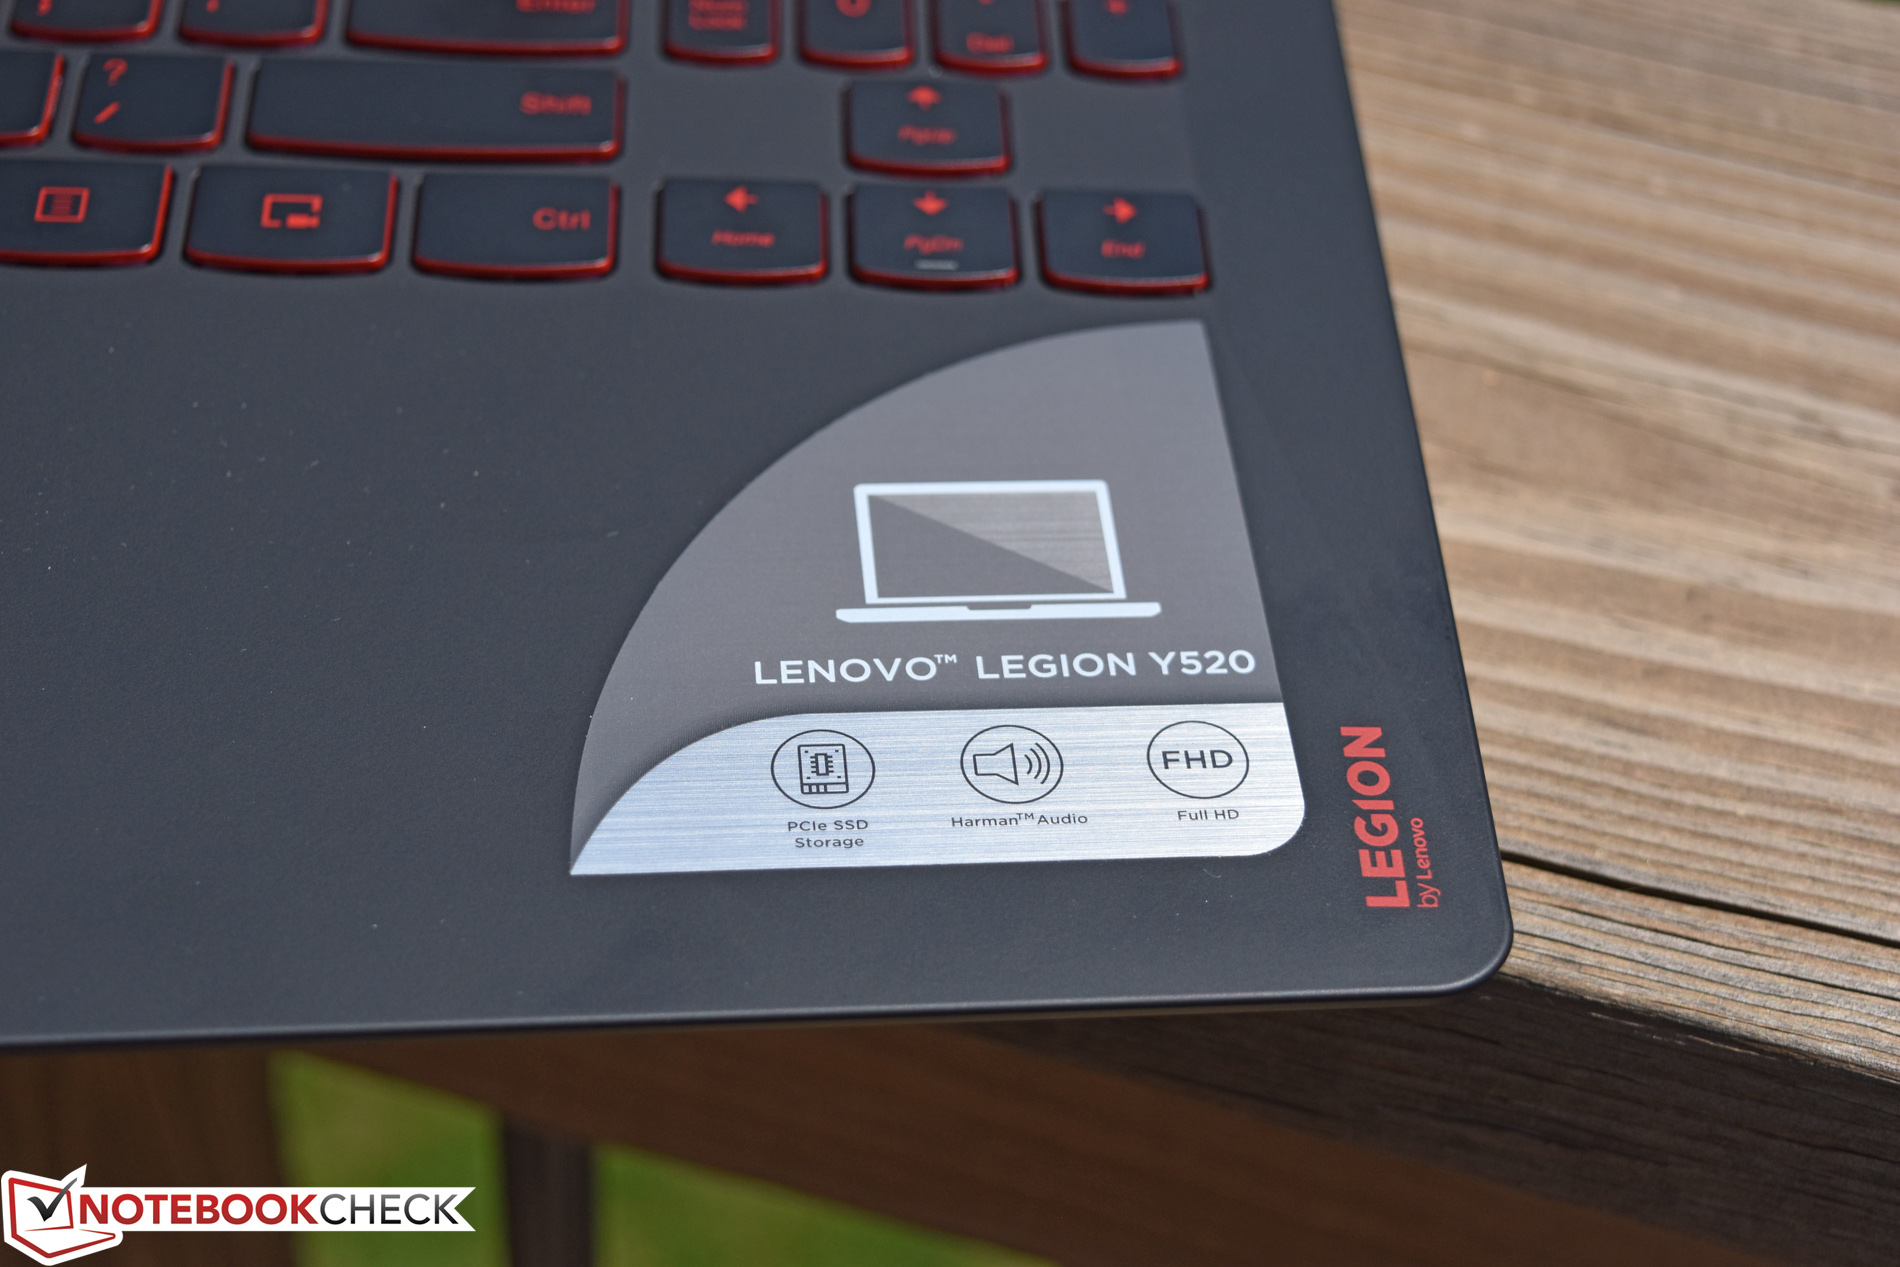
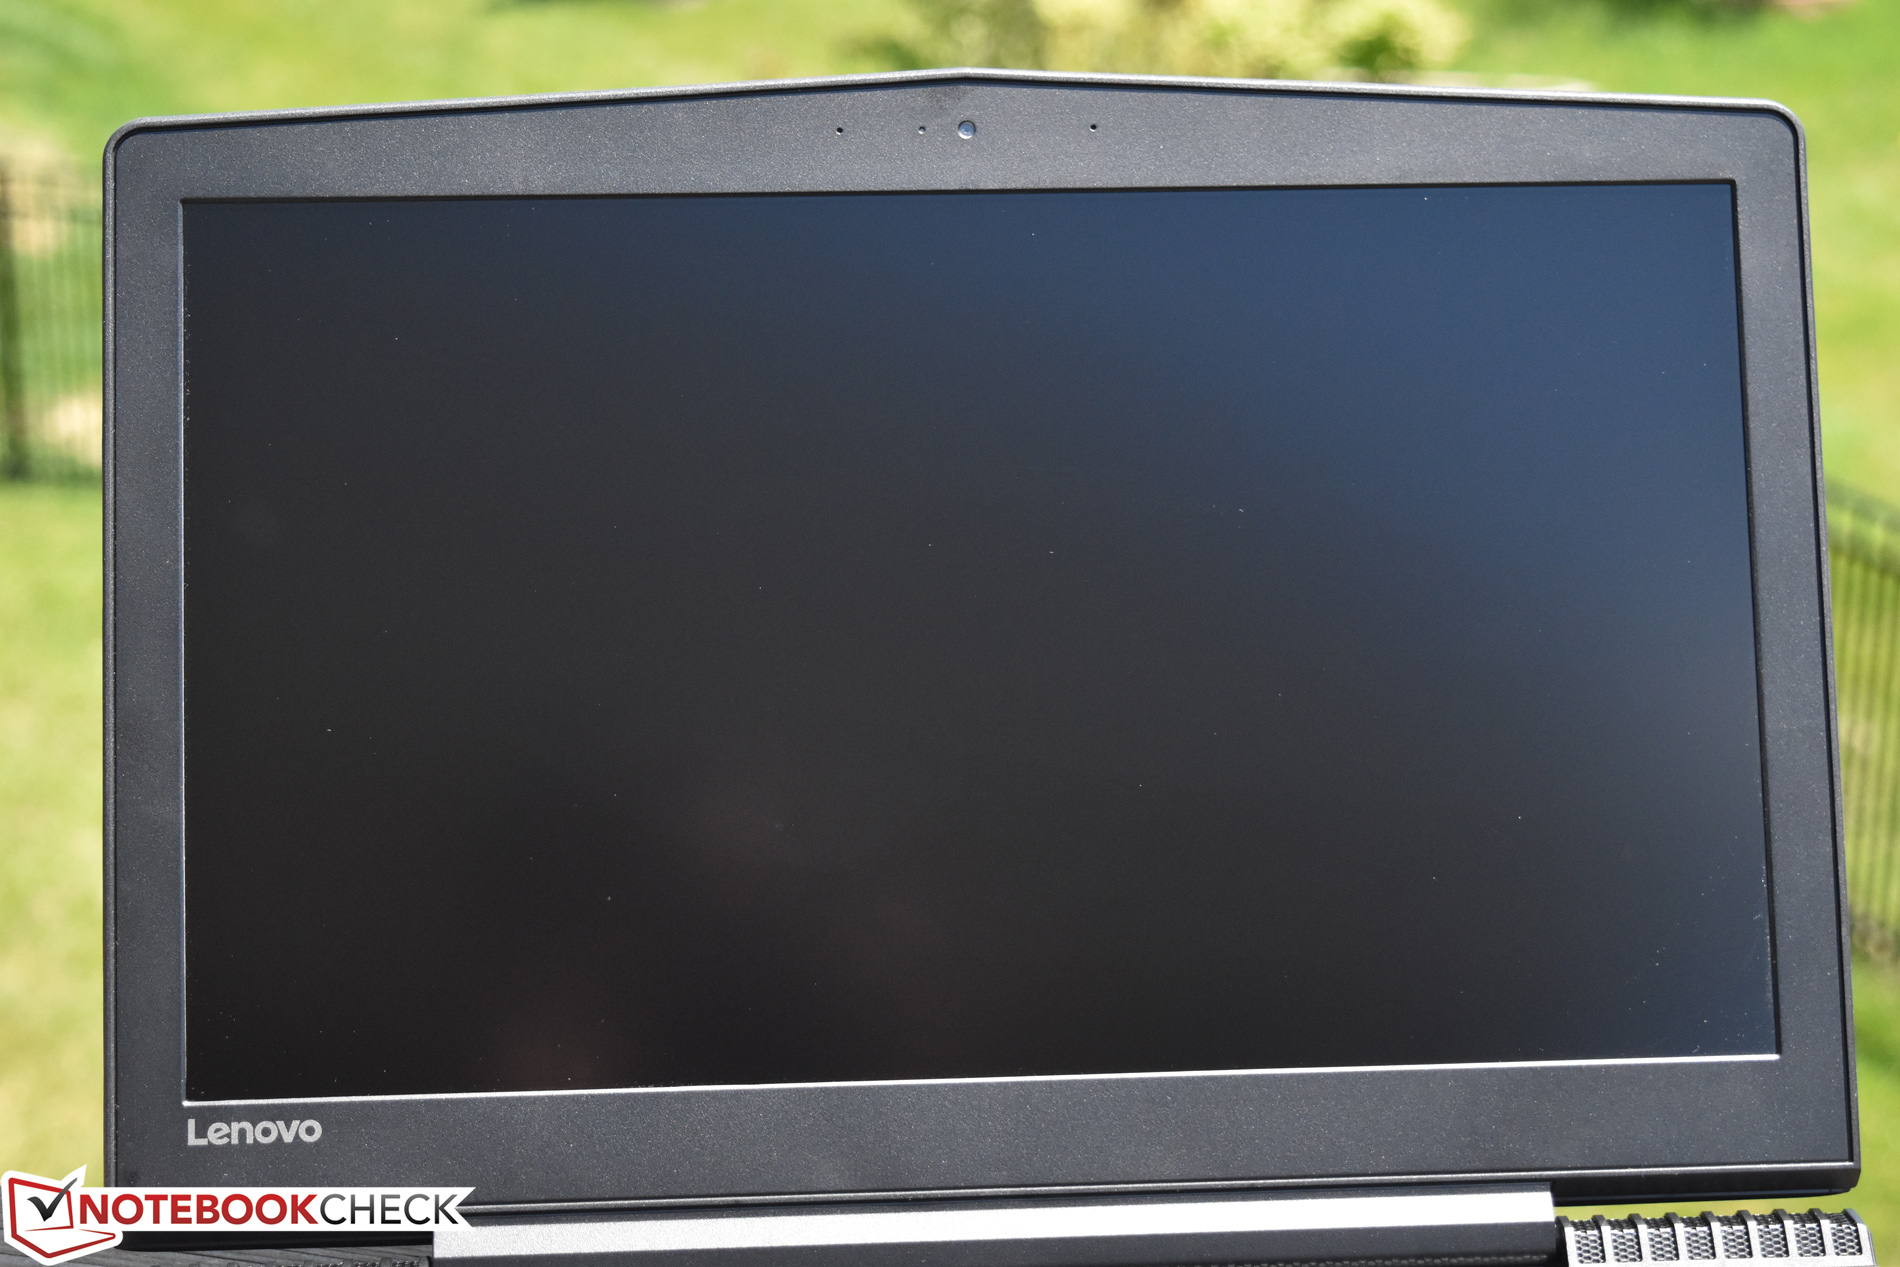
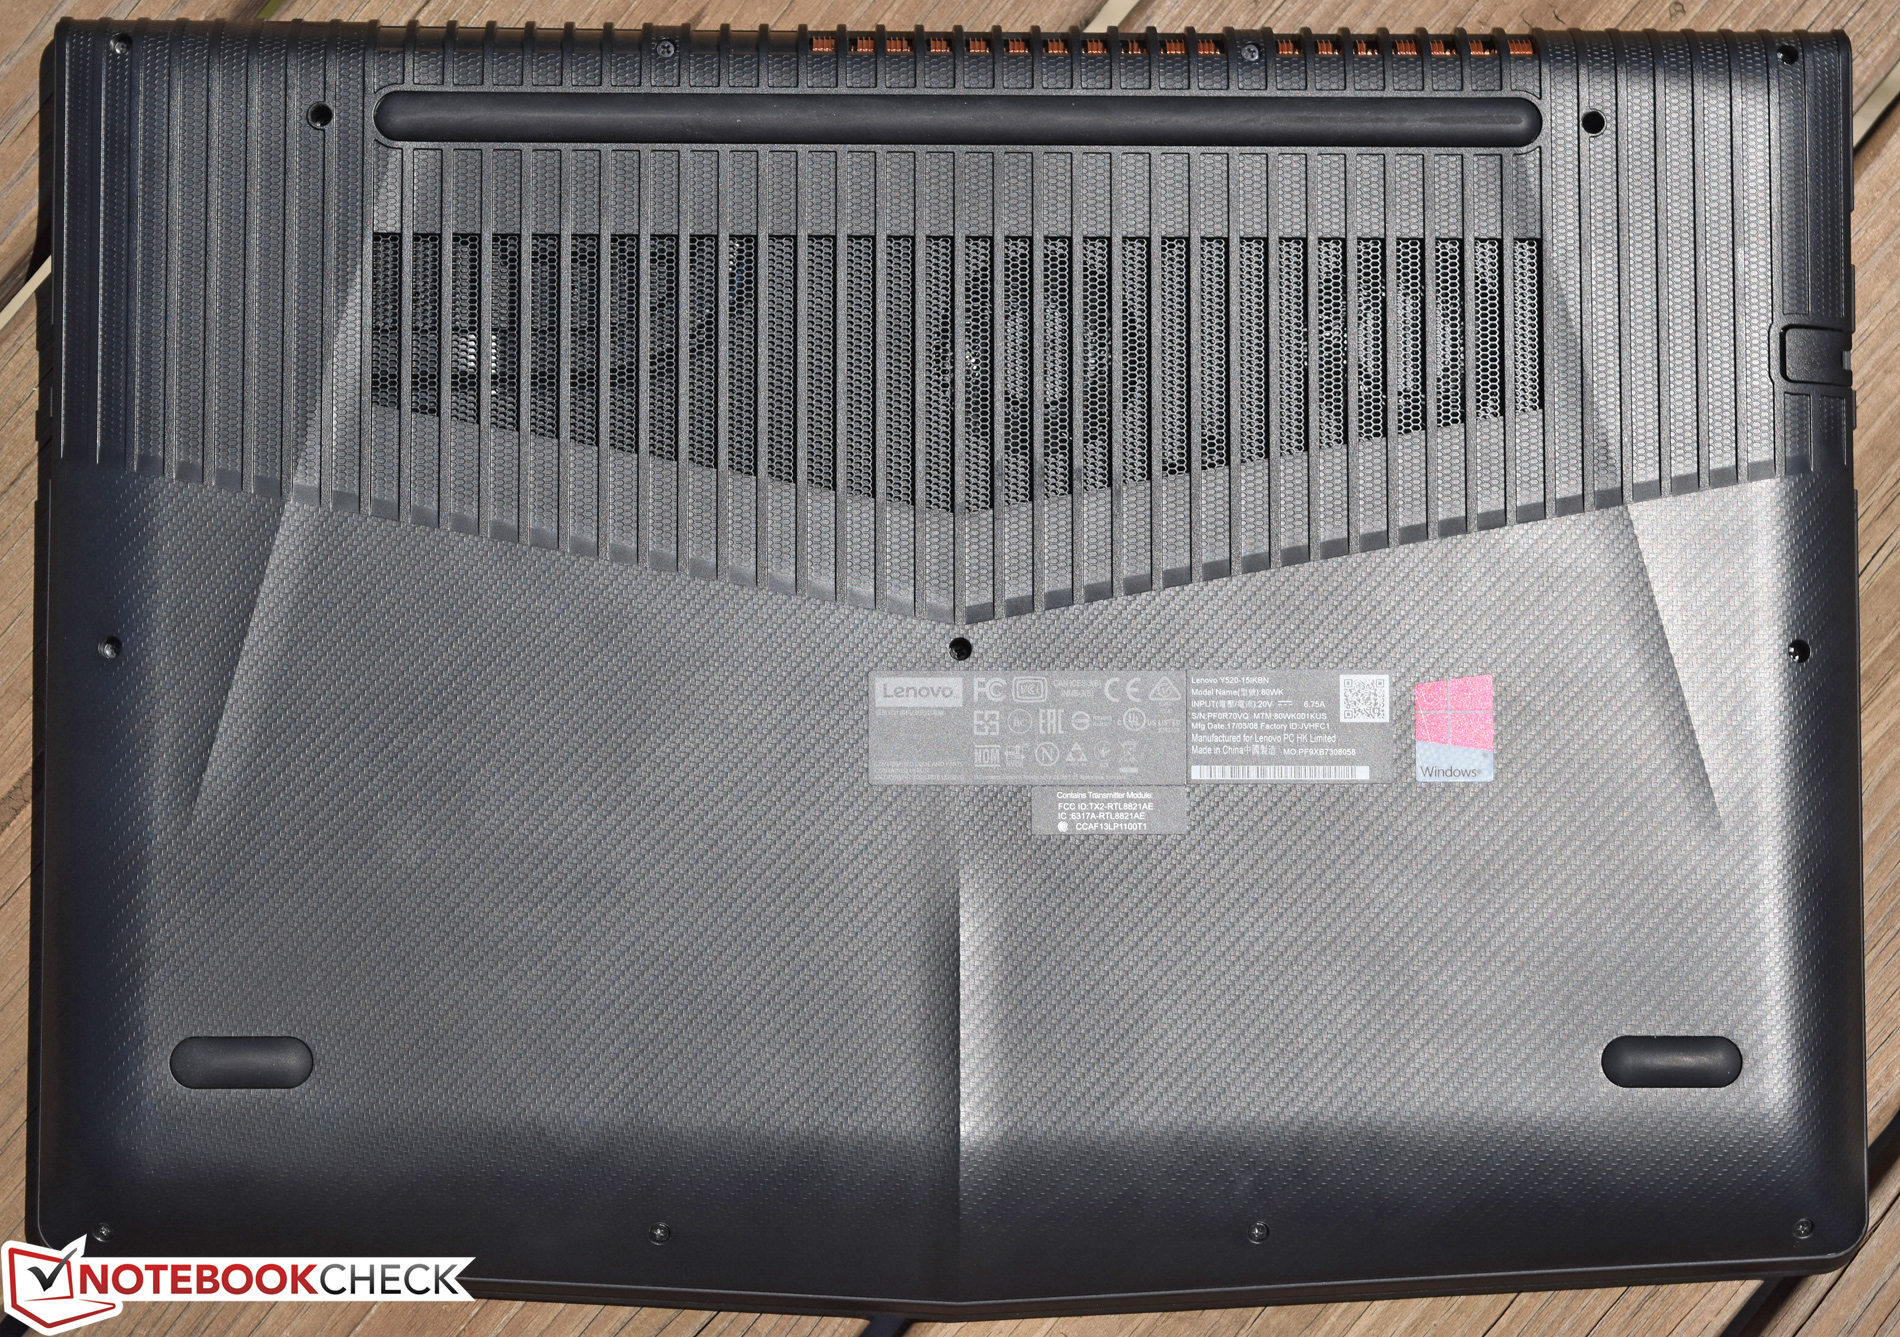
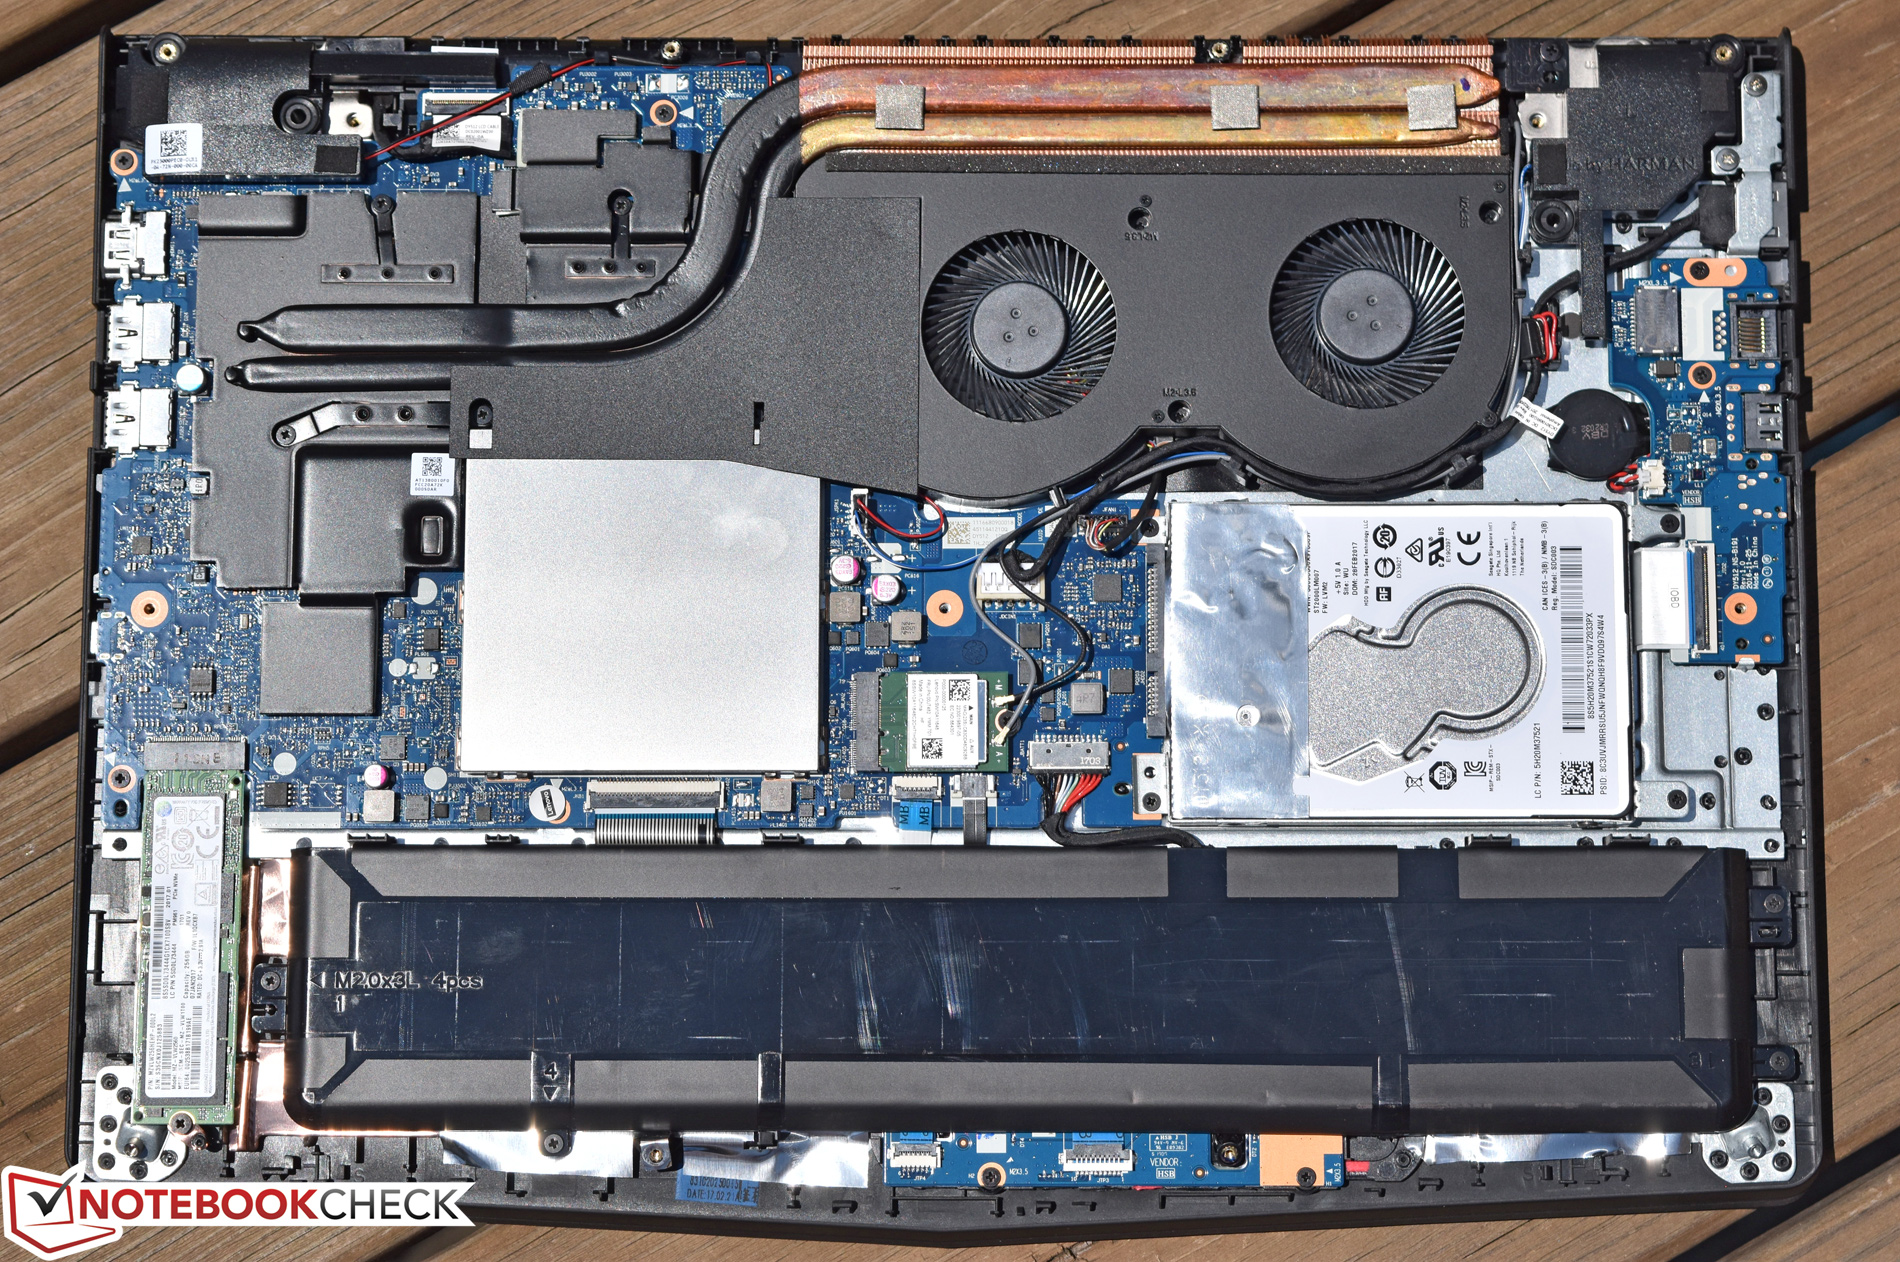
Gracias a un buen teclado ya un duncionamiento silencioso mientras está en inactivo y en cargas bajas, también se puede utilizar el ordenador en la oficina. Un SSD NVMe muy veloz garantiza un sistema de funcionamiento rápido. El almacenamiento necesario para un portátil gaming lo proporciona un disco duro de 2,5" que también está instalado. Ambas unidades se pueden quitar. Para ello, se tendría que abrir la carcasa. El brillo y el contraste de la pantalla mate IPS Full HD están bien, pero podría haber sido un poco mejor en general.
Ésta es una versión acortada del análisis original. Puedes leer el análisis completo en inglés aquí.
Lenovo Legion Y520-15IKBN 80WK0042GE
-
10/02/2017 v6(old)
Sascha Mölck