 Deutsch
 English
 Español
 Français
 Italiano
 Nederlands
 Polski
 Português
 Русский
 Türkçe
 Svenska
 Chinese
 Magyar
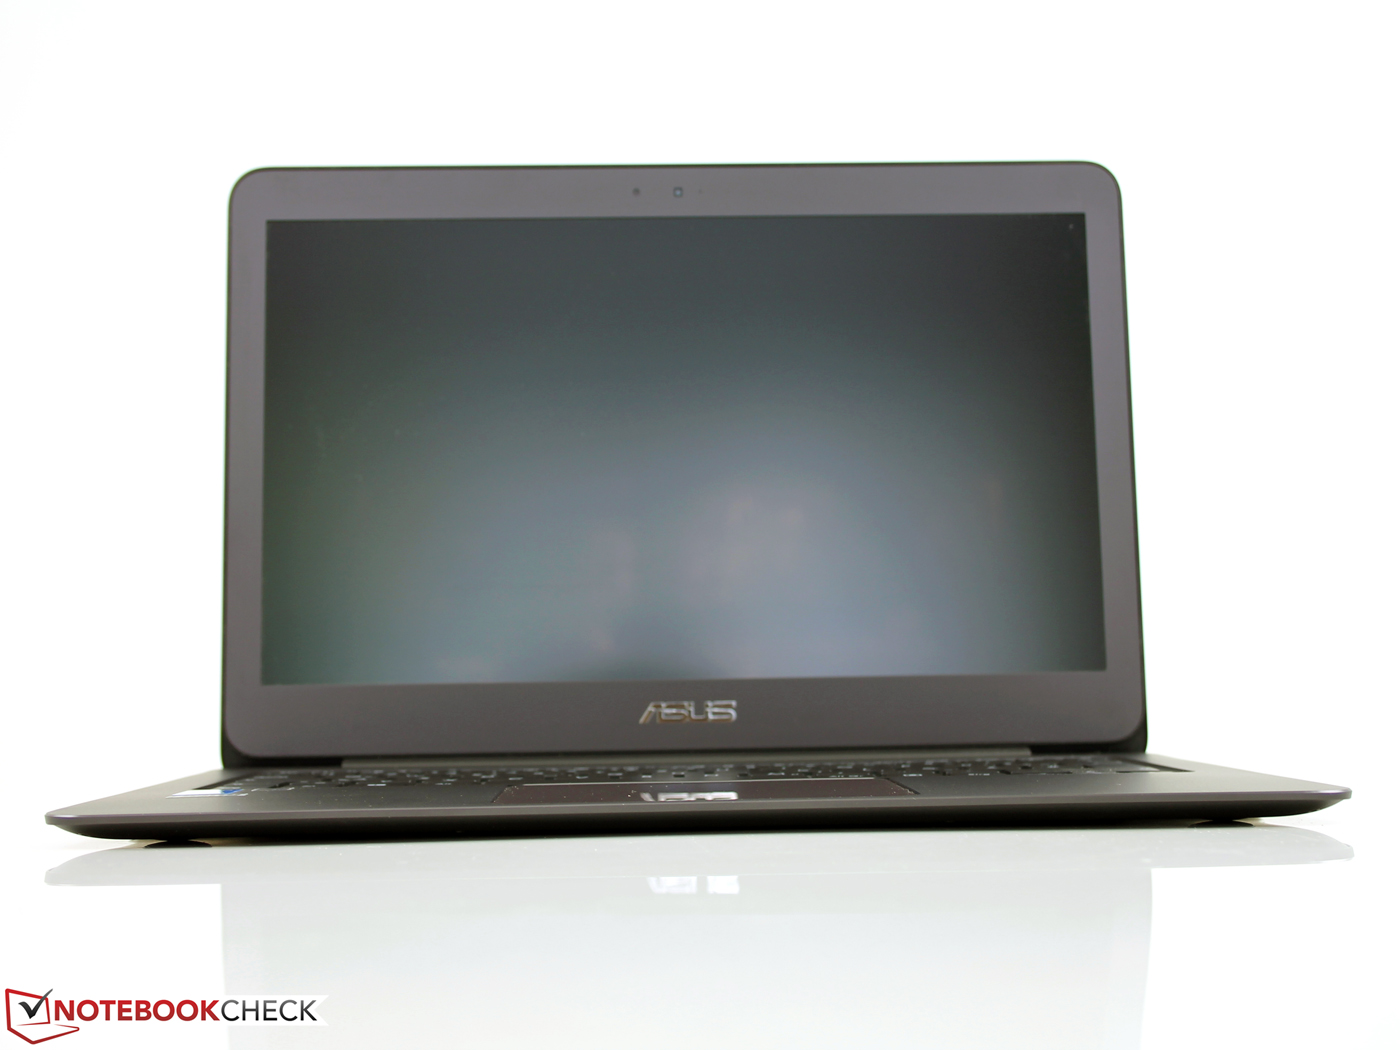
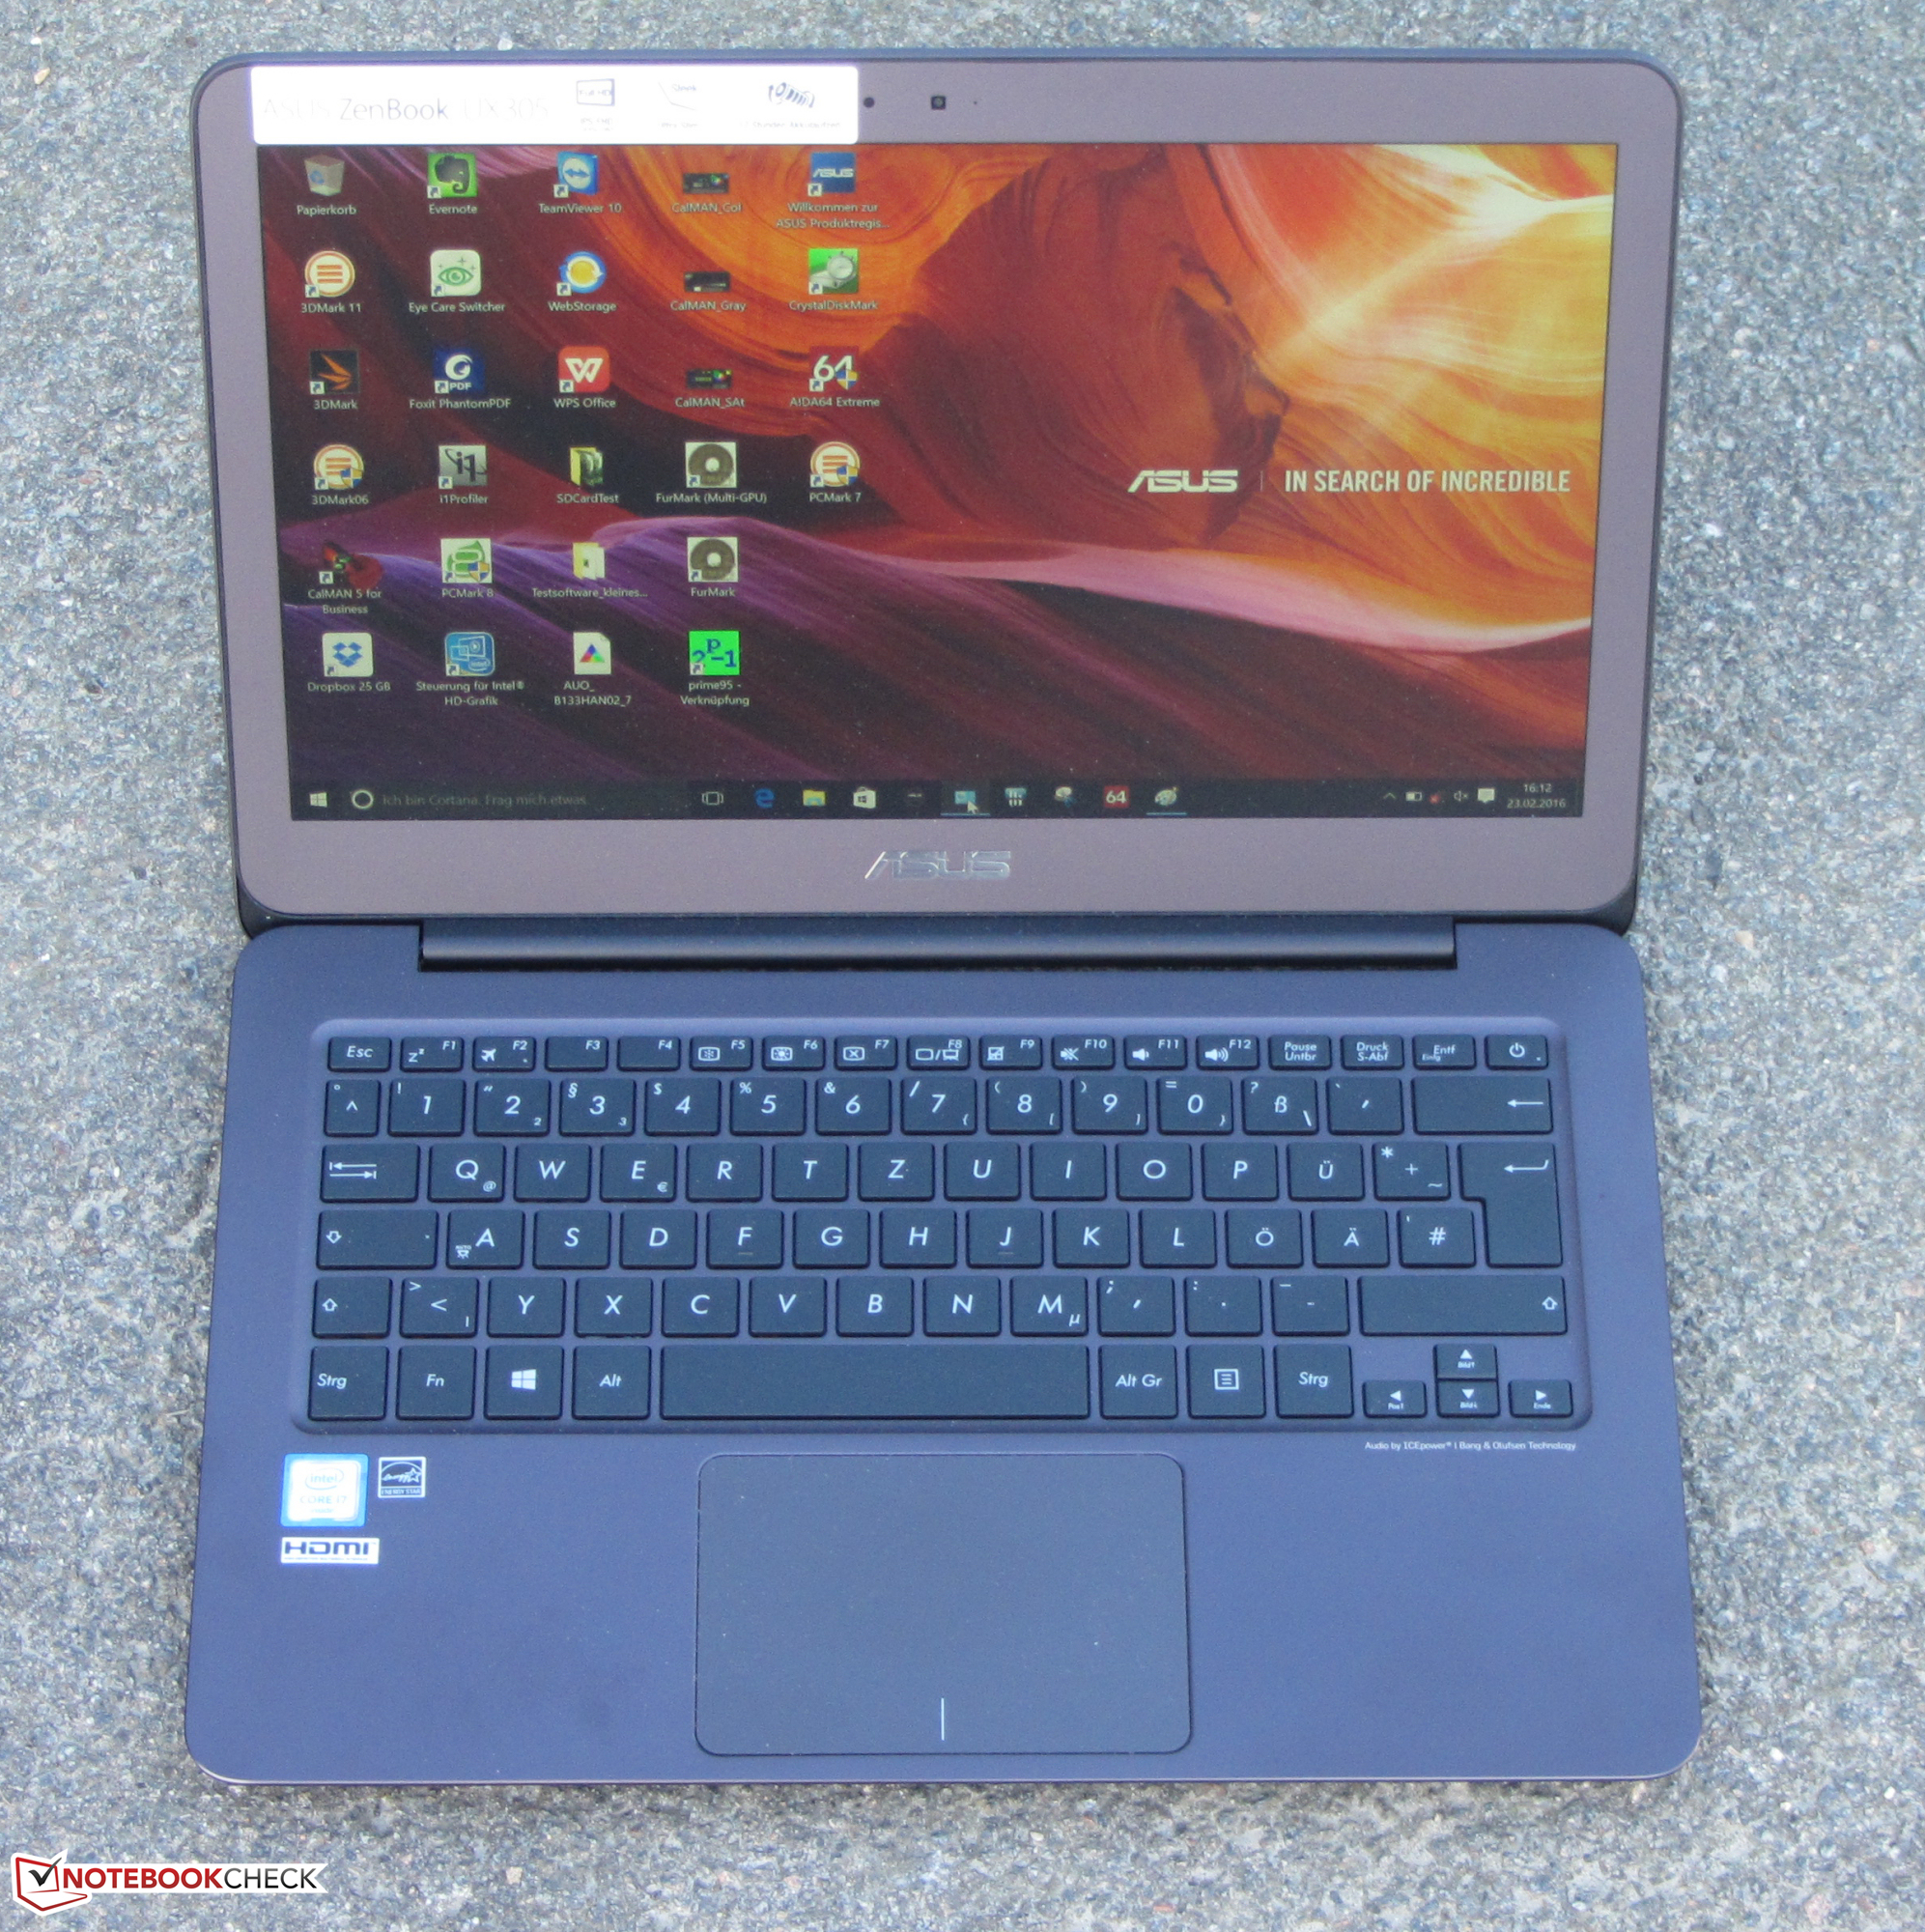
Breve análisis del subportátil Asus Zenbook UX305UA-FC040T

| |||||||||||||||||||||||||
iluminación: 86 %
Brillo con batería: 358 cd/m²
Contraste: 895:1 (Negro: 0.4 cd/m²)
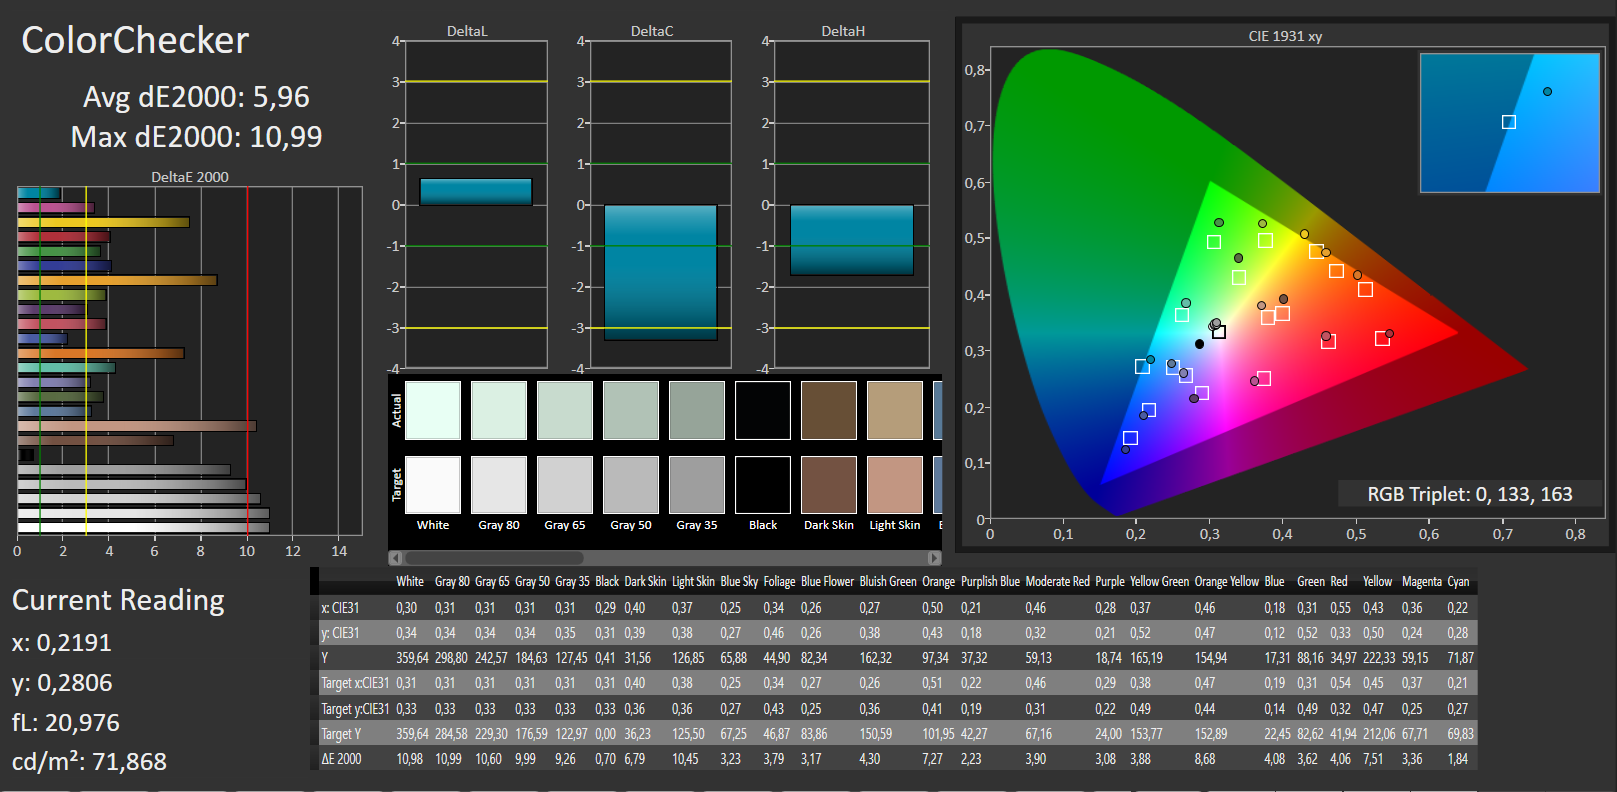
ΔE Color 5.96 | 0.5-29.43 Ø5
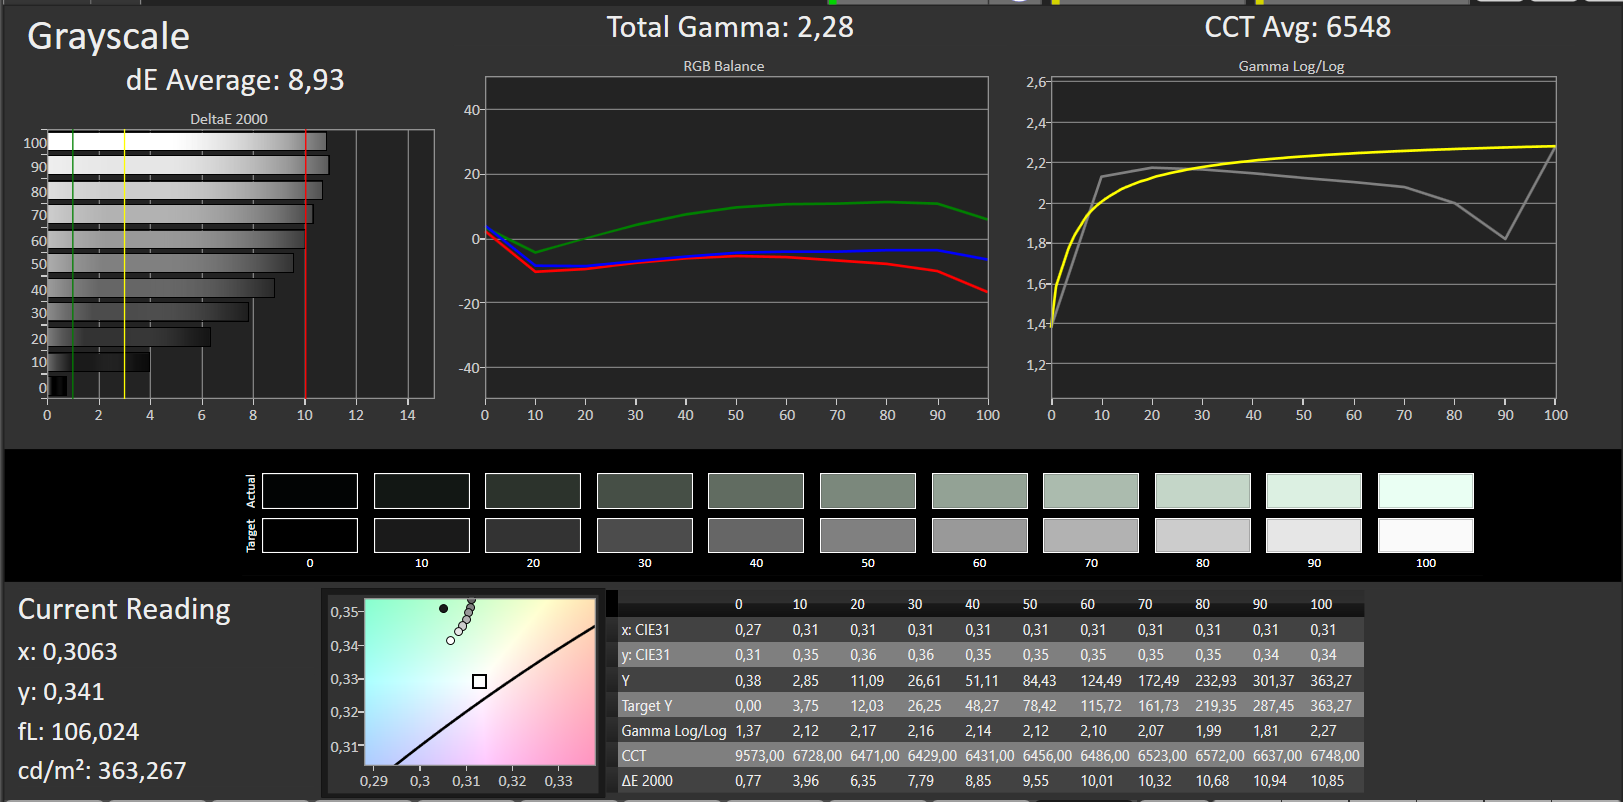
ΔE Greyscale 8.93 | 0.57-98 Ø5.3
93% sRGB (Argyll 1.6.3 3D)
60% AdobeRGB 1998 (Argyll 1.6.3 3D)
66.3% AdobeRGB 1998 (Argyll 2.2.0 3D)
92.8% sRGB (Argyll 2.2.0 3D)
65.1% Display P3 (Argyll 2.2.0 3D)
Gamma: 2.28
Parpadeo de Pantalla / PWM (Pulse-Width Modulation)
| Parpadeo de Pantalla / PWM detectado | 50 Hz | ≤ 20 % de brillo | 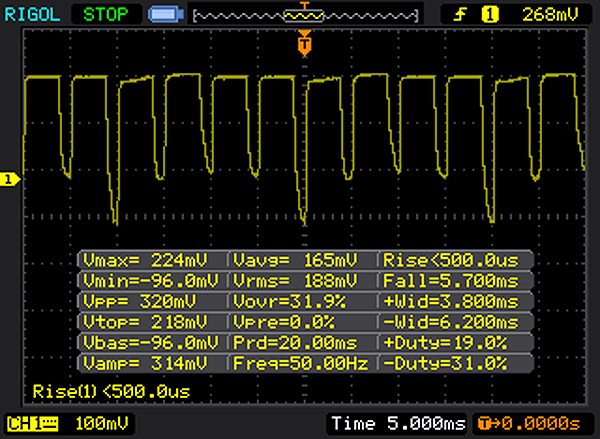 |
La retroiluminación del display parpadea a 50 Hz (seguramente usa PWM - Pulse-Width Modulation) a un brillo del 20 % e inferior. Sobre este nivel de brillo no debería darse parpadeo / PWM. La frecuencia de 50 Hz es bajísima, por lo que el parpadeo puede causar fatiga visual y cefaleas cuando se usa mucho tiempo. Comparación: 53 % de todos los dispositivos testados no usaron PWM para atenuar el display. Si se usó, medimos una media de 17924 (mínimo: 5 - máxmo: 3846000) Hz. | |||

Tiempos de respuesta del display
| ↔ Tiempo de respuesta de Negro a Blanco | ||
|---|---|---|
| 28 ms ... subida ↗ y bajada ↘ combinada | ↗ 8 ms subida | 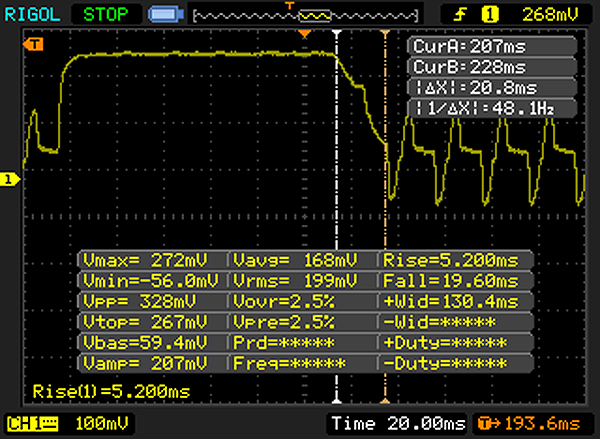 |
| ↘ 20 ms bajada | ||
| La pantalla mostró tiempos de respuesta relativamente lentos en nuestros tests pero podría ser demasiado lenta para los jugones. En comparación, todos los dispositivos de prueba van de ##min### (mínimo) a 240 (máximo) ms. » 67 % de todos los dispositivos son mejores. Eso quiere decir que el tiempo de respuesta es peor que la media (21.5 ms) de todos los dispositivos testados. | ||
| ↔ Tiempo de respuesta 50% Gris a 80% Gris | ||
| 25 ms ... subida ↗ y bajada ↘ combinada | ↗ 15 ms subida |  |
| ↘ 10 ms bajada | ||
| La pantalla mostró tiempos de respuesta relativamente lentos en nuestros tests pero podría ser demasiado lenta para los jugones. En comparación, todos los dispositivos de prueba van de ##min### (mínimo) a 636 (máximo) ms. » 30 % de todos los dispositivos son mejores. Esto quiere decir que el tiempo de respuesta medido es mejor que la media (33.7 ms) de todos los dispositivos testados. | ||
| Asus Zenbook UX305UA-FC040T IPS, 1920x1080 | Asus Zenbook UX305LA-FC012H IPS, 1920x1080 | Asus Zenbook UX305CA-EHM1 IPS, 1920x1080 | Dell XPS 13 2016 i7 256GB QHD IGZO , 3200x1800 | Lenovo Yoga 900-13ISK 80MK IPS, 3200x1800 | Apple MacBook Air 13 inch 2015-03 TN LED, 1440x900 | Lenovo U31-70 80M5003EGE IPS, 1920x1080 | Acer Aspire V3-372-50LK IPS, 1920x1080 | |
|---|---|---|---|---|---|---|---|---|
| Display | -2% | -2% | -1% | -3% | -37% | -39% | -39% | |
| Display P3 Coverage | 65.1 | 63.9 -2% | 64.5 -1% | 63.6 -2% | 63.2 -3% | 40.1 -38% | 38.85 -40% | 39.05 -40% |
| sRGB Coverage | 92.8 | 91.6 -1% | 90.4 -3% | 93.6 1% | 88.7 -4% | 59.8 -36% | 58.3 -37% | 58.7 -37% |
| AdobeRGB 1998 Coverage | 66.3 | 65 -2% | 65.5 -1% | 65.5 -1% | 64.9 -2% | 41.51 -37% | 40.17 -39% | 40.35 -39% |
| Response Times | 88% | 3211% | 832% | -62% | -35% | |||
| Response Time Grey 50% / Grey 80% * | 25 ? | 37.6 ? -50% | 40 ? -60% | 38.8 ? -55% | 54 ? -116% | 46 ? -84% | ||
| Response Time Black / White * | 28 ? | 24.8 ? 11% | 30 ? -7% | 22.4 ? 20% | 30 ? -7% | 24 ? 14% | ||
| PWM Frequency | 50 ? | 201.6 ? 303% | 4900 ? 9700% | 1316 2532% | ||||
| Screen | 15% | 6% | 17% | -8% | 2% | -2% | -10% | |
| Brightness middle | 358 | 349 -3% | 324.3 -9% | 285 -20% | 319.8 -11% | 329 -8% | 293 -18% | 250 -30% |
| Brightness | 351 | 338 -4% | 314 -11% | 281 -20% | 302 -14% | 310 -12% | 289 -18% | 247 -30% |
| Brightness Distribution | 86 | 87 1% | 93 8% | 90 5% | 88 2% | 82 -5% | 93 8% | 87 1% |
| Black Level * | 0.4 | 0.25 37% | 0.289 28% | 0.18 55% | 0.835 -109% | 0.405 -1% | 0.36 10% | 0.43 -8% |
| Contrast | 895 | 1396 56% | 1122 25% | 1583 77% | 383 -57% | 812 -9% | 814 -9% | 581 -35% |
| Colorchecker dE 2000 * | 5.96 | 5.49 8% | 6.03 -1% | 4.89 18% | 2.68 55% | 3.96 34% | 4.94 17% | 4.51 24% |
| Colorchecker dE 2000 max. * | 10.99 | 7.51 32% | 9.98 9% | |||||
| Greyscale dE 2000 * | 8.93 | 5.43 39% | 7.89 12% | 5.16 42% | 2.35 74% | 3.51 61% | 4.11 54% | 3.18 64% |
| Gamma | 2.28 96% | 2.17 101% | 2.08 106% | 2.15 102% | 2.09 105% | 3.83 57% | 2.48 89% | 2.43 91% |
| CCT | 6548 99% | 7055 92% | 6490 100% | 7106 91% | 6975 93% | 6711 97% | 7508 87% | 6743 96% |
| Color Space (Percent of AdobeRGB 1998) | 60 | 60 0% | 65.46 9% | 59 -2% | 57 -5% | 38.4 -36% | 37 -38% | 37 -38% |
| Color Space (Percent of sRGB) | 93 | 92 -1% | 90.36 -3% | 93 0% | 88 -5% | 59.8 -36% | 58 -38% | 58 -38% |
| Media total (Programa/Opciones) | 7% /
11% | 31% /
21% | 1076% /
652% | 274% /
161% | -18% /
-7% | -34% /
-17% | -28% /
-20% |
* ... más pequeño es mejor
| Geekbench 3 | |
| 32 Bit Single-Core Score | |
| Asus Zenbook UX305UA-FC040T | |
| Apple MacBook Air 13 inch 2015-03 | |
| Asus Zenbook UX305LA-FC012H | |
| Lenovo U31-70 80M5003EGE | |
| 32 Bit Multi-Core Score | |
| Asus Zenbook UX305UA-FC040T | |
| Apple MacBook Air 13 inch 2015-03 | |
| Asus Zenbook UX305LA-FC012H | |
| Lenovo U31-70 80M5003EGE | |
| Sunspider - 1.0 Total Score | |
| Asus Zenbook UX305CA-EHM1 | |
| Lenovo U31-70 80M5003EGE | |
| Asus Zenbook UX305LA-FC012H | |
| Acer Aspire V3-372-50LK | |
| Dell XPS 13 2016 i7 256GB QHD | |
| Asus Zenbook UX305UA-FC040T | |
| JetStream 1.1 - Total Score | |
| Asus Zenbook UX305UA-FC040T | |
| Lenovo U31-70 80M5003EGE | |
| Mozilla Kraken 1.1 - Total | |
| Asus Zenbook UX305LA-FC012H | |
| Lenovo U31-70 80M5003EGE | |
| Acer Aspire V3-372-50LK | |
| Dell XPS 13 2016 i7 256GB QHD | |
| Asus Zenbook UX305UA-FC040T | |
| Octane V2 - Total Score | |
| Asus Zenbook UX305UA-FC040T | |
| Dell XPS 13 2016 i7 256GB QHD | |
| Acer Aspire V3-372-50LK | |
| Asus Zenbook UX305LA-FC012H | |
| Lenovo U31-70 80M5003EGE | |
| Peacekeeper - --- | |
| Asus Zenbook UX305UA-FC040T | |
| Lenovo U31-70 80M5003EGE | |
| Asus Zenbook UX305LA-FC012H | |
* ... más pequeño es mejor
| PCMark 7 Score | 5389 puntos | |
| PCMark 8 Home Score Accelerated v2 | 3341 puntos | |
| PCMark 8 Creative Score Accelerated v2 | 3937 puntos | |
| PCMark 8 Work Score Accelerated v2 | 4225 puntos | |
ayuda | ||

| 3DMark 11 Performance | 1525 puntos | |
| 3DMark Ice Storm Standard Score | 56569 puntos | |
| 3DMark Cloud Gate Standard Score | 5734 puntos | |
| 3DMark Fire Strike Score | 826 puntos | |
ayuda | ||
| 3DMark 06 - 1280x1024 Standard Score AA:0x AF:0x | |
| Apple MacBook Air 13 inch 2015-03 | |
| Lenovo U31-70 80M5003EGE | |
| Asus Zenbook UX305LA-FC012H | |
| bajo | medio | alto | ultra | |
| Tomb Raider (2013) | 67.9 | 33.3 | 21.7 | 10.1 |
| BioShock Infinite (2013) | 46.8 | 25.7 | 21.5 | 6.4 |
| Dirt Rally (2015) | 116.6 | 26.6 | 12.5 | 12.5 |
| XCOM 2 (2016) | 16.3 | 5.2 | 2.9 |
| Tomb Raider - 1366x768 Normal Preset AA:FX AF:4x | |
| Lenovo U31-70 80M5003EGE | |
| Dell XPS 13 2016 i7 256GB QHD | |
| Apple MacBook Air 13 inch 2015-03 | |
| Asus Zenbook UX305UA-FC040T | |
| Asus Zenbook UX305LA-FC012H | |
Ruido
| Ocioso |
| 31.3 / 31.3 / 32.2 dB(A) |
| Carga |
| 37.6 / 38 dB(A) |
 | ||
30 dB silencioso 40 dB(A) audible 50 dB(A) ruidosamente alto |
||
min: | ||
| Asus Zenbook UX305UA-FC040T 6500U, HD Graphics 520 | Asus Zenbook UX305LA-FC012H 5500U, HD Graphics 5500 | Dell XPS 13 2016 i7 256GB QHD 6500U, HD Graphics 520 | Lenovo Yoga 900-13ISK 80MK 6500U, HD Graphics 520 | Apple MacBook Air 13 inch 2015-03 5650U, HD Graphics 6000 | Lenovo U31-70 80M5003EGE 5500U, GeForce 920M | Acer Aspire V3-372-50LK 6200U, HD Graphics 520 | |
|---|---|---|---|---|---|---|---|
| Noise | 4% | 1% | 6% | -1% | -7% | 6% | |
| off / environment * | 31.3 | ||||||
| Idle Minimum * | 31.3 | 29.6 5% | 31.8 -2% | 29.7 5% | 29.2 7% | 31.9 -2% | 31.5 -1% |
| Idle Average * | 31.3 | 29.6 5% | 31.8 -2% | 29.8 5% | 29.2 7% | 32.3 -3% | 31.5 -1% |
| Idle Maximum * | 32.2 | 29.6 8% | 34.8 -8% | 30 7% | 29.2 9% | 32.3 -0% | 31.5 2% |
| Load Average * | 37.6 | 39.3 -5% | 34.8 7% | 32 15% | 40.2 -7% | 40.8 -9% | 32.4 14% |
| Load Maximum * | 38 | 36 5% | 34.8 8% | 38.5 -1% | 46.3 -22% | 46.6 -23% | 32.3 15% |
* ... más pequeño es mejor
(±) The maximum temperature on the upper side is 40.8 °C / 105 F, compared to the average of 35.9 °C / 97 F, ranging from 21.4 to 59 °C for the class Subnotebook.
(+) The bottom heats up to a maximum of 37 °C / 99 F, compared to the average of 39.4 °C / 103 F
(+) In idle usage, the average temperature for the upper side is 24.1 °C / 75 F, compared to the device average of 30.7 °C / 87 F.
(+) The palmrests and touchpad are cooler than skin temperature with a maximum of 27.6 °C / 81.7 F and are therefore cool to the touch.
(±) The average temperature of the palmrest area of similar devices was 28.3 °C / 82.9 F (+0.7 °C / 1.2 F).
| Asus Zenbook UX305UA-FC040T 6500U, HD Graphics 520 | Asus Zenbook UX305LA-FC012H 5500U, HD Graphics 5500 | Asus Zenbook UX305CA-EHM1 6Y30, HD Graphics 515 | Dell XPS 13 2016 i7 256GB QHD 6500U, HD Graphics 520 | Lenovo Yoga 900-13ISK 80MK 6500U, HD Graphics 520 | Apple MacBook Air 13 inch 2015-03 5650U, HD Graphics 6000 | Lenovo U31-70 80M5003EGE 5500U, GeForce 920M | Acer Aspire V3-372-50LK 6200U, HD Graphics 520 | |
|---|---|---|---|---|---|---|---|---|
| Heat | -9% | 9% | -41% | 0% | -13% | -16% | -27% | |
| Maximum Upper Side * | 40.8 | 45.9 -13% | 34.6 15% | 57 -40% | 37.4 8% | 43.8 -7% | 40.8 -0% | 49.3 -21% |
| Maximum Bottom * | 37 | 45 -22% | 35.2 5% | 56 -51% | 36.4 2% | 42.1 -14% | 43.8 -18% | 53.3 -44% |
| Idle Upper Side * | 25.2 | 25.6 -2% | 22.6 10% | 34.1 -35% | 26.6 -6% | 28.5 -13% | 29.8 -18% | 28.2 -12% |
| Idle Bottom * | 24.9 | 25 -0% | 23.4 6% | 34.3 -38% | 25.6 -3% | 28.9 -16% | 31.5 -27% | 32.6 -31% |
* ... más pequeño es mejor
| Off / Standby | |
| Ocioso | |
| Carga |
|
| Asus Zenbook UX305UA-FC040T 6500U, HD Graphics 520 | Asus Zenbook UX305LA-FC012H 5500U, HD Graphics 5500 | Dell XPS 13 2016 i7 256GB QHD 6500U, HD Graphics 520 | Apple MacBook Air 13 inch 2015-03 5650U, HD Graphics 6000 | Lenovo U31-70 80M5003EGE 5500U, GeForce 920M | Acer Aspire V3-372-50LK 6200U, HD Graphics 520 | |
|---|---|---|---|---|---|---|
| Power Consumption | 8% | -46% | 3% | -25% | -7% | |
| Idle Minimum * | 3.2 | 2.6 19% | 6.8 -113% | 2.7 16% | 3.9 -22% | 3.8 -19% |
| Idle Average * | 6.5 | 6.2 5% | 10 -54% | 5.7 12% | 6.8 -5% | 5.8 11% |
| Idle Maximum * | 6.7 | 6.5 3% | 10.5 -57% | 6 10% | 7 -4% | 8.1 -21% |
| Load Average * | 30.6 | 30.8 -1% | 30.2 1% | 32.1 -5% | 40 -31% | 30.2 1% |
| Load Maximum * | 31 | 27 13% | 33.6 -8% | 36.2 -17% | 51 -65% | 32.4 -5% |
* ... más pequeño es mejor
| Asus Zenbook UX305UA-FC040T 56 Wh | Asus Zenbook UX305LA-FC012H 56 Wh | Asus Zenbook UX305CA-EHM1 45 Wh | Dell XPS 13 2016 i7 256GB QHD 56 Wh | Lenovo Yoga 900-13ISK 80MK 66 Wh | Apple MacBook Air 13 inch 2015-03 54 Wh | Lenovo U31-70 80M5003EGE 35 Wh | Acer Aspire V3-372-50LK 51 Wh | |
|---|---|---|---|---|---|---|---|---|
| Duración de Batería | 1% | 8% | -27% | -20% | 1% | -52% | -20% | |
| Reader / Idle | 1427 | 1469 3% | 1052 -26% | 784 -45% | 844 -41% | 1572 10% | 525 -63% | 906 -37% |
| H.264 | 545 | 582 7% | 273 -50% | |||||
| WiFi v1.3 | 561 | 569 1% | 382 -32% | 432 -23% | 403 -28% | 620 11% | 253 -55% | 349 -38% |
| Load | 118 | 108 -8% | 215 82% | 103 -13% | 128 8% | 97 -18% | 70 -41% | 135 14% |
Pro
Contra
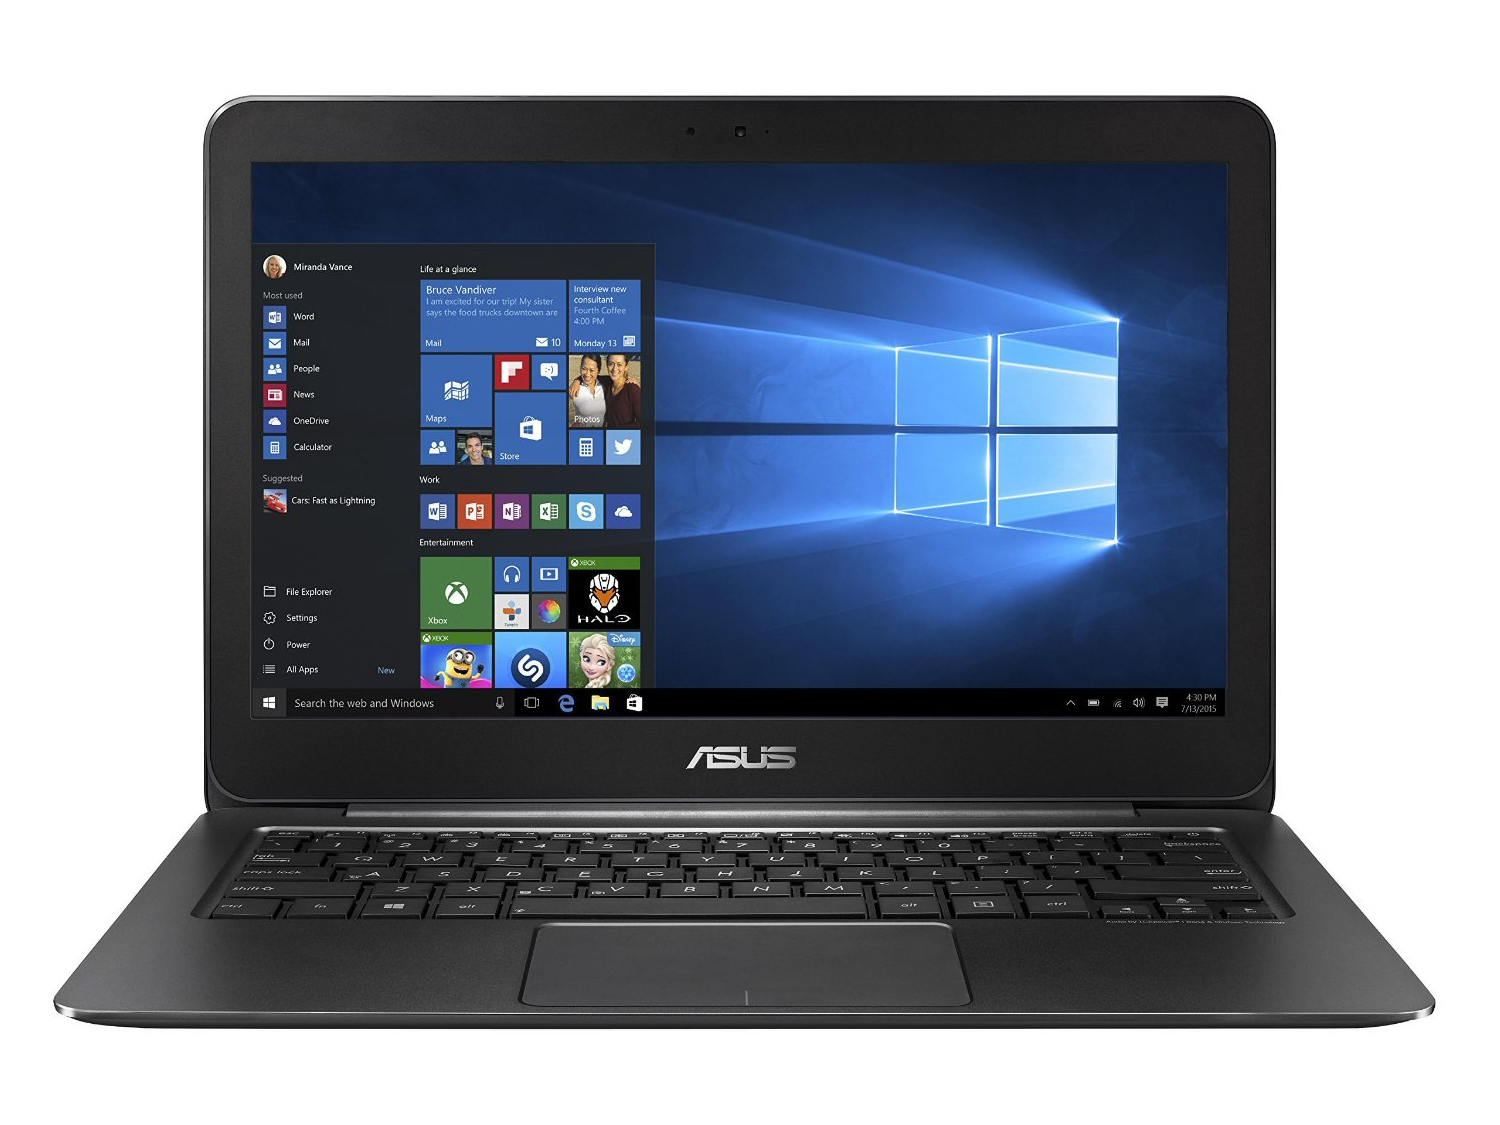
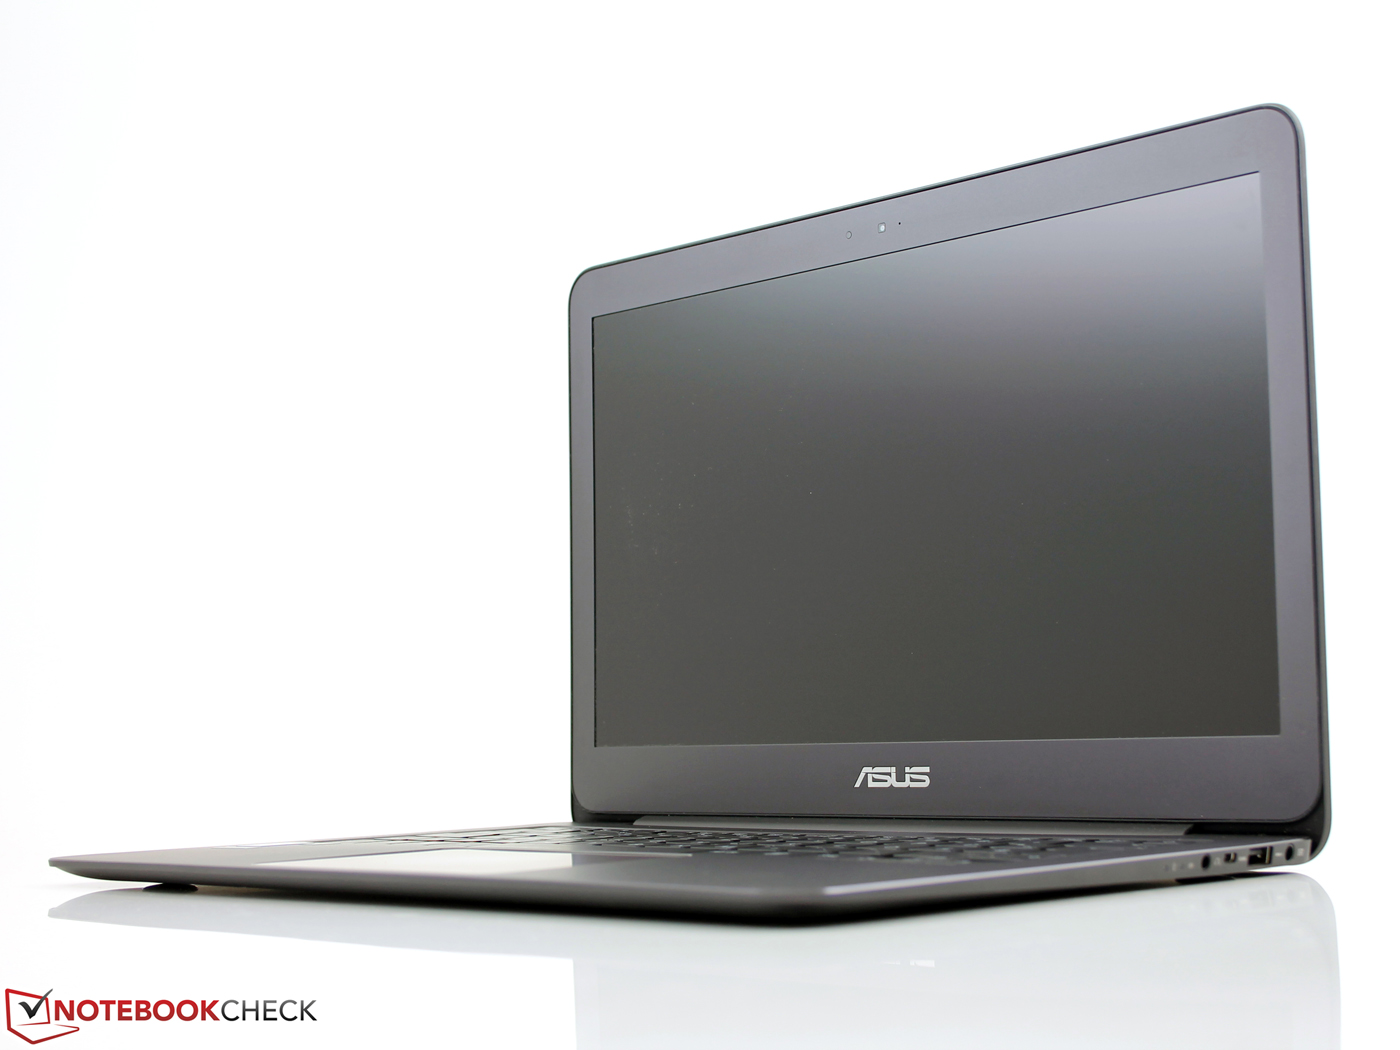
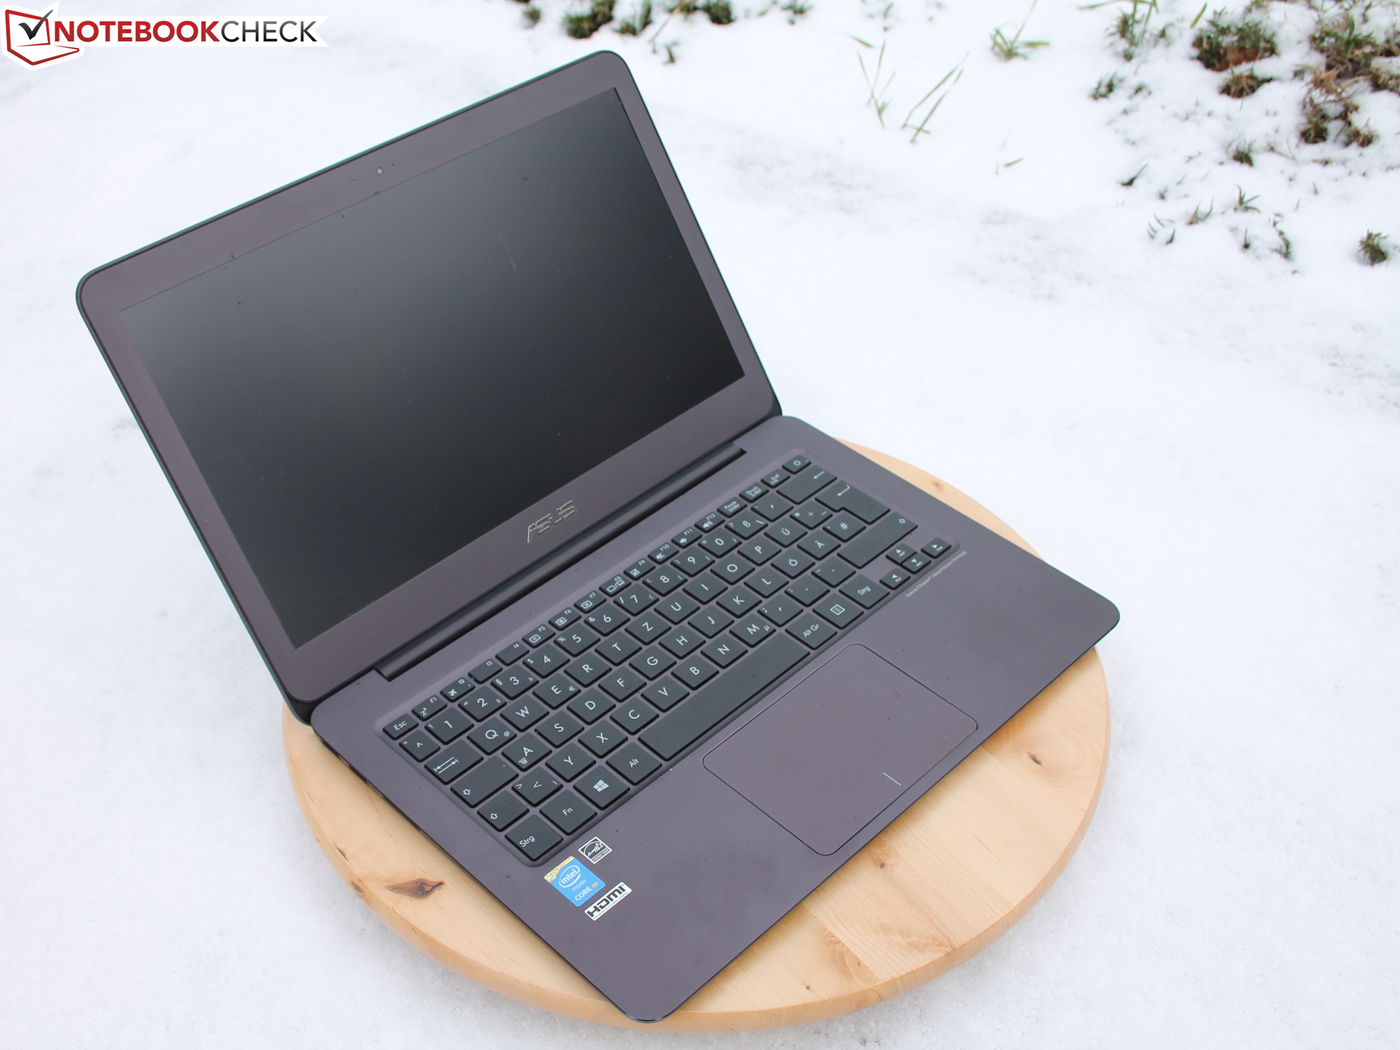
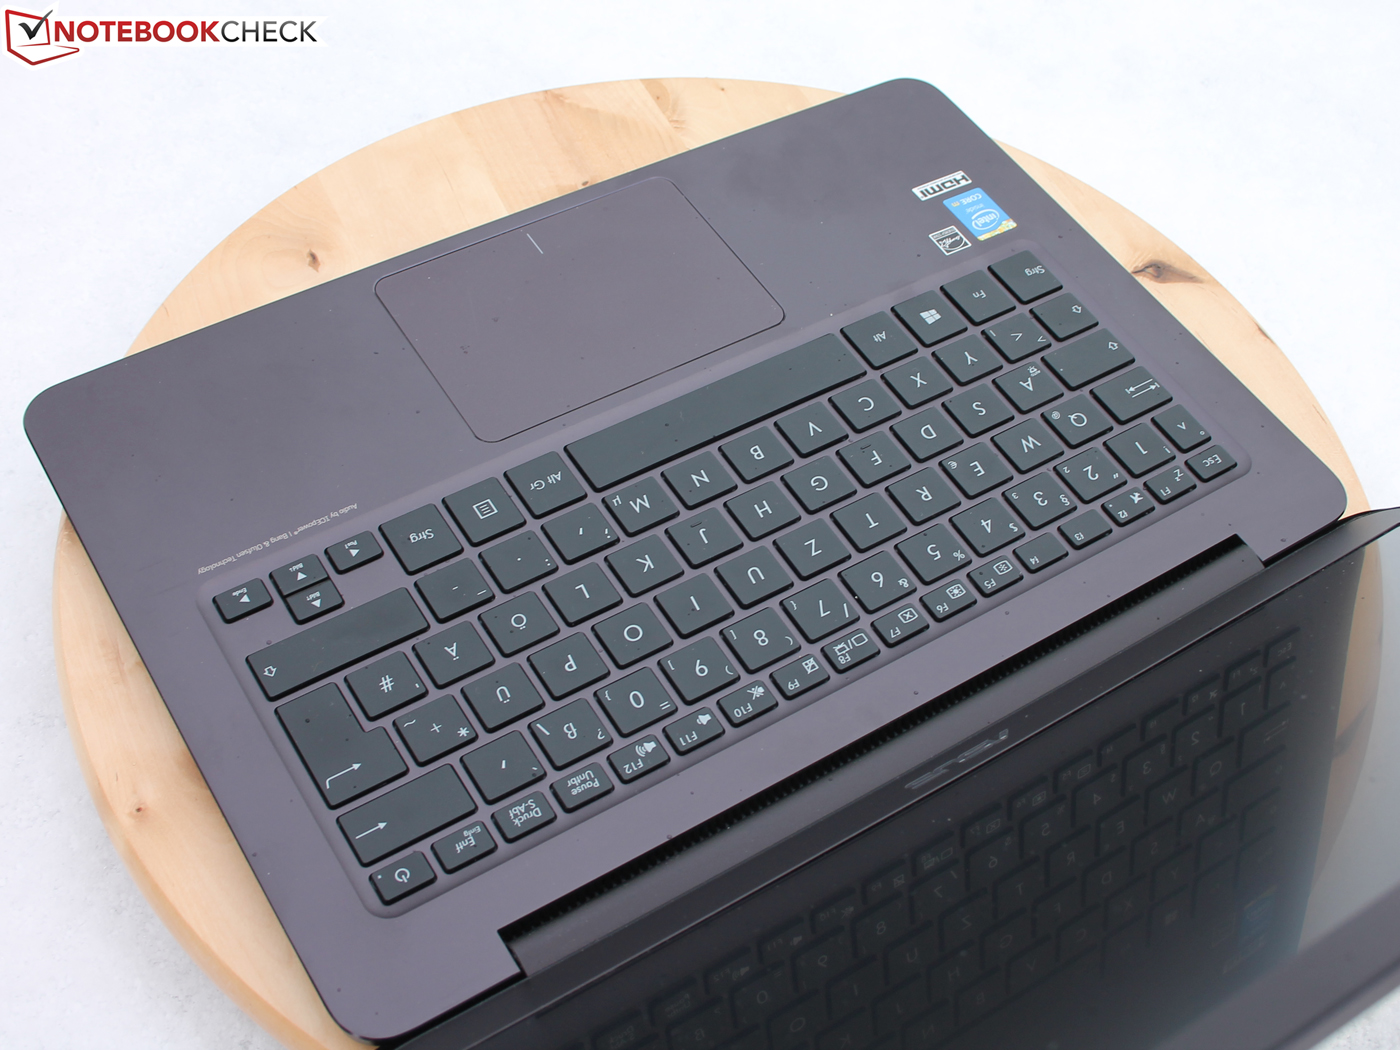
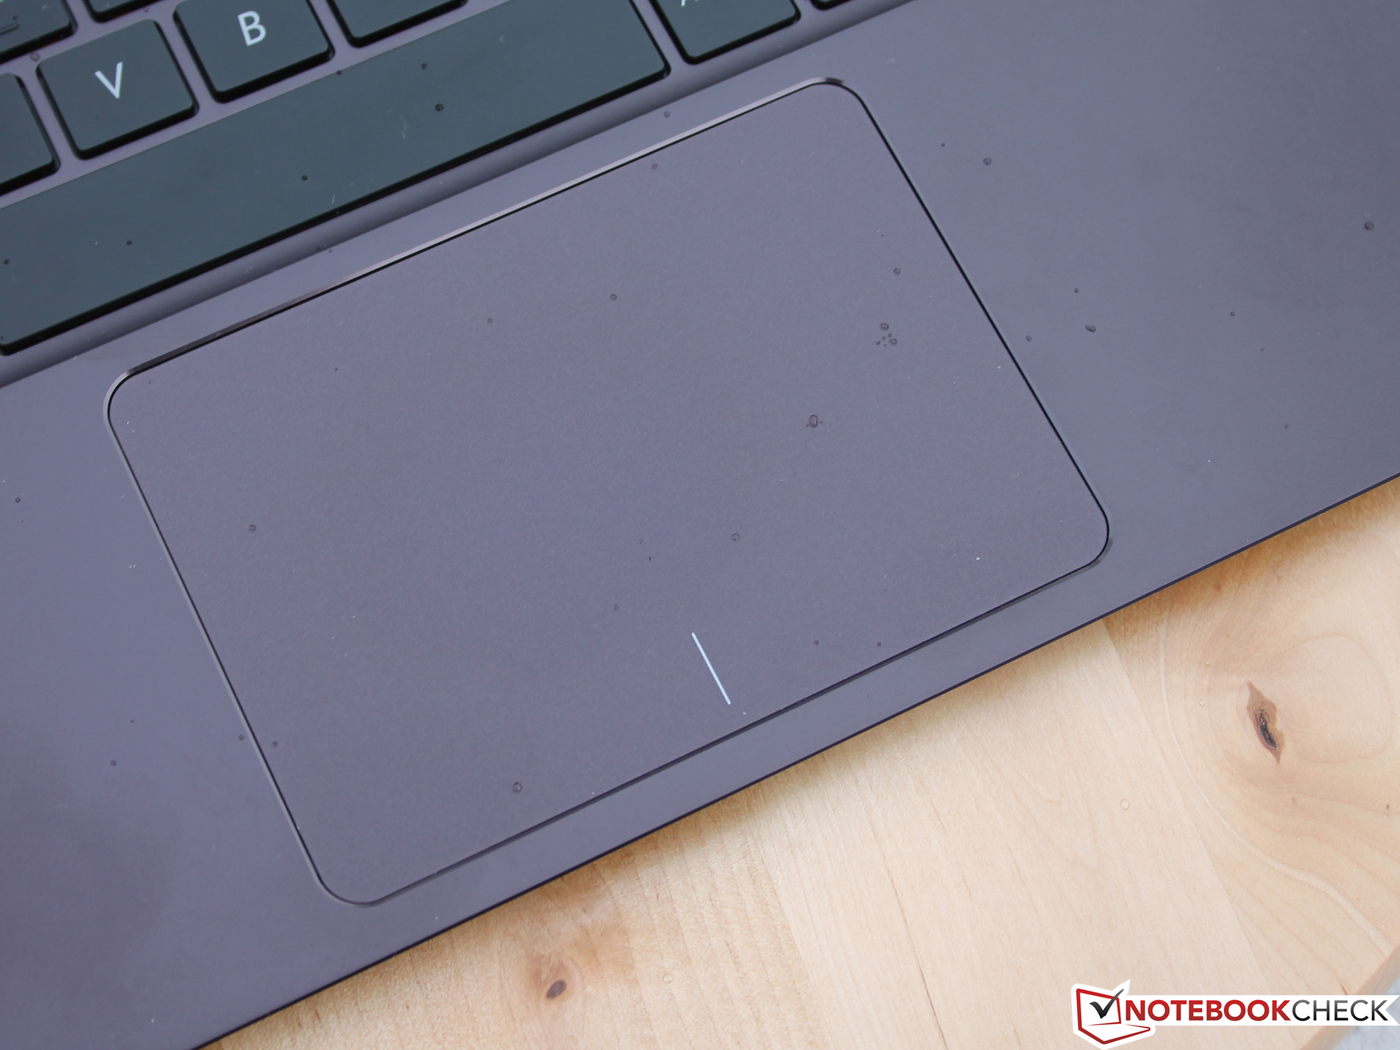
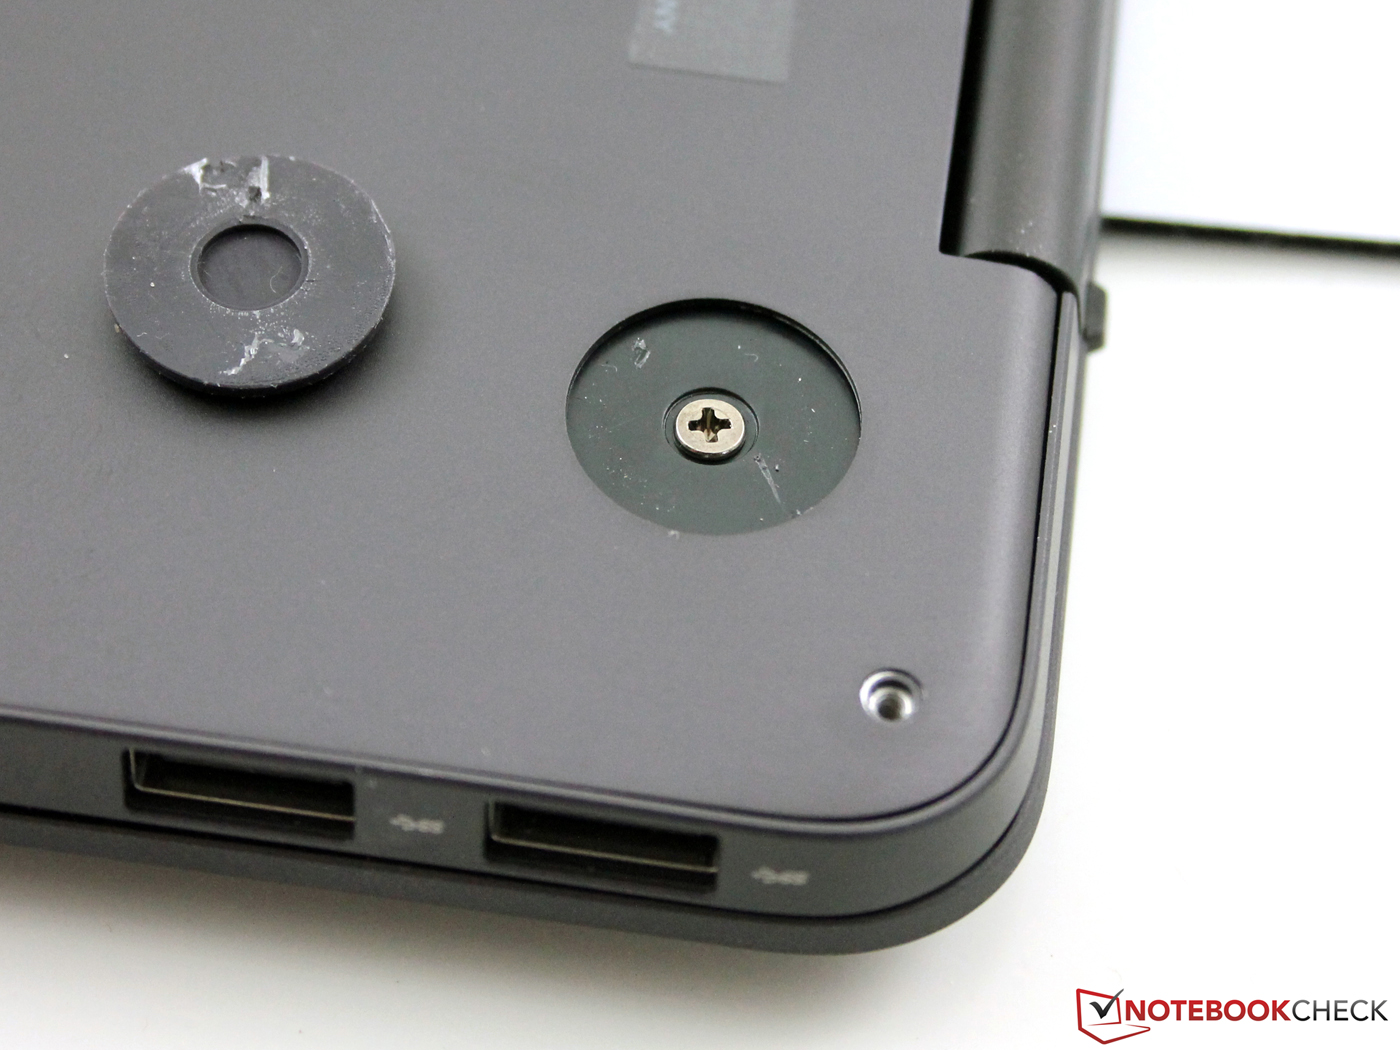
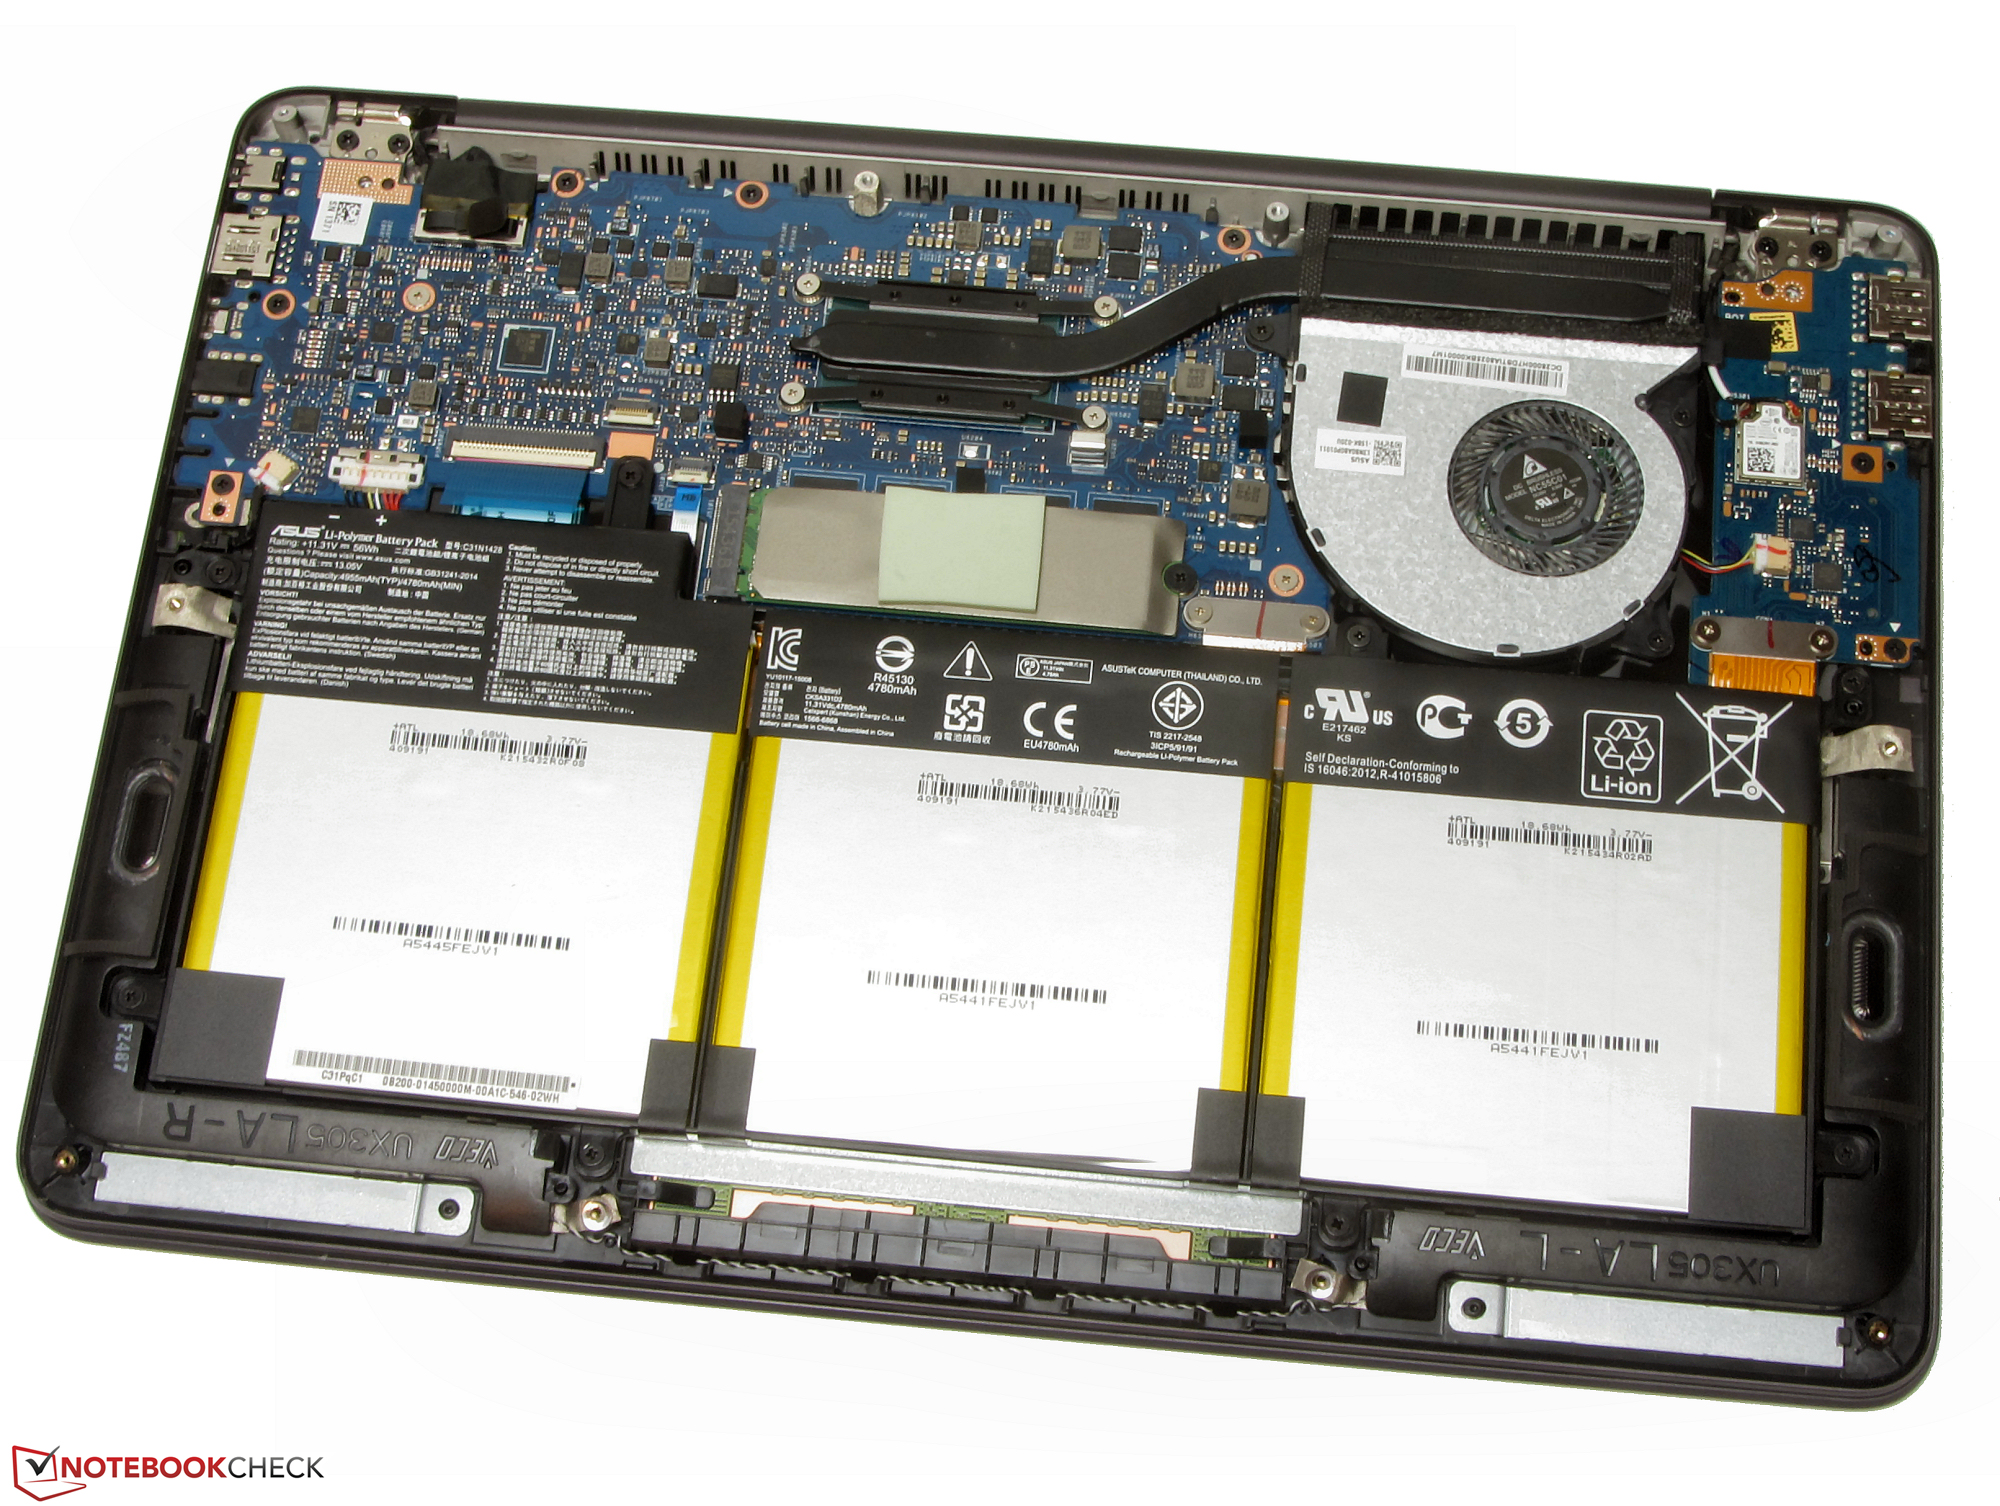
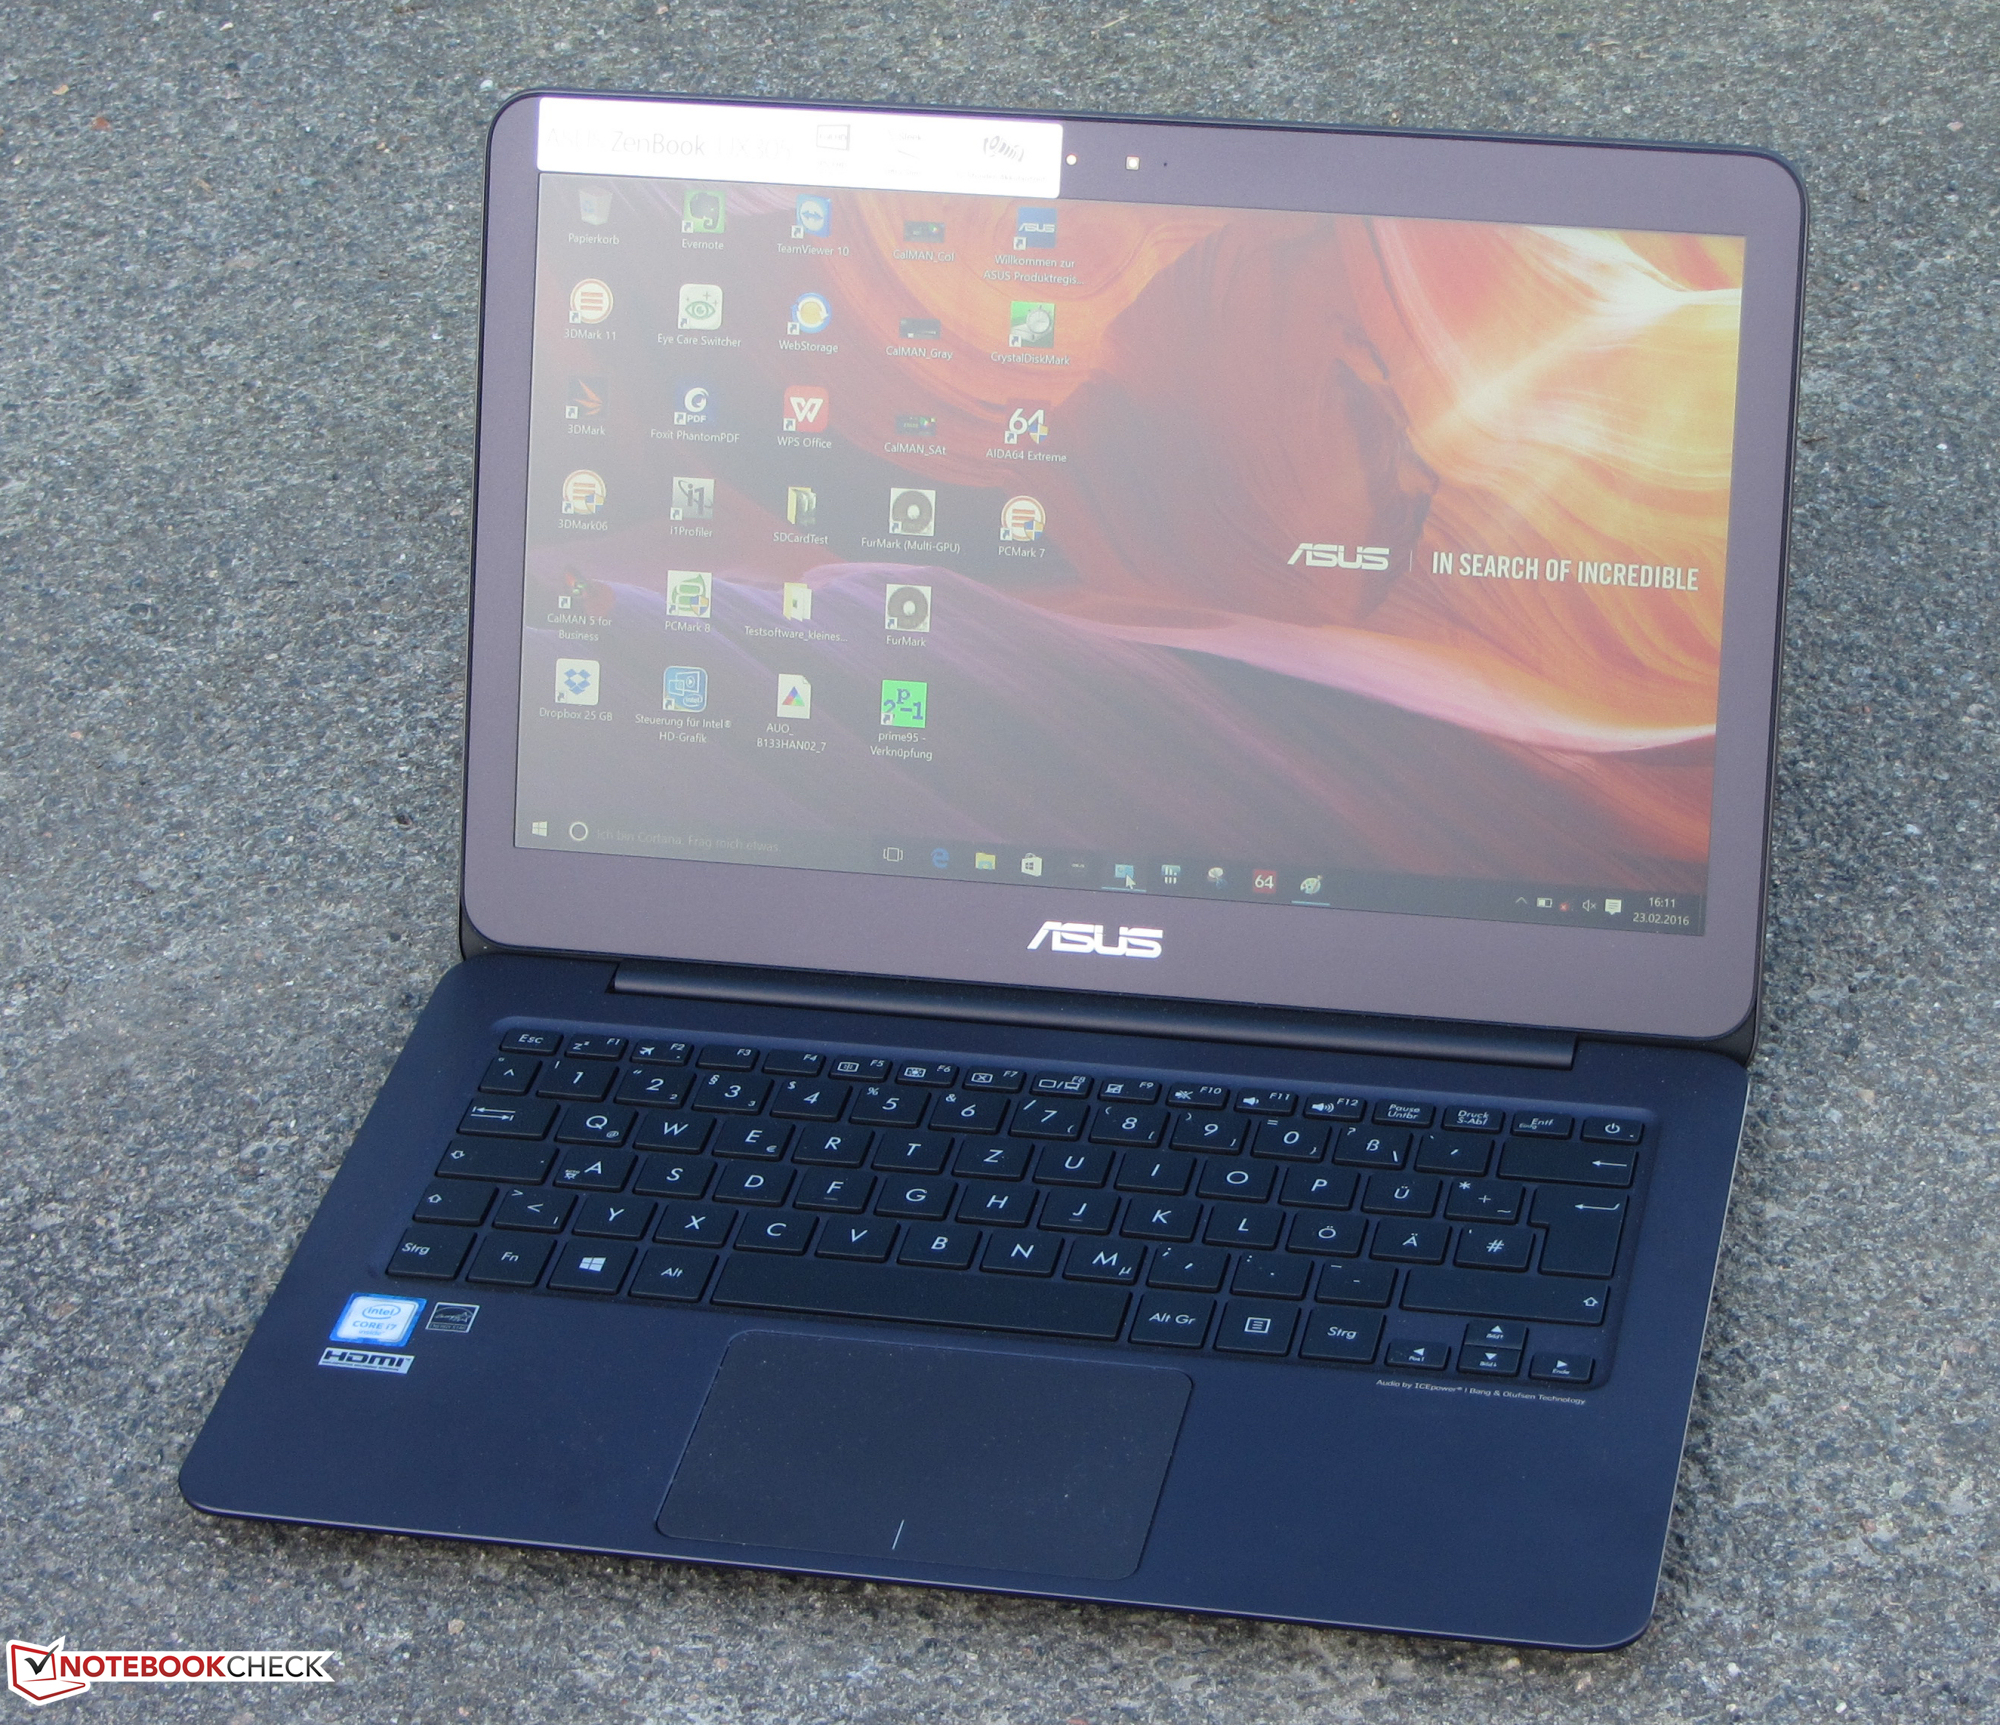
El Asus Zenbook UX305UA ofrece un alto rendimiento CPU y capacidades de juego, al menos limitadas. No obstante, el ordenador suele ir en silencio y apenas se calienta. Un veloz SSD da rapidez al sistema. Al ordenador no le falta espacio de almacenamiento. El SSD tiene 512 GB. De ser preciso, se podría cambiar el SSD. Si bien el Zenbook no tiene escotilla de mantenimiento, se puede quitar la parte inferior. Además, nso gustó el display IPS de ángulo de visión estable. Ofrece un brillo elevado y buen contraste. El teclado integrado siguió tan bueno como antes. Es adecuado para escritores prolíficos. Sin embargo, no terminamos de entender por qué Asus no lo equipa esta vez con retroiluminación. Eso haría el paquete más equilibrado.
En resumen: El Zenbook Skylake ofrece un rendimiento superior sin impacto negativo en la duración de la batería.
Asus adopta dos enfoques en su serie Zenbook UX305. Los modelos Core i dan más rendimiento CPU y ayor aguante de batería. Los modelos Core M no pueden igualar estos aspectos. A cambio, funcionan en silencio y son más baratsos. Depende del usuario decidir qué propiedades son más importantes. En los días venideros, Notebookcheck.com publicará un análisis del nuevo Zenbook UX305 con procesador Skylake Core M7.
Ésta es una versión acortada del análisis original. Puedes leer el análisis completo en inglés aquí.
Asus Zenbook UX305UA-FC040T
-
02/26/2016 v5(old)
Sascha Mölck