 Deutsch
 English
 Español
 Français
 Italiano
 Nederlands
 Polski
 Português
 Русский
 Türkçe
 Svenska
 Chinese
 Magyar
Breve análisis del subportátil Toshiba Portégé A30-D (7100U, 128 GB)


| SD Card Reader | |
| average JPG Copy Test (av. of 3 runs) | |
| Dell XPS 13 9360 FHD i5 (Toshiba Exceria Pro SDXC 64 GB UHS-II) | |
| Toshiba Portege A30-D-139 (Toshiba Exceria Pro SDXC 64 GB UHS-II) | |
| Asus Zenbook UX3410UQ-GV077T (Toshiba Exceria Pro SDXC 64 GB UHS-II) | |
| maximum AS SSD Seq Read Test (1GB) | |
| Dell XPS 13 9360 FHD i5 (Toshiba Exceria Pro SDXC 64 GB UHS-II) | |
| Toshiba Portege A30-D-139 (Toshiba Exceria Pro SDXC 64 GB UHS-II) | |
| Asus Zenbook UX3410UQ-GV077T (Toshiba Exceria Pro SDXC 64 GB UHS-II) | |
| Networking | |
| iperf3 transmit AX12 | |
| Toshiba Portege A30-D-139 | |
| Huawei MateBook X | |
| Dell XPS 13 9360 FHD i5 | |
| Asus Zenbook UX3410UQ-GV077T | |
| iperf3 receive AX12 | |
| Asus Zenbook UX3410UQ-GV077T | |
| Toshiba Portege A30-D-139 | |
| Dell XPS 13 9360 FHD i5 | |
| Huawei MateBook X | |
| |||||||||||||||||||||||||
iluminación: 88 %
Brillo con batería: 310 cd/m²
Contraste: 1139:1 (Negro: 0.28 cd/m²)
ΔE Color 4.04 | 0.5-29.43 Ø5
ΔE Greyscale 5.5 | 0.57-98 Ø5.3
98% sRGB (Argyll 1.6.3 3D)
64% AdobeRGB 1998 (Argyll 1.6.3 3D)
70% AdobeRGB 1998 (Argyll 2.2.0 3D)
98.1% sRGB (Argyll 2.2.0 3D)
68% Display P3 (Argyll 2.2.0 3D)
Gamma: 2.4
| Toshiba Portege A30-D-139 Toshiba TOS508F, , 1920x1080, 13.30 | Huawei MateBook X Chi Mei CMN8201 / P130ZDZ-EF1, , 2160x1440, 13.30 | Asus Zenbook UX3410UQ-GV077T Chi Mei N140HCE-EN1, , 1920x1080, 14.00 | Dell XPS 13 9360 FHD i5 Sharp SHP1449 LQ133M1, , 1920x1080, 13.30 | |
|---|---|---|---|---|
| Display | -3% | -0% | -27% | |
| Display P3 Coverage | 68 | 65.8 -3% | 67.2 -1% | 48.94 -28% |
| sRGB Coverage | 98.1 | 96.2 -2% | 99.2 1% | 73.3 -25% |
| AdobeRGB 1998 Coverage | 70 | 66.8 -5% | 69.3 -1% | 50.5 -28% |
| Response Times | 19% | -26% | 4% | |
| Response Time Grey 50% / Grey 80% * | 40 ? | 33 ? 17% | 44 ? -10% | 32.8 ? 18% |
| Response Time Black / White * | 30 ? | 24 ? 20% | 29 ? 3% | 33.2 ? -11% |
| PWM Frequency | 208 ? | 60 ? -71% | ||
| Screen | 17% | 10% | -5% | |
| Brightness middle | 319 | 408 28% | 381 19% | 351.2 10% |
| Brightness | 296 | 395 33% | 368 24% | 325 10% |
| Brightness Distribution | 88 | 88 0% | 84 -5% | 89 1% |
| Black Level * | 0.28 | 0.45 -61% | 0.3 -7% | 0.195 30% |
| Contrast | 1139 | 907 -20% | 1270 12% | 1801 58% |
| Colorchecker dE 2000 * | 4.04 | 1.55 62% | 2.84 30% | 7.4 -83% |
| Colorchecker dE 2000 max. * | 8.09 | 2.19 73% | 6.5 20% | 9.08 -12% |
| Greyscale dE 2000 * | 5.5 | 1.91 65% | 4.02 27% | 6.71 -22% |
| Gamma | 2.4 92% | 2.34 94% | 2.42 91% | 2.74 80% |
| CCT | 7198 90% | 6491 100% | 7430 87% | 7222 90% |
| Color Space (Percent of AdobeRGB 1998) | 64 | 61 -5% | 56 -12% | 50.48 -21% |
| Color Space (Percent of sRGB) | 98 | 96 -2% | 86 -12% | 73.31 -25% |
| Media total (Programa/Opciones) | 11% /
13% | -5% /
1% | -9% /
-9% |
* ... más pequeño es mejor
Tiempos de respuesta del display
| ↔ Tiempo de respuesta de Negro a Blanco | ||
|---|---|---|
| 30 ms ... subida ↗ y bajada ↘ combinada | ↗ 16 ms subida | 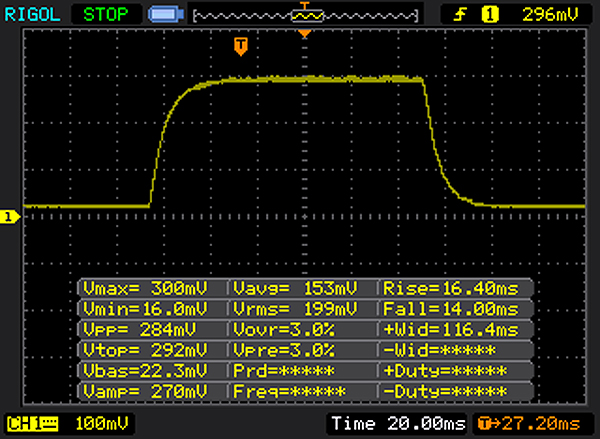 |
| ↘ 14 ms bajada | ||
| La pantalla mostró tiempos de respuesta lentos en nuestros tests y podría ser demasiado lenta para los jugones. En comparación, todos los dispositivos de prueba van de ##min### (mínimo) a 240 (máximo) ms. » 77 % de todos los dispositivos son mejores. Eso quiere decir que el tiempo de respuesta es peor que la media (21.5 ms) de todos los dispositivos testados. | ||
| ↔ Tiempo de respuesta 50% Gris a 80% Gris | ||
| 40 ms ... subida ↗ y bajada ↘ combinada | ↗ 20 ms subida | 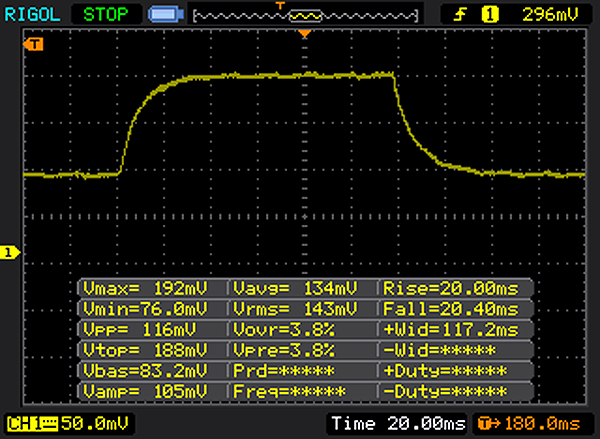 |
| ↘ 20 ms bajada | ||
| La pantalla mostró tiempos de respuesta lentos en nuestros tests y podría ser demasiado lenta para los jugones. En comparación, todos los dispositivos de prueba van de ##min### (mínimo) a 636 (máximo) ms. » 56 % de todos los dispositivos son mejores. Eso quiere decir que el tiempo de respuesta es peor que la media (33.8 ms) de todos los dispositivos testados. | ||
Parpadeo de Pantalla / PWM (Pulse-Width Modulation)
| Parpadeo de Pantalla / PWM detectado | 208 Hz | ≤ 10 % de brillo | 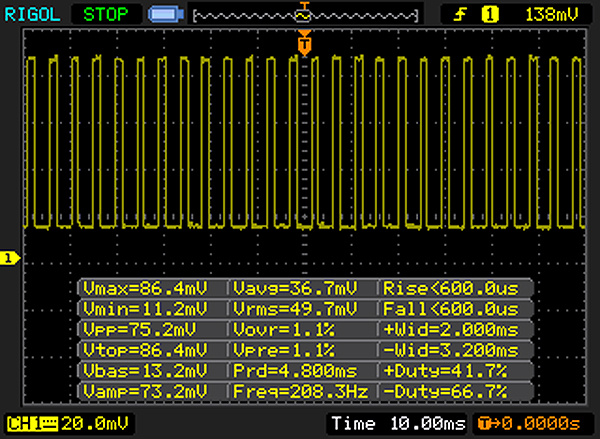 |
La retroiluminación del display parpadea a 208 Hz (seguramente usa PWM - Pulse-Width Modulation) a un brillo del 10 % e inferior. Sobre este nivel de brillo no debería darse parpadeo / PWM. La frecuencia de 208 Hz es relativamente baja, por lo que la gente sensible debería ver parpadeos y padecer fatiga visual por la pantalla (usado al brillo indicado a continuación). Comparación: 53 % de todos los dispositivos testados no usaron PWM para atenuar el display. Si se usó, medimos una media de 17942 (mínimo: 5 - máxmo: 3846000) Hz. | |||
| Cinebench R15 | |
| CPU Single 64Bit | |
| Asus Zenbook UX3410UQ-GV077T | |
| Dell XPS 13 9360 FHD i5 | |
| Huawei MateBook X | |
| Toshiba Portege A30-D-139 | |
| CPU Multi 64Bit | |
| Asus Zenbook UX3410UQ-GV077T | |
| Huawei MateBook X | |
| Dell XPS 13 9360 FHD i5 | |
| Toshiba Portege A30-D-139 | |
| PCMark 8 | |
| Home Score Accelerated v2 | |
| Asus Zenbook UX3410UQ-GV077T | |
| Dell XPS 13 9360 FHD i5 | |
| Huawei MateBook X | |
| Toshiba Portege A30-D-139 | |
| Work Score Accelerated v2 | |
| Dell XPS 13 9360 FHD i5 | |
| Huawei MateBook X | |
| Toshiba Portege A30-D-139 | |
| PCMark 8 Home Score Accelerated v2 | 3247 puntos | |
| PCMark 8 Work Score Accelerated v2 | 4113 puntos | |
ayuda | ||
| Toshiba Portege A30-D-139 Toshiba SG5 THNSNK128GVN8 | Huawei MateBook X LITEON CB1-SD256 | Asus Zenbook UX3410UQ-GV077T SanDisk SD8SNAT256G1002 | Dell XPS 13 9360 FHD i5 Toshiba NVMe THNSN5256GPUK | |
|---|---|---|---|---|
| CrystalDiskMark 3.0 | 84% | 36% | 152% | |
| Read Seq | 471.1 | 741 57% | 497 5% | 1233 162% |
| Write Seq | 138.5 | 461.2 233% | 323.7 134% | 733 429% |
| Read 512 | 413.5 | 504 22% | 289 -30% | 1036 151% |
| Write 512 | 138.7 | 310.3 124% | 288 108% | 439.9 217% |
| Read 4k | 22.95 | 29.48 28% | 22.78 -1% | 29.31 28% |
| Write 4k | 79.4 | 68.1 -14% | 79.5 0% | 116.9 47% |
| Read 4k QD32 | 235 | 498.9 112% | 147 -37% | 479.2 104% |
| Write 4k QD32 | 121.8 | 257.5 111% | 257.2 111% | 218.3 79% |

| 3DMark 11 - 1280x720 Performance GPU | |
| Asus Zenbook UX3410UQ-GV077T | |
| Dell XPS 13 9360 FHD i5 | |
| Huawei MateBook X | |
| Toshiba Portege A30-D-139 | |
| 3DMark | |
| 1280x720 Cloud Gate Standard Graphics | |
| Dell XPS 13 9360 FHD i5 | |
| Huawei MateBook X | |
| Toshiba Portege A30-D-139 | |
| 1920x1080 Fire Strike Graphics | |
| Dell XPS 13 9360 FHD i5 | |
| Huawei MateBook X | |
| Toshiba Portege A30-D-139 | |
| 3DMark 11 Performance | 1478 puntos | |
| 3DMark Cloud Gate Standard Score | 5188 puntos | |
| 3DMark Fire Strike Score | 747 puntos | |
ayuda | ||
| bajo | medio | alto | ultra | |
| The Witcher 3 (2015) | 13.1 | |||
| Rise of the Tomb Raider (2016) | 17.2 | |||
| Farming Simulator 17 (2016) | 44 | 16.9 |
Ruido
| Ocioso |
| 30 / 30 / 30 dB(A) |
| DVD |
| 37 / dB(A) |
| Carga |
| 39.3 / 38.3 dB(A) |
 | ||
30 dB silencioso 40 dB(A) audible 50 dB(A) ruidosamente alto |
||
min: | ||
(+) The maximum temperature on the upper side is 39.2 °C / 103 F, compared to the average of 34.2 °C / 94 F, ranging from 21.2 to 62.5 °C for the class Office.
(+) The bottom heats up to a maximum of 39.5 °C / 103 F, compared to the average of 36.7 °C / 98 F
(+) In idle usage, the average temperature for the upper side is 26.8 °C / 80 F, compared to the device average of 29.5 °C / 85 F.
(+) The palmrests and touchpad are cooler than skin temperature with a maximum of 29.9 °C / 85.8 F and are therefore cool to the touch.
(-) The average temperature of the palmrest area of similar devices was 27.7 °C / 81.9 F (-2.2 °C / -3.9 F).
Toshiba Portege A30-D-139 audio analysis
(±) | speaker loudness is average but good (77 dB)
Bass 100 - 315 Hz
(-) | nearly no bass - on average 15.3% lower than median
(+) | bass is linear (2.5% delta to prev. frequency)
Mids 400 - 2000 Hz
(±) | higher mids - on average 9.7% higher than median
(±) | linearity of mids is average (8.8% delta to prev. frequency)
Highs 2 - 16 kHz
(±) | higher highs - on average 6% higher than median
(±) | linearity of highs is average (7.9% delta to prev. frequency)
Overall 100 - 16.000 Hz
(±) | linearity of overall sound is average (23.9% difference to median)
Compared to same class
» 65% of all tested devices in this class were better, 10% similar, 25% worse
» The best had a delta of 7%, average was 22%, worst was 53%
Compared to all devices tested
» 67% of all tested devices were better, 7% similar, 26% worse
» The best had a delta of 4%, average was 25%, worst was 134%
Huawei MateBook X audio analysis
(-) | not very loud speakers (66 dB)
Bass 100 - 315 Hz
(±) | reduced bass - on average 8.3% lower than median
(±) | linearity of bass is average (7.6% delta to prev. frequency)
Mids 400 - 2000 Hz
(+) | balanced mids - only 3.3% away from median
(+) | mids are linear (6.2% delta to prev. frequency)
Highs 2 - 16 kHz
(+) | balanced highs - only 2.6% away from median
(+) | highs are linear (6.6% delta to prev. frequency)
Overall 100 - 16.000 Hz
(+) | overall sound is linear (14.7% difference to median)
Compared to same class
» 25% of all tested devices in this class were better, 5% similar, 70% worse
» The best had a delta of 5%, average was 19%, worst was 53%
Compared to all devices tested
» 15% of all tested devices were better, 4% similar, 81% worse
» The best had a delta of 4%, average was 25%, worst was 134%
Asus Zenbook UX3410UQ-GV077T audio analysis
(±) | speaker loudness is average but good (73 dB)
Bass 100 - 315 Hz
(±) | reduced bass - on average 12% lower than median
(+) | bass is linear (4.5% delta to prev. frequency)
Mids 400 - 2000 Hz
(±) | higher mids - on average 6.5% higher than median
(+) | mids are linear (6.7% delta to prev. frequency)
Highs 2 - 16 kHz
(+) | balanced highs - only 3.9% away from median
(+) | highs are linear (4.8% delta to prev. frequency)
Overall 100 - 16.000 Hz
(±) | linearity of overall sound is average (17% difference to median)
Compared to same class
» 38% of all tested devices in this class were better, 8% similar, 54% worse
» The best had a delta of 5%, average was 19%, worst was 53%
Compared to all devices tested
» 25% of all tested devices were better, 7% similar, 67% worse
» The best had a delta of 4%, average was 25%, worst was 134%
Dell XPS 13 9360 FHD i5 audio analysis
(-) | not very loud speakers (70.3 dB)
Bass 100 - 315 Hz
(±) | reduced bass - on average 6.9% lower than median
(±) | linearity of bass is average (10.5% delta to prev. frequency)
Mids 400 - 2000 Hz
(+) | balanced mids - only 3.7% away from median
(+) | mids are linear (4% delta to prev. frequency)
Highs 2 - 16 kHz
(+) | balanced highs - only 2% away from median
(±) | linearity of highs is average (10.3% delta to prev. frequency)
Overall 100 - 16.000 Hz
(±) | linearity of overall sound is average (18.3% difference to median)
Compared to same class
» 48% of all tested devices in this class were better, 7% similar, 45% worse
» The best had a delta of 5%, average was 19%, worst was 53%
Compared to all devices tested
» 34% of all tested devices were better, 8% similar, 58% worse
» The best had a delta of 4%, average was 25%, worst was 134%
| Off / Standby | |
| Ocioso | |
| Carga |
|
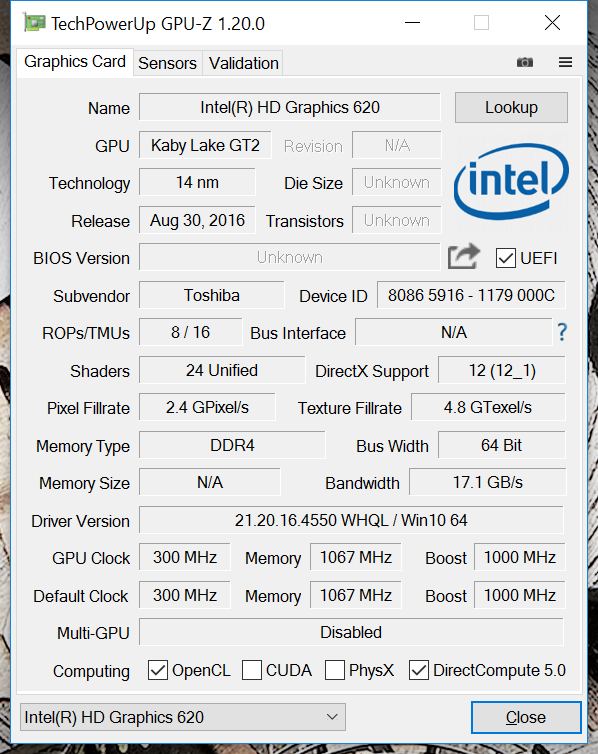
| Toshiba Portege A30-D-139 i3-7100U, HD Graphics 620, Toshiba SG5 THNSNK128GVN8, IPS, 1920x1080, 13.30 | Huawei MateBook X i5-7200U, HD Graphics 620, LITEON CB1-SD256, , 2160x1440, 13.30 | Asus Zenbook UX3410UQ-GV077T i7-7500U, GeForce 940MX, SanDisk SD8SNAT256G1002, IPS, 1920x1080, 14.00 | Dell XPS 13 9360 FHD i5 i5-7200U, HD Graphics 620, Toshiba NVMe THNSN5256GPUK, IPS, 1920x1080, 13.30 | |
|---|---|---|---|---|
| Power Consumption | -42% | -25% | 14% | |
| Idle Minimum * | 3.2 | 4.6 -44% | 3.5 -9% | 4.1 -28% |
| Idle Average * | 6.8 | 11 -62% | 6.6 3% | 4.2 38% |
| Idle Maximum * | 8 | 12 -50% | 7.1 11% | 5.1 36% |
| Load Average * | 30.4 | 39.5 -30% | 30 1% | 22.1 27% |
| Load Maximum * | 28 | 34.6 -24% | 65 -132% | 29.4 -5% |
* ... más pequeño es mejor
| Toshiba Portege A30-D-139 i3-7100U, HD Graphics 620, 45 Wh | Huawei MateBook X i5-7200U, HD Graphics 620, 40 Wh | Asus Zenbook UX3410UQ-GV077T i7-7500U, GeForce 940MX, 48 Wh | Dell XPS 13 9360 FHD i5 i5-7200U, HD Graphics 620, 60 Wh | |
|---|---|---|---|---|
| Duración de Batería | -30% | -7% | 16% | |
| Reader / Idle | 1008 | 512 -49% | 1295 28% | |
| WiFi v1.3 | 548 | 337 -39% | 511 -7% | 677 24% |
| Load | 165 | 162 -2% | 157 -5% |
Pro
Contra
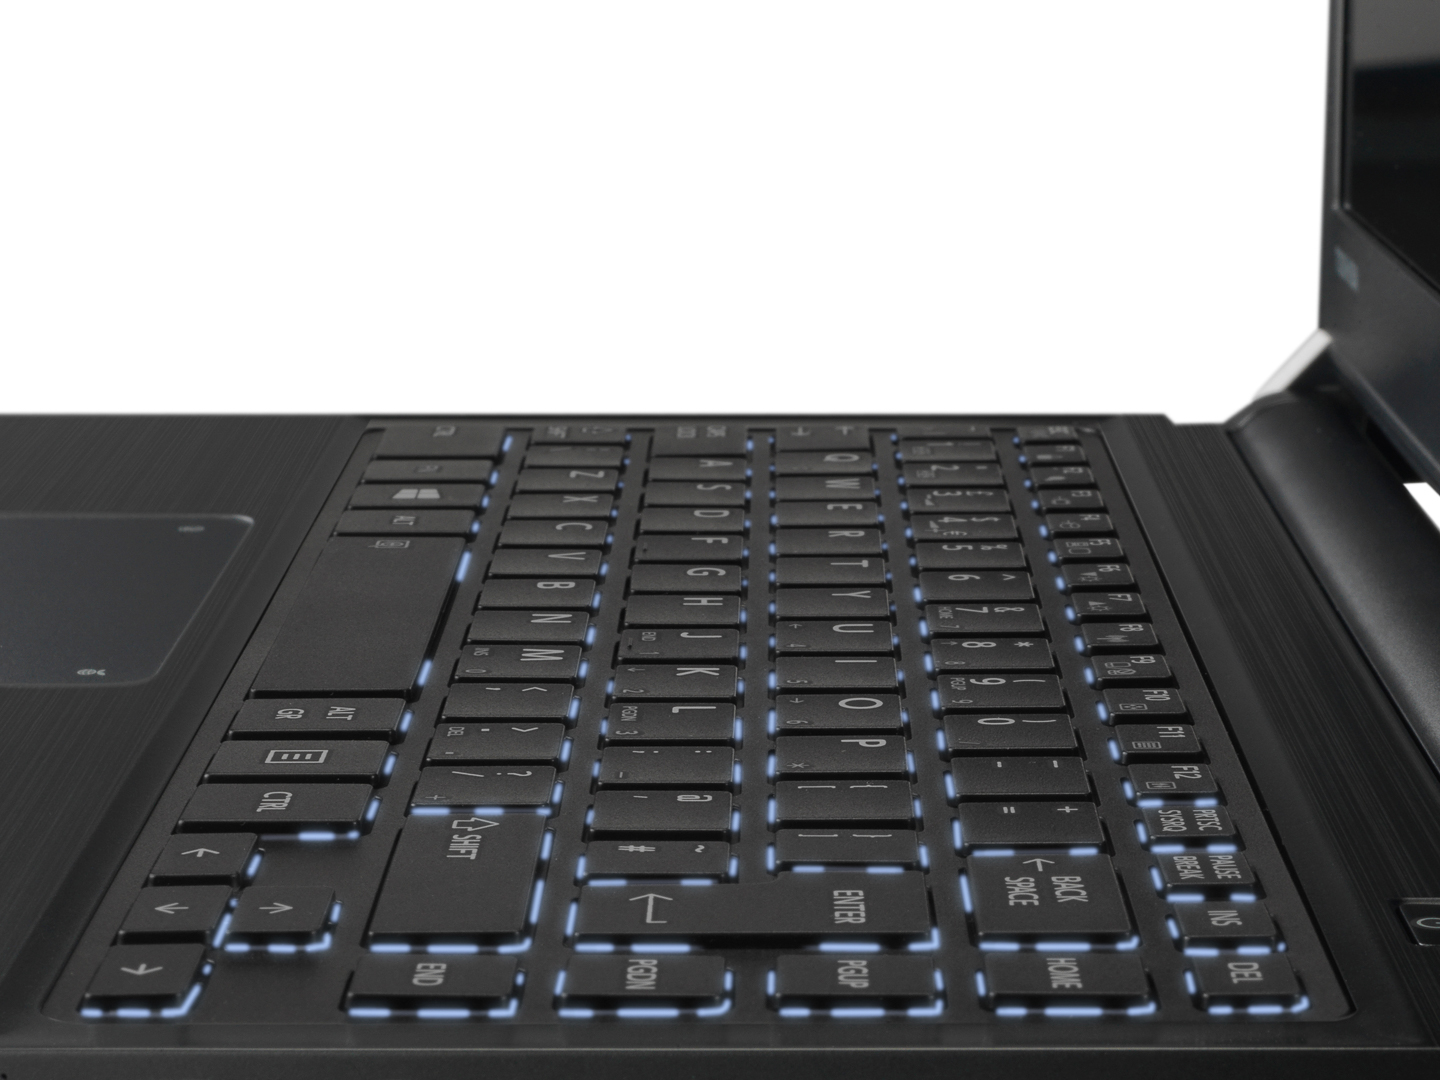
El Portégé A30-D-139 de Toshiba nos deja con sensaciones encontradas a pesar de la muy buena nota final. Esto se debe debido a pequeños problemas con el touchpad, el inaceptable sonido de la unidad de prueba y el lento SSD.
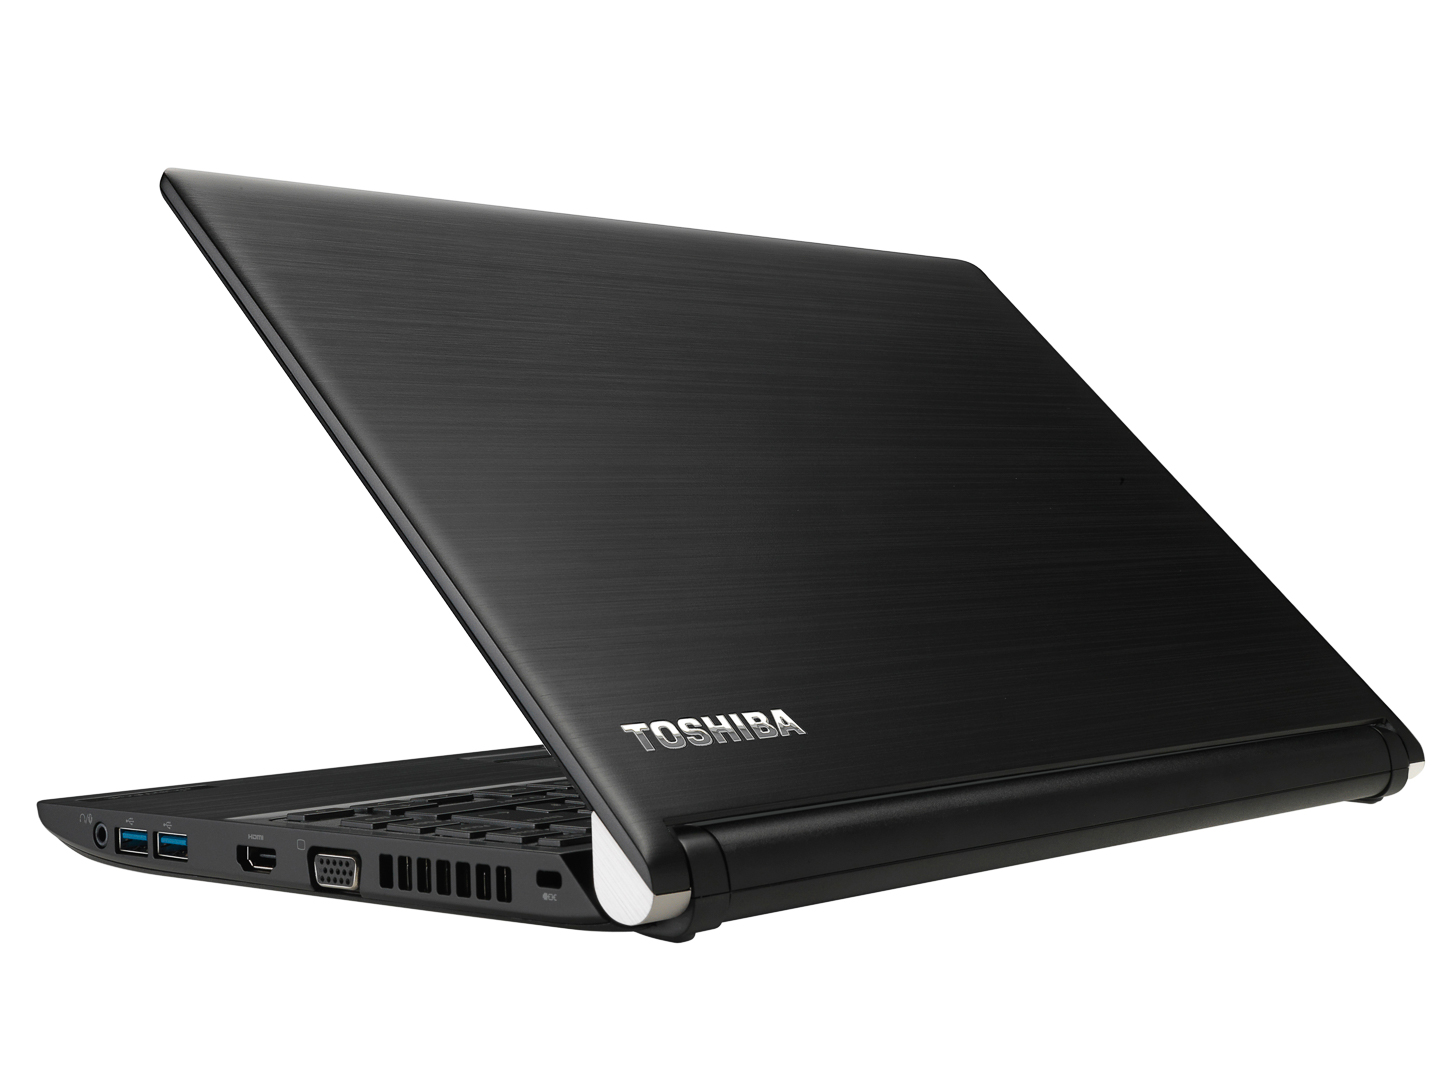
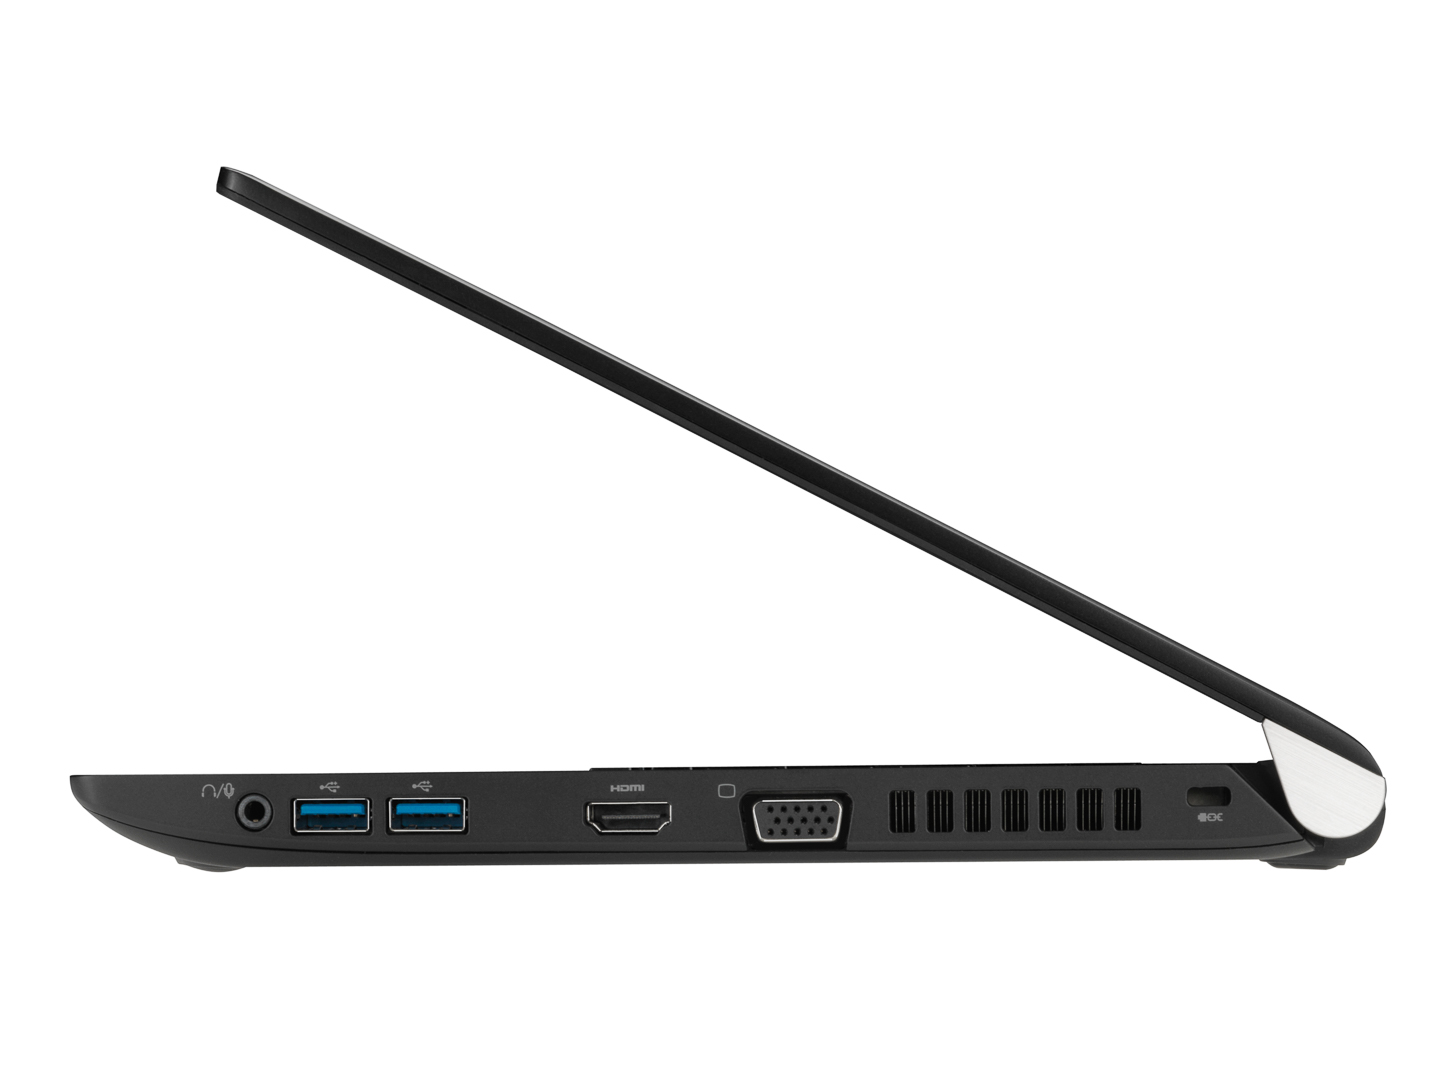
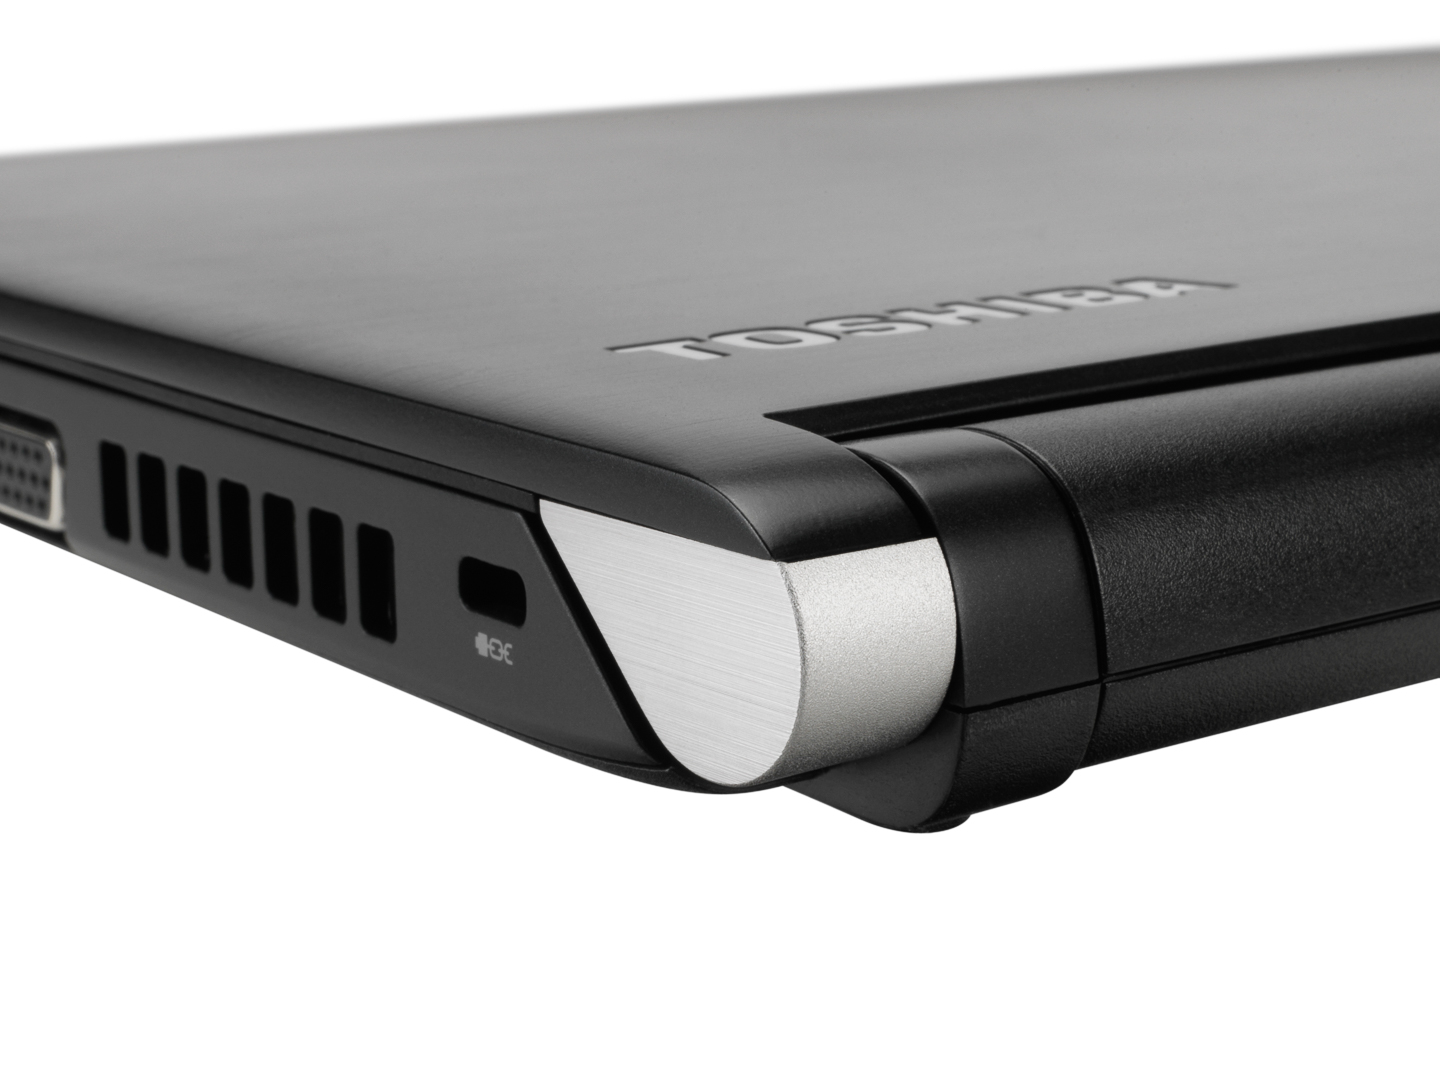
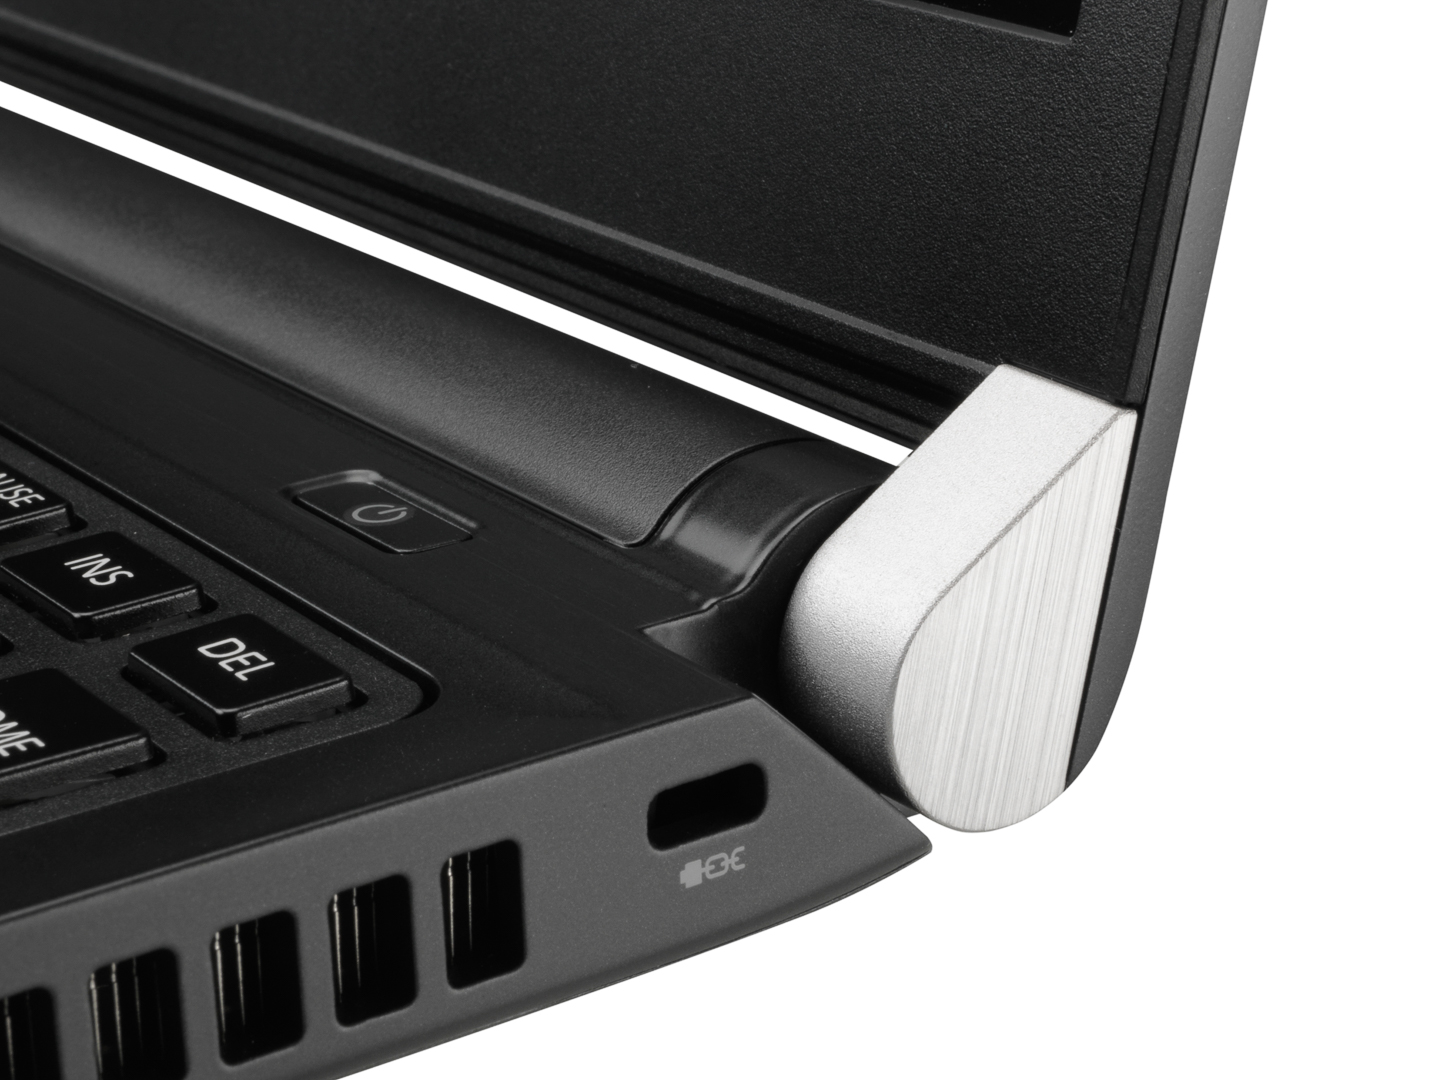
En el dispositivo se incluye todo lo necesario para los usuarios que buscan un portátil de oficina móvil o aquellos que navegan por internet. Al contrario que los rivales a los que se enfrenta, el Portégé tiene base de expansión y solo el MateBook X de Huaweii ofrece características de seguridad comparables. El portátil es más grande y pesado que los dispositivos de la competencia. Sin embargo esto nunca resultó un problema durante los tests. No tenemos ninguna queja sobre la solida y robusta carcasa a pesar de que no está perfectamente acabada.
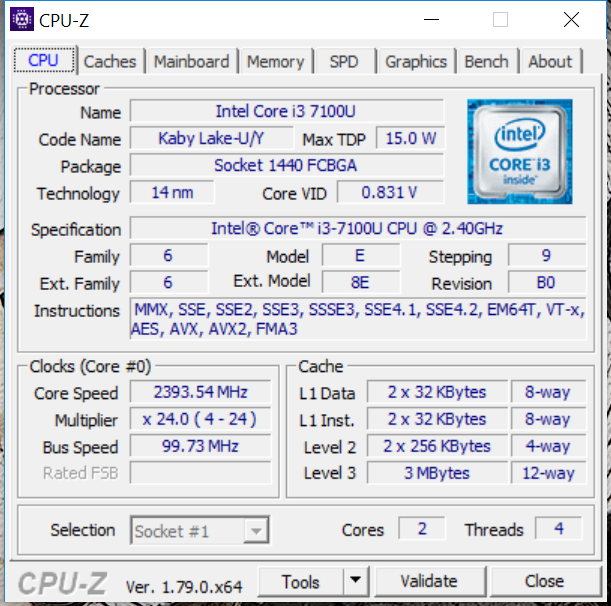
Hay que alabar al dispositivo por su batería fácil de extraer sin tener que abrirlo, la buena calidad de la pantalla y, sobre todo, su funcionamiento absolutamente silencioso. Esto es posible gracias a que el fabricante no ha usado un procesador i5 y ha optado por el suficientemente rápido i3-7100U. Ha sido complicado llevarlo a sus límites incluso en el test de estrés.
Solo podemos recomendar la compra de forma condicional. ¿Se va a hacer uso frecuente del touchpad? ¿Son el peso y el tamaño muy importantes? ¿Se va a usar el portátil para escuchar música? ¿Se necesita puerto Thunderbolt y/o DisplayPort? Si has contestado que sí a la mayoría de las preguntas, deberías buscar otro portátil. Si no, el nuevo Portégé es una muy buena elección.
Ésta es una versión acortada del análisis original. Puedes leer el análisis completo en inglés aquí.
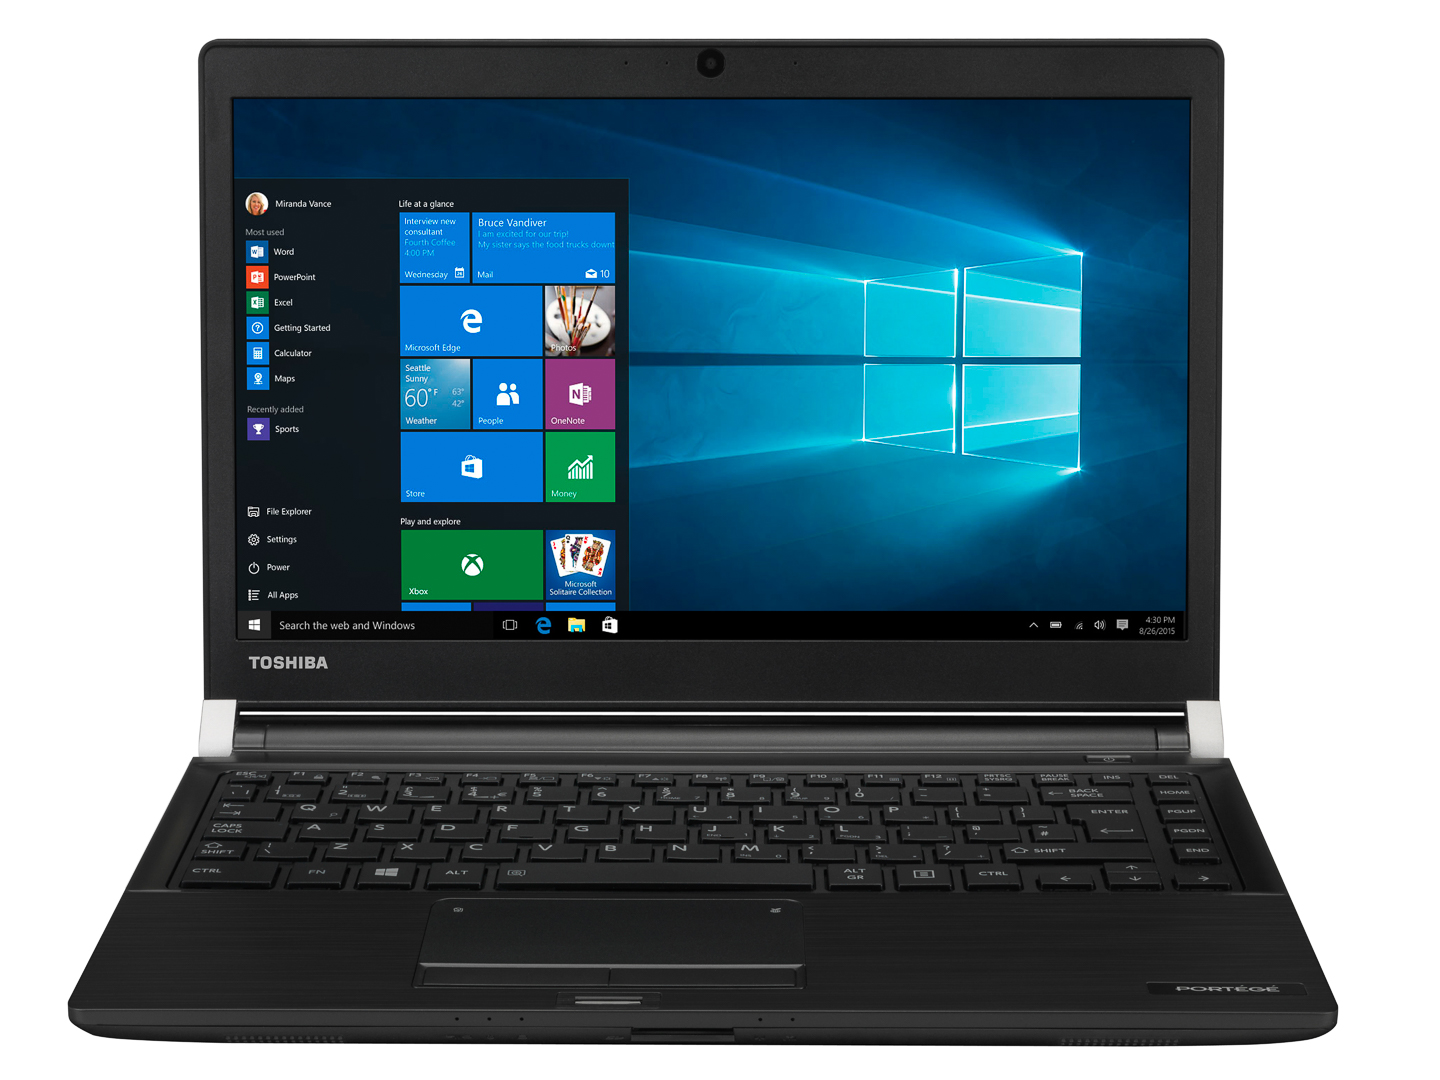
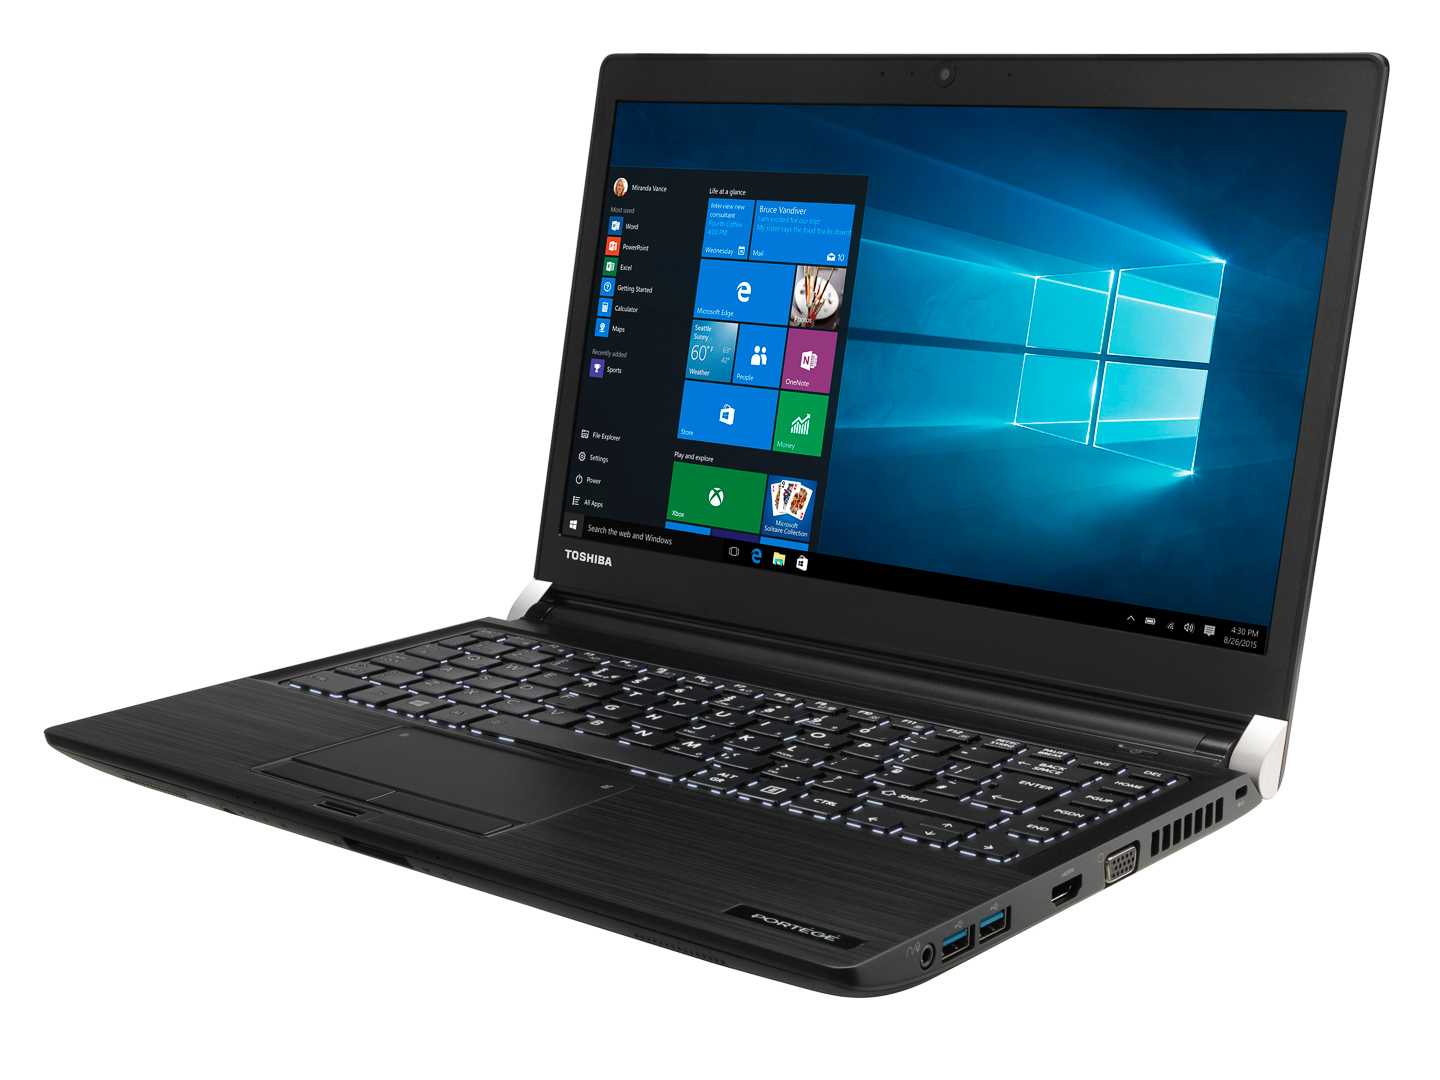
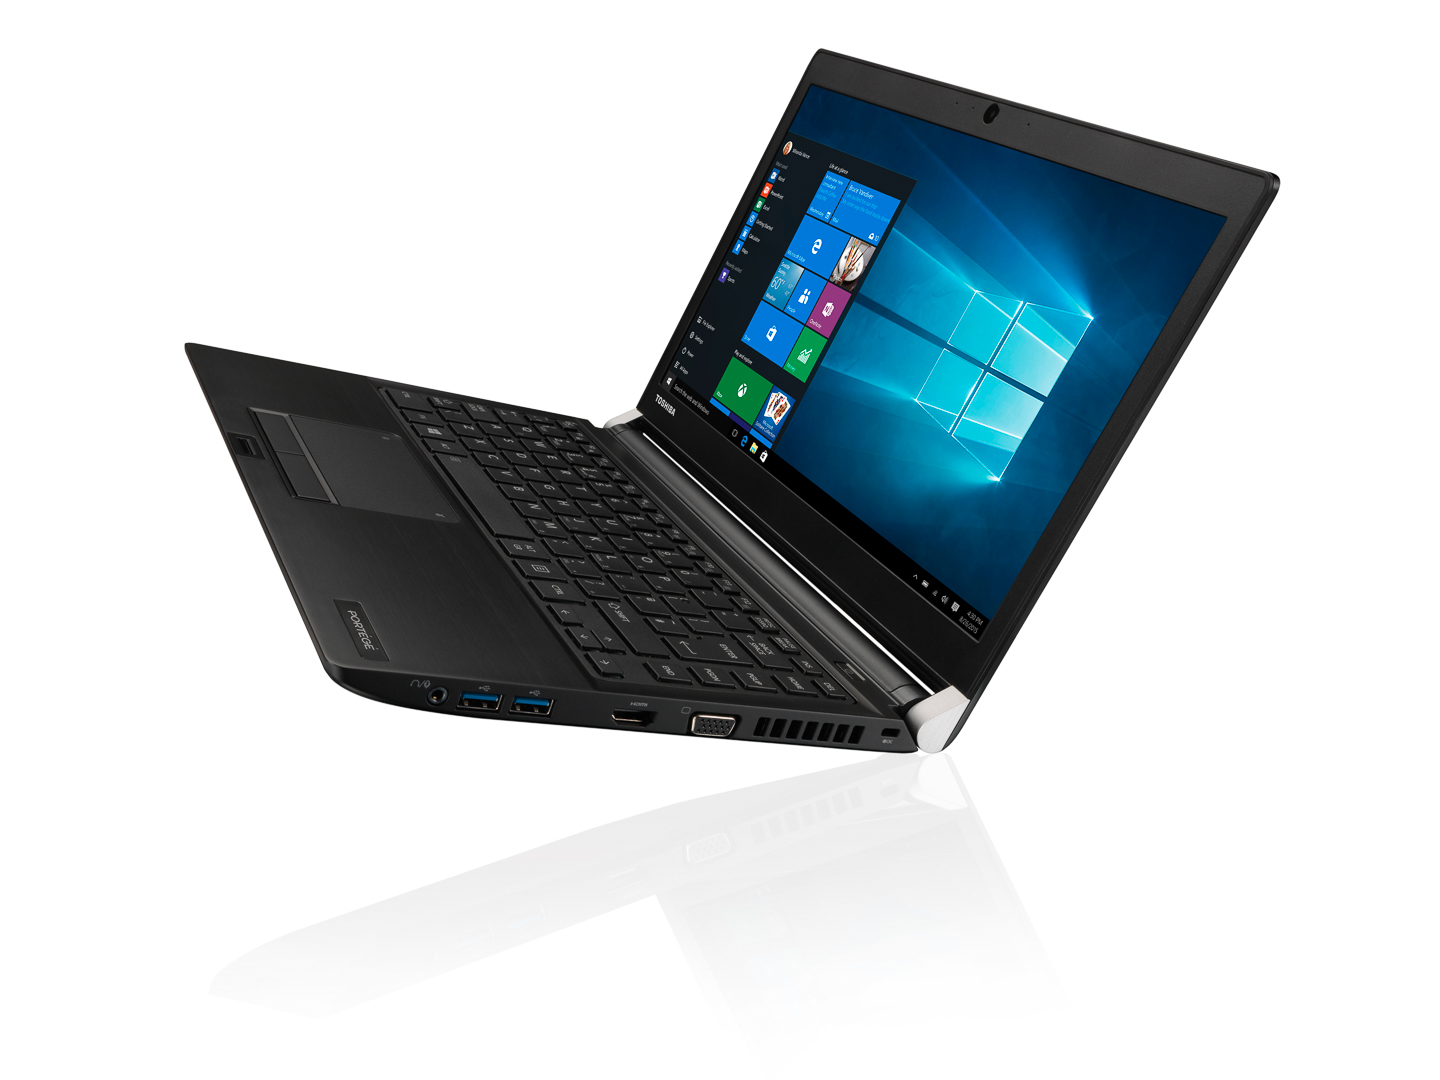
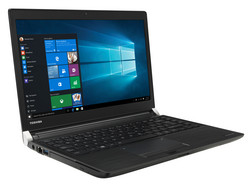
Toshiba Portege A30-D-139
-
09/12/2017 v6(old)
Sven Kloevekorn