 Deutsch
 English
 Español
 Français
 Italiano
 Nederlands
 Polski
 Português
 Русский
 Türkçe
 Svenska
 Chinese
 Magyar
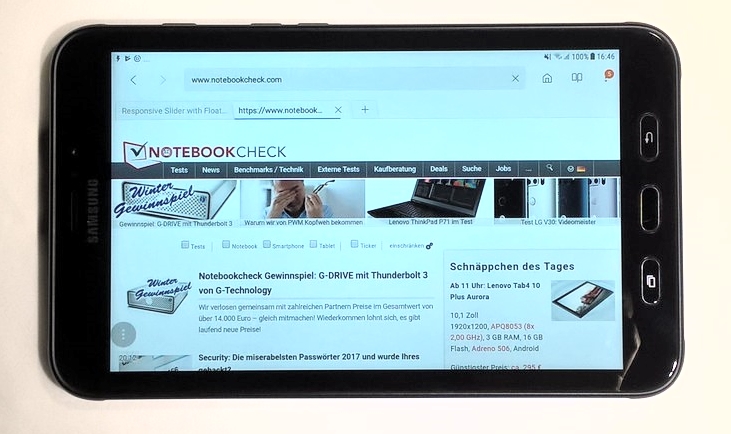
Breve análisis del tablet Samsung Galaxy Tab Active 2


| |||||||||||||||||||||||||
iluminación: 91 %
Brillo con batería: 509 cd/m²
Contraste: 1060:1 (Negro: 0.48 cd/m²)
ΔE Color 3.45 | 0.5-29.43 Ø5
ΔE Greyscale 4.5 | 0.57-98 Ø5.3
99.9% sRGB (Calman 2D)
Gamma: 2.11
| Samsung Galaxy Tab Active 2 TFT LCD, 1280x800, 8.00 | Samsung Galaxy Tab Active TFT, 1280x800, 8.00 | Lenovo Tab 4 8 IPS, 1280x800, 8.00 | Huawei Mediapad M3 Lite 8 IPS, 1920x1200, 8.00 | Amazon Fire HD 8 2017 IPS, 1280x800, 8.00 | Apple iPad (2017) IPS, 2048x1536, 9.70 | |
|---|---|---|---|---|---|---|
| Screen | -31% | -38% | -26% | -57% | 21% | |
| Brightness middle | 509 | 424 -17% | 455 -11% | 409.1 -20% | 419 -18% | 514 1% |
| Brightness | 477 | 426 -11% | 446 -6% | 402 -16% | 412 -14% | 485 2% |
| Brightness Distribution | 91 | 85 -7% | 91 0% | 92 1% | 91 0% | 88 -3% |
| Black Level * | 0.48 | 0.7 -46% | 0.51 -6% | 0.56 -17% | 0.39 19% | 0.46 4% |
| Contrast | 1060 | 606 -43% | 892 -16% | 731 -31% | 1074 1% | 1117 5% |
| Colorchecker dE 2000 * | 3.45 | 5.7 -65% | 5.5 -59% | 4.1 -19% | 8.5 -146% | 1.4 59% |
| Colorchecker dE 2000 max. * | 5.17 | 14.8 -186% | 9.6 -86% | 13.8 -167% | 2.9 44% | |
| Greyscale dE 2000 * | 4.5 | 5.76 -28% | 5.5 -22% | 5.3 -18% | 10.3 -129% | 2.1 53% |
| Gamma | 2.11 104% | 2.36 93% | 2.23 99% | 2.2 100% | 2.6 85% | 2.22 99% |
| CCT | 7171 91% | 7236 90% | 7852 83% | 7603 85% | 6216 105% | 6647 98% |
* ... más pequeño es mejor
Parpadeo de Pantalla / PWM (Pulse-Width Modulation)
| Parpadeo de Pantalla / PWM no detectado | 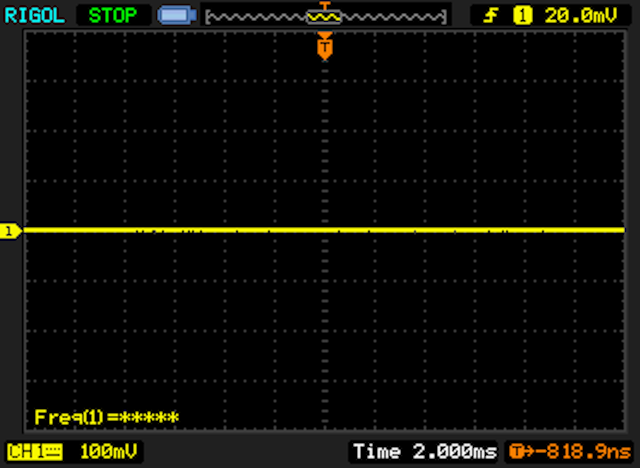 | ||
Comparación: 53 % de todos los dispositivos testados no usaron PWM para atenuar el display. Si se usó, medimos una media de 17900 (mínimo: 5 - máxmo: 3846000) Hz. | |||
Tiempos de respuesta del display
| ↔ Tiempo de respuesta de Negro a Blanco | ||
|---|---|---|
| 28 ms ... subida ↗ y bajada ↘ combinada | ↗ 17 ms subida | 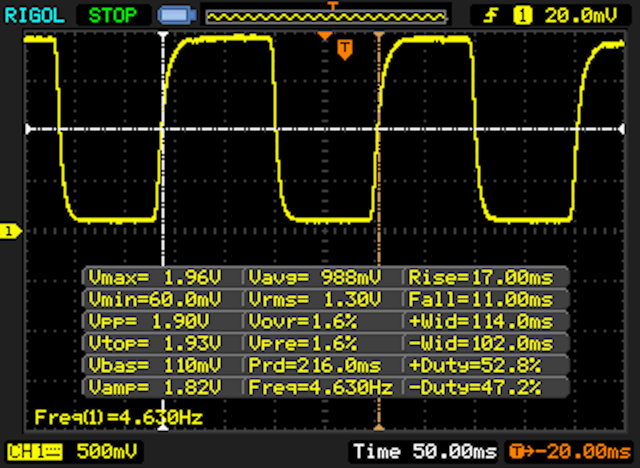 |
| ↘ 11 ms bajada | ||
| La pantalla mostró tiempos de respuesta relativamente lentos en nuestros tests pero podría ser demasiado lenta para los jugones. En comparación, todos los dispositivos de prueba van de ##min### (mínimo) a 240 (máximo) ms. » 67 % de todos los dispositivos son mejores. Eso quiere decir que el tiempo de respuesta es peor que la media (21.5 ms) de todos los dispositivos testados. | ||
| ↔ Tiempo de respuesta 50% Gris a 80% Gris | ||
| 42 ms ... subida ↗ y bajada ↘ combinada | ↗ 23 ms subida | 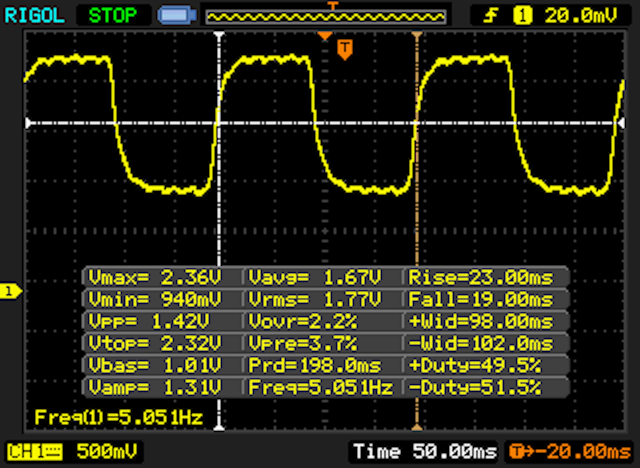 |
| ↘ 19 ms bajada | ||
| La pantalla mostró tiempos de respuesta lentos en nuestros tests y podría ser demasiado lenta para los jugones. En comparación, todos los dispositivos de prueba van de ##min### (mínimo) a 636 (máximo) ms. » 63 % de todos los dispositivos son mejores. Eso quiere decir que el tiempo de respuesta es peor que la media (33.7 ms) de todos los dispositivos testados. | ||
| AnTuTu v6 - Total Score | |
| Apple iPad (2017) | |
| Huawei Mediapad M3 Lite 8 | |
| Samsung Galaxy Tab Active 2 | |
| Lenovo Tab 4 8 | |
| Amazon Fire HD 8 2017 | |
| PCMark for Android | |
| Work performance score | |
| Samsung Galaxy Tab Active 2 | |
| Huawei Mediapad M3 Lite 8 | |
| Lenovo Tab 4 8 | |
| Amazon Fire HD 8 2017 | |
| Samsung Galaxy Tab Active | |
| Work 2.0 performance score | |
| Samsung Galaxy Tab Active 2 | |
| Huawei Mediapad M3 Lite 8 | |
| Lenovo Tab 4 8 | |
| Amazon Fire HD 8 2017 | |
| Geekbench 4.4 | |
| 64 Bit Single-Core Score | |
| Samsung Galaxy Tab Active 2 | |
| Lenovo Tab 4 8 | |
| Huawei Mediapad M3 Lite 8 | |
| Amazon Fire HD 8 2017 | |
| 64 Bit Multi-Core Score | |
| Samsung Galaxy Tab Active 2 | |
| Huawei Mediapad M3 Lite 8 | |
| Lenovo Tab 4 8 | |
| Amazon Fire HD 8 2017 | |
| Compute RenderScript Score | |
| Samsung Galaxy Tab Active 2 | |
| Lenovo Tab 4 8 | |
| GFXBench (DX / GLBenchmark) 2.7 | |
| T-Rex Onscreen | |
| Apple iPad (2017) | |
| Samsung Galaxy Tab Active 2 | |
| Amazon Fire HD 8 2017 | |
| Huawei Mediapad M3 Lite 8 | |
| Lenovo Tab 4 8 | |
| Samsung Galaxy Tab Active | |
| 1920x1080 T-Rex Offscreen | |
| Apple iPad (2017) | |
| Huawei Mediapad M3 Lite 8 | |
| Samsung Galaxy Tab Active 2 | |
| Amazon Fire HD 8 2017 | |
| Lenovo Tab 4 8 | |
| Samsung Galaxy Tab Active | |
| GFXBench 3.0 | |
| on screen Manhattan Onscreen OGL | |
| Apple iPad (2017) | |
| Samsung Galaxy Tab Active 2 | |
| Huawei Mediapad M3 Lite 8 | |
| Amazon Fire HD 8 2017 | |
| Lenovo Tab 4 8 | |
| Samsung Galaxy Tab Active | |
| 1920x1080 1080p Manhattan Offscreen | |
| Apple iPad (2017) | |
| Huawei Mediapad M3 Lite 8 | |
| Samsung Galaxy Tab Active 2 | |
| Amazon Fire HD 8 2017 | |
| Lenovo Tab 4 8 | |
| Samsung Galaxy Tab Active | |
| GFXBench 3.1 | |
| on screen Manhattan ES 3.1 Onscreen | |
| Apple iPad (2017) | |
| Samsung Galaxy Tab Active 2 | |
| Amazon Fire HD 8 2017 | |
| Huawei Mediapad M3 Lite 8 | |
| 1920x1080 Manhattan ES 3.1 Offscreen | |
| Apple iPad (2017) | |
| Huawei Mediapad M3 Lite 8 | |
| Samsung Galaxy Tab Active 2 | |
| Amazon Fire HD 8 2017 | |
| GFXBench | |
| on screen Car Chase Onscreen | |
| Samsung Galaxy Tab Active 2 | |
| Huawei Mediapad M3 Lite 8 | |
| 1920x1080 Car Chase Offscreen | |
| Huawei Mediapad M3 Lite 8 | |
| Samsung Galaxy Tab Active 2 | |
| Octane V2 - Total Score | |
| Apple iPad (2017) | |
| Samsung Galaxy Tab Active 2 | |
| Huawei Mediapad M3 Lite 8 (Google Chrome 61.0.3163.98) | |
| Lenovo Tab 4 8 (Chrome 61) | |
| Amazon Fire HD 8 2017 (Amazon Silk 58.2.3029.83.10) | |
| Samsung Galaxy Tab Active (Chrome 40) | |
| WebXPRT 2015 - Overall | |
| Apple iPad (2017) | |
| Lenovo Tab 4 8 (Chrome 61) | |
| Huawei Mediapad M3 Lite 8 (Google Chrome 61.0.3163.98) | |
| Samsung Galaxy Tab Active 2 | |
| Amazon Fire HD 8 2017 (Amazon Silk 58.2.3029.83.10) | |
| JetStream 1.1 - Total Score | |
| Apple iPad (2017) | |
| Samsung Galaxy Tab Active 2 | |
| Amazon Fire HD 8 2017 (Amazon Silk 58.2.3029.83.10) | |
| Lenovo Tab 4 8 (Chrome 61) | |
| Huawei Mediapad M3 Lite 8 (Google Chrome 61.0.3163.98) | |
| Mozilla Kraken 1.1 - Total | |
| Samsung Galaxy Tab Active (Chrome 40) | |
| Huawei Mediapad M3 Lite 8 (Google Chrome 61.0.3163.98) | |
| Lenovo Tab 4 8 (Chrome 61) | |
| Amazon Fire HD 8 2017 (Amazon Silk 58.2.3029.83.10) | |
| Samsung Galaxy Tab Active 2 | |
| Apple iPad (2017) | |
* ... más pequeño es mejor
| Samsung Galaxy Tab Active 2 | Samsung Galaxy Tab Active | Lenovo Tab 4 8 | Huawei Mediapad M3 Lite 8 | Amazon Fire HD 8 2017 | |
|---|---|---|---|---|---|
| AndroBench 3-5 | -21% | 16% | -21% | -22% | |
| Sequential Read 256KB | 218.1 | 151.8 -30% | 265.1 22% | 135.1 -38% | 159.1 -27% |
| Sequential Write 256KB | 54 | 42.81 -21% | 72.3 34% | 38.01 -30% | 47.23 -13% |
| Random Read 4KB | 25.96 | 20.24 -22% | 44 69% | 35 35% | 21.55 -17% |
| Random Write 4KB | 10.98 | 9.76 -11% | 7.1 -35% | 7.64 -30% | 11.51 5% |
| Sequential Read 256KB SDCard | 78.6 | 84.8 8% | 87.7 12% | 51.1 -35% | |
| Sequential Write 256KB SDCard | 64.3 | 61.1 -5% | 14.6 -77% | 34.15 -47% |
(+) The maximum temperature on the upper side is 35.5 °C / 96 F, compared to the average of 33.8 °C / 93 F, ranging from 20.7 to 53.2 °C for the class Tablet.
(+) The bottom heats up to a maximum of 34.4 °C / 94 F, compared to the average of 33.3 °C / 92 F
(+) In idle usage, the average temperature for the upper side is 29.9 °C / 86 F, compared to the device average of 30 °C / 86 F.
Apple iPad (2017) audio analysis
(+) | speakers can play relatively loud (86.1 dB)
Bass 100 - 315 Hz
(-) | nearly no bass - on average 17.5% lower than median
(±) | linearity of bass is average (10.8% delta to prev. frequency)
Mids 400 - 2000 Hz
(+) | balanced mids - only 2.8% away from median
(+) | mids are linear (5.3% delta to prev. frequency)
Highs 2 - 16 kHz
(±) | higher highs - on average 8.5% higher than median
(+) | highs are linear (3.9% delta to prev. frequency)
Overall 100 - 16.000 Hz
(±) | linearity of overall sound is average (19% difference to median)
Compared to same class
» 44% of all tested devices in this class were better, 6% similar, 50% worse
» The best had a delta of 7%, average was 23%, worst was 129%
Compared to all devices tested
» 39% of all tested devices were better, 8% similar, 53% worse
» The best had a delta of 4%, average was 25%, worst was 134%
| Off / Standby | |
| Ocioso | |
| Carga |
|
| Samsung Galaxy Tab Active 2 4450 mAh | Samsung Galaxy Tab Active mAh | Lenovo Tab 4 8 4850 mAh | Huawei Mediapad M3 Lite 8 4800 mAh | Amazon Fire HD 8 2017 mAh | Apple iPad (2017) 8.827 mAh | |
|---|---|---|---|---|---|---|
| Power Consumption | 23% | -19% | -141% | -0% | -131% | |
| Idle Minimum * | 0.89 | 0.6 33% | 1.1 -24% | 4.02 -352% | 0.99 -11% | 2.06 -131% |
| Idle Average * | 3.13 | 2.2 30% | 3.51 -12% | 6 -92% | 2.74 12% | 7.42 -137% |
| Idle Maximum * | 3.36 | 2.5 26% | 4.14 -23% | 6.64 -98% | 2.83 16% | 7.47 -122% |
| Load Average * | 3.93 | 3.7 6% | 4.86 -24% | 7.34 -87% | 4.51 -15% | 9.45 -140% |
| Load Maximum * | 5.45 | 4.3 21% | 6.13 -12% | 9.6 -76% | 5.69 -4% | 12.31 -126% |
* ... más pequeño es mejor
| Samsung Galaxy Tab Active 2 4450 mAh | Samsung Galaxy Tab Active mAh | Lenovo Tab 4 8 4850 mAh | Huawei Mediapad M3 Lite 8 4800 mAh | Amazon Fire HD 8 2017 mAh | Apple iPad (2017) 8.827 mAh | |
|---|---|---|---|---|---|---|
| Duración de Batería | 18% | -17% | 7% | 22% | 6% | |
| Reader / Idle | 1357 | 1640 21% | 1207 -11% | 1382 2% | 2032 50% | 1496 10% |
| H.264 | 493 | 771 56% | 603 22% | 744 51% | 845 71% | |
| WiFi v1.3 | 895 | 452 -49% | 877 -2% | 770 -14% | 764 -15% | |
| Load | 396 | 306 -23% | 276 -30% | 480 21% | 393 -1% | 225 -43% |
| WiFi | 861 |
Pro
Contra
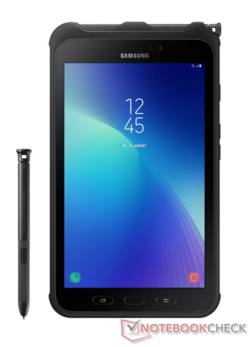
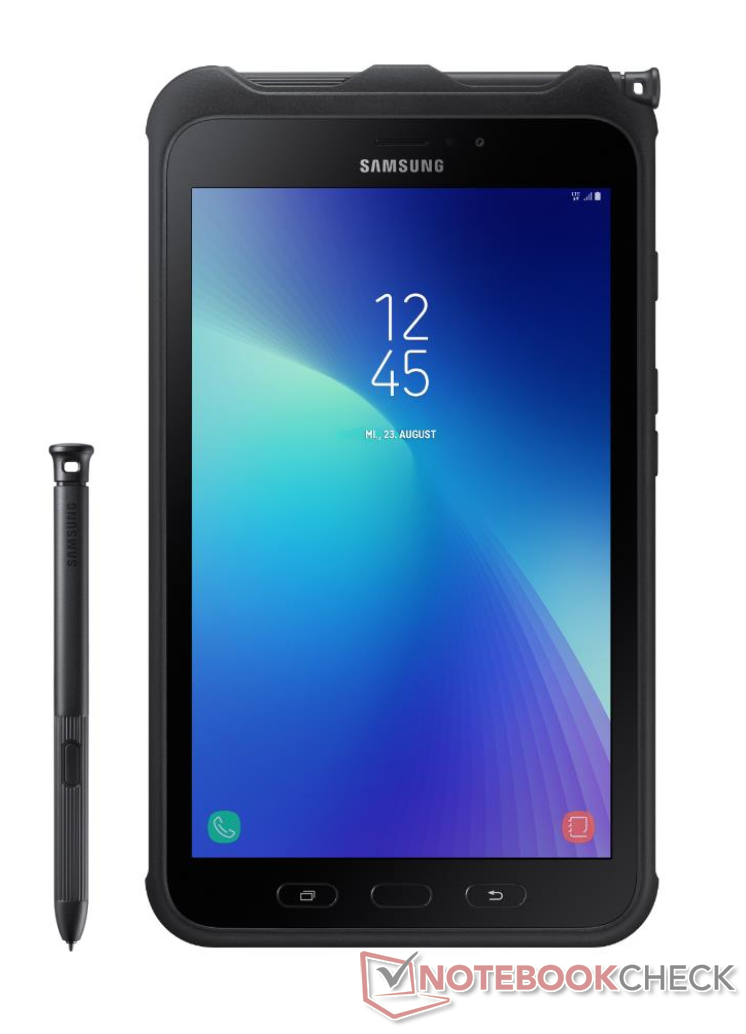
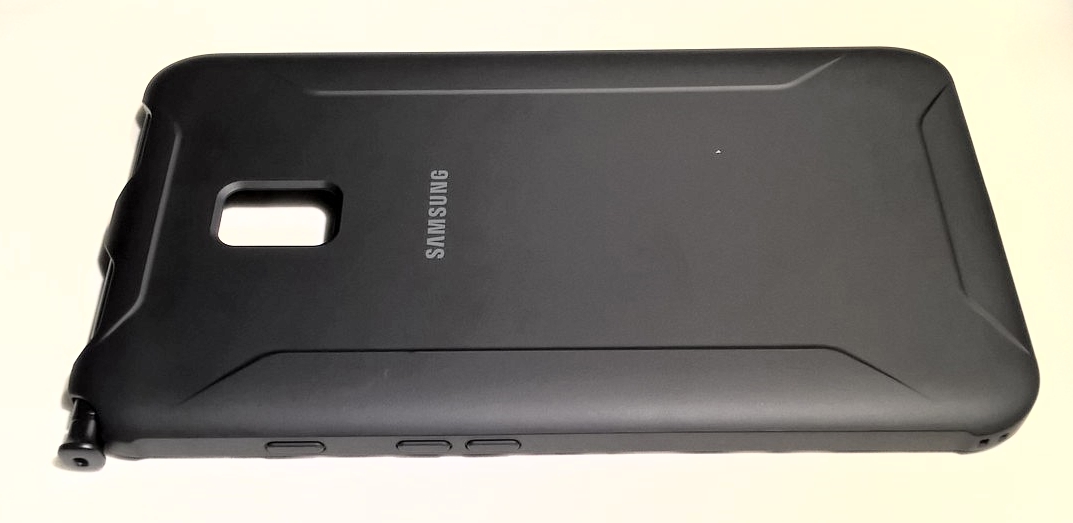
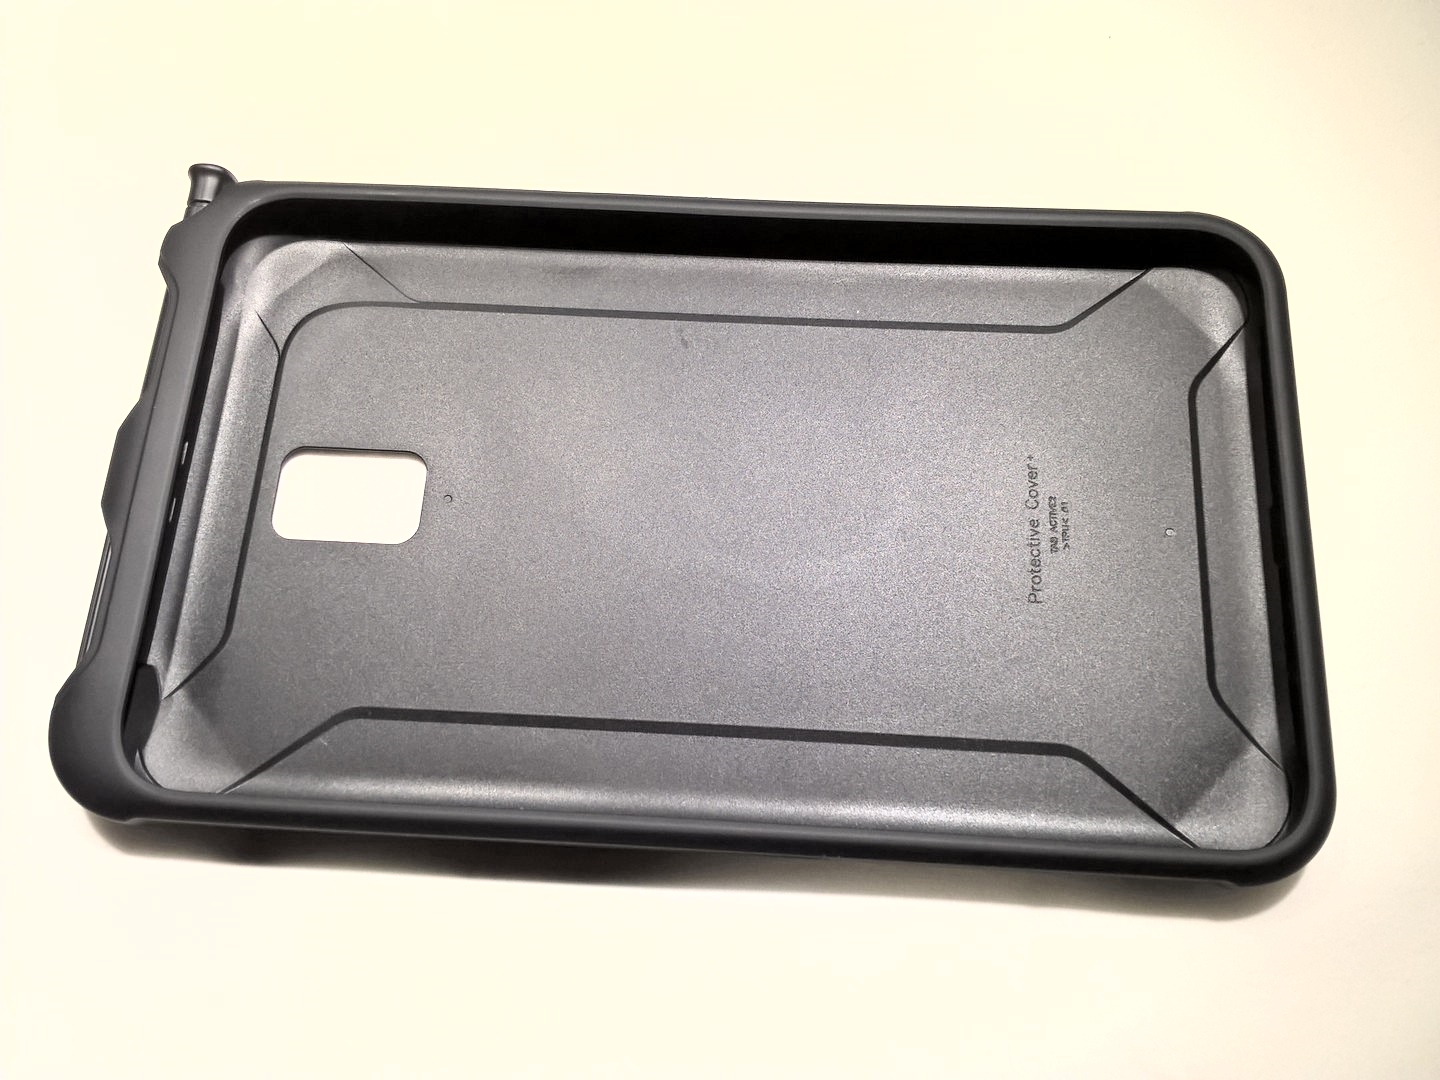
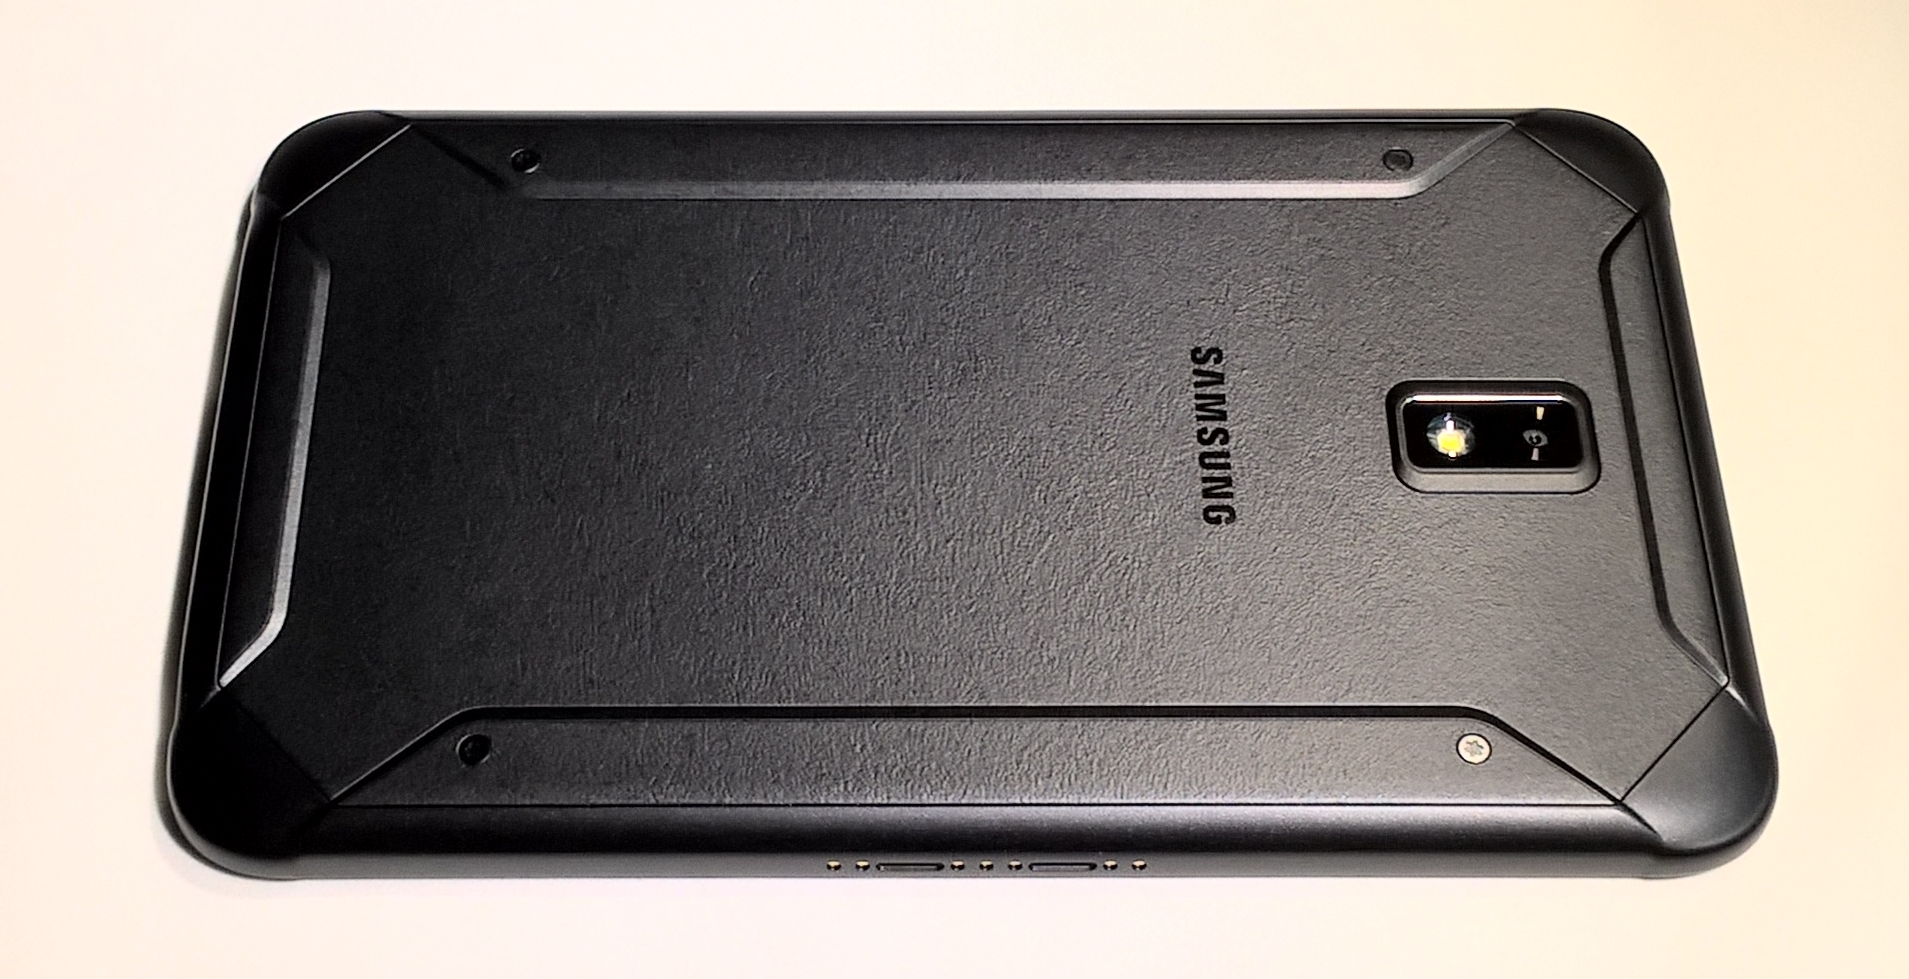
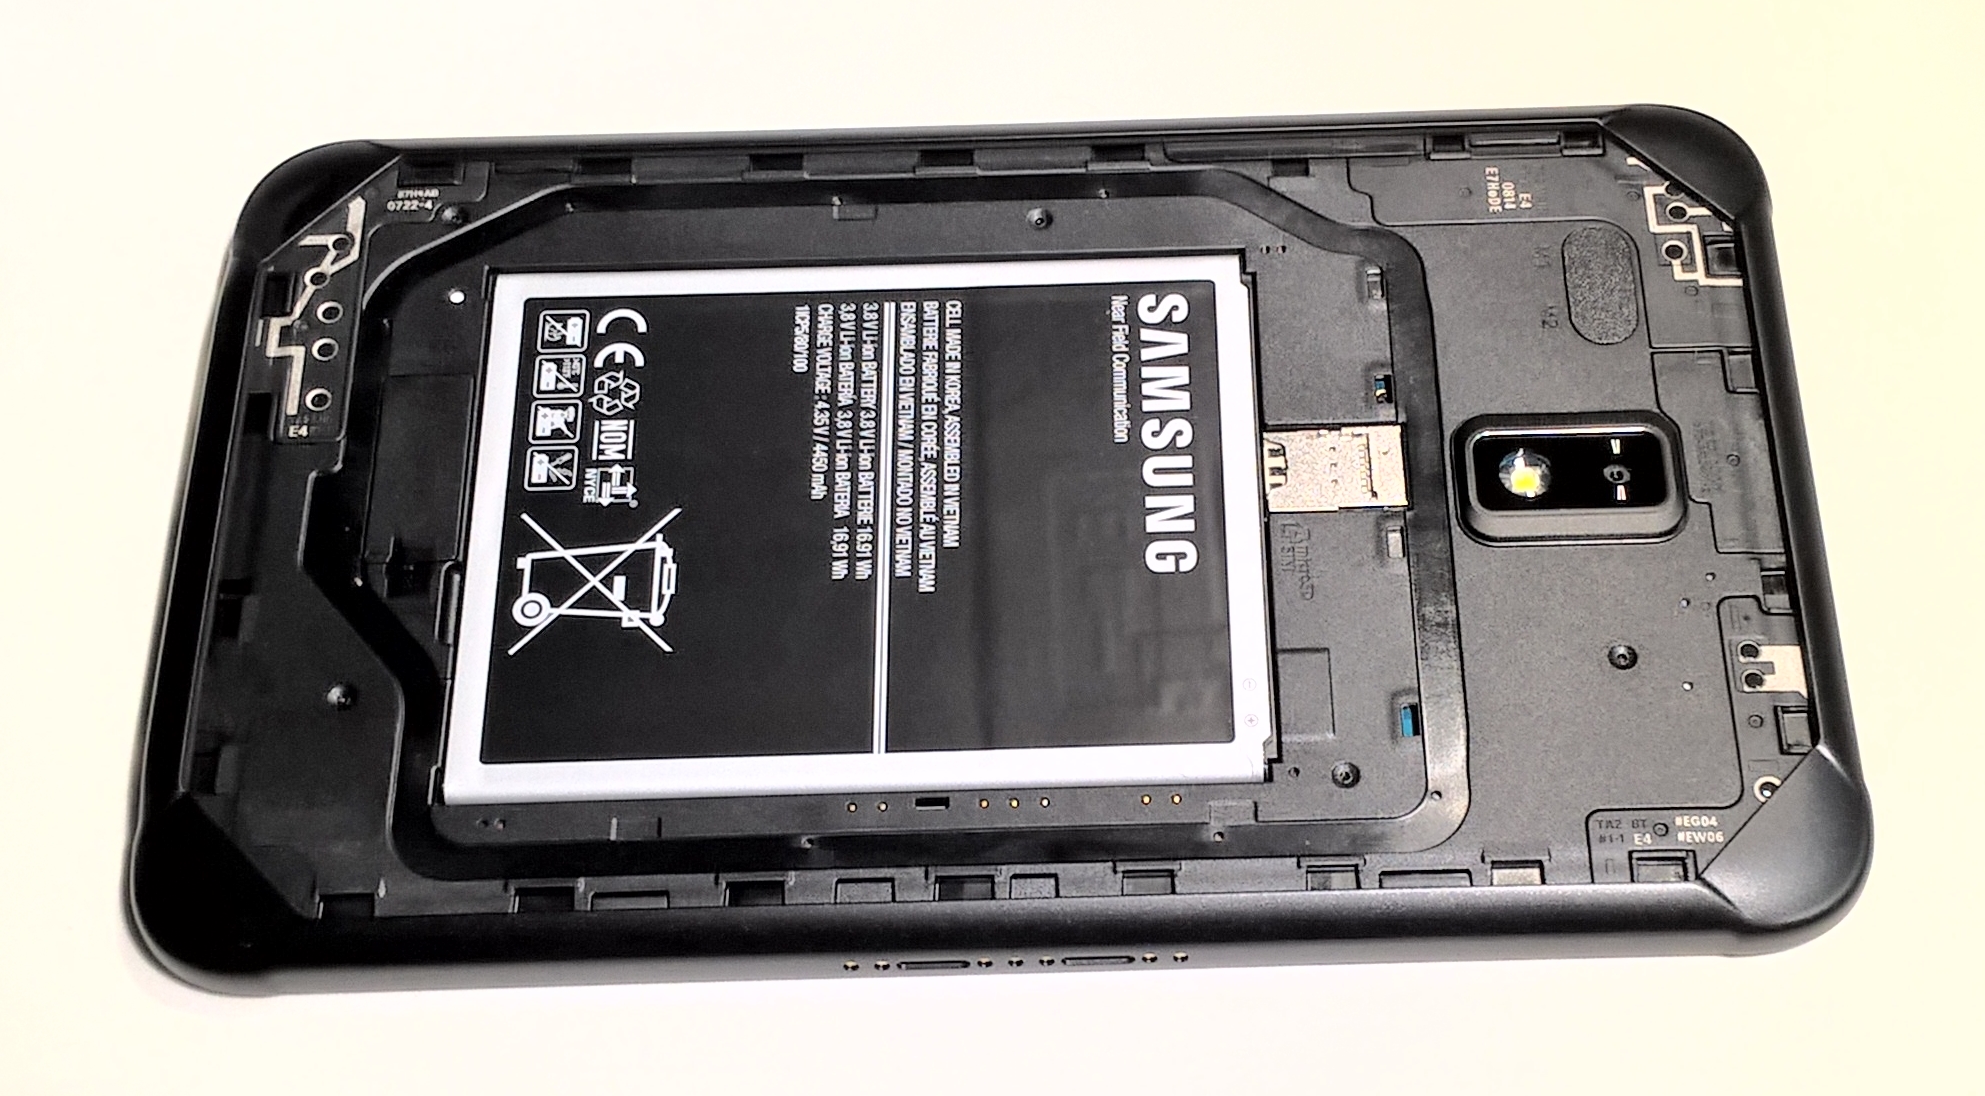
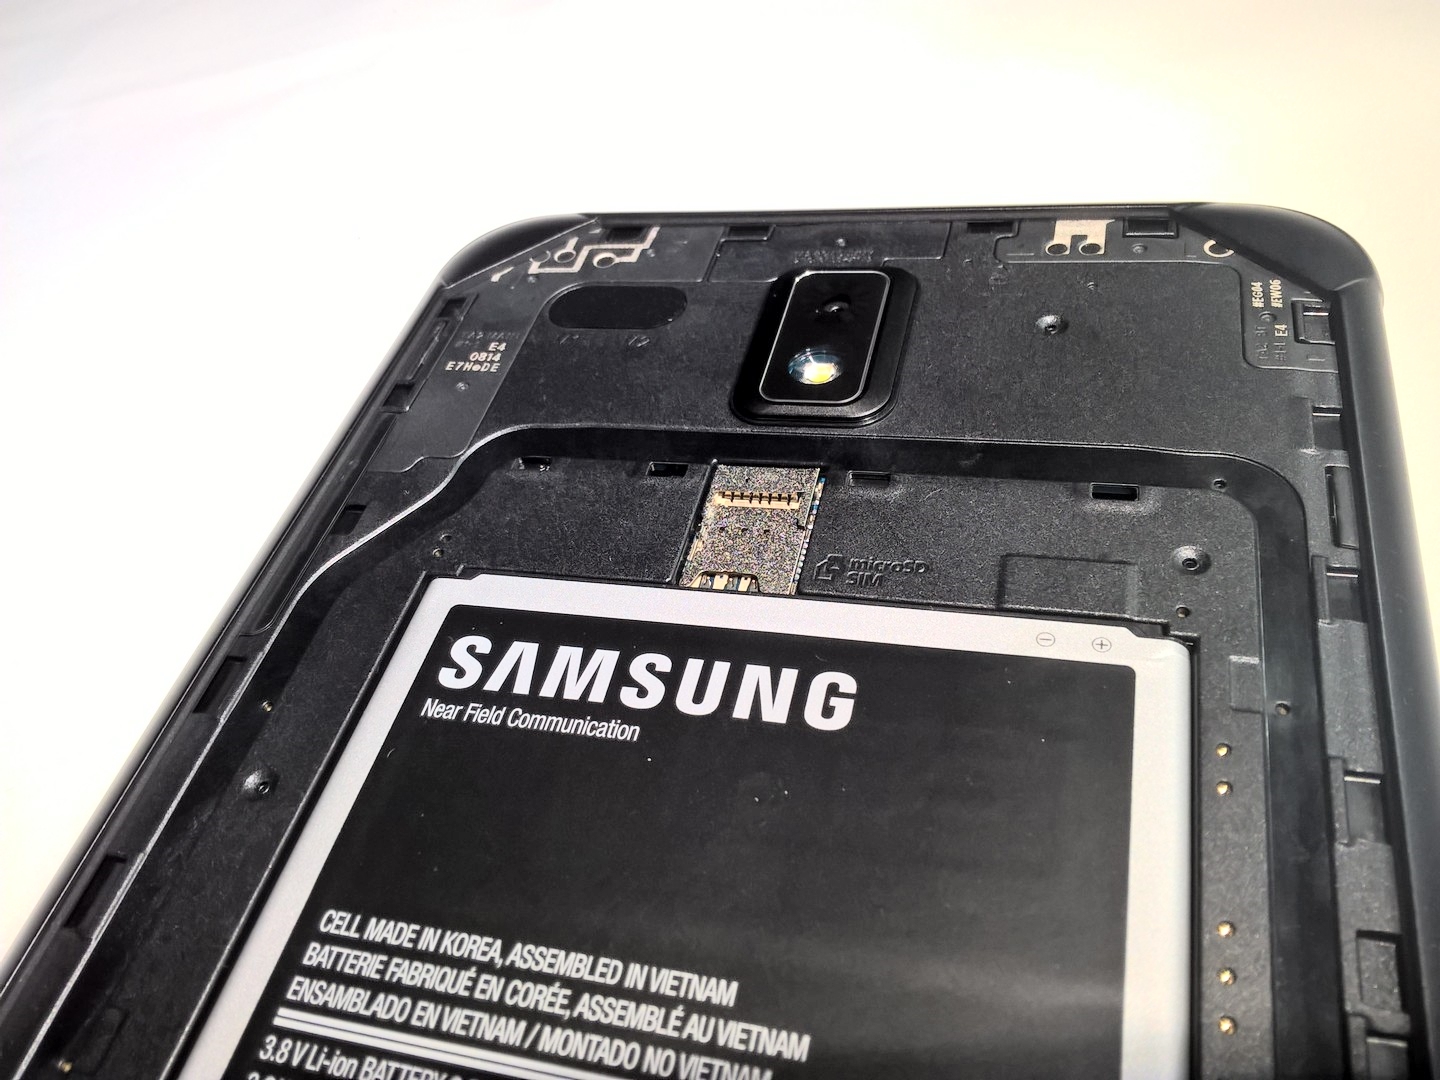
Ni una duda: El Galaxy Tab Active 2 es un todoterreno muy resistente. El sistema operativo va como la seda y el dispositivo debería soportar las tareas diarias con facilidad. El almacenamiento interno está bastante limitado, y, aunque en teoría el sistema no necesita mas almacenamiento, acabarás necesitando una microSD extra tarde o temprano. Al menos soporta tarjetas microSD de hasta 256GB.
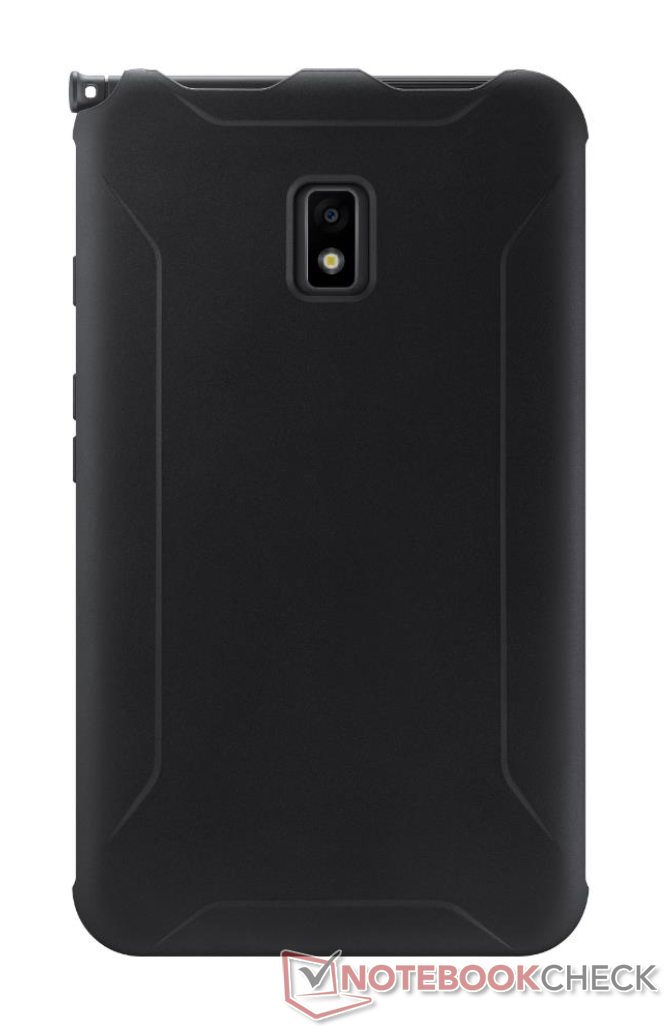
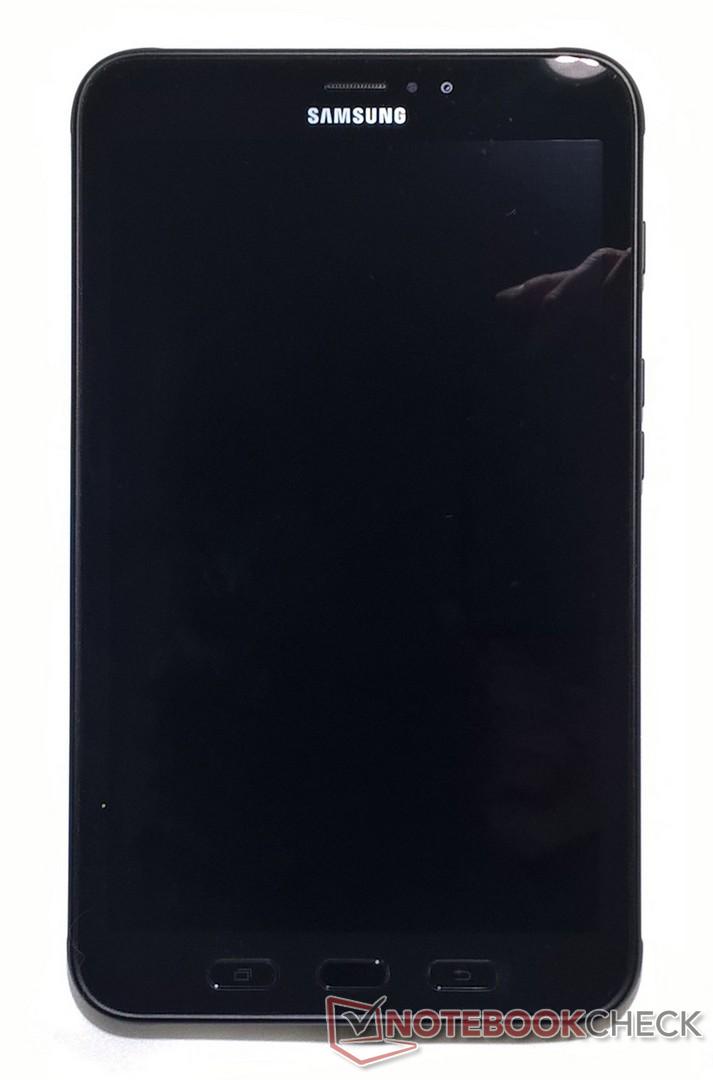
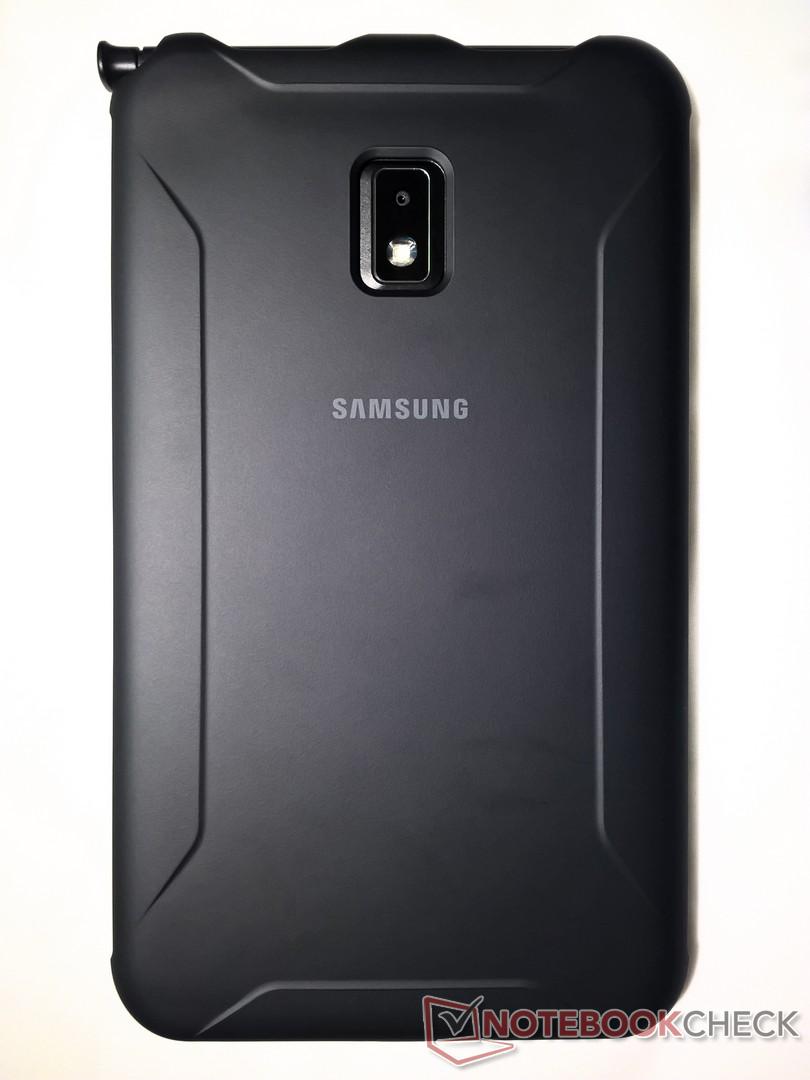
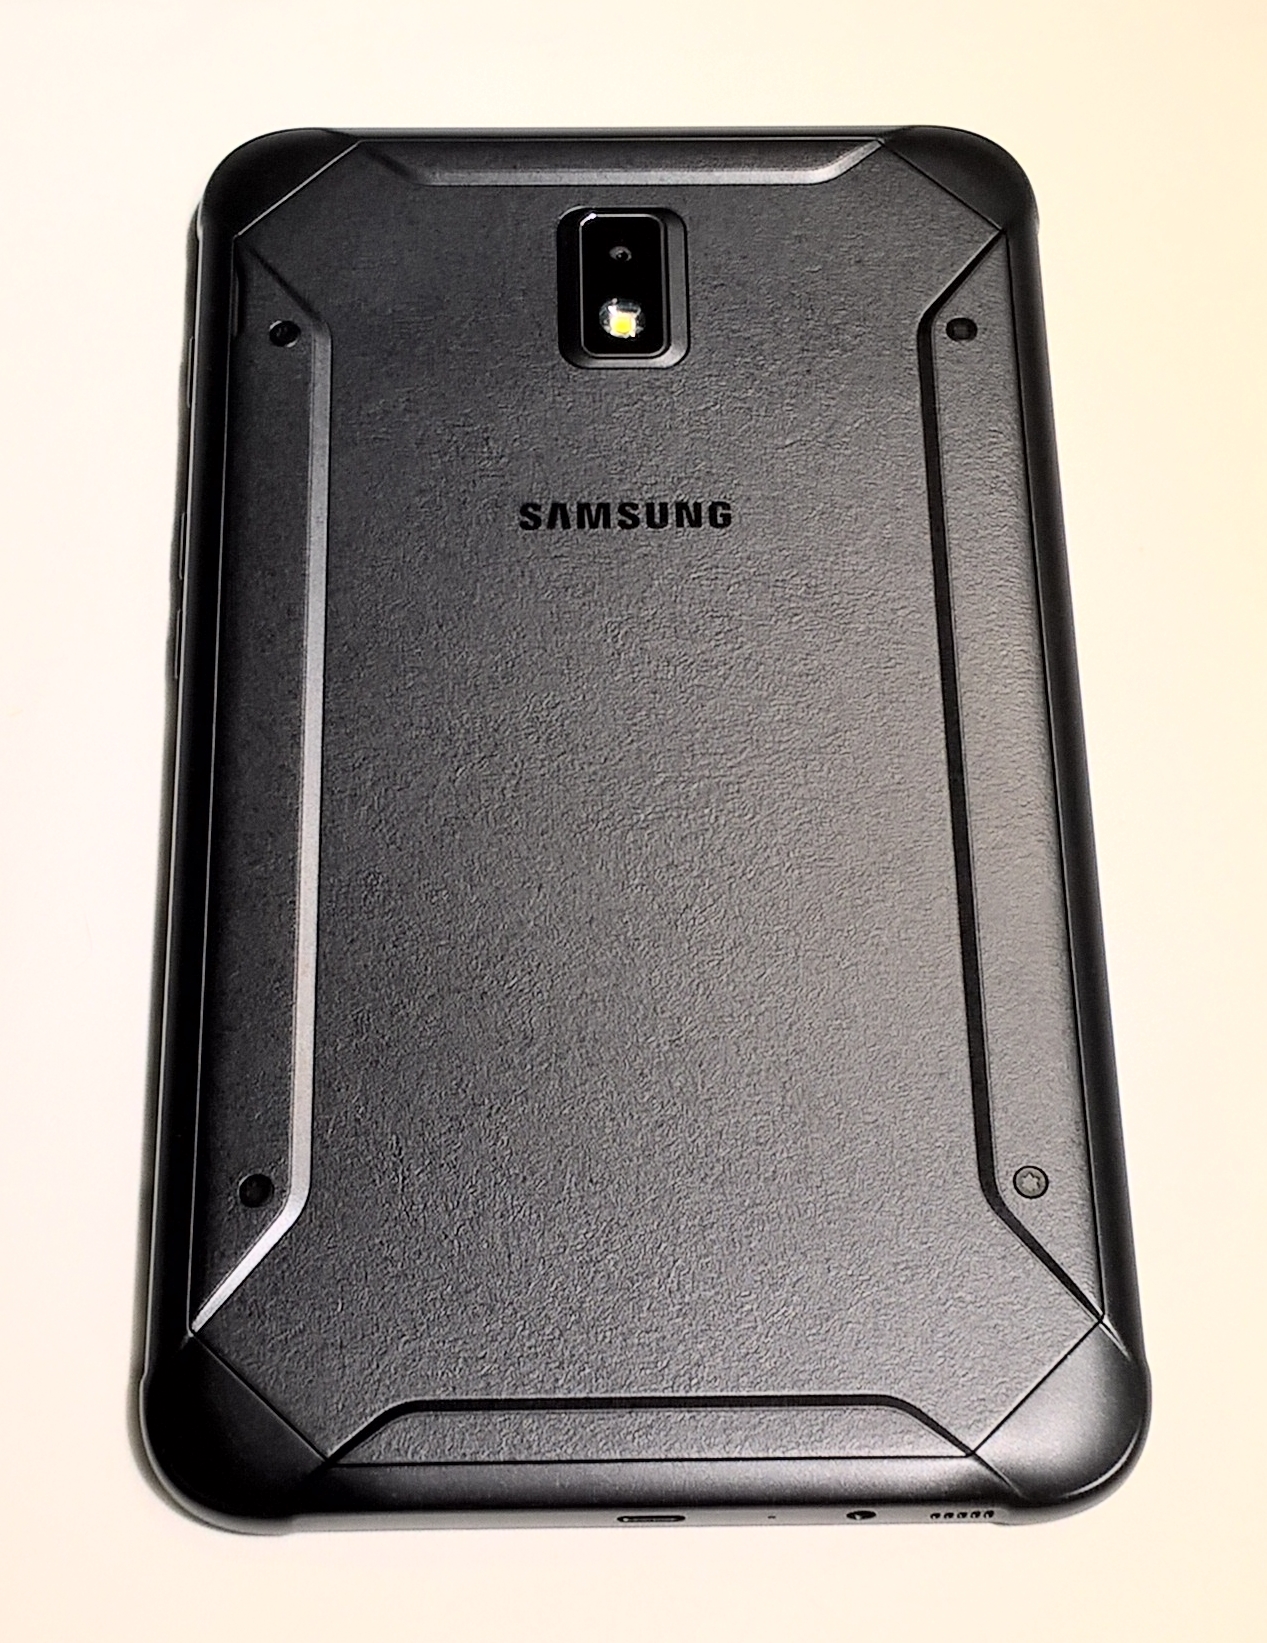
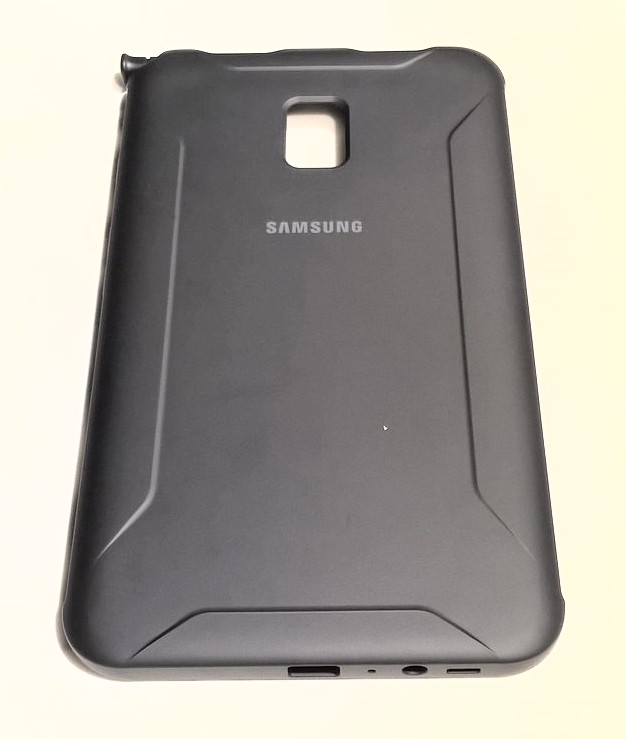
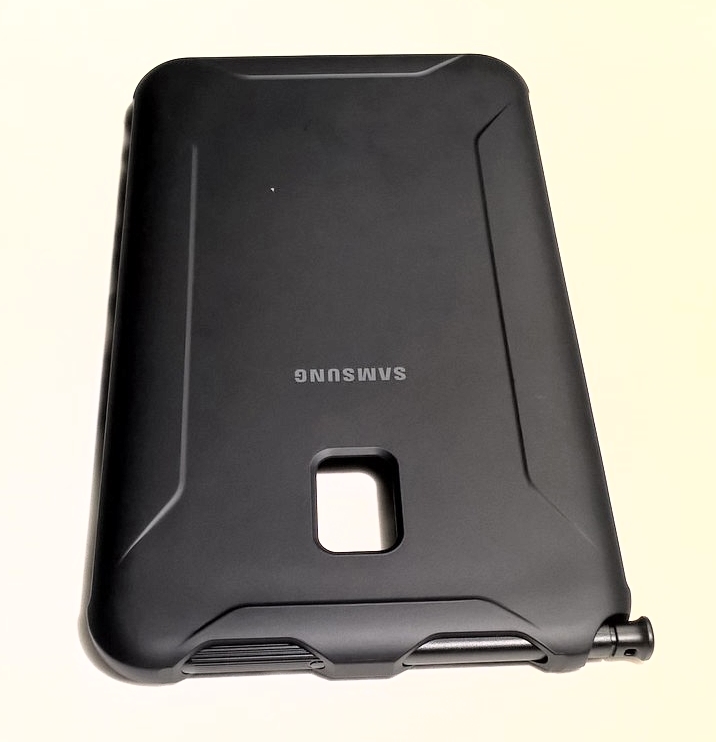
Bajo su endurecida y gruesa piel hay un tablet de gama media. Está equipado adecuadamente, y los posibles usuarios acabarán comprándolo por que no tiene competencia en uso en exteriores.
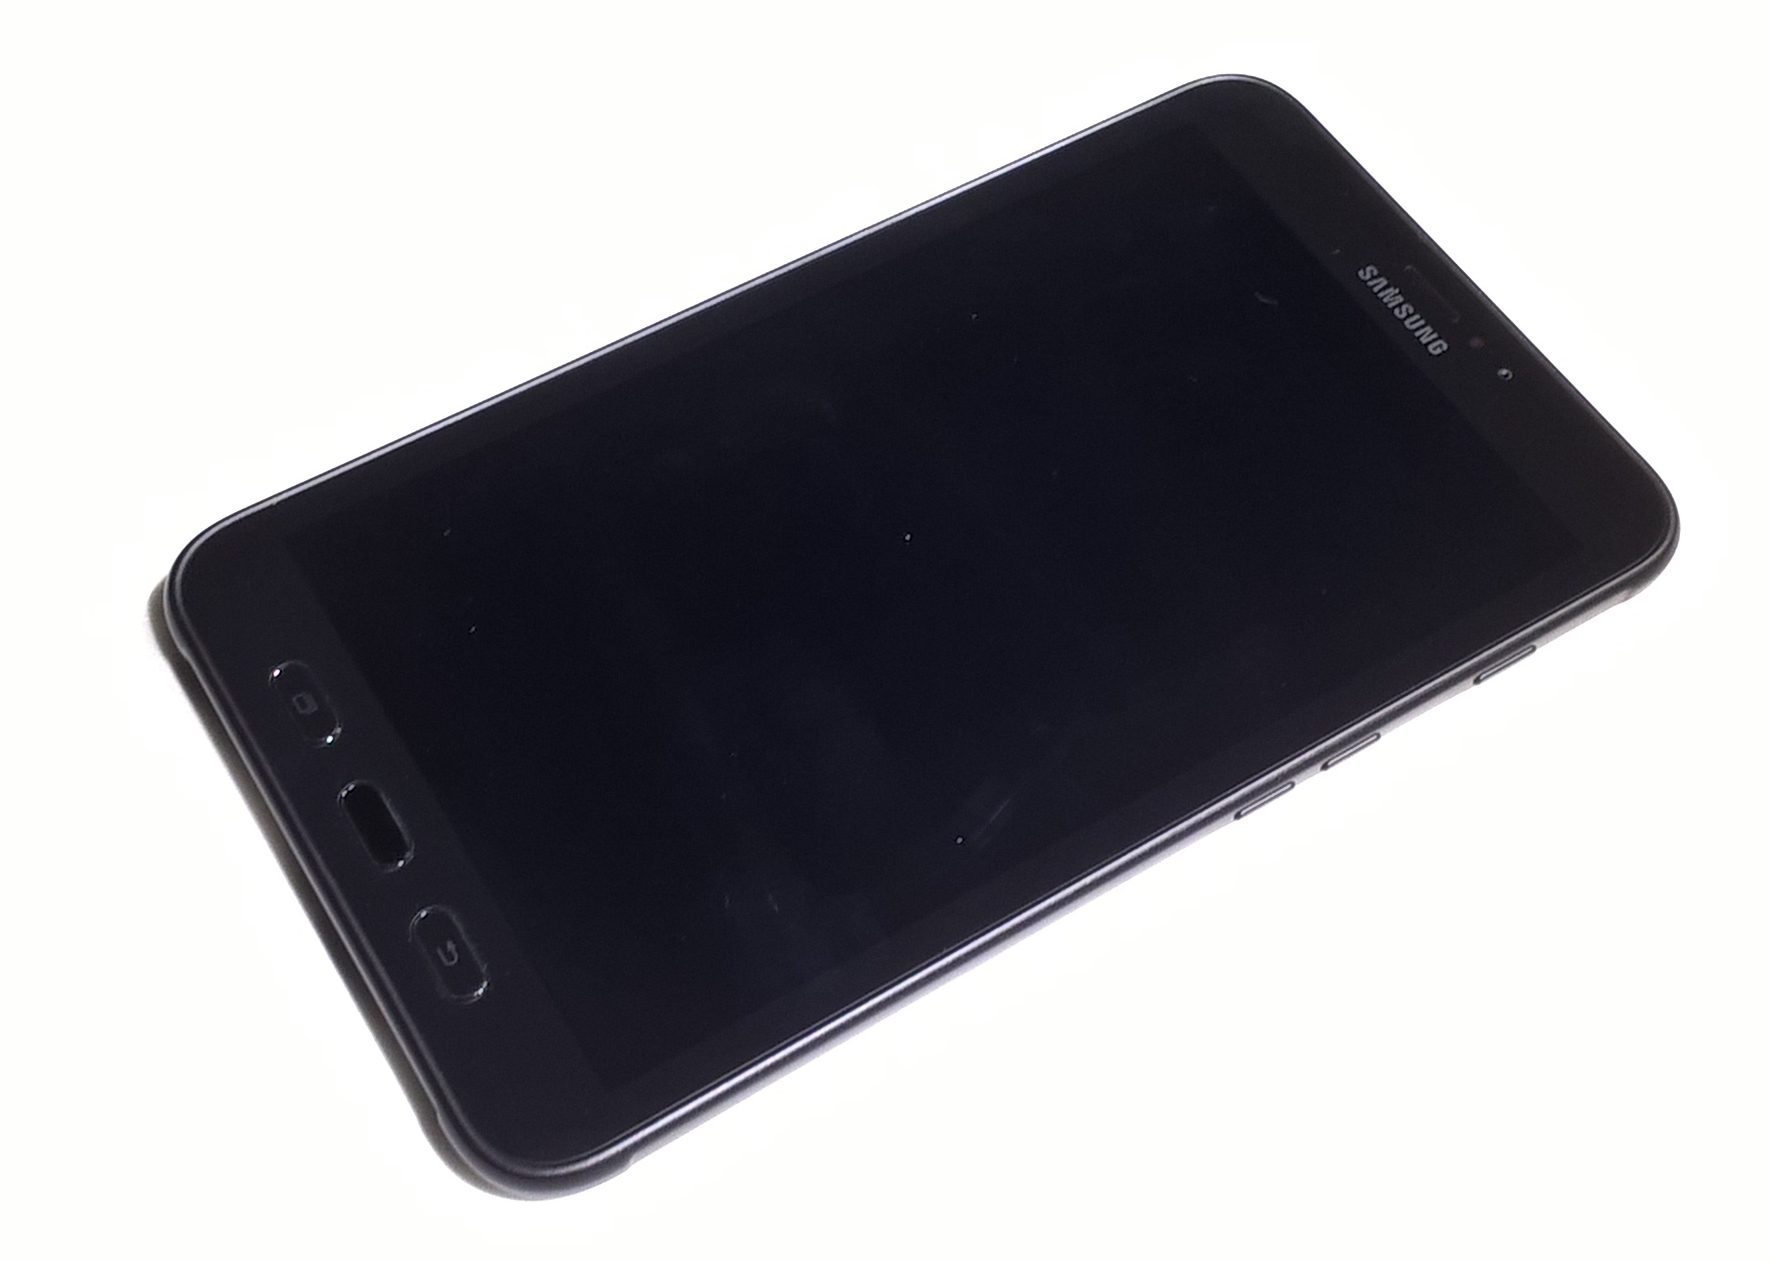
Que el Galaxy Tab Active 2 acabe o no siendo utilizable en un taller, garaje o sitio de construcción está por ver. Definitivamente es más resistente y robusto que muchos de sus competidores, y puede convertirse en un compañero fiel en excursiones en el campo. Aún con guantes es posible usar el display, y el lápiz S incluido da la opción de tener una entrada táctil muy precisa.
Ésta es una versión acortada del análisis original. Puedes leer el análisis completo en inglés aquí.
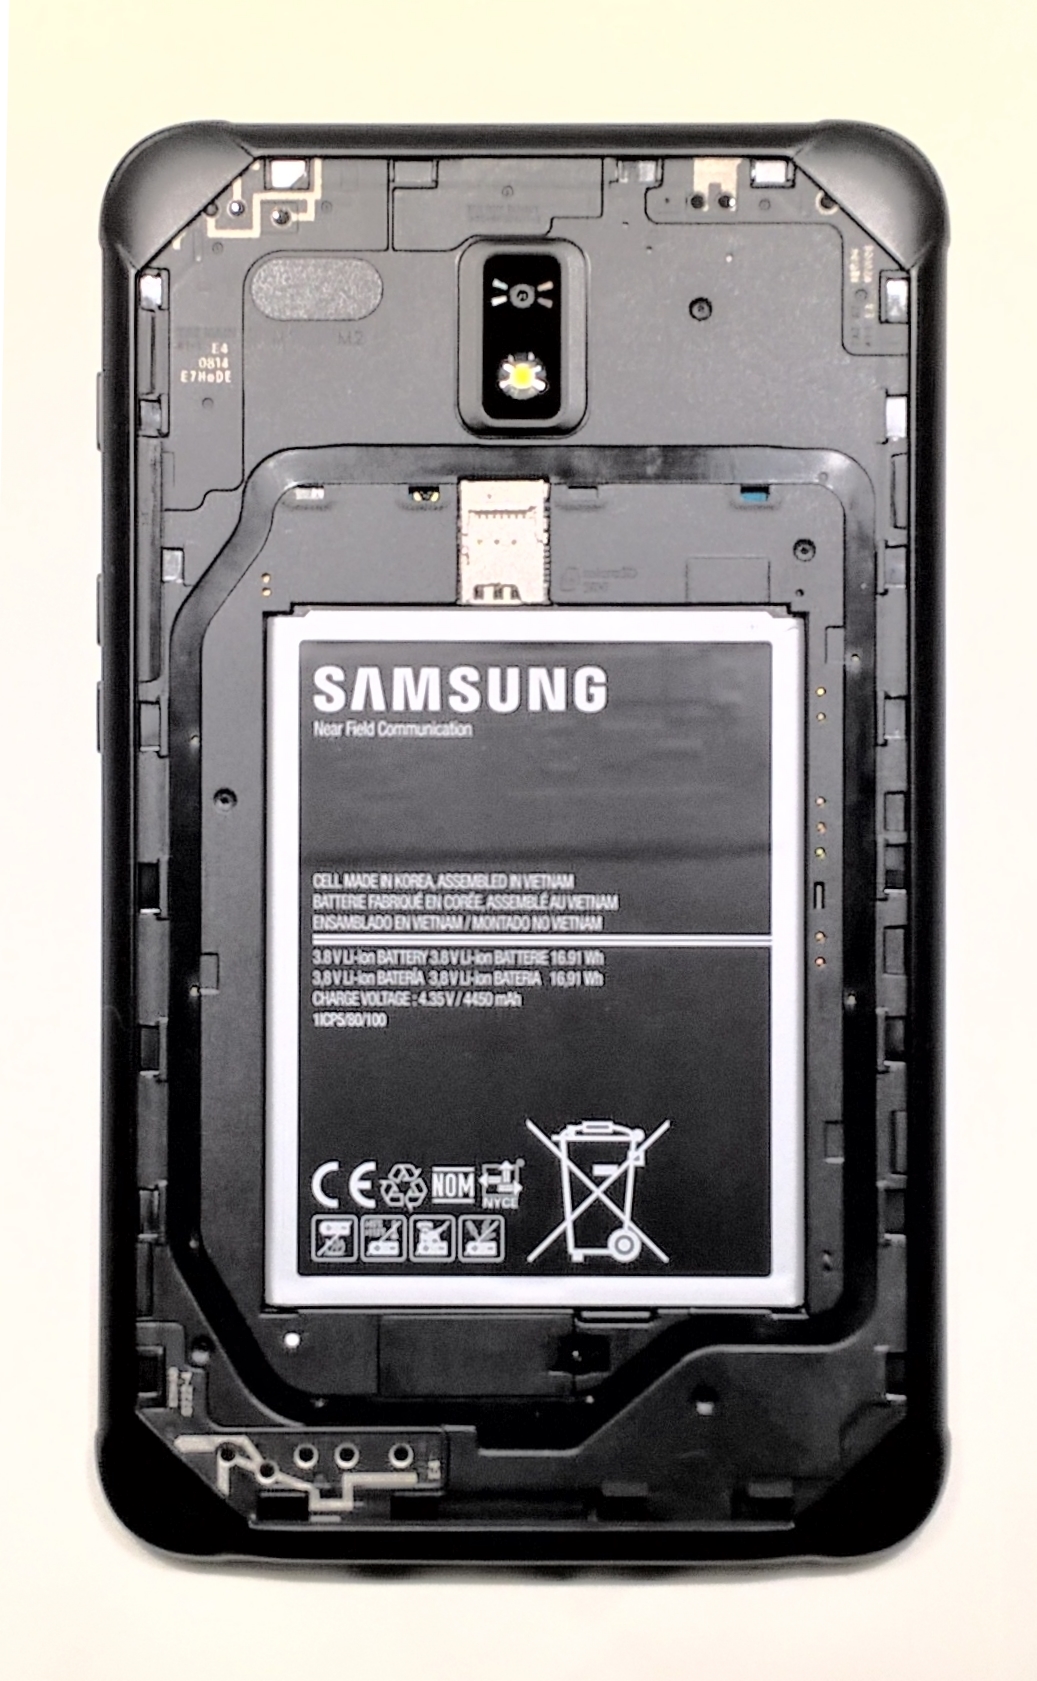
Samsung Galaxy Tab Active 2
-
12/22/2017 v6(old)
Mike Wobker
Pricecompare
