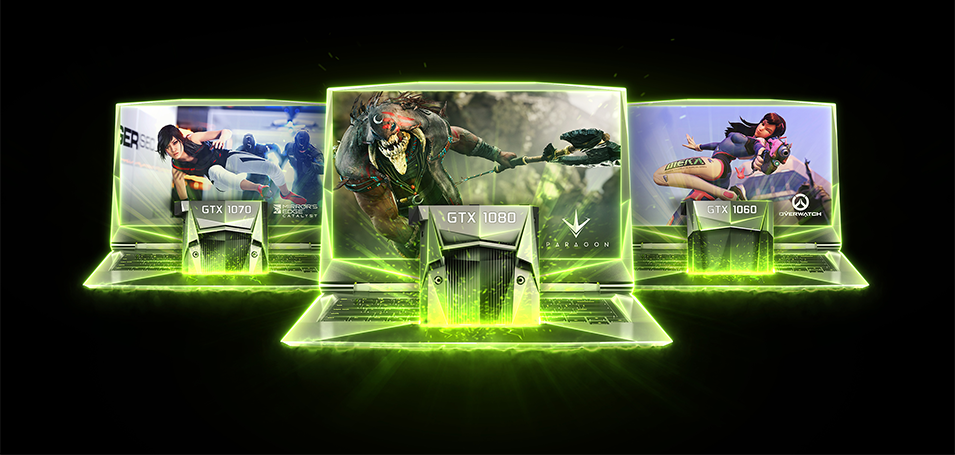
NVIDIA GeForce GTX 1070 Mobile
La Nvidia GeForce GTX 1070 es la segunda tarjeta de vídeo más veloz basada en Pascal de mediados de mayo de 2016. Viene en dos variantes, la versión de desktop (ver aquí la página de detalles) con 1920 shaders y la variante móvil con 2048 shaders y velocidades más bajas. Ambas tarjetas se basan en un chip GP104 reducido (como la GTX 1080) y producidas en 16 nm FinFET en TSMC.
Comparada con la GTX1080, la GTX1070 tiene menos núcleos CUDA (2048 versus 2560) que tienen una velocidad un poco inferior (Boost máximo de 1645 versus 1733). En vez de la nueva GDDR5X, la GTX 1070 utiliza memoria gráfica GDDR5 más lenta - pero aun 8 GB. El TDP también se reduce y se rumorea que es 10 Watts más alto que el predecesor, la GTX 980M.
Para computadoras portátiles delgadas y livianas, Nvidia ofrece una versión llamada Max-Q de la GTX 1070 con un TDP más bajo y también un rendimiento significativamente más bajo. Tristemente, esta variante se vende con el mismo nombre GTX 1070, lo que hace difícil evaluar el rendimiento.
El rendimiento depende de la solución de enfriamiento del portátil. Con un buen sistema de ventiladores, el rendimiento de la versión de portátil está a la par con la GTX 1070 de desktop (Edición de Fundadores). Sin embargo, Nvidia afirma que las soluciones de socios pueden ser hasta un 10 por ciento más lentas. En nuestros benchmarks con varios portátiles, el rendimiento osciló entre -5 y -14% de rendimiento más lento en comparación con los modelos asociados de los modelos de desktop GTX 1080 con velocidades ligeramente más altas.
En promedio, la GTX 1070 es aproximadamente un 20 por ciento más rápida que la antigua GeForce GTX 980 móvil y, por lo tanto, la segunda tarjeta gráfica móvil más rápida (sin SLI). Por lo tanto, admite WQHD y juegos 4K con configuraciones altas (ver benchmarks de juegos a continuación).
El chip GP104 es producido en el proceso de 16nm FinFET en TSMC y ofrece una gama de nuevos recursos. DisplayPort 1.4 (listo), HDMI 2.0b, HDR, Simultaneous Multi-Projection (SMP), codificadores y decodificadores de vídeos H.265 mejorados (parar PlayReady 3.0) son solo algunas de las mejoras. Lea nuestro detallado artículo de la arquitectura Pascal para más detalles.
El consumo de energía de la GTX 1070 se especifica con 115 vatios TGP según Nvidia y, por lo tanto, ligeramente por encima de la antigua GeForce GTX 980M. Esto lleva a portátiles de juegos bastante grandes y torpes que usan la GTX 1070. La versión Max-Q lanzada más tarde de la GTX 1070 utiliza solo 80 - 90 Watts TGP y por lo tanto es más adecuada para computadoras portátiles delgadas y livianas.
GeForce GTX 1000 Serie Nombre Código N17E-G2 Arquitectura Pascal Pipelines 2048 - unificado Velocidad del núcleo 1443 - 1645 (Boost) MHz Velocidad de Memoria 8000 MHz Ancho de Bus de Memoria 256 Bit Tipo de Memoria GDDR5 Max. Cantidad de Memoria 8 GB Memoria Compartida no API DirectX 12_1, OpenGL 4.5 Consumo de corriente 115 Watt Conteo de Transistores 7.2 Billion tecnología 16 nm Características Multi-Projection, VR Ready, G-SYNC, Vulkan, Multi Monitor Tamaño de la portátil grande Fecha de Anuncio 01.09.2016 Link a la Página del Fabricante NVIDIA GeForce GTX 1070 Mobile
Benchmarks Performance Rating - 3DMark 11 + Fire Strike + Time Spy
7.9 pt (24%)
...
NVIDIA GeForce GTX 1070 Mobile
...
max:
3DMark - 3DMark Time Spy Score
min: 4729 de promedio: 5253 mediana: 5268 (15%) max: 5773 Points
...
NVIDIA GeForce GTX 1070 Mobile
...
max:
3DMark - 3DMark Time Spy Graphics
min: 5145 de promedio: 5464 mediana: 5485 (15%) max: 5743 Points
...
NVIDIA GeForce GTX 1070 Mobile
...
max:
3DMark - 3DMark Ice Storm Unlimited Graphics
min: 246743 de promedio: 341959 mediana: 338057 (38%) max: 410191 Points
...
NVIDIA GeForce GTX 1050 Max-Q
NVIDIA GeForce GTX 1050 Ti Max-Q
NVIDIA Quadro P2000 Max-Q
AMD Radeon 680M
NVIDIA GeForce GTX 1070 Mobile
...
max:
3DMark - 3DMark Ice Storm Extreme Graphics
min: 116033 de promedio: 225792 mediana: 235672 (30%) max: 368933 Points
...
NVIDIA GeForce GTX 1070 Mobile
...
max:
3DMark - 3DMark Cloud Gate Score
min: 22639 de promedio: 28539 mediana: 27920 (30%) max: 37519 Points
...
NVIDIA Quadro P4000 Max-Q
NVIDIA GeForce GTX 1070 Mobile
AMD Radeon 680M
AMD Radeon Pro Vega 16
...
max:
3DMark - 3DMark Cloud Gate Graphics
min: 64973 de promedio: 99208 mediana: 101041 (27%) max: 125922 Points
...
NVIDIA GeForce GTX 1070 Mobile
NVIDIA GeForce RTX 2070 Super Max-Q
...
max:
3DMark - 3DMark Fire Strike Standard Score
min: 11779 de promedio: 13906 mediana: 13797.5 (24%) max: 15909 Points
...
NVIDIA Quadro P4200
NVIDIA GeForce GTX 1070 Mobile
...
max:
3DMark - 3DMark Fire Strike Standard Graphics
min: 15718 de promedio: 17228 mediana: 17236.5 (19%) max: 19059 Points
...
NVIDIA GeForce GTX 1070 Mobile
...
max:
3DMark - 3DMark Ice Storm Graphics
min: 117135 de promedio: 258682 mediana: 266175 (32%) max: 424321 Points
...
NVIDIA GeForce GTX 1070 Mobile
AMD Radeon RX 580 (Laptop)
...
max:
3DMark 11 - 3DM11 Performance Score
min: 11913 de promedio: 16930 mediana: 16939.5 (23%) max: 19481 Points
...
NVIDIA GeForce GTX 1070 Mobile
...
max:
3DMark 11 - 3DM11 Performance GPU
min: 13760 de promedio: 22405 mediana: 22575.5 (19%) max: 25604 Points
...
NVIDIA GeForce GTX 1070 Mobile
...
max:
3DMark Vantage + 3DMark Vantage - 3DM Vant. Perf. total
34389 Points (10%)
...
NVIDIA Quadro P2000 Max-Q
NVIDIA GeForce GTX 1070 Mobile
AMD Radeon RX 5300M
...
max:
3DM Vant. Perf. GPU no PhysX + 3DMark Vantage - 3DM Vant. Perf. GPU no PhysX
40134 Points (23%)
...
AMD Radeon RX 5300M
NVIDIA GeForce GTX 1070 Mobile
...
max:
3DMark 03 - 3DMark 03 - Standard
141639 Points (74%)
VIA S3 Graphics ProSavage8
...
NVIDIA GeForce GTX 1070 Mobile
3DMark 05 - 3DMark 05 - Standard
33386 Points (37%)
...
Intel UHD Graphics Xe 32EUs (Tiger Lake-H)
NVIDIA GeForce GTX 1070 Mobile
AMD Radeon RX Vega 7
...
max:
3DMark 06 3DMark 06 - Standard 1280x1024 +
min: 25589 de promedio: 32403 mediana: 31045 (41%) max: 40048 Points
...
NVIDIA Quadro P2000 Max-Q
NVIDIA GeForce GTX 1070 Mobile
...
max:
Unigine Valley 1.0 - Unigine Valley 1.0 DX
min: 79.3 de promedio: 82.5 mediana: 82.5 (27%) max: 85.7 fps
...
NVIDIA GeForce GTX 1070 Mobile
...
max:
SPECviewperf 11 + SPECviewperf 11 - specvp11 snx-01
min: 11.81 de promedio: 13.3 mediana: 13.2 (8%) max: 14.35 fps
...
AMD Radeon R7 M340
NVIDIA GeForce GTX 1070 Mobile
...
specvp11 tcvis-02 + SPECviewperf 11 - specvp11 tcvis-02
min: 3.4 de promedio: 4 mediana: 4 (2%) max: 4.5 fps
...
NVIDIA GeForce GTX 1070 Mobile
Intel HD Graphics 630
AMD Radeon HD 6730M
AMD Radeon R7 M340
...
specvp11 sw-02 + SPECviewperf 11 - specvp11 sw-02
min: 19.74 de promedio: 23.7 mediana: 24.2 (18%) max: 26.19 fps
...
AMD Radeon R7 M340
Intel HD Graphics 630
NVIDIA GeForce GTX 1070 Mobile
AMD FirePro W5130M
...
specvp11 proe-05 + SPECviewperf 11 - specvp11 proe-05
min: 2.74 de promedio: 3.3 mediana: 3.4 (4%) max: 3.66 fps
...
Intel HD Graphics 630
AMD Radeon R7 M260
NVIDIA GeForce GTX 1070 Mobile
AMD Radeon R7 M340
AMD FirePro W5130M
...
specvp11 maya-03 + SPECviewperf 11 - specvp11 maya-03
min: 23.15 de promedio: 27.1 mediana: 27.5 (21%) max: 31.3 fps
...
NVIDIA GeForce GTX 1050 Ti Mobile
Intel HD Graphics 630
NVIDIA GeForce GTX 1070 Mobile
...
max:
AMD Radeon Pro Vega 56
specvp11 lightwave-01 + SPECviewperf 11 - specvp11 lightwave-01
min: 22.15 de promedio: 26.6 mediana: 26.7 (29%) max: 29.62 fps
...
AMD Radeon HD 6730M
Intel HD Graphics 630
NVIDIA GeForce GTX 1070 Mobile
AMD FirePro W5130M
...
max:
AMD Radeon Pro Vega 56
specvp11 ensight-04 + SPECviewperf 11 - specvp11 ensight-04
min: 73 de promedio: 140.2 mediana: 140.2 (67%) max: 209.3 fps
...
NVIDIA GeForce GTX 1070 Mobile
specvp11 catia-03 + SPECviewperf 11 - specvp11 catia-03
min: 21.98 de promedio: 24.6 mediana: 23.4 (12%) max: 28.99 fps
...
NVIDIA GeForce GTX 1070 Mobile
AMD FirePro W4190M
...
SPECviewperf 12 + SPECviewperf 12 - specvp12 sw-03
min: 39.93 de promedio: 47.6 mediana: 50.7 (13%) max: 52.5 fps
...
AMD Radeon Pro 455
NVIDIA GeForce GTX 1070 Mobile
AMD Radeon Pro 555
NVIDIA Quadro M600M
...
max:
specvp12 snx-02 + SPECviewperf 12 - specvp12 snx-02
min: 7.1 de promedio: 7.6 mediana: 7.5 (1%) max: 8.38 fps
...
NVIDIA GeForce GTX 1070 Mobile
AMD Radeon RX Vega 10
...
max:
specvp12 showcase-01 + SPECviewperf 12 - specvp12 showcase-01
min: 70.7 de promedio: 83.7 mediana: 80.8 (18%) max: 94.9 fps
...
NVIDIA GeForce GTX 1070 Mobile
...
max:
specvp12 mediacal-01 + SPECviewperf 12 - specvp12 mediacal-01
min: 37.56 de promedio: 40.1 mediana: 39.8 (10%) max: 42.81 fps
...
NVIDIA GeForce GTX 1070 Mobile
NVIDIA Quadro P4000 Max-Q
...
max:
specvp12 maya-04 + SPECviewperf 12 - specvp12 maya-04
min: 68.9 de promedio: 91.3 mediana: 78.1 (21%) max: 129.1 fps
...
NVIDIA GeForce GTX 1070 Mobile
...
max:
specvp12 energy-01 + SPECviewperf 12 - specvp12 energy-01
min: 7.48 de promedio: 8.3 mediana: 8.3 (7%) max: 8.9 fps
...
NVIDIA GeForce GTX 1070 Mobile
AMD Radeon RX Vega 7
...
AMD Radeon 660M
max:
specvp12 creo-01 + SPECviewperf 12 - specvp12 creo-01
min: 41.42 de promedio: 47.4 mediana: 47 (19%) max: 53.9 fps
...
AMD Radeon 680M
NVIDIA GeForce GTX 1070 Mobile
NVIDIA Quadro P2000 Max-Q
...
max:
specvp12 catia-04 + SPECviewperf 12 - specvp12 catia-04
min: 70.4 de promedio: 72.6 mediana: 72.3 (12%) max: 74.5 fps
...
AMD Radeon Pro WX Vega M GL
NVIDIA Quadro P2000 Max-Q
AMD Radeon 680M
NVIDIA GeForce GTX 1070 Mobile
AMD Radeon RX 580 (Laptop)
...
max:
Cinebench R10 Cinebench R10 Shading (32bit) + Cinebench R10 - Cinebench R10 Shading (32bit)
min: 464.7 de promedio: 8521 mediana: 7504 (5%) max: 14797 puntos
...
AMD Radeon Pro WX 3100
NVIDIA GeForce GTX 1070 Mobile
...
Cinebench R11.5 Cinebench R11.5 OpenGL 64 Bit + Cinebench R11.5 - Cinebench R11.5 OpenGL 64 Bit
min: 50.7 de promedio: 71.7 mediana: 71 (25%) max: 89.8 fps
...
NVIDIA GeForce GTX 1050 Ti Max-Q
NVIDIA GeForce GTX 1070 Mobile
NVIDIA Quadro P500
AMD Radeon RX 560X (Laptop)
AMD Radeon Pro 560
...
max:
Cinebench R15 + Cinebench R15 - Cinebench R15 OpenGL 64 Bit
min: 75.7 de promedio: 116.4 mediana: 112.3 (7%) max: 159.3 fps
...
AMD Radeon RX 5300M
AMD Radeon Pro 460
NVIDIA GeForce GTX 1070 Mobile
AMD Radeon 660M
...
Cinebench R15 OpenGL Ref. Match 64 Bit + Cinebench R15 - Cinebench R15 OpenGL Ref. Match 64 Bit
99.6 % (100%)
...
NVIDIA Quadro P4000 Max-Q
NVIDIA GeForce GTX 1070 Mobile
...
GFXBench 3.0 - GFXBench 3.0 Manhattan Offscreen
298.5 fps (17%)
...
NVIDIA GeForce GTX 1050 Ti Max-Q
NVIDIA GeForce GTX 1070 Mobile
NVIDIA GeForce GTX 1050 Ti Mobile
Apple M1 8-Core GPU
...
LuxMark v2.0 64Bit - LuxMark v2.0 Room GPU
min: 2277 de promedio: 2849 mediana: 2409 (11%) max: 4730 Samples/s
...
NVIDIA GeForce GTX 1070 Mobile
...
max:
4x NVIDIA RTX A6000
LuxMark v2.0 64Bit - LuxMark v2.0 Sala GPU
min: 2419 de promedio: 3972 mediana: 4097 (7%) max: 4706 Samples/s
...
AMD Radeon RX 5300M
NVIDIA GeForce GTX 1070 Mobile
NVIDIA Quadro P4000 Max-Q
...
max:
4x NVIDIA RTX A6000
ComputeMark v2.1 - ComputeMark v2.1 Result
min: 1350 de promedio: 11365 mediana: 12369.5 (13%) max: 13299 puntos
...
NVIDIA GeForce GTX 1070 Mobile
NVIDIA GeForce RTX 2070 Super Max-Q
...
max:
Power Consumption - Witcher 3 Power Consumption *
min: 154 de promedio: 178.6 mediana: 179.5 (39%) max: 206 Watt
...
NVIDIA GeForce GTX 1070 Mobile
NVIDIA GeForce RTX 2070 Super Mobile
AMD Radeon RX 580 (Laptop)
...
Power Consumption - Witcher 3 ultra Power Efficiency
min: 0.251 de promedio: 0.3 mediana: 0.3 (33%) max: 0.3735 fps per Watt
...
AMD Radeon RX Vega 7
NVIDIA Quadro P2000 Max-Q
NVIDIA GeForce GTX 1070 Mobile
...
Apple M2 10-Core GPU
Emissions Witcher 3 Fan Noise + Emissions - Witcher 3 Fan Noise
min: 37.6 de promedio: 47.7 mediana: 49 (78%) max: 54 dB(A)
...
AMD Radeon Pro WX Vega M GL
NVIDIA GeForce GTX 1070 Mobile
AMD Radeon RX 5300M
...
Clock Speed - GPU Clock Witcher 3 ultra
min: 1544 de promedio: 1664 mediana: 1670 (65%) max: 1797 MHz
...
NVIDIA Quadro P600
NVIDIA GeForce GTX 1070 Mobile
NVIDIA GeForce GTX 1050 Ti Mobile
AMD Radeon 680M
NVIDIA GeForce RTX 2080 Super Mobile
...
Clock Speed - GPU Clock Speed Furmark
1265 MHz (50%)
...
NVIDIA GeForce GTX 1070 Mobile
NVIDIA Quadro P500
NVIDIA Quadro P600
...
max:
AMD Radeon RX 6700 XT
- Gama de valores de las pruebas para esta tarjeta gráfica
- Valores medios de las pruebas para esta tarjeta gráfica
* Smaller numbers mean a higher performance
Pruebas de juegos Los siguientes benchmarks se derivan de nuestros benchmarks de los portátiles de análisis. El rendimiento depende de la memoria gráfica utilizada, velocidad de reloj, procesador, configuración del sistema, controladores y sistemas operativos. Así que los resultados no tienen que ser representativos de todos los portátiles con esta GPU. Para información más detallada sobre los resultados del benchmark, haga clic en el número de fps.
...
NVIDIA GeForce GTX 1070 Mobile
NVIDIA GeForce RTX 2070 Super Max-Q
...
max:
0 100 200 300 400 500 600 700 800 900 1000 1100 1200 1300 1400 1500 1600 1700 1800 1900 2000 2100 2200 2300 2400 2500 2600 2700 2800 2900 3000 3100 3200 3300 3400 3500 3600 3700 3800 3900 4000 4100 4200 4300 4400 4500 4600 4700 4800 4900 5000 5100 5200 5300 5400 5500 5600 5700 5800 5900 6000 6100 6200 6300 Tooltip
...
NVIDIA GeForce GTX 1070 Mobile
...
max:
...
NVIDIA GeForce GTX 1070 Mobile
NVIDIA GeForce RTX 2070 Super Max-Q
...
max:
NVIDIA GeForce GTX 1070 Mobile
...
max:
NVIDIA GeForce GTX 1070 Mobile
...
max:
» Jugable con todos los portátiles probados en ajustes de detalle ultra.
Additional Benchmarks
Low Preset 1920x1080
63.1 [X] Asus G752VS Intel Core i7-6820HK 2.7GHz
GeForce GTX 1070 Mobile
min:
11.6 fps, P0.1:
41.9 fps, P1:
48.5 fps, max:
125 fps
Intel UHD Graphics G1 (Ice Lake 32 EU)
...
NVIDIA GeForce GTX 1070 Mobile
...
max:
...
NVIDIA GeForce GTX 1070 Mobile
...
max:
...
NVIDIA GeForce GTX 1070 Mobile
...
max:
NVIDIA GeForce GTX 1070 Mobile
...
max:
NVIDIA GeForce GTX 1070 Mobile
max:
» Jugable con todos los portátiles probados en ajustes de detalle ultra.
...
NVIDIA GeForce GTX 1070 Mobile
NVIDIA GeForce RTX 2070 Super Max-Q
...
Intel UHD Graphics Xe 32EUs (Tiger Lake-H)
...
NVIDIA GeForce GTX 1070 Mobile
NVIDIA GeForce RTX 2070 Super Max-Q
NVIDIA GeForce RTX 2070 Super Mobile
...
...
NVIDIA GeForce GTX 1070 Mobile
NVIDIA GeForce RTX 2070 Super Max-Q
NVIDIA GeForce RTX 2070 Super Mobile
...
...
NVIDIA GeForce GTX 1070 Mobile
NVIDIA GeForce RTX 2070 Super Mobile
...
NVIDIA GeForce GTX 1070 Mobile
NVIDIA GeForce RTX 2070 Super Mobile
...
max:
» Jugable con todos los portátiles probados en ajustes de detalle ultra.
0 100 200 300 400 500 600 700 Tooltip
...
NVIDIA GeForce GTX 1050 Ti Mobile
NVIDIA GeForce GTX 1070 Mobile
NVIDIA GeForce RTX 2070 Super Max-Q
NVIDIA GeForce RTX 2070 Super Mobile
...
max:
...
NVIDIA GeForce GTX 1050 Ti Mobile
NVIDIA GeForce GTX 1070 Mobile
NVIDIA GeForce RTX 2070 Super Max-Q
...
max:
NVIDIA GeForce GTX 1050 Ti Mobile
NVIDIA GeForce GTX 1070 Mobile
NVIDIA GeForce RTX 2070 Super Max-Q
NVIDIA GeForce RTX 2070 Super Mobile
...
max:
NVIDIA GeForce GTX 1070 Mobile
NVIDIA GeForce RTX 2070 Super Mobile
max:
NVIDIA GeForce GTX 1070 Mobile
NVIDIA GeForce RTX 2070 Super Mobile
max:
» Jugable con todos los portátiles probados en ajustes de detalle ultra.
Additional Benchmarks
Highest Settings + Ultra Ray Tracing 1920x1080
15.3 [X] Asus G752VS Intel Core i7-6820HK 2.7GHz
GeForce GTX 1070 Mobile
min:
11.1 fps, P0.1:
11.5 fps, P1:
11.8 fps, max:
27.4 fps
...
NVIDIA GeForce GTX 1070 Mobile
NVIDIA GeForce RTX 2070 Super Max-Q
NVIDIA GeForce RTX 2070 Super Mobile
...
max:
...
NVIDIA GeForce GTX 1070 Mobile
NVIDIA GeForce RTX 2070 Super Max-Q
NVIDIA GeForce RTX 2070 Super Mobile
...
max:
...
AMD Radeon 680M
NVIDIA GeForce GTX 1070 Mobile
NVIDIA GeForce RTX 2070 Super Max-Q
...
max:
...
NVIDIA GeForce GTX 1070 Mobile
...
max:
NVIDIA GeForce GTX 1070 Mobile
...
max:
» Jugable con todos los portátiles probados en ajustes de detalle ultra.
...
AMD Radeon 680M
NVIDIA GeForce GTX 1070 Mobile
...
max:
...
AMD Radeon 680M
NVIDIA GeForce GTX 1070 Mobile
...
max:
...
AMD Radeon RX 560X (Laptop)
AMD Radeon 680M
NVIDIA GeForce GTX 1070 Mobile
...
max:
NVIDIA GeForce GTX 1070 Mobile
...
max:
NVIDIA GeForce GTX 1070 Mobile
NVIDIA GeForce RTX 2070 Super Mobile
...
max:
» Jugable con todos los portátiles probados en ajustes de detalle alto.
Intel UHD Graphics Xe 16EUs (Tiger Lake-H)
...
NVIDIA GeForce GTX 1070 Mobile
...
max:
...
NVIDIA GeForce GTX 1070 Mobile
...
max:
...
NVIDIA GeForce GTX 1070 Mobile
...
max:
...
NVIDIA GeForce GTX 1070 Mobile
...
max:
NVIDIA GeForce GTX 1070 Mobile
NVIDIA GeForce RTX 2070 Super Mobile
...
max:
» Jugable con todos los portátiles probados en ajustes de detalle ultra.
Additional Benchmarks
Ultra Preset + Ultra Ray Tracing (DX12) 1920x1080
14.2 [X] Asus G752VS Intel Core i7-6820HK 2.7GHz
GeForce GTX 1070 Mobile
min:
7.22 fps, P1:
10.27 fps, max:
27.41 fps
0 100 200 Tooltip 1.5.4.5: Ø162.9 (136.222-278)
...
Intel UHD Graphics Xe 32EUs (Tiger Lake-H)
Intel Iris Plus Graphics G7 (Ice Lake 64 EU)
AMD Radeon RX Vega 7
NVIDIA GeForce GTX 1070 Mobile
NVIDIA GeForce GTX 1050 Ti Mobile
...
max:
0 100 Tooltip 1.5.4.5: Ø154.6 (137.016-181.8)
...
AMD Radeon RX Vega 7
NVIDIA GeForce GTX 1050 Ti Mobile
NVIDIA GeForce GTX 1070 Mobile
...
max:
0 100 Tooltip 1.5.4.5: Ø151.9 (138.432-196.6)
...
AMD Radeon RX Vega 7
NVIDIA GeForce GTX 1050 Ti Mobile
NVIDIA GeForce GTX 1070 Mobile
...
NVIDIA GeForce RTX 2080 Super Mobile
max:
0 100 Tooltip 1.5.4.5: Ø148.6 (136.308-162.07)
...
AMD Radeon RX Vega 7
NVIDIA GeForce GTX 1050 Ti Mobile
NVIDIA GeForce GTX 1070 Mobile
...
NVIDIA GeForce RTX 2080 Super Mobile
max:
0 100 200 300 400 500 600 Tooltip 1.5.4.5: Ø158.5 (120.83-631)
...
NVIDIA GeForce GTX 1050 Ti Mobile
NVIDIA GeForce GTX 1070 Mobile
...
NVIDIA GeForce RTX 2080 Super Mobile
max:
0 100 200 Tooltip 1.5.4.5: Ø135.8 (124.262-229.2)
...
NVIDIA GeForce GTX 1070 Mobile
NVIDIA GeForce RTX 2080 Super Mobile
max:
» Jugable con todos los portátiles probados en ajustes de detalle ultra.
0 100 200 300 400 500 600 700 800 Tooltip 1.5.4.5: Ø254 (175.513-847)
...
AMD Radeon 660M
AMD Radeon RX 560X (Laptop)
AMD Radeon 680M
NVIDIA GeForce GTX 1050 Ti Mobile
NVIDIA GeForce GTX 1070 Mobile
NVIDIA GeForce RTX 2070 Super Mobile
...
max:
0 100 200 Tooltip 1.5.4.5: Ø186.4 (163.782-210.9)
...
NVIDIA GeForce GTX 1070 Mobile
NVIDIA GeForce RTX 2070 Super Mobile
...
max:
0 100 Tooltip 1.5.4.5: Ø168.5 (142.402-193.4)
...
NVIDIA GeForce GTX 1070 Mobile
NVIDIA GeForce RTX 2070 Super Mobile
...
max:
0 100 Tooltip 1.5.4.5: Ø167.9 (144.088-190.1)
...
NVIDIA GeForce GTX 1070 Mobile
NVIDIA GeForce RTX 2070 Super Mobile
...
max:
0 100 Tooltip 1.5.4.5: Ø111.1 (91.166-152.8)
...
NVIDIA GeForce GTX 1050 Ti Mobile
NVIDIA GeForce GTX 1070 Mobile
...
max:
0 100 Tooltip 1.5.4.5: Ø64.6 (53.088-114.9)
NVIDIA GeForce GTX 1050 Ti Mobile
NVIDIA GeForce GTX 1070 Mobile
...
max:
» Jugable con todos los portátiles probados en ajustes de detalle ultra.
0 100 200 Tooltip 1.5.4.5: Ø119.4 (91.48-275)
...
NVIDIA GeForce GTX 1050 Ti Mobile
NVIDIA GeForce GTX 1070 Mobile
NVIDIA GeForce RTX 2070 Super Mobile
...
max:
0 100 200 300 400 500 600 700 800 900 1000 1100 1200 1300 1400 1500 1600 1700 1800 1900 2000 2100 2200 2300 2400 2500 2600 2700 2800 2900 3000 3100 3200 3300 3400 3500 3600 3700 3800 3900 4000 4100 4200 4300 4400 4500 4600 4700 4800 4900 5000 5100 5200 5300 5400 5500 5600 5700 5800 5900 6000 6100 6200 6300 6400 6500 6600 6700 6800 6900 7000 7100 7200 7300 7400 7500 7600 7700 7800 7900 8000 8100 8200 8300 8400 8500 8600 8700 8800 8900 9000 9100 9200 9300 9400 9500 9600 9700 9800 9900 Tooltip 1.5.4.5: Ø4366883210188 (70.227-1.5284091235396E+14)
Intel UHD Graphics G1 (Ice Lake 32 EU)
...
NVIDIA GeForce GTX 1070 Mobile
NVIDIA GeForce RTX 2070 Super Mobile
...
max:
0 100 200 300 400 Tooltip 1.5.4.5: Ø87.1 (67.081-469)
...
NVIDIA GeForce GTX 1070 Mobile
...
max:
0 Tooltip 1.5.4.5: Ø51.1 (46.036-78.1)
...
NVIDIA GeForce GTX 1070 Mobile
...
max:
0 100 Tooltip 1.5.4.5: Ø34.2 (23.019-197)
NVIDIA GeForce GTX 1050 Ti Mobile
...
NVIDIA GeForce GTX 1070 Mobile
...
max:
» Jugable con todos los portátiles probados en ajustes de detalle alto.
...
AMD Radeon RX Vega 7
AMD Radeon RX 560X (Laptop)
NVIDIA GeForce GTX 1070 Mobile
AMD Radeon 680M
AMD Radeon 660M
...
max:
...
AMD Radeon RX 560X (Laptop)
NVIDIA GeForce GTX 1050 Ti Mobile
NVIDIA GeForce GTX 1070 Mobile
...
max:
...
AMD Radeon 660M
NVIDIA GeForce GTX 1070 Mobile
...
NVIDIA GeForce RTX 2080 Super Mobile
max:
...
NVIDIA GeForce GTX 1070 Mobile
NVIDIA GeForce RTX 2070 Super Max-Q
...
max:
...
NVIDIA GeForce GTX 1070 Mobile
NVIDIA GeForce RTX 2070 Super Mobile
...
max:
» Jugable con todos los portátiles probados en ajustes de detalle ultra.
...
NVIDIA GeForce GTX 1070 Mobile
...
max:
...
NVIDIA GeForce GTX 1070 Mobile
...
max:
...
NVIDIA GeForce GTX 1070 Mobile
...
max:
NVIDIA GeForce GTX 1070 Mobile
...
max:
NVIDIA GeForce GTX 1070 Mobile
...
max:
» Jugable con todos los portátiles probados en ajustes de detalle ultra.
0 Tooltip 1.5.4.5: Ø57.2 (5.91-70.5)
Intel UHD Graphics Xe 16EUs (Tiger Lake-H)
...
NVIDIA GeForce GTX 1050 Ti Mobile
AMD Radeon RX 560X (Laptop)
NVIDIA GeForce GTX 1070 Mobile
NVIDIA GeForce RTX 2070 Super Mobile
...
0 Tooltip 1.5.4.5: Ø53.4 (6.22-66.2)
AMD Radeon RX Vega 8 (Ryzen 2000/3000)
...
NVIDIA GeForce GTX 1070 Mobile
NVIDIA GeForce RTX 2070 Super Mobile
...
0 Tooltip 1.5.4.5: Ø40.6 (6.26-51.1)
...
NVIDIA GeForce GTX 1070 Mobile
NVIDIA GeForce RTX 2070 Super Mobile
...
...
NVIDIA GeForce GTX 1070 Mobile
NVIDIA GeForce RTX 2070 Super Mobile
...
0 Tooltip 1.5.4.5: Ø20.9 (9.36-37.8)
NVIDIA GeForce GTX 1050 Ti Mobile
NVIDIA GeForce GTX 1070 Mobile
NVIDIA GeForce RTX 2080 Super Mobile
...
NVIDIA GeForce GTX 1050 Ti Mobile
NVIDIA GeForce GTX 1070 Mobile
NVIDIA GeForce RTX 2080 Super Mobile
...
» Jugable con todos los portátiles probados en ajustes de detalle alto.
...
NVIDIA GeForce GTX 1050 Ti Mobile
AMD Radeon 680M
NVIDIA GeForce GTX 1070 Mobile
...
max:
Intel UHD Graphics Xe 16EUs (Tiger Lake-H)
...
NVIDIA GeForce GTX 1070 Mobile
...
max:
...
NVIDIA GeForce GTX 1070 Mobile
...
max:
...
NVIDIA GeForce GTX 1070 Mobile
...
max:
...
NVIDIA GeForce GTX 1070 Mobile
...
max:
NVIDIA GeForce GTX 1050 Ti Mobile
NVIDIA GeForce GTX 1070 Mobile
...
max:
» Jugable con todos los portátiles probados en ajustes de detalle ultra.
...
AMD Radeon 680M
NVIDIA GeForce GTX 1070 Mobile
NVIDIA GeForce RTX 2070 Super Mobile
...
max:
AMD Radeon RX 6700 XT
...
NVIDIA GeForce GTX 1070 Mobile
NVIDIA GeForce RTX 2070 Super Max-Q
...
max:
...
NVIDIA GeForce GTX 1070 Mobile
NVIDIA GeForce RTX 2070 Super Max-Q
...
max:
...
NVIDIA GeForce GTX 1070 Mobile
NVIDIA GeForce RTX 2070 Super Max-Q
...
max:
...
NVIDIA GeForce GTX 1070 Mobile
NVIDIA GeForce RTX 2070 Super Mobile
...
max:
NVIDIA GeForce GTX 1050 Ti Mobile
NVIDIA GeForce GTX 1070 Mobile
NVIDIA GeForce RTX 2070 Super Mobile
...
max:
» Jugable con todos los portátiles probados en ajustes de detalle ultra.
...
AMD Radeon 680M
NVIDIA GeForce GTX 1050 Ti Mobile
NVIDIA GeForce GTX 1070 Mobile
...
max:
...
NVIDIA GeForce RTX 2070 Super Max-Q
NVIDIA GeForce RTX 2070 Super Mobile
NVIDIA GeForce GTX 1070 Mobile
NVIDIA GeForce RTX 2080 Super Mobile
...
max:
...
NVIDIA GeForce RTX 2070 Super Max-Q
NVIDIA GeForce RTX 2070 Super Mobile
NVIDIA GeForce GTX 1070 Mobile
...
max:
...
NVIDIA GeForce GTX 1070 Mobile
NVIDIA GeForce RTX 2070 Super Max-Q
...
max:
...
NVIDIA GeForce GTX 1070 Mobile
...
max:
...
NVIDIA GeForce GTX 1070 Mobile
...
max:
» Jugable con todos los portátiles probados en ajustes de detalle ultra.
...
NVIDIA GeForce GTX 1070 Mobile
NVIDIA GeForce GTX 1050 Ti Mobile
Intel UHD Graphics Xe 750 32EUs (Rocket Lake)
max:
NVIDIA Titan RTX
...
NVIDIA GeForce GTX 1070 Mobile
NVIDIA GeForce GTX 1050 Ti Mobile
max:
NVIDIA Titan RTX
...
AMD Radeon RX Vega 7
NVIDIA GeForce GTX 1070 Mobile
NVIDIA GeForce GTX 1050 Ti Mobile
...
max:
NVIDIA Titan RTX
Intel UHD Graphics Xe 750 32EUs (Rocket Lake)
AMD Radeon RX Vega 7
NVIDIA GeForce GTX 1050 Ti Mobile
NVIDIA GeForce GTX 1070 Mobile
...
max:
NVIDIA Titan RTX
AMD Radeon RX Vega 7
NVIDIA GeForce GTX 1050 Ti Mobile
NVIDIA GeForce GTX 1070 Mobile
» Jugable con todos los portátiles probados en ajustes de detalle alto.
...
NVIDIA GeForce GTX 1050 Ti Mobile
NVIDIA GeForce GTX 1070 Mobile
AMD Radeon RX 5300M
NVIDIA GeForce RTX 2070 Super Mobile
...
max:
...
NVIDIA GeForce GTX 1070 Mobile
NVIDIA GeForce RTX 2070 Super Max-Q
...
max:
...
NVIDIA GeForce GTX 1070 Mobile
NVIDIA GeForce RTX 2070 Super Max-Q
...
max:
...
NVIDIA GeForce GTX 1070 Mobile
NVIDIA GeForce RTX 2070 Super Max-Q
...
max:
...
NVIDIA GeForce GTX 1070 Mobile
NVIDIA GeForce RTX 2070 Super Mobile
...
max:
...
NVIDIA GeForce GTX 1070 Mobile
NVIDIA GeForce RTX 2070 Super Mobile
...
max:
» Jugable con todos los portátiles probados en ajustes de detalle ultra.
...
NVIDIA GeForce GTX 1070 Mobile
NVIDIA GeForce RTX 2070 Super Mobile
...
max:
Intel UHD Graphics Xe 16EUs (Tiger Lake-H)
...
NVIDIA GeForce GTX 1070 Mobile
NVIDIA GeForce RTX 2070 Super Max-Q
...
max:
Intel Iris Plus Graphics G7 (Ice Lake 64 EU)
...
NVIDIA GeForce GTX 1070 Mobile
NVIDIA GeForce RTX 2070 Super Max-Q
AMD Radeon 680M
...
max:
AMD Radeon RX Vega 8 (Ryzen 2000/3000)
...
AMD Radeon RX Vega 7
AMD Radeon Pro 560X
NVIDIA GeForce GTX 1070 Mobile
NVIDIA GeForce RTX 2070 Super Max-Q
...
max:
NVIDIA GeForce GTX 1070 Mobile
NVIDIA GeForce RTX 2070 Super Max-Q
...
max:
NVIDIA GeForce GTX 1070 Mobile
NVIDIA GeForce RTX 2070 Super Max-Q
NVIDIA GeForce RTX 2070 Super Mobile
...
max:
» Jugable con todos los portátiles probados en ajustes de detalle ultra.
AMD Radeon R4 (Stoney Ridge)
...
NVIDIA GeForce GTX 1070 Mobile
...
NVIDIA GeForce GTX 1070 Mobile
NVIDIA GeForce RTX 2070 Super Max-Q
...
...
NVIDIA GeForce GTX 1070 Mobile
NVIDIA GeForce RTX 2070 Super Max-Q
...
...
NVIDIA GeForce GTX 1050 Ti Mobile
NVIDIA GeForce GTX 1070 Mobile
NVIDIA GeForce RTX 2070 Super Max-Q
...
max:
NVIDIA GeForce GTX 1050 Max-Q
NVIDIA GeForce GTX 1050 Ti Mobile
NVIDIA GeForce GTX 1070 Mobile
NVIDIA GeForce RTX 2070 Super Max-Q
...
max:
» Jugable con todos los portátiles probados en ajustes de detalle alto.
AMD Radeon R4 (Stoney Ridge)
...
AMD Radeon Pro 560X
NVIDIA GeForce GTX 1050 Ti Mobile
NVIDIA GeForce GTX 1070 Mobile
...
AMD Radeon RX 5300M
NVIDIA GeForce GTX 1070 Mobile
...
max:
NVIDIA Titan RTX
...
AMD Radeon RX 5300M
NVIDIA GeForce GTX 1070 Mobile
NVIDIA GeForce RTX 2070 Super Max-Q
NVIDIA GeForce RTX 2080 Super Mobile
...
NVIDIA GeForce RTX 2070 Super Mobile
max:
AMD Radeon RX 5700 (Desktop)
...
AMD Radeon RX 5300M
NVIDIA GeForce GTX 1070 Mobile
NVIDIA GeForce RTX 2070 Super Max-Q
NVIDIA GeForce RTX 2080 Super Mobile
...
NVIDIA GeForce RTX 2070 Super Mobile
NVIDIA GeForce GTX 1050 Ti Mobile
NVIDIA GeForce GTX 1070 Mobile
NVIDIA GeForce RTX 2070 Super Max-Q
NVIDIA GeForce RTX 2070 Super Mobile
NVIDIA GeForce RTX 2080 Super Mobile
max:
NVIDIA GeForce GTX 1050 Ti Mobile
NVIDIA GeForce GTX 1070 Mobile
NVIDIA GeForce RTX 2070 Super Max-Q
NVIDIA GeForce RTX 2070 Super Mobile
NVIDIA GeForce RTX 2080 Super Mobile
max:
NVIDIA Titan RTX
» Jugable con todos los portátiles probados en ajustes de detalle ultra.
AMD Radeon R4 (Stoney Ridge)
...
AMD Radeon RX 5300M
NVIDIA GeForce GTX 1070 Mobile
NVIDIA GeForce RTX 2070 Super Max-Q
...
max:
...
NVIDIA GeForce GTX 1070 Mobile
NVIDIA GeForce RTX 2070 Super Max-Q
...
max:
Intel UHD Graphics Xe 32EUs (Tiger Lake-H)
...
AMD Radeon RX 5300M
NVIDIA GeForce GTX 1070 Mobile
NVIDIA GeForce RTX 2070 Super Max-Q
...
max:
...
NVIDIA GeForce GTX 1070 Mobile
NVIDIA GeForce RTX 2070 Super Max-Q
...
max:
NVIDIA GeForce GTX 1070 Mobile
NVIDIA GeForce RTX 2070 Super Max-Q
...
max:
NVIDIA GeForce GTX 1070 Mobile
NVIDIA GeForce RTX 2070 Super Max-Q
...
max:
» Jugable con todos los portátiles probados en ajustes de detalle alto.
...
AMD Radeon RX 5300M
NVIDIA GeForce GTX 1070 Mobile
...
max:
...
AMD Radeon RX 5300M
NVIDIA GeForce GTX 1070 Mobile
...
NVIDIA GeForce RTX 2080 Super Mobile
max:
...
AMD Radeon RX 5300M
NVIDIA GeForce GTX 1070 Mobile
...
max:
...
NVIDIA GeForce GTX 1070 Mobile
NVIDIA GeForce RTX 2070 Super Max-Q
...
max:
...
NVIDIA GeForce GTX 1070 Mobile
NVIDIA GeForce RTX 2070 Super Max-Q
NVIDIA GeForce RTX 2070 Super Mobile
...
max:
» Jugable con todos los portátiles probados en ajustes de detalle ultra.
AMD Radeon R4 (Stoney Ridge)
...
NVIDIA GeForce GTX 1050 Ti Mobile
NVIDIA GeForce GTX 1070 Mobile
...
max:
...
AMD Radeon RX 5300M
NVIDIA GeForce GTX 1070 Mobile
...
max:
Intel Iris Plus Graphics G7 (Ice Lake 64 EU)
...
NVIDIA GeForce GTX 1070 Mobile
...
max:
...
AMD Radeon RX 5300M
NVIDIA GeForce GTX 1070 Mobile
NVIDIA GeForce RTX 2080 Super Mobile
...
max:
...
NVIDIA GeForce GTX 1070 Mobile
NVIDIA GeForce RTX 2070 Super Max-Q
...
max:
NVIDIA Titan RTX
NVIDIA GeForce GTX 1050 Ti Mobile
...
NVIDIA GeForce GTX 1070 Mobile
NVIDIA GeForce RTX 2070 Super Max-Q
...
max:
NVIDIA Titan RTX
» Jugable con todos los portátiles probados en ajustes de detalle ultra.
...
AMD Radeon RX 5300M
NVIDIA GeForce RTX 2070 Super Max-Q
NVIDIA GeForce GTX 1070 Mobile
max:
...
AMD Radeon RX 5300M
NVIDIA GeForce GTX 1070 Mobile
NVIDIA GeForce RTX 2070 Super Max-Q
NVIDIA GeForce RTX 2070 Super Mobile
NVIDIA GeForce RTX 2080 Super Mobile
...
max:
NVIDIA Titan RTX
...
AMD Radeon RX 5300M
NVIDIA GeForce GTX 1070 Mobile
NVIDIA GeForce RTX 2070 Super Max-Q
NVIDIA GeForce RTX 2070 Super Mobile
NVIDIA GeForce RTX 2080 Super Mobile
...
max:
NVIDIA Titan RTX
...
AMD Radeon RX 5300M
NVIDIA GeForce GTX 1070 Mobile
NVIDIA GeForce RTX 2070 Super Max-Q
NVIDIA GeForce RTX 2070 Super Mobile
NVIDIA GeForce RTX 2080 Super Mobile
...
max:
NVIDIA GeForce GTX 1050 Max-Q
NVIDIA GeForce GTX 1050 Ti Mobile
NVIDIA GeForce GTX 1070 Mobile
NVIDIA GeForce RTX 2070 Super Max-Q
NVIDIA GeForce RTX 2070 Super Mobile
NVIDIA GeForce RTX 2080 Super Mobile
...
max:
NVIDIA GeForce GTX 1050 Ti Mobile
NVIDIA GeForce GTX 1050 Max-Q
NVIDIA GeForce GTX 1070 Mobile
NVIDIA GeForce RTX 2070 Super Max-Q
NVIDIA GeForce RTX 2070 Super Mobile
NVIDIA GeForce RTX 2080 Super Mobile
...
max:
» Jugable con todos los portátiles probados en ajustes de detalle ultra.
Additional Benchmarks
Maximum Settings with Raytracing T2X Filmic SMAA 1920x1080
30.3 [X] Asus G752VS Intel Core i7-6820HK 2.7GHz
GeForce GTX 1070 Mobile
min:
18 fps
AMD Radeon R5 (Bristol Ridge)
...
NVIDIA GeForce GTX 1050 Ti Mobile
NVIDIA GeForce GTX 1070 Mobile
AMD Radeon RX 5300M
...
...
AMD Radeon RX 5300M
NVIDIA GeForce GTX 1070 Mobile
NVIDIA GeForce RTX 2070 Super Max-Q
...
max:
NVIDIA Titan X Pascal
...
NVIDIA GeForce GTX 1070 Mobile
NVIDIA GeForce RTX 2070 Super Max-Q
NVIDIA GeForce RTX 2070 Super Mobile
NVIDIA GeForce RTX 2080 Super Mobile
...
max:
NVIDIA Titan RTX
...
NVIDIA GeForce GTX 1070 Mobile
NVIDIA GeForce RTX 2070 Super Max-Q
NVIDIA GeForce RTX 2070 Super Mobile
...
max:
NVIDIA Titan RTX
NVIDIA GeForce GTX 1050 Max-Q
...
NVIDIA GeForce GTX 1070 Mobile
NVIDIA GeForce RTX 2070 Super Max-Q
NVIDIA GeForce RTX 2070 Super Mobile
...
max:
NVIDIA Titan RTX
NVIDIA GeForce GTX 1050 Max-Q
...
NVIDIA GeForce GTX 1070 Mobile
NVIDIA GeForce RTX 2070 Super Max-Q
...
max:
» Jugable con todos los portátiles probados en ajustes de detalle ultra.
...
NVIDIA GeForce GTX 1050 Ti Mobile
AMD Radeon RX 5300M
NVIDIA GeForce GTX 1070 Mobile
...
...
AMD Radeon RX 5300M
NVIDIA GeForce GTX 1070 Mobile
NVIDIA GeForce RTX 2070 Super Max-Q
...
max:
NVIDIA Titan RTX
...
NVIDIA GeForce GTX 1070 Mobile
NVIDIA GeForce RTX 2070 Super Max-Q
NVIDIA GeForce RTX 2080 Super Mobile
...
max:
NVIDIA Titan RTX
...
NVIDIA GeForce GTX 1070 Mobile
NVIDIA GeForce RTX 2070 Super Max-Q
NVIDIA GeForce RTX 2080 Super Mobile
...
max:
NVIDIA GeForce GTX 1050 Max-Q
NVIDIA GeForce GTX 1050 Ti Mobile
NVIDIA GeForce GTX 1070 Mobile
NVIDIA GeForce RTX 2070 Super Max-Q
NVIDIA GeForce RTX 2070 Super Mobile
NVIDIA GeForce RTX 2080 Super Mobile
...
max:
NVIDIA GeForce GTX 1050 Ti Mobile
NVIDIA GeForce GTX 1050 Max-Q
NVIDIA GeForce GTX 1070 Mobile
NVIDIA GeForce RTX 2070 Super Max-Q
NVIDIA GeForce RTX 2070 Super Mobile
NVIDIA GeForce RTX 2080 Super Mobile
max:
» Jugable con todos los portátiles probados en ajustes de detalle ultra.
...
AMD Radeon RX Vega 10
NVIDIA Quadro P620
AMD Radeon RX 5300M
NVIDIA GeForce GTX 1050 Ti Mobile
NVIDIA GeForce GTX 1070 Mobile
NVIDIA GeForce GTX 1050 Max-Q
...
NVIDIA GeForce GTX 1050 Ti Mobile
AMD Radeon RX 5300M
NVIDIA GeForce GTX 1070 Mobile
NVIDIA GeForce RTX 2070 Super Max-Q
NVIDIA GeForce RTX 2070 Super Mobile
NVIDIA GeForce RTX 2080 Super Mobile
...
max:
...
NVIDIA GeForce GTX 1050 Ti Mobile
AMD Radeon RX 5300M
NVIDIA GeForce GTX 1070 Mobile
NVIDIA GeForce RTX 2070 Super Max-Q
NVIDIA GeForce RTX 2080 Super Mobile
...
NVIDIA GeForce RTX 2070 Super Mobile
max:
...
NVIDIA GeForce GTX 1050 Ti Mobile
AMD Radeon RX 5300M
NVIDIA GeForce GTX 1070 Mobile
NVIDIA GeForce RTX 2070 Super Max-Q
NVIDIA GeForce RTX 2080 Super Mobile
NVIDIA GeForce RTX 2070 Super Mobile
max:
AMD Radeon RX 5700 (Desktop)
...
AMD Radeon Pro 560X
NVIDIA GeForce GTX 1050 Ti Mobile
NVIDIA GeForce GTX 1070 Mobile
NVIDIA GeForce RTX 2070 Super Max-Q
NVIDIA GeForce RTX 2080 Super Mobile
NVIDIA GeForce RTX 2070 Super Mobile
...
NVIDIA GeForce GTX 1050 Ti Mobile
NVIDIA GeForce GTX 1070 Mobile
NVIDIA GeForce RTX 2070 Super Max-Q
NVIDIA GeForce RTX 2070 Super Mobile
NVIDIA GeForce RTX 2080 Super Mobile
max:
» Jugable con todos los portátiles probados en ajustes de detalle ultra.
...
NVIDIA GeForce GTX 1050 Ti Mobile
AMD Radeon RX 5300M
NVIDIA GeForce GTX 1070 Mobile
...
max:
...
NVIDIA GeForce GTX 1070 Mobile
...
max:
Intel UHD Graphics Xe 16EUs (Tiger Lake-H)
...
NVIDIA GeForce GTX 1070 Mobile
NVIDIA GeForce RTX 2070 Super Max-Q
...
max:
Intel Iris Plus Graphics G4 (Ice Lake 48 EU)
...
Apple M1 Max 32-Core GPU
NVIDIA GeForce GTX 1070 Mobile
NVIDIA GeForce RTX 2070 Super Max-Q
...
max:
...
Apple M1 Max 32-Core GPU
NVIDIA GeForce GTX 1070 Mobile
NVIDIA GeForce RTX 2070 Super Max-Q
NVIDIA GeForce RTX 2070 Super Mobile
...
max:
NVIDIA GeForce GTX 1050 Ti Mobile
...
AMD Radeon 680M
NVIDIA GeForce GTX 1070 Mobile
Apple M1 Max 32-Core GPU
NVIDIA GeForce RTX 2070 Super Max-Q
...
max:
» Jugable con todos los portátiles probados en ajustes de detalle ultra.
...
NVIDIA GeForce GTX 1070 Mobile
...
max:
...
NVIDIA GeForce GTX 1070 Mobile
NVIDIA GeForce RTX 2070 Super Max-Q
...
max:
...
AMD Radeon RX 5300M
NVIDIA GeForce GTX 1070 Mobile
NVIDIA GeForce RTX 2070 Super Max-Q
...
max:
...
AMD Radeon 680M
NVIDIA GeForce GTX 1070 Mobile
NVIDIA GeForce RTX 2070 Super Max-Q
...
max:
NVIDIA GeForce GTX 1050 Ti Mobile
...
AMD Radeon 680M
NVIDIA GeForce GTX 1070 Mobile
NVIDIA GeForce RTX 2070 Super Max-Q
...
max:
» Jugable con todos los portátiles probados en ajustes de detalle alto.
Additional Benchmarks
High Quality Preset & High Ray Tracing Preset (DX12) 1920x1080
13.8 [X] Asus G752VS Intel Core i7-6820HK 2.7GHz
GeForce GTX 1070 Mobile
min:
11 fps
...
NVIDIA GeForce GTX 1050 Ti Mobile
AMD Radeon RX 5300M
NVIDIA GeForce GTX 1070 Mobile
...
max:
...
AMD Radeon RX 5300M
NVIDIA GeForce GTX 1070 Mobile
NVIDIA GeForce RTX 2070 Super Max-Q
NVIDIA GeForce RTX 2070 Super Mobile
NVIDIA GeForce RTX 2080 Super Mobile
...
NVIDIA GeForce GTX 1070 Mobile
NVIDIA GeForce RTX 2070 Super Max-Q
NVIDIA GeForce RTX 2080 Super Mobile
NVIDIA GeForce RTX 2070 Super Mobile
...
AMD Radeon RX 5300M
NVIDIA GeForce GTX 1070 Mobile
...
NVIDIA GeForce RTX 2070 Super Mobile
...
NVIDIA GeForce GTX 1050 Ti Mobile
NVIDIA GeForce GTX 1050 Max-Q
NVIDIA GeForce GTX 1070 Mobile
NVIDIA GeForce RTX 2070 Super Max-Q
NVIDIA GeForce RTX 2070 Super Mobile
...
...
NVIDIA GeForce GTX 1050 Max-Q
NVIDIA GeForce GTX 1070 Mobile
NVIDIA GeForce RTX 2070 Super Max-Q
NVIDIA GeForce RTX 2070 Super Mobile
...
NVIDIA GeForce RTX 2080 Super Mobile
max:
NVIDIA Titan RTX
» Jugable con todos los portátiles probados en ajustes de detalle ultra.
...
AMD Radeon RX 5300M
NVIDIA GeForce GTX 1070 Mobile
max:
...
NVIDIA GeForce GTX 1070 Mobile
NVIDIA GeForce RTX 2070 Super Max-Q
NVIDIA GeForce RTX 2070 Super Mobile
...
max:
...
NVIDIA GeForce GTX 1070 Mobile
NVIDIA GeForce RTX 2070 Super Max-Q
...
max:
...
NVIDIA GeForce GTX 1070 Mobile
NVIDIA GeForce RTX 2070 Super Max-Q
...
max:
...
NVIDIA GeForce GTX 1050 Max-Q
NVIDIA GeForce GTX 1050 Ti Mobile
NVIDIA GeForce GTX 1070 Mobile
NVIDIA GeForce RTX 2070 Super Max-Q
NVIDIA GeForce RTX 2070 Super Mobile
...
max:
NVIDIA GeForce GTX 1050 Max-Q
NVIDIA GeForce GTX 1070 Mobile
NVIDIA GeForce RTX 2070 Super Max-Q
NVIDIA GeForce RTX 2070 Super Mobile
...
max:
» Jugable con todos los portátiles probados en ajustes de detalle ultra.
...
NVIDIA GeForce GTX 1050 Ti Mobile
NVIDIA GeForce GTX 1050 Max-Q
NVIDIA GeForce GTX 1070 Mobile
AMD Radeon RX 5300M
...
max:
...
NVIDIA GeForce GTX 1070 Mobile
...
max:
...
NVIDIA GeForce GTX 1070 Mobile
...
max:
...
NVIDIA GeForce GTX 1070 Mobile
...
max:
...
NVIDIA GeForce GTX 1050 Ti Mobile
NVIDIA GeForce GTX 1070 Mobile
NVIDIA GeForce RTX 2070 Super Max-Q
...
max:
...
NVIDIA GeForce GTX 1050 Max-Q
NVIDIA GeForce GTX 1070 Mobile
NVIDIA GeForce RTX 2070 Super Max-Q
...
max:
» Jugable con todos los portátiles probados en ajustes de detalle alto.
...
NVIDIA GeForce GTX 1070 Mobile
...
max:
AMD Radeon RX 6700 XT
...
NVIDIA GeForce GTX 1070 Mobile
NVIDIA GeForce RTX 2070 Super Max-Q
...
max:
...
NVIDIA GeForce GTX 1070 Mobile
...
max:
...
NVIDIA GeForce GTX 1070 Mobile
NVIDIA GeForce RTX 2070 Super Max-Q
...
max:
...
NVIDIA GeForce GTX 1070 Mobile
NVIDIA GeForce RTX 2070 Super Max-Q
...
max:
...
NVIDIA GeForce GTX 1070 Mobile
NVIDIA GeForce RTX 2070 Super Max-Q
NVIDIA GeForce RTX 2070 Super Mobile
...
max:
» Jugable con todos los portátiles probados en ajustes de detalle ultra.
...
AMD Radeon RX 560X (Laptop)
NVIDIA GeForce GTX 1070 Mobile
AMD Radeon RX 5300M
...
max:
...
AMD Radeon RX 5300M
NVIDIA GeForce GTX 1070 Mobile
...
NVIDIA GeForce RTX 2070 Super Mobile
max:
...
AMD Radeon RX 5300M
NVIDIA GeForce GTX 1070 Mobile
...
Intel Iris Plus Graphics G4 (Ice Lake 48 EU)
...
AMD Radeon RX 5300M
NVIDIA GeForce GTX 1070 Mobile
...
max:
...
NVIDIA GeForce GTX 1070 Mobile
NVIDIA GeForce RTX 2070 Super Max-Q
NVIDIA GeForce RTX 2070 Super Mobile
NVIDIA GeForce RTX 2080 Super Mobile
...
max:
» Jugable con todos los portátiles probados en ajustes de detalle ultra.
...
NVIDIA GeForce GTX 1050 Max-Q
AMD Radeon Pro 560X
NVIDIA GeForce GTX 1050 Ti Max-Q
NVIDIA GeForce GTX 1050 Ti Mobile
NVIDIA GeForce GTX 1070 Mobile
max:
...
NVIDIA GeForce GTX 1070 Mobile
...
NVIDIA GeForce GTX 1070 Mobile
max:
AMD Radeon RX Vega 8 (Ryzen 2000/3000)
...
AMD Radeon RX 560X (Laptop)
NVIDIA GeForce GTX 1050 Ti Max-Q
NVIDIA GeForce GTX 1070 Mobile
max:
...
NVIDIA GeForce GTX 1050 Max-Q
NVIDIA GeForce GTX 1050 Ti Mobile
NVIDIA GeForce GTX 1070 Mobile
max:
...
NVIDIA GeForce GTX 1050 Ti Mobile
NVIDIA GeForce GTX 1050 Max-Q
NVIDIA GeForce GTX 1050 Ti Max-Q
NVIDIA GeForce GTX 1070 Mobile
max:
NVIDIA Titan RTX
» Jugable con todos los portátiles probados en ajustes de detalle ultra.
...
NVIDIA GeForce GTX 1050 Ti Mobile
NVIDIA GeForce GTX 1050 Ti Max-Q
AMD Radeon RX 5300M
NVIDIA GeForce GTX 1070 Mobile
...
max:
...
AMD Radeon RX 5300M
NVIDIA GeForce GTX 1070 Mobile
...
max:
...
AMD Radeon RX 5300M
NVIDIA GeForce GTX 1070 Mobile
...
max:
Intel UHD Graphics Xe 16EUs (Tiger Lake-H)
...
AMD Radeon RX 5300M
NVIDIA GeForce GTX 1070 Mobile
...
max:
...
NVIDIA GeForce GTX 1070 Mobile
NVIDIA GeForce RTX 2070 Super Max-Q
...
max:
...
NVIDIA GeForce GTX 1070 Mobile
NVIDIA GeForce RTX 2070 Super Max-Q
...
max:
» Jugable con todos los portátiles probados en ajustes de detalle ultra.
...
AMD Radeon RX 5300M
NVIDIA GeForce GTX 1070 Mobile
...
max:
...
NVIDIA GeForce GTX 1070 Mobile
NVIDIA GeForce RTX 2070 Super Max-Q
...
max:
...
NVIDIA GeForce GTX 1070 Mobile
NVIDIA GeForce RTX 2070 Super Max-Q
...
max:
AMD Radeon RX Vega 8 (Ryzen 2000/3000)
...
NVIDIA GeForce GTX 1070 Mobile
NVIDIA GeForce RTX 2070 Super Max-Q
...
max:
...
NVIDIA GeForce GTX 1070 Mobile
NVIDIA GeForce RTX 2070 Super Max-Q
...
max:
AMD Radeon Pro W6800
NVIDIA GeForce GTX 1050 Ti Max-Q
...
NVIDIA GeForce GTX 1070 Mobile
NVIDIA GeForce RTX 2070 Super Max-Q
...
max:
» Jugable con todos los portátiles probados en ajustes de detalle ultra.
...
AMD Radeon RX 5300M
NVIDIA GeForce GTX 1070 Mobile
...
AMD Radeon RX 5300M
NVIDIA GeForce GTX 1070 Mobile
...
...
AMD Radeon RX 5300M
NVIDIA GeForce GTX 1070 Mobile
...
...
AMD Radeon RX 5300M
NVIDIA GeForce GTX 1070 Mobile
...
...
NVIDIA GeForce GTX 1050 Ti Mobile
NVIDIA GeForce GTX 1070 Mobile
...
max:
...
NVIDIA GeForce GTX 1050 Max-Q
NVIDIA GeForce GTX 1050 Ti Mobile
NVIDIA GeForce GTX 1070 Mobile
...
max:
» Jugable con todos los portátiles probados en ajustes de detalle ultra.
...
NVIDIA GeForce GTX 1050 Ti Max-Q
NVIDIA GeForce GTX 1050 Ti Mobile
AMD Radeon RX 5300M
NVIDIA GeForce GTX 1070 Mobile
max:
...
AMD Radeon RX 5300M
NVIDIA GeForce GTX 1070 Mobile
NVIDIA GeForce RTX 2070 Super Max-Q
...
NVIDIA GeForce RTX 2070 Super Mobile
max:
NVIDIA Titan RTX
Intel Iris Plus Graphics G7 (Ice Lake 64 EU)
...
AMD Radeon RX 5300M
NVIDIA GeForce GTX 1070 Mobile
NVIDIA GeForce RTX 2070 Super Max-Q
...
NVIDIA GeForce RTX 2080 Super Mobile
max:
NVIDIA Titan RTX
...
AMD Radeon RX 5300M
NVIDIA GeForce GTX 1070 Mobile
NVIDIA GeForce RTX 2070 Super Max-Q
NVIDIA GeForce RTX 2070 Super Mobile
...
NVIDIA GeForce RTX 2080 Super Mobile
max:
NVIDIA Titan RTX
...
NVIDIA GeForce GTX 1050 Ti Mobile
NVIDIA GeForce GTX 1070 Mobile
NVIDIA GeForce RTX 2070 Super Max-Q
NVIDIA GeForce RTX 2070 Super Mobile
...
NVIDIA GeForce RTX 2080 Super Mobile
max:
...
NVIDIA GeForce GTX 1070 Mobile
NVIDIA GeForce RTX 2070 Super Max-Q
NVIDIA GeForce RTX 2070 Super Mobile
NVIDIA GeForce RTX 2080 Super Mobile
...
max:
» Jugable con todos los portátiles probados en ajustes de detalle ultra.
...
NVIDIA GeForce GTX 1050 Ti Mobile
AMD Radeon Pro 560X
AMD Radeon RX 5300M
NVIDIA GeForce GTX 1070 Mobile
...
max:
...
NVIDIA GeForce GTX 1050 Ti Max-Q
NVIDIA GeForce GTX 1070 Mobile
NVIDIA GeForce RTX 2070 Super Max-Q
NVIDIA GeForce RTX 2070 Super Mobile
...
NVIDIA GeForce RTX 2080 Super Mobile
...
AMD Radeon RX 5300M
NVIDIA GeForce GTX 1050 Ti Max-Q
NVIDIA GeForce GTX 1070 Mobile
NVIDIA GeForce RTX 2070 Super Max-Q
...
NVIDIA GeForce RTX 2080 Super Mobile
...
AMD Radeon RX 5300M
NVIDIA GeForce GTX 1050 Ti Max-Q
NVIDIA GeForce GTX 1070 Mobile
NVIDIA GeForce RTX 2070 Super Max-Q
...
NVIDIA GeForce RTX 2080 Super Mobile
max:
...
NVIDIA GeForce GTX 1050 Ti Mobile
NVIDIA GeForce GTX 1070 Mobile
NVIDIA GeForce RTX 2070 Super Max-Q
NVIDIA GeForce RTX 2070 Super Mobile
NVIDIA GeForce RTX 2080 Super Mobile
...
max:
...
NVIDIA GeForce GTX 1050 Ti Max-Q
NVIDIA GeForce GTX 1050 Ti Mobile
NVIDIA GeForce GTX 1070 Mobile
NVIDIA GeForce RTX 2070 Super Max-Q
NVIDIA GeForce RTX 2070 Super Mobile
NVIDIA GeForce RTX 2080 Super Mobile
...
max:
NVIDIA Titan RTX
» Jugable con todos los portátiles probados en ajustes de detalle ultra.
...
AMD Radeon RX 5300M
NVIDIA GeForce GTX 1070 Mobile
max:
...
NVIDIA GeForce GTX 1070 Mobile
NVIDIA GeForce RTX 2070 Super Max-Q
NVIDIA GeForce RTX 2070 Super Mobile
...
NVIDIA GeForce RTX 2080 Super Mobile
max:
...
NVIDIA GeForce GTX 1070 Mobile
NVIDIA GeForce RTX 2070 Super Max-Q
...
max:
...
NVIDIA GeForce GTX 1070 Mobile
NVIDIA GeForce RTX 2070 Super Max-Q
...
max:
...
NVIDIA GeForce GTX 1070 Mobile
NVIDIA GeForce RTX 2070 Super Max-Q
...
max:
...
NVIDIA GeForce GTX 1070 Mobile
...
max:
» Jugable con todos los portátiles probados en ajustes de detalle ultra.
...
NVIDIA GeForce GTX 1070 Mobile
NVIDIA GeForce GTX 1050 Ti Mobile
...
max:
...
NVIDIA GeForce GTX 1050 Max-Q
NVIDIA GeForce GTX 1070 Mobile
NVIDIA GeForce GTX 1050 Ti Mobile
NVIDIA GeForce GTX 1050 Ti Max-Q
...
max:
...
NVIDIA GeForce GTX 1050 Ti Mobile
NVIDIA GeForce GTX 1050 Ti Max-Q
NVIDIA GeForce GTX 1070 Mobile
...
max:
...
NVIDIA GeForce GTX 1050 Ti Mobile
NVIDIA GeForce GTX 1050 Ti Max-Q
NVIDIA GeForce GTX 1070 Mobile
...
max:
...
NVIDIA GeForce GTX 1070 Mobile
max:
» Jugable con todos los portátiles probados en ajustes de detalle ultra.
...
AMD Radeon RX Vega 8 (Ryzen 2000/3000)
AMD Radeon RX 560X (Laptop)
NVIDIA GeForce GTX 1070 Mobile
NVIDIA GeForce GTX 1050 Ti Mobile
...
max:
NVIDIA Titan RTX
...
AMD Radeon RX 560X (Laptop)
NVIDIA GeForce GTX 1050 Ti Mobile
NVIDIA GeForce GTX 1070 Mobile
...
max:
NVIDIA Titan RTX
...
AMD Radeon Pro 560X
AMD Radeon RX 560X (Laptop)
NVIDIA GeForce GTX 1050 Ti Mobile
NVIDIA GeForce GTX 1070 Mobile
max:
NVIDIA Titan RTX
AMD Radeon RX Vega 8 (Ryzen 2000/3000)
...
NVIDIA GeForce GTX 1050 Ti Mobile
NVIDIA GeForce GTX 1070 Mobile
max:
NVIDIA Titan RTX
NVIDIA GeForce GTX 1070 Mobile
...
max:
NVIDIA GeForce GTX 1070 Mobile
max:
NVIDIA Titan RTX
» Jugable con todos los portátiles probados en ajustes de detalle ultra.
...
NVIDIA GeForce GTX 1050 Ti Mobile
NVIDIA GeForce GTX 1050 Ti Max-Q
NVIDIA GeForce GTX 1070 Mobile
AMD Radeon RX 5300M
...
AMD Radeon RX 5300M
NVIDIA GeForce GTX 1070 Mobile
NVIDIA GeForce RTX 2070 Super Max-Q
...
NVIDIA GeForce RTX 2080 Super Mobile
AMD Radeon RX Vega 8 (Ryzen 2000/3000)
...
AMD Radeon RX 5300M
NVIDIA GeForce GTX 1070 Mobile
...
NVIDIA GeForce RTX 2070 Super Mobile
max:
AMD Radeon RX Vega 8 (Ryzen 2000/3000)
...
AMD Radeon RX 5300M
NVIDIA GeForce GTX 1070 Mobile
...
max:
...
NVIDIA GeForce GTX 1070 Mobile
NVIDIA GeForce RTX 2070 Super Max-Q
NVIDIA GeForce RTX 2080 Super Mobile
...
max:
...
NVIDIA GeForce GTX 1070 Mobile
NVIDIA GeForce RTX 2070 Super Max-Q
NVIDIA GeForce RTX 2070 Super Mobile
...
max:
» Jugable con todos los portátiles probados en ajustes de detalle ultra.
...
AMD Radeon RX 560X (Laptop)
NVIDIA GeForce GTX 1050 Ti Mobile
NVIDIA GeForce GTX 1050 Ti Max-Q
NVIDIA GeForce GTX 1070 Mobile
max:
...
AMD Radeon RX 560X (Laptop)
NVIDIA GeForce GTX 1070 Mobile
...
max:
...
NVIDIA GeForce GTX 1050 Ti Max-Q
NVIDIA GeForce GTX 1050 Ti Mobile
NVIDIA GeForce GTX 1070 Mobile
...
max:
...
NVIDIA GeForce GTX 1070 Mobile
...
max:
...
NVIDIA GeForce GTX 1070 Mobile
max:
...
NVIDIA GeForce GTX 1070 Mobile
max:
NVIDIA Titan RTX
» Jugable con todos los portátiles probados en ajustes de detalle ultra.
...
NVIDIA GeForce GTX 1050 Ti Max-Q
NVIDIA GeForce GTX 1050 Ti Mobile
AMD Radeon RX 5300M
NVIDIA GeForce GTX 1070 Mobile
...
max:
...
AMD Radeon RX 5300M
NVIDIA GeForce GTX 1070 Mobile
...
max:
...
NVIDIA GeForce GTX 1070 Mobile
NVIDIA GeForce RTX 2070 Super Max-Q
...
max:
...
NVIDIA GeForce GTX 1070 Mobile
NVIDIA GeForce RTX 2080 Super Mobile
NVIDIA GeForce RTX 2070 Super Max-Q
NVIDIA GeForce RTX 2070 Super Mobile
max:
...
NVIDIA GeForce GTX 1070 Mobile
NVIDIA GeForce RTX 2070 Super Max-Q
...
max:
...
AMD Radeon Pro WX Vega M GL
NVIDIA GeForce GTX 1070 Mobile
...
max:
» Jugable con todos los portátiles probados en ajustes de detalle ultra.
...
NVIDIA GeForce GTX 1050 Ti Mobile
NVIDIA GeForce GTX 1050 Ti Max-Q
NVIDIA GeForce GTX 1070 Mobile
max:
...
NVIDIA GeForce GTX 1070 Mobile
max:
...
NVIDIA GeForce GTX 1070 Mobile
max:
...
NVIDIA GeForce GTX 1050 Ti Max-Q
NVIDIA GeForce GTX 1070 Mobile
max:
NVIDIA GeForce GTX 1070 Mobile
max:
AMD Radeon RX Vega 8 (Ryzen 2000/3000)
NVIDIA GeForce GTX 1050 Ti Max-Q
NVIDIA GeForce GTX 1070 Mobile
max:
» Jugable con todos los portátiles probados en ajustes de detalle ultra.
...
NVIDIA GeForce GTX 1050 Ti Mobile
NVIDIA GeForce GTX 1070 Mobile
max:
...
NVIDIA GeForce GTX 1050 Ti Mobile
NVIDIA GeForce GTX 1070 Mobile
...
NVIDIA GeForce GTX 1050 Ti Mobile
NVIDIA GeForce GTX 1070 Mobile
max:
...
AMD Radeon Pro 560X
NVIDIA GeForce GTX 1050 Ti Mobile
NVIDIA GeForce GTX 1070 Mobile
max:
NVIDIA GeForce GTX 1070 Mobile
max:
...
AMD Radeon Pro 560X
NVIDIA GeForce GTX 1050 Ti Mobile
NVIDIA GeForce GTX 1070 Mobile
max:
» Jugable con todos los portátiles probados en ajustes de detalle ultra.
...
Apple M3 10-Core GPU
NVIDIA GeForce GTX 1070 Mobile
AMD Radeon RX 5300M
...
max:
...
Apple M1 Max 24-Core GPU
NVIDIA GeForce GTX 1070 Mobile
...
max:
...
Apple M1 Max 24-Core GPU
NVIDIA GeForce GTX 1070 Mobile
...
max:
...
NVIDIA GeForce GTX 1070 Mobile
Apple M1 Max 24-Core GPU
...
max:
...
NVIDIA GeForce GTX 1070 Mobile
Apple M1 Max 32-Core GPU
...
max:
AMD Radeon RX Vega 8 (Ryzen 2000/3000)
...
NVIDIA GeForce GTX 1070 Mobile
...
max:
» Jugable con todos los portátiles probados en ajustes de detalle ultra.
...
NVIDIA GeForce GTX 1050 Ti Max-Q
NVIDIA GeForce GTX 1070 Mobile
max:
...
NVIDIA Quadro P2000 Max-Q
NVIDIA GeForce GTX 1070 Mobile
max:
...
NVIDIA GeForce GTX 1070 Mobile
max:
NVIDIA Titan RTX
...
NVIDIA GeForce GTX 1050 Ti Mobile
NVIDIA GeForce GTX 1070 Mobile
max:
AMD Radeon RX Vega 8 (Ryzen 2000/3000)
...
NVIDIA GeForce GTX 1050 Max-Q
AMD Radeon Pro WX Vega M GL
NVIDIA GeForce GTX 1050 Ti Mobile
NVIDIA GeForce GTX 1050 Ti Max-Q
NVIDIA Quadro P2000 Max-Q
NVIDIA GeForce GTX 1070 Mobile
max:
NVIDIA Titan RTX
» Jugable con todos los portátiles probados en ajustes de detalle ultra.
AMD Radeon R4 (Stoney Ridge)
...
NVIDIA GeForce GTX 1050 Max-Q
AMD Radeon Pro 560X
AMD Radeon RX 5300M
NVIDIA GeForce GTX 1070 Mobile
NVIDIA GeForce GTX 1050 Ti Mobile
NVIDIA GeForce GTX 1050 Ti Max-Q
max:
NVIDIA GeForce GTX 1650 Super (Desktop)
...
AMD Radeon RX 5300M
NVIDIA GeForce GTX 1070 Mobile
NVIDIA GeForce RTX 2070 Super Max-Q
...
max:
...
AMD Radeon RX 5300M
NVIDIA GeForce GTX 1070 Mobile
NVIDIA GeForce RTX 2070 Super Max-Q
NVIDIA GeForce RTX 2080 Super Mobile
...
max:
...
AMD Radeon RX 5300M
NVIDIA GeForce GTX 1070 Mobile
NVIDIA GeForce RTX 2070 Super Max-Q
NVIDIA GeForce RTX 2070 Super Mobile
NVIDIA GeForce RTX 2080 Super Mobile
...
max:
...
NVIDIA GeForce GTX 1070 Mobile
NVIDIA GeForce RTX 2070 Super Max-Q
NVIDIA GeForce RTX 2070 Super Mobile
NVIDIA GeForce RTX 2080 Super Mobile
max:
NVIDIA GeForce GTX 1050 Max-Q
NVIDIA GeForce GTX 1050 Ti Max-Q
NVIDIA GeForce GTX 1070 Mobile
NVIDIA GeForce RTX 2070 Super Max-Q
...
NVIDIA GeForce RTX 2080 Super Mobile
max:
NVIDIA Titan RTX
» Jugable con todos los portátiles probados en ajustes de detalle ultra.
...
AMD Radeon RX Vega 8 (Ryzen 2000/3000)
AMD Radeon RX 560X (Laptop)
NVIDIA Quadro P600
AMD Radeon Pro 560X
NVIDIA GeForce GTX 1070 Mobile
...
AMD Radeon Pro 555
...
AMD Radeon Pro 560X
NVIDIA GeForce GTX 1050 Max-Q
AMD Radeon RX 560X (Laptop)
NVIDIA GeForce GTX 1050 Ti Max-Q
NVIDIA GeForce GTX 1050 Ti Mobile
NVIDIA GeForce GTX 1070 Mobile
...
...
AMD Radeon Pro 560X
AMD Radeon RX 560X (Laptop)
NVIDIA GeForce GTX 1050 Ti Max-Q
NVIDIA GeForce GTX 1050 Ti Mobile
NVIDIA GeForce GTX 1070 Mobile
...
max:
...
NVIDIA GeForce GTX 1050 Ti Max-Q
NVIDIA GeForce GTX 1050 Ti Mobile
NVIDIA GeForce GTX 1070 Mobile
...
max:
AMD Radeon RX 480 (Desktop)
...
NVIDIA GeForce GTX 1050 Ti Mobile
NVIDIA GeForce GTX 1070 Mobile
max:
...
NVIDIA GeForce GTX 1050 Ti Max-Q
NVIDIA GeForce GTX 1050 Ti Mobile
NVIDIA GeForce GTX 1070 Mobile
max:
NVIDIA Titan RTX
» Jugable con todos los portátiles probados en ajustes de detalle ultra.
...
NVIDIA GeForce GTX 1070 Mobile
...
max:
...
NVIDIA GeForce GTX 1070 Mobile
...
max:
...
NVIDIA GeForce GTX 1070 Mobile
...
max:
...
NVIDIA GeForce GTX 1070 Mobile
...
max:
...
NVIDIA GeForce GTX 1070 Mobile
...
max:
...
NVIDIA GeForce GTX 1070 Mobile
...
max:
» Jugable con todos los portátiles probados en ajustes de detalle ultra.
...
NVIDIA GeForce GTX 1050 Max-Q
NVIDIA GeForce GTX 1050 Ti Max-Q
NVIDIA GeForce GTX 1070 Mobile
...
max:
...
NVIDIA Quadro P620
NVIDIA GeForce GTX 1070 Mobile
NVIDIA GeForce GTX 1050 Ti Max-Q
NVIDIA GeForce GTX 1050 Max-Q
...
max:
...
NVIDIA Quadro P620
NVIDIA GeForce GTX 1050 Max-Q
NVIDIA GeForce GTX 1070 Mobile
NVIDIA GeForce GTX 1050 Ti Max-Q
...
max:
» Jugable con todos los portátiles probados en ajustes de detalle alto.
...
AMD Radeon Pro 560X
NVIDIA GeForce GTX 1050 Max-Q
NVIDIA GeForce GTX 1050 Ti Mobile
NVIDIA GeForce GTX 1070 Mobile
AMD Radeon RX 5300M
max:
...
AMD Radeon RX 5300M
NVIDIA GeForce GTX 1070 Mobile
NVIDIA GeForce RTX 2070 Super Max-Q
...
NVIDIA GeForce RTX 2070 Super Mobile
max:
...
AMD Radeon RX 5300M
NVIDIA GeForce GTX 1070 Mobile
NVIDIA GeForce RTX 2080 Super Mobile
NVIDIA GeForce RTX 2070 Super Max-Q
...
NVIDIA GeForce RTX 2070 Super Mobile
max:
...
NVIDIA GeForce GTX 1070 Mobile
NVIDIA GeForce RTX 2080 Super Mobile
NVIDIA GeForce RTX 2070 Super Max-Q
NVIDIA GeForce RTX 2070 Super Mobile
...
NVIDIA GeForce RTX 2070 Super Mobile
max:
...
NVIDIA GeForce GTX 1050 Ti Mobile
NVIDIA GeForce GTX 1070 Mobile
NVIDIA GeForce RTX 2070 Super Max-Q
NVIDIA GeForce RTX 2080 Super Mobile
NVIDIA GeForce RTX 2070 Super Mobile
...
max:
...
NVIDIA GeForce GTX 1070 Mobile
NVIDIA GeForce RTX 2070 Super Max-Q
NVIDIA GeForce RTX 2070 Super Mobile
NVIDIA GeForce RTX 2080 Super Mobile
max:
» Jugable con todos los portátiles probados en ajustes de detalle ultra.
...
NVIDIA GeForce GTX 1070 Mobile
NVIDIA GeForce RTX 2070 Super Max-Q
...
max:
...
NVIDIA GeForce GTX 1070 Mobile
...
max:
...
NVIDIA GeForce GTX 1070 Mobile
...
max:
...
NVIDIA GeForce GTX 1070 Mobile
...
max:
» Jugable con todos los portátiles probados en ajustes de detalle alto.
...
AMD Radeon RX 580 (Laptop)
NVIDIA GeForce GTX 1070 Mobile
max:
NVIDIA GeForce GTX 1070 SLI (Desktop)
...
NVIDIA GeForce RTX 2070 Super Max-Q
NVIDIA GeForce GTX 1070 Mobile
NVIDIA GeForce RTX 2070 Super Mobile
NVIDIA GeForce RTX 2080 Super Mobile
AMD Radeon RX 580 (Laptop)
...
max:
...
NVIDIA GeForce RTX 2070 Super Max-Q
NVIDIA GeForce GTX 1070 Mobile
NVIDIA GeForce RTX 2070 Super Mobile
NVIDIA GeForce RTX 2080 Super Mobile
...
NVIDIA GeForce RTX 2080 Super Mobile
max:
Intel Iris Plus Graphics G4 (Ice Lake 48 EU)
...
NVIDIA GeForce RTX 2070 Super Max-Q
NVIDIA GeForce GTX 1070 Mobile
NVIDIA GeForce RTX 2070 Super Mobile
NVIDIA GeForce RTX 2080 Super Mobile
...
NVIDIA GeForce RTX 2080 Super Mobile
max:
...
NVIDIA GeForce GTX 1050 Ti Mobile
NVIDIA GeForce GTX 1070 Mobile
NVIDIA GeForce RTX 2070 Super Max-Q
NVIDIA GeForce RTX 2070 Super Mobile
NVIDIA GeForce RTX 2080 Super Mobile
...
max:
...
NVIDIA GeForce GTX 1070 Mobile
AMD Radeon RX 560 (Laptop)
NVIDIA GeForce RTX 2070 Super Max-Q
NVIDIA GeForce RTX 2070 Super Mobile
NVIDIA GeForce RTX 2080 Super Mobile
max:
» Jugable con todos los portátiles probados en ajustes de detalle ultra.
...
AMD Radeon Pro 560X
NVIDIA GeForce GTX 1050 Ti Mobile
NVIDIA GeForce GTX 1070 Mobile
max:
...
NVIDIA GeForce GTX 1070 Mobile
max:
...
NVIDIA GeForce GTX 1070 Mobile
max:
...
NVIDIA GeForce GTX 1070 Mobile
max:
...
NVIDIA GeForce GTX 1050 Ti Mobile
NVIDIA GeForce GTX 1070 Mobile
max:
...
NVIDIA GeForce GTX 1050 Ti Mobile
NVIDIA GeForce GTX 1050 Max-Q
NVIDIA GeForce GTX 1070 Mobile
max:
» Jugable con todos los portátiles probados en ajustes de detalle ultra.
...
AMD Radeon RX 580 (Laptop)
NVIDIA GeForce GTX 1050 Ti Mobile
NVIDIA GeForce GTX 1070 Mobile
max:
NVIDIA GeForce GTX 1060 (Desktop)
...
AMD Radeon RX 580 (Laptop)
NVIDIA GeForce GTX 1070 Mobile
...
AMD Radeon RX 580 (Laptop)
NVIDIA GeForce GTX 1070 Mobile
AMD Radeon RX Vega 8 (Ryzen 2000/3000)
...
AMD Radeon RX 580 (Laptop)
NVIDIA GeForce GTX 1070 Mobile
...
NVIDIA GeForce GTX 1050 Ti Mobile
NVIDIA GeForce GTX 1070 Mobile
max:
NVIDIA GeForce GTX 1050 Ti Mobile
...
NVIDIA GeForce GTX 1070 Mobile
max:
» Jugable con todos los portátiles probados en ajustes de detalle ultra.
...
NVIDIA GeForce GTX 1050 Ti Mobile
NVIDIA GeForce GTX 1070 Mobile
...
max:
...
AMD Radeon RX 580 (Laptop)
NVIDIA GeForce GTX 1050 Ti Mobile
NVIDIA GeForce GTX 1070 Mobile
max:
...
NVIDIA GeForce GTX 1050 Ti Mobile
AMD Radeon RX 580 (Laptop)
NVIDIA GeForce GTX 1070 Mobile
max:
...
AMD Radeon RX 580 (Laptop)
AMD Radeon RX 560X (Laptop)
NVIDIA GeForce GTX 1050 Ti Mobile
NVIDIA GeForce GTX 1070 Mobile
max:
NVIDIA GeForce GTX 1050 Ti Mobile
NVIDIA GeForce GTX 1070 Mobile
max:
NVIDIA GeForce GTX 1050 Max-Q
NVIDIA GeForce GTX 1050 Ti Mobile
NVIDIA GeForce GTX 1070 Mobile
max:
NVIDIA Titan RTX
» Jugable con todos los portátiles probados en ajustes de detalle ultra.
...
NVIDIA GeForce GTX 1070 Mobile
max:
...
NVIDIA GeForce GTX 1070 Mobile
max:
NVIDIA Titan X Pascal
NVIDIA GeForce GTX 1050 Ti Mobile
NVIDIA GeForce GTX 1070 Mobile
max:
NVIDIA Titan X Pascal
NVIDIA GeForce GTX 1050 Ti Mobile
NVIDIA GeForce GTX 1070 Mobile
max:
NVIDIA GeForce GTX 1050 Ti Mobile
NVIDIA GeForce GTX 1070 Mobile
max:
NVIDIA GeForce GTX 1070 Mobile
max:
NVIDIA Titan X Pascal
» Jugable con todos los portátiles probados en ajustes de detalle ultra.
...
NVIDIA GeForce GTX 1050 Ti Mobile
NVIDIA GeForce GTX 1070 Mobile
max:
...
AMD Radeon RX 580 (Laptop)
NVIDIA GeForce GTX 1070 Mobile
max:
...
AMD Radeon RX 580 (Laptop)
NVIDIA GeForce GTX 1070 Mobile
max:
...
AMD Radeon RX 580 (Laptop)
NVIDIA GeForce GTX 1070 Mobile
max:
NVIDIA GeForce GTX 1050 Ti Mobile
NVIDIA GeForce GTX 1070 Mobile
max:
...
NVIDIA GeForce GTX 1050 Ti Mobile
NVIDIA GeForce GTX 1050 Max-Q
NVIDIA GeForce GTX 1050 Ti Max-Q
NVIDIA GeForce GTX 1070 Mobile
max:
» Jugable con todos los portátiles probados en ajustes de detalle ultra.
...
AMD Radeon RX 560 (Laptop)
NVIDIA GeForce GTX 1050 Ti Mobile
NVIDIA GeForce GTX 1050 Ti Max-Q
NVIDIA GeForce GTX 1070 Mobile
...
AMD Radeon RX 580 (Laptop)
NVIDIA GeForce GTX 1070 Mobile
...
AMD Radeon RX 580 (Laptop)
NVIDIA GeForce GTX 1070 Mobile
max:
...
AMD Radeon RX 580 (Laptop)
NVIDIA GeForce GTX 1070 Mobile
max:
NVIDIA GeForce GTX 1050 Ti Mobile
NVIDIA GeForce GTX 1070 Mobile
max:
...
NVIDIA GeForce GTX 1050 Max-Q
NVIDIA GeForce GTX 1050 Ti Mobile
NVIDIA GeForce GTX 1050 Ti Max-Q
NVIDIA GeForce GTX 1070 Mobile
max:
NVIDIA Titan RTX
» Jugable con todos los portátiles probados en ajustes de detalle ultra.
...
NVIDIA GeForce GTX 1050 Ti Mobile
AMD Radeon RX 580 (Laptop)
NVIDIA GeForce GTX 1070 Mobile
max:
NVIDIA GeForce GTX 1060 (Desktop)
...
AMD Radeon RX 580 (Laptop)
NVIDIA GeForce GTX 1070 Mobile
max:
...
AMD Radeon RX 580 (Laptop)
NVIDIA GeForce GTX 1070 Mobile
...
max:
...
AMD Radeon RX 580 (Laptop)
NVIDIA GeForce GTX 1070 Mobile
max:
...
NVIDIA GeForce GTX 1050 Ti Mobile
NVIDIA GeForce GTX 1070 Mobile
max:
...
NVIDIA GeForce GTX 1050 Ti Mobile
NVIDIA GeForce GTX 1070 Mobile
max:
» Jugable con todos los portátiles probados en ajustes de detalle ultra.
...
AMD Radeon RX 580 (Laptop)
NVIDIA GeForce GTX 1050 Ti Mobile
NVIDIA GeForce GTX 1070 Mobile
max:
...
NVIDIA GeForce GTX 1050 Ti Mobile
AMD Radeon RX 580 (Laptop)
NVIDIA GeForce GTX 1070 Mobile
max:
NVIDIA Titan X Pascal
...
NVIDIA GeForce GTX 1050 Ti Mobile
AMD Radeon RX 580 (Laptop)
NVIDIA GeForce GTX 1070 Mobile
...
max:
NVIDIA Titan X Pascal
...
NVIDIA GeForce GTX 1050 Ti Mobile
AMD Radeon RX 580 (Laptop)
NVIDIA GeForce GTX 1070 Mobile
...
max:
NVIDIA GeForce GTX 1050 Ti Mobile
NVIDIA GeForce GTX 1070 Mobile
max:
» Jugable con todos los portátiles probados en ajustes de detalle ultra.
Additional Benchmarks
Ultra Preset FXAA + TAA 2560x1440
41.1 [X] Asus G752VS Intel Core i7-6820HK 2.7GHz
GeForce GTX 1070 Mobile
min:
36 fps
...
AMD Radeon RX 580 (Laptop)
NVIDIA GeForce GTX 1070 Mobile
...
AMD Radeon RX 580 (Laptop)
NVIDIA GeForce GTX 1070 Mobile
max:
...
AMD Radeon RX 580 (Laptop)
NVIDIA GeForce GTX 1070 Mobile
max:
...
AMD Radeon RX 580 (Laptop)
NVIDIA GeForce GTX 1070 Mobile
max:
...
NVIDIA GeForce GTX 1050 Ti Max-Q
NVIDIA GeForce GTX 1070 Mobile
max:
» Jugable con todos los portátiles probados en ajustes de detalle ultra.
Additional Benchmarks
Ultra Preset TAA 2560x1440
54 [X] Asus G752VS Intel Core i7-6820HK 2.7GHz
GeForce GTX 1070 Mobile
min:
26 fps
...
AMD Radeon RX 580 (Laptop)
NVIDIA GeForce GTX 1050 Max-Q
NVIDIA GeForce GTX 1050 Ti Mobile
NVIDIA GeForce GTX 1070 Mobile
max:
...
AMD Radeon RX 560 (Laptop)
NVIDIA GeForce GTX 1050 Max-Q
NVIDIA GeForce GTX 1050 Ti Mobile
AMD Radeon RX 580 (Laptop)
NVIDIA GeForce GTX 1070 Mobile
max:
...
NVIDIA GeForce GTX 1050 Max-Q
NVIDIA GeForce GTX 1050 Ti Mobile
AMD Radeon RX 580 (Laptop)
NVIDIA GeForce GTX 1070 Mobile
...
max:
...
NVIDIA GeForce GTX 1050 Ti Mobile
AMD Radeon RX 580 (Laptop)
NVIDIA GeForce GTX 1070 Mobile
...
max:
NVIDIA Titan RTX
...
NVIDIA GeForce GTX 1050 Max-Q
NVIDIA GeForce GTX 1050 Ti Mobile
NVIDIA GeForce GTX 1070 Mobile
max:
NVIDIA Titan RTX
» Jugable con todos los portátiles probados en ajustes de detalle ultra.
Additional Benchmarks
Medium Preset 1366x768
318 [X] Asus G752VS Intel Core i7-6820HK 2.7GHz
GeForce GTX 1070 Mobile
min:
289 fps
...
AMD Radeon RX 560X (Laptop)
AMD Radeon RX 580 (Laptop)
NVIDIA GeForce GTX 1050 Ti Mobile
NVIDIA Quadro P4000 Max-Q
NVIDIA GeForce GTX 1070 Mobile
...
NVIDIA GeForce GTX 1050 Ti Mobile
AMD Radeon RX 580 (Laptop)
NVIDIA Quadro P4000 Max-Q
NVIDIA GeForce GTX 1070 Mobile
max:
NVIDIA Titan X Pascal
...
NVIDIA GeForce GTX 1050 Ti Mobile
AMD Radeon RX 580 (Laptop)
NVIDIA Quadro P4000 Max-Q
NVIDIA GeForce GTX 1070 Mobile
max:
NVIDIA Titan X Pascal
...
AMD Radeon RX 560X (Laptop)
NVIDIA GeForce GTX 1050 Ti Mobile
AMD Radeon RX 580 (Laptop)
NVIDIA Quadro P4000 Max-Q
NVIDIA GeForce GTX 1070 Mobile
max:
NVIDIA Titan X Pascal
NVIDIA GeForce GTX 1070 Mobile
NVIDIA Quadro P4000 Max-Q
max:
NVIDIA Titan X Pascal
» Jugable con todos los portátiles probados en ajustes de detalle ultra.
Additional Benchmarks
Medium Preset (100 % Resolution Scale) 1366x768
101 [X] Asus G752VS Intel Core i7-6820HK 2.7GHz
GeForce GTX 1070 Mobile
min:
68 fps
...
AMD Radeon Pro 555
AMD Radeon Pro WX Vega M GL
AMD Radeon RX 580 (Laptop)
NVIDIA GeForce GTX 1050 Ti Mobile
NVIDIA Quadro P4000 Max-Q
NVIDIA GeForce GTX 1070 Mobile
...
NVIDIA GeForce GTX 1050 Ti Mobile
AMD Radeon RX 580 (Laptop)
NVIDIA Quadro P4000 Max-Q
NVIDIA GeForce GTX 1070 Mobile
max:
NVIDIA GeForce GTX 1070 SLI (Desktop)
...
NVIDIA GeForce GTX 1050 Ti Mobile
AMD Radeon RX 580 (Laptop)
NVIDIA Quadro P4000 Max-Q
NVIDIA GeForce GTX 1070 Mobile
max:
NVIDIA GeForce GTX 1070 SLI (Desktop)
...
AMD Radeon RX 580 (Laptop)
NVIDIA Quadro P4000 Max-Q
NVIDIA GeForce GTX 1070 Mobile
max:
NVIDIA Titan RTX
...
AMD Radeon Pro WX Vega M GL
AMD Radeon RX 580 (Laptop)
NVIDIA Quadro P4000 Max-Q
NVIDIA GeForce GTX 1070 Mobile
max:
NVIDIA Titan RTX
» Jugable con todos los portátiles probados en ajustes de detalle ultra.
Additional Benchmarks
Medium Preset 4xAF 1366x768
161 [X] Asus G752VS Intel Core i7-6820HK 2.7GHz
GeForce GTX 1070 Mobile
min:
126 fps
...
AMD Radeon RX 560 (Laptop)
AMD Radeon RX 580 (Laptop)
AMD Radeon RX 560X (Laptop)
NVIDIA GeForce GTX 1070 Mobile
NVIDIA GeForce GTX 1050 Ti Mobile
max:
...
NVIDIA GeForce GTX 1050 Ti Mobile
AMD Radeon RX 580 (Laptop)
NVIDIA GeForce GTX 1070 Mobile
...
NVIDIA GeForce GTX 1050 Max-Q
NVIDIA GeForce GTX 1050 Ti Mobile
AMD Radeon RX 580 (Laptop)
NVIDIA GeForce GTX 1070 Mobile
...
AMD Radeon RX 580 (Laptop)
NVIDIA GeForce GTX 1070 Mobile
max:
...
NVIDIA GeForce GTX 1050 Max-Q
AMD Radeon RX 580 (Laptop)
NVIDIA GeForce GTX 1070 Mobile
max:
NVIDIA Titan RTX
» Jugable con todos los portátiles probados en ajustes de detalle ultra.
Additional Benchmarks
Medium Preset 1366x768
112 [X] Asus G752VS Intel Core i7-6820HK 2.7GHz
GeForce GTX 1070 Mobile
min:
76 fps
...
NVIDIA Quadro P4000 Max-Q
AMD Radeon RX 580 (Laptop)
NVIDIA GeForce GTX 1050 Ti Mobile
NVIDIA GeForce GTX 1070 Mobile
...
NVIDIA GeForce GTX 1050 Ti Mobile
AMD Radeon RX 580 (Laptop)
NVIDIA Quadro P4000 Max-Q
NVIDIA GeForce GTX 1070 Mobile
max:
AMD Radeon VII
...
NVIDIA Quadro P4000 Max-Q
AMD Radeon RX 580 (Laptop)
NVIDIA GeForce GTX 1070 Mobile
max:
AMD Radeon VII
...
NVIDIA Quadro P4000 Max-Q
AMD Radeon RX 580 (Laptop)
NVIDIA GeForce GTX 1070 Mobile
max:
NVIDIA Titan RTX
NVIDIA GeForce GTX 1050 Max-Q
AMD Radeon Pro WX Vega M GL
NVIDIA Quadro P4000 Max-Q
NVIDIA GeForce GTX 1070 Mobile
max:
NVIDIA Titan RTX
» Jugable con todos los portátiles probados en ajustes de detalle ultra.
Additional Benchmarks
Medium Preset 4xAF 1366x768
200 [X] Asus G752VS Intel Core i7-6820HK 2.7GHz
GeForce GTX 1070 Mobile
min:
169 fps
...
NVIDIA Quadro P620
NVIDIA GeForce GTX 1050 Ti Max-Q
NVIDIA GeForce GTX 1070 Mobile
...
...
NVIDIA GeForce GTX 1070 Mobile
...
max:
...
NVIDIA Quadro P4000 Max-Q
AMD Radeon RX 580 (Laptop)
NVIDIA GeForce GTX 1070 Mobile
...
max:
NVIDIA Titan X Pascal
...
NVIDIA GeForce GTX 1070 Mobile
max:
» Jugable con todos los portátiles probados en ajustes de detalle alto.
Additional Benchmarks
Performance 1920x1080
250 [X] Asus G752VS Intel Core i7-6820HK 2.7GHz
GeForce GTX 1070 Mobile
min:
241 fps
...
AMD Radeon RX 580 (Laptop)
NVIDIA GeForce GTX 1050 Ti Mobile
NVIDIA Quadro P2000 Max-Q
NVIDIA Quadro P4000 Max-Q
NVIDIA GeForce GTX 1050 Ti Max-Q
NVIDIA GeForce GTX 1070 Mobile
NVIDIA Quadro P620
...
NVIDIA Quadro P2000 Max-Q
AMD Radeon RX 580 (Laptop)
NVIDIA Quadro P4000 Max-Q
NVIDIA GeForce GTX 1070 Mobile
...
AMD Radeon RX 580 (Laptop)
NVIDIA Quadro P2000 Max-Q
NVIDIA Quadro P4000 Max-Q
NVIDIA GeForce GTX 1070 Mobile
...
AMD Radeon R5 (Bristol Ridge)
...
NVIDIA Quadro P4000 Max-Q
NVIDIA Quadro P2000 Max-Q
NVIDIA GeForce GTX 1070 Mobile
...
...
NVIDIA Quadro P2000 Max-Q
NVIDIA Quadro P4000 Max-Q
NVIDIA GeForce GTX 1070 Mobile
...
max:
» Jugable con todos los portátiles probados en ajustes de detalle ultra.
Additional Benchmarks
Medium Preset 4xAF FXAA 1366x768
142 [X] Asus G752VS Intel Core i7-6820HK 2.7GHz
GeForce GTX 1070 Mobile
min:
135 fps
...
AMD Radeon RX 560X (Laptop)
NVIDIA GeForce GTX 1050 Ti Mobile
AMD Radeon RX 580 (Laptop)
NVIDIA GeForce GTX 1070 Mobile
max:
...
NVIDIA GeForce GTX 1050 Ti Mobile
AMD Radeon RX 560X (Laptop)
AMD Radeon RX 580 (Laptop)
NVIDIA GeForce GTX 1070 Mobile
max:
AMD Radeon RX Vega 8 (Ryzen 2000/3000)
...
NVIDIA GeForce GTX 1050 Ti Mobile
AMD Radeon RX 560X (Laptop)
NVIDIA GeForce GTX 1070 Mobile
AMD Radeon RX 580 (Laptop)
...
NVIDIA GeForce GTX 1050 Ti Mobile
AMD Radeon RX 560X (Laptop)
AMD Radeon RX 580 (Laptop)
NVIDIA GeForce GTX 1070 Mobile
...
NVIDIA GeForce GTX 1070 Mobile
» Jugable con todos los portátiles probados en ajustes de detalle ultra.
Additional Benchmarks
Medium / On (100 % Gameplay Resolution) MediumAA 1366x768
92.3 [X] Asus G752VS Intel Core i7-6820HK 2.7GHz
GeForce GTX 1070 Mobile
min:
81 fps
...
AMD Radeon Pro 555
NVIDIA GeForce GTX 1050 Ti Mobile
NVIDIA GeForce GTX 1070 Mobile
max:
...
AMD Radeon RX 580 (Laptop)
NVIDIA GeForce GTX 1050 Ti Mobile
NVIDIA GeForce GTX 1070 Mobile
max:
...
AMD Radeon RX 580 (Laptop)
NVIDIA GeForce GTX 1050 Ti Mobile
NVIDIA GeForce GTX 1070 Mobile
max:
...
AMD Radeon RX 580 (Laptop)
NVIDIA GeForce GTX 1050 Ti Mobile
NVIDIA GeForce GTX 1070 Mobile
max:
NVIDIA GeForce GTX 1070 Mobile
» Jugable con todos los portátiles probados en ajustes de detalle ultra.
Additional Benchmarks
Medium Preset (Resolution Scale Mode off) FXAA 1366x768
122 [X] Asus G752VS Intel Core i7-6820HK 2.7GHz
GeForce GTX 1070 Mobile
min:
100 fps
...
NVIDIA GeForce GTX 1050 Max-Q
NVIDIA GeForce GTX 1050 Ti Max-Q
AMD Radeon RX 580 (Laptop)
NVIDIA GeForce GTX 1050 Ti Mobile
NVIDIA GeForce GTX 1070 Mobile
max:
...
NVIDIA GeForce GTX 1070 Mobile
max:
...
NVIDIA GeForce GTX 1070 Mobile
max:
...
NVIDIA GeForce GTX 1070 Mobile
max:
NVIDIA Titan RTX
...
AMD Radeon RX 580 (Laptop)
NVIDIA GeForce GTX 1070 Mobile
max:
NVIDIA Titan RTX
» Jugable con todos los portátiles probados en ajustes de detalle ultra.
Additional Benchmarks
Medium Preset FXAA 1366x768
106 [X] Asus G752VS Intel Core i7-6820HK 2.7GHz
GeForce GTX 1070 Mobile
min:
92 fps
...
NVIDIA GeForce GTX 1070 Mobile
max:
...
NVIDIA GeForce GTX 1070 Mobile
max:
...
AMD Radeon RX 580 (Laptop)
NVIDIA GeForce GTX 1070 Mobile
max:
...
NVIDIA GeForce GTX 1070 Mobile
max:
NVIDIA Titan RTX
...
AMD Radeon RX 580 (Laptop)
NVIDIA GeForce GTX 1070 Mobile
...
» Jugable con todos los portátiles probados en ajustes de detalle ultra.
Additional Benchmarks
Medium Preset 4xAF TAA 1366x768
218 [X] Asus G752VS Intel Core i7-6820HK 2.7GHz
GeForce GTX 1070 Mobile
min:
142 fps
...
AMD Radeon Pro 460
AMD Radeon RX 560X (Laptop)
NVIDIA GeForce GTX 1050 Ti Mobile
AMD Radeon RX 580 (Laptop)
NVIDIA Quadro P4000 Max-Q
NVIDIA GeForce GTX 1070 Mobile
max:
...
NVIDIA GeForce GTX 1050 Ti Mobile
AMD Radeon Pro 555
AMD Radeon RX 580 (Laptop)
NVIDIA Quadro P4000 Max-Q
NVIDIA GeForce GTX 1070 Mobile
max:
...
AMD Radeon RX 580 (Laptop)
NVIDIA Quadro P4000 Max-Q
NVIDIA GeForce GTX 1070 Mobile
max:
...
AMD Radeon RX 580 (Laptop)
NVIDIA Quadro P4000 Max-Q
NVIDIA GeForce GTX 1070 Mobile
max:
...
AMD Radeon RX 580 (Laptop)
NVIDIA GeForce GTX 1070 Mobile
NVIDIA Quadro P4000 Max-Q
max:
» Jugable con todos los portátiles probados en ajustes de detalle ultra.
Additional Benchmarks
Medium / Off FXAA 1366x768
374 [X] Asus G752VS Intel Core i7-6820HK 2.7GHz
GeForce GTX 1070 Mobile
min:
331 fps
...
AMD Radeon RX 580 (Laptop)
NVIDIA GeForce GTX 1050 Ti Mobile
NVIDIA GeForce GTX 1070 Mobile
max:
...
AMD Radeon RX 580 (Laptop)
NVIDIA GeForce GTX 1050 Ti Mobile
NVIDIA GeForce GTX 1070 Mobile
max:
AMD Radeon RX Vega 8 (Ryzen 2000/3000)
...
NVIDIA GeForce GTX 1050 Ti Mobile
AMD Radeon RX 580 (Laptop)
NVIDIA GeForce GTX 1070 Mobile
max:
AMD Radeon RX Vega 8 (Ryzen 2000/3000)
...
NVIDIA GeForce GTX 1050 Ti Mobile
AMD Radeon RX 580 (Laptop)
NVIDIA GeForce GTX 1070 Mobile
NVIDIA GeForce GTX 1050 Ti Mobile
AMD Radeon RX 580 (Laptop)
NVIDIA GeForce GTX 1070 Mobile
» Jugable con todos los portátiles probados en ajustes de detalle ultra.
Additional Benchmarks
Medium Preset 1920x1080
107 [X] Asus G752VS Intel Core i7-6820HK 2.7GHz
GeForce GTX 1070 Mobile
min:
70 fps
...
AMD Radeon Pro 555
AMD Radeon RX 560X (Laptop)
AMD Radeon Pro 460
AMD Radeon RX 580 (Laptop)
NVIDIA GeForce GTX 1050 Ti Mobile
NVIDIA GeForce GTX 1070 Mobile
...
max:
...
AMD Radeon RX 560X (Laptop)
NVIDIA GeForce GTX 1050 Ti Mobile
AMD Radeon RX 580 (Laptop)
NVIDIA GeForce GTX 1070 Mobile
max:
NVIDIA Titan RTX
...
NVIDIA GeForce GTX 1050 Ti Mobile
AMD Radeon RX 580 (Laptop)
NVIDIA GeForce GTX 1070 Mobile
max:
NVIDIA Titan RTX
AMD Radeon RX Vega 8 (Ryzen 2000/3000)
...
NVIDIA GeForce GTX 1050 Ti Mobile
AMD Radeon RX 580 (Laptop)
NVIDIA GeForce GTX 1070 Mobile
NVIDIA GeForce GTX 1050 Ti Mobile
AMD Radeon RX 580 (Laptop)
NVIDIA GeForce GTX 1070 Mobile
...
max:
NVIDIA Titan RTX
» Jugable con todos los portátiles probados en ajustes de detalle ultra.
Additional Benchmarks
Medium Preset TXAA 1920x1080
86.4 [X] Asus G752VS Intel Core i7-6820HK 2.7GHz
GeForce GTX 1070 Mobile
min:
73 fps
...
AMD Radeon Pro 460
AMD Radeon RX 580 (Laptop)
NVIDIA GeForce GTX 1050 Ti Mobile
NVIDIA GeForce GTX 1070 Mobile
...
max:
NVIDIA Titan X Pascal
...
AMD Radeon RX 580 (Laptop)
NVIDIA GeForce GTX 1050 Ti Mobile
NVIDIA GeForce GTX 1070 Mobile
...
max:
NVIDIA Titan X Pascal
...
NVIDIA GeForce GTX 1050 Ti Mobile
AMD Radeon RX 580 (Laptop)
NVIDIA GeForce GTX 1070 Mobile
max:
...
NVIDIA GeForce GTX 1050 Ti Mobile
AMD Radeon RX 580 (Laptop)
NVIDIA GeForce GTX 1070 Mobile
...
max:
NVIDIA Titan X Pascal
...
NVIDIA GeForce GTX 1050 Ti Mobile
AMD Radeon RX 580 (Laptop)
NVIDIA GeForce GTX 1070 Mobile
max:
» Jugable con todos los portátiles probados en ajustes de detalle ultra.
Additional Benchmarks
Normal / Off 1920x1080
123 [X] Asus G752VS Intel Core i7-6820HK 2.7GHz
GeForce GTX 1070 Mobile
min:
113 fps
...
AMD Radeon Pro 460
NVIDIA GeForce GTX 1050 Ti Mobile
NVIDIA GeForce GTX 1070 Mobile
...
max:
NVIDIA Titan X Pascal
...
NVIDIA GeForce GTX 1050 Ti Mobile
AMD Radeon RX 580 (Laptop)
NVIDIA GeForce GTX 1070 Mobile
...
max:
NVIDIA Titan X Pascal
...
NVIDIA GeForce GTX 1050 Ti Mobile
AMD Radeon RX 580 (Laptop)
NVIDIA GeForce GTX 1070 Mobile
max:
NVIDIA Titan X Pascal
...
NVIDIA GeForce GTX 1050 Ti Mobile
AMD Radeon RX 580 (Laptop)
NVIDIA GeForce GTX 1070 Mobile
max:
...
NVIDIA GeForce GTX 1050 Ti Mobile
NVIDIA GeForce GTX 1070 Mobile
max:
NVIDIA Titan X Pascal
» Jugable con todos los portátiles probados en ajustes de detalle ultra.
Additional Benchmarks
Medium / Disabled 4xAF 1920x1080
142 [X] Asus G752VS Intel Core i7-6820HK 2.7GHz
GeForce GTX 1070 Mobile
min:
131 fps
...
AMD Radeon Pro 460
NVIDIA GeForce GTX 1070 Mobile
...
NVIDIA GeForce GTX 1070 Mobile
...
NVIDIA GeForce GTX 1050 Ti Mobile
NVIDIA GeForce GTX 1050 Ti Max-Q
NVIDIA GeForce GTX 1070 Mobile
max:
NVIDIA GeForce GTX 1060 (Desktop)
...
NVIDIA GeForce GTX 1050 Ti Max-Q
NVIDIA GeForce GTX 1050 Ti Mobile
NVIDIA GeForce GTX 1070 Mobile
...
max:
...
NVIDIA GeForce GTX 1050 Ti Mobile
NVIDIA GeForce GTX 1070 Mobile
max:
NVIDIA Titan X Pascal
» Jugable con todos los portátiles probados en ajustes de detalle ultra.
Additional Benchmarks
Medium Preset 1920x1080
214 [X] Asus G752VS Intel Core i7-6820HK 2.7GHz
GeForce GTX 1070 Mobile
min:
185 fps
AMD Radeon R4 (Stoney Ridge)
...
NVIDIA GeForce GTX 1050 Max-Q
NVIDIA GeForce GTX 1070 Mobile
max:
...
AMD Radeon RX 580 (Laptop)
NVIDIA GeForce GTX 1070 Mobile
max:
...
AMD Radeon RX 580 (Laptop)
NVIDIA GeForce GTX 1070 Mobile
max:
...
AMD Radeon RX 580 (Laptop)
NVIDIA GeForce GTX 1070 Mobile
max:
...
NVIDIA GeForce GTX 1050 Ti Max-Q
AMD Radeon RX 580 (Laptop)
NVIDIA GeForce GTX 1070 Mobile
max:
» Jugable con todos los portátiles probados en ajustes de detalle ultra.
Additional Benchmarks
Medium Preset FXAA 1920x1080
162 [X] Asus G752VS Intel Core i7-6820HK 2.7GHz
GeForce GTX 1070 Mobile
min:
140 fps
...
AMD Radeon Pro WX 3100
NVIDIA Quadro P4000 Max-Q
Apple M1 7-Core GPU
NVIDIA GeForce GTX 1070 Mobile
NVIDIA GeForce GTX 1050 Ti Mobile
AMD Radeon RX 580 (Laptop)
AMD Radeon RX 560X (Laptop)
NVIDIA GeForce GTX 1050 Ti Max-Q
...
...
AMD Radeon Pro WX 3100
NVIDIA GeForce GTX 1070 Mobile
Apple M1 Pro 14-Core GPU
NVIDIA Quadro P4000 Max-Q
NVIDIA GeForce GTX 1050 Ti Mobile
AMD Radeon RX 560X (Laptop)
NVIDIA GeForce GTX 1050 Max-Q
AMD Radeon RX 580 (Laptop)
...
...
Apple M1 Pro 16-Core GPU
NVIDIA GeForce GTX 1050 Ti Mobile
NVIDIA GeForce GTX 1050 Ti Max-Q
NVIDIA GeForce GTX 1070 Mobile
NVIDIA Quadro P4000 Max-Q
AMD Radeon RX 580 (Laptop)
...
NVIDIA GeForce GTX 1050 Ti Max-Q
NVIDIA GeForce GTX 1050 Ti Mobile
Apple M1 Pro 16-Core GPU
NVIDIA GeForce GTX 1070 Mobile
NVIDIA Quadro P4000 Max-Q
AMD Radeon RX 580 (Laptop)
...
Apple M1 7-Core GPU
NVIDIA GeForce GTX 1050 Max-Q
NVIDIA Quadro P4000 Max-Q
NVIDIA GeForce GTX 1070 Mobile
max:
» Jugable con todos los portátiles probados en ajustes de detalle ultra.
Additional Benchmarks
Medium Preset 1920x1080
58.9 [X] Asus G752VS Intel Core i7-6820HK 2.7GHz
GeForce GTX 1070 Mobile
min:
48 fps
...
AMD Radeon RX 580 (Laptop)
NVIDIA GeForce GTX 1050 Ti Mobile
NVIDIA GeForce GTX 1070 Mobile
NVIDIA Quadro P4000 Max-Q
...
AMD Radeon RX 580 (Laptop)
NVIDIA GeForce GTX 1050 Ti Mobile
NVIDIA GeForce GTX 1070 Mobile
NVIDIA Quadro P4000 Max-Q
43.2 46.6 [X] Asus G752VS Intel Core i7-6820HK 2.7GHz
GeForce GTX 1070 Mobile
min:
42 fps
58 62 65.7 65.9 [X] Saelic Vidi G771D Intel Core i7-7700 3.6GHz
GeForce GTX 1070 Mobile
66 67.5 [X] Aorus X5 v6 AO-S107W516-PL-002 Intel Core i7-6820HK 2.7GHz
GeForce GTX 1070 Mobile
67.9 [X] Smart7 Karme GX17E G2 Intel Core i5-8600K 3.6GHz
GeForce GTX 1070 Mobile
71.3 [X] Aorus X7 v6 AO-S107Q716-PL-005 Intel Core i7-6820HK 2.7GHz
GeForce GTX 1070 Mobile
~ 61 fps
+ Comparar
- Ocultar comparación
...
NVIDIA GeForce GTX 1050 Ti Mobile
AMD Radeon RX 580 (Laptop)
NVIDIA Quadro P4000 Max-Q
NVIDIA GeForce GTX 1070 Mobile
max:
NVIDIA GeForce GTX 1050 Ti Mobile
NVIDIA Quadro P4000 Max-Q
NVIDIA GeForce GTX 1070 Mobile
max:
» Jugable con todos los portátiles probados en ajustes de detalle alto.
Additional Benchmarks
Medium Preset 1920x1080
60.3 [X] Asus G752VS Intel Core i7-6820HK 2.7GHz
GeForce GTX 1070 Mobile
min:
54 fps
...
AMD Radeon RX 580 (Laptop)
AMD Radeon Pro 460
NVIDIA GeForce GTX 1070 Mobile
max:
NVIDIA GeForce GTX 1060 (Desktop)
...
AMD Radeon RX 580 (Laptop)
NVIDIA GeForce GTX 1070 Mobile
max:
AMD Radeon RX 480 (Desktop)
...
AMD Radeon Pro 460
AMD Radeon RX 580 (Laptop)
NVIDIA GeForce GTX 1070 Mobile
max:
NVIDIA Titan RTX
...
AMD Radeon Pro 460
AMD Radeon RX 580 (Laptop)
NVIDIA GeForce GTX 1070 Mobile
max:
NVIDIA Titan RTX
...
NVIDIA GeForce GTX 1050 Ti Mobile
AMD Radeon RX 580 (Laptop)
NVIDIA GeForce GTX 1070 Mobile
max:
NVIDIA Titan RTX
» Jugable con todos los portátiles probados en ajustes de detalle ultra.
Additional Benchmarks
Medium Preset 1920x1080
323 [X] Asus G752VS Intel Core i7-6820HK 2.7GHz
GeForce GTX 1070 Mobile
min:
301 fps
...
NVIDIA GeForce GTX 1050 Ti Mobile
NVIDIA GeForce GTX 1070 Mobile
NVIDIA Quadro P4000 Max-Q
max:
...
AMD Radeon RX 580 (Laptop)
NVIDIA GeForce GTX 1050 Ti Mobile
NVIDIA Quadro P4000 Max-Q
NVIDIA GeForce GTX 1070 Mobile
...
NVIDIA Quadro P4000 Max-Q
max:
...
Apple M1 Pro 16-Core GPU
AMD Radeon RX 580 (Laptop)
NVIDIA Quadro P4000 Max-Q
NVIDIA GeForce GTX 1070 Mobile
max:
...
AMD Radeon RX 580 (Laptop)
NVIDIA Quadro P4000 Max-Q
NVIDIA GeForce GTX 1070 Mobile
Apple M1 Pro 16-Core GPU
...
NVIDIA GeForce GTX 1050 Max-Q
...
AMD Radeon RX 580 (Laptop)
NVIDIA Quadro P4000 Max-Q
NVIDIA GeForce GTX 1070 Mobile
max:
NVIDIA Titan RTX
» Jugable con todos los portátiles probados en ajustes de detalle ultra.
Additional Benchmarks
Medium Preset 2xAF 1920x1080
84.4 [X] Asus G752VS Intel Core i7-6820HK 2.7GHz
GeForce GTX 1070 Mobile
min:
68 fps
...
NVIDIA GeForce GTX 1070 Mobile
max:
...
NVIDIA GeForce GTX 1070 Mobile
max:
NVIDIA GeForce GTX 1060 (Desktop)
...
NVIDIA GeForce GTX 1050 Ti Mobile
NVIDIA GeForce GTX 1070 Mobile
...
NVIDIA GeForce GTX 1050 Ti Mobile
NVIDIA GeForce GTX 1070 Mobile
NVIDIA GeForce GTX 1050 Ti Mobile
NVIDIA GeForce GTX 1070 Mobile
max:
NVIDIA Titan X Pascal
» Jugable con todos los portátiles probados en ajustes de detalle ultra.
Additional Benchmarks
Medium 4x AF Off AA 1920x1080
130 [X] Asus G752VS Intel Core i7-6820HK 2.7GHz
GeForce GTX 1070 Mobile
min:
96 fps
...
AMD Radeon RX 580 (Laptop)
NVIDIA GeForce GTX 1070 Mobile
...
max:
...
AMD Radeon RX 560X (Laptop)
AMD Radeon RX 580 (Laptop)
NVIDIA GeForce GTX 1070 Mobile
max:
...
AMD Radeon RX 580 (Laptop)
NVIDIA GeForce GTX 1070 Mobile
...
AMD Radeon RX 580 (Laptop)
NVIDIA GeForce GTX 1070 Mobile
...
...
AMD Radeon RX 580 (Laptop)
NVIDIA GeForce GTX 1070 Mobile
» Jugable con todos los portátiles probados en ajustes de detalle ultra.
...
AMD Radeon RX 580 (Laptop)
NVIDIA GeForce GTX 1070 Mobile
...
AMD Radeon R5 (Bristol Ridge)
...
NVIDIA GeForce GTX 1070 Mobile
max:
NVIDIA Titan RTX
...
NVIDIA GeForce GTX 1070 Mobile
max:
NVIDIA Titan RTX
» Jugable con todos los portátiles probados en ajustes de detalle ultra.
...
NVIDIA GeForce GTX 1050 Ti Mobile
NVIDIA Quadro P4000 Max-Q
NVIDIA GeForce GTX 1070 Mobile
...
NVIDIA Quadro P2000 Max-Q
NVIDIA GeForce GTX 1050 Ti Mobile
NVIDIA Quadro P4000 Max-Q
NVIDIA GeForce GTX 1070 Mobile
...
NVIDIA Quadro P4000 Max-Q
NVIDIA GeForce GTX 1070 Mobile
...
...
NVIDIA Quadro P4000 Max-Q
NVIDIA GeForce GTX 1070 Mobile
max:
...
AMD Radeon RX 580 (Laptop)
NVIDIA Quadro P4000 Max-Q
NVIDIA GeForce GTX 1070 Mobile
...
max:
NVIDIA Titan RTX
» Jugable con todos los portátiles probados en ajustes de detalle ultra.
Additional Benchmarks
Medium Preset 1920x1080
...
NVIDIA Quadro P620
NVIDIA GeForce GTX 1050 Max-Q
NVIDIA Quadro P2000 Max-Q
NVIDIA GeForce GTX 1050 Ti Mobile
NVIDIA GeForce GTX 1050 Ti Max-Q
NVIDIA GeForce GTX 1070 Mobile
NVIDIA Quadro P4000 Max-Q
...
AMD Radeon R5 (Bristol Ridge)
...
NVIDIA GeForce GTX 1050 Ti Mobile
NVIDIA GeForce GTX 1050 Ti Max-Q
NVIDIA GeForce GTX 1070 Mobile
NVIDIA Quadro P4000 Max-Q
...
NVIDIA Quadro P4000 Max-Q
NVIDIA GeForce GTX 1070 Mobile
» Jugable con todos los portátiles probados en ajustes de detalle alto.
...
NVIDIA GeForce GTX 1070 Mobile
...
NVIDIA GeForce GTX 1070 Mobile
max:
...
NVIDIA GeForce GTX 1050 Ti Mobile
NVIDIA GeForce GTX 1070 Mobile
max:
...
NVIDIA GeForce GTX 1050 Ti Mobile
NVIDIA GeForce GTX 1070 Mobile
...
max:
...
NVIDIA GeForce GTX 1050 Ti Mobile
NVIDIA GeForce GTX 1070 Mobile
» Jugable con todos los portátiles probados en ajustes de detalle ultra.
Additional Benchmarks
Medium / Off 1920x1080
...
AMD Radeon Pro 455
NVIDIA GeForce GTX 1070 Mobile
...
NVIDIA GeForce GTX 1070 Mobile
...
NVIDIA GeForce GTX 1050 Ti Mobile
AMD Radeon RX 580 (Laptop)
NVIDIA GeForce GTX 1070 Mobile
max:
...
NVIDIA GeForce GTX 1050 Ti Mobile
AMD Radeon RX 580 (Laptop)
NVIDIA GeForce GTX 1070 Mobile
...
NVIDIA GeForce GTX 1050 Ti Mobile
NVIDIA GeForce GTX 1070 Mobile
max:
» Jugable con todos los portátiles probados en ajustes de detalle ultra.
...
NVIDIA GeForce GTX 1050 Ti Mobile
AMD Radeon RX 580 (Laptop)
NVIDIA GeForce GTX 1070 Mobile
...
max:
...
NVIDIA GeForce GTX 1050 Ti Mobile
AMD Radeon RX 580 (Laptop)
NVIDIA GeForce GTX 1070 Mobile
...
max:
NVIDIA Titan RTX
NVIDIA GeForce GTX 1050 Max-Q
...
NVIDIA GeForce GTX 1050 Ti Mobile
AMD Radeon RX 580 (Laptop)
NVIDIA GeForce GTX 1070 Mobile
max:
NVIDIA Titan RTX
» Jugable con todos los portátiles probados en ajustes de detalle ultra.
...
AMD Radeon RX 580 (Laptop)
NVIDIA GeForce GTX 1070 Mobile
...
AMD Radeon RX 580 (Laptop)
NVIDIA GeForce GTX 1070 Mobile
max:
...
NVIDIA GeForce GTX 1050 Ti Mobile
AMD Radeon RX 580 (Laptop)
NVIDIA GeForce GTX 1070 Mobile
max:
...
AMD Radeon RX 580 (Laptop)
NVIDIA GeForce GTX 1070 Mobile
max:
...
NVIDIA GeForce GTX 1050 Ti Mobile
AMD Radeon RX 580 (Laptop)
NVIDIA GeForce GTX 1070 Mobile
max:
NVIDIA Titan RTX
» Jugable con todos los portátiles probados en ajustes de detalle ultra.
Additional Benchmarks
Low Preset 1920x1080
...
AMD Radeon Pro 455
AMD Radeon RX 580 (Laptop)
NVIDIA GeForce GTX 1070 Mobile
AMD Radeon Pro 460
...
AMD Radeon RX 580 (Laptop)
NVIDIA GeForce GTX 1070 Mobile
...
NVIDIA GeForce GTX 1050 Ti Mobile
AMD Radeon RX 580 (Laptop)
NVIDIA GeForce GTX 1070 Mobile
...
NVIDIA GeForce GTX 1050 Ti Mobile
AMD Radeon RX 580 (Laptop)
NVIDIA GeForce GTX 1070 Mobile
NVIDIA GeForce GTX 1050 Ti Mobile
NVIDIA GeForce GTX 1070 Mobile
» Jugable con todos los portátiles probados en ajustes de detalle ultra.
...
NVIDIA Quadro P4000 Max-Q
AMD Radeon RX 580 (Laptop)
NVIDIA GeForce GTX 1070 Mobile
...
max:
...
NVIDIA Quadro P4000 Max-Q
NVIDIA GeForce GTX 1070 Mobile
...
max:
...
NVIDIA GeForce GTX 1070 Mobile
...
max:
...
NVIDIA GeForce GTX 1070 Mobile
...
max:
...
NVIDIA Quadro P4000 Max-Q
NVIDIA GeForce GTX 1070 Mobile
...
max:
» Jugable con todos los portátiles probados en ajustes de detalle ultra.
...
NVIDIA GeForce GTX 1070 Mobile
max:
...
NVIDIA GeForce GTX 1070 Mobile
...
max:
...
AMD Radeon RX 580 (Laptop)
NVIDIA GeForce GTX 1070 Mobile
...
max:
NVIDIA Titan RTX
» Jugable con todos los portátiles probados en ajustes de detalle ultra.
...
NVIDIA GeForce GTX 1050 Ti Mobile
NVIDIA Quadro P4000 Max-Q
NVIDIA GeForce GTX 1070 Mobile
max:
...
NVIDIA GeForce GTX 1050 Ti Mobile
NVIDIA Quadro P4000 Max-Q
NVIDIA GeForce GTX 1070 Mobile
...
max:
NVIDIA Titan X Pascal
» Jugable con todos los portátiles probados en ajustes de detalle ultra.
...
AMD Radeon RX 580 (Laptop)
NVIDIA GeForce GTX 1070 Mobile
...
...
AMD Radeon RX 580 (Laptop)
NVIDIA GeForce GTX 1070 Mobile
...
AMD Radeon RX 580 (Laptop)
NVIDIA GeForce GTX 1070 Mobile
» Jugable con todos los portátiles probados en ajustes de detalle ultra.
...
AMD Radeon RX 580 (Laptop)
NVIDIA GeForce GTX 1050 Ti Mobile
NVIDIA GeForce GTX 1070 Mobile
max:
NVIDIA Titan X Pascal
...
AMD Radeon RX 580 (Laptop)
NVIDIA GeForce GTX 1070 Mobile
...
NVIDIA GeForce GTX 1050 Ti Mobile
AMD Radeon RX 580 (Laptop)
NVIDIA GeForce GTX 1070 Mobile
» Jugable con todos los portátiles probados en ajustes de detalle ultra.
...
NVIDIA GeForce GTX 1050 Ti Mobile
NVIDIA Quadro P4000 Max-Q
NVIDIA GeForce GTX 1070 Mobile
...
...
NVIDIA Quadro P4000 Max-Q
NVIDIA GeForce GTX 1070 Mobile
...
max:
...
NVIDIA GeForce GTX 1050 Ti Mobile
NVIDIA Quadro P4000 Max-Q
NVIDIA GeForce GTX 1070 Mobile
» Jugable con todos los portátiles probados en ajustes de detalle ultra.
...
NVIDIA Quadro P4000 Max-Q
NVIDIA GeForce GTX 1070 Mobile
...
NVIDIA GeForce GTX 1070 Mobile
...
NVIDIA Quadro P4000 Max-Q
NVIDIA GeForce GTX 1070 Mobile
» Jugable con todos los portátiles probados en ajustes de detalle ultra.
...
NVIDIA GeForce GTX 1050 Ti Mobile
AMD Radeon RX 580 (Laptop)
NVIDIA GeForce GTX 1070 Mobile
max:
...
NVIDIA GeForce GTX 1050 Ti Mobile
AMD Radeon RX 580 (Laptop)
NVIDIA GeForce GTX 1070 Mobile
max:
NVIDIA Titan X Pascal
...
NVIDIA GeForce GTX 1050 Ti Mobile
NVIDIA GeForce GTX 1070 Mobile
max:
NVIDIA Titan X Pascal
» Jugable con todos los portátiles probados en ajustes de detalle ultra.
...
NVIDIA GeForce GTX 1070 Mobile
...
NVIDIA GeForce GTX 1070 Mobile
max:
NVIDIA Titan X Pascal
» Jugable con todos los portátiles probados en ajustes de detalle ultra.
...
NVIDIA GeForce GTX 1070 Mobile
NVIDIA GeForce GTX 1050 Ti Mobile
NVIDIA Quadro P2000 Max-Q
...
...
AMD Radeon Pro WX Vega M GL
NVIDIA GeForce GTX 1070 Mobile
...
...
NVIDIA Quadro P2000 Max-Q
NVIDIA Quadro P4000 Max-Q
NVIDIA GeForce GTX 1070 Mobile
...
» Jugable con todos los portátiles probados en ajustes de detalle ultra.
...
NVIDIA GeForce GTX 1050 Ti Mobile
NVIDIA GeForce GTX 1070 Mobile
...
NVIDIA GeForce GTX 1050 Ti Mobile
NVIDIA GeForce GTX 1070 Mobile
» Jugable con todos los portátiles probados en ajustes de detalle ultra.
...
NVIDIA GeForce GTX 1070 Mobile
NVIDIA Quadro P4000 Max-Q
...
NVIDIA Quadro P4000 Max-Q
NVIDIA GeForce GTX 1070 Mobile
...
AMD Radeon RX 580 (Laptop)
NVIDIA Quadro P4000 Max-Q
NVIDIA GeForce GTX 1070 Mobile
56 [X] Saelic Vidi G761 Intel Core i7-6700HQ 2.6GHz
GeForce GTX 1070 Mobile
73 [X] Smart7 Karme GX17E G2 Intel Core i5-8600K 3.6GHz
GeForce GTX 1070 Mobile
77 78 79 85 85 86 [X] Saelic Vidi G771D Intel Core i7-7700 3.6GHz
GeForce GTX 1070 Mobile
87 87 [X] Saelic Vidi G761D Intel Core i7-6700K 4GHz
GeForce GTX 1070 Mobile
87 87 [X] Aorus X5 v6 AO-S107W516-PL-002 Intel Core i7-6820HK 2.7GHz
GeForce GTX 1070 Mobile
89 89 [X] Aorus X7 v6 AO-S107Q716-PL-005 Intel Core i7-6820HK 2.7GHz
GeForce GTX 1070 Mobile
117 ~ 84 fps
+ Comparar
- Ocultar comparación
...
NVIDIA Quadro P2000 Max-Q
NVIDIA GeForce GTX 1070 Mobile
NVIDIA Quadro P4000 Max-Q
...
AMD Radeon RX 580 (Laptop)
NVIDIA Quadro P4000 Max-Q
NVIDIA GeForce GTX 1070 Mobile
» Jugable con todos los portátiles probados en ajustes de detalle ultra.
...
NVIDIA GeForce GTX 1070 Mobile
...
max:
...
NVIDIA GeForce GTX 1070 Mobile
...
max:
...
NVIDIA GeForce GTX 1070 Mobile
...
max:
0 Tooltip Q8: Ø47 (40-65)
P56XT: Ø54.9 (52-58)
GL504GS: Ø56.4 (53-61)
Predator Helios 500 PH517-51-79BY: Ø58.5 (36-65)
Omen 17t-3AW55AV_1: Ø56.3 (52-61)
Erazer X7857: Ø57.6 (51-65)
Strix GL702VSK: Ø58.1 (49-61)
Omen 17-an014ng: Ø56.6 (50-60)
GE73VR 7RF Raider: Ø60.2 (55-65)
Legion Y920-17IKB: Ø59 (50-61)
Legion Y920-17IKB: Ø60 (56-61)
Predator 17 G9-793-70PJ: Ø57.6 (54-61)
Zephyrus M GM501: Ø55.6 (51-59)
15 R4: Ø59.6 (54-64)
Predator 15 G9-593-751X: Ø57.2 (54-61)
G752VS-BA338T: Ø60.1 (57-63)
X5 v8: Ø57.2 (53-62)
GE63 Raider RGB 8RF-008: Ø61.5 (56-67)
17 R5: Ø61.9 (57-66)
X5 v7: Ø56.9 (53-61)
X7 v7: Ø58.7 (54-64)
XMG Pro 17: Ø57.9 (54-63)
GE63VR 7RF Raider: Ø59 (56-62)
GE73 8RF-008 Raider RGB: Ø60.3 (57-63)
XMG U507 2017: Ø60.1 (56-64)
XMG Ultra 15: Ø62.6 (59-67)
Sky MX5 R3: Ø61.4 (58-65)
...
NVIDIA GeForce GTX 1070 Mobile
...
max:
...
NVIDIA GeForce GTX 1070 Mobile
...
max:
» Jugable con todos los portátiles probados en ajustes de detalle ultra.
...
NVIDIA GeForce GTX 1070 Mobile
...
NVIDIA Quadro P2000 Max-Q
NVIDIA GeForce GTX 1070 Mobile
max:
NVIDIA GeForce GTX 1060 (Desktop)
...
NVIDIA Quadro P2000 Max-Q
NVIDIA GeForce GTX 1050 Ti Mobile
NVIDIA GeForce GTX 1070 Mobile
...
...
NVIDIA GeForce GTX 1050 Ti Mobile
NVIDIA Quadro P2000 Max-Q
NVIDIA GeForce GTX 1070 Mobile
...
NVIDIA Quadro P2000 Max-Q
NVIDIA GeForce GTX 1050 Ti Mobile
NVIDIA GeForce GTX 1070 Mobile
» Jugable con todos los portátiles probados en ajustes de detalle ultra.
...
AMD Radeon RX 5300M
NVIDIA GeForce GTX 1070 Mobile
...
max:
...
NVIDIA GeForce GTX 1050 Ti Max-Q
NVIDIA GeForce GTX 1070 Mobile
...
max:
...
NVIDIA GeForce GTX 1070 Mobile
...
max:
...
NVIDIA GeForce GTX 1070 Mobile
...
max:
...
NVIDIA GeForce GTX 1050 Ti Max-Q
NVIDIA GeForce GTX 1070 Mobile
...
max:
» Jugable con todos los portátiles probados en ajustes de detalle ultra.
...
NVIDIA GeForce GTX 1070 Mobile
...
NVIDIA GeForce GTX 1070 Mobile
» Jugable con todos los portátiles probados en ajustes de detalle ultra.
...
NVIDIA GeForce GTX 1050 Ti Mobile
AMD Radeon RX 580 (Laptop)
NVIDIA GeForce GTX 1070 Mobile
...
NVIDIA GeForce GTX 1050 Ti Mobile
AMD Radeon RX 580 (Laptop)
NVIDIA GeForce GTX 1070 Mobile
max:
» Jugable con todos los portátiles probados en ajustes de detalle ultra.
...
NVIDIA Quadro P4000 Max-Q
NVIDIA GeForce GTX 1070 Mobile
...
NVIDIA Quadro P4000 Max-Q
NVIDIA GeForce GTX 1070 Mobile
» Jugable con todos los portátiles probados en ajustes de detalle ultra.
...
NVIDIA GeForce GTX 1070 Mobile
NVIDIA Quadro P4000 Max-Q
NVIDIA GeForce GTX 1050 Ti Mobile
...
max:
NVIDIA GeForce GTX 1060 (Desktop)
...
NVIDIA GeForce GTX 1050 Ti Mobile
NVIDIA GeForce GTX 1070 Mobile
NVIDIA Quadro P4000 Max-Q
max:
...
NVIDIA GeForce GTX 1050 Ti Mobile
NVIDIA GeForce GTX 1070 Mobile
NVIDIA Quadro P4000 Max-Q
» Jugable con todos los portátiles probados en ajustes de detalle ultra.
...
NVIDIA GeForce GTX 1050 Ti Mobile
NVIDIA Quadro P4000 Max-Q
NVIDIA GeForce GTX 1070 Mobile
...
NVIDIA GeForce GTX 1050 Ti Mobile
NVIDIA Quadro P4000 Max-Q
NVIDIA GeForce GTX 1070 Mobile
» Jugable con todos los portátiles probados en ajustes de detalle ultra.
...
AMD Radeon RX 560X (Laptop)
NVIDIA GeForce GTX 1070 Mobile
...
NVIDIA GeForce GTX 1070 Mobile
max:
NVIDIA Titan X Pascal
» Jugable con todos los portátiles probados en ajustes de detalle ultra.
...
NVIDIA GeForce GTX 1070 Mobile
...
NVIDIA GeForce GTX 1070 Mobile
...
NVIDIA GeForce GTX 1050 Ti Mobile
NVIDIA GeForce GTX 1070 Mobile
...
max:
...
NVIDIA GeForce GTX 1050 Ti Mobile
NVIDIA GeForce GTX 1070 Mobile
max:
NVIDIA GeForce GTX 1060 (Desktop)
» Jugable con todos los portátiles probados en ajustes de detalle ultra.
...
NVIDIA GeForce GTX 1070 Mobile
max:
NVIDIA GeForce GTX 1060 (Desktop)
...
NVIDIA GeForce GTX 1070 Mobile
» Jugable con todos los portátiles probados en ajustes de detalle ultra.
...
NVIDIA Quadro P4000 Max-Q
NVIDIA GeForce GTX 1050 Max-Q
NVIDIA GeForce GTX 1070 Mobile
...
...
NVIDIA GeForce GTX 1050 Ti Mobile
NVIDIA Quadro P4000 Max-Q
NVIDIA GeForce GTX 1070 Mobile
...
NVIDIA GeForce GTX 1050 Ti Mobile
NVIDIA Quadro P4000 Max-Q
NVIDIA GeForce GTX 1070 Mobile
77 78 80 86.5 [X] Saelic Vidi G761 Intel Core i7-6700HQ 2.6GHz
GeForce GTX 1070 Mobile
88.3 [X] Medion Erazer X7849 MD 60292 Intel Core i7-6820HK 2.7GHz
GeForce GTX 1070 Mobile
88.5 101.6 [X] Asus G752VS-XB78K Intel Core i7-6820HK @3.8GHz
GeForce GTX 1070 Mobile
min:
73.9 fps, max:
128.7 fps
103.2 103.3 [X] Saelic Vidi G771D Intel Core i7-7700 3.6GHz
GeForce GTX 1070 Mobile
106.6 107 107.6 [X] Saelic Vidi G761D Intel Core i7-6700K 4GHz
GeForce GTX 1070 Mobile
108.2 [X] Aorus X5 v6 AO-S107W516-PL-002 Intel Core i7-6820HK 2.7GHz
GeForce GTX 1070 Mobile
109.6 [X] Aorus X7 v6 AO-S107Q716-PL-005 Intel Core i7-6820HK 2.7GHz
GeForce GTX 1070 Mobile
120.8 [X] Smart7 Karme GX17E G2 Intel Core i5-8600K 3.6GHz
GeForce GTX 1070 Mobile
~ 98 fps
+ Comparar
- Ocultar comparación
...
NVIDIA Quadro P4000 Max-Q
NVIDIA GeForce GTX 1070 Mobile
» Jugable con todos los portátiles probados en ajustes de detalle ultra.
...
NVIDIA GeForce GTX 1050 Ti Mobile
NVIDIA GeForce GTX 1070 Mobile
max:
NVIDIA Titan RTX
...
NVIDIA GeForce GTX 1050 Ti Mobile
NVIDIA GeForce GTX 1070 Mobile
max:
NVIDIA Titan RTX
...
NVIDIA GeForce GTX 1050 Ti Mobile
NVIDIA GeForce GTX 1070 Mobile
max:
NVIDIA Titan RTX
...
NVIDIA GeForce GTX 1050 Ti Mobile
NVIDIA GeForce GTX 1070 Mobile
max:
NVIDIA Titan RTX
...
NVIDIA GeForce GTX 1070 Mobile
» Jugable con todos los portátiles probados en ajustes de detalle ultra.
...
NVIDIA GeForce GTX 1050 Ti Mobile
NVIDIA GeForce GTX 1070 Mobile
75.5 [X] Saelic Vidi G761 Intel Core i7-6700HQ 2.6GHz
GeForce GTX 1070 Mobile
92.3 [X] Saelic Vidi G771D Intel Core i7-7700 3.6GHz
GeForce GTX 1070 Mobile
93.9 [X] Saelic Vidi G761D Intel Core i7-6700K 4GHz
GeForce GTX 1070 Mobile
94 [X] Aorus X5 v6 AO-S107W516-PL-002 Intel Core i7-6820HK 2.7GHz
GeForce GTX 1070 Mobile
95.6 [X] Aorus X7 v6 AO-S107Q716-PL-005 Intel Core i7-6820HK 2.7GHz
GeForce GTX 1070 Mobile
106.7 [X] Smart7 Karme GX17E G2 Intel Core i5-8600K 3.6GHz
GeForce GTX 1070 Mobile
~ 93 fps
+ Comparar
- Ocultar comparación
...
NVIDIA GeForce GTX 1050 Ti Mobile
NVIDIA GeForce GTX 1070 Mobile
» Jugable con todos los portátiles probados en ajustes de detalle ultra.
...
NVIDIA Quadro P2000 Max-Q
NVIDIA GeForce GTX 1050 Ti Mobile
NVIDIA GeForce GTX 1070 Mobile
...
...
NVIDIA Quadro P4000 Max-Q
NVIDIA GeForce GTX 1070 Mobile
max:
» Jugable con todos los portátiles probados en ajustes de detalle ultra.
...
NVIDIA Quadro P600
AMD Radeon Pro 455
NVIDIA GeForce GTX 1050 Ti Mobile
NVIDIA GeForce GTX 1070 Mobile
NVIDIA Quadro P4000 Max-Q
NVIDIA Quadro P2000 Max-Q
...
...
NVIDIA GeForce GTX 1050 Max-Q
NVIDIA GeForce GTX 1050 Ti Max-Q
NVIDIA Quadro P4000 Max-Q
NVIDIA GeForce GTX 1070 Mobile
...
...
NVIDIA GeForce GTX 1050 Ti Max-Q
NVIDIA Quadro P4000 Max-Q
NVIDIA GeForce GTX 1070 Mobile
...
...
NVIDIA Quadro P4000 Max-Q
NVIDIA GeForce GTX 1070 Mobile
NVIDIA GeForce RTX 2070 Super Max-Q
...
max:
» Jugable con todos los portátiles probados en ajustes de detalle ultra.
...
AMD Radeon Pro WX Vega M GL
NVIDIA Quadro P620
NVIDIA GeForce GTX 1070 Mobile
» Jugable con todos los portátiles probados en ajustes de detalle ultra.
...
NVIDIA GeForce GTX 1050 Ti Mobile
NVIDIA GeForce GTX 1070 Mobile
...
NVIDIA GeForce GTX 1070 Mobile
...
NVIDIA GeForce GTX 1070 Mobile
...
NVIDIA GeForce GTX 1070 Mobile
» Jugable con todos los portátiles probados en ajustes de detalle ultra.
...
NVIDIA GeForce GTX 1070 Mobile
max:
» Jugable con todos los portátiles probados en ajustes de detalle ultra.
...
NVIDIA GeForce GTX 1070 Mobile
...
NVIDIA GeForce GTX 1070 Mobile
...
NVIDIA GeForce GTX 1070 Mobile
...
NVIDIA GeForce GTX 1070 Mobile
» Jugable con todos los portátiles probados en ajustes de detalle ultra.
...
NVIDIA GeForce GTX 1070 Mobile
...
» Jugable con todos los portátiles probados en ajustes de detalle ultra.
...
NVIDIA GeForce GTX 1070 Mobile
» Jugable con todos los portátiles probados en ajustes de detalle ultra.
...
NVIDIA GeForce GTX 1070 Mobile
» Jugable con todos los portátiles probados en ajustes de detalle ultra.
Para ver más juegos jugables y una lista de todos los juegos y tarjetas gráficas visita nuestroListado de juegos
v1.26
log 24. 10:18:11
#0 no ids found in url (should be separated by "_") +0s ... 0s
#1 not redirecting to Ajax server +0s ... 0s
#2 did not recreate cache, as it is less than 5 days old! Created at Mon, 22 Apr 2024 05:40:21 +0200 +0.001s ... 0.001s
#3 no comparison url found in template nbc.compare_page_1 needed +0.065s ... 0.066s
#4 no comparison url found in template nbc.compare_page_1 needed +0s ... 0.066s
#5 no comparison url found in template nbc.compare_page_1 needed +0s ... 0.066s
#6 no comparison url found in template nbc.compare_page_1 needed +0s ... 0.067s
#7 no comparison url found in template nbc.compare_page_1 needed +0s ... 0.067s
#8 no comparison url found in template nbc.compare_page_1 needed +0s ... 0.067s
#9 no comparison url found in template nbc.compare_page_1 needed +0s ... 0.067s
#10 no comparison url found in template nbc.compare_page_1 needed +0s ... 0.068s
#11 no comparison url found in template nbc.compare_page_1 needed +0s ... 0.068s
#12 no comparison url found in template nbc.compare_page_1 needed +0s ... 0.069s
#13 no comparison url found in template nbc.compare_page_1 needed +0s ... 0.069s
#14 no comparison url found in template nbc.compare_page_1 needed +0s ... 0.069s
#15 no comparison url found in template nbc.compare_page_1 needed +0s ... 0.069s
#16 no comparison url found in template nbc.compare_page_1 needed +0s ... 0.069s
#17 no comparison url found in template nbc.compare_page_1 needed +0s ... 0.069s
#18 no comparison url found in template nbc.compare_page_1 needed +0s ... 0.069s
#19 no comparison url found in template nbc.compare_page_1 needed +0s ... 0.07s
#20 no comparison url found in template nbc.compare_page_1 needed +0s ... 0.07s
#21 no comparison url found in template nbc.compare_page_1 needed +0s ... 0.07s
#22 no comparison url found in template nbc.compare_page_1 needed +0s ... 0.07s
#23 composed specs +0s ... 0.07s
#24 did output specs +0s ... 0.07s
#25 start showIntegratedCPUs +0s ... 0.07s
#26 getting avg benchmarks for device 7364 +0.041s ... 0.111s
#27 got single benchmarks 7364 +0.271s ... 0.383s
#28 got avg benchmarks for devices +0s ... 0.383s
#29 min, max, avg, median took s +1.084s ... 1.467s
#30 before gaming benchmark output +0s ... 1.467s
#31 Got 1509 rows for game benchmarks. +0.165s ... 1.632s
#32 composed SQL query for gamebenchmarks +0s ... 1.632s
#33 got data and put it in $dataArray +0.116s ... 1.748s
#34 benchmarks composed for output. +11.344s ... 13.092s
#35 no comparison url found in template nbc.compare_page_1 needed +0.012s ... 13.104s
#36 return log +0s ... 13.104s
Análises de portátiles con NVIDIA GeForce GTX 1070 Mobile tarjeta gráfica
Review del Alienware 17 R5 (i7-8750H, GTX 1070, QHD) Ahora con una CPU hexa-core. A pesar de utilizar los componentes más actuales, la antigua marca de juegos Alienware tiene cada vez más dificultades para hacer f...
Intel Core i7-8750H | NVIDIA GeForce GTX 1070 Mobile | 17.30" | 4.4 kg
Review del Acer Predator Helios 500 (GTX 1070, i9-8950HK) Este pedazo de portátil entra en la segunda ronda: Ya hemos revisado la versión más barata de Acer Predator Helios 500 no hace mucho tiempo - ahora aquí viene l...
Intel Core i9-8950HK | NVIDIA GeForce GTX 1070 Mobile | 17.30" | 4 kg
Review del HP Omen 17t (i7-8750H, GTX 1070) Gigante Tranquilo. El Omen 17t es un portátil bien equilibrado. Sus componentes internos son consistentemente potentes, su pantalla G-Sync de 144 Hz es una de l...
Intel Core i7-8750H | NVIDIA GeForce GTX 1070 Mobile | 17.30" | 3.7 kg
Review del MSI GE63 Raider RGB 8RF (i7-8750H, GTX 1070, FHD) Hágase la luz. MSI adorna discretamente sus portátiles de la serie GE, con sólo un poco de iluminación RGB en la tapa de la pantalla del dispositivo. El GE63 8R...
Intel Core i7-8750H | NVIDIA GeForce GTX 1070 Mobile | 15.60" | 2.5 kg
Review del Asus ROG Strix GL504 Scar II (i7-8750H, GTX 1070, FHD) Review del Con el ROG Strix GL504, Asus presenta un portátil de 15 pulgadas de gama alta que ofrece casi todas las funciones que usted podría desear en una plataforma de j...
Intel Core i7-8750H | NVIDIA GeForce GTX 1070 Mobile | 15.60" | 2.5 kg
Alienware 15 R4 : Intel Core i9-8950HK, 15.60", 3.5 kganálise » Review del Alienware 15 R4 (i9-8950HK, GTX 1070, FHD)
Eurocom Q8 : Intel Core i9-8950HK, 17.30", 3 kganálise » Review del Eurocom Q8 (i9-8950HK, GTX 1070, QHD)
MSI GE73 8RF-008 Raider RGB : Intel Core i7-8750H, 17.30", 2.9 kganálise » Review del portátil MSI GE73 8RF Raider RGB (i7-8750H, GTX 1070, Full-HD)
Acer Predator Helios 500 PH517-51-79BY : Intel Core i7-8750H, 17.30", 3.8 kganálise » Review del portátil Acer Predator Helios 500 (GTX 1070, i7-8750H)
Aorus X5 v8 : Intel Core i7-8850H, 15.60", 2.7 kganálise » Revisión del portátil Aorus X5 v8 (i7-8850H, GTX 1070, Full HD)
Asus Zephyrus M GM501 : Intel Core i7-8750H, 15.60", 2.5 kganálise » Análisis completo del Asus ROG Zephyrus M GM501 (i7-8750H, GTX 1070, Full-HD)
SCHENKER XMG Ultra 15 : Intel Core i5-8600K, 15.60", 3.5 kganálise » Análisis del Schenker XMG Ultra 15 (Clevo P751TM1-G)
SCHENKER XMG Pro 17 : Intel Core i7-7700HQ, 17.30", 3.1 kganálise » Análisis del Schenker Technologies XMG Pro 17 (Clevo PA71HS-G)
MSI GE63VR 7RF Raider : Intel Core i7-7700HQ, 15.60", 2.4 kganálise » Breve análisis del portátil MSI GE63VR Raider-075 (i7-7700HQ, GTX 1070, Full-HD)
MSI GE73VR 7RF Raider : Intel Core i7-7700HQ, 17.30", 2.9 kganálise » Breve análisis del MSI GE73VR 7RF Raider (i7-7700HQ, GTX 1070, Full HD)
Aorus X5 v7 : Intel Core i7-7820HK, 15.60", 2.6 kganálise » Análisis completo del Aorus X5 v7 (i7-7820HK, GTX 1070, UHD)
Lenovo Legion Y920-17IKB : Intel Core i7-7820HK, 17.30", 4.4 kganálise » Análisis completo del Lenovo Legion Y920-17IKB (i7-7820HK, GTX 1070)
Aorus X7 v7 : Intel Core i7-7820HK, 17.30", 3.4 kganálise » Breve análisis del portátil Aorus X7 v7 (7820HK, GTX 1070, QHD)
HP Omen 17-an014ng : Intel Core i7-7700HQ, 17.30", 3.8 kganálise » Breve análisis del HP Omen 17 (7700HQ, GTX 1070, Full-HD)
Gigabyte P56XT : Intel Core i7-7700HQ, 15.60", 2.7 kganálise » Breve análisis del Gigabyte P56XT (7700HQ, GTX 1070, Full-HD)
Eurocom Sky MX5 R3 : Intel Core i7-7820HK, 15.60", 2.9 kganálise » Breve análisis del portátil Eurocom Sky MX5 R3 (i7-7820HK, FHD, Clevo P650HS-G)
Asus G752VS-BA338T : Intel Core i7-7700HQ, 17.30", 4.5 kganálise » Análisis completo del Asus ROG G752VS (7700HQ, GTX 1070, FHD)
Acer Predator 15 G9-593-751X : Intel Core i7-7700HQ, 15.60", 3.7 kganálise » Breve análisis del portátil Acer Predator 15 (7700HQ, GTX 1070, Full-HD)
Acer Predator 17 G9-793-70PJ : Intel Core i7-7700HQ, 17.30", 4.3 kganálise » Análisis completo del Acer Predator 17 (7700HQ, GTX 1070, UHD)
SCHENKER XMG U507 2017 : Intel Core i7-7700K, 15.60", 3.6 kganálise » Breve análisis del portátil Schenker XMG U507 (Clevo P751DM2-G)
Asus Strix GL702VSK : Intel Core i7-7700HQ, 17.30", 2.9 kganálise » Breve análisis del portátil Asus Strix GL702VSK (7700HQ, FHD, GTX 1070)
Alienware 15 R3 : Intel Core i7-7700HQ, 15.60", 3.5 kganálise » Análisis completo del Alienware 15 R3
Nexoc G734IV : Intel Core i7-7700HQ, 17.30", 3.3 kganálise » Breve análisis del Nexoc G734IV (Clevo P670HS-G)
MSI GT62VR 7RE-223 : Intel Core i7-7700HQ, 15.60", 2.9 kganálise » Breve análisis del MSI GT62VR 7RE Dominator Pro
Gigabyte P57X v7 : Intel Core i7-7700HQ, 17.30", 3.4 kganálise » Análisis completo del Gigabyte P57X v7
SCHENKER XMG P507 PRO : Intel Core i7-7700HQ, 15.60", 2.9 kganálise » Breve análisis del portátil Schenker XMG P507 (Clevo P651HS-G)
MSI GT72VR 7RE-433 : Intel Core i7-7700HQ, 17.30", 3.8 kganálise » Breve análisis del MSI GT72VR 7RE Dominator Pro
Eurocom Tornado F5 : Intel Core i7-7700K, 15.60", 3.1 kganálise » Breve análisis del Eurocom Tornado F5
Acer Predator 15 G9-593-765Q : Intel Core i7-6700HQ, 15.60", 3.7 kganálise » Breve análisis del Acer Predator 15 G9-593
EVGA SC17 GTX 1070 : Intel Core i7-6820HK, 17.30", 4.1 kganálise » Breve análisis del EVGA SC17 GTX 1070
Aorus X7 v6 : Intel Core i7-6820HK, 17.30", 3.2 kganálise » Breve análisis del Aorus X7 v6
HP Omen 17-w110ng : Intel Core i7-6700HQ, 17.30", 3.3 kganálise » Breve análisis del HP Omen 17 (i7-6700HQ, GTX 1070)
Aorus X5 v6 : Intel Core i7-6820HK, 15.60", 2.6 kganálise » Análisis completo del Aorus X5 v6
Gigabyte P57X v6 : Intel Core i7-6700HQ, 17.30", 3.2 kganálise » Breve análisis del Gigabyte P57X v6
Nexoc G734III : Intel Core i7-6700HQ, 17.30", 3.3 kganálise » Breve análisis del Nexoc G734III (Clevo P670RS-G)
Acer Predator 17 G9-793-77LG : Intel Core i7-6700HQ, 17.30", 4.2 kganálise » Breve análisis del Acer Predator 17 G9-793
MSI GT73VR-6RE16SR451 : Intel Core i7-6820HK, 17.30", 4.1 kganálise » Análisis completo del MSI GT73VR 6RE Titan
Asus G752VS-XB78K : Intel Core i7-6820HK, 17.30", 4.5 kganálise » Análisis completo del Asus ROG G752VS
MSI GT72VR 6RE-015US : Intel Core i7-6700HQ, 17.30", 3.9 kganálise » Breve análisis del MSI GT72VR 6RE-015US
Asus Strix GL502VS-FY032T : Intel Core i7-6700HQ, 15.60", 2.6 kganálise » Análisis completo del Asus ROG Strix GL502VS
MSI GT62VR-6RE16H21 : Intel Core i7-6700HQ, 15.60", 2.9 kganálise » Análisis completo del MSI GT62VR 6RE Dominator Pro
Acer Predator Helios 500 PH517-51-79T5 : Intel Core i7-8750H, 17.30", 4 kganálise externo » Acer Predator Helios 500 PH517-51-79T5
HP Omen 17-an105ns : Intel Core i7-8750H, 17.30", 3.8 kganálise externo » HP OMEN 17-an105ns
HP Omen 15-dc0006ur : Intel Core i7-8750H, 15.60", 2.5 kganálise externo » HP Omen 15-dc0006ur
MSI GE63 Raider 8RF-040ES : Intel Core i7-8750H, 15.60", 2.4 kganálise externo » MSI GE63 Raider 8RF-040ES
Medion Erazer X7861 : Intel Core i7-8750H, 17.30", 3.4 kganálise externo » Medion Erazer X7861
Acer Predator Helios 500 PH517-51-960K : Intel Core i9-8950HK, 17.30", 4 kganálise externo » Acer Predator Helios 500 PH517-51-960K
MSI P65 Creator 8RF-442 : Intel Core i7-8750H, 15.60", 1.9 kganálise externo » MSI P65 Creator 8RF-442
Origin PC EVO-17S, GTX 1070, i9-8950HK : Intel Core i9-8950HK, 17.30", 3 kganálise externo » Origin PC EVO-17S, GTX 1070, i9-8950HK
HP Omen 15-dc0805no : Intel Core i7-8750H, 15.60", 2.5 kganálise externo » HP Omen 15-dc0805no
Acer Predator Helios 500 517-51-59BH : Intel Core i7-8750H, 17.30", 4 kganálise externo » Acer Predator Helios 500 517-51-59BH
MSI GE73 Raider 8RF-029ES : Intel Core i7-8750H, 17.30", 2.8 kganálise externo » MSI GE73 Raider 8RF-029ES
MSI GE75 Raider 8RF-012XES : Intel Core i7-8750H, 17.30", 2.6 kganálise externo » MSI GE75 Raider 8RF-012XES
Alienware M15, GTX 1070 : Intel Core i7-8750H, 15.60", 2.2 kganálise externo » Alienware M15, GTX 1070
Acer Predator Helios 500 PH517-51-98Y7 : Intel Core i9-8950HK, 17.30", 4 kganálise externo » Acer Predator Helios 500 PH517-51-98Y7
MSI GS73 Stealth 8RF-007XES : Intel Core i3-7020U, 17.30", 2.4 kganálise externo » MSI GS73 Stealth 8RF-007XES
Asus Strix Scar II GL504GS-ES082T : Intel Core i7-8750H, 15.60", 2.5 kganálise externo » Asus Strix Scar II GL504GS-ES082T
Acer Predator Helios 500 PH517-51-90BK : Intel Core i9-8950HK, 17.30", 3.8 kganálise externo » Acer Predator Helios 500 PH517-51-90BK
Medion Erazer X7853-MD60707 : Intel Core i7-7700HQ, 17.30", 3.8 kganálise externo » Medion Erazer X7853-MD60707
Medion Erazer X7853-MD60709 : Intel Core i7-7820HK, 17.30", 3.5 kganálise externo » Medion Erazer X7853-MD60709
Alienware 17 R5 : Intel Core i7-8750H, 17.30", 4.4 kganálise externo » Alienware 17 R5
Asus ROG Strix Scar II GL504GS-ES056T : Intel Core i7-8750H, 15.60", 2.4 kganálise externo » Asus ROG Strix Scar II GL504GS-ES056T
MSI GS65 Stealth Thin 8RF-086TR : Intel Core i7-8750H, 15.60", 1.9 kganálise externo » MSI GS65 Stealth Thin 8RF-086TR
HP Omen 17-an113NS : Intel Core i7-8750H, 17.30", 3.8 kganálise externo » HP Omen 17-AN113NS
MSI GT62VR 7RE-456XES : Intel Core i7-7700HQ, 15.60", 2.9 kganálise externo » MSI GT62VR 7RE-456XES
HP Omen 17-an104nd : Intel Core i7-8750H, 17.30", 3.8 kganálise externo » HP Omen 17-an104nd
HP Omen 15-dc0982nd : Intel Core i7-8750H, 15.60", 2.4 kganálise externo » HP Omen 15-dc0982nd
Acer Predator Helios 500 PH517-51-72NU : Intel Core i7-8750H, 17.30", 3.8 kganálise externo » Acer Predator Helios 500 PH517-51-72NU
Asus Zephyrus M GM501GS-EI004T : Intel Core i7-8750H, 15.60", 2.5 kganálise externo » Asus Zephyrus M GM501GS-EI004T
MSI Raider GE73VR 7RF-258XES : Intel Core i7-7700HQ, 17.30", 2.8 kganálise externo » MSI Raider GE73VR 7RF-258XES
MSI Raider GE63VR 7RF-227XES : Intel Core i7-7700HQ, 15.60", 2 kganálise externo » MSI Raider GE63VR 7RF-227XES
MSI GS63VR 7RG-084XES : Intel Core i7-7700HQ, 15.60", 1.8 kganálise externo » MSI GS63VR 7RG-084XES
Alienware 15 R4 : Intel Core i9-8950HK, 15.60", 3.5 kganálise externo » Alienware 15 R4
Asus ROG Strix GL504GM Scar II Edition : Intel Core i7-8750H, 15.60", 2.4 kganálise externo » Asus ROG Strix GL504GM Scar II Edition
HP Omen 15-dc0015ng : Intel Core i7-8750H, 15.60", 2.5 kganálise externo » HP Omen 15-dc0015ng
Asus Zephyrus M GM501GS-90NR0031-M00420 : Intel Core i7-8750H, 15.60", 2.5 kganálise externo » Asus Zephyrus M GM501GS-90NR0031-M00420
MSI GE63 Raider RGB-010 : Intel Core i7-8750H, 15.60", 2.5 kganálise externo » MSI GE63 Raider RGB-010
Alienware 15 R4-9PTN3 : Intel Core i7-8750H, 15.60", 3.5 kganálise externo » Alienware 15 R4-9PTN3
Acer Predator Helios 500 PH517-51-99UR : Intel Core i9-8950HK, 17.30", 3.8 kganálise externo » Acer Predator Helios 500 PH517-51-99UR
Asus GL504GS : Intel Core i7-8750H, 15.60", 2.5 kganálise externo » Asus GL504
MSI GP73 Leopard 8RF-415XES : Intel Core i7-8750H, 17.30", 2.2 kganálise externo » MSI GP73 Leopard 8RF-415XES
MSI GS65 Stealth Thin 8RE-016NE : Intel Core i7-8750H, 15.60", 1.8 kganálise externo » MSI GS65 Stealth Thin 8RE-016NE
Lenovo Legion Y920-80YW001DGE : Intel Core i7-7820HK, 17.30", 4.5 kganálise externo » Lenovo Legion Y920-80YW001DGE
Acer Predator Helios 500 PH517-51-93LS : Intel Core i9-8950HK, 17.30", 4 kganálise externo » Acer Predator Helios 500 PH517-51-93LS
Gigabyte Aorus X5 V8 : Intel Core i7-8850H, 15.60", 2.5 kganálise externo » Gigabyte Aorus X5 V8
Asus GL703GS Strix Scar Edition 90NR00E1-M00160 : Intel Core i7-8750H, 17.30", 2.9 kganálise externo » Asus GL703GS Strix Scar Edition 90NR00E1-M00160
MSI GE63 Raider RGB 8RF-039XES : Intel Core i7-8750H, 15.60", 2.5 kganálise externo » MSI GE63 Raider RGB 8RF-039XES
MSI GF72 7RE-1055XES : Intel Core i7-7700HQ, 17.30", 2.7 kganálise externo » MSI GF72 7RE-1055XES
Asus GL502VS-GZ226T : Intel Core i7-7700HQ, 15.60", 2.3 kganálise externo » Asus GL502VS-GZ226T
MSI GS65 8RF-040NL : Intel Core i7-8750H, 15.60", 1.9 kganálise externo » MSI GS65 8RF-040NL
Asus Zephyrus GM501G : Intel Core i7-8750H, 15.60", 2.5 kganálise externo » Asus Zephyrus GM501G
MSI GE73 8RF-211DE - Raider RGB : Intel Core i7-8750H, 17.30", 2.9 kganálise externo » MSI GE73 8RF-211DE - Raider RGB
HP Omen X 17-ap000nf : Intel Core i7-7820HK, 17.30", 4.4 kganálise externo » HP Omen X 17-ap000nf
Acer Predator Helios 500 PH517-51-79BY : Intel Core i7-8750H, 17.30", 3.8 kganálise externo » Acer Predator Helios 500 PH517-51-79BY
MSI GE73 8RF-008 Raider RGB : Intel Core i7-8750H, 17.30", 2.9 kganálise externo » MSI GE73 8RF-008 Raider RGB
MSI GE73-008 8RF Raider RGB : Intel Core i7-8750H, 17.30", 2.9 kganálise externo » MSI GE73-008 8RF Raider RGB
Aorus X5 v8 : Intel Core i7-8850H, 15.60", 2.7 kganálise externo » Aorus X5 v8
Asus G752VS-GC310T : Intel Core i7-7700HQ, 17.30", 4.3 kganálise externo » Asus G752VS-GC310T
MSI GE63 Raider RGB 8RF-008 : Intel Core i7-8750H, 15.60", 2.5 kganálise externo » MSI GE63 Raider 8RF-008
Asus Zephyrus M GM501 : Intel Core i7-8750H, 15.60", 2.5 kganálise externo » Asus Zephyrus M GM501
MSI GE63VR 7RF-252XES : Intel Core i7-7700HQ, 15.60", 2.4 kganálise externo » MSI GE63VR 7RF-252XES
Aorus X9 v7 : Intel Core i7-7820HQ, 17.30", 3.6 kganálise externo » Aorus X9 v7
HP Omen 17-an014ng : Intel Core i7-7700HQ, 17.30", 3.8 kganálise externo » HP Omen 17-an014ng
MSI GE63VR Raider 4K-212 : Intel Core i7-7700HQ, 15.60", 2.4 kganálise externo » MSI GE63VR Raider 4K-212
MSI GE63VR Raider-213 : Intel Core i7-7700HQ, 15.60", 2.4 kganálise externo » MSI GE63VR Raider-213
Asus GL503VS-EI011T Strix Scar Edition : Intel Core i7-7700HQ, 15.60", 2.5 kganálise externo » Asus GL503VS-EI011T Strix Scar Edition
HP Omen 17-an090nz : Intel Core i7-7700HQ, 17.30", 3.8 kganálise externo » HP Omen 17-an090nz
Asus Strix GL503VS-DH74 Scar Edition : Intel Core i7-7700HQ, 15.60", 2.4 kganálise externo » Asus Strix GL503VS-DH74 Scar Edition
HP Omen 17-an010ns : Intel Core i7-7700HQ, 17.30", 3.8 kganálise externo » HP OMEN 17-an010ns
HP Omen 17-an009tx : Intel Core i7-7700HQ, 17.30", 3.8 kganálise externo » HP Omen 17-an009tx
MSI GS63VR Stealth Pro-078 : Intel Core i7-7700HQ, 15.60", 1.8 kganálise externo » MSI GS63VR Stealth Pro-078
MSI GE63VR 7RF-039 Raider : Intel Core i7-7700HQ, 15.60", 2.2 kganálise externo » MSI GE63VR 7RF-039 Raider
HP Omen X 17-ap000na : Intel Core i7-7820HK, 17.30", 4.5 kganálise externo » HP Omen X 17-ap000na
Asus Strix GL503VS-EI012T : Intel Core i7-7700HQ, 15.60", 2.5 kganálise externo » Asus Strix GL503VS-EI012T
MSI GT72VR 7RE-629XES Dominator Pro : Intel Core i7-7700HQ, 17.30", 3.8 kganálise externo » MSI GT72VR 7RE-629XES Dominator Pro
MSI GT72VR 7RE-487FR Dominator Pro Dragon Edition : Intel Core i7-7820HK, 17.30", 3.8 kganálise externo » MSI GT72VR 7RE-487FR Dominator Pro Dragon Edition
Alienware 17 R4-A17-0289 : Intel Core i7-7700HQ, 17.30", 4.4 kganálise externo » Alienware 17 R4-A17-0289
MSI GT75VR 7RE Titan-018AU : Intel Core i7-7700HQ, 17.30", 4.5 kganálise externo » MSI GT75VR 7RE Titan-018AU
MSI GE63VR-001 Raider : Intel Core i7-7700HQ, 15.60", 2.4 kganálise externo » MSI GE63VR-001 Raider
MSI GT73VR 6RE-053NL : Intel Core i7-6820HK, 17.30", 3.9 kganálise externo » MSI GT73VR 6RE-053NL
Asus GL502VS-FY313T : Intel Core i7-7700HQ, 15.60", 2.3 kganálise externo » Asus GL502VS-FY313T
MSI GE72MVR 7RG-050XES : Intel Core i7-7700HQ, 17.30", 2.9 kganálise externo » MSI GE72MVR 7RG-050XES
MSI GE73VR 7RF-031ES : Intel Core i7-7700HQ, 17.30", 2.8 kganálise externo » MSI GE73VR 7RF-031ES
MSI GE63VR 7RF-005NL : Intel Core i7-7700HQ, 15.60", 2.2 kganálise externo » MSI GE63VR 7RF-005NL
Medion Erazer X7853 : Intel Core i7-7700HQ, 17.30", 3.5 kganálise externo » Medion Erazer X7853
Aorus X5 V7-KL3K3D : Intel Core i7-7820HK, 15.60", 2.5 kganálise externo » Aorus X5 V7-KL3K3D
Medion Erazer X7857 : Intel Core i7-7820HK, 17.30", 3.1 kganálise externo » Medion Erazer X7857
Lenovo Legion Y920-17IKB 80YW0009RK : Intel Core i7-7700HQ, 17.30", 4.4 kganálise externo » Lenovo Legion Y920-17IKB 80YW0009RK
Asus G752VS-BA263T : Intel Core i7-7700HQ, 17.30", 4.4 kganálise externo » Asus G752VS-BA263T
Aorus X7 v7 : Intel Core i7-7820HK, 17.30", 3.4 kganálise externo » Aorus X7 v7
MSI GE73VR 7RF-039 Raider : Intel Core i7-7700HQ, 17.30", 2.8 kganálise externo » MSI GE73VR 7RF-039 Raider
MSI GE62MVR 7RG-033XES : Intel Core i7-7700HQ, 15.60", 2.3 kganálise externo » MSI GE62MVR 7RG-033XES
MSI GE73VR 7RE Raider-042 : Intel Core i7-7700HQ, 17.30", 2.8 kganálise externo » MSI GE73VR 7RE Raider-042
MSI GE72MVR 7RE Apache Pro-044 : Intel Core i7-7700HQ, 17.30", 2.7 kganálise externo » MSI GE72MVR 7RE Apache Pro-044
MSI GE63VR 7RF-014CZ : Intel Core i7-7700HQ, 15.60", 2.4 kganálise externo » MSI GE63VR 7RF-014CZ
HP Omen 17-w200nu : Intel Core i7-7700HQ, 17.30", 3.4 kganálise externo » HP Omen 17-w200nu
Aorus X5 v7 : Intel Core i7-7820HK, 15.60", 2.6 kganálise externo » Aorus X5 v7
Medion Erazer X7849-MD60426 : Intel Core i7-6700HQ, 17.30", 3.5 kganálise externo » Medion Erazer X7849-MD60426
Gigabyte P56XT : Intel Core i7-7700HQ, 15.60", 2.7 kganálise externo » Gigabyte P56XT
MSI GE63VR 7RF Raider : Intel Core i7-7700HQ, 15.60", 2.4 kganálise externo » MSI GE63VR 7RF Raider
Acer Predator 17 G9-793-718K : Intel Core i7-7700HQ, 17.30", 3.9 kganálise externo » Acer Predator 17 G9-793-718K
Alienware 15 R3-A571610S2NDW-61 : Intel Core i7-6700HQ, 15.60", 3.5 kganálise externo » Alienware 15 R3-A571610S2NDW-61
EVGA SC17 GTX 1070 : Intel Core i7-6820HK, 17.30", 4.1 kganálise externo » EVGA SC17 GTX 1070
Asus Strix GL502VS-FY030T : Intel Core i7-6700HQ, 15.60", 2.6 kganálise externo » Asus Strix GL502VS-FY030T
HP Omen 17-an016ng : Intel Core i7-7700HQ, 17.30", 3.8 kganálise externo » HP Omen 17-an016ng
Lenovo Legion Y920-17IKB : Intel Core i7-7820HK, 17.30", 4.4 kganálise externo » Lenovo Legion Y920-17IKB
MSI GE73VR 7RF Raider : Intel Core i7-7700HQ, 17.30", 2.9 kganálise externo » MSI GE73VR 7RF Raider
Asus GL702VS-GC095T : Intel Core i7-7700HQ, 17.30", 2.9 kganálise externo » Asus GL702VS-GC095T
HP Omen 17-an015ng : Intel Core i7-7700HQ, 17.30", 3.8 kganálise externo » HP Omen 17-an015ng
Alienware 15 R3 (2016) : Intel Core i7-6820HK, 15.60", 3.5 kganálise externo » Alienware 15 R3 (2016)
Acer Predator 15 G9-593-74BY : Intel Core i7-6700HQ, 15.60", 3.7 kganálise externo » Acer Predator 15 G9-593-74BY
Lenovo Legion Y920 : Intel Core i7-7820HK, 17.30", 4.6 kganálise externo » Lenovo Legion Y920
MSI GT72VR 6RE-266NL : Intel Core i7-6820HK, 17.30", 3.8 kganálise externo » MSI GT72VR 6RE-266NL
MSI GE72MVR 7RG-046 : Intel Core i7-7700HQ, 17.30", 2.7 kganálise externo » MSI GE72MVR 7RG-046
MSI GS63VR 7RG-006DE : Intel Core i7-7700HQ, 15.60", 1.8 kganálise externo » MSI GS63VR 7RG-006DE
HP Omen 17-w216ng : Intel Core i7-7700HQ, 17.30", 3.4 kganálise externo » HP Omen 17-w216ng
Asus G752VS-GC074T : Intel Core i7-6700HQ, 17.30", 4.5 kganálise externo » Asus G752VS-GC074T
HP Omen 17-w107ng : Intel Core i7-6700HQ, 17.30", 3.4 kganálise externo » HP Omen 17-w107ng
HP Omen 17-w270nd : Intel Core i7-7700HQ, 17.30", 3.4 kganálise externo » HP Omen 17-w270nd
HP Omen 17-w201ns : Intel Core i7-7700HQ, 17.30", 3.4 kganálise externo » HP Omen 17-w201ns
MSI GE62MVR 7RG-012 Apache Pro : Intel Core i7-7700HQ, 15.60", 2.4 kganálise externo » MSI GE62MVR 7RG-012 Apache Pro
Asus Strix GL702VSK : Intel Core i7-7700HQ, 17.30", 2.9 kganálise externo » Asus Strix GL702VSK
HP Omen 17-w203no : Intel Core i7-7700HQ, 17.30", 3.4 kganálise externo » HP Omen 17-w203no
MSI GT62VR 7RE-246XES : Intel Core i7-7700HQ, 15.60", 2.9 kganálise externo » MSI GT62VR 7RE-246XES
HP Omen 17-w120no : Intel Core i7-6700HQ, 17.30", 3.3 kganálise externo » HP Omen 17-w120no
HP Omen 17-w110ng : Intel Core i7-6700HQ, 17.30", 3.3 kganálise externo » HP Omen 17-w110ng
HP Omen 17-w172nw : Intel Core i7-6700HQ, 17.30", 3.4 kganálise externo » HP Omen 17-w172nw
Asus G752VSK-77B07SB1 : Intel Core i7-7700HQ, 17.30", 3.9 kganálise externo » Asus G752VSK-77B07SB1
MSI GT72VR 7RE-469XTR Dominator Pro : Intel Core i7-7700HQ, 17.30", 3.8 kganálise externo » MSI GT72VR 7RE-469XTR Dominator Pro
MSI GT62VR Dominator Pro-238 : Intel Core i7-7700HQ, 15.60", 2.9 kganálise externo » MSI GT62VR Dominator Pro-238
Eurocom Sky X4E2 : Intel Core i7-7700K, 15.60", 3.4 kganálise externo » Eurocom Sky X4E2
HP Omen 17-w250tx : Intel Core i7-7700HQ, 17.30", 3.4 kganálise externo » HP Omen 17-w250tx
HP Omen 17-w106na : Intel Core i7-6700HQ, 17.30", 2.8 kganálise externo » HP Omen 17-w106na
MSI GE72MVR 7RG-008 : Intel Core i7-7700HQ, 17.30", 2.7 kganálise externo » MSI GE72MVR 7RG-008
HP Omen 17-w212ng : Intel Core i7-7700HQ, 17.30", 3.4 kganálise externo » HP Omen 17-w212ng
MSI GT72VR 7RE Dominator Pro 483RU : Intel Core i7-7700HQ, 17.30", 3.8 kganálise externo » MSI GT72VR 7RE Dominator Pro 483RU
Asus Strix GL502VS-GZ120T : Intel Core i7-7700HQ, 15.60", 2.3 kganálise externo » Asus Strix GL502VS-GZ120T
HP Omen 17-w100nc : Intel Core i7-6700HQ, 17.30", 3.4 kganálise externo » HP Omen 17-w100nc
Alienware 15 R3 : Intel Core i7-7700HQ, 15.60", 3.5 kganálise externo » Alienware 15 R3
Gigabyte P57X v7 : Intel Core i7-7700HQ, 17.30", 3.4 kganálise externo » Gigabyte P57X v7
Acer Predator 17 G9-793-76Z1 : Intel Core i7-6700HQ, 17.30", 4.4 kganálise externo » Acer Predator 17 G9-793-76Z1
Asus GL502VS-DS71 : Intel Core i7-7700HQ, 15.60", 2.2 kganálise externo » Asus GL502VS-DS71
Asus G752VS-XS74K : Intel Core i7-7820HK, 17.30", 4.3 kganálise externo » Asus G752VS-XS74K
Acer Predator 17 G9-793-78RN : Intel Core i7-6700HQ, 17.30", 4.2 kganálise externo » Acer Predator 17 G9-793-78RN
HP Omen 17-w102nl : Intel Core i7-6700HQ, 17.30", 3.4 kganálise externo » HP Omen 17-w102nl
Acer Predator 15 G9-593-71EB : Intel Core i7-7700HQ, 15.60", 3.6 kganálise externo » Acer Predator 15 G9-593-71EB
Acer Predator 17 G9-793-71A3 : Intel Core i7-6700HQ, 17.30", 4.2 kganálise externo » Acer Predator 17 G9-793-71A3
MSI GT62VR 7RE-261RU Dominator Pro : Intel Core i7-7700HQ, 15.60", 2.9 kganálise externo » MSI GT62VR 7RE-261RU Dominator Pro
Asus G752VS (KBL)-BA326T : Intel Core i7-7700HQ, 17.30", 4.3 kganálise externo » Asus G752VS (KBL)-BA326T
Asus Strix GL502VS-FY038T : Intel Core i7-6700HQ, 15.60", 2.2 kganálise externo » Asus Strix GL502VS-FY038T
HP Omen 17-w240ng : Intel Core i7-7700HQ, 17.30", 3.4 kganálise externo » HP Omen 17-w240ng
MSI GT72VR 7RE-461XES : Intel Core i7-7700HQ, 17.30", 3.8 kganálise externo » MSI GT72VR 7RE-461XES
Eurocom Tornado F5 : Intel Core i7-7700K, 15.60", 3.1 kganálise externo » Eurocom Tornado F5
MSI GT73VR 7RE Titan - 7RE-298 : Intel Core i7-7820HK, 17.30", 4.1 kganálise externo » MSI GT73VR 7RE Titan - 7RE-298
MSI GT72VR 7RE-433 : Intel Core i7-7700HQ, 17.30", 3.8 kganálise externo » MSI GT72VR 7RE-433
Asus Strix GL502VS-FY030D : Intel Core i7-6700HQ, 15.60", 2.6 kganálise externo » Asus Strix GL502VS-FY030D
Asus G752VS-GC087T : Intel Core i7-6700HQ, 17.30", 4.4 kganálise externo » Asus G752VS-GC087T
MSI GT62VR 7RE Dominator Pro - 7RE-223 : Intel Core i7-7700HQ, 15.60", 2.9 kganálise externo » MSI GT62VR 7RE Dominator Pro - 7RE-223
Alienware 17 R4-HID55-AUK2 : Intel Core i7-6820HK, 17.30", 4.4 kganálise externo » Alienware 17 R4-HID55-AUK2
HP Omen 17-w109ng : Intel Core i7-6700HQ, 17.30", 3.3 kganálise externo » HP Omen 17-w109ng
Medion Erazer X7849-MD60291 : Intel Core i7-6700HQ, 17.30", 3.5 kganálise externo » Medion Erazer X7849-MD60291
Gigabyte P35X v6-DE022T : Intel Core i7-6700HQ, 15.60", 2.4 kganálise externo » Gigabyte P35X v6-DE022T
Asus G752VS-GC064T : Intel Core i7-6700HQ, 17.30", 4 kganálise externo » Asus G752VS-GC064T
HP Omen 17-w103nf : Intel Core i7-6700HQ, 17.30", 3.4 kganálise externo » HP Omen 17-w103nf
Acer Predator 17 G9-793-78AU : Intel Core i7-6700HQ, 17.30", 4.2 kganálise externo » Acer Predator 17 G9-793-78AU
MSI GT73VR 6RE-030PL : Intel Core i7-6820HK, 17.30", 4.1 kganálise externo » MSI GT73VR 6RE-030PL
HP Omen 17-w104ns : Intel Core i7-6700HQ, 17.30", 3.4 kganálise externo » HP Omen 17-w104ns
Asus G752VS-GC003T : Intel Core i7-6700HQ, 17.30", 4.3 kganálise externo » Asus G752VS-GC003T
Gigabyte P57X v6 : Intel Core i7-6700HQ, 17.30", 3.2 kganálise externo » Gigabyte P57X v6
Alienware 15 R3-10881SLV : Intel Core i7-6700HQ, 15.60", 3.5 kganálise externo » Alienware 15 R3-10881SLV
Asus ROG G752VS-BA185T : Intel Core i7-6700HQ, 17.30", 4.4 kganálise externo » Asus ROG G752VS-BA185T
Aorus X7 v6 : Intel Core i7-6820HK, 17.30", 3.2 kganálise externo » Aorus X7 v6
MSI GT62VR-6REAC16H21 : Intel Core i7-6700HQ, 15.60", 2.9 kganálise externo » MSI GT62VR-6REAC16H21
Acer Predator 17 G9-793-79NC : Intel Core i7-6700HQ, 17.30", 4.2 kganálise externo » Acer Predator 17 G9-793-79NC
MSI GT73VR 6RE-022ES TITAN : Intel Core i7-6820HK, 17.30", 3.9 kganálise externo » MSI GT73VR 6RE-022ES TITAN
Asus G752VS-GC026T : Intel Core i7-6820HK, 17.30", 4.4 kganálise externo » Asus G752VS-GC026T
Asus Strix GL502VS-DB71 : Intel Core i7-6700HQ, 15.60", 2.6 kganálise externo » Asus Strix GL502VS-DB71
Aorus X5 v6 : Intel Core i7-6820HK, 15.60", 2.6 kganálise externo » Aorus X5 v6
MSI GT72VR-6REAC16H51 : Intel Core i7-6700HQ, 17.30", 3.9 kganálise externo » MSI GT72VR-6REAC16H51
Asus G752VS-BA191T : Intel Core i7-6700HQ, 17.30", 4.5 kganálise externo » Asus G752VS-BA191T
HP Omen 17-w106ng : Intel Core i7-6700HQ, 17.30", 2.8 kganálise externo » HP Omen 17-w106ng
HP Omen 17-w104ng : Intel Core i7-6700HQ, 17.30", 2.8 kganálise externo » HP Omen 17-w104ng
MSI GT62VR 6RE-016NL : Intel Core i7-6820HK, 15.60", 4 kganálise externo » MSI GT62VR 6RE-016NL
Gigabyte P37X v6-DE426T : Intel Core i7-6700HQ, 17.30", 2.8 kganálise externo » Gigabyte P37X v6-DE426T
MSI GT72VR Tobii-031 : Intel Core i7-6700HQ, 17.30", 3.9 kganálise externo » MSI GT72VR Tobii-031
MSI GT73VR-6RF-095FR : Intel Core i7-6820HK, 17.30", 3.9 kganálise externo » MSI GT73VR-6RF-095FR
Asus G752VS-GC123T : Intel Core i7-6700HQ, 17.30", 4.5 kganálise externo » Asus G752VS-GC123T
Acer Predator 17 G9-793-77LG : Intel Core i7-6700HQ, 17.30", 4.2 kganálise externo » Acer Predator 17 G9-793-77LG
Acer Predator 17 G9-793-70F3 : Intel Core i7-6700HQ, 17.30", 4.2 kganálise externo » Acer Predator 17 G9-793-70F3
MSI GT62VR-6RE-022UK : Intel Core i7-6700HQ, 15.60", 2.9 kganálise externo » MSI GT62VR-6RE-022UK
Asus Strix GL502VS-FY042T : Intel Core i7-6700HQ, 15.60", 2.6 kganálise externo » Asus Strix GL502VS-FY042T
Lenovo Ideapad Y910 : Intel Core i7-6820HK, 17.30", 4.6 kganálise externo » Lenovo Ideapad Y910
Acer Predator 15 G9-593-765Q : Intel Core i7-6700HQ, 15.60", 3.7 kganálise externo » Acer Predator 15 G9-593-765Q
MSI GT72VR-6RE16H51 : Intel Core i7-6700HQ, 17.30", 3.9 kganálise externo » MSI GT72VR-6RE16H51
MSI GT72VR 6RE Dominator Pro Tobii : Intel Core i7-6700HQ, 17.30", 3.8 kganálise externo » MSI GT72VR 6RE Dominator Pro Tobii
MSI GT73VR-6RE16SR451 : Intel Core i7-6820HK, 17.30", 4.1 kganálise externo » MSI GT73VR-6RE16SR451
Medion Erazer X7849 MD 60292 : Intel Core i7-6820HK, 17.30", 3.6 kganálise externo » Medion Erazer X7849 MD 60292
Asus Strix GL502VS-FY032T : Intel Core i7-6700HQ, 15.60", 2.6 kganálise externo » Asus Strix GL502VS-FY032T
Gigabyte P57x V6-CF2 : Intel Core i7-6700HQ, 17.30", 3 kganálise externo » Gigabyte P57x V6-CF2
Acer Predator 17 G9-793-77LN : Intel Core i7-6700HQ, 17.30", 4.2 kganálise externo » Acer Predator 17 G9-793-77LN
Gigabyte P35X v6-PC4K4D : Intel Core i7-6700HQ, 15.60", 2.3 kganálise externo » Gigabyte P35X v6-PC4K4D
MSI GT72VR 6RE-015US : Intel Core i7-6700HQ, 17.30", 3.9 kganálise externo » MSI GT72VR 6RE-015US
Asus G752VS-XB72K : Intel Core i7-6820HK, 17.30", 4.3 kganálise externo » Asus G752VS-XB72K
MSI GT62VR-6RE16H21 : Intel Core i7-6700HQ, 15.60", 2.9 kganálise externo » MSI GT62VR-6RE16H21
Asus G752VS-XB78K : Intel Core i7-6820HK, 17.30", 4.5 kganálise externo » Asus G752VS-XB78K
Please share our article, every link counts!
Class 1 GeForce RTX 2080 Super Mobile
Class 2 M1 Max 32-Core GPU *
GeForce RTX 2070 Super Mobile
M1 Max 24-Core GPU *
Radeon RX 5700M *
M1 Pro 16-Core GPU *
Radeon PRO W6600M *
GeForce RTX 2070 Super Max-Q
M1 Pro 14-Core GPU *
Quadro P4200
Quadro P5000 Max-Q *
Quadro P4000 Max-Q
Radeon RX 580X (Laptop) *
Radeon RX 580 (Laptop)
Radeon Pro 5300M
Radeon RX 5300M
Quadro P3000 Max-Q *
Radeon Pro WX 7100 *
Radeon RX 570X (Laptop) *
Radeon RX 570 (Laptop) *
Radeon RX 470 (Laptop) *
Class 3 GeForce GTX 1050 Ti Mobile
Radeon 680M
Quadro P2000 Max-Q
Radeon R9 M395X
GeForce GTX 1050 Ti Max-Q *
Radeon Pro Vega 16
WX Vega M GL
Radeon R9 M485X
GeForce GTX 1050 Max-Q *
Radeon 660M
Radeon RX 560X (Laptop)
Radeon RX 560 (Laptop)
Radeon Pro 560X
Radeon Pro 560
Radeon Pro 460
Radeon Pro WX 4130 *
Quadro P620 *
Radeon RX 550X (Laptop)
Radeon Pro 555X
Radeon Pro 555
Radeon Pro 455
Quadro P600
Radeon RX 540X *
Radeon Pro WX 2100 *
Radeon Pro WX 3100 *
Radeon Pro 450
Radeon 630
Radeon 540X *
Quadro P520
Quadro P500 *
Iris Plus Graphics G7 (Ice Lake 64 EU) *
Vega 10 *
Iris Pro Graphics 580
Vega 9
FirePro W5130M
UHD Graphics Xe G4 48EUs *
UHD Graphics 32EUs
UHD Graphics Xe 32EUs (Tiger Lake-H) *
UHD Graphics 750
Vega 7
Radeon R7 M465
Vega 8
Iris Plus Graphics G4 (Ice Lake 48 EU)
Quadro M600M
FirePro W4190M
Radeon R7 M445
UHD Graphics 24EUs (Alder Lake-N) *
Radeon R7 M340
Radeon 610M *
UHD Graphics G1 (Ice Lake 32 EU)
UHD Graphics Xe 16EUs (Tiger Lake-H) *
UHD Graphics G7 (Lakefield GT2 64 EU)
Radeon R5 (Bristol Ridge)
Adreno 690 *
Adreno 685 *
Adreno 680 *
UHD Graphics G4 (Lakefield GT1 48 EU) *
Class 4 UHD Graphics 730
Radeon R5 M315 *
Radeon R5 M420 *
UHD Graphics 617
UHD Graphics 615
Radeon R4 (Stoney Ridge)
Radeon R2 (Stoney Ridge)
HD Graphics (Broadwell)
Class 5 Posición aproximada del adaptador gráfico
Klaus Hinum, 2018-01-18 (Update: 2018-01-18)
 Deutsch
 English
 Español
 Français
 Italiano
 Nederlands
 Polski
 Português
 Русский
 Türkçe
 Svenska
 Chinese
 Magyar