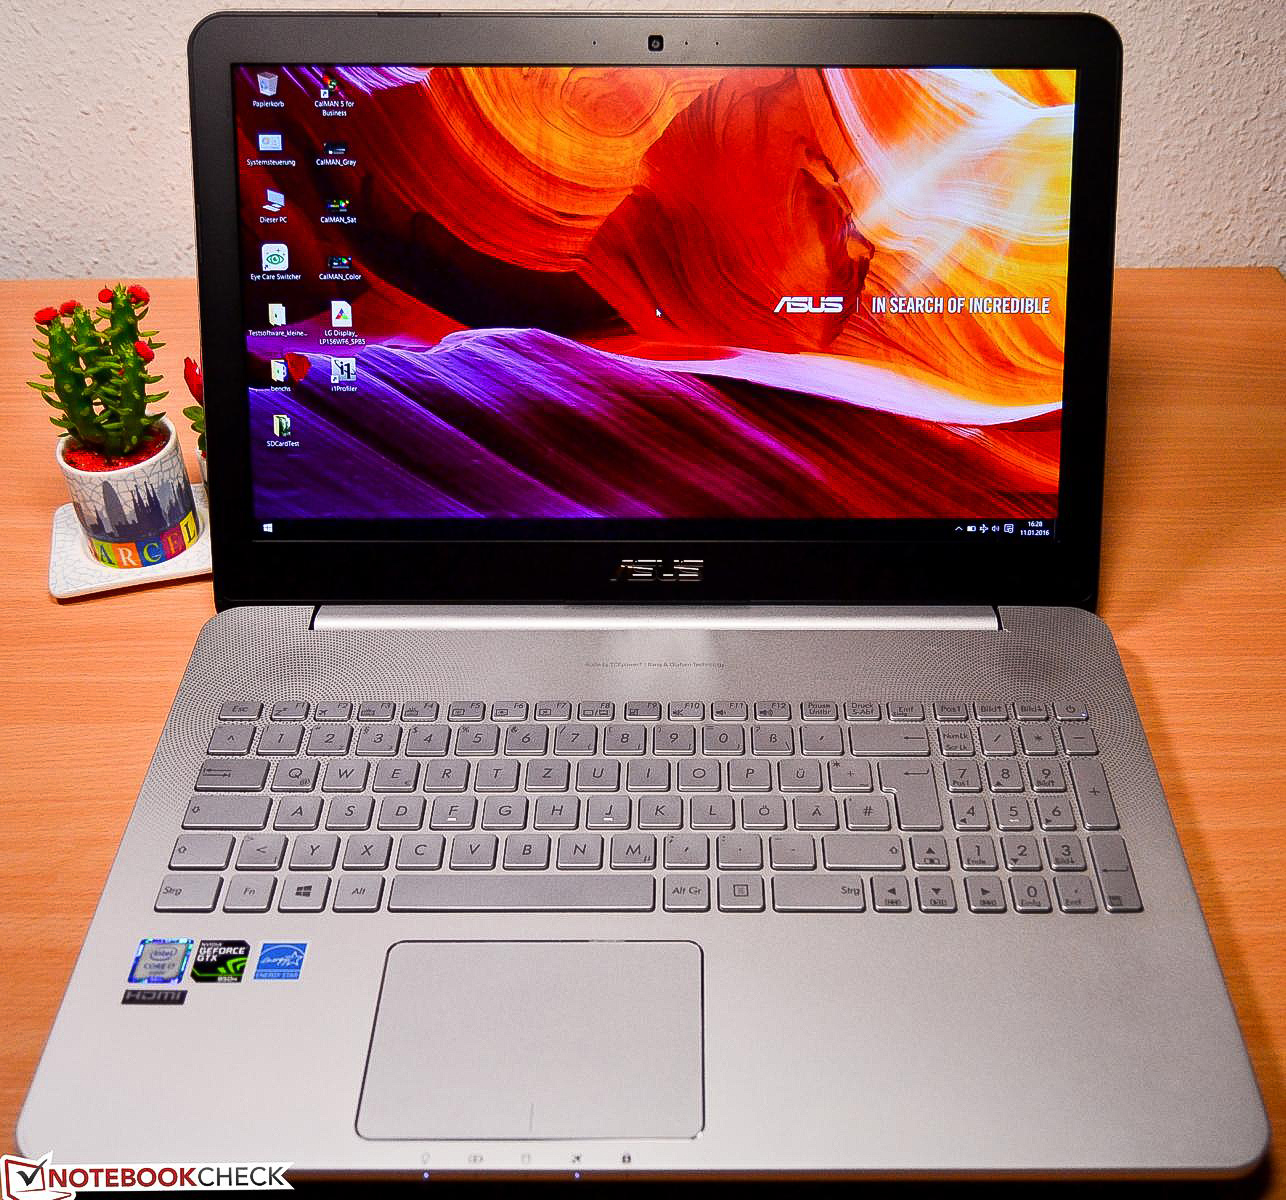
Breve análisis del Asus N552VX-FY103T


| |||||||||||||||||||||||||
iluminación: 85 %
Brillo con batería: 336 cd/m²
Contraste: 988:1 (Negro: 0.34 cd/m²)
ΔE ColorChecker Calman: 5.26 | ∀{0.5-29.43 Ø4.72}
ΔE Greyscale Calman: 4.26 | ∀{0.09-98 Ø4.97}
88% sRGB (Argyll 1.6.3 3D)
57% AdobeRGB 1998 (Argyll 1.6.3 3D)
64% AdobeRGB 1998 (Argyll 3D)
87.7% sRGB (Argyll 3D)
67.9% Display P3 (Argyll 3D)
Gamma: 2.35
CCT: 6758 K
| Asus N552VX-FY103T GeForce GTX 950M, 6700HQ, Toshiba MQ02ABD100H | Asus N551JK-CN166H GeForce GTX 850M, 4200H, HGST Travelstar 5K1000 HTS541010A9E680 | Acer Aspire V5-591G-71K2 GeForce GTX 950M, 6700HQ, Toshiba MQ02ABF050H (SSHD 500 + 8 GB) | Asus GL552JX-CN154H GeForce GTX 950M, 4720HQ, Micron M600 MTFDDAV128MBF | Lenovo Ideapad Y700 15ISK 80NW GeForce GTX 960M, 6700HQ, Samsung MZNLN128HCGR-000L2 | |
|---|---|---|---|---|---|
| Display | 6% | 23% | 7% | -38% | |
| Display P3 Coverage (%) | 67.9 | 67.3 -1% | 84.9 25% | 67.8 0% | 38.55 -43% |
| sRGB Coverage (%) | 87.7 | 96.7 10% | 99.8 14% | 97.5 11% | 57.6 -34% |
| AdobeRGB 1998 Coverage (%) | 64 | 69.4 8% | 83.3 30% | 70 9% | 39.86 -38% |
| Response Times | -7% | 6% | |||
| Response Time Grey 50% / Grey 80% * (ms) | 42 ? | 44 ? -5% | 40.8 ? 3% | ||
| Response Time Black / White * (ms) | 26 ? | 28 ? -8% | 24 ? 8% | ||
| PWM Frequency (Hz) | 200 ? | 58.1 | |||
| Screen | -12% | -41% | 4% | -24% | |
| Brightness middle (cd/m²) | 336 | 323 -4% | 249 -26% | 326 -3% | 258.6 -23% |
| Brightness (cd/m²) | 304 | 312 3% | 240 -21% | 317 4% | 242 -20% |
| Brightness Distribution (%) | 85 | 83 -2% | 86 1% | 91 7% | 88 4% |
| Black Level * (cd/m²) | 0.34 | 0.38 -12% | 0.48 -41% | 0.31 9% | 0.277 19% |
| Contrast (:1) | 988 | 850 -14% | 519 -47% | 1052 6% | 934 -5% |
| Colorchecker dE 2000 * | 5.26 | 7.4 -41% | 10.15 -93% | 4.14 21% | 8.1 -54% |
| Colorchecker dE 2000 max. * | 10.49 | ||||
| Greyscale dE 2000 * | 4.26 | 6.24 -46% | 12.13 -185% | 5.46 -28% | 7.23 -70% |
| Gamma | 2.35 94% | 2.98 74% | 2.48 89% | 2.44 90% | 1.99 111% |
| CCT | 6758 96% | 8098 80% | 13445 48% | 7574 86% | 6567 99% |
| Color Space (Percent of AdobeRGB 1998) (%) | 57 | 69 21% | 74 30% | 64 12% | 36.5 -36% |
| Color Space (Percent of sRGB) (%) | 88 | 100 14% | 97 10% | 57.2 -35% | |
| Media total (Programa/Opciones) | -3% /
-7% | -8% /
-22% | 6% /
5% | -19% /
-23% |
* ... más pequeño es mejor
Tiempos de respuesta del display
| ↔ Tiempo de respuesta de Negro a Blanco | ||
|---|---|---|
| 26 ms ... subida ↗ y bajada ↘ combinada | ↗ 5 ms subida | 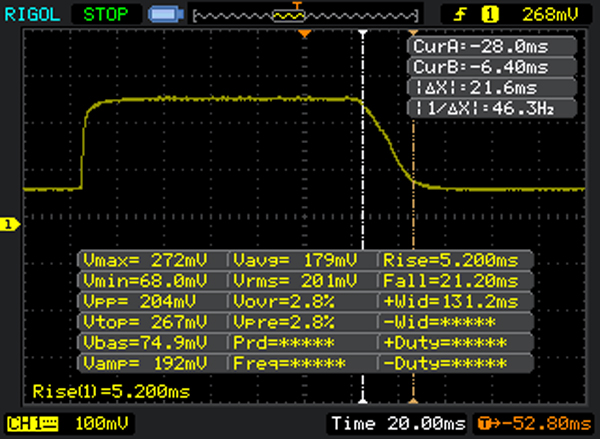 |
| ↘ 21 ms bajada | ||
| La pantalla mostró tiempos de respuesta relativamente lentos en nuestros tests pero podría ser demasiado lenta para los jugones. En comparación, todos los dispositivos de prueba van de ##min### (mínimo) a 240 (máximo) ms. » 62 % de todos los dispositivos son mejores. Eso quiere decir que el tiempo de respuesta es peor que la media (19.8 ms) de todos los dispositivos testados. | ||
| ↔ Tiempo de respuesta 50% Gris a 80% Gris | ||
| 42 ms ... subida ↗ y bajada ↘ combinada | ↗ 18 ms subida | 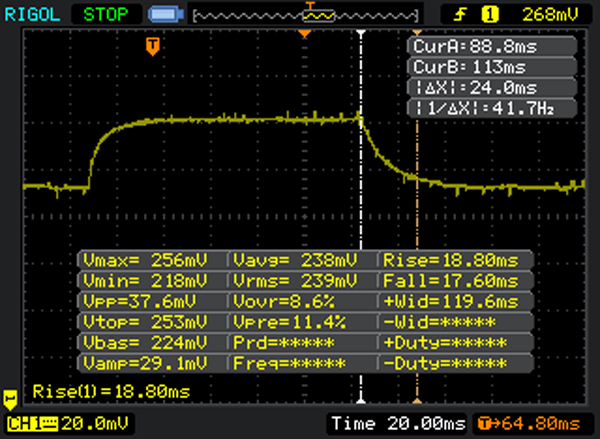 |
| ↘ 24 ms bajada | ||
| La pantalla mostró tiempos de respuesta lentos en nuestros tests y podría ser demasiado lenta para los jugones. En comparación, todos los dispositivos de prueba van de ##min### (mínimo) a 636 (máximo) ms. » 67 % de todos los dispositivos son mejores. Eso quiere decir que el tiempo de respuesta es peor que la media (31 ms) de todos los dispositivos testados. | ||
Parpadeo de Pantalla / PWM (Pulse-Width Modulation)
| Parpadeo de Pantalla / PWM no detectado | ||
Comparación: 52 % de todos los dispositivos testados no usaron PWM para atenuar el display. Si se usó, medimos una media de 7781 (mínimo: 5 - máxmo: 343500) Hz. | ||

| Asus N552VX-FY103T GeForce GTX 950M, 6700HQ, Toshiba MQ02ABD100H | Asus N551JK-CN166H GeForce GTX 850M, 4200H, HGST Travelstar 5K1000 HTS541010A9E680 | Acer Aspire V5-591G-71K2 GeForce GTX 950M, 6700HQ, Toshiba MQ02ABF050H (SSHD 500 + 8 GB) | Asus GL552JX-CN154H GeForce GTX 950M, 4720HQ, Micron M600 MTFDDAV128MBF | Lenovo Ideapad Y700 15ISK 80NW GeForce GTX 960M, 6700HQ, Samsung MZNLN128HCGR-000L2 | |
|---|---|---|---|---|---|
| Cinebench R10 | -30% | 1% | -6% | -2% | |
| Rendering Single 32Bit (Points) | 5453 | 4773 -12% | 5547 2% | 5104 -6% | 5283 -3% |
| Rendering Multiple CPUs 32Bit (Points) | 20388 | 10668 -48% | 20433 0% | 19276 -5% | 20302 0% |
| Cinebench R11.5 | -33% | 1% | -5% | -6% | |
| CPU Single 64Bit (Points) | 1.68 | 1.46 -13% | 1.68 0% | 1.54 -8% | 1.48 -12% |
| CPU Multi 64Bit (Points) | 7.42 | 3.5 -53% | 7.48 1% | 7.35 -1% | 7.46 1% |
| Cinebench R15 | -32% | 1% | -5% | -6% | |
| CPU Single 64Bit (Points) | 146 | 130 -11% | 148 1% | 133 -9% | 129 -12% |
| CPU Multi 64Bit (Points) | 673 | 323 -52% | 677 1% | 669 -1% | 676 0% |
| Media total (Programa/Opciones) | -32% /
-32% | 1% /
1% | -5% /
-5% | -5% /
-4% |
| Asus N552VX-FY103T GeForce GTX 950M, 6700HQ, Toshiba MQ02ABD100H | Asus N551JK-CN166H GeForce GTX 850M, 4200H, HGST Travelstar 5K1000 HTS541010A9E680 | Acer Aspire V5-591G-71K2 GeForce GTX 950M, 6700HQ, Toshiba MQ02ABF050H (SSHD 500 + 8 GB) | Asus GL552JX-CN154H GeForce GTX 950M, 4720HQ, Micron M600 MTFDDAV128MBF | Lenovo Ideapad Y700 15ISK 80NW GeForce GTX 960M, 6700HQ, Samsung MZNLN128HCGR-000L2 | |
|---|---|---|---|---|---|
| PCMark 7 | -3% | -2% | 41% | 36% | |
| Score (Points) | 4714 | 4131 -12% | 4673 -1% | 5829 24% | 5918 26% |
| Creativity (Points) | 7837 | 7266 -7% | 7654 -2% | 10382 32% | 9899 26% |
| Productivity (Points) | 3507 | 3494 0% | 3382 -4% | 5180 48% | 5008 43% |
| Lightweight (Points) | 3709 | 3941 6% | 3745 1% | 5889 59% | 5543 49% |
| PCMark 8 | -12% | 7% | 8% | 11% | |
| Work Score Accelerated v2 (Points) | 4503 | 3881 -14% | 4747 5% | 4972 10% | 5011 11% |
| Home Score Accelerated v2 (Points) | 3452 | 3113 -10% | 3719 8% | 3637 5% | 3845 11% |
| Media total (Programa/Opciones) | -8% /
-6% | 3% /
1% | 25% /
30% | 24% /
28% |
| PCMark 7 Score | 4714 puntos | |
| PCMark 8 Home Score Accelerated v2 | 3452 puntos | |
| PCMark 8 Work Score Accelerated v2 | 4503 puntos | |
ayuda | ||

| 3DMark 11 - 1280x720 Performance | |
| Lenovo Ideapad Y700 15ISK 80NW | |
| Acer Aspire V5-591G-71K2 | |
| MSI PE60 2QD | |
| Asus N552VX-FY103T | |
| Asus GL552JX-CN154H | |
| Asus N551JK-CN166H | |
| 3DMark | |
| 1920x1080 Fire Strike Score | |
| Lenovo Ideapad Y700 15ISK 80NW | |
| MSI PE60 2QD | |
| Acer Aspire V5-591G-71K2 | |
| Asus N552VX-FY103T | |
| Asus GL552JX-CN154H | |
| Asus N551JK-CN166H | |
| 1280x720 Cloud Gate Standard Score | |
| Lenovo Ideapad Y700 15ISK 80NW | |
| MSI PE60 2QD | |
| Acer Aspire V5-591G-71K2 | |
| Asus N552VX-FY103T | |
| Asus GL552JX-CN154H | |
| Asus N551JK-CN166H | |
| 1280x720 Ice Storm Standard Score | |
| Acer Aspire V5-591G-71K2 | |
| Lenovo Ideapad Y700 15ISK 80NW | |
| Asus N551JK-CN166H | |
| Asus N552VX-FY103T | |
| 3DMark 11 Performance | 4579 puntos | |
| 3DMark Ice Storm Standard Score | 58288 puntos | |
| 3DMark Cloud Gate Standard Score | 14578 puntos | |
| 3DMark Fire Strike Score | 2917 puntos | |
ayuda | ||
| Rise of the Tomb Raider | |
| 1366x768 Medium Preset AF:2x | |
| Asus N551ZU-CN007H | |
| MSI PE60 2QD | |
| Asus N552VX-FY103T | |
| 1920x1080 High Preset AA:FX AF:4x | |
| Asus N551ZU-CN007H | |
| MSI PE60 2QD | |
| Asus N552VX-FY103T | |
| BioShock Infinite | |
| 1366x768 Medium Preset | |
| Lenovo Ideapad Y700 15ISK 80NW | |
| MSI PE60 2QD | |
| Asus N552VX-FY103T | |
| Asus GL552JX-CN154H | |
| Asus N551ZU-CN007H | |
| 1366x768 High Preset | |
| Lenovo Ideapad Y700 15ISK 80NW | |
| MSI PE60 2QD | |
| Asus N552VX-FY103T | |
| Asus GL552JX-CN154H | |
| Asus N551ZU-CN007H | |
| 1920x1080 Ultra Preset, DX11 (DDOF) | |
| Lenovo Ideapad Y700 15ISK 80NW | |
| MSI PE60 2QD | |
| Asus N552VX-FY103T | |
| Asus GL552JX-CN154H | |
| Asus N551ZU-CN007H | |
| Dirt Rally | |
| 1366x768 Medium Preset | |
| Asus GL552JX-CN154H | |
| Acer Aspire V5-591G-71K2 | |
| Asus N552VX-FY103T | |
| Asus N551ZU-CN007H | |
| 1920x1080 High Preset | |
| Acer Aspire V5-591G-71K2 | |
| Asus N552VX-FY103T | |
| Asus GL552JX-CN154H | |
| Asus N551ZU-CN007H | |
| 1920x1080 Ultra Preset AA:4x MS | |
| Acer Aspire V5-591G-71K2 | |
| Asus GL552JX-CN154H | |
| Asus N552VX-FY103T | |
| Asus N551ZU-CN007H | |
| bajo | medio | alto | ultra | |
|---|---|---|---|---|
| BioShock Infinite (2013) | 101.5 | 84.3 | 27.7 | |
| Dirt Rally (2015) | 90.7 | 56.3 | 21.7 | |
| Rise of the Tomb Raider (2016) | 35 | 21 |
| Asus N552VX-FY103T GeForce GTX 950M, 6700HQ, Toshiba MQ02ABD100H | Asus N551JK-CN166H GeForce GTX 850M, 4200H, HGST Travelstar 5K1000 HTS541010A9E680 | Acer Aspire V5-591G-71K2 GeForce GTX 950M, 6700HQ, Toshiba MQ02ABF050H (SSHD 500 + 8 GB) | Asus GL552JX-CN154H GeForce GTX 950M, 4720HQ, Micron M600 MTFDDAV128MBF | Lenovo Ideapad Y700 15ISK 80NW GeForce GTX 960M, 6700HQ, Samsung MZNLN128HCGR-000L2 | |
|---|---|---|---|---|---|
| Noise | -2% | -2% | 5% | -0% | |
| apagado / medio ambiente * (dB) | 31.3 | ||||
| Idle Minimum * (dB) | 33.1 | 32.1 3% | 32.6 2% | 30 9% | 30.4 8% |
| Idle Average * (dB) | 33.2 | 32.9 1% | 32.6 2% | 30 10% | 30.5 8% |
| Idle Maximum * (dB) | 33.2 | 33.7 -2% | 32.6 2% | 31.3 6% | 33.3 -0% |
| Load Average * (dB) | 37.7 | 42 -11% | 42.7 -13% | 36.9 2% | 41.4 -10% |
| Load Maximum * (dB) | 43.4 | 44.8 -3% | 45.5 -5% | 44.7 -3% | 47 -8% |
* ... más pequeño es mejor
Ruido
| Ocioso |
| 33.1 / 33.2 / 33.2 dB(A) |
| HDD |
| 33.3 dB(A) |
| DVD |
| 37.7 / dB(A) |
| Carga |
| 37.7 / 43.4 dB(A) |
 | ||
30 dB silencioso 40 dB(A) audible 50 dB(A) ruidosamente alto |
||
min: | ||
(±) La temperatura máxima en la parte superior es de 41.5 °C / 107 F, frente a la media de 36.8 °C / 98 F, que oscila entre 21 y 71 °C para la clase Multimedia.
(+) El fondo se calienta hasta un máximo de 39 °C / 102 F, frente a la media de 39.1 °C / 102 F
(+) En reposo, la temperatura media de la parte superior es de 25.2 °C / 77# F, frente a la media del dispositivo de 31.3 °C / 88 F.
(+) Los reposamanos y el panel táctil alcanzan como máximo la temperatura de la piel (32.2 °C / 90 F) y, por tanto, no están calientes.
(-) La temperatura media de la zona del reposamanos de dispositivos similares fue de 28.7 °C / 83.7 F (-3.5 °C / -6.3 F).
| Asus N552VX-FY103T GeForce GTX 950M, 6700HQ, Toshiba MQ02ABD100H | Asus N551JK-CN166H GeForce GTX 850M, 4200H, HGST Travelstar 5K1000 HTS541010A9E680 | Acer Aspire V5-591G-71K2 GeForce GTX 950M, 6700HQ, Toshiba MQ02ABF050H (SSHD 500 + 8 GB) | Asus GL552JX-CN154H GeForce GTX 950M, 4720HQ, Micron M600 MTFDDAV128MBF | Lenovo Ideapad Y700 15ISK 80NW GeForce GTX 960M, 6700HQ, Samsung MZNLN128HCGR-000L2 | |
|---|---|---|---|---|---|
| Power Consumption | -6% | 3% | 4% | ||
| Idle Minimum * (Watt) | 7 | 8.6 -23% | 6 14% | 6.2 11% | |
| Idle Average * (Watt) | 10.9 | 12 -10% | 9.8 10% | 10.3 6% | |
| Idle Maximum * (Watt) | 12.9 | 13 -1% | 11.4 12% | 12.2 5% | |
| Load Average * (Watt) | 72 | 72.2 -0% | 84 -17% | 77 -7% | |
| Load Maximum * (Watt) | 109 | 104 5% | 113.5 -4% | 105 4% |
* ... más pequeño es mejor
| Off / Standby | |
| Ocioso | |
| Carga |
|
Clave:
min: | |
| Asus N552VX-FY103T 44 Wh | Asus N551JK-CN166H 56 Wh | Acer Aspire V5-591G-71K2 56 Wh | Asus GL552JX-CN154H 48 Wh | |
|---|---|---|---|---|
| Duración de Batería | 20% | 53% | -0% | |
| Reader / Idle (h) | 6 | 7.3 22% | 11.9 98% | 3.7 -38% |
| WiFi v1.3 (h) | 4.5 | 4.3 -4% | 3.7 -18% | |
| Load (h) | 1.1 | 1.3 18% | 1.8 64% | 1.7 55% |
| WiFi (h) | 4.5 |
Pro
Contra
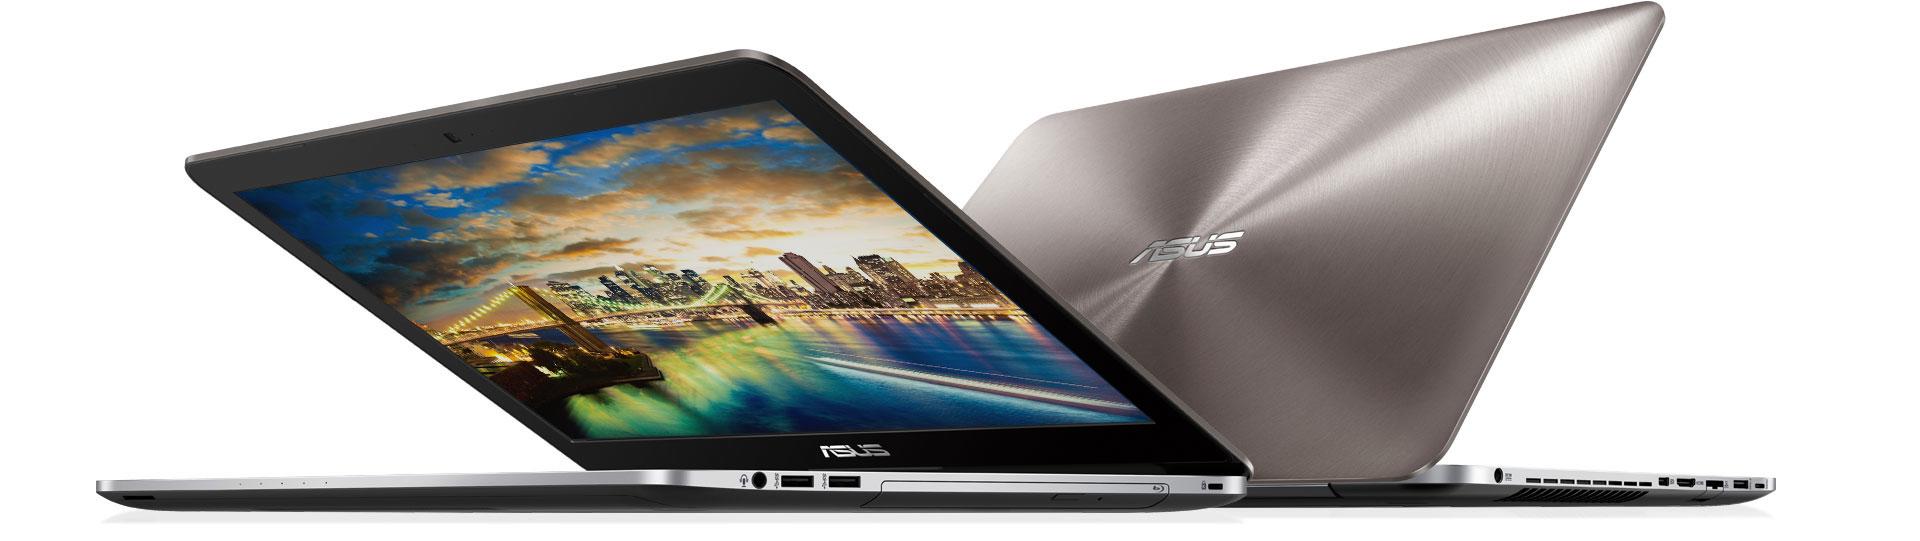
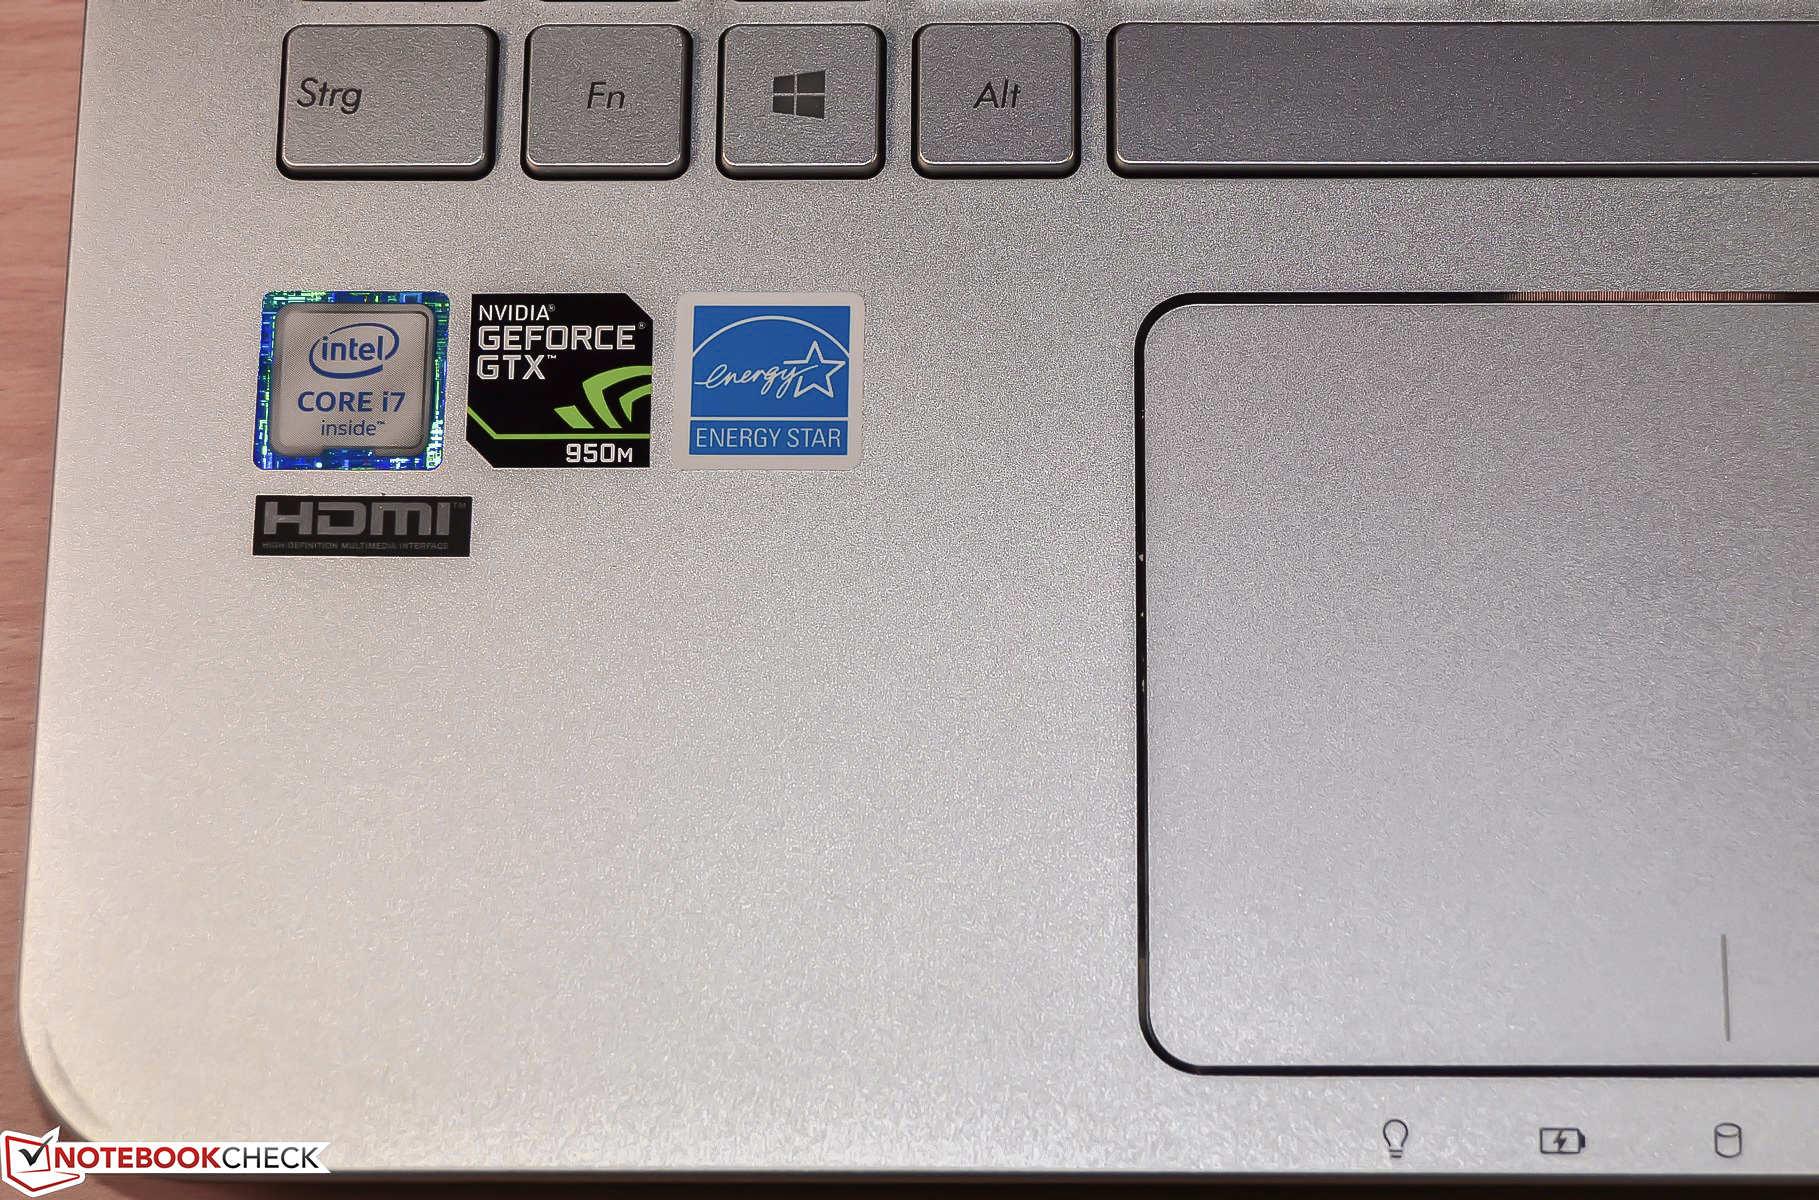
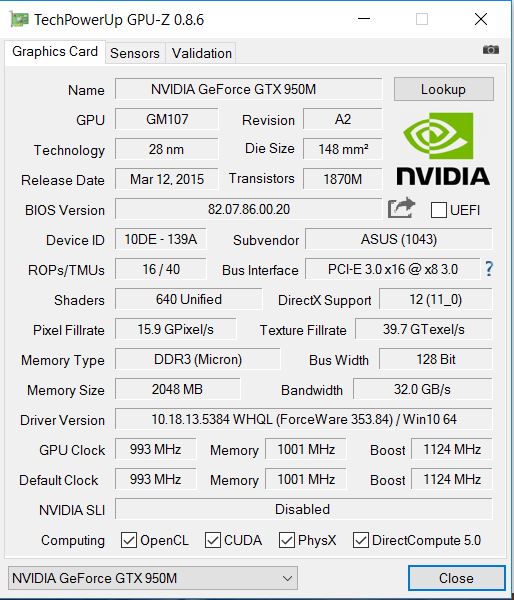
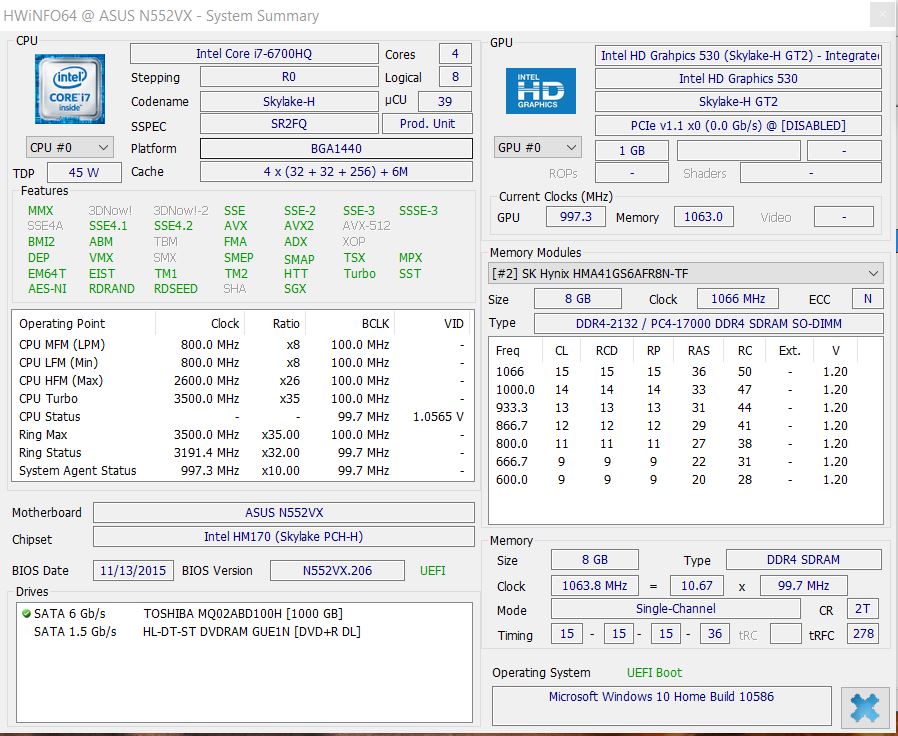
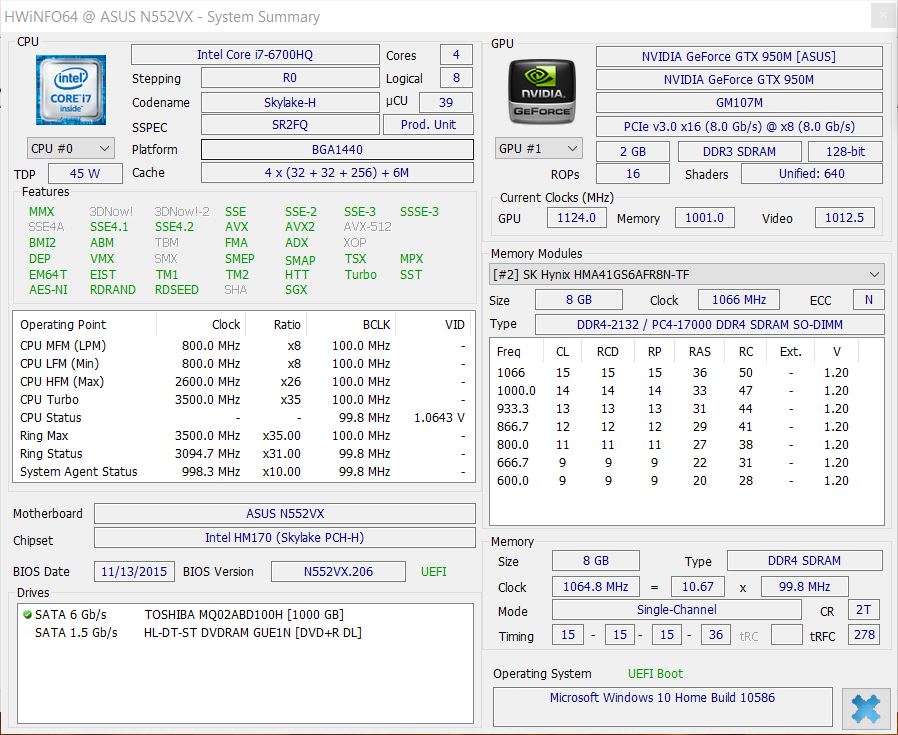
La gráfica Nvidia GeForce 950M junto con 2048 MB de VRAM DDR3 no es precisamente adecuada para los jugones ambiciosos. Los juegos actuales necesitarán reducir los detalles gráficos y/o la resolución. Sin embargo, todos los demás campos de uso del sector multimedia quedan completamente cubiertos. Así, los usuarios que puedan olvidarse de las sesiones regulares de juego a configuración alta y usar el portátil normalmente enchufado se llevarán una plataforma muy exitosa con el Asus N552VX-FY103T. La construcción es impecable, lo mismo que la pantalla, el sonido, los dispositivos de entrada, el rendimiento (enchufado), las temperaturas y las emisiones.
Por desgracia, no descubrimos aquí al manitas que muchos esperaban.
A un precio de menos de 1000 Euros, el modelo de pruebas es una solución con un buen ratio precio-rendimiento. Una alternativa un 30% más cara es el Acer Nitro Black Edition VN7-792G-74Q4. Es un portátil de 17" que también se ralentiza en batería. La ralentización es algo desconocido para el Lenovo Y700 15ISK 80NW, pero pierde puntos en la valoración de pantalla.
Ésta es una versión acortada del análisis original. Puedes leer el análisis completo en inglés aquí.
Asus N552VX-FY103T
- 12/09/2016 v6 (old)
Marcus Conrad