Análisis para el Intel Core i7-6700HQ procesador
Breve análisis del SSD externo Samsung T5
Samsung ha presentado su SSD T5, el último modelo de una serie de SSDs externos de alto rendimiento. Como sus predecesores, el T5 ofrece tasas de transferencias de datos de vértigo y en un paquete premium de primera, pero le falta innovación.
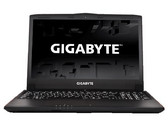
Intel Core i7-6700HQ, AMD Radeon Pro 450, 15.4", 1.8 kgBreve análisis del portátil Gigabyte P55W v6
Centrado en lo esencial. La versión más reciente del Gigabyte P55W no ha cambiado demasiado. El predecesor usaba una GeForce GTX 970M, el nuevo una GTX 1060 - y es una notable diferencia.
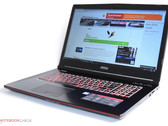
Intel Core i7-6700HQ, NVIDIA GeForce GTX 1060 Mobile, 15.6", 2.7 kgBreve análisis del MSI GE72VR 6RF Apache Pro
¡Apache a la vista! La conocida marca de portátiles gaming MSI nos trae una combinación interesante. Un veloz procesador quad core de la familia Skylake y una GPU Pascal son el corazón de su último modelo. Descubre lo bien que encajan los componentes entre sí en nuestro análisis exhaustivo.
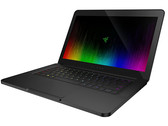
Intel Core i7-6700HQ, NVIDIA GeForce GTX 1060 Mobile, 17.3", 3 kgBreve análisis del Razer Blade (2016) FHD
Exitoso. El delgado Razer de 14" trae hardware potente que puede con todos los juegos modernos en el display mate Full HD. También tiene buenos dispositivos de entrada y Thunderbolt 3. El aguante del pequeño sistema tampoco está mal.
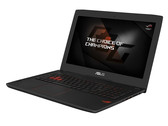
Intel Core i7-6700HQ, NVIDIA GeForce GTX 1060 Mobile, 14", 1.9 kgBreve análisis del Asus ROG Strix GL502VM
Potente y delgado. El Asus GL502VM es un portátil gaming delgado de 15.6" que puede ejecutar juegos con fluidez en su pantalla mate FHD. El hardware necesita mucha ventilación, por lo que el portátil puede resulta ruidoso.
Intel Core i7-6700HQ, NVIDIA GeForce GTX 1060 Mobile, 15.6", 2.5 kgAcer Predator 15 G9-593-765Q: NVIDIA GeForce GTX 1070 Mobile, 15.60", 3.7 kg
análise » Breve análisis del Acer Predator 15 G9-593
Asus GL702VM-GC102D: NVIDIA GeForce GTX 1060 Mobile, 17.30", 2.7 kg
análise » Breve análisis del portátil Asus GL702VM-GC102D
Razer Blade (2016): NVIDIA GeForce GTX 1060 Mobile, 14.00", 2 kg
análise » Análisis completo del Razer Blade (2016)
Apple MacBook Pro 15 2016 (2.6 GHz, 450): AMD Radeon Pro 450, 15.40", 1.8 kg
análise » Análisis completo del Apple MacBook Pro 15 (Fin de 2016, 2.6 GHz i7)
HP Omen 17-w110ng: NVIDIA GeForce GTX 1070 Mobile, 17.30", 3.3 kg
análise » Breve análisis del HP Omen 17 (i7-6700HQ, GTX 1070)
MSI GS63VR-6RF16H22 Stealth Pro: NVIDIA GeForce GTX 1060 Mobile, 15.60", 1.9 kg
análise » Breve análisis del MSI GS63VR 6RF Stealth Pro
Gigabyte P57X v6: NVIDIA GeForce GTX 1070 Mobile, 17.30", 3.2 kg
análise » Breve análisis del Gigabyte P57X v6
Nexoc G734III: NVIDIA GeForce GTX 1070 Mobile, 17.30", 3.3 kg
análise » Breve análisis del Nexoc G734III (Clevo P670RS-G)
MSI GT72VR 6RD-063US: NVIDIA GeForce GTX 1060 Mobile, 17.30", 3.8 kg
análise » Breve análisis del MSI GT72VR 6RD Dominator Pro
Acer Predator 17 G9-793-77LG: NVIDIA GeForce GTX 1070 Mobile, 17.30", 4.2 kg
análise » Breve análisis del Acer Predator 17 G9-793
MSI GE62VR 6RF-001US: NVIDIA GeForce GTX 1060 Mobile, 15.60", 2.5 kg
análise » Breve análisis del MSI GE62VR 6RF Apache Xotic PC Edition
MSI GS43VR 6RE-006US: NVIDIA GeForce GTX 1060 Mobile, 14.00", 1.9 kg
análise » Breve análisis del MSI GS43VR 6RE Phantom Pro
Schenker XMG P507: NVIDIA GeForce GTX 1060 Mobile, 15.60", 2.8 kg
análise » Breve análisis del Schenker XMG P507 (Clevo P651RP6-G)
MSI GS73VR 6RF: NVIDIA GeForce GTX 1060 Mobile, 17.30", 2.4 kg
análise » Análisis completo del MSI GS73VR 6RF
MSI GT72VR 6RE-015US: NVIDIA GeForce GTX 1070 Mobile, 17.30", 3.9 kg
análise » Breve análisis del MSI GT72VR 6RE-015US
Asus Strix GL502VS-FY032T: NVIDIA GeForce GTX 1070 Mobile, 15.60", 2.6 kg
análise » Análisis completo del Asus ROG Strix GL502VS
MSI GT62VR-6RE16H21: NVIDIA GeForce GTX 1070 Mobile, 15.60", 2.9 kg
análise » Análisis completo del MSI GT62VR 6RE Dominator Pro
HP Pavilion 17 FHD V3A33AV: NVIDIA GeForce GTX 960M, 17.30", 3 kg
análise » Breve análisis del HP Pavilion 17 FHD V3A33AV
HP Pavilion 15 UHD T9Y85AV: NVIDIA GeForce GTX 960M, 15.60", 2.2 kg
análise » Breve análisis del HP Pavilion 15 UHD T9Y85AV
Dell Precision 3510: AMD FirePro W5130M, 15.60", 2.4 kg
análise » Breve análisis de la estación de trabajo Dell Precision 3510
MSI GL62-6QFi781H11: NVIDIA GeForce GTX 960M, 15.60", 2.3 kg
análise » Breve análisis del MSI GL62 6QF
Asus Strix GL502VY-DS71: NVIDIA GeForce GTX 980M, 15.60", 2.6 kg
análise » Breve análisis del Asus ROG Strix GL502VY-DS71
Asus Strix GL502VT-DS74: NVIDIA GeForce GTX 970M, 15.60", 2.5 kg
análise » Breve análisis del Asus ROG Strix GL502VT-DS74
Acer Predator 15 G9-592-7925: NVIDIA GeForce GTX 970M, 15.60", 3.5 kg
análise » Breve análisis del portátil Acer Predator 15 (i7-6700HQ, GTX 970M)
Acer Predator 17 G9-792-71EF: NVIDIA GeForce GTX 980M, 17.30", 4.1 kg
análise » Breve análisis del Acer Predator 17 (i7-6700HQ, GTX 980M)
MSI Prestige PE70 6QE-055XUS: NVIDIA GeForce GTX 960M, 17.30", 2.4 kg
análise » Breve análisis del MSI PE70 6QE Prestige iBuyPower Edition
MSI PE60 6QE-056XUS: NVIDIA GeForce GTX 960M, 15.60", 2.4 kg
análise » Breve análisis del MSI PE60 6QE Prestige iBuyPower Edition
MSI PX60 6QD: NVIDIA GeForce GTX 950M, 15.60", 2.2 kg
análise » Breve análisis del MSI PX60 6QD Prestige iBuyPower Edition
Aorus X5S v5: NVIDIA GeForce GTX 980M, 15.60", 2.5 kg
análise » Breve análisis del Aorus X5S v5
Gigabyte P55K v5: NVIDIA GeForce GTX 965M, 15.60", 2.6 kg
análise » Breve análisis del Gigabyte P55K v5
Lenovo ThinkPad T460p-20FXS05500: NVIDIA GeForce 940MX, 14.00", 1.9 kg
análise » Breve análisis del Lenovo ThinkPad T460p (Core i7, GeForce 940MX)
Asus G501VW-FY081T: NVIDIA GeForce GTX 960M, 15.60", 2.1 kg
análise » Breve análisis del Asus G501VW-FY081T
Gigabyte P57W: NVIDIA GeForce GTX 970M, 17.30", 3.2 kg
análise » Breve análisis del Gigabyte P57W
Asus GL552VW-DH74: NVIDIA GeForce GTX 960M, 15.60", 2.6 kg
análise » Breve análisis del Asus GL552VW Xotic PC Edition
Asus N752VX-GC131T: NVIDIA GeForce GTX 950M, 17.30", 3.2 kg
análise » Breve análisis del Asus N752VX-GC131T
Asus GL752VW-T4168T: NVIDIA GeForce GTX 960M, 17.30", 3 kg
análise » Breve análisis del portátil Asus GL752VW
Asus N552VX-FY103T: NVIDIA GeForce GTX 950M, 15.60", 2.5 kg
análise » Breve análisis del Asus N552VX-FY103T
Acer Aspire V15 Nitro BE VN7-592G-79DV: NVIDIA GeForce GTX 960M, 15.60", 2.3 kg
análise » Breve análisis del Acer Aspire V15 Nitro BE VN7-592G-79DV
MSI GL72 6QF: NVIDIA GeForce GTX 960M, 17.30", 2.8 kg
análise » MSI GL72 6QF Xotic PC Edition
Gigabyte P37X v5: NVIDIA GeForce GTX 980M, 17.30", 2.9 kg
análise » Breve análisis del Gigabyte P37X v5
Alienware 17 R3 (A17-9935): NVIDIA GeForce GTX 980M, 17.30", 3.7 kg
análise » Breve análisis del Alienware 17 R3
Gigabyte P55W v5: NVIDIA GeForce GTX 970M, 15.60", 2.6 kg
análise » Breve análisis del Gigabyte P55W v5
MSI GS60-6QE4K16H21: NVIDIA GeForce GTX 970M, 15.60", 2 kg
análise » Breve análisis del MSI GS60 6QE Ghost Pro
Gigabyte P35X v5: NVIDIA GeForce GTX 980M, 15.60", 2.6 kg
análise » Breve análisis del Gigabyte P35X v5
Acer Predator 17 G9-791-75PV: NVIDIA GeForce GTX 970M, 17.30", 4.1 kg
análise » Breve análisis del Acer Predator 17 G9-791
Dell XPS 15 9550 i7 FHD: NVIDIA GeForce GTX 960M, 15.60", 2 kg
análise » Breve análisis del Dell XPS 15 9550 (Core i7, FHD)
Asus ZenBook Pro UX501VW-DS71T: NVIDIA GeForce GTX 960M, 15.60", 2.3 kg
análise » Breve análisis del Asus ZenBook Pro UX501VW
Asus G752VY-RH71: NVIDIA GeForce GTX 980M, 17.30", 4.5 kg
análise » Breve análisis del portátil Xotic PC Asus G752VY
MSI GS40-6QE16H11: NVIDIA GeForce GTX 970M, 14.00", 1.8 kg
análise » Breve análisis del MSI GS40 6QE Phantom
Lenovo Ideapad Y700 17ISK 80Q0: NVIDIA GeForce GTX 960M, 17.30", 3.6 kg
análise » Breve análisis del Lenovo Ideapad Y700 17ISK 80Q0
MSI GE62-6QD16H11: NVIDIA GeForce GTX 960M, 15.60", 2.4 kg
análise » Breve análisis del MSI GE62 6QD Apache Pro
Dell XPS 15-9550 i7: NVIDIA GeForce GTX 960M, 15.60", 2.1 kg
análise » Breve análisis del Dell XPS 15 9550 (i7, 512GB, UHD) InfinityEdge
Acer Aspire V5-591G-71K2: NVIDIA GeForce GTX 950M, 15.60", 2.4 kg
análise » Breve análisis del Acer Aspire V5-591G-71K2
Aorus X3 Plus v5: NVIDIA GeForce GTX 970M, 13.90", 1.8 kg
análise » Breve análisis del Aorus X3 Plus v5
HP Pavilion 15-ak003ng: NVIDIA GeForce GTX 950M, 15.60", 2.4 kg
análise » Breve análisis del HP Pavilion 15 (i7-6700HQ, GTX 950M)
Lenovo Ideapad Y700 15ISK 80NW: NVIDIA GeForce GTX 960M, 15.60", 2.9 kg
análise » Breve análisis del Lenovo Ideapad Y700 15ISK 80NW
HP Envy 17-n107ng: NVIDIA GeForce GTX 950M, 17.30", 2.8 kg
análise » Breve análisis del portatil HP Envy 17-n107ng
Acer Predator 15 G9-591-74ZV: NVIDIA GeForce GTX 980M, 15.60", 3.6 kg
análise » Análisis completo del Acer Predator 15
Dell Inspiron 15 7559: NVIDIA GeForce GTX 960M, 15.60", 2.7 kg
análise » Breve análisis del Dell Inspiron 15 7559
Acer Aspire V Nitro Black Edition VN7-792G-74Q4: NVIDIA GeForce GTX 960M, 17.30", 3.1 kg
análise » Breve análisis del Acer Aspire V Nitro Black Edition VN7-792G-74Q4
MSI GE72-6QF8H11: NVIDIA GeForce GTX 970M, 17.30", 2.9 kg
análise » Breve análisis del MSI GE72 6QF Apache Pro
MSI GS70-6QE16H21: NVIDIA GeForce GTX 970M, 17.30", 2.7 kg
análise » Breve análisis del MSI GS70 6QE Stealth Pro
MSI GE62 6QC-018NL: NVIDIA GeForce GTX 960M, 15.60", 2.4 kg
análise externo » MSI GE62 6QC-018NL
Alienware 17 R4 01: AMD Radeon RX 470 (Laptop), 17.30", 4.4 kg
análise externo » Alienware 17 R4 01
Acer Predator 15 G9-591-72L8: NVIDIA GeForce GTX 980M, 15.60", 3.4 kg
análise externo » Acer Predator 15 G9-591-72L8
HP Omen 17-w105nf: NVIDIA GeForce GTX 1060 Mobile, 17.30", 4.4 kg
análise externo » HP Omen 17-w105nf
Asus GL552VW-CN471T: NVIDIA GeForce GTX 960M, 15.60", 2.6 kg
análise externo » Asus GL552VW-CN471T
Asus G752VY-GC174T: NVIDIA GeForce GTX 980M, 17.30", 4.3 kg
análise externo » Asus G752VY-GC174T
MSI GP72 6QF-823NL: NVIDIA GeForce GTX 960M, 17.30", 2.6 kg
análise externo » MSI GP72 6QF-823NL
MSI GS63VR 6RF-023NL Stealth Pro: NVIDIA GeForce GTX 1060 Mobile, 15.60", 1.8 kg
análise externo » MSI GS63VR 6RF-023NL Stealth Pro
Lenovo Ideapad Y700-15ISK-80NV00XSSP: NVIDIA GeForce GTX 960M, 15.60", 2.6 kg
análise externo » Lenovo Ideapad Y700-15ISK-80NV00XSSP
Lenovo Ideapad Y700-15ISK-80NV00XVSP: NVIDIA GeForce GTX 960M, 15.60", 2.6 kg
análise externo » Lenovo Ideapad Y700-15ISK-80NV00XVSP
Medion Erazer X7849-MD60426: NVIDIA GeForce GTX 1070 Mobile, 17.30", 3.5 kg
análise externo » Medion Erazer X7849-MD60426
Asus Strix GL502VT-FW038T: NVIDIA GeForce GTX 970M, 15.60", 2 kg
análise externo » Asus Strix GL502VT-FW038T
Alienware 15 R3-A571610S2NDW-61: NVIDIA GeForce GTX 1070 Mobile, 15.60", 3.5 kg
análise externo » Alienware 15 R3-A571610S2NDW-61
Acer Aspire V17 Nitro VN7-792G-70GT: NVIDIA GeForce 945M, 17.30", 3 kg
análise externo » Acer Aspire V17 Nitro VN7-792G-70GT
Asus G752VM-GC005T: NVIDIA GeForce GTX 1060 Mobile, 17.30", 4.1 kg
análise externo » Asus G752VM-GC005T
Asus GL552VW-DM594T: NVIDIA GeForce GTX 960M, 15.60", 2.6 kg
análise externo » Asus GL552VW-DM594T
Asus Strix GL502VS-FY030T: NVIDIA GeForce GTX 1070 Mobile, 15.60", 2.6 kg
análise externo » Asus Strix GL502VS-FY030T
Asus FX502VM-DM105T: NVIDIA GeForce GTX 1060 Mobile, 15.60", 2.5 kg
análise externo » Asus FX502VM-DM105T
Asus GL702VM-90NB0DQ1-M00830: NVIDIA GeForce GTX 1060 Mobile, 17.30", 2.7 kg
análise externo » Asus GL702VM-90NB0DQ1-M00830
HP Omen 17-w000ns: NVIDIA GeForce GTX 960M, 17.30", 2.9 kg
análise externo » HP Omen 17-w000ns
MSI CX72 6QD-080XES: NVIDIA GeForce 940MX, 17.30", 2.8 kg
análise externo » MSI CX72 6QD-080XES
Asus G752VT-GC062T: NVIDIA GeForce GTX 970M, 17.30", 4.3 kg
análise externo » Asus G752VT-GC062T
Acer Predator 15 G9-593-74BY: NVIDIA GeForce GTX 1070 Mobile, 15.60", 3.7 kg
análise externo » Acer Predator 15 G9-593-74BY
MSI GP72 6QF-690NL Leopard Pro: NVIDIA GeForce GTX 960M, 17.30", 2.6 kg
análise externo » MSI GP72 6QF-690NL Leopard Pro
Asus G752VS-GC074T: NVIDIA GeForce GTX 1070 Mobile, 17.30", 4.5 kg
análise externo » Asus G752VS-GC074T
HP Omen 17-w107ng: NVIDIA GeForce GTX 1070 Mobile, 17.30", 3.4 kg
análise externo » HP Omen 17-w107ng
Asus Strix GL502VM-FY110T: NVIDIA GeForce GTX 1060 Mobile, 15.60", 2.2 kg
análise externo » Asus Strix GL502VM-FY110T
HP Pavilion 15-bc005ns: NVIDIA GeForce GTX 950M, 15.60", 2.2 kg
análise externo » HP Pavilion 15-bc005ns
MSI GE62VR 6RF-081NL Apache Pro: NVIDIA GeForce GTX 1060 Mobile, 15.60", 2.4 kg
análise externo » MSI GE62VR 6RF-081NL Apache Pro
HP Omen 17-w120no: NVIDIA GeForce GTX 1070 Mobile, 17.30", 3.3 kg
análise externo » HP Omen 17-w120no
Acer Aspire V17 Nitro BE VN7-792G-70G: NVIDIA GeForce 945M, 17.30", 3 kg
análise externo » Acer Aspire V17 Nitro BE VN7-792G-70G
HP Omen 17-w110ng: NVIDIA GeForce GTX 1070 Mobile, 17.30", 3.3 kg
análise externo » HP Omen 17-w110ng
HP Omen 17-w172nw: NVIDIA GeForce GTX 1070 Mobile, 17.30", 3.4 kg
análise externo » HP Omen 17-w172nw
Dell XPS 15 9550-3628: NVIDIA GeForce GTX 960M, 15.60", 2 kg
análise externo » Dell XPS 15 9550-3628
MSI GL72 6QF-407NL: NVIDIA GeForce GTX 960M, 17.30", 2.8 kg
análise externo » MSI GL72 6QF-407NL
HP Omen 17-w106na: NVIDIA GeForce GTX 1070 Mobile, 17.30", 2.8 kg
análise externo » HP Omen 17-w106na
MSI GT72VR 6RD-057NL Dominator: NVIDIA GeForce GTX 1060 Mobile, 17.30", 3.8 kg
análise externo » MSI GT72VR 6RD-057NL Dominator
Asus VivoBook Pro N552VX-FY186T: NVIDIA GeForce GTX 950M, 15.60", 2.5 kg
análise externo » Asus VivoBook Pro N552VX-FY186T
Lenovo IdeaPad Y700-15ISK 80NV00V1MH: NVIDIA GeForce GTX 960M, 15.60", 2.6 kg
análise externo » Lenovo IdeaPad Y700-15ISK 80NV00V1MH
HP Omen 17-w005ur: NVIDIA GeForce GTX 965M, 17.30", 2.8 kg
análise externo » HP Omen 17-w005ur
HP Omen 17-w100nc: NVIDIA GeForce GTX 1070 Mobile, 17.30", 3.4 kg
análise externo » HP Omen 17-w100nc
Asus G501VW-FI135T: NVIDIA GeForce GTX 960M, 15.60", 2 kg
análise externo » Asus G501VW-FI135T
Asus VivoBook Pro N552VW-FY217T: NVIDIA GeForce GTX 960M, 15.60", 2.5 kg
análise externo » Asus VivoBook Pro N552VW-FY217T
Asus GL553VW-FY079T: NVIDIA GeForce GTX 960M, 15.60", 2.5 kg
análise externo » Asus GL553VW-FY079T
Asus Strix GL702VT 90NB0CQ1-M0134: NVIDIA GeForce GTX 970M, 17.30", 2.7 kg
análise externo » Asus Strix GL702VT 90NB0CQ1-M0134
Asus GL552VW-DM141T: NVIDIA GeForce GTX 960M, 15.60", 2.6 kg
análise externo » Asus GL552VW-DM141T
HP Pavilion 15-bc004ns: NVIDIA GeForce GTX 960M, 15.60", 2.2 kg
análise externo » HP Pavilion 15-bc004ns
Lenovo Ideapad Y700-15ISK-80NV009BSP: NVIDIA GeForce GTX 960M, 15.60", 2.6 kg
análise externo » Lenovo Ideapad Y700-15ISK-80NV009BSP
HP ZBook 15 G3-Y6J87ES: NVIDIA Quadro M1000M, 15.60", 2.6 kg
análise externo » HP ZBook 15 G3-Y6J87ES
Alienware 13 R3 AW13R303: NVIDIA GeForce GTX 1060 Mobile, 13.00", 2.6 kg
análise externo » Alienware 13 R3 AW13R303
Acer Predator 17 G9-793-76Z1: NVIDIA GeForce GTX 1070 Mobile, 17.30", 4.4 kg
análise externo » Acer Predator 17 G9-793-76Z1
Lenovo IdeaPad 700-15ISK 80RU00HVTX: NVIDIA GeForce GTX 950M, 15.60", 2.3 kg
análise externo » Lenovo IdeaPad 700-15ISK 80RU00HVTX
Lenovo Y700-15ISK-80NV0143GE: NVIDIA GeForce GTX 960M, 15.60", 2.6 kg
análise externo » Lenovo Y700-15ISK-80NV0143GE
Asus FX502VM-DM113T: NVIDIA GeForce GTX 1060 Mobile, 15.60", 2.6 kg
análise externo » Asus FX502VM-DM113T
Asus FX502VM-DM114T: NVIDIA GeForce GTX 1060 Mobile, 15.60", 2.6 kg
análise externo » Asus FX502VM-DM114T
Cyberpower Vector 17: NVIDIA GeForce GTX 1060 Mobile, 17.30", 3.8 kg
análise externo » Cyberpower Vector 17
HP Pavilion 17-AB006NS: NVIDIA GeForce GTX 960M, 17.30", 2.9 kg
análise externo » HP Pavilion 17-AB006NS
HP Envy 17-n111ur: NVIDIA GeForce GTX 950M, 17.30", 2.8 kg
análise externo » HP Envy 17-n111ur
Acer Predator 17 G9-793-78RN: NVIDIA GeForce GTX 1070 Mobile, 17.30", 4.2 kg
análise externo » Acer Predator 17 G9-793-78RN
HP Omen 17-w102nl: NVIDIA GeForce GTX 1070 Mobile, 17.30", 3.4 kg
análise externo » HP Omen 17-w102nl
Dell Inspiron 7566-0435: NVIDIA GeForce GTX 960M, 15.60", 2.6 kg
análise externo » Dell Inspiron 7566-0435
MSI GT72VR-6RDAC16H21: NVIDIA GeForce GTX 1060 Mobile, 17.30", 3.8 kg
análise externo » MSI GT72VR-6RDAC16H21
MSI GP72 Leopard Pro 6QE-254XFR: NVIDIA GeForce GTX 950M, 17.30", 2.7 kg
análise externo » MSI GP72 Leopard Pro 6QE-254XFR
Acer Predator 17 G9-793-71A3: NVIDIA GeForce GTX 1070 Mobile, 17.30", 4.2 kg
análise externo » Acer Predator 17 G9-793-71A3
HP Omen 17-w010nd: NVIDIA GeForce GTX 965M, 17.30", 2.9 kg
análise externo » HP Omen 17-w010nd
HP Omen 17-w001ns: NVIDIA GeForce GTX 960M, 17.30", 2.9 kg
análise externo » HP Omen 17-w001ns
Asus Vivobook Pro N752VX-GC114T: NVIDIA GeForce GTX 950M, 17.30", 3.2 kg
análise externo » Asus Vivobook Pro N752VX-GC114T
Lenovo IdeaPad 700-15ISK 80RU00P6MH: NVIDIA GeForce GTX 950M, 15.60", 2.3 kg
análise externo » Lenovo IdeaPad 700-15ISK 80RU00P6MH
Lenovo IdeaPad 700-15ISK 80RU008RMH: NVIDIA GeForce GTX 950M, 15.60", 2.3 kg
análise externo » Lenovo IdeaPad 700-15ISK 80RU008RMH
Asus Strix GL502VS-FY038T: NVIDIA GeForce GTX 1070 Mobile, 15.60", 2.2 kg
análise externo » Asus Strix GL502VS-FY038T
Dell XPS 15 9550-3813: NVIDIA GeForce GTX 960M, 15.60", 1.8 kg
análise externo » Dell XPS 15 9550-3813
Asus Strix GL502VM-FY022T: NVIDIA GeForce GTX 1060 Mobile, 15.60", 2.2 kg
análise externo » Asus Strix GL502VM-FY022T
Acer Predator 17 G5-793-7108: NVIDIA GeForce GTX 1060 Mobile, 17.30", 4.2 kg
análise externo » Acer Predator 17 G5-793-7108
Asus ZenBook Pro UX501VW-FY075T: NVIDIA GeForce GTX 960M, 15.60", 2.1 kg
análise externo » Asus ZenBook Pro UX501VW-FY075T
MSI PX60 6QE-254NL: NVIDIA GeForce GTX 960M, 15.60", 2.1 kg
análise externo » MSI PX60 6QE-254NL
MSI GS73-6RF-006UK: NVIDIA GeForce GTX 1060 Mobile, 17.30", 2.4 kg
análise externo » MSI GS73-6RF-006UK
Acer Predator 15 G9-593-70G8: NVIDIA GeForce GTX 1060 Mobile, 15.60", 3.4 kg
análise externo » Acer Predator 15 G9-593-70G8
Asus Strix GL502VS-FY030D: NVIDIA GeForce GTX 1070 Mobile, 15.60", 2.6 kg
análise externo » Asus Strix GL502VS-FY030D
Asus Strix GL702VM-GC005T: NVIDIA GeForce GTX 1060 Mobile, 17.30", 2.7 kg
análise externo » Asus Strix GL702VM-GC005T
Asus G752VS-GC087T: NVIDIA GeForce GTX 1070 Mobile, 17.30", 4.4 kg
análise externo » Asus G752VS-GC087T
HP Pavilion 17-ab004ns: NVIDIA GeForce GTX 960M, 17.30", 2.9 kg
análise externo » HP Pavilion 17-ab004ns
Asus N552VX-FW320T: NVIDIA GeForce GTX 950M, 15.60", 2.5 kg
análise externo » Asus N552VX-FW320T
MSI GL72 6QF-410NL: NVIDIA GeForce GTX 960M, 17.30", 2.8 kg
análise externo » MSI GL72 6QF-410NL
HP Pavilion 15-bc012ng: NVIDIA GeForce GTX 960M, 15.60", 2.3 kg
análise externo » HP Pavilion 15-bc012ng
HP Omen 17-w109ng: NVIDIA GeForce GTX 1070 Mobile, 17.30", 3.3 kg
análise externo » HP Omen 17-w109ng
Medion Erazer X7849-MD60291: NVIDIA GeForce GTX 1070 Mobile, 17.30", 3.5 kg
análise externo » Medion Erazer X7849-MD60291
MSI GS43VR 6RE-053ES: NVIDIA GeForce GTX 1060 Mobile, 14.00", 1.8 kg
análise externo » MSI GS43VR 6RE-053ES
Gigabyte P35X v6-DE022T: NVIDIA GeForce GTX 1070 Mobile, 15.60", 2.4 kg
análise externo » Gigabyte P35X v6-DE022T
MSI GS63VR 6RF-029NL Stealth Pro: NVIDIA GeForce GTX 1060 Mobile, 15.60", 1.8 kg
análise externo » MSI GS63VR 6RF-029NL Stealth Pro
Asus GL752VW-T4064T: NVIDIA GeForce GTX 960M, 17.30", 2.8 kg
análise externo » Asus GL752VW-T4064T
HP Pavilion 15-bc008tx: NVIDIA GeForce GTX 960M, 15.60", 2.2 kg
análise externo » HP Pavilion 15-bc008tx
Asus G752VS-GC064T: NVIDIA GeForce GTX 1070 Mobile, 17.30", 4 kg
análise externo » Asus G752VS-GC064T
Asus N552VX-FW140T: NVIDIA GeForce GTX 950M, 0.00", 2.5 kg
análise externo » Asus N552VX-FW140T
Asus N552VX-FW027T: NVIDIA GeForce GTX 950M, 15.60", 2.5 kg
análise externo » Asus N552VX-FW027T
Asus GL552VW-DM748T: NVIDIA GeForce GTX 960M, 15.60", 2.6 kg
análise externo » Asus GL552VW-DM748T
HP Omen 17-w103nf: NVIDIA GeForce GTX 1070 Mobile, 17.30", 3.4 kg
análise externo » HP Omen 17-w103nf
Acer Predator 17 G9-793-78AU: NVIDIA GeForce GTX 1070 Mobile, 17.30", 4.2 kg
análise externo » Acer Predator 17 G9-793-78AU
Acer Predator 15 G9-592-7925: NVIDIA GeForce GTX 970M, 15.60", 3.5 kg
análise externo » Acer Predator 15 G9-592-7925
Gigabyte Aero 14-P64WV6: NVIDIA GeForce GTX 1060 Mobile, 14.00", 1.9 kg
análise externo » Gigabyte Aero 14-P64WV6
Asus GL702VM-GC017T: NVIDIA GeForce GTX 1060 Mobile, 17.30", 2.7 kg
análise externo » Asus GL702VM-GC017T
HP Omen 17-w010ng: NVIDIA GeForce GTX 965M, 17.30", 2.8 kg
análise externo » HP Omen 17-w010ng
HP Omen 17-w104ns: NVIDIA GeForce GTX 1070 Mobile, 17.30", 3.4 kg
análise externo » HP Omen 17-w104ns
Acer Aspire VN7-592G-77BU: NVIDIA GeForce GTX 960M, 15.60", 2.3 kg
análise externo » Acer Aspire VN7-592G-77BU
MSI GE62 6QD-006NL: NVIDIA GeForce GTX 960M, 15.60", 2.4 kg
análise externo » MSI GE62 6QD-006NL
HP ZBook Studio G3 T7W01EA: NVIDIA Quadro M1000M, 15.60", 2 kg
análise externo » HP ZBook Studio G3 T7W01EA
Asus G752VS-GC003T: NVIDIA GeForce GTX 1070 Mobile, 17.30", 4.3 kg
análise externo » Asus G752VS-GC003T
Razer Blade (2016) FHD: NVIDIA GeForce GTX 1060 Mobile, 14.00", 1.9 kg
análise externo » Razer Blade (2016) FHD
MSI GS43VR 6RE-007RU Phantom Pro: NVIDIA GeForce GTX 1060 Mobile, 14.00", 1.8 kg
análise externo » MSI GS43VR 6RE-007RU Phantom Pro
Asus Strix GL502VM-FY006T-BE: NVIDIA GeForce GTX 1060 Mobile, 15.60", 2.2 kg
análise externo » Asus Strix GL502VM-FY006T-BE
Gigabyte P57X v6: NVIDIA GeForce GTX 1070 Mobile, 17.30", 3.2 kg
análise externo » Gigabyte P57X v6
Dell Inspiron i7559-2512BLK: NVIDIA GeForce GTX 960M, 15.60", 2.6 kg
análise externo » Dell Inspiron i7559-2512BLK
HP Omen 15-ax001ns: NVIDIA GeForce GTX 960M, 15.60", 2.2 kg
análise externo » HP Omen 15-ax001ns
Alienware 15 R3-3831SLV: NVIDIA GeForce GTX 1060 Mobile, 15.60", 3.5 kg
análise externo » Alienware 15 R3-3831SLV
Alienware 15 R3-10881SLV: NVIDIA GeForce GTX 1070 Mobile, 15.60", 3.5 kg
análise externo » Alienware 15 R3-10881SLV
Asus N752VX-GC234T: NVIDIA GeForce GTX 950M, 17.30", 2.7 kg
análise externo » Asus N752VX-GC234T
Asus G752VM-GC034D: NVIDIA GeForce GTX 1060 Mobile, 17.30", 4 kg
análise externo » Asus G752VM-GC034D
Gigabyte Aero 14-K-ES-CF1: NVIDIA GeForce GTX 965M, 14.00", 1.9 kg
análise externo » Gigabyte Aero 14-K-ES-CF1
MSI GT62VR 6RD-070XES: NVIDIA GeForce GTX 1060 Mobile, 15.60", 3 kg
análise externo » MSI GT62VR 6RD-070XES
Asus N552VW-FI202T: NVIDIA GeForce GTX 960M, 15.60", 2.5 kg
análise externo » Asus N552VW-FI202T
Asus G701VI-BA034T: NVIDIA GeForce GTX 1080 Mobile, 17.30", 3.8 kg
análise externo » Asus G701VI-BA034T
Asus R753UX-T4115D: NVIDIA GeForce GTX 950M, 17.30", 2.7 kg
análise externo » Asus R753UX-T4115D
HP Omen 15-ax009ng: NVIDIA GeForce GTX 960M, 15.60", 2.3 kg
análise externo » HP Omen 15-ax009ng
HP Omen 15-ax025nd: NVIDIA GeForce GTX 965M, 11.60", 2.2 kg
análise externo » HP Omen 15-ax025nd
MSI GS63VR-6RF-048 Stealth Pro: NVIDIA GeForce GTX 1060 Mobile, 15.60", 1.8 kg
análise externo » MSI GS63VR-6RF-048 Stealth Pro
Alienware 13 R3 OLED: NVIDIA GeForce GTX 1060 Mobile, 13.30", 2.4 kg
análise externo » Alienware 13 R3 OLED
Lenovo IdeaPad Y700-15ISK-80NV010NMH: NVIDIA GeForce GTX 960M, 15.60", 2.6 kg
análise externo » Lenovo IdeaPad Y700-15ISK-80NV010NMH
Asus N552VX-FW120T: NVIDIA GeForce GTX 950M, 15.60", 2.5 kg
análise externo » Asus N552VX-FW120T
Asus K550VX-DM028D: NVIDIA GeForce GTX 950M, 15.60", 2.5 kg
análise externo » Asus K550VX-DM028D
Razer Blade (2016): NVIDIA GeForce GTX 1060 Mobile, 14.00", 2 kg
análise externo » Razer Blade (2016)
MSI GS63VR-6RFAC16H22: NVIDIA GeForce GTX 1060 Mobile, 15.60", 1.9 kg
análise externo » MSI GS63VR-6RFAC16H22
Asus ROG G752VS-BA185T: NVIDIA GeForce GTX 1070 Mobile, 17.30", 4.4 kg
análise externo » Asus ROG G752VS-BA185T
Acer Predator 17 G9-791-71MG: NVIDIA GeForce GTX 970M, 17.30", 3.9 kg
análise externo » Acer Predator 17 G9-791-71MG
MSI GT62VR-6REAC16H21: NVIDIA GeForce GTX 1070 Mobile, 15.60", 2.9 kg
análise externo » MSI GT62VR-6REAC16H21
Asus K550VX-DM108T: NVIDIA GeForce GTX 950M, 15.60", 2.4 kg
análise externo » Asus K550VX-DM108T
Acer Predator 17 G9-793-79NC: NVIDIA GeForce GTX 1070 Mobile, 17.30", 4.2 kg
análise externo » Acer Predator 17 G9-793-79NC
Origin PC EVO15-S: NVIDIA GeForce GTX 1060 Mobile, 15.60", 1.8 kg
análise externo » Origin PC EVO15-S
Asus G752VS-BA184T: Intel HD Graphics 530, 17.30", 4.4 kg
análise externo » Asus G752VS-BA184T
HP Pavilion Gaming 15-ak113nl: NVIDIA GeForce GTX 950M, 15.60", 2.5 kg
análise externo » HP Pavilion Gaming 15-ak113nl
Asus R510VX-DM010D: NVIDIA GeForce GTX 950M, 15.60", 2.4 kg
análise externo » Asus R510VX-DM010D
Asus R510VX-DM010T: NVIDIA GeForce GTX 950M, 15.60", 2.4 kg
análise externo » Asus R510VX-DM010T
Asus R510VX-DM006T: NVIDIA GeForce GTX 950M, 15.60", 2.4 kg
análise externo » Asus R510VX-DM006T
Asus R510VX-DM006D: NVIDIA GeForce GTX 950M, 15.60", 2.4 kg
análise externo » Asus R510VX-DM006D
Acer Aspire VN7-592G-77Q4: NVIDIA GeForce GTX 960M, 15.60", 3 kg
análise externo » Acer Aspire VN7-592G-77Q4
Asus K550VX-DM115T: NVIDIA GeForce GTX 950M, 15.60", 2.4 kg
análise externo » Asus K550VX-DM115T
Asus GL752VW-T4065D: NVIDIA GeForce GTX 960M, 17.30", 2.8 kg
análise externo » Asus GL752VW-T4065D
Asus GL752VW-T4016T: NVIDIA GeForce GTX 960M, 17.30", 4.3 kg
análise externo » Asus GL752VW-T4016T
MSI GP72 6QF Leopard Pro-614IT: NVIDIA GeForce GTX 960M, 17.30", 2.6 kg
análise externo » MSI GP72 6QF Leopard Pro-614IT
MSI GT62VR 6RD-056ES Dominator: NVIDIA GeForce GTX 1060 Mobile, 15.60", 3 kg
análise externo » MSI GT62VR 6RD-056ES Dominator
Apple MacBook Pro 15 2016 (2.6 GHz, 450): AMD Radeon Pro 450, 15.40", 1.8 kg
análise externo » Apple MacBook Pro 15 inch 2016
Asus N552VX-FY209D: NVIDIA GeForce GTX 950M, 15.60", 2.5 kg
análise externo » Asus N552VX-FY209D
HP Omen 15-ax002no: NVIDIA GeForce GTX 960M, 15.60", 2.2 kg
análise externo » HP Omen 15-ax002no
Asus UX501VW-F1020T: NVIDIA GeForce GTX 960M, 15.60", 2.1 kg
análise externo » Asus UX501VW-F1020T
Asus GL552VX-CN267T: NVIDIA GeForce GTX 950M, 15.60", 2.6 kg
análise externo » Asus GL552VX-CN267T
HP Omen 15-ax009no: NVIDIA GeForce GTX 965M, 15.60", 2.1 kg
análise externo » HP Omen 15-ax009no
Razer Blade Pro 2016: NVIDIA GeForce GTX 1080 Mobile, 17.30", 3.5 kg
análise externo » Razer Blade Pro 2016
HP Pavilion 15-bc001nu: NVIDIA GeForce GTX 960M, 15.60", 2.2 kg
análise externo » HP Pavilion 15-bc001nu
Lenovo Ideapad 700-17ISK-80RV003UCK: NVIDIA GeForce GTX 950M, 17.30", 2.6 kg
análise externo » Lenovo Ideapad 700-17ISK-80RV003UCK
MSI GS72-6QE4K16H21: NVIDIA GeForce GTX 970M, 17.30", 2.6 kg
análise externo » MSI GS72-6QE4K16H21
MSI GE62VR-6RFAC16H21: NVIDIA GeForce GTX 1060 Mobile, 15.60", 2.5 kg
análise externo » MSI GE62VR-6RFAC16H21
Asus Strix GL502VS-DB71: NVIDIA GeForce GTX 1070 Mobile, 15.60", 2.6 kg
análise externo » Asus Strix GL502VS-DB71
HP Omen 15-ax011na: NVIDIA GeForce GTX 965M, 15.60", 2.2 kg
análise externo » HP Omen 15-ax011na
MSI GT72VR-6REAC16H51: NVIDIA GeForce GTX 1070 Mobile, 17.30", 3.9 kg
análise externo » MSI GT72VR-6REAC16H51
Asus G752VS-BA191T: NVIDIA GeForce GTX 1070 Mobile, 17.30", 4.5 kg
análise externo » Asus G752VS-BA191T
Medion Erazer X7847-MD60342: NVIDIA GeForce GTX 1060 Mobile, 17.30", 3.8 kg
análise externo » Medion Erazer X7847-MD60342
HP Omen 17-w106ng: NVIDIA GeForce GTX 1070 Mobile, 17.30", 2.8 kg
análise externo » HP Omen 17-w106ng
HP Omen 17-w104ng: NVIDIA GeForce GTX 1070 Mobile, 17.30", 2.8 kg
análise externo » HP Omen 17-w104ng
Gigabyte P37X v6-DE426T: NVIDIA GeForce GTX 1070 Mobile, 17.30", 2.8 kg
análise externo » Gigabyte P37X v6-DE426T
MSI GT72VR Tobii-031: NVIDIA GeForce GTX 1070 Mobile, 17.30", 3.9 kg
análise externo » MSI GT72VR Tobii-031
Asus Strix GL502VM-FY035T: NVIDIA GeForce GTX 1060 Mobile, 15.60", 2.2 kg
análise externo » Asus Strix GL502VM-FY035T
MSI GE72-6QF8H11: NVIDIA GeForce GTX 970M, 17.30", 2.9 kg
análise externo » MSI GE72-6QF8H11
Asus Strix GL502VT-FY002T: NVIDIA GeForce GTX 970M, 15.60", 2.2 kg
análise externo » Asus Strix GL502VT-FY002T
MSI GE62VR-6RF16H11 Apache Pro: NVIDIA GeForce GTX 1060 Mobile, 15.60", 2.5 kg
análise externo » MSI GE62VR-6RF16H11 Apache Pro
HP Pavilion 17-ab006ur: NVIDIA GeForce GTX 960M, 17.30", 3 kg
análise externo » HP Pavilion 17-ab006ur
Asus G752VS-GC123T: NVIDIA GeForce GTX 1070 Mobile, 17.30", 4.5 kg
análise externo » Asus G752VS-GC123T
Acer Predator 17 G9-793-77LG: NVIDIA GeForce GTX 1070 Mobile, 17.30", 4.2 kg
análise externo » Acer Predator 17 G9-793-77LG
MSI GS73VR-6RF16H22 Stealth Pro: NVIDIA GeForce GTX 1060 Mobile, 17.30", 2.4 kg
análise externo » MSI GS73VR-6RF16H22 Stealth Pro
Acer Predator 17 G9-793-70F3: NVIDIA GeForce GTX 1070 Mobile, 17.30", 4.2 kg
análise externo » Acer Predator 17 G9-793-70F3
Alienware 15 R2 A15-0238: NVIDIA GeForce GTX 970M, 15.60", 3.2 kg
análise externo » Alienware 15 R2 A15-0238
HP Omen 17-w101ng: NVIDIA GeForce GTX 1060 Mobile, 17.30", 2.8 kg
análise externo » HP Omen 17-w101ng
MSI GS43VR 6RE-008NE: NVIDIA GeForce GTX 1060 Mobile, 14.00", 1.6 kg
análise externo » MSI GS43VR 6RE-008NE
MSI GS43VR 6RE-009NL Phantom Pro: NVIDIA GeForce GTX 1060 Mobile, 14.00", 1.6 kg
análise externo » MSI GS43VR 6RE-009NL Phantom Pro
Asus GL552VW-CN470T: NVIDIA GeForce GTX 960M, 15.60", 2.6 kg
análise externo » Asus GL552VW-CN470T
Asus G752VY-T7003T: NVIDIA GeForce GTX 980M, 17.30", 4.3 kg
análise externo » Asus G752VY-T7003T
MSI GT62VR-6RE-022UK: NVIDIA GeForce GTX 1070 Mobile, 15.60", 2.9 kg
análise externo » MSI GT62VR-6RE-022UK
Asus N552VX-FY200T: NVIDIA GeForce GTX 950M, 15.60", 2.5 kg
análise externo » Asus N552VX-FY200T
Nexoc G518II: NVIDIA GeForce GTX 1060 Mobile, 15.60", 2.5 kg
análise externo » Nexoc G518II
MSI GL72-6QFi781FD: NVIDIA GeForce GTX 960M, 17.30", 2.8 kg
análise externo » MSI GL72-6QFi781FD
MSI GE62-6QF8H11 Apache Pro: NVIDIA GeForce GTX 970M, 15.60", 2.4 kg
análise externo » MSI GE62-6QF8H11 Apache Pro
Lenovo IdeaPad Y900-17ISK-80Q1000BGE: NVIDIA GeForce GTX 980M, 17.30", 4.4 kg
análise externo » Lenovo IdeaPad Y900-17ISK-80Q1000BGE
Lenovo IdeaPad 700-17SK-80RV0031GE: NVIDIA GeForce 940M, 17.30", 2.7 kg
análise externo » Lenovo IdeaPad 700-17SK-80RV0031GE
Lenovo Ideapad 700-17ISK-80RV001MGE: NVIDIA GeForce 940M, 17.30", 2.7 kg
análise externo » Lenovo Ideapad 700-17ISK-80RV001MGE
Lenovo Ideapad Y700-17ISK-80Q0002GGE: NVIDIA GeForce GTX 960M, 17.30", 3.6 kg
análise externo » Lenovo Ideapad Y700-17ISK-80Q0002GGE
Lenovo Ideapad Y700-15ISK-80NV006QGE: NVIDIA GeForce GTX 960M, 15.60", 2.9 kg
análise externo » Lenovo Ideapad Y700-15ISK-80NV006QGE
Asus VivoBook Pro N552VW-FY094T: NVIDIA GeForce GTX 960M, 15.60", 2.5 kg
análise externo » Asus VivoBook Pro N552VW-FY094T
HP Omen 17-w009ng: NVIDIA GeForce GTX 965M, 17.30", 2.8 kg
análise externo » HP Omen 17-w009ng
HP Omen 15-ax006ng: NVIDIA GeForce GTX 960M, 15.60", 2.2 kg
análise externo » HP Omen 15-ax006ng
HP Envy 17-r182nz: NVIDIA GeForce GTX 950M, 17.30", 2.8 kg
análise externo » HP Envy 17-r182nz
HP Envy 17-n107ng: NVIDIA GeForce GTX 950M, 17.30", 2.8 kg
análise externo » HP Envy 17-n107ng
HP Envy 17-r110ng: NVIDIA GeForce GTX 950M, 17.30", 2.8 kg
análise externo » HP Envy 17-r110ng
Asus N552VX-FY299T: NVIDIA GeForce GTX 950M, 15.60", 2.5 kg
análise externo » Asus N552VX-FY299T
Asus GL752VW-T4287T: NVIDIA GeForce GTX 960M, 17.30", 3 kg
análise externo » Asus GL752VW-T4287T
Asus GL752VW-T4113T: NVIDIA GeForce GTX 960M, 17.30", 3 kg
análise externo » Asus GL752VW-T4113T
Asus G752VL-GC085T: NVIDIA GeForce GTX 965M, 17.30", 4.5 kg
análise externo » Asus G752VL-GC085T
Asus G752VY-GC087T: NVIDIA GeForce GTX 980M, 17.30", 4.5 kg
análise externo » Asus G752VY-GC087T
Asus Strix GL502VS-FY042T: NVIDIA GeForce GTX 1070 Mobile, 15.60", 2.6 kg
análise externo » Asus Strix GL502VS-FY042T
Asus Strix GL502VT-FY010T: NVIDIA GeForce GTX 970M, 15.60", 2.5 kg
análise externo » Asus Strix GL502VT-FY010T
Asus UX501VW-FY145T: NVIDIA GeForce GTX 960M, 15.60", 2.3 kg
análise externo » Asus UX501VW-FY145T
Asus UX501VW-FY144T: NVIDIA GeForce GTX 960M, 15.60", 2.3 kg
análise externo » Asus UX501VW-FY144T
Acer Predator 17 G9-792-707R: NVIDIA GeForce GTX 970M, 17.30", 4.2 kg
análise externo » Acer Predator 17 G9-792-707R
Acer Predator 17 G9-792-74TT: NVIDIA GeForce GTX 980M, 17.30", 4.1 kg
análise externo » Acer Predator 17 G9-792-74TT
Acer Predator 17 G9-792-736Q: NVIDIA GeForce GTX 980M, 17.30", 4.1 kg
análise externo » Acer Predator 17 G9-792-736Q
Acer Predator 15 G9-593-765Q: NVIDIA GeForce GTX 1070 Mobile, 15.60", 3.7 kg
análise externo » Acer Predator 15 G9-593-765Q
Acer Predator 15 G9-591-713C: NVIDIA GeForce GTX 980M, 15.60", 3.6 kg
análise externo » Acer Predator 15 G9-591-713C
Acer Aspire V17 Nitro BE VN7-792G-70JV: NVIDIA GeForce GTX 960M, 17.30", 3.1 kg
análise externo » Acer Aspire V17 Nitro BE VN7-792G-70JV
Acer Aspire V17 Nitro BE VN7-792G-726L: NVIDIA GeForce GTX 960M, 17.30", 3.1 kg
análise externo » Acer Aspire V17 Nitro BE VN7-792G-726L
Acer Aspire V15 Nitro BE VN7-592G-79U3: NVIDIA GeForce GTX 960M, 15.60", 2.3 kg
análise externo » Acer Aspire V15 Nitro BE VN7-592G-79U3
Acer Aspire V15 Nitro BE VN7-592G-74FP: NVIDIA GeForce GTX 960M, 15.60", 2.3 kg
análise externo » Acer Aspire V15 Nitro BE VN7-592G-74FP
MSI GT72VR-6RE16H51: NVIDIA GeForce GTX 1070 Mobile, 17.30", 3.9 kg
análise externo » MSI GT72VR-6RE16H51
MSI GL72 6QF: NVIDIA GeForce GTX 960M, 17.30", 2.8 kg
análise externo » MSI GL72 6QF
Medion Erazer X7841: NVIDIA GeForce GTX 970M, 17.30", 3.5 kg
análise externo » Medion Erazer X7841
MSI GT72VR 6RE Dominator Pro Tobii: NVIDIA GeForce GTX 1070 Mobile, 17.30", 3.8 kg
análise externo » MSI GT72VR 6RE Dominator Pro Tobii
MSI GT62VR-6RDAC16H11: NVIDIA GeForce GTX 1060 Mobile, 15.60", 2.9 kg
análise externo » MSI GT62VR-6RDAC16H11
Asus Strix GL502VT-FY186: NVIDIA GeForce GTX 970M, 15.60", 2.2 kg
análise externo » Asus Strix GL502VT-FY186
Acer Predator 15 G9-592-77ZU: NVIDIA GeForce GTX 980M, 15.60", 3.5 kg
análise externo » Acer Predator 15 G9-592-77ZU
Alienware 17 R3 (A17-9935): NVIDIA GeForce GTX 980M, 17.30", 3.7 kg
análise externo » Alienware 17 R3 (A17-9935)
Acer Predator 15 G9-592-70GD: NVIDIA GeForce GTX 970M, 15.60", 3.5 kg
análise externo » Acer Predator 15 G9-592-70GD
HP Omen 15-ax003ng: NVIDIA GeForce GTX 965M, 15.60", 2.2 kg
análise externo » HP Omen 15-ax003ng
Acer Predator 17 G9-791-718D: NVIDIA GeForce GTX 980M, 17.30", 4.1 kg
análise externo » Acer Predator 17 G9-791-718D
MSI GS73VR 6RF: NVIDIA GeForce GTX 1060 Mobile, 17.30", 2.4 kg
análise externo » MSI GS73VR 6RF
MSI GE72VR-6RF: NVIDIA GeForce GTX 1060 Mobile, 0.00"
análise externo » MSI GE72VR-6RF
Asus Strix GL502VS-FY032T: NVIDIA GeForce GTX 1070 Mobile, 15.60", 2.6 kg
análise externo » Asus Strix GL502VS-FY032T
Schenker XMG P507: NVIDIA GeForce GTX 1060 Mobile, 15.60", 2.8 kg
análise externo » Schenker XMG P507
Gigabyte P57x V6-CF2: NVIDIA GeForce GTX 1070 Mobile, 17.30", 3 kg
análise externo » Gigabyte P57x V6-CF2
Asus Strix GL502VM-FY039T: NVIDIA GeForce GTX 1060 Mobile, 15.60", 2.5 kg
análise externo » Asus Strix GL502VM-FY039T
MSI GT72VR-6RD-16H21: NVIDIA GeForce GTX 1060 Mobile, 17.30", 3.8 kg
análise externo » MSI GT72VR-6RD-16H21
Acer Predator 17 G9-793-77LN: NVIDIA GeForce GTX 1070 Mobile, 17.30", 4.2 kg
análise externo » Acer Predator 17 G9-793-77LN
Gigabyte P35X v6-PC4K4D: NVIDIA GeForce GTX 1070 Mobile, 15.60", 2.3 kg
análise externo » Gigabyte P35X v6-PC4K4D
Asus GL752VW-T4168T: NVIDIA GeForce GTX 960M, 17.30", 3 kg
análise externo » Asus GL752VW-T4168T
MSI GT72VR 6RE-015US: NVIDIA GeForce GTX 1070 Mobile, 17.30", 3.9 kg
análise externo » MSI GT72VR 6RE-015US
Gigabyte P55W v6: NVIDIA GeForce GTX 1060 Mobile, 15.60", 2.7 kg
análise externo » Gigabyte P55W v6
MSI GS43VR 6RE-006US: NVIDIA GeForce GTX 1060 Mobile, 14.00", 1.9 kg
análise externo » MSI GS43VR 6RE-006US
MSI GS63VR-6RF16H22 Stealth Pro: NVIDIA GeForce GTX 1060 Mobile, 15.60", 1.9 kg
análise externo » MSI GS63VR-6RF16H22 Stealth Pro
HP Pavilion Gaming 15-ak008na: NVIDIA GeForce GTX 950M, 15.60", 2.3 kg
análise externo » HP Pavilion Gaming 15-ak008na
Gigabyte P35W v5: NVIDIA GeForce GTX 970M, 15.60", 2.4 kg
análise externo » Gigabyte P35W v5
Asus ROG Strix GL702VT-GC023T: NVIDIA GeForce GTX 970M, 17.30", 2.7 kg
análise externo » Asus ROG Strix GL702VT-GC023T
HP Omen 15-ax005ng: NVIDIA GeForce GTX 960M, 15.60", 2.2 kg
análise externo » HP Omen 15-ax005ng
MSI GT62VR-6RE16H21: NVIDIA GeForce GTX 1070 Mobile, 15.60", 2.9 kg
análise externo » MSI GT62VR-6RE16H21
Eurocom Sky M5: NVIDIA GeForce GTX 970M, 15.60", 2.5 kg
análise externo » Eurocom Sky M5
HP Omen 15-ax002nc: NVIDIA GeForce GTX 965M, 15.60", 2.3 kg
análise externo » HP Omen 15-ax002nc
Dell XPS 15 9550-1370: NVIDIA GeForce GTX 960M, 15.60", 2 kg
análise externo » Dell XPS 15 9550-1370
Gigabyte Aero 14-W-CF2: NVIDIA GeForce GTX 970M, 14.00", 1.9 kg
análise externo » Gigabyte Aero 14-W-CF2
Dell XPS 15 9550 i7 FHD: NVIDIA GeForce GTX 960M, 15.60", 2 kg
análise externo » Dell XPS 15 9550 i7 FHD
Asus Strix GL502VY-DS71: NVIDIA GeForce GTX 980M, 15.60", 2.6 kg
análise externo » Asus Strix GL502VY-DS71
HP Omen 17-w012ng: NVIDIA GeForce GTX 965M, 17.30", 2.8 kg
análise externo » HP Omen 17-w012ng
Asus Strix GL502VT-DS74: NVIDIA GeForce GTX 970M, 15.60", 2.5 kg
análise externo » Asus Strix GL502VT-DS74
HP Omen 15-ax008ng: NVIDIA GeForce GTX 965M, 15.60", 2.2 kg
análise externo » HP Omen 15-ax008ng
Lenovo IdeaPad 700-15ISK-80RU0009GE: NVIDIA GeForce GTX 950M, 15.60", 2.3 kg
análise externo » Lenovo IdeaPad 700-15ISK-80RU0009GE
Asus N552VW-FY083T: NVIDIA GeForce GTX 960M, 15.60", 2.5 kg
análise externo » Asus N552VW-FY083T
Lenovo IdeaPad Y700-17ISK 80Q0002EGE: NVIDIA GeForce GTX 960M, 17.30", 3.5 kg
análise externo » Lenovo IdeaPad Y700-17ISK 80Q0002EGE
HP Envy 17-r100ur: NVIDIA GeForce GTX 950M, 17.30", 2.8 kg
análise externo » HP Envy 17-r100ur
Asus Zenbook Pro UX501VW-FJ098T: NVIDIA GeForce GTX 960M, 15.60", 2.1 kg
análise externo » Asus Zenbook Pro UX501VW-FJ098T
Asus Zenbook Pro UX501VW-FJ044T: NVIDIA GeForce GTX 960M, 15.60", 2.3 kg
análise externo » Asus Zenbook Pro UX501VW-FJ044T
Acer Aspire V 17 Nitro VN7-792G-78VL: NVIDIA GeForce GTX 960M, 15.60", 2.4 kg
análise externo » Acer Aspire V 17 Nitro VN7-792G-78VL
Schenker XMG P406: NVIDIA GeForce GTX 970M, 14.00", 2.2 kg
análise externo » Schenker XMG P406
Gigabyte P57W: NVIDIA GeForce GTX 970M, 17.30", 3.2 kg
análise externo » Gigabyte P57W
Aorus X5S v5 Camo: NVIDIA GeForce GTX 980M, 15.60", 2.5 kg
análise externo » Aorus X5S v5 Camo
Acer Predator 17 G9-791-75BE: NVIDIA GeForce GTX 970M, 17.30", 4 kg
análise externo » Acer Predator 17 G9-791-75BE
Acer Predator 15 G9-591-79KE: NVIDIA GeForce GTX 970M, 15.60", 3.4 kg
análise externo » Acer Predator 15 G9-591-79KE
Lenovo ThinkPad T460p-20FXS05500: NVIDIA GeForce 940MX, 14.00", 1.9 kg
análise externo » Lenovo ThinkPad T460p-20FXS05500
Asus G501VW-BSI7N25: NVIDIA GeForce GTX 960M, 15.60", 2.1 kg
análise externo » Asus G501VW-BSI7N25
Asus G552VW-CN287D: NVIDIA GeForce GTX 960M, 15.60", 2.6 kg
análise externo » Asus G552VW-CN287D
Asus GL752VW-T4255D: NVIDIA GeForce GTX 960M, 17.30", 3 kg
análise externo » Asus GL752VW-T4255D
Asus G752VY-GC304T: NVIDIA GeForce GTX 980M, 17.30", 4.4 kg
análise externo » Asus G752VY-GC304T
MSI GT72-6QD81FD: NVIDIA GeForce GTX 970M, 17.30", 3.9 kg
análise externo » MSI GT72-6QD81FD
Acer Aspire VN7-592 N15W7: NVIDIA GeForce GTX 960M, 15.60", 2.2 kg
análise externo » Acer Aspire VN7-592 N15W7
Acer Predator 17 G9-791-730K: NVIDIA GeForce GTX 980M, 17.30", 4.1 kg
análise externo » Acer Predator 17 G9-791-730K
Asus G551VW: NVIDIA GeForce GTX 960M, 15.60", 2.7 kg
análise externo » Asus G551VW
Lenovo Ideapad Y700-15-80NW0010US: NVIDIA GeForce GTX 960M, 15.60", 2.9 kg
análise externo » Lenovo Ideapad Y700-15-80NW0010US
Sager NP7258: NVIDIA GeForce GTX 965M, 15.60", 2.5 kg
análise externo » Sager NP7258
Lenovo Ideapad Y700 14-80NU0004US: AMD Radeon R9 M375, 14.00", 2.2 kg
análise externo » Lenovo Ideapad Y700 14-80NU0004US
MSI GL72 6QD-039XPL: NVIDIA GeForce GTX 950M, 17.30", 2.7 kg
análise externo » MSI GL72 6QD-039XPL
MSI GT72S-6QE-084FR : NVIDIA GeForce GTX 980M, 17.30", 3.9 kg
análise externo » MSI GT72S-6QE-084FR
Acer Predator 17 G9-791-75PV: NVIDIA GeForce GTX 970M, 17.30", 4.1 kg
análise externo » Acer Predator 17 G9-791-75PV
Asus G752VY-RH71: NVIDIA GeForce GTX 980M, 17.30", 4.5 kg
análise externo » Asus G752VY-RH71
Acer Predator 15 G9-591-70F6: NVIDIA GeForce GTX 980M, 15.60", 5.5 kg
análise externo » Acer Predator 15 G9-591-70F6
Acer Predator 15 G9-591-79K: NVIDIA GeForce GTX 970M, 15.60", 3.4 kg
análise externo » Acer Predator 15 G9-591-79K
Dell Inspiron 15 7559-1363: NVIDIA GeForce GTX 960M, 15.60", 3.2 kg
análise externo » Dell Inspiron 15 7559-1363
Acer Aspire V Nitro Black Edition VN7-792G-74Q4: NVIDIA GeForce GTX 960M, 17.30", 3.1 kg
análise externo » Acer Aspire V Nitro Black Edition VN7-792G-74Q4
Aorus X5S v5: NVIDIA GeForce GTX 980M, 15.60", 2.5 kg
análise externo » Aorus X5S v5
Schenker XMG P506: NVIDIA GeForce GTX 970M, 15.60", 2.7 kg
análise externo » Schenker XMG P506
Toshiba Satellite P50-C-179: NVIDIA GeForce GTX 950M, 15.60", 2.1 kg
análise externo » Toshiba Satellite P50-C-179
Acer Predator 15 G9-591-74KN: NVIDIA GeForce GTX 980M, 15.60", 3.6 kg
análise externo » Acer Predator 15 G9-591-74KN
Razer Blade 14 inch 2016: NVIDIA GeForce GTX 970M, 14.00", 1.9 kg
análise externo » Razer Blade 14 inch 2016
Asus N752VX-GC131T: NVIDIA GeForce GTX 950M, 17.30", 3.2 kg
análise externo » Asus N752VX-GC131T
Acer Aspire V15 Nitro BE VN7-592G-79DV: NVIDIA GeForce GTX 960M, 15.60", 2.3 kg
análise externo » Acer Aspire V15 Nitro BE VN7-592G-79DV
Asus GL752VW-DH71: NVIDIA GeForce GTX 960M, 17.30", 2.8 kg
análise externo » Asus GL752VW-DH71
MSI GE62-6QF-004FR: NVIDIA GeForce GTX 970M, 15.60", 2.4 kg
análise externo » MSI GE62-6QF-004FR
MSI GS40-6QE-014FR Phantom: NVIDIA GeForce GTX 970M, 14.00", 1.8 kg
análise externo » MSI GS40-6QE-014FR Phantom
Gigabyte P55W v5: NVIDIA GeForce GTX 970M, 15.60", 2.6 kg
análise externo » Gigabyte P55W v5
HP Pavilion 15 ak-003ur: NVIDIA GeForce GTX 950M, 15.60", 2.3 kg
análise externo » HP Pavilion 15 ak-003ur
Gigabyte P57W-CF1: NVIDIA GeForce GTX 970M, 17.30", 2.9 kg
análise externo » Gigabyte P57W-CF1
Acer Predator 17 G9-791-73EX: NVIDIA GeForce GTX 980M, 17.30", 4 kg
análise externo » Acer Predator 17 G9-791-73EX
Digital Storm Equinox 15 inch: NVIDIA GeForce GTX 970M, 15.60", 1.9 kg
análise externo » Digital Storm Equinox 15 inch
Aorus X3 Plus v5: NVIDIA GeForce GTX 970M, 13.90", 1.8 kg
análise externo » Aorus X3 Plus v5
Asus ZenBook Pro UX501VW-DS71T: NVIDIA GeForce GTX 960M, 15.60", 2.3 kg
análise externo » Asus ZenBook Pro UX501VW-DS71T
Gigabyte P37X v5: NVIDIA GeForce GTX 980M, 17.30", 2.9 kg
análise externo » Gigabyte P37X v5
Acer Aspire V5-591G-78CE: NVIDIA GeForce GTX 950M, 15.60", 2.4 kg
análise externo » Acer Aspire V5-591G-78CE
Acer Predator 15 G9-591-71L2: NVIDIA GeForce GTX 980M, 15.60", 3.6 kg
análise externo » Acer Predator 15 G9-591-71L2
Alienware 17 R3-A17-9911: NVIDIA GeForce GTX 970M, 17.30", 3.8 kg
análise externo » Alienware 17 R3-A17-9911
MSI GS40-6QE-026CZ Phantom: NVIDIA GeForce GTX 970M, 14.00", 1.9 kg
análise externo » MSI GS40-6QE-026CZ Phantom
MSI GS40 6QE-019RU Phantom: NVIDIA GeForce GTX 970M, 14.00", 1.6 kg
análise externo » MSI GS40 6QE-019RU Phantom
MSI WT72-6QI16H21FD: NVIDIA Quadro M1000M, 17.30", 3.8 kg
análise externo » MSI WT72-6QI16H21FD
HP Pavilion 15-ak001nu: NVIDIA GeForce GTX 950M, 15.60", 2.3 kg
análise externo » HP Pavilion 15-ak001nu
HP Pavilion 15-ak003nf: NVIDIA GeForce GTX 950M, 15.60", 2.4 kg
análise externo » HP Pavilion 15-ak003nf
MSI GS60-6QE-019CZ: NVIDIA GeForce GTX 970M, 15.60", 2.1 kg
análise externo » MSI GS60-6QE-019CZ
MSI GS40-6QE-020RU Phantom: NVIDIA GeForce GTX 970M, 14.00", 1.6 kg
análise externo » MSI GS40-6QE-020RU Phantom
MSI PE70-6QD-064XRU: NVIDIA GeForce GTX 950M, 17.30", 2.6 kg
análise externo » MSI PE70-6QD-064XRU
Asus G752VY-GC263T: NVIDIA GeForce GTX 980M, 17.30", 4.3 kg
análise externo » Asus G752VY-GC263T
Alienware 17 R3: NVIDIA GeForce GTX 970M, 17.30", 3.8 kg
análise externo » Alienware 17 R3
Samsung 940Z5L-X01US: NVIDIA GeForce GTX 950M, 15.60", 2 kg
análise externo » Samsung 940Z5L-X01US
Asus N551VW-FY196T: NVIDIA GeForce GTX 960M, 15.60", 2.7 kg
análise externo » Asus N551VW-FY196T
Asus G752VT-GC037T: NVIDIA GeForce GTX 970M, 17.30", 4 kg
análise externo » Asus G752VT-GC037T
Acer Aspire V5-591G-71K2: NVIDIA GeForce GTX 950M, 15.60", 2.4 kg
análise externo » Acer Aspire V5-591G-71K2
Gigabyte P35X v5: NVIDIA GeForce GTX 980M, 15.60", 2.6 kg
análise externo » Gigabyte P35X v5
MSI GE72-6QD161: NVIDIA GeForce GTX 960M, 17.30", 2.9 kg
análise externo » MSI GE72-6QD161
Lenovo Ideapad Y700 17ISK 80Q0: NVIDIA GeForce GTX 960M, 17.30", 3.6 kg
análise externo » Lenovo Ideapad Y700 17ISK 80Q0
Asus G752VT: NVIDIA GeForce GTX 970M, 17.30", 4.1 kg
análise externo » Asus G752VT
Lenovo Ideapad Y700 15ISK 80NW: NVIDIA GeForce GTX 960M, 15.60", 2.9 kg
análise externo » Lenovo Ideapad Y700 15ISK 80NW
MSI GE72 6QF-009RU Apache Pro: NVIDIA GeForce GTX 970M, 17.30", 2.9 kg
análise externo » MSI GE72 6QF-009RU Apache Pro
Gigabyte P34W v5: NVIDIA GeForce GTX 970M, 14.00", 1.8 kg
análise externo » Gigabyte P34W v5
MSI GP62-6QE8H11: NVIDIA GeForce GTX 950M, 15.60", 2.3 kg
análise externo » MSI GP62-6QE8H11
Acer Predator 15 G9-591-74ZV: NVIDIA GeForce GTX 980M, 15.60", 3.6 kg
análise externo » Acer Predator 15 G9-591-74ZV
Alienware 15 R2 (Skylake): NVIDIA GeForce GTX 980M, 15.60", 3.1 kg
análise externo » Alienware 15 R2 (Skylake)
MSI PE60-6QEi781: NVIDIA GeForce GTX 960M, 15.60", 2.3 kg
análise externo » MSI PE60-6QEi781
Dell XPS 15-9550 i7: NVIDIA GeForce GTX 960M, 15.60", 2.1 kg
análise externo » Dell XPS 15-9550, Core i7
Acer Aspire VN7-592G-71ZL: NVIDIA GeForce GTX 960M, 15.60", 2.3 kg
análise externo » Acer Aspire VN7-592G-71ZL
Medion Erazer X7843-MD9957: NVIDIA GeForce GTX 980M, 17.30", 3.5 kg
análise externo » Medion Erazer X7843-MD9957
MSI GS60 6QE-063UK: NVIDIA GeForce GTX 970M, 15.60", 2 kg
análise externo » MSI GS60 6QE-063UK
Acer Predator 17 G9-791-72VU: NVIDIA GeForce GTX 980M, 17.30", 4 kg
análise externo » Acer Predator 17 G9-791-72VU
MSI GS40-6QE16H11: NVIDIA GeForce GTX 970M, 14.00", 1.8 kg
análise externo » MSI GS40-6QE16H11
Asus G752VT-DH72: NVIDIA GeForce GTX 970M, 17.30", 4 kg
análise externo » Asus G752VT-DH72
HP Pavilion Gaming 15-ak001ng: NVIDIA GeForce GTX 950M, 15.60", 2.3 kg
análise externo » HP Pavilion Gaming 15-ak001ng
Acer Aspire V Nitro VN7-792G-785Q: NVIDIA GeForce 945M, 17.30", 3.1 kg
análise externo » Acer Aspire V Nitro VN7-792G-785Q
Dell Inspiron 15 7559: NVIDIA GeForce GTX 960M, 15.60", 2.7 kg
análise externo » Dell Inspiron 15 7559
MSI GS60 6QE-002US: NVIDIA GeForce GTX 970M, 15.60", 2.1 kg
análise externo » MSI GS60 6QE-002US
Asus GL552VW-DH71: NVIDIA GeForce GTX 960M, 15.60", 2.6 kg
análise externo » Asus GL552VW-DH71
MSI GE62-6QF16H21: NVIDIA GeForce GTX 970M, 15.60", 2.4 kg
análise externo » MSI GE62-6QF16H21
MSI GS70 6QE-017AU: NVIDIA GeForce GTX 970M, 17.30", 2.6 kg
análise externo » MSI GS70 6QE-017AU
Schenker XMG P706, Intel Core i7-6700HQ: NVIDIA GeForce GTX 980M, 17.30", 3.2 kg
análise externo » Schenker XMG P706, Intel Core i7-6700HQ
MSI GE72-6QF16H21: NVIDIA GeForce GTX 970M, 17.30", 2.9 kg
análise externo » MSI GE72-6QF16H21
MSI GS60 6QE-017RUGhost Pro: NVIDIA GeForce GTX 970M, 15.60", 2.1 kg
análise externo » MSI GS60 6QE-017RUGhost Pro
Acer Aspire V Nitro Black Edition VN7-792G-79KE: NVIDIA GeForce GTX 960M, 17.30", 3 kg
análise externo » Acer Aspire V Nitro Black Edition VN7-792G-79KE