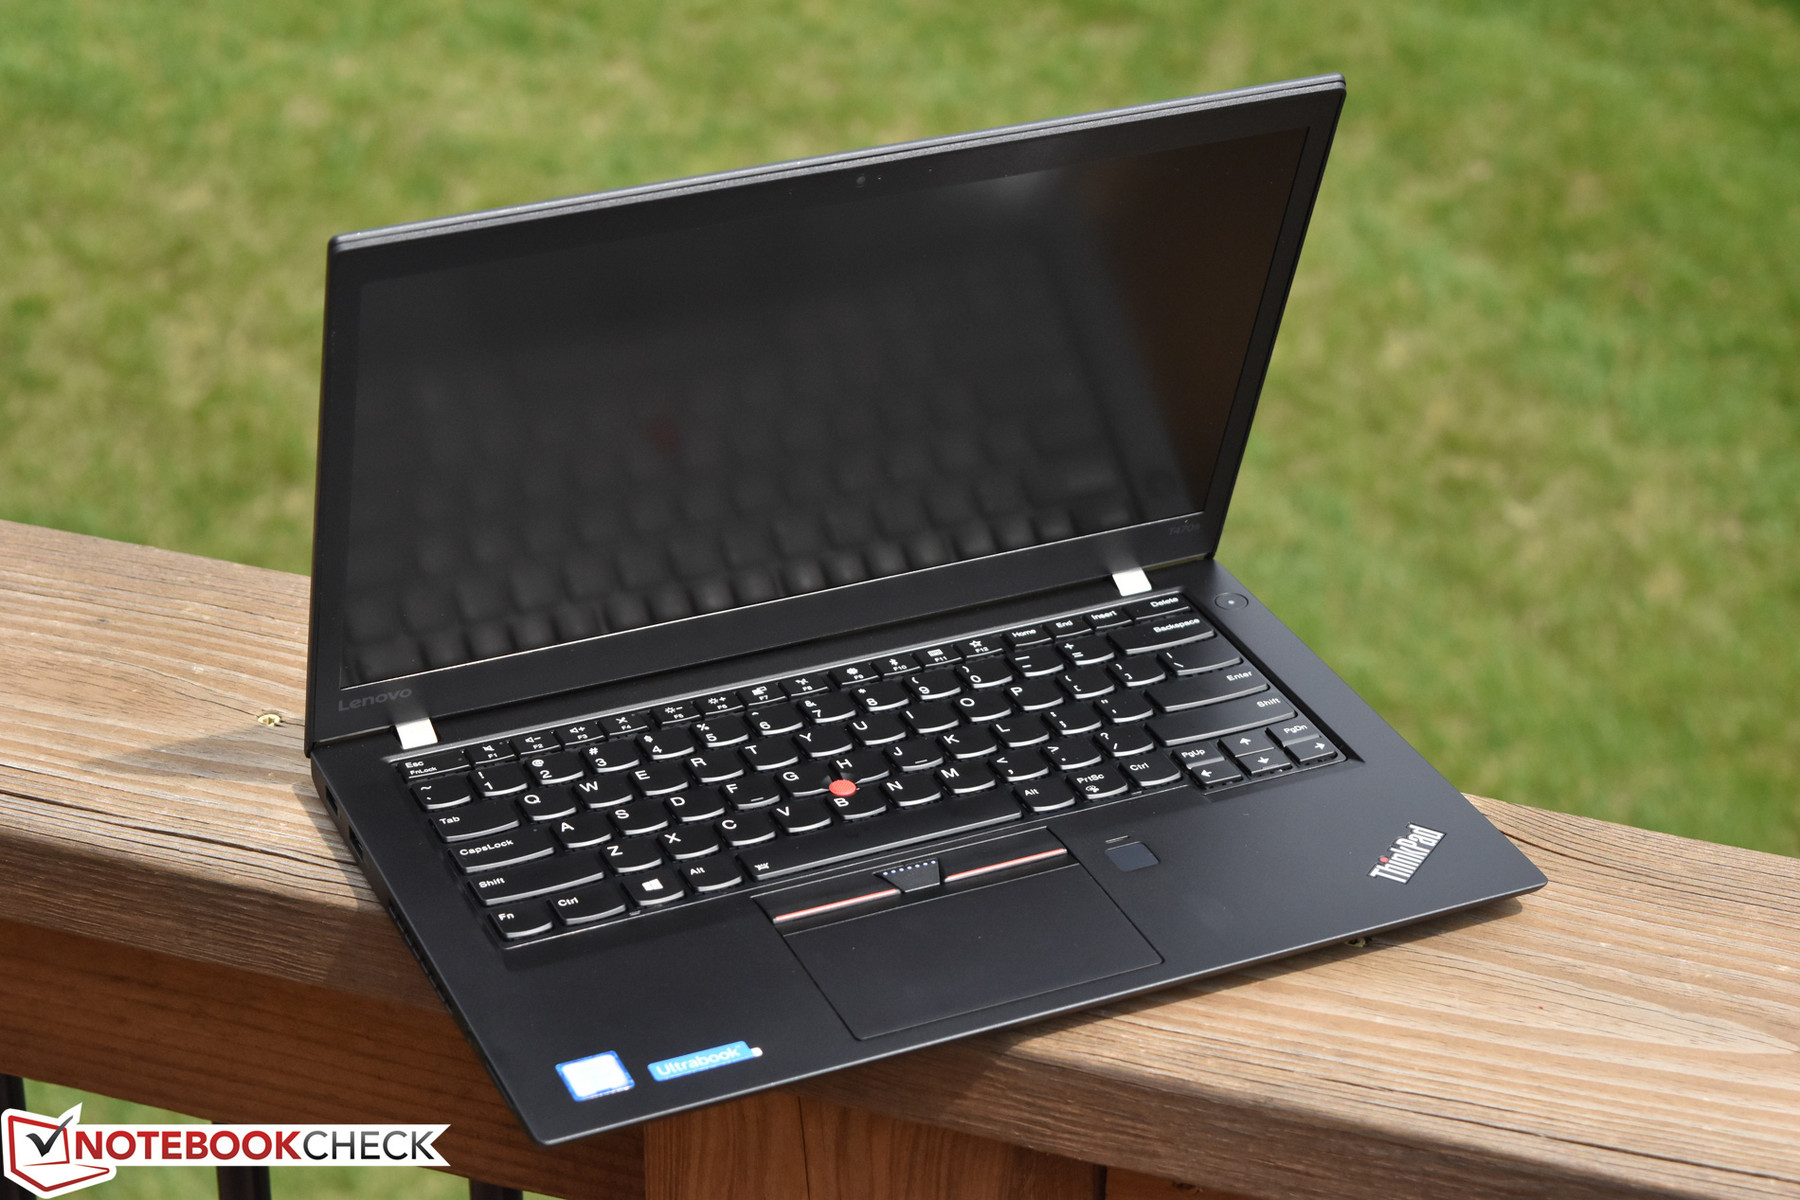
Breve análisis del portátil Lenovo ThinkPad T470s (7300U, FHD)
| SD Card Reader | |
| average JPG Copy Test (av. of 3 runs) | |
| Lenovo ThinkPad T470s-20HGS00V00 | |
| Lenovo ThinkPad T470-20HD002HGE | |
| Dell Latitude 7480 | |
| Lenovo ThinkPad T470s-20HF0012US | |
| Lenovo ThinkPad X1 Carbon 2017-20HQS03P00 | |
| maximum AS SSD Seq Read Test (1GB) | |
| Dell Latitude 7480 | |
| Lenovo ThinkPad T470s-20HF0012US | |
| Lenovo ThinkPad T470s-20HGS00V00 | |
| Lenovo ThinkPad T470-20HD002HGE | |
| Lenovo ThinkPad X1 Carbon 2017-20HQS03P00 | |
| |||||||||||||||||||||||||
iluminación: 88 %
Brillo con batería: 271.6 cd/m²
Contraste: 1132:1 (Negro: 0.24 cd/m²)
ΔE ColorChecker Calman: 6.1 | ∀{0.5-29.43 Ø4.71}
ΔE Greyscale Calman: 3.4 | ∀{0.09-98 Ø4.96}
60% sRGB (Argyll 1.6.3 3D)
38% AdobeRGB 1998 (Argyll 1.6.3 3D)
41.72% AdobeRGB 1998 (Argyll 3D)
60.3% sRGB (Argyll 3D)
40.35% Display P3 (Argyll 3D)
Gamma: 2.12
CCT: 6077 K
| Lenovo ThinkPad T470s-20HF0012US LEN40A9 (R140NWF5 R1), IPS, 14", 1920x1080 | Lenovo ThinkPad T470s-20HGS00V00 B140QAN01.5, IPS, 14", 2560x1440 | Dell Latitude 7480 LG Philips LGD0557, IPS, 14", 1920x1080 | Lenovo ThinkPad T470-20HD002HGE N140HCA-EAB, IPS, 14", 1920x1080 | Lenovo ThinkPad X1 Carbon 2017-20HQS03P00 B140HAN03_1, IPS, 14", 1920x1080 | |
|---|---|---|---|---|---|
| Display | 65% | 58% | 3% | 48% | |
| Display P3 Coverage (%) | 40.35 | 69 71% | 65.4 62% | 41.6 3% | 61.4 52% |
| sRGB Coverage (%) | 60.3 | 95.1 58% | 92.3 53% | 61.9 3% | 85.9 42% |
| AdobeRGB 1998 Coverage (%) | 41.72 | 69.6 67% | 65.8 58% | 43.06 3% | 62.4 50% |
| Response Times | -7% | -4% | -10% | -6% | |
| Response Time Grey 50% / Grey 80% * (ms) | 40.8 ? | 46.4 ? -14% | 40.8 ? -0% | 41.6 ? -2% | 41.6 ? -2% |
| Response Time Black / White * (ms) | 28.8 ? | 28.8 ? -0% | 31.2 ? -8% | 34 ? -18% | 31.6 ? -10% |
| PWM Frequency (Hz) | 219.3 ? | ||||
| Screen | 7% | 29% | -3% | 12% | |
| Brightness middle (cd/m²) | 271.6 | 327 20% | 344 27% | 306 13% | 311 15% |
| Brightness (cd/m²) | 264 | 311 18% | 321 22% | 287 9% | 288 9% |
| Brightness Distribution (%) | 88 | 88 0% | 85 -3% | 88 0% | 85 -3% |
| Black Level * (cd/m²) | 0.24 | 0.25 -4% | 0.32 -33% | 0.3 -25% | 0.24 -0% |
| Contrast (:1) | 1132 | 1308 16% | 1075 -5% | 1020 -10% | 1296 14% |
| Colorchecker dE 2000 * | 6.1 | 6.1 -0% | 2.6 57% | 6.2 -2% | 5.5 10% |
| Colorchecker dE 2000 max. * | 28.6 | 12.2 57% | 7.8 73% | 13.6 52% | 9 69% |
| Greyscale dE 2000 * | 3.4 | 8.8 -159% | 2.6 24% | 5.8 -71% | 6.2 -82% |
| Gamma | 2.12 104% | 2.18 101% | 2.28 96% | 2.04 108% | 2.02 109% |
| CCT | 6077 107% | 6172 105% | 7050 92% | 6277 104% | 5950 109% |
| Color Space (Percent of AdobeRGB 1998) (%) | 38 | 61.56 62% | 65.82 73% | 39.62 4% | 55.96 47% |
| Color Space (Percent of sRGB) (%) | 60 | 94.88 58% | 92.27 54% | 61.44 2% | 85.77 43% |
| Media total (Programa/Opciones) | 22% /
17% | 28% /
30% | -3% /
-3% | 18% /
17% |
* ... más pequeño es mejor
Tiempos de respuesta del display
| ↔ Tiempo de respuesta de Negro a Blanco | ||
|---|---|---|
| 28.8 ms ... subida ↗ y bajada ↘ combinada | ↗ 14.8 ms subida | 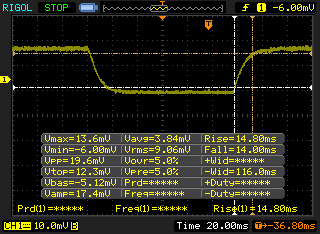 |
| ↘ 14 ms bajada | ||
| La pantalla mostró tiempos de respuesta relativamente lentos en nuestros tests pero podría ser demasiado lenta para los jugones. En comparación, todos los dispositivos de prueba van de ##min### (mínimo) a 240 (máximo) ms. » 76 % de todos los dispositivos son mejores. Eso quiere decir que el tiempo de respuesta es peor que la media (19.8 ms) de todos los dispositivos testados. | ||
| ↔ Tiempo de respuesta 50% Gris a 80% Gris | ||
| 40.8 ms ... subida ↗ y bajada ↘ combinada | ↗ 22.8 ms subida | 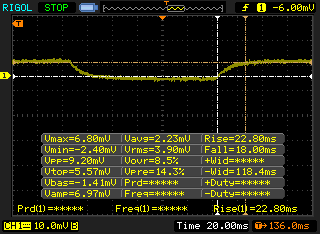 |
| ↘ 18 ms bajada | ||
| La pantalla mostró tiempos de respuesta lentos en nuestros tests y podría ser demasiado lenta para los jugones. En comparación, todos los dispositivos de prueba van de ##min### (mínimo) a 636 (máximo) ms. » 64 % de todos los dispositivos son mejores. Eso quiere decir que el tiempo de respuesta es peor que la media (30.9 ms) de todos los dispositivos testados. | ||
Parpadeo de Pantalla / PWM (Pulse-Width Modulation)
| Parpadeo de Pantalla / PWM detectado | 219.3 Hz | ≤ 99 % de brillo | 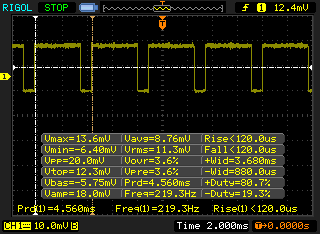 |
La retroiluminación del display parpadea a 219.3 Hz (seguramente usa PWM - Pulse-Width Modulation) a un brillo del 99 % e inferior. Sobre este nivel de brillo no debería darse parpadeo / PWM. La frecuencia de 219.3 Hz es relativamente baja, por lo que la gente sensible debería ver parpadeos y padecer fatiga visual por la pantalla (usado al brillo indicado a continuación). Comparación: 52 % de todos los dispositivos testados no usaron PWM para atenuar el display. Si se usó, medimos una media de 7744 (mínimo: 5 - máxmo: 343500) Hz. | |||
| wPrime 2.10 - 1024m | |
| Dell Latitude 7480 | |
| Lenovo ThinkPad T470s-20HF0012US | |
| Lenovo ThinkPad T470s-20HGS00V00 | |
* ... más pequeño es mejor
| PCMark 8 Home Score Accelerated v2 | 3987 puntos | |
| PCMark 8 Creative Score Accelerated v2 | 4910 puntos | |
| PCMark 8 Work Score Accelerated v2 | 4999 puntos | |
ayuda | ||
| Lenovo ThinkPad T470s-20HF0012US Samsung PM961 MZVLW256HEHP | Lenovo ThinkPad T470s-20HGS00V00 Samsung SSD PM961 1TB M.2 PCIe 3.0 x4 NVMe (MZVLW1T0) | Dell Latitude 7480 Intel SSDSCKKF256H6 | Lenovo ThinkPad T470-20HD002HGE Samsung PM961 NVMe MZVLW512HMJP | Lenovo ThinkPad X1 Carbon 2017-20HQS03P00 Samsung PM961 NVMe MZVLW512HMJP | |
|---|---|---|---|---|---|
| CrystalDiskMark 3.0 | 12% | -56% | -10% | 10% | |
| Read Seq (MB/s) | 1399 | 1760 26% | 486.5 -65% | 1155 -17% | 1827 31% |
| Write Seq (MB/s) | 1213 | 1666 37% | 418.6 -65% | 1076 -11% | 1383 14% |
| Read 512 (MB/s) | 831 | 832 0% | 354.3 -57% | 811 -2% | 814 -2% |
| Write 512 (MB/s) | 856 | 1064 24% | 306.8 -64% | 862 1% | 1098 28% |
| Read 4k (MB/s) | 60.7 | 53.2 -12% | 29.25 -52% | 55.5 -9% | 61 0% |
| Write 4k (MB/s) | 159.2 | 167.4 5% | 90.5 -43% | 134.6 -15% | 172.2 8% |
| Read 4k QD32 (MB/s) | 580 | 630 9% | 280.2 -52% | 496.2 -14% | 601 4% |
| Write 4k QD32 (MB/s) | 499.4 | 533 7% | 252.8 -49% | 425.4 -15% | 495.6 -1% |

| 3DMark | |
| 1280x720 Cloud Gate Standard Graphics | |
| Lenovo ThinkPad T470s-20HGS00V00 | |
| Lenovo ThinkPad X1 Carbon 2017-20HQS03P00 | |
| Lenovo ThinkPad T470s-20HF0012US | |
| Dell Latitude 7480 | |
| Lenovo ThinkPad T470-20HD002HGE | |
| 1920x1080 Fire Strike Graphics | |
| Lenovo ThinkPad T470s-20HGS00V00 | |
| Lenovo ThinkPad X1 Carbon 2017-20HQS03P00 | |
| Lenovo ThinkPad T470s-20HF0012US | |
| Dell Latitude 7480 | |
| Lenovo ThinkPad T470-20HD002HGE | |
| 1920x1080 Ice Storm Extreme Graphics | |
| Dell Latitude 7480 | |
| 3DMark 06 Standard Score | 9671 puntos | |
| 3DMark 11 Performance | 1741 puntos | |
| 3DMark Ice Storm Standard Score | 67756 puntos | |
| 3DMark Cloud Gate Standard Score | 6945 puntos | |
| 3DMark Fire Strike Score | 971 puntos | |
ayuda | ||
| bajo | medio | alto | ultra | |
|---|---|---|---|---|
| BioShock Infinite (2013) | 54.6 | 31.7 | 26 | 8.2 |
Ruido
| Ocioso |
| 27.8 / 27.8 / 27.8 dB(A) |
| Carga |
| 34.8 / 42 dB(A) |
 | ||
30 dB silencioso 40 dB(A) audible 50 dB(A) ruidosamente alto |
||
min: | ||
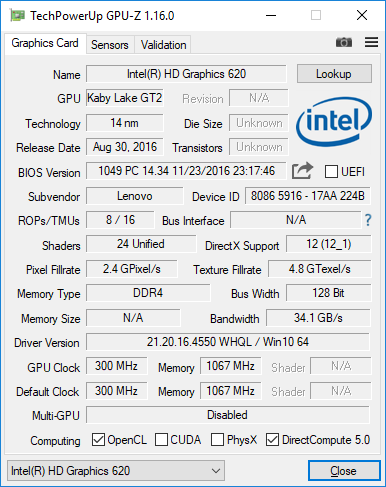
| Lenovo ThinkPad T470s-20HF0012US HD Graphics 620, i5-7300U, Samsung PM961 MZVLW256HEHP | Lenovo ThinkPad T470s-20HGS00V00 HD Graphics 620, i7-7600U, Samsung SSD PM961 1TB M.2 PCIe 3.0 x4 NVMe (MZVLW1T0) | Dell Latitude 7480 HD Graphics 620, i7-7600U, Intel SSDSCKKF256H6 | Lenovo ThinkPad T470-20HD002HGE HD Graphics 620, i5-7200U, Samsung PM961 NVMe MZVLW512HMJP | Lenovo ThinkPad X1 Carbon 2017-20HQS03P00 HD Graphics 620, i7-7500U, Samsung PM961 NVMe MZVLW512HMJP | |
|---|---|---|---|---|---|
| Noise | -4% | 6% | 3% | -4% | |
| apagado / medio ambiente * (dB) | 27.8 | 28.9 -4% | 28 -1% | 29.3 -5% | |
| Idle Minimum * (dB) | 27.8 | 28.9 -4% | 28.6 -3% | 28 -1% | 29.3 -5% |
| Idle Average * (dB) | 27.8 | 28.9 -4% | 28.6 -3% | 28 -1% | 29.3 -5% |
| Idle Maximum * (dB) | 27.8 | 30.1 -8% | 28.6 -3% | 29.4 -6% | 32.2 -16% |
| Load Average * (dB) | 34.8 | 39.2 -13% | 30.2 13% | 31.4 10% | 34.3 1% |
| Witcher 3 ultra * (dB) | 42 | ||||
| Load Maximum * (dB) | 42 | 39.2 7% | 31.2 26% | 34.6 18% | 39.3 6% |
* ... más pequeño es mejor
(-) La temperatura máxima en la parte superior es de 45.4 °C / 114 F, frente a la media de 34.3 °C / 94 F, que oscila entre 21.2 y 62.5 °C para la clase Office.
(-) El fondo se calienta hasta un máximo de 51.2 °C / 124 F, frente a la media de 36.8 °C / 98 F
(+) En reposo, la temperatura media de la parte superior es de 24 °C / 75# F, frente a la media del dispositivo de 29.5 °C / 85 F.
(+) Los reposamanos y el panel táctil alcanzan como máximo la temperatura de la piel (33.8 °C / 92.8 F) y, por tanto, no están calientes.
(-) La temperatura media de la zona del reposamanos de dispositivos similares fue de 27.6 °C / 81.7 F (-6.2 °C / -11.1 F).
Lenovo ThinkPad T470s-20HF0012US análisis de audio
(±) | la sonoridad del altavoz es media pero buena (72 dB)
Graves 100 - 315 Hz
(-) | casi sin bajos - de media 15.3% inferior a la mediana
(±) | la linealidad de los graves es media (14.1% delta a frecuencia anterior)
Medios 400 - 2000 Hz
(+) | medios equilibrados - a sólo 3.2% de la mediana
(±) | la linealidad de los medios es media (11% delta respecto a la frecuencia anterior)
Altos 2 - 16 kHz
(+) | máximos equilibrados - a sólo 4.4% de la mediana
(±) | la linealidad de los máximos es media (12.5% delta a frecuencia anterior)
Total 100 - 16.000 Hz
(±) | la linealidad del sonido global es media (24.8% de diferencia con la mediana)
En comparación con la misma clase
» 74% de todos los dispositivos probados de esta clase eran mejores, 7% similares, 19% peores
» El mejor tuvo un delta de 7%, la media fue 21%, el peor fue ###max##%
En comparación con todos los dispositivos probados
» 76% de todos los dispositivos probados eran mejores, 5% similares, 19% peores
» El mejor tuvo un delta de 4%, la media fue 23%, el peor fue ###max##%
Dell Latitude 7480 análisis de audio
(±) | la sonoridad del altavoz es media pero buena (75 dB)
Graves 100 - 315 Hz
(±) | lubina reducida - en promedio 11.9% inferior a la mediana
(±) | la linealidad de los graves es media (10.6% delta a frecuencia anterior)
Medios 400 - 2000 Hz
(+) | medios equilibrados - a sólo 3.8% de la mediana
(±) | la linealidad de los medios es media (7.8% delta respecto a la frecuencia anterior)
Altos 2 - 16 kHz
(±) | máximos más altos - de media 6.6% más altos que la mediana
(+) | los máximos son lineales (6.3% delta a la frecuencia anterior)
Total 100 - 16.000 Hz
(±) | la linealidad del sonido global es media (23.2% de diferencia con la mediana)
En comparación con la misma clase
» 65% de todos los dispositivos probados de esta clase eran mejores, 8% similares, 27% peores
» El mejor tuvo un delta de 7%, la media fue 21%, el peor fue ###max##%
En comparación con todos los dispositivos probados
» 70% de todos los dispositivos probados eran mejores, 5% similares, 25% peores
» El mejor tuvo un delta de 4%, la media fue 23%, el peor fue ###max##%
| Off / Standby | |
| Ocioso | |
| Carga |
|
Clave:
min: | |
| Lenovo ThinkPad T470s-20HF0012US i5-7300U, HD Graphics 620, Samsung PM961 MZVLW256HEHP, IPS, 1920x1080, 14" | Lenovo ThinkPad T470s-20HGS00V00 i7-7600U, HD Graphics 620, Samsung SSD PM961 1TB M.2 PCIe 3.0 x4 NVMe (MZVLW1T0), IPS, 2560x1440, 14" | Dell Latitude 7480 i7-7600U, HD Graphics 620, Intel SSDSCKKF256H6, IPS, 1920x1080, 14" | Lenovo ThinkPad T470-20HD002HGE i5-7200U, HD Graphics 620, Samsung PM961 NVMe MZVLW512HMJP, IPS, 1920x1080, 14" | Lenovo ThinkPad X1 Carbon 2017-20HQS03P00 i7-7500U, HD Graphics 620, Samsung PM961 NVMe MZVLW512HMJP, IPS, 1920x1080, 14" | |
|---|---|---|---|---|---|
| Power Consumption | -15% | 16% | 19% | -3% | |
| Idle Minimum * (Watt) | 4.8 | 4.64 3% | 4.32 10% | 3.21 33% | 3.84 20% |
| Idle Average * (Watt) | 6.6 | 8.93 -35% | 6.27 5% | 6.15 7% | 6.3 5% |
| Idle Maximum * (Watt) | 7 | 9.12 -30% | 6.35 9% | 6.82 3% | 8.6 -23% |
| Load Average * (Watt) | 39.2 | 42.2 -8% | 29.82 24% | 28.5 27% | 41.9 -7% |
| Load Maximum * (Watt) | 44.8 | 47.3 -6% | 30.64 32% | 34.5 23% | 48.7 -9% |
* ... más pequeño es mejor
| Lenovo ThinkPad T470s-20HF0012US i5-7300U, HD Graphics 620, 51 Wh | Lenovo ThinkPad T470s-20HGS00V00 i7-7600U, HD Graphics 620, 51 Wh | Dell Latitude 7480 i7-7600U, HD Graphics 620, 60 Wh | Lenovo ThinkPad T470-20HD002HGE i5-7200U, HD Graphics 620, 48 Wh | Lenovo ThinkPad X1 Carbon 2017-20HQS03P00 i7-7500U, HD Graphics 620, 57 Wh | |
|---|---|---|---|---|---|
| Duración de Batería | -28% | 35% | -24% | -6% | |
| Reader / Idle (h) | 17.7 | 13.1 -26% | 27.7 56% | 20.9 18% | |
| WiFi v1.3 (h) | 8.1 | 7 -14% | 12 48% | 7.3 -10% | 8.3 2% |
| Load (h) | 2.9 | 1.6 -45% | 2.9 0% | 1.8 -38% | 1.8 -38% |
Pro
Contra
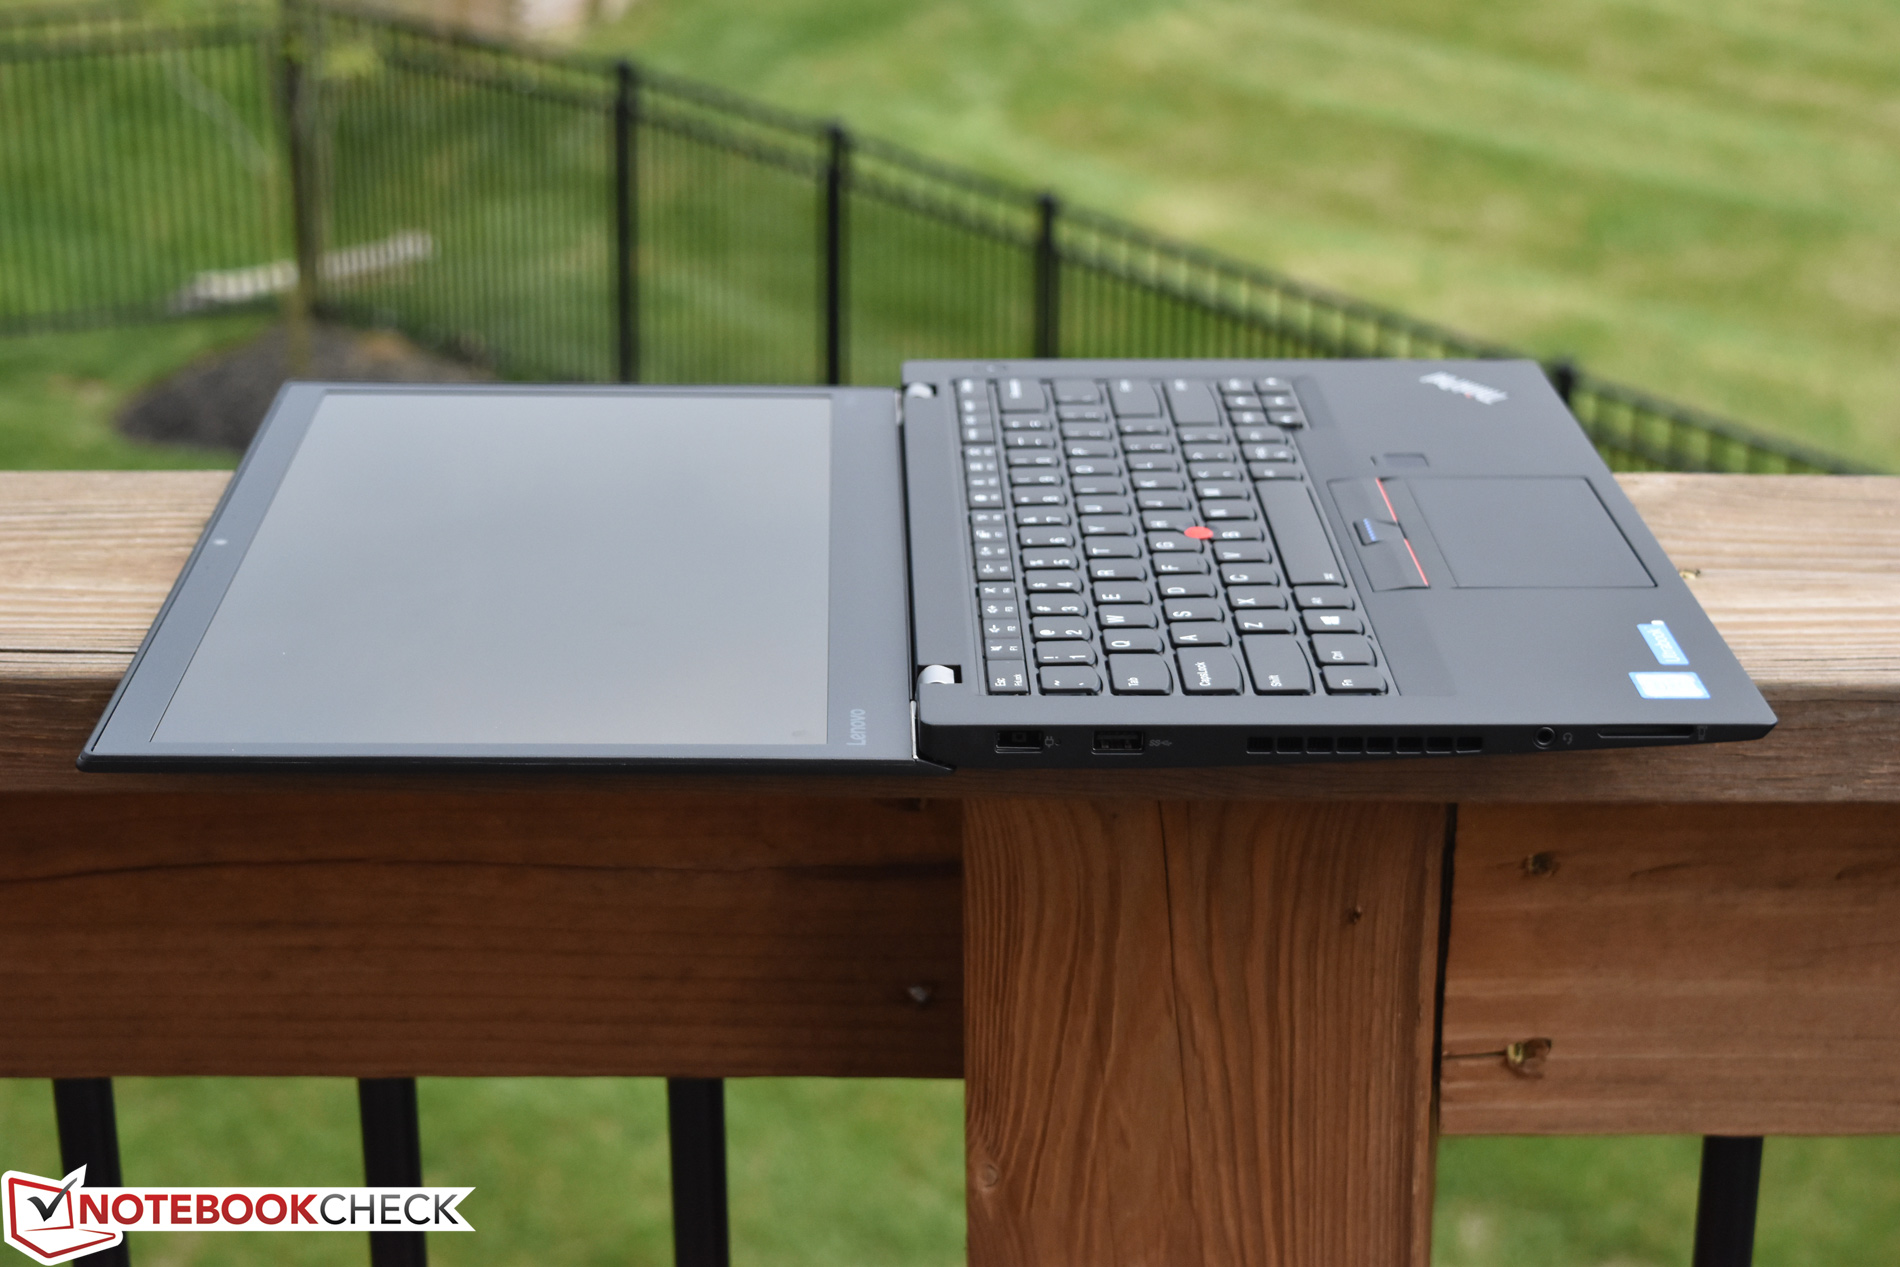
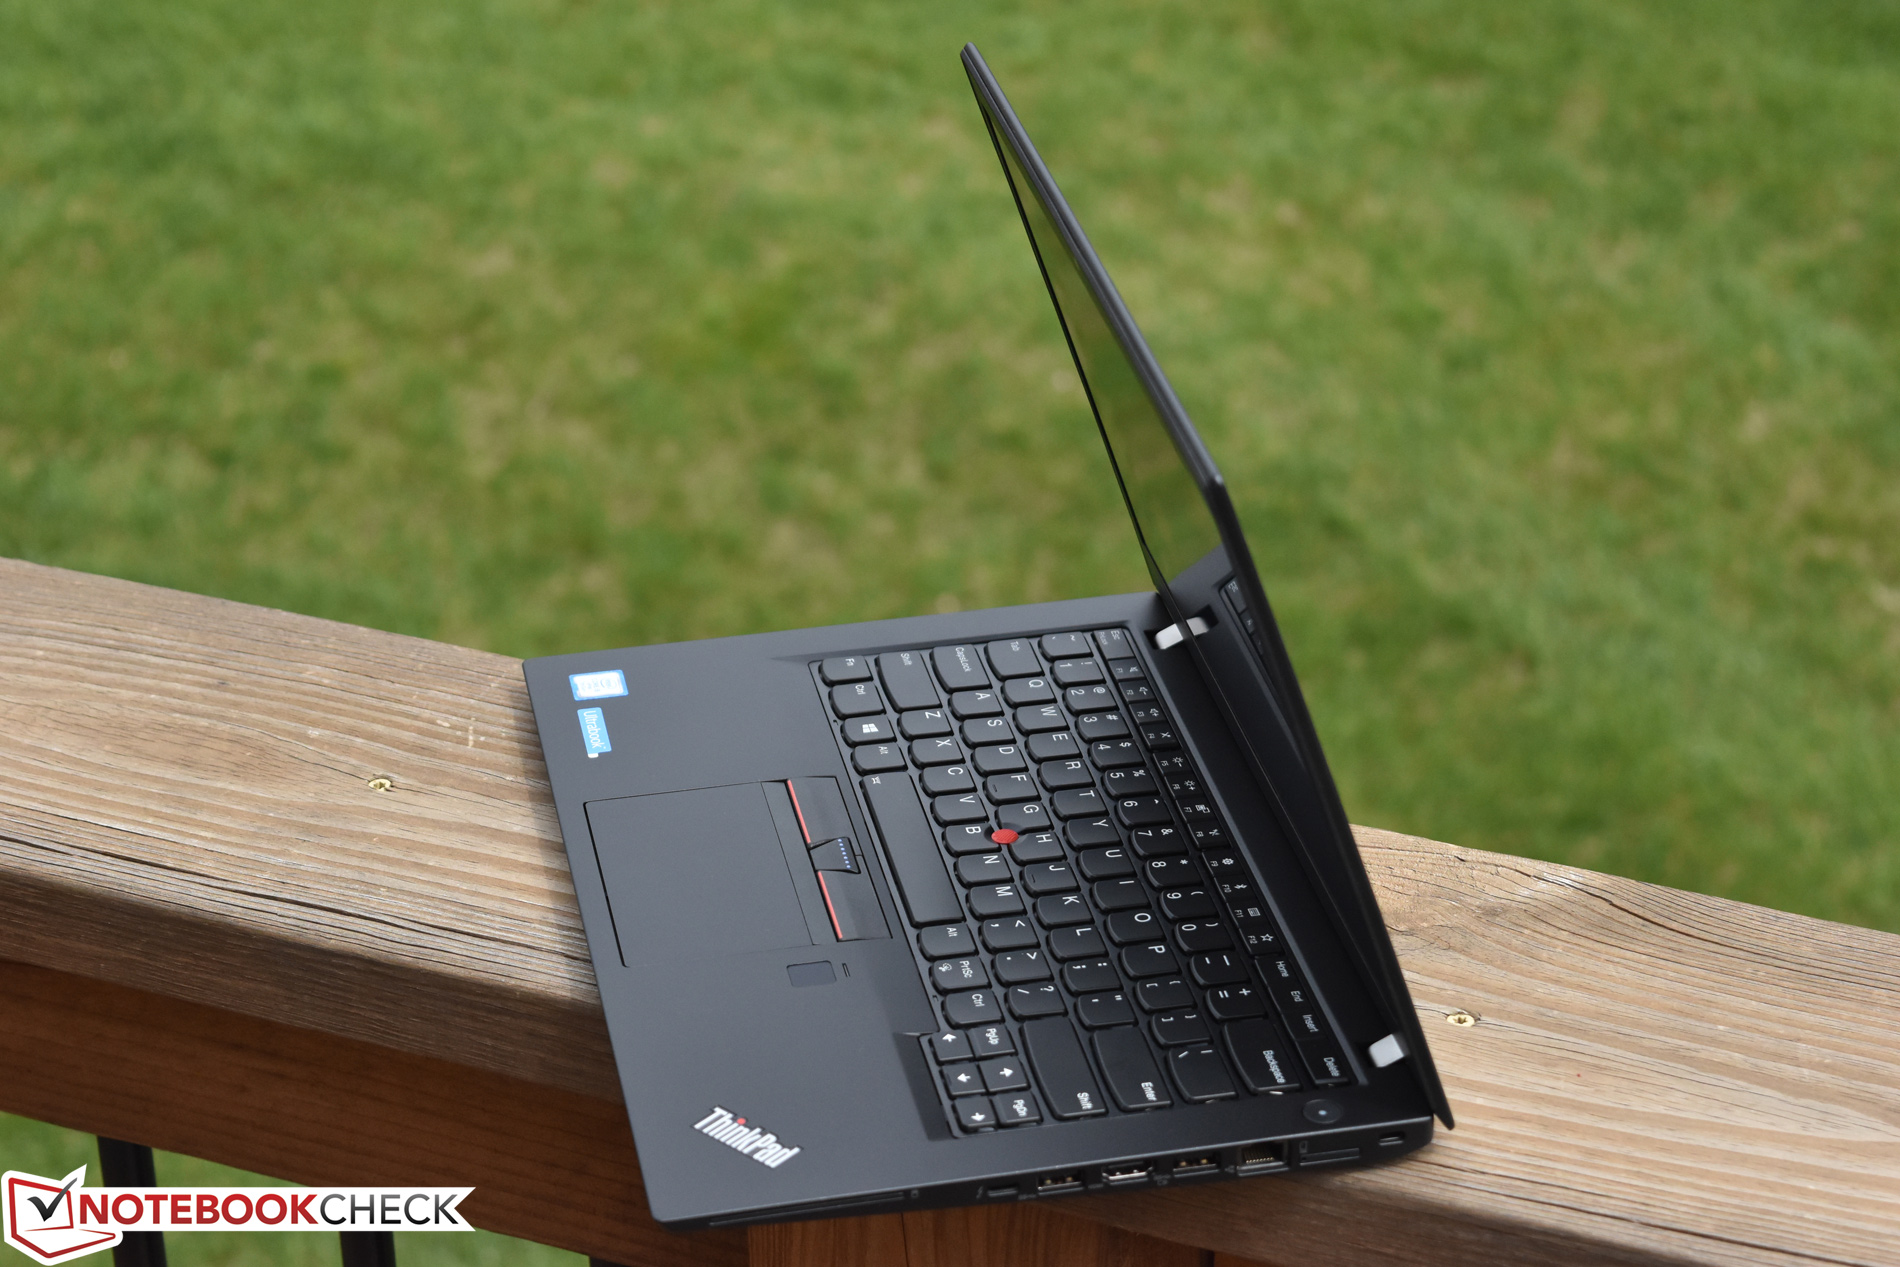
Con un peso muy ligero que resulta a la vez portable y duradero (gracias a su construcción híbrida entre magnesio y fibra de carbono), una tremenda duración de batería y unos excelentes dispositivos de entrada que son dignos de llevar la etiqueta ThinkPad, el Lenovo ThinkPad T470S FHD ya debería haber llamado la atención de los profesionales que están buscando un nuevo dispositivo. Pero además añade un excelente rendimiento con aplicaciones (posible gracias a un SSD Samsung NVMe muy rápido), sólido rendimiento de la CPU gracias al chip Core i5, y sencillo mantenimiento y encontraras un dispositivo que no te decepcionará.
¿Puntos negativos? Sí, unos pocos. Para empezar, la pantalla no es tan impresionante como la de muchos dispositivos de la competencia, y es un considerable paso atrás respecto al modelo WQHD no solo respecto a la resolución, si no también al brillo, al contraste y a la reproducción de color. Detectamos PWM con todos los niveles de brillo excepto el máximo, lo que es decepcionante para un ThinkPad. Y finalmente, el dispositivo se calienta muy fácilmente, alcanzando rápidamente temperaturas molestas (si funciona bajo carga) especialmente si se usa en sobre las piernas.
Aparte del desafortunado parpadeo PWM, la mala calidad de pantalla y las temperaturas alcanzadas al funcionar a plena carga, el Lenovo ThinkPad T470s FHD es una excelente elección.
Si al usuario no le importa una ligeramente menor (pero muy buena) duración de batería y un precio mayor, te recomendamos que eches un ojo al modelo T470s WQHD recientemente analizado, ya que su pantalla no solo presenta mejor brillo y color si no que además no hace uso de PWM para la reducción de brillo. Sin embargo, la CPU Core i5 que analizamos en la configuración de hoy parece una inversión más razonable considerando el excelente rendimiento y estabilidad respecto a la configuración con Core i7 de la configuración WQHD que analizamos. El Dell Latitude 7480 es también una excelente elección o, si el presupuesto lo permite, el ThinkPad X1 Carbon. Pero aparte de los problemas con la pantalla, si al usuario no le molesta un poco de calor cuando exija rendimiento a la CPU, el T470s FHD es uno de los mejores dispositivos de 14 pulgadas en el mercado.
Ésta es una versión acortada del análisis original. Puedes leer el análisis completo en inglés aquí.
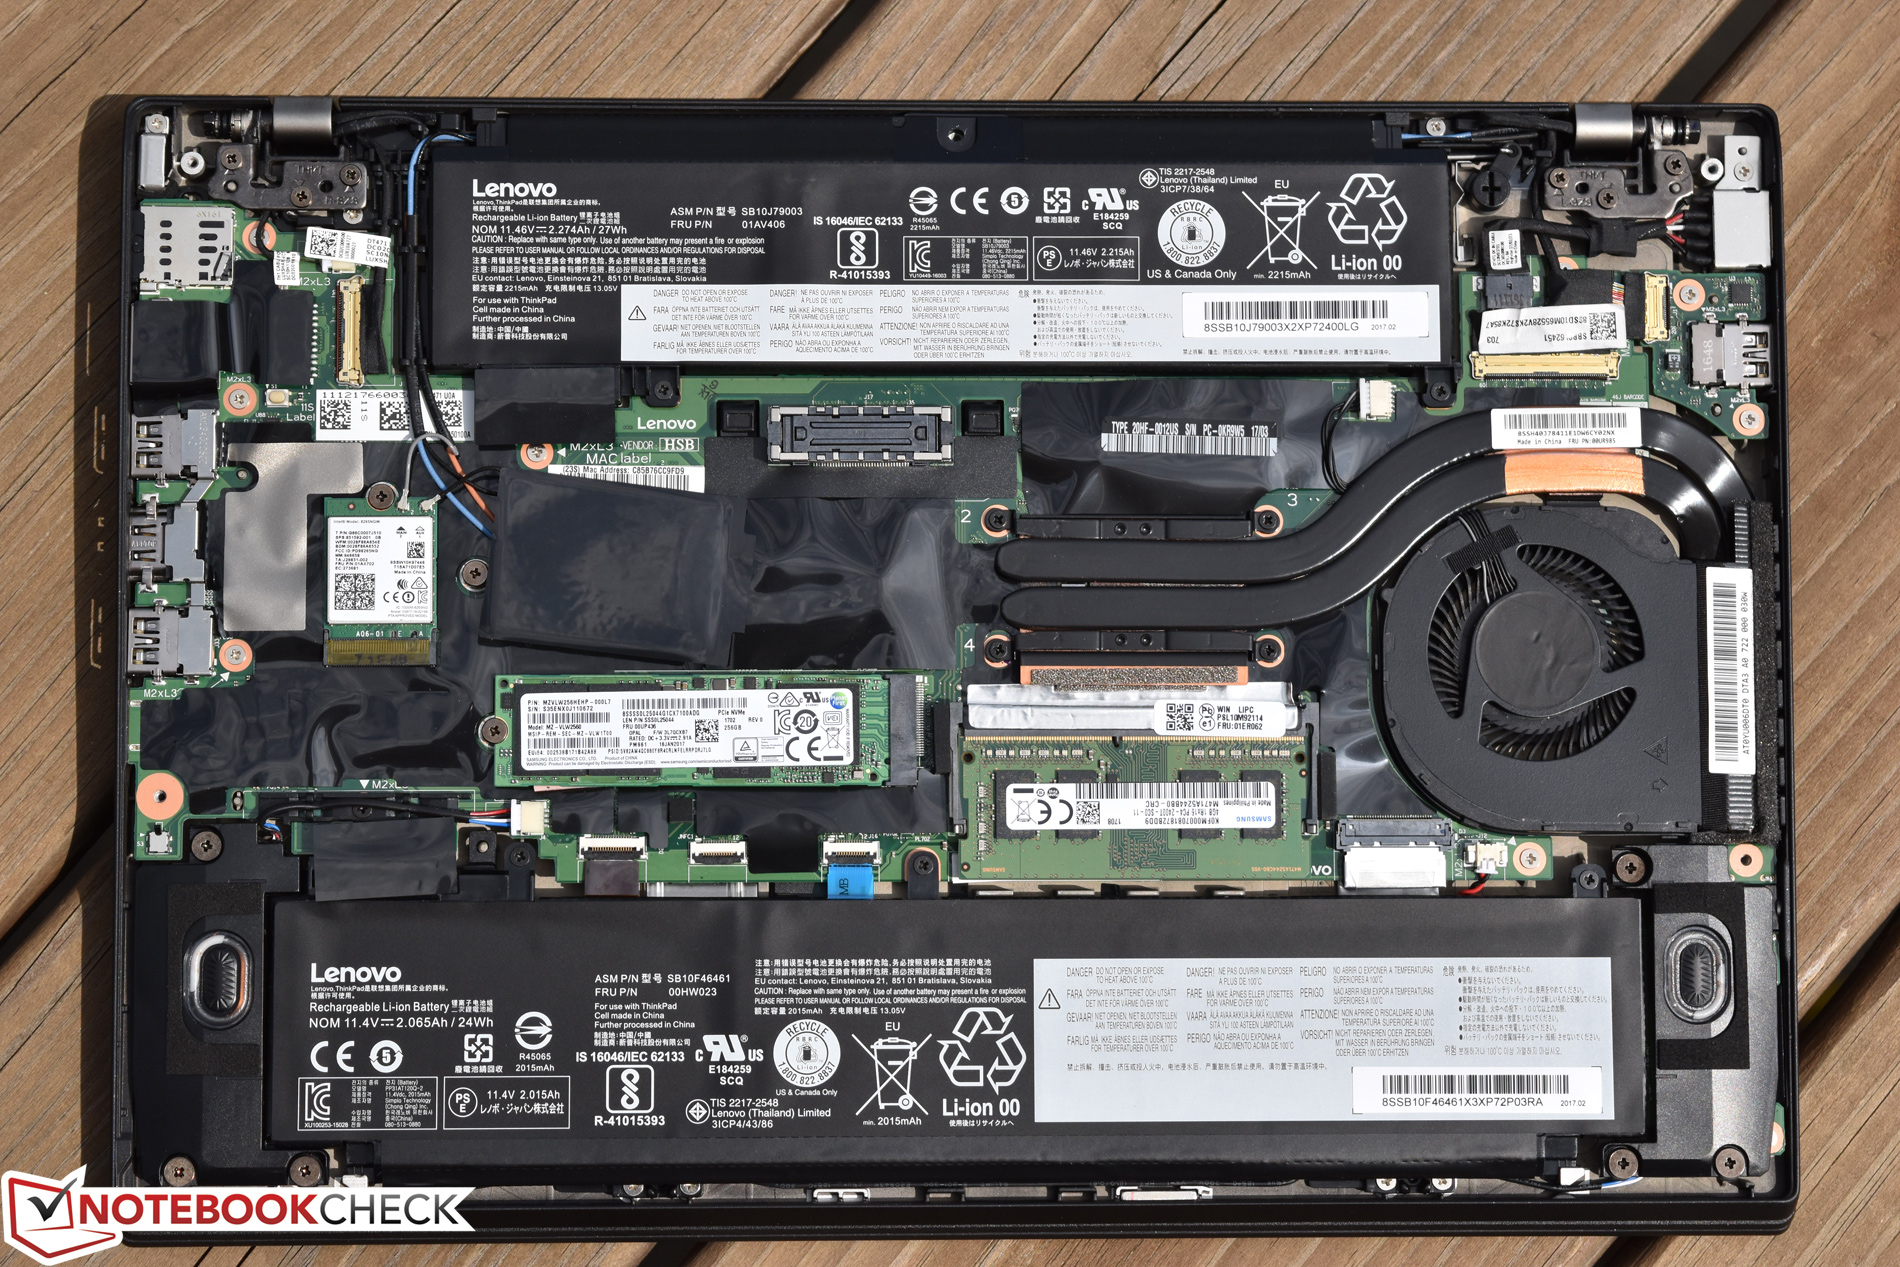
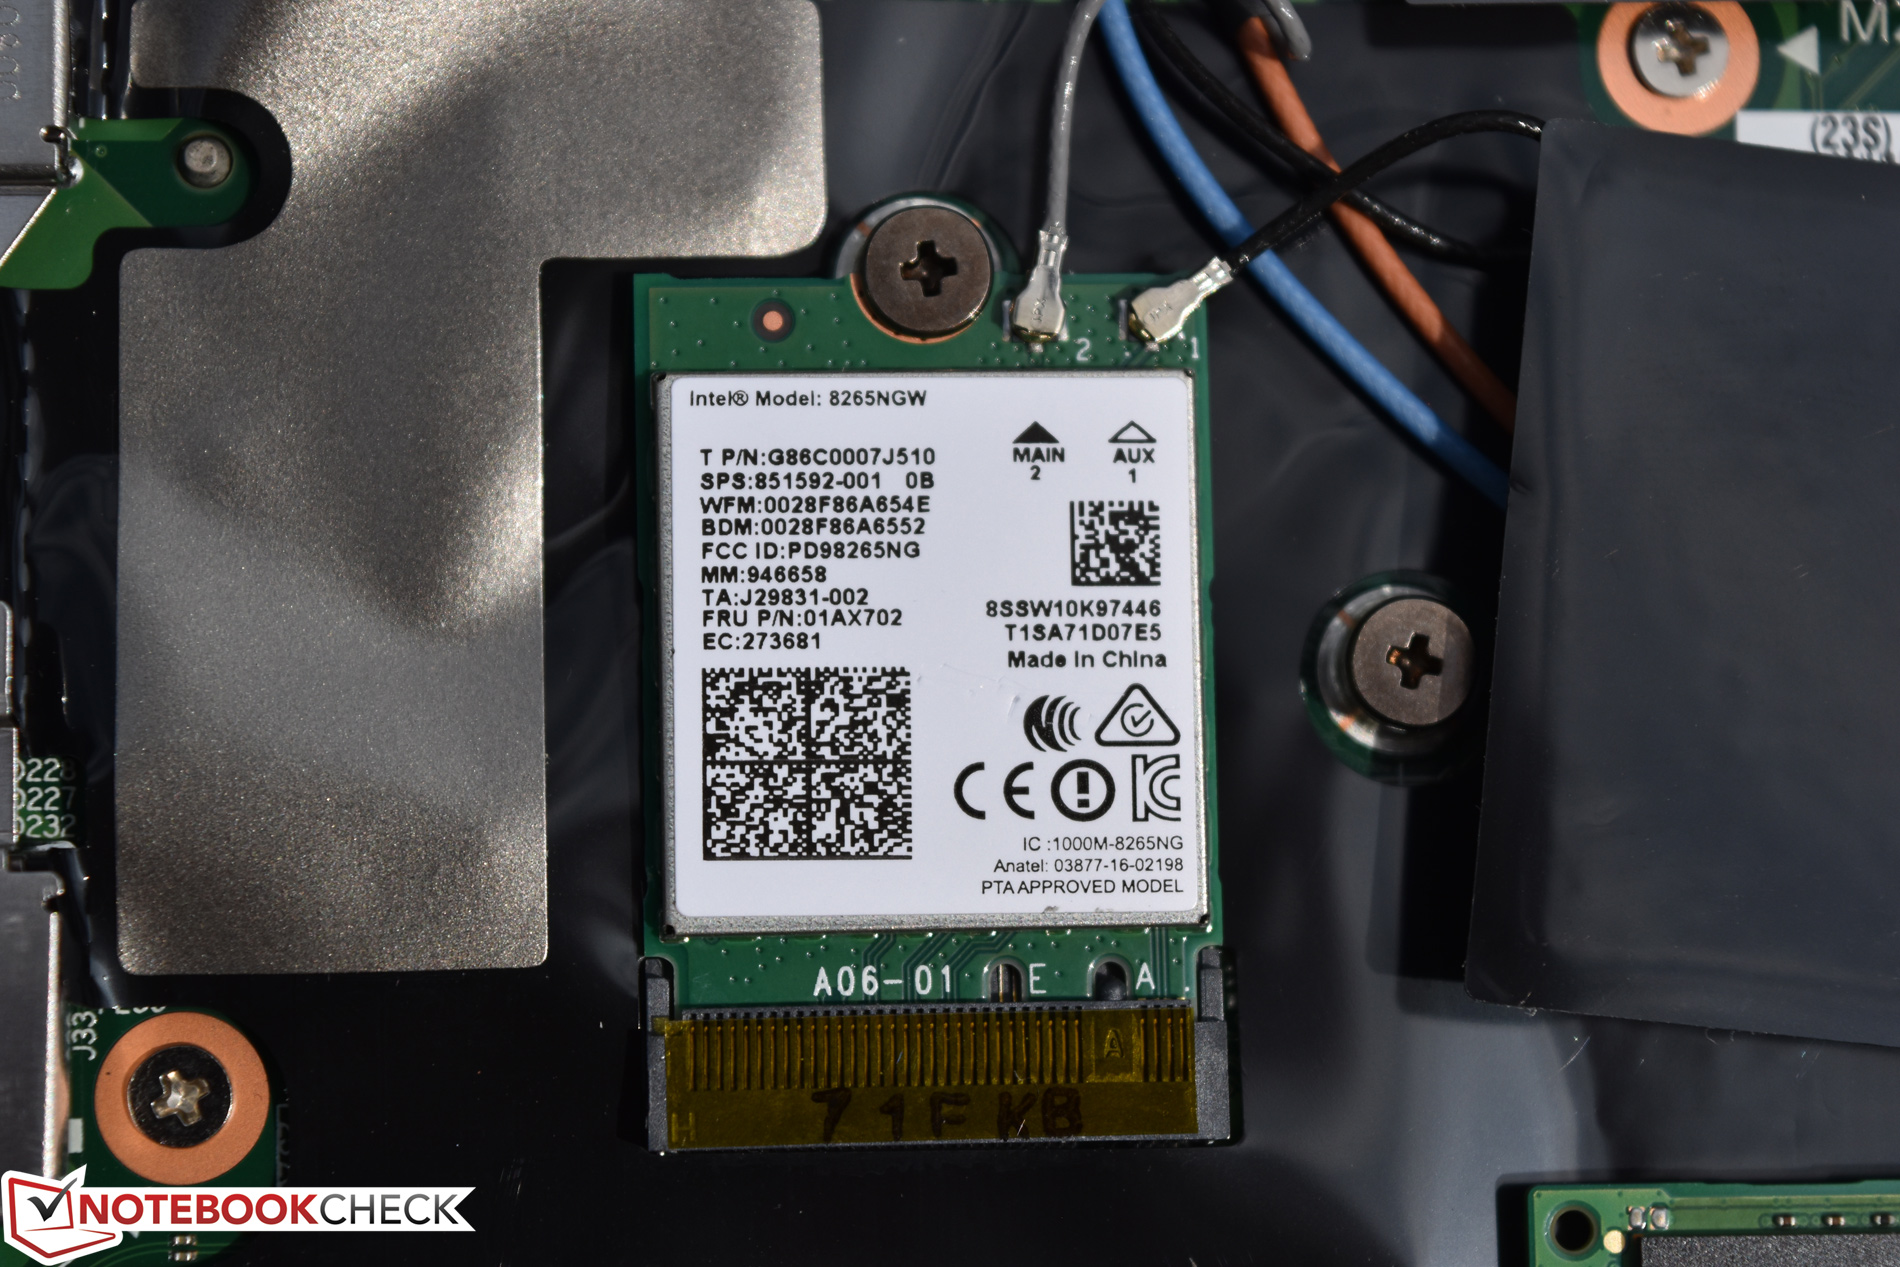
Lenovo ThinkPad T470s-20HF0012US
- 05/13/2017 v6 (old)
Steve Schardein
Price comparison
