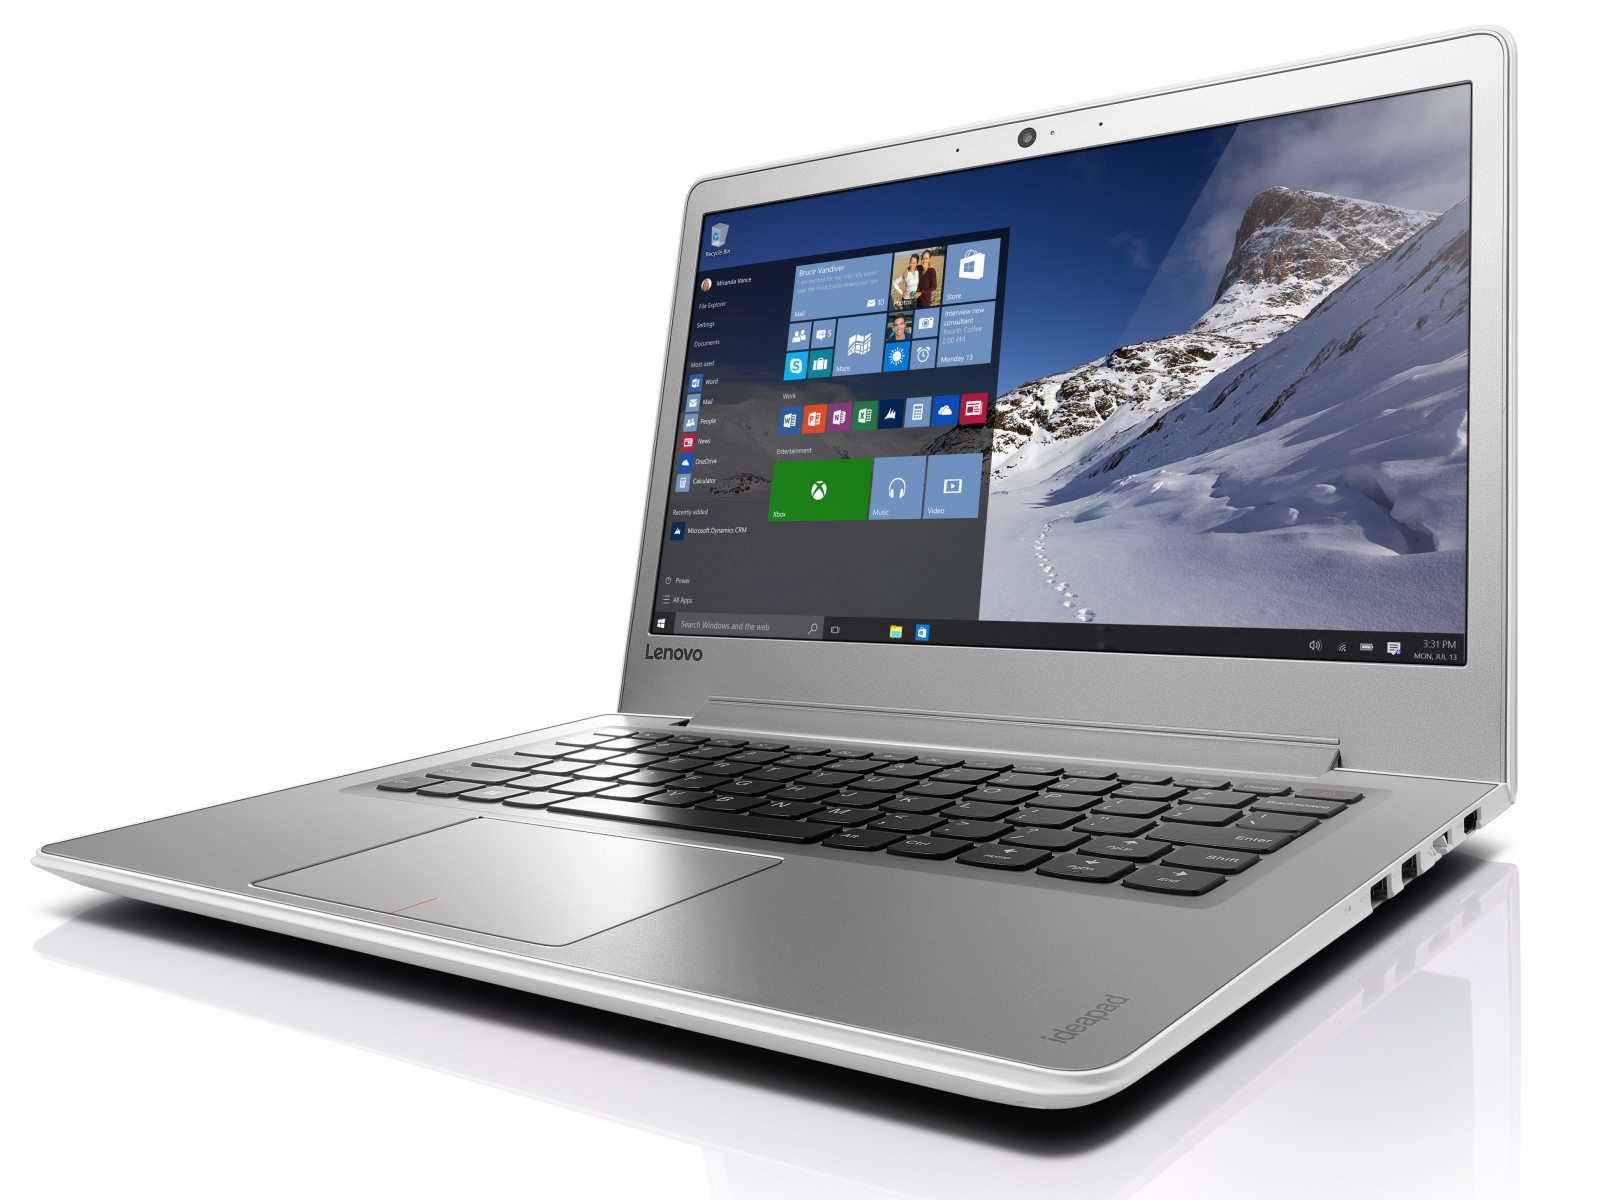
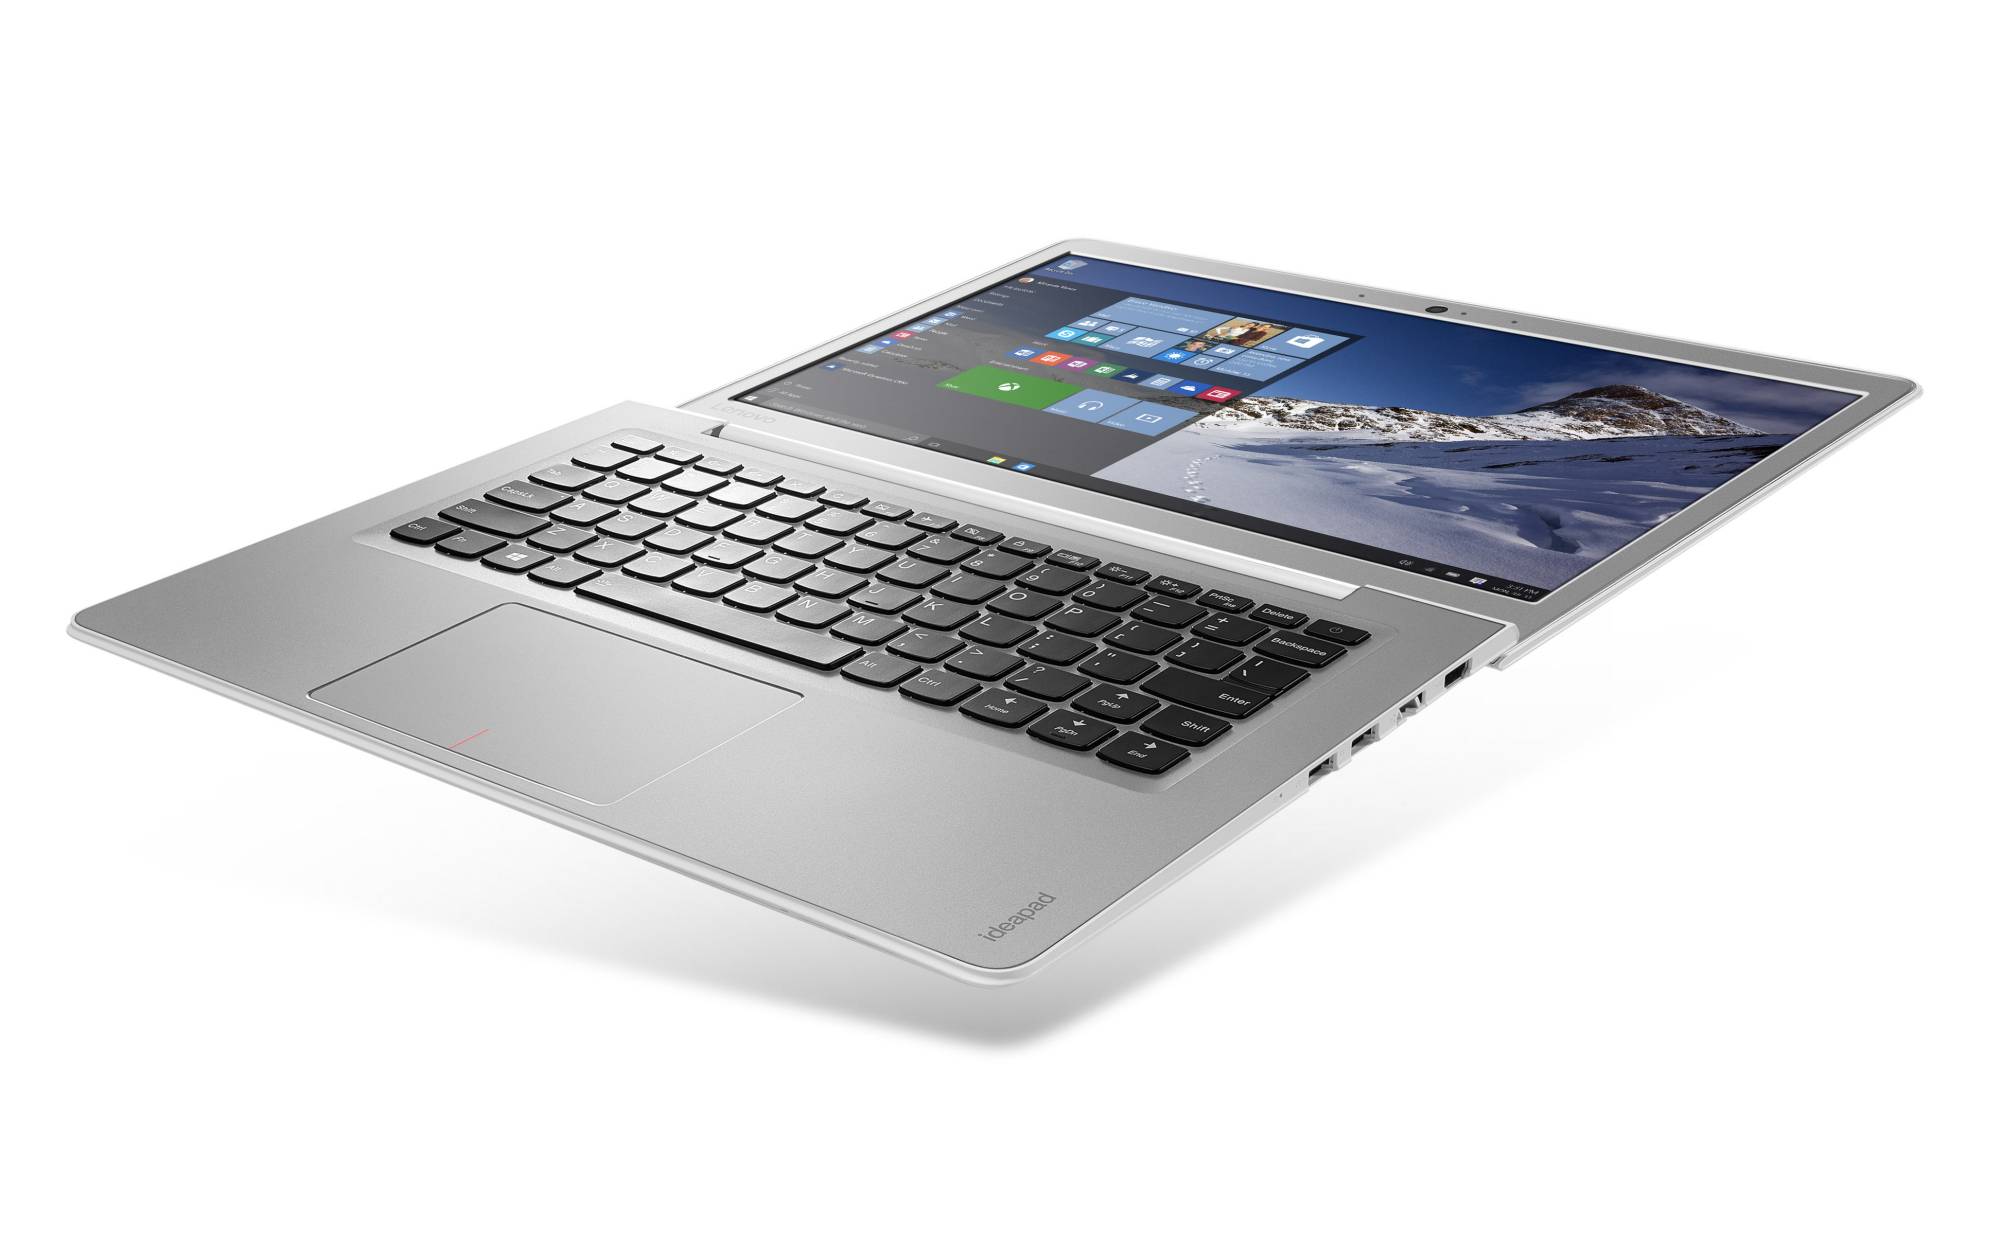
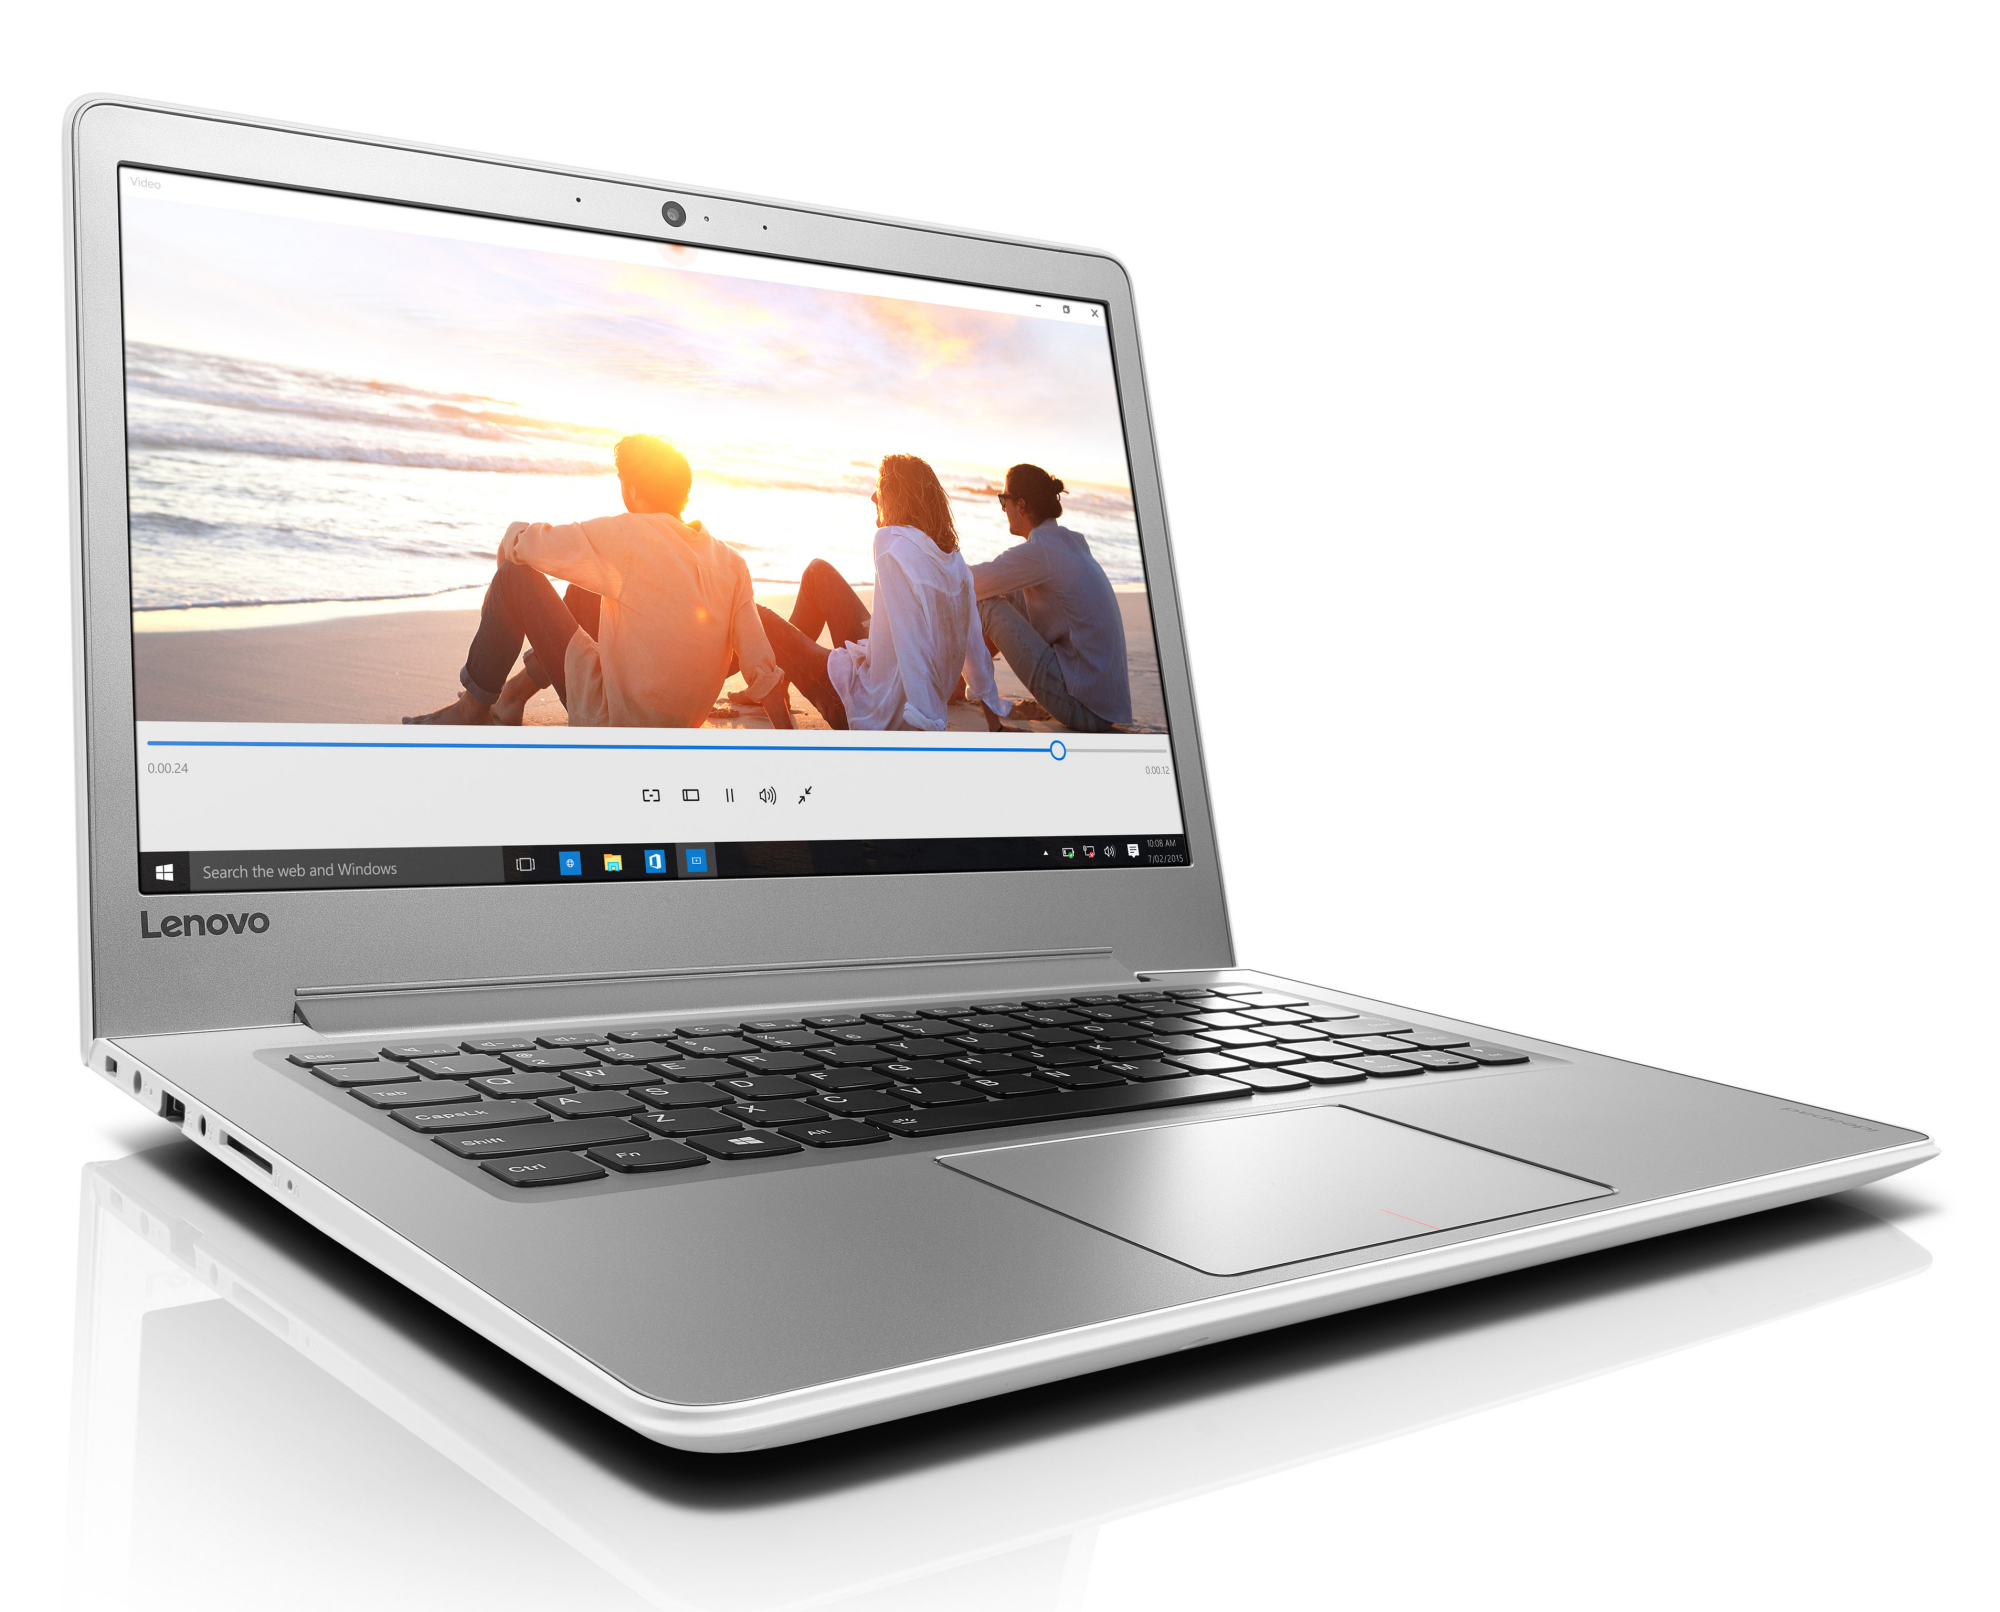
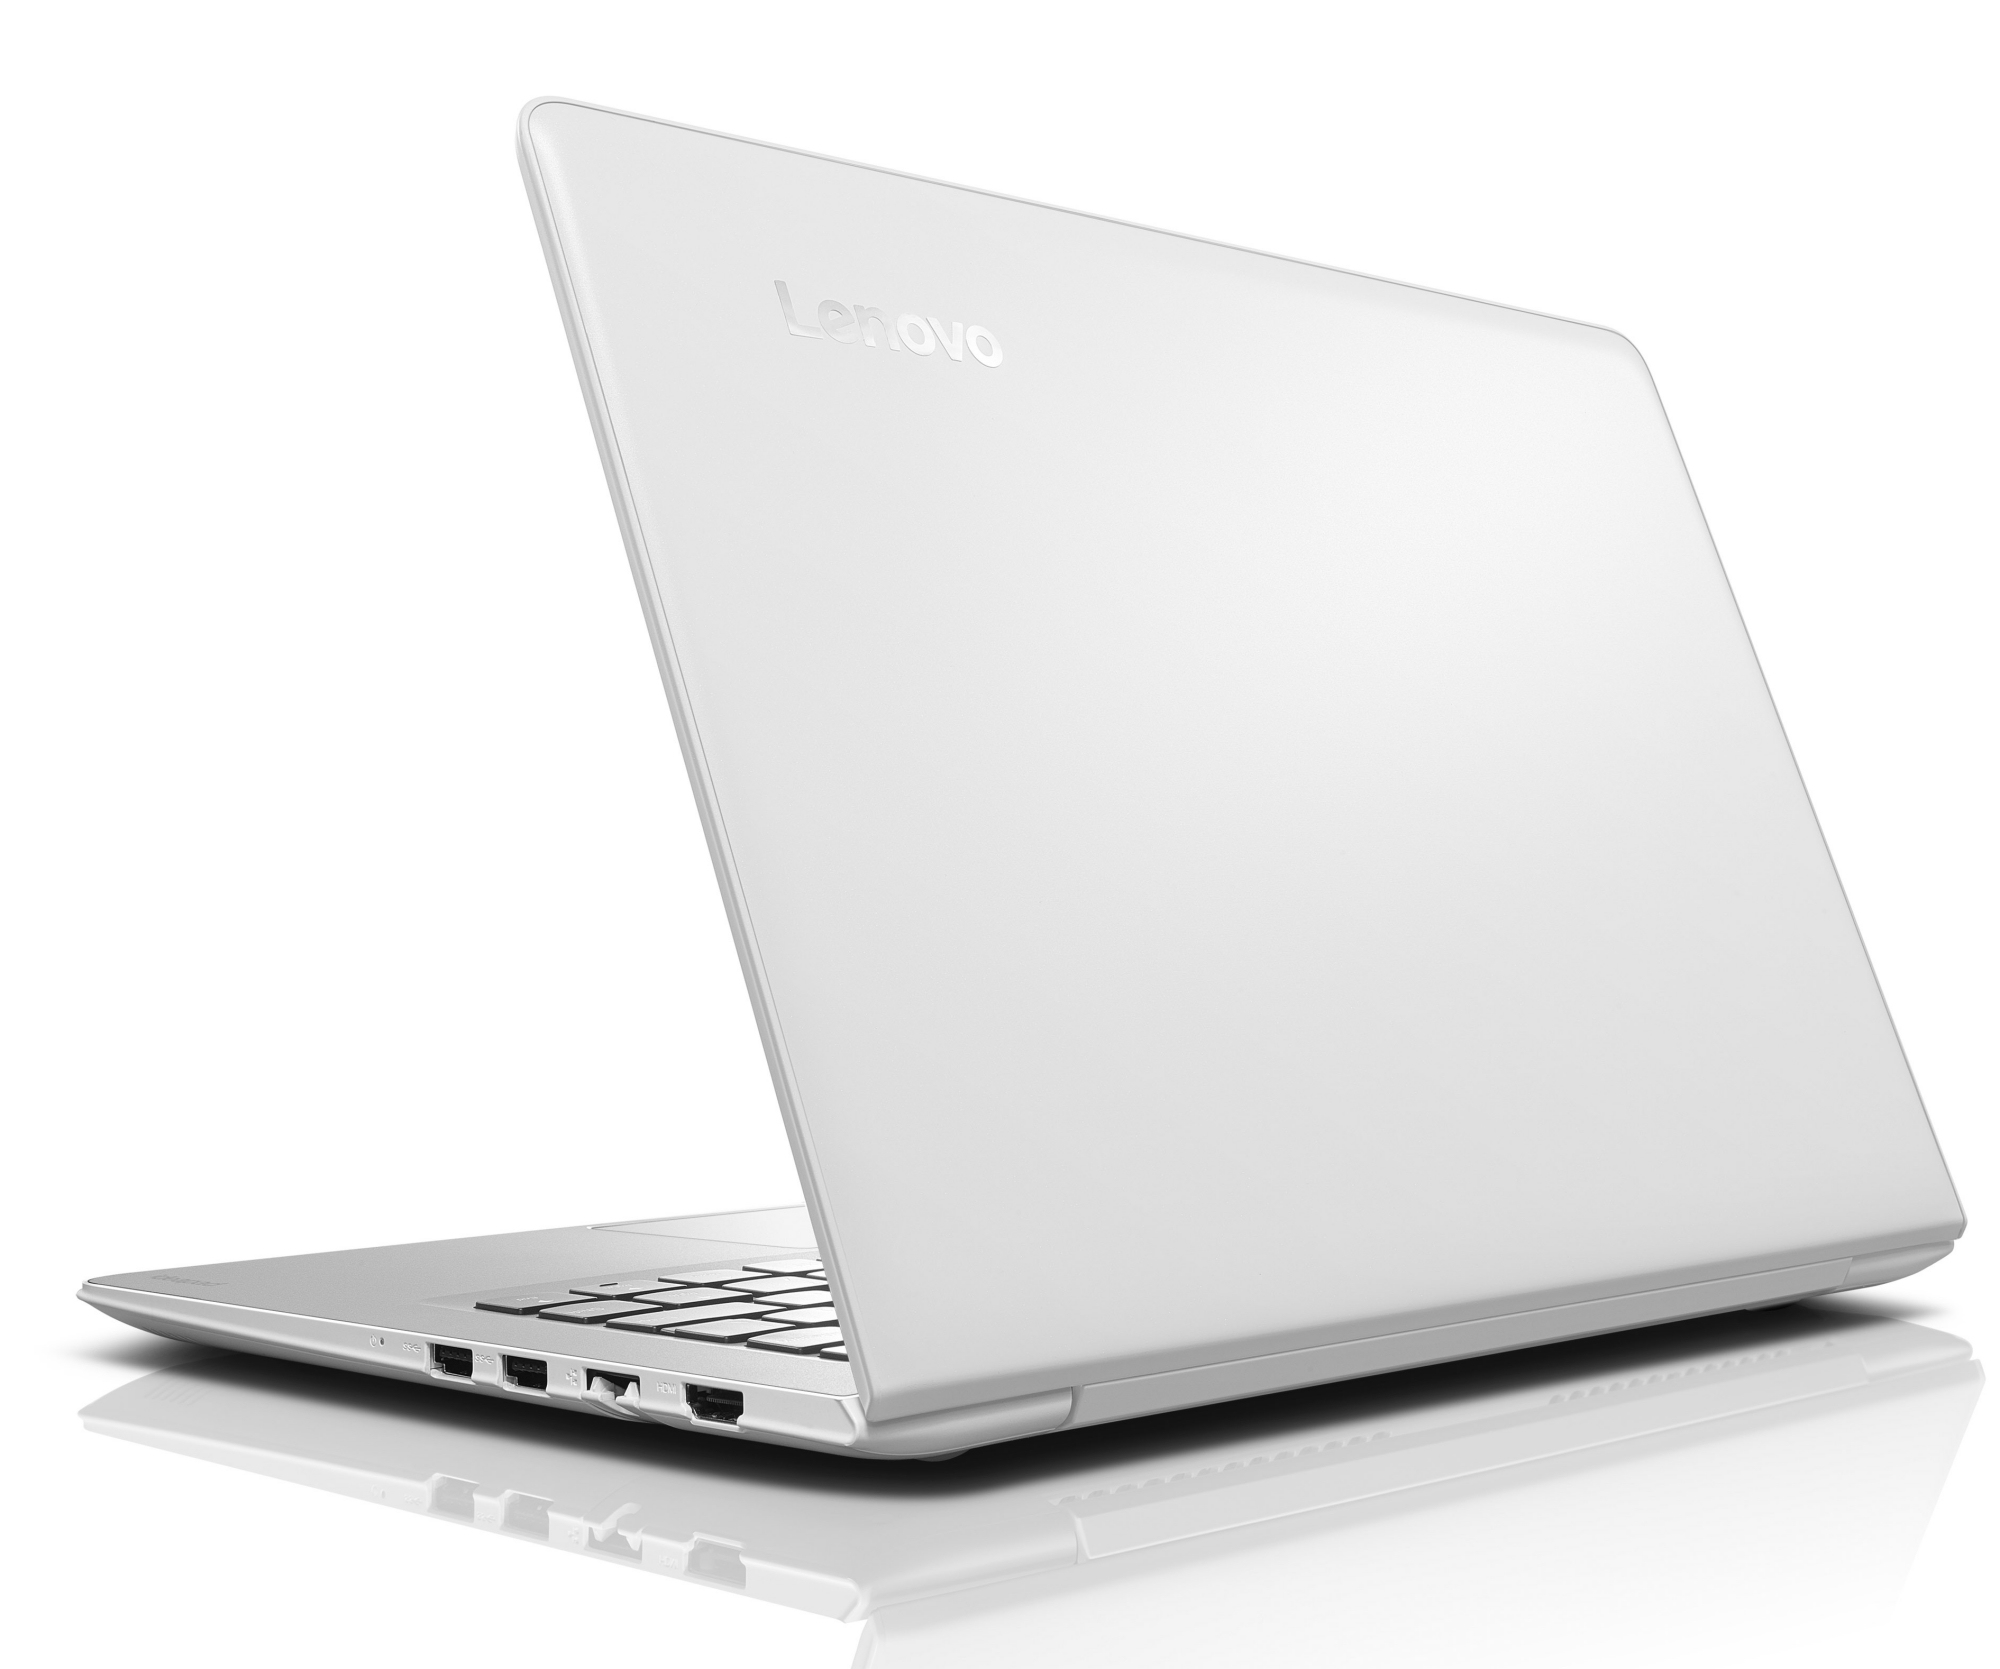
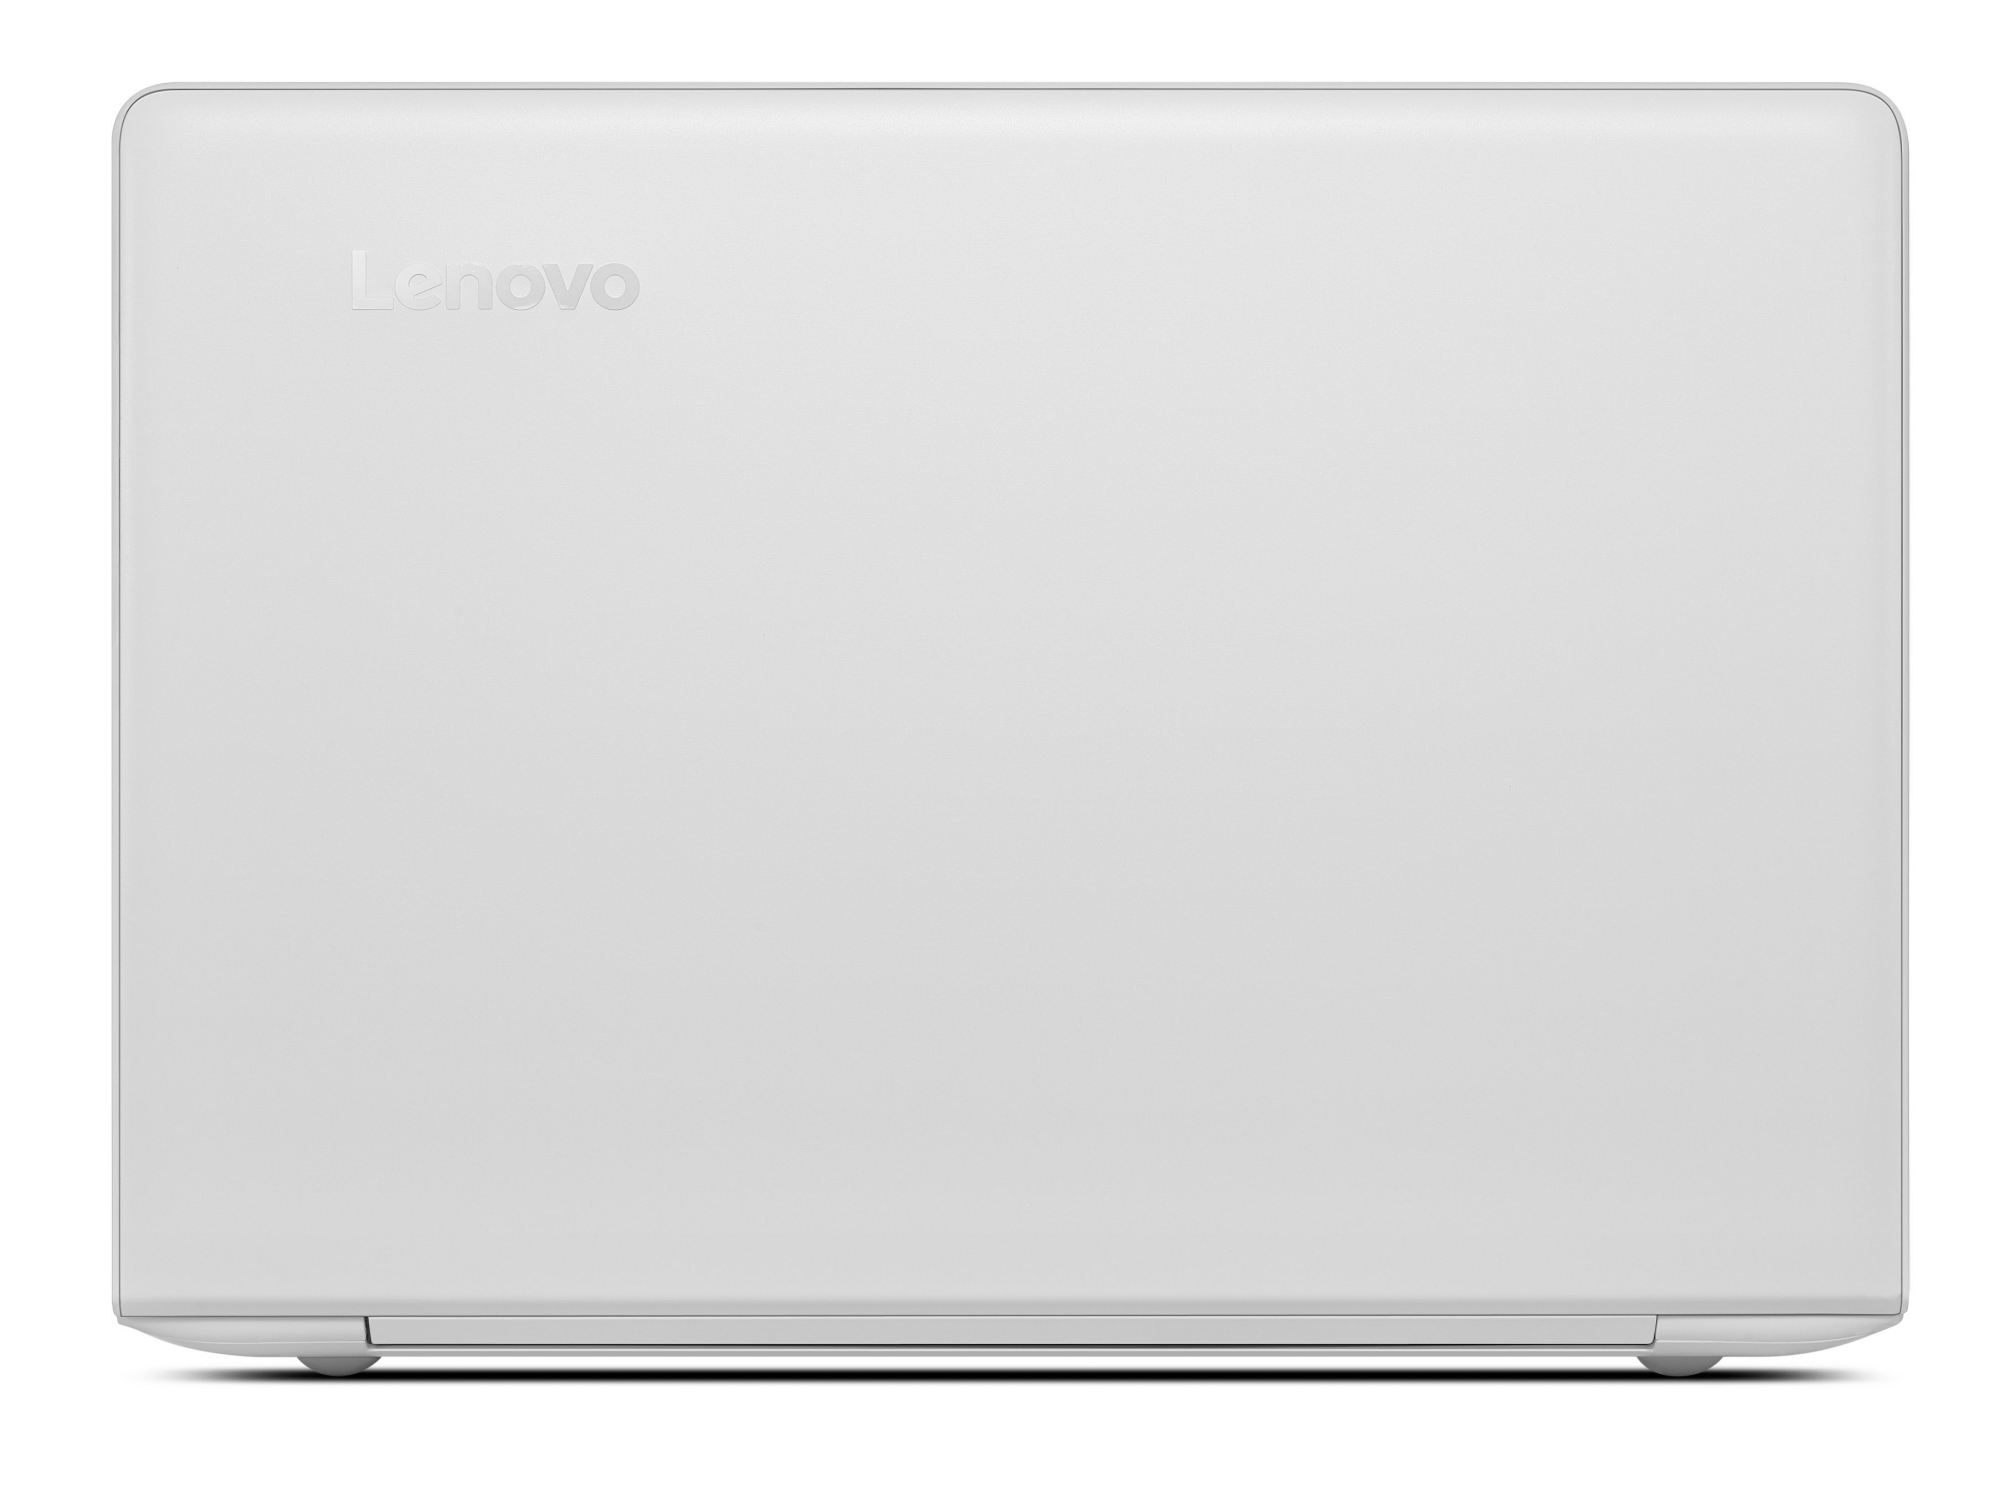
Breve análisis del subportátil Lenovo IdeaPad 510S-13IKB 80V00026GE
| |||||||||||||||||||||||||
iluminación: 82 %
Brillo con batería: 259 cd/m²
Contraste: 785:1 (Negro: 0.33 cd/m²)
ΔE ColorChecker Calman: 5.12 | ∀{0.5-29.43 Ø4.73}
ΔE Greyscale Calman: 3.8 | ∀{0.09-98 Ø4.97}
58% sRGB (Argyll 1.6.3 3D)
37% AdobeRGB 1998 (Argyll 1.6.3 3D)
39.92% AdobeRGB 1998 (Argyll 3D)
57.9% sRGB (Argyll 3D)
38.61% Display P3 (Argyll 3D)
Gamma: 2.39
CCT: 7405 K
| Lenovo IdeaPad 510S-13IKB 80V00026GE IPS, 1920x1080, 13.3" | Lenovo Ideapad 510S-13ISK IPS, 1920x1080, 13.3" | Asus X302UV-FN016T TN LED, 1366x768, 13.3" | Acer Aspire V3-372-57CW IPS, 1920x1080, 13.3" | HP Envy 13-d020ng IPS, 1920x1080, 13.3" | Asus Zenbook UX303UA-R4051T IPS, 1920x1080, 13.3" | |
|---|---|---|---|---|---|---|
| Display | 2% | 25% | 1% | 63% | 68% | |
| Display P3 Coverage (%) | 38.61 | 39.48 2% | 48.37 25% | 39.18 1% | 63.7 65% | 67.5 75% |
| sRGB Coverage (%) | 57.9 | 59.2 2% | 72.6 25% | 58.6 1% | 93 61% | 92.5 60% |
| AdobeRGB 1998 Coverage (%) | 39.92 | 40.8 2% | 49.98 25% | 40.51 1% | 65.1 63% | 67.7 70% |
| Response Times | 10% | -2% | -24% | 7% | 15% | |
| Response Time Grey 50% / Grey 80% * (ms) | 39 ? | 33 ? 15% | 42 ? -8% | 41 ? -5% | 34 ? 13% | 31 ? 21% |
| Response Time Black / White * (ms) | 24 ? | 23 ? 4% | 23 ? 4% | 34.4 ? -43% | 24 ? -0% | 22 ? 8% |
| PWM Frequency (Hz) | 250 ? | 50 ? | 50 ? | 208 ? | 198 ? | |
| Screen | 3% | -5% | -14% | 27% | 22% | |
| Brightness middle (cd/m²) | 259 | 265 2% | 218 -16% | 247 -5% | 345 33% | 357 38% |
| Brightness (cd/m²) | 253 | 261 3% | 210 -17% | 239 -6% | 335 32% | 351 39% |
| Brightness Distribution (%) | 82 | 90 10% | 88 7% | 81 -1% | 95 16% | 90 10% |
| Black Level * (cd/m²) | 0.33 | 0.33 -0% | 0.5 -52% | 0.38 -15% | 0.25 24% | 0.58 -76% |
| Contrast (:1) | 785 | 803 2% | 436 -44% | 650 -17% | 1380 76% | 616 -22% |
| Colorchecker dE 2000 * | 5.12 | 4.98 3% | 3.89 24% | 5.95 -16% | 4.94 4% | 3.39 34% |
| Colorchecker dE 2000 max. * | 10.12 | 9.75 4% | 7.11 30% | 14.2 -40% | 8.85 13% | 6.76 33% |
| Greyscale dE 2000 * | 3.8 | 3.9 -3% | 4.9 -29% | 5.25 -38% | 5.85 -54% | 2.36 38% |
| Gamma | 2.39 92% | 2.55 86% | 2.41 91% | 2.42 91% | 2.25 98% | 2.2 100% |
| CCT | 7405 88% | 7318 89% | 7860 83% | 6736 96% | 7105 91% | 6653 98% |
| Color Space (Percent of AdobeRGB 1998) (%) | 37 | 38 3% | 46 24% | 37.28 1% | 60 62% | 60 62% |
| Color Space (Percent of sRGB) (%) | 58 | 59 2% | 73 26% | 58.37 1% | 93 60% | 93 60% |
| Media total (Programa/Opciones) | 5% /
3% | 6% /
2% | -12% /
-12% | 32% /
31% | 35% /
30% |
* ... más pequeño es mejor
Parpadeo de Pantalla / PWM (Pulse-Width Modulation)
| Parpadeo de Pantalla / PWM detectado | 250 Hz | ≤ 80 % de brillo | 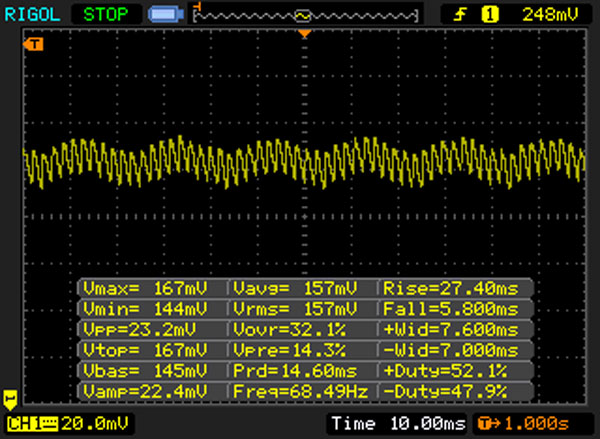 |
La retroiluminación del display parpadea a 250 Hz (seguramente usa PWM - Pulse-Width Modulation) a un brillo del 80 % e inferior. Sobre este nivel de brillo no debería darse parpadeo / PWM. La frecuencia de 250 Hz es relativamente baja, por lo que la gente sensible debería ver parpadeos y padecer fatiga visual por la pantalla (usado al brillo indicado a continuación). Comparación: 52 % de todos los dispositivos testados no usaron PWM para atenuar el display. Si se usó, medimos una media de 7794 (mínimo: 5 - máxmo: 343500) Hz. | |||
Tiempos de respuesta del display
| ↔ Tiempo de respuesta de Negro a Blanco | ||
|---|---|---|
| 24 ms ... subida ↗ y bajada ↘ combinada | ↗ 5 ms subida | 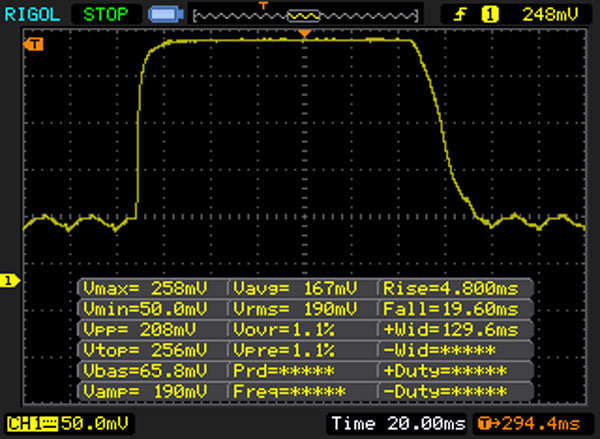 |
| ↘ 19 ms bajada | ||
| La pantalla mostró buenos tiempos de respuesta en nuestros tests pero podría ser demasiado lenta para los jugones competitivos. En comparación, todos los dispositivos de prueba van de ##min### (mínimo) a 240 (máximo) ms. » 54 % de todos los dispositivos son mejores. Eso quiere decir que el tiempo de respuesta es peor que la media (19.9 ms) de todos los dispositivos testados. | ||
| ↔ Tiempo de respuesta 50% Gris a 80% Gris | ||
| 39 ms ... subida ↗ y bajada ↘ combinada | ↗ 14 ms subida | 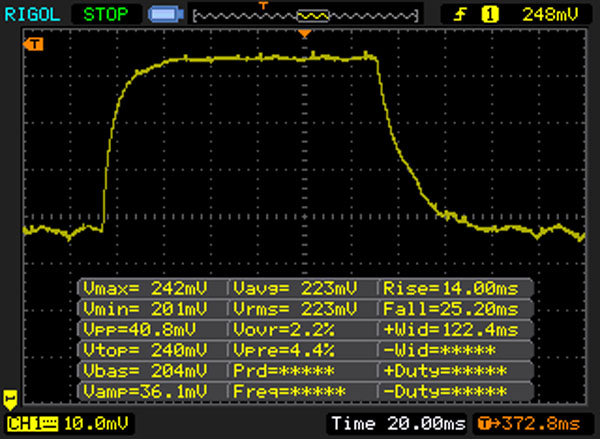 |
| ↘ 25 ms bajada | ||
| La pantalla mostró tiempos de respuesta lentos en nuestros tests y podría ser demasiado lenta para los jugones. En comparación, todos los dispositivos de prueba van de ##min### (mínimo) a 636 (máximo) ms. » 59 % de todos los dispositivos son mejores. Eso quiere decir que el tiempo de respuesta es peor que la media (31.1 ms) de todos los dispositivos testados. | ||
| Geekbench 4.0 | |
| 64 Bit Single-Core Score | |
| Lenovo IdeaPad 510S-13IKB 80V00026GE | |
| 64 Bit Multi-Core Score | |
| Lenovo IdeaPad 510S-13IKB 80V00026GE | |
| JetStream 1.1 - 1.1 Total | |
| Lenovo IdeaPad 510S-13IKB 80V00026GE | |
| Acer Aspire V3-372-57CW | |
| Asus X302UV-FN016T | |
| HP Envy 13-d020ng | |
| Lenovo Ideapad 510S-13ISK | |
| Asus Zenbook UX303UA-FN121T | |
| Lenovo E31-70 80KX015RGE | |
| PCMark 7 Score | 5427 puntos | |
| PCMark 8 Home Score Accelerated v2 | 3574 puntos | |
| PCMark 8 Creative Score Accelerated v2 | 4506 puntos | |
| PCMark 8 Work Score Accelerated v2 | 4712 puntos | |
ayuda | ||

| Lenovo IdeaPad 510S-13IKB 80V00026GE Samsung MZYTY256HDHP | Lenovo Ideapad 510S-13ISK WDC Slim WD10SPCX-24HWST1 | Asus X302UV-FN016T Hynix HFS128G3MND | Acer Aspire V3-372-57CW Kingston RBU-SNS8152S3256GG2 | HP Envy 13-d020ng Samsung MZRPC256HADR-000SO | Asus Zenbook UX303UA-R4051T SK hynix SSD Canvas SC300 HFS256G32MND | |
|---|---|---|---|---|---|---|
| CrystalDiskMark 3.0 | -89% | -29% | 12% | 3% | 2% | |
| Read Seq (MB/s) | 494.5 | 108.3 -78% | 428.2 -13% | 515 4% | 478.7 -3% | 465 -6% |
| Write Seq (MB/s) | 494.1 | 109 -78% | 178.6 -64% | 338 -32% | 268.5 -46% | 321 -35% |
| Read 512 (MB/s) | 383.9 | 35.24 -91% | 282.6 -26% | 368.1 -4% | 386.6 1% | 331.4 -14% |
| Write 512 (MB/s) | 155.5 | 53.3 -66% | 179.1 15% | 338.6 118% | 268.8 73% | 321.2 107% |
| Read 4k (MB/s) | 36.08 | 0.395 -99% | 6.559 -82% | 28.88 -20% | 26.88 -25% | 21.41 -41% |
| Write 4k (MB/s) | 96.4 | 1.19 -99% | 71.2 -26% | 74.2 -23% | 78.7 -18% | 74.6 -23% |
| Read 4k QD32 (MB/s) | 403.3 | 1.139 -100% | 253 -37% | 319.9 -21% | 369.4 -8% | 325.4 -19% |
| Write 4k QD32 (MB/s) | 176.4 | 1.212 -99% | 174 -1% | 309.4 75% | 259.7 47% | 263 49% |
| 3DMark 06 Standard Score | 8449 puntos | |
| 3DMark 11 Performance | 1603 puntos | |
| 3DMark Ice Storm Standard Score | 52169 puntos | |
| 3DMark Cloud Gate Standard Score | 5407 puntos | |
| 3DMark Fire Strike Score | 764 puntos | |
ayuda | ||
| bajo | medio | alto | ultra | |
|---|---|---|---|---|
| Tomb Raider (2013) | 68.5 | 34.4 | 19.7 | 9.6 |
| BioShock Infinite (2013) | 42.7 | 25.3 | 21.3 | 7.1 |
| Battlefield 4 (2013) | 33.8 | 26.1 | 16.9 | 6.3 |
Ruido
| Ocioso |
| 31.2 / 31.2 / 33.3 dB(A) |
| Carga |
| 40 / 39.8 dB(A) |
 | ||
30 dB silencioso 40 dB(A) audible 50 dB(A) ruidosamente alto |
||
min: | ||
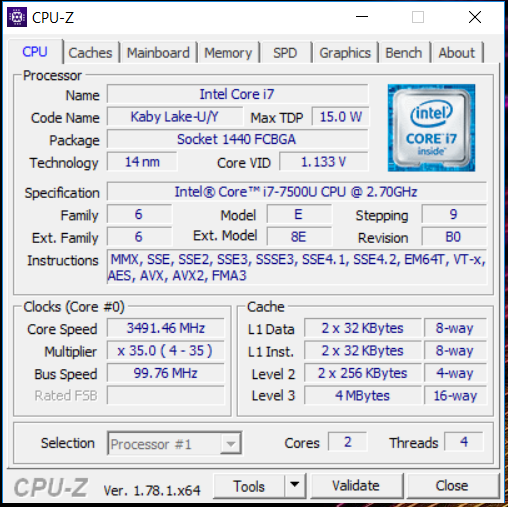
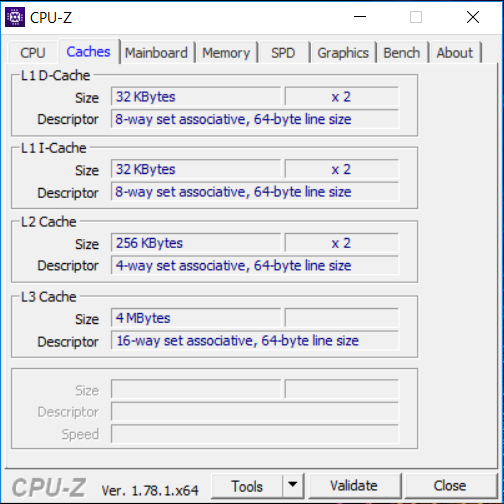
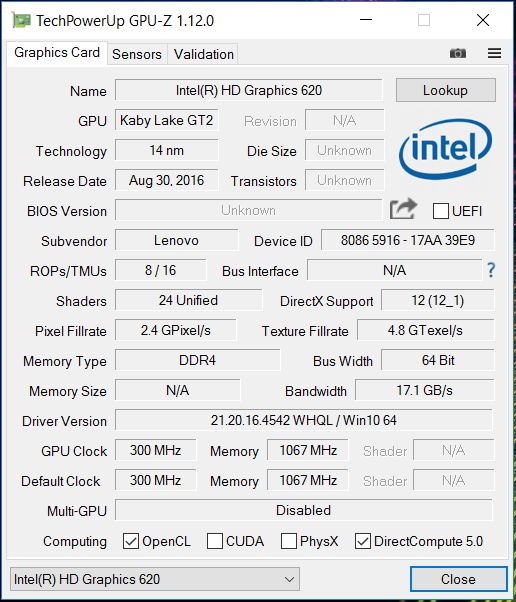
| Lenovo IdeaPad 510S-13IKB 80V00026GE i7-7500U, HD Graphics 620 | Lenovo Ideapad 510S-13ISK 6200U, HD Graphics 520 | Asus X302UV-FN016T 6200U, GeForce 920MX | Acer Aspire V3-372-57CW 6267U, Iris Graphics 550 | Lenovo E31-70 80KX015RGE 5005U, HD Graphics 5500 | HP Envy 13-d020ng 6200U, HD Graphics 520 | Asus Zenbook UX303UA-R4051T 6500U, HD Graphics 520 | |
|---|---|---|---|---|---|---|---|
| Noise | -1% | 4% | 3% | 6% | 3% | 6% | |
| apagado / medio ambiente * (dB) | 31.6 | 31.2 1% | 31.2 1% | 29.1 8% | 29.2 8% | 31.3 1% | |
| Idle Minimum * (dB) | 31.2 | 32.1 -3% | 32.9 -5% | 29.1 7% | 30.1 4% | 32.5 -4% | 31.3 -0% |
| Idle Average * (dB) | 31.2 | 32.1 -3% | 32.9 -5% | 29.1 7% | 30.1 4% | 32.5 -4% | 31.3 -0% |
| Idle Maximum * (dB) | 33.3 | 32.1 4% | 33 1% | 29.1 13% | 30.1 10% | 32.4 3% | 31.5 5% |
| Load Average * (dB) | 40 | 40 -0% | 33 17% | 41.1 -3% | 38.1 5% | 36 10% | 33.2 17% |
| Load Maximum * (dB) | 39.8 | 40.9 -3% | 34.6 13% | 46.4 -17% | 38.1 4% | 36.5 8% | 34.1 14% |
* ... más pequeño es mejor
(+) La temperatura máxima en la parte superior es de 33 °C / 91 F, frente a la media de 35.9 °C / 97 F, que oscila entre 21.4 y 59 °C para la clase Subnotebook.
(+) El fondo se calienta hasta un máximo de 35.4 °C / 96 F, frente a la media de 39.2 °C / 103 F
(+) En reposo, la temperatura media de la parte superior es de 25.3 °C / 78# F, frente a la media del dispositivo de 30.8 °C / 87 F.
(+) El reposamanos y el panel táctil están a una temperatura inferior a la de la piel, con un máximo de 26.4 °C / 79.5 F y, por tanto, son fríos al tacto.
(±) La temperatura media de la zona del reposamanos de dispositivos similares fue de 28.2 °C / 82.8 F (+1.8 °C / 3.3 F).
| Lenovo IdeaPad 510S-13IKB 80V00026GE i7-7500U, HD Graphics 620 | Lenovo Ideapad 510S-13ISK 6200U, HD Graphics 520 | Asus X302UV-FN016T 6200U, GeForce 920MX | Acer Aspire V3-372-57CW 6267U, Iris Graphics 550 | Lenovo E31-70 80KX015RGE 5005U, HD Graphics 5500 | HP Envy 13-d020ng 6200U, HD Graphics 520 | Asus Zenbook UX303UA-R4051T 6500U, HD Graphics 520 | |
|---|---|---|---|---|---|---|---|
| Heat | -11% | 3% | -17% | -12% | -16% | -3% | |
| Maximum Upper Side * (°C) | 33 | 38 -15% | 29.6 10% | 37.1 -12% | 38.6 -17% | 51 -55% | 38.1 -15% |
| Maximum Bottom * (°C) | 35.4 | 39.1 -10% | 41 -16% | 43.2 -22% | 41.1 -16% | 46 -30% | 40.3 -14% |
| Idle Upper Side * (°C) | 27.2 | 30.7 -13% | 24.8 9% | 32.1 -18% | 29.5 -8% | 25.5 6% | 25.8 5% |
| Idle Bottom * (°C) | 29.3 | 31.1 -6% | 26.6 9% | 34.4 -17% | 30.8 -5% | 24.4 17% | 25.5 13% |
* ... más pequeño es mejor
Lenovo IdeaPad 510S-13IKB 80V00026GE análisis de audio
(-) | altavoces no muy altos (#66 dB)
Graves 100 - 315 Hz
(±) | lubina reducida - en promedio 14.4% inferior a la mediana
(±) | la linealidad de los graves es media (7.3% delta a frecuencia anterior)
Medios 400 - 2000 Hz
(+) | medios equilibrados - a sólo 0.7% de la mediana
(+) | los medios son lineales (2.3% delta a la frecuencia anterior)
Altos 2 - 16 kHz
(+) | máximos equilibrados - a sólo 1.5% de la mediana
(+) | los máximos son lineales (2.1% delta a la frecuencia anterior)
Total 100 - 16.000 Hz
(+) | el sonido global es lineal (13.2% de diferencia con la mediana)
En comparación con la misma clase
» 21% de todos los dispositivos probados de esta clase eran mejores, 5% similares, 74% peores
» El mejor tuvo un delta de 5%, la media fue 18%, el peor fue ###max##%
En comparación con todos los dispositivos probados
» 13% de todos los dispositivos probados eran mejores, 3% similares, 84% peores
» El mejor tuvo un delta de 4%, la media fue 24%, el peor fue ###max##%
Apple MacBook 12 (Early 2016) 1.1 GHz análisis de audio
(+) | los altavoces pueden reproducir a un volumen relativamente alto (#83.6 dB)
Graves 100 - 315 Hz
(±) | lubina reducida - en promedio 11.3% inferior a la mediana
(±) | la linealidad de los graves es media (14.2% delta a frecuencia anterior)
Medios 400 - 2000 Hz
(+) | medios equilibrados - a sólo 2.4% de la mediana
(+) | los medios son lineales (5.5% delta a la frecuencia anterior)
Altos 2 - 16 kHz
(+) | máximos equilibrados - a sólo 2% de la mediana
(+) | los máximos son lineales (4.5% delta a la frecuencia anterior)
Total 100 - 16.000 Hz
(+) | el sonido global es lineal (10.2% de diferencia con la mediana)
En comparación con la misma clase
» 7% de todos los dispositivos probados de esta clase eran mejores, 2% similares, 91% peores
» El mejor tuvo un delta de 5%, la media fue 18%, el peor fue ###max##%
En comparación con todos los dispositivos probados
» 5% de todos los dispositivos probados eran mejores, 1% similares, 94% peores
» El mejor tuvo un delta de 4%, la media fue 24%, el peor fue ###max##%
| Off / Standby | |
| Ocioso | |
| Carga |
|
Clave:
min: | |
| Lenovo IdeaPad 510S-13IKB 80V00026GE i7-7500U, HD Graphics 620 | Lenovo Ideapad 510S-13ISK 6200U, HD Graphics 520 | Asus X302UV-FN016T 6200U, GeForce 920MX | Acer Aspire V3-372-57CW 6267U, Iris Graphics 550 | Lenovo E31-70 80KX015RGE 5005U, HD Graphics 5500 | HP Envy 13-d020ng 6200U, HD Graphics 520 | Asus Zenbook UX303UA-R4051T 6500U, HD Graphics 520 | |
|---|---|---|---|---|---|---|---|
| Power Consumption | -24% | -3% | -27% | -14% | -25% | -6% | |
| Idle Minimum * (Watt) | 3.3 | 5 -52% | 3.3 -0% | 3.4 -3% | 4.2 -27% | 4.2 -27% | 3.5 -6% |
| Idle Average * (Watt) | 5.8 | 7.2 -24% | 5.1 12% | 6.5 -12% | 6.1 -5% | 7.4 -28% | 7.3 -26% |
| Idle Maximum * (Watt) | 7.4 | 8.7 -18% | 5.2 30% | 7 5% | 7.4 -0% | 10.1 -36% | 7.9 -7% |
| Load Average * (Watt) | 29.2 | 32 -10% | 29.5 -1% | 44.5 -52% | 31.5 -8% | 33.4 -14% | 26.6 9% |
| Load Maximum * (Watt) | 28.6 | 33 -15% | 44 -54% | 49.5 -73% | 37.1 -30% | 34.7 -21% | 28 2% |
* ... más pequeño es mejor
| Lenovo IdeaPad 510S-13IKB 80V00026GE i7-7500U, HD Graphics 620, 35 Wh | Lenovo Ideapad 510S-13ISK 6200U, HD Graphics 520, 35 Wh | Asus X302UV-FN016T 6200U, GeForce 920MX, 38 Wh | Acer Aspire V3-372-57CW 6267U, Iris Graphics 550, 51 Wh | Lenovo E31-70 80KX015RGE 5005U, HD Graphics 5500, 35 Wh | HP Envy 13-d020ng 6200U, HD Graphics 520, 45 Wh | Asus Zenbook UX303UA-R4051T 6500U, HD Graphics 520, 50 Wh | |
|---|---|---|---|---|---|---|---|
| Duración de Batería | -8% | 14% | 50% | -26% | 12% | 19% | |
| Reader / Idle (h) | 10.8 | 9.3 -14% | 17.3 60% | ||||
| H.264 (h) | 5.5 | 5.4 -2% | |||||
| WiFi v1.3 (h) | 5.7 | 5.9 4% | 6.5 14% | 6.9 21% | 4.2 -26% | 6.4 12% | 6.8 19% |
| Load (h) | 2 | 1.6 -20% | 3.4 70% |
Pro
Contra
Los portátiles Lenovo de 13.3" a partir de ahora también se pueden tener con procesadores Kaby Lake. La nueva generación de CPUs de Intel ofrece bastante rendimiento para los años venideros. La mejora de rendimiento de Kaby Lake respecto a Skylake no lleva a un mayor ruido de sistema y aumento de temperatura. Un veloz SSD asegura un sistema rápido. Si bien es posible reemplazar el SSD, esto implica abrir la carcasa, ya que el ordenador no tiene escotilla de mantenimiento. El teclado iluminado parece bueno en general.
El procesador Kaby Lake no trae ninguna ventaja real. Los que quieran ahorrarse unos pocos Euros pueden elegir un modelo Skylake del IdeaPad.
El aguante de batería es bastante bueno. Aunque un portátil de 13.3" de esta gama de precios podría hacerlo mejor. Lenovo no ha considerado que un gran aguante de batería sea más importante que el máximo rendimiento posible en el segmento de 13.3". El IdeaPad se habría beneficiado de una batería con mayor capacidad que de un nuevo procesador Kaby Lake. El display Full HD IPS con amplio ángulo de visión ofrece unos resultados aceptables de su medición. Sin embargo, esperábamos más de un portátil de 880 Euros.
Ésta es una versión acortada del análisis original. Puedes leer el análisis completo en inglés aquí.
Lenovo IdeaPad 510S-13IKB 80V00026GE
- 12/05/2016 v6 (old)
Sascha Mölck