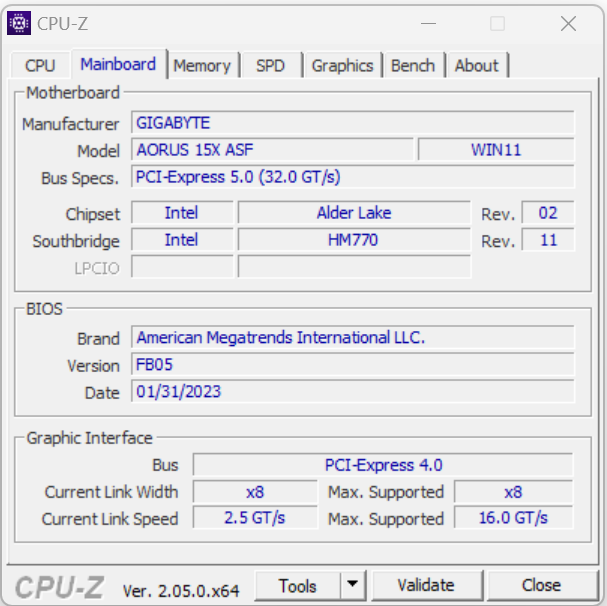
Análisis del Aorus 15X ASF: Portátil gaming con potencia y resistencia RTX 4070
El Aorus 15X -un portátil gaming de gama media- está equipado con un Core i7 Raptor Lake y una GPU RTX 4070. El precio total ronda los 2.099 dólares. Entre sus competidores se encuentran dispositivos como el Razer Blade 15 OLED (principios de 2022)elAsus ROG Strix G17 G713PIelMSI Katana 17 B13VFKy elAcer Predator Helios 300.
Posibles contendientes en la comparación
Valoración | Fecha | Modelo | Peso | Altura | Tamaño | Resolución | Precio |
|---|---|---|---|---|---|---|---|
| 86.2 % v7 (old) | 04/2023 | Aorus 15X ASF i7-13700HX, GeForce RTX 4070 Laptop GPU | 2.3 kg | 19.7 mm | 15.60" | 2560x1440 | |
| 89.9 % v7 (old) | 03/2023 | Razer Blade 15 OLED (Early 2022) i9-12900H, GeForce RTX 3070 Ti Laptop GPU | 2 kg | 16.99 mm | 15.60" | 2560x1440 | |
| 82.1 % v7 (old) | 02/2023 | MSI Katana 17 B13VFK i7-13620H, GeForce RTX 4060 Laptop GPU | 2.8 kg | 25.2 mm | 17.30" | 1920x1080 | |
| 88.4 % v7 (old) | 04/2023 | Asus ROG Strix G17 G713PI R9 7945HX, GeForce RTX 4070 Laptop GPU | 2.8 kg | 30.7 mm | 17.30" | 2560x1440 | |
| 86.5 % v7 (old) | 11/2022 | Acer Predator Helios 300 (i7-12700H, RTX 3070 Ti) i7-12700H, GeForce RTX 3070 Ti Laptop GPU | 3 kg | 27.65 mm | 17.30" | 2560x1440 |
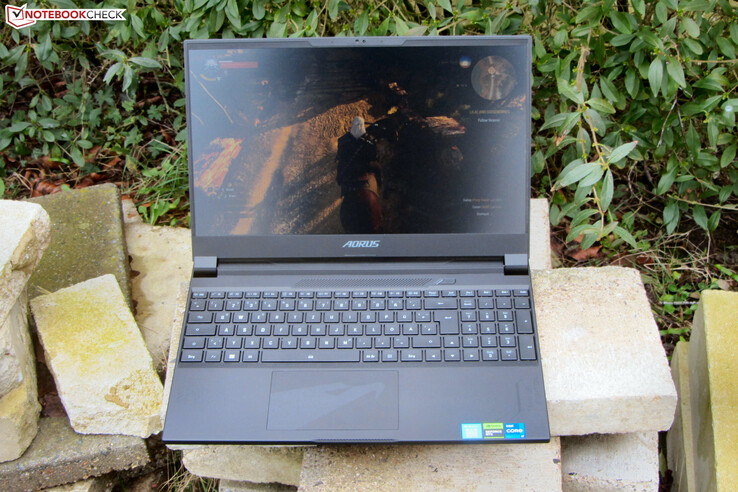
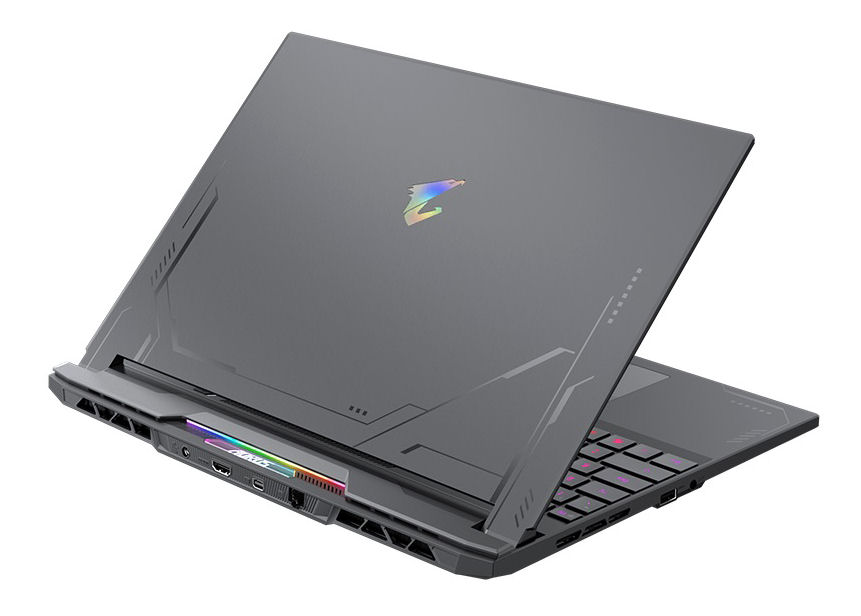
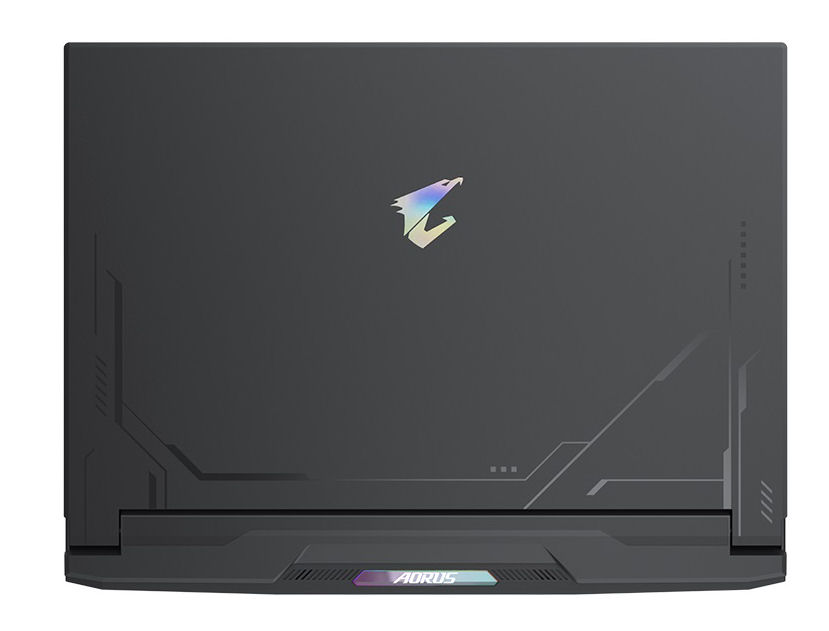
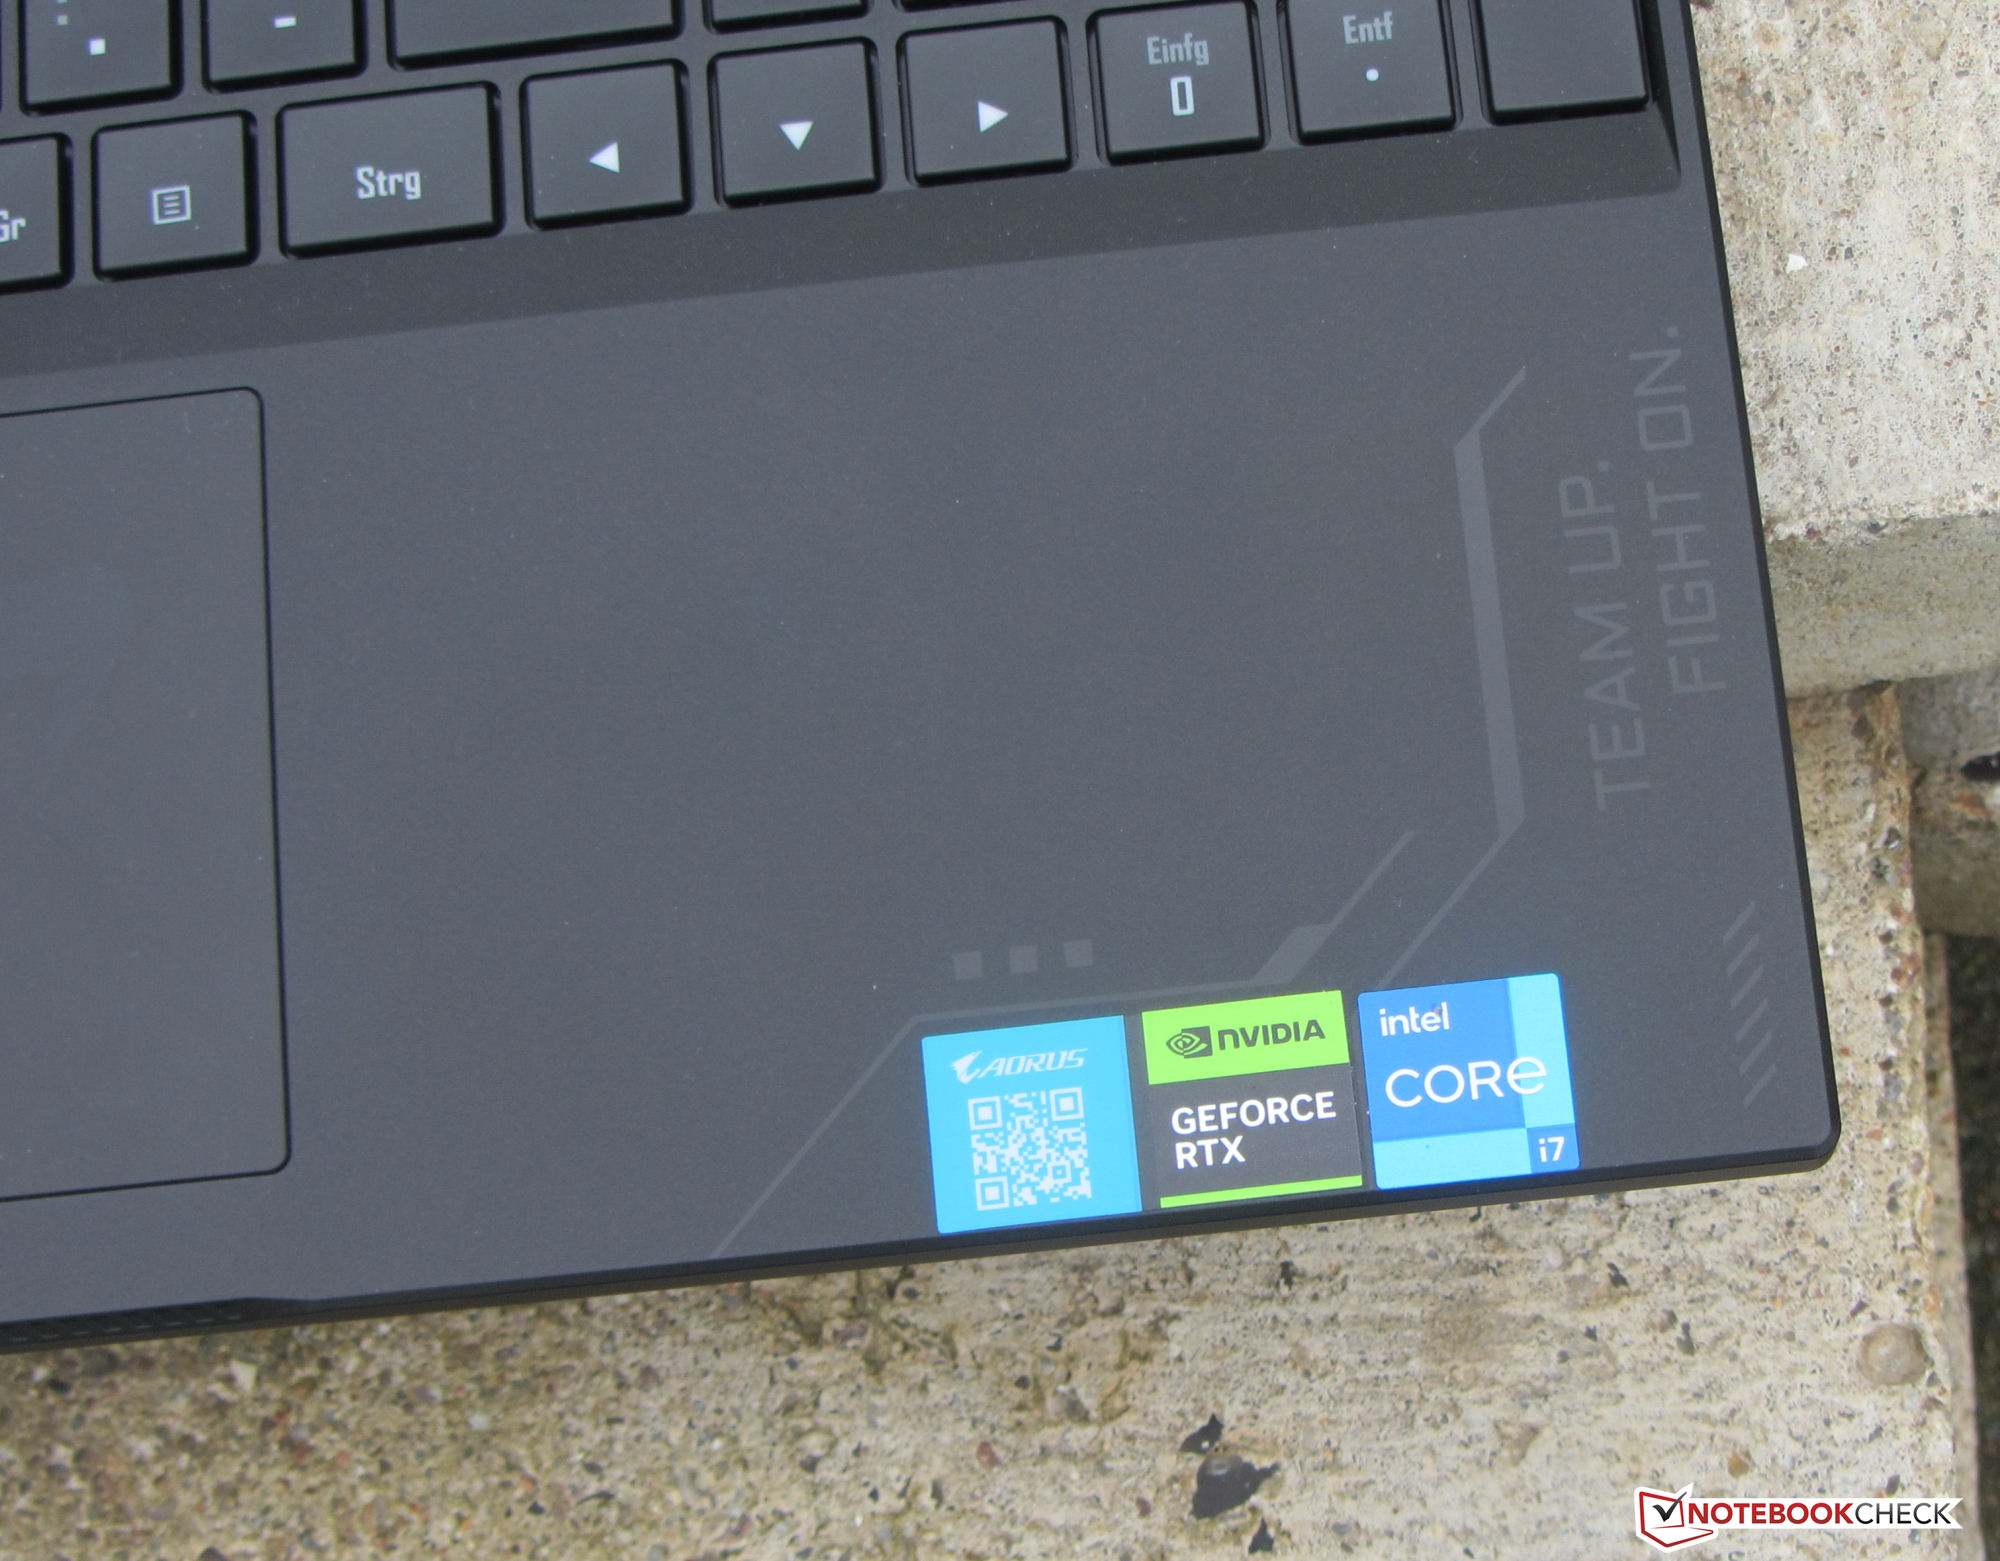
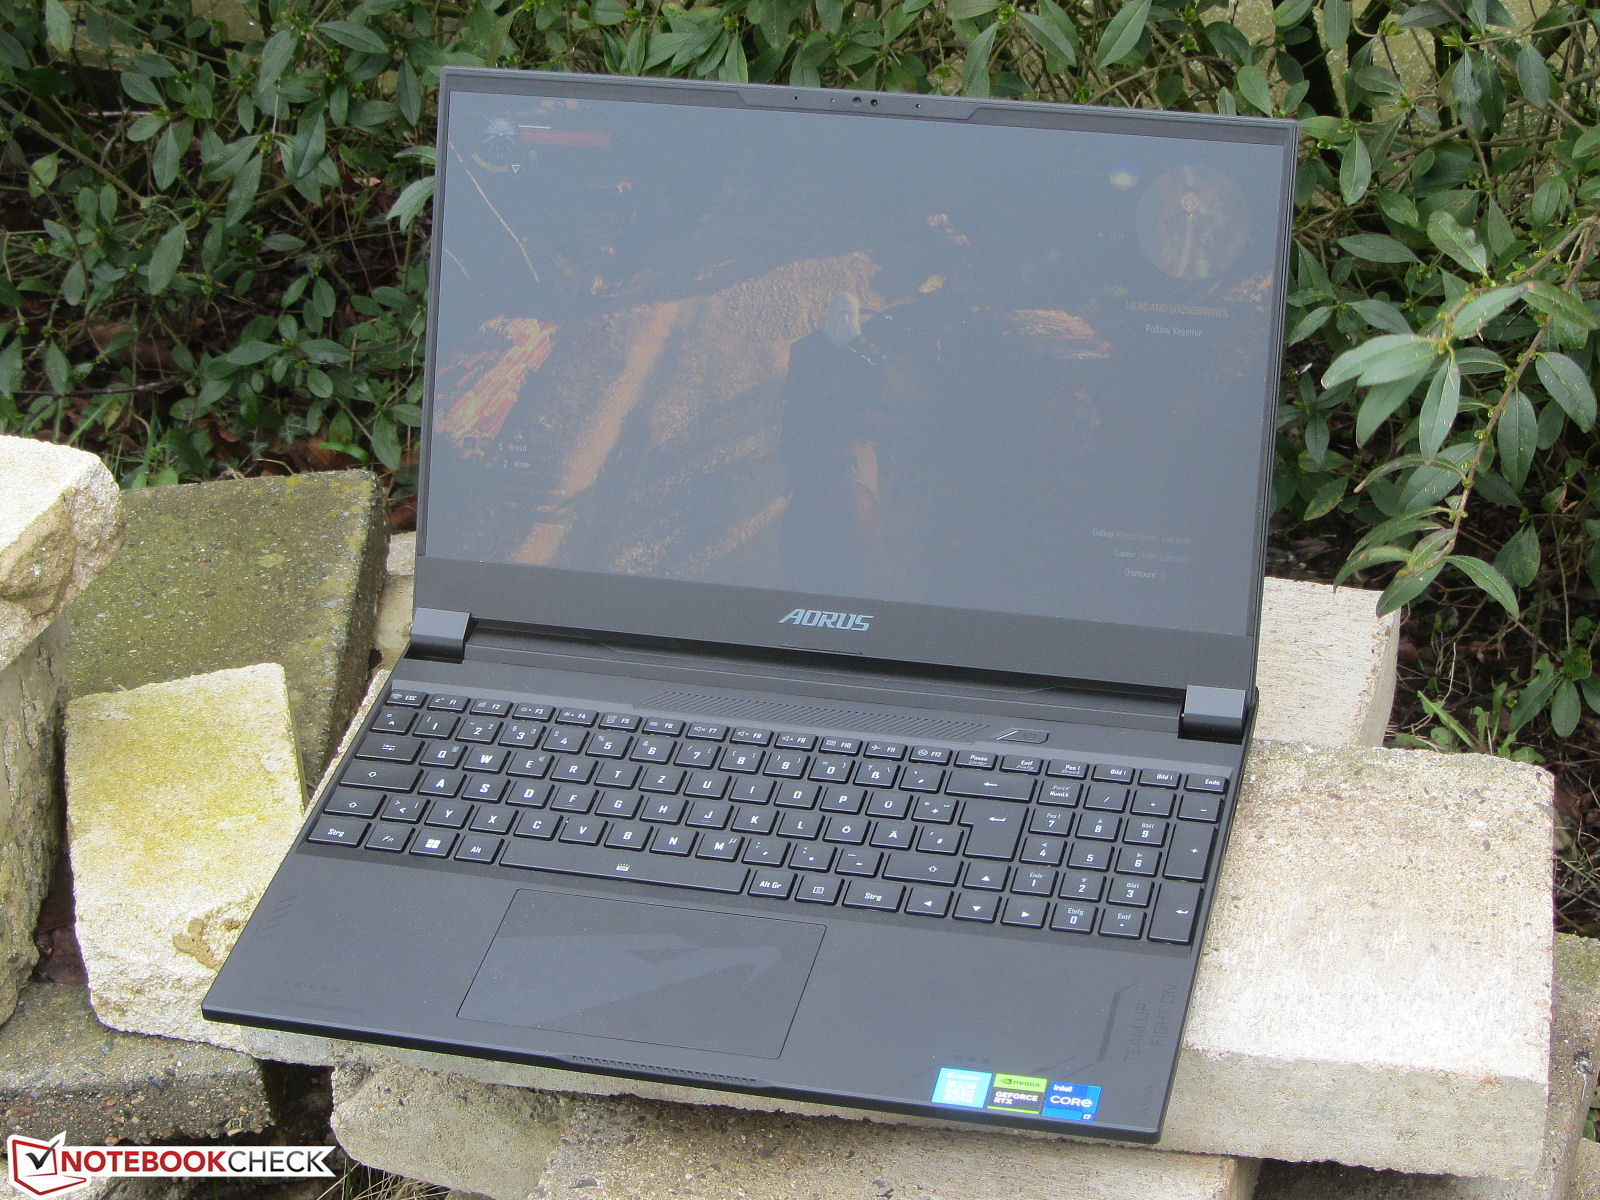
Carcasa - Gigabyte utiliza una mezcla de materiales
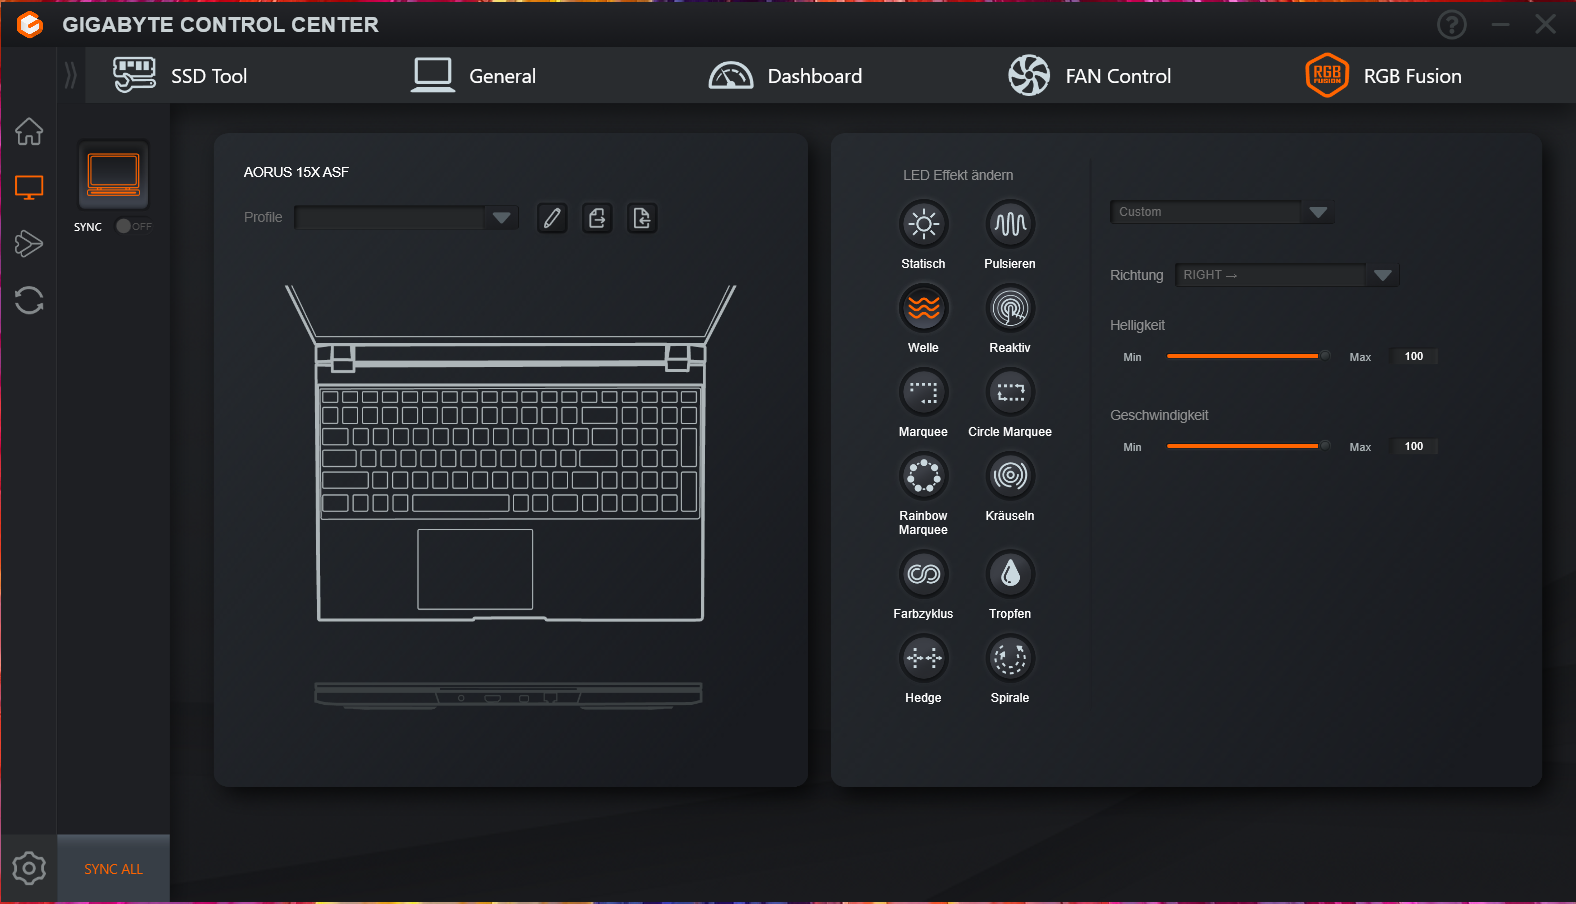
Sólo la parte trasera de la tapa es de metal negro mate, la unidad base es de plástico. Gigabyte no ha añadido ningún adorno visual extravagante aparte del patrón grabado en la superficie lisa de la carcasa. Una tira de LED (RGB, personalizable) en la parte posterior de la unidad base y las teclas iluminadas (RGB) añaden un toque de color al dispositivo.
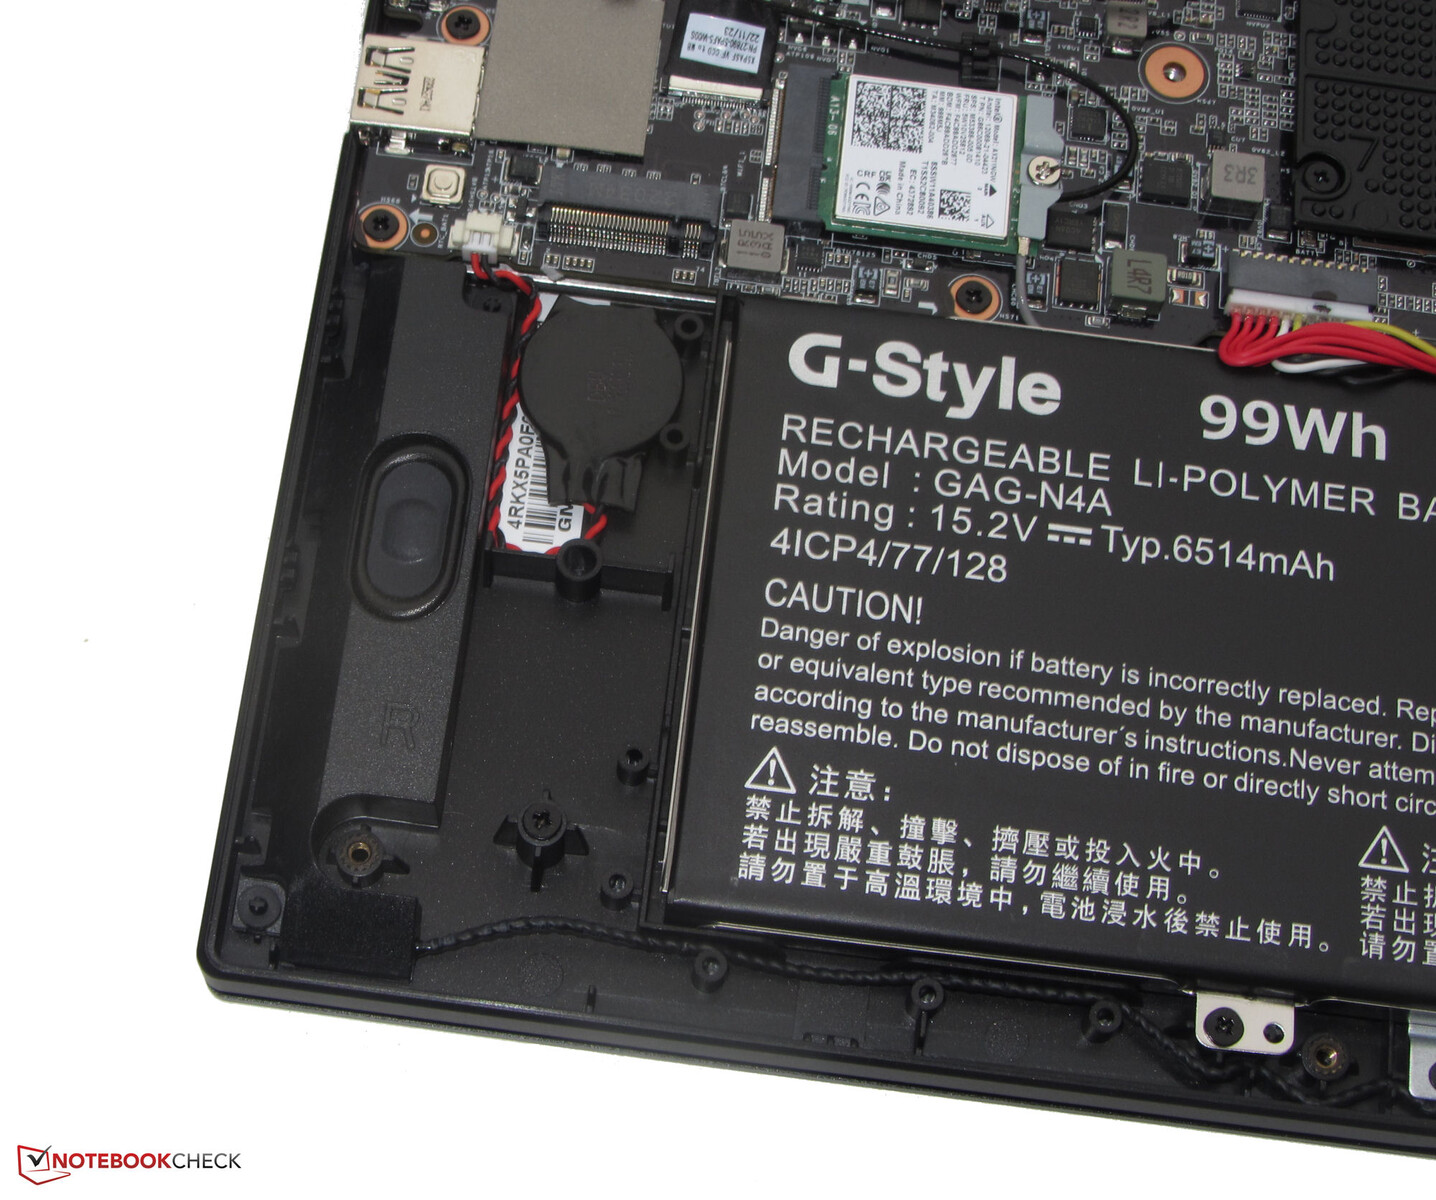
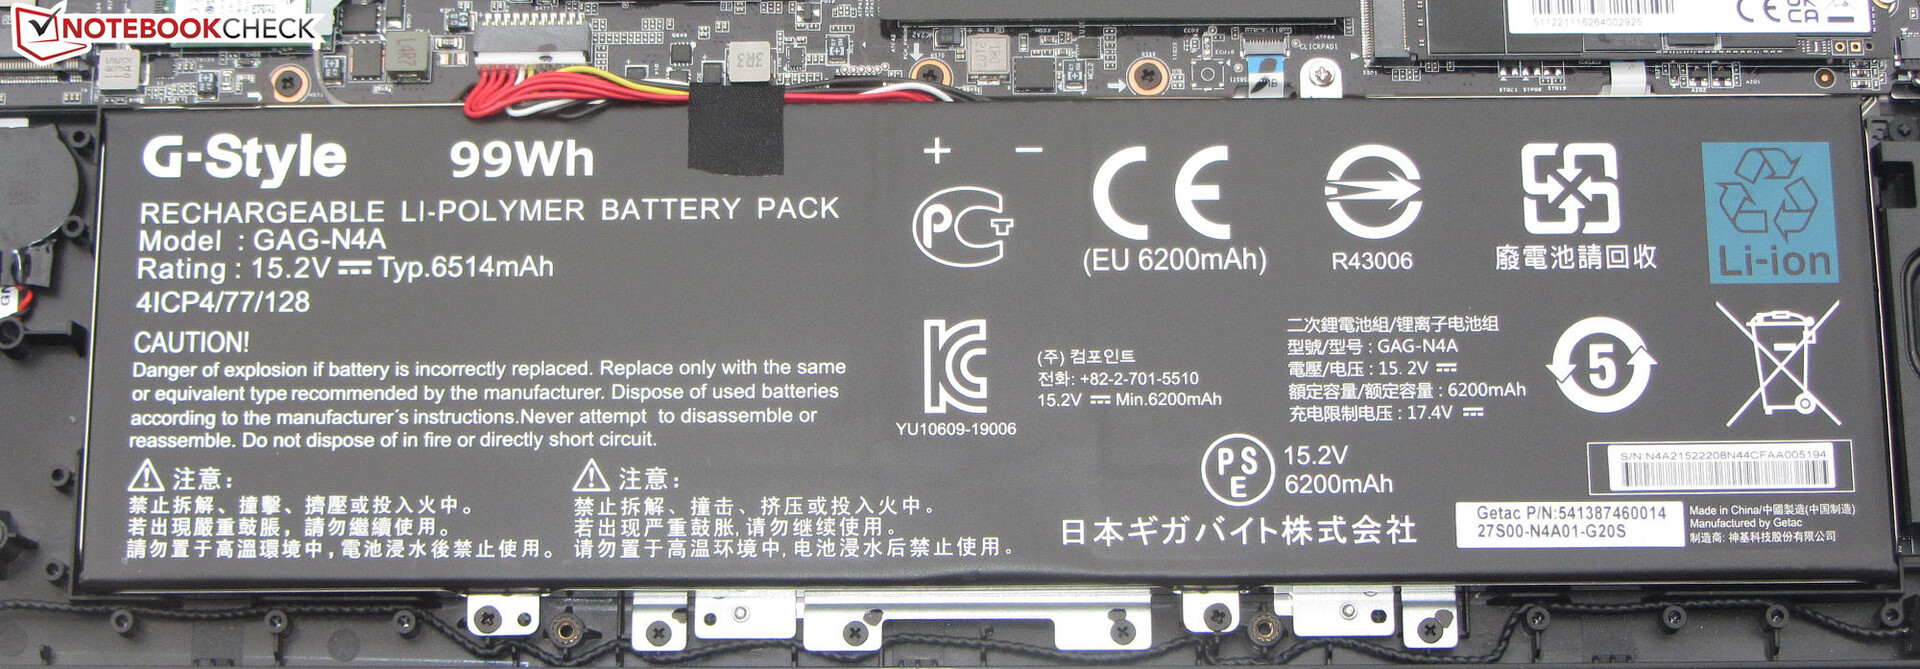
La carcasa está ensamblada a la perfección: no hay excesos de material y las dimensiones de los huecos son correctas. La unidad base sólo puede torcerse ligeramente, la tapa más. Pero todo esto se mantiene dentro de un rango normal. Se puede acceder a la batería (atornillada, no pegada) y al resto de las entrañas del portátil cuando se retira la carcasa inferior. Las bisagras mantienen la tapa firmemente en su sitio y el ángulo máximo de apertura es de unos 130 grados. Es posible abrir la tapa con una sola mano.
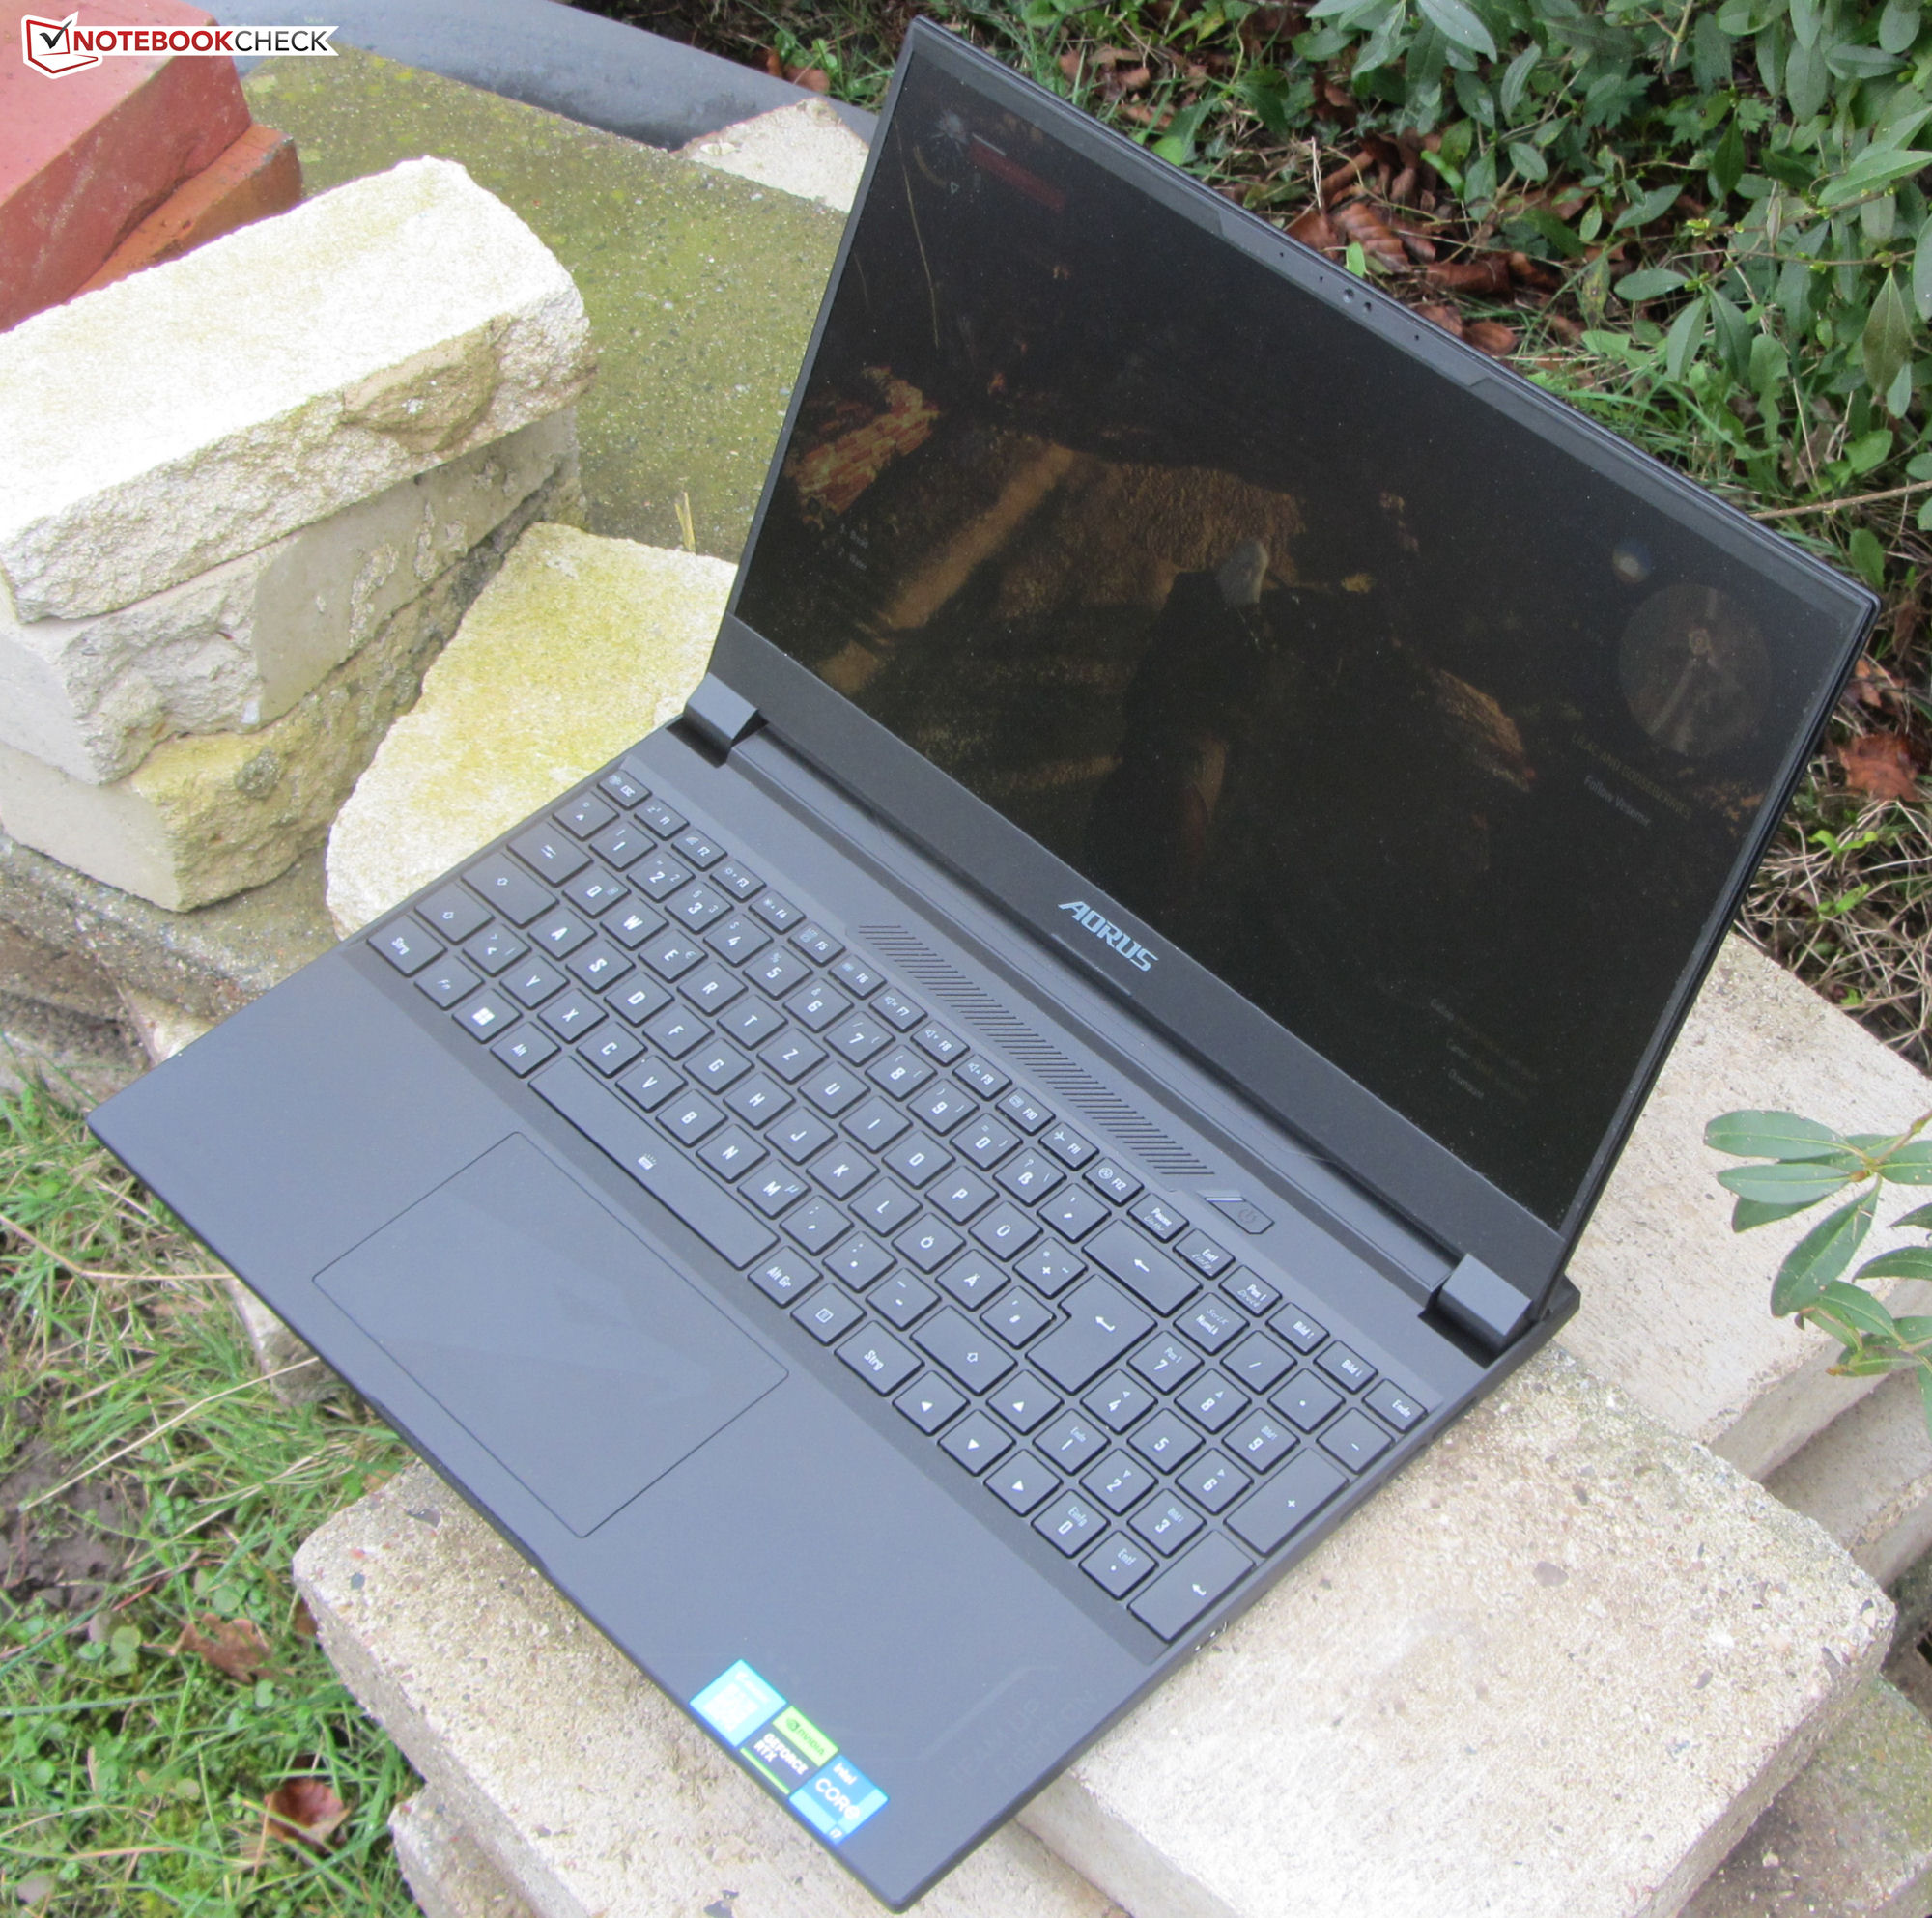
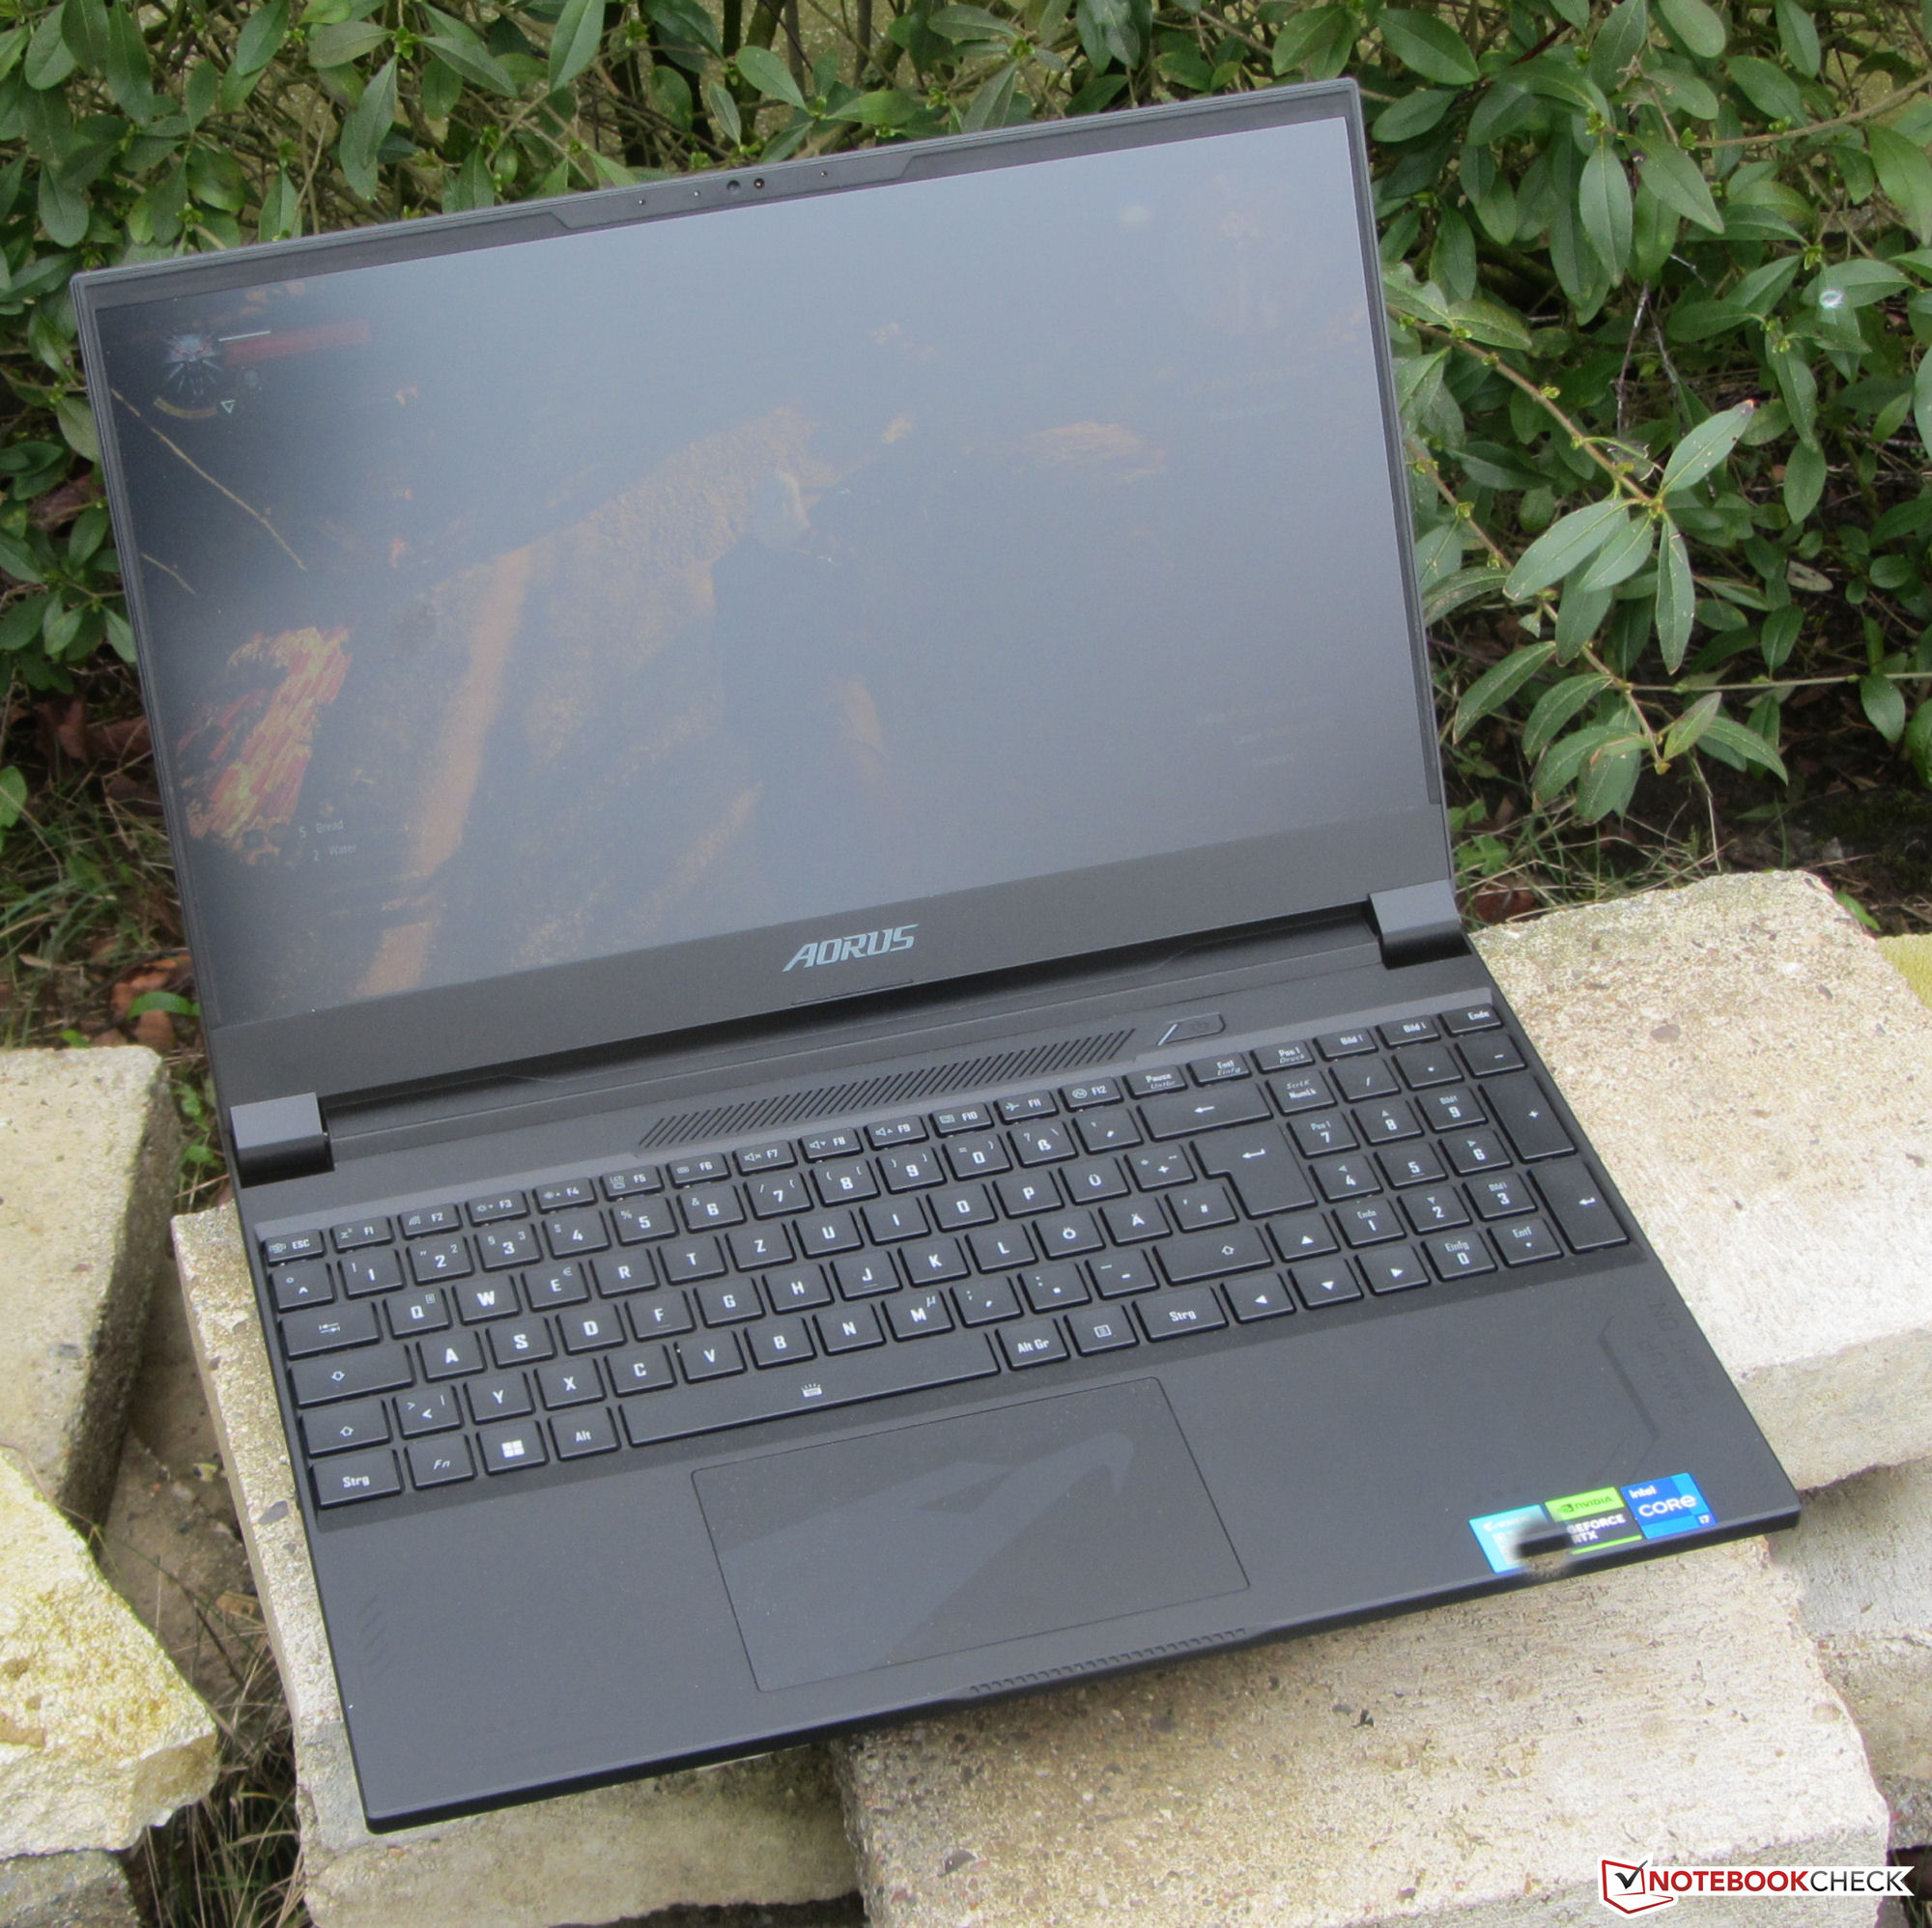
El 15X puede situarse más o menos en la gama media de todos los portátiles de 15,6 pulgadas: Ni es compacto, ni es especialmente grande. Lo mismo puede decirse de su peso.
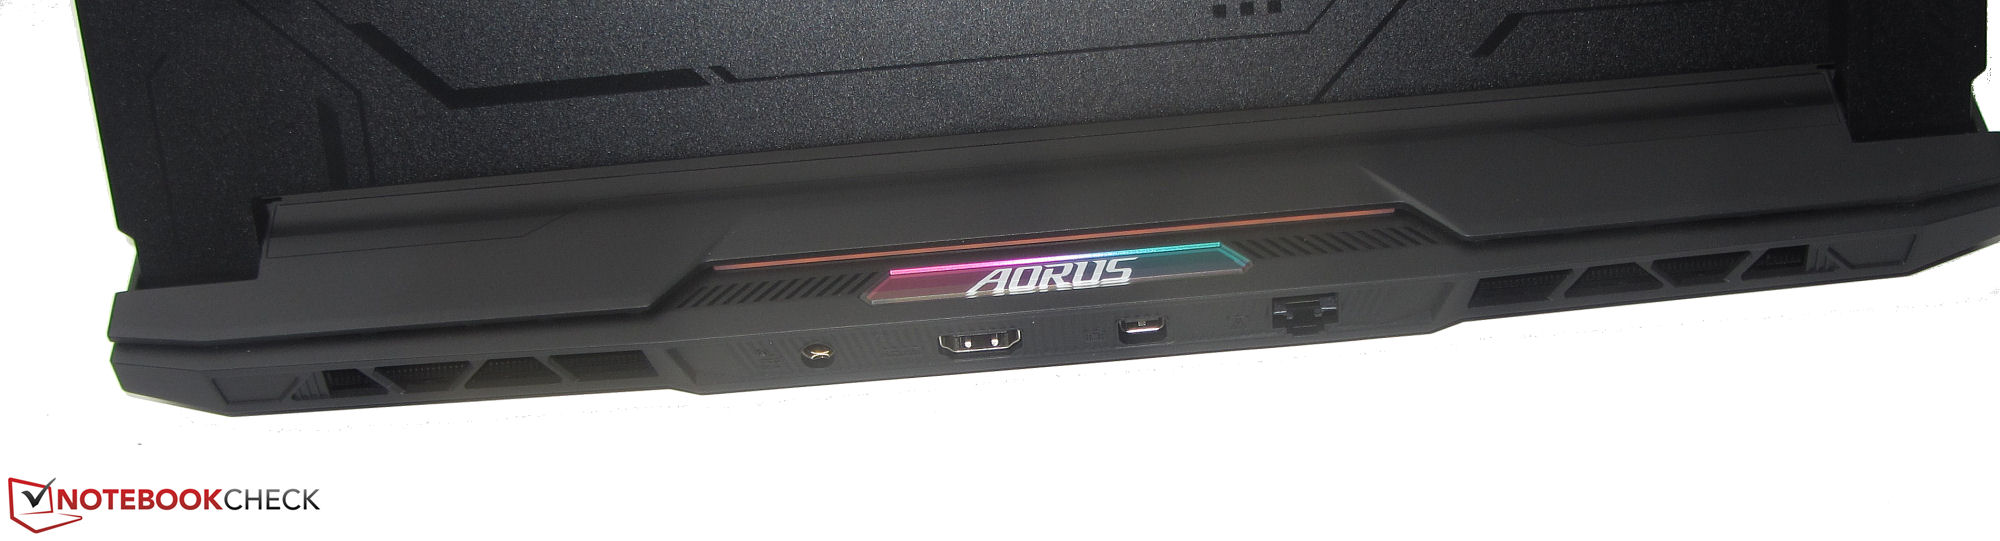
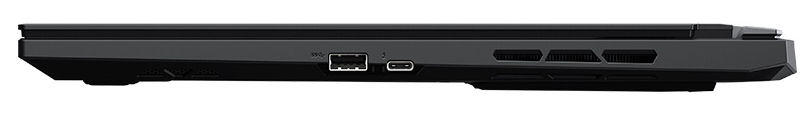
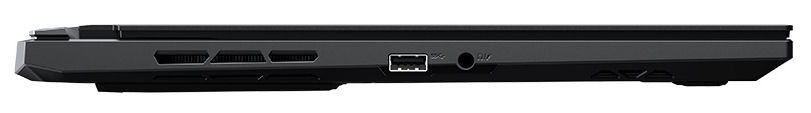
Conectividad: el ordenador Aorus incorpora Thunderbolt 4
El 15X tiene dos puertos USB-A (USB 3.2 Gen 2) y un puerto USB-C (Thunderbolt 4). Este último soporta Power Delivery y puede emitir una señal DisplayPort. Esto, junto con el puerto HDMI (2.1) y el Mini DisplayPort dedicado (1.4), hacen tres salidas de vídeo. El ordenador no dispone de lector de tarjetas SD.
Las dos salidas de vídeo dedicadas, así como el puerto ethernet, se encuentran en la parte trasera del dispositivo. Esto significa que los cables no le estorbarán cuando utilice el portátil.

Comunicación
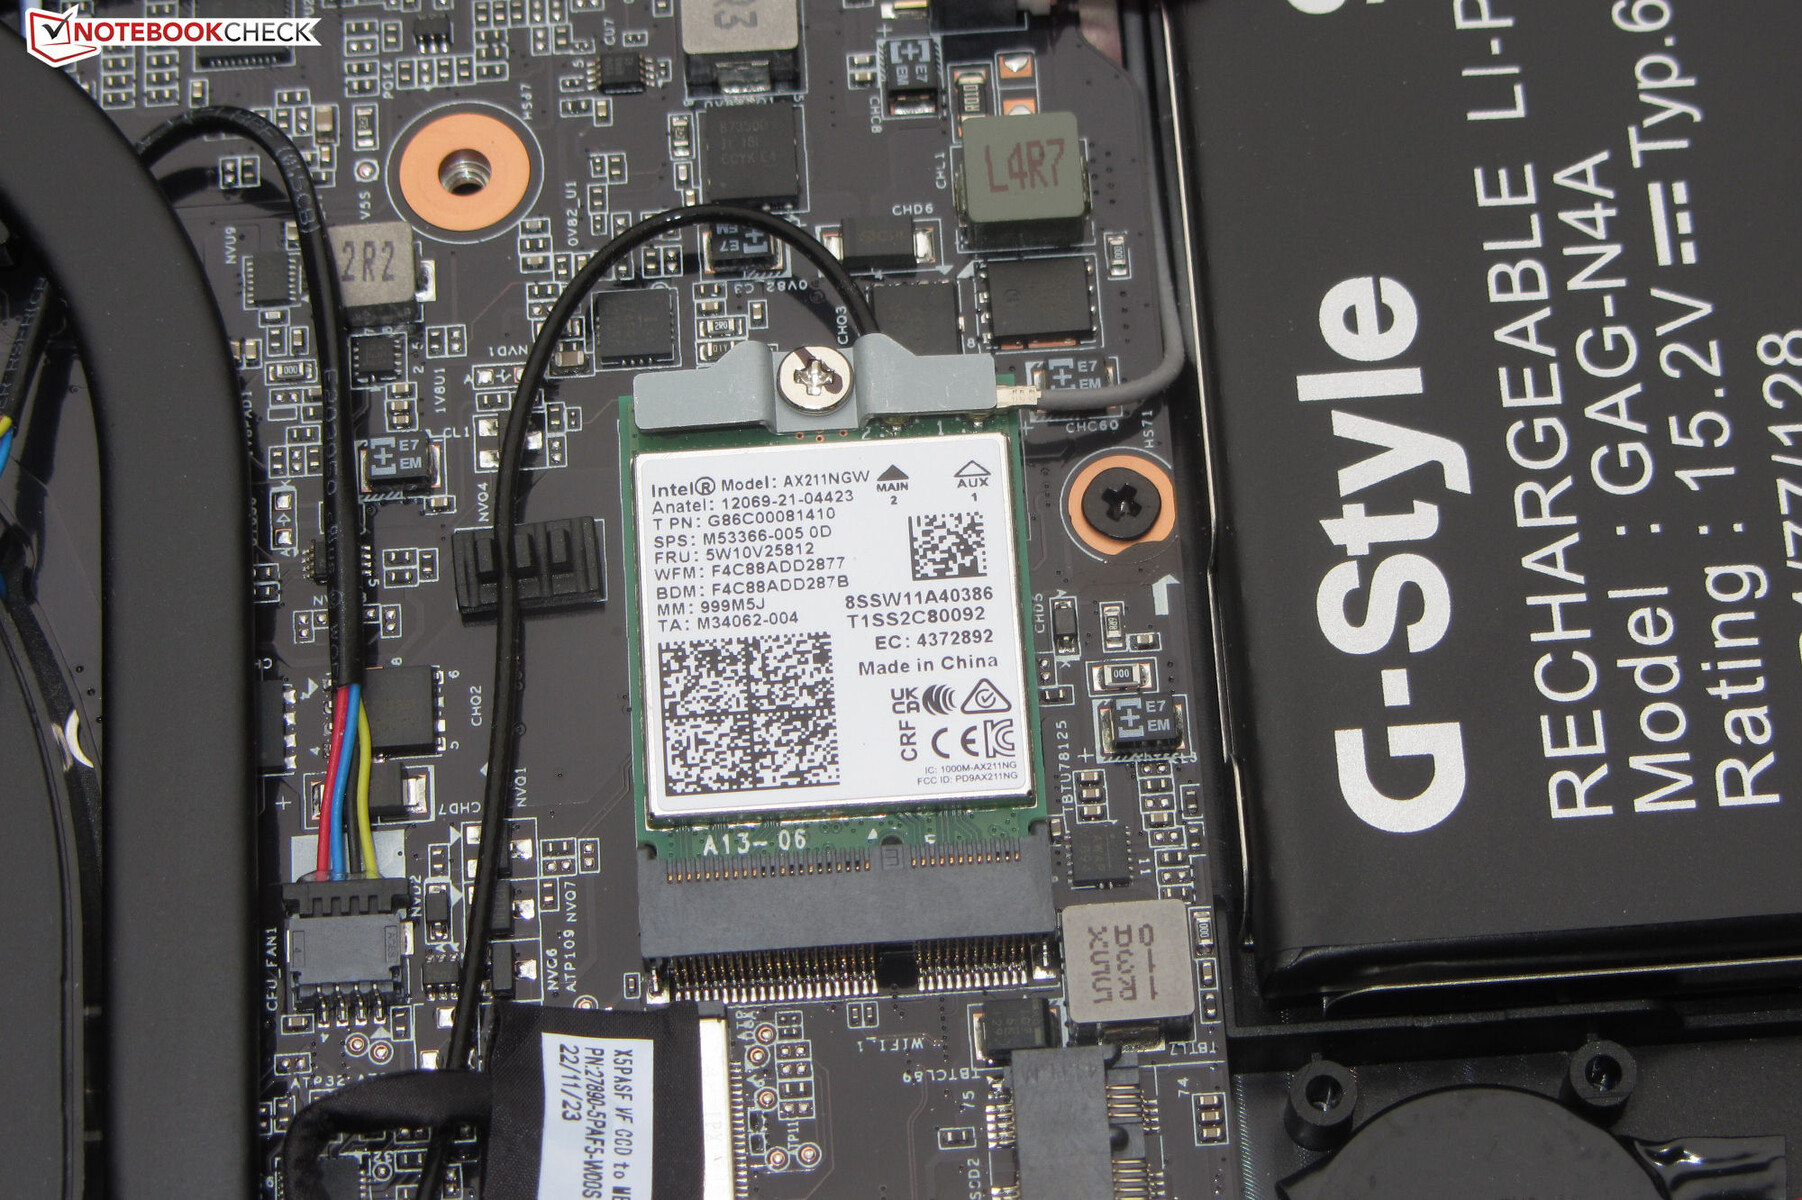
En condiciones óptimas (sin dispositivos WLAN adicionales en las cercanías, poca distancia entre el portátil y el PC servidor), las tasas de transferencia WLAN del portátil son buenas, sin embargo, se quedan ligeramente por debajo de la media considerando lo que es posible con este chip Wi-Fi (Intel AX211; Wi-Fi 6E). La conexión a la red por cable es posible gracias a un chip Gigabit Ethernet (RTL8125; 2,5 Gbit) de Realtek.
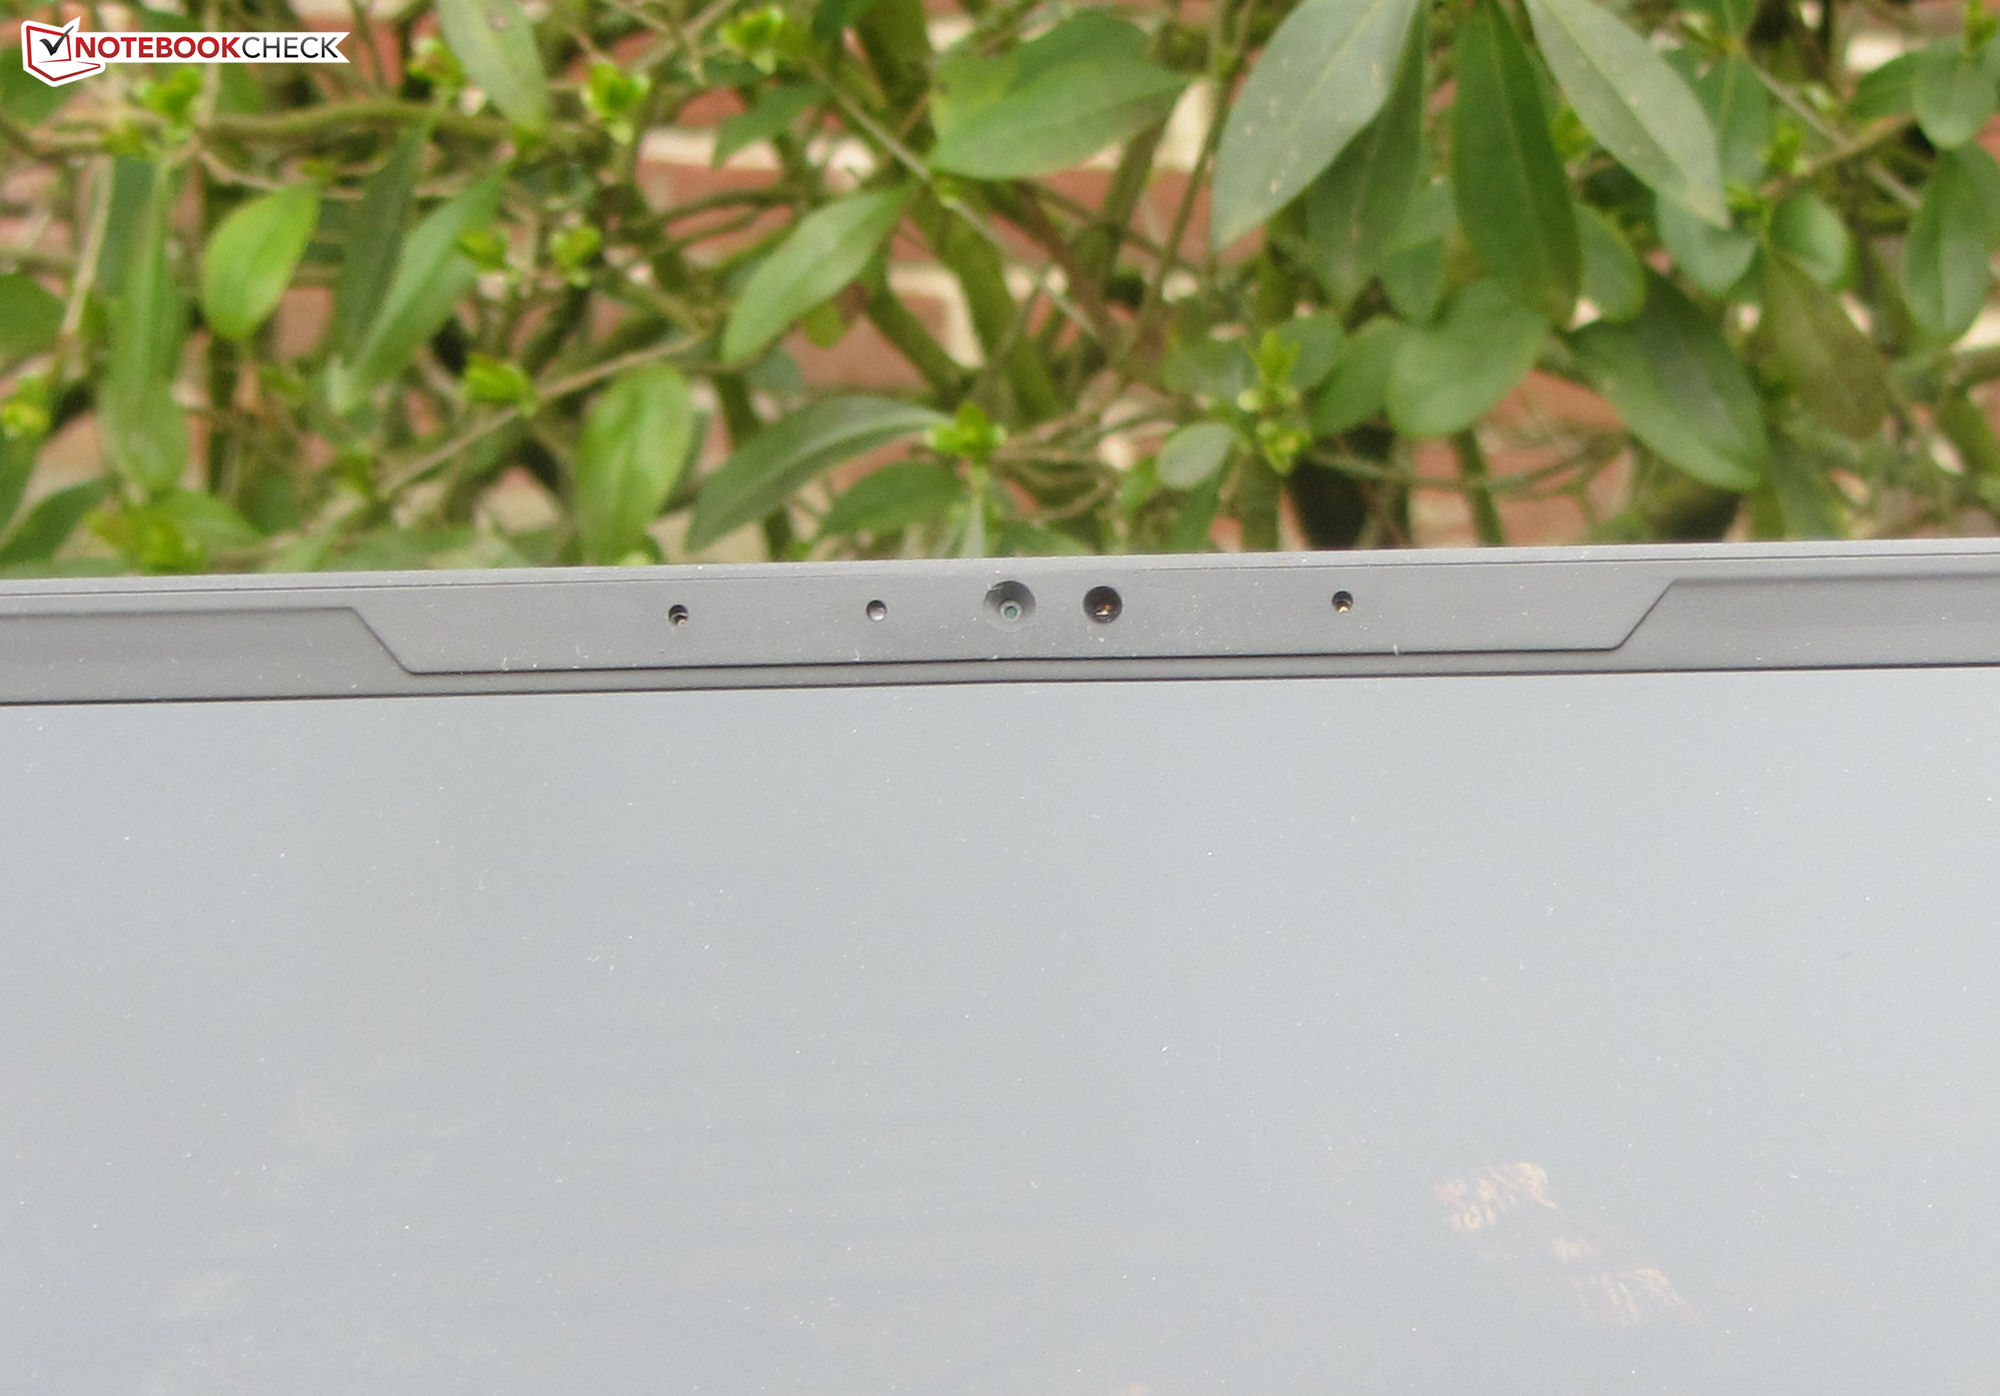
Cámara web
La webcam del dispositivo (2,1 MP, máx. 1.920 x 1.080 píxeles) no tiene tapa, sin embargo, su calidad es bastante estándar. Le cuesta un poco la precisión del color: Su desviación de color de 11 hace que caiga dentro de un rango inaceptable (deseable: DeltaE inferior a 3).


Accesorios
Además de los documentos habituales (guía de inicio rápido e información sobre la garantía), el portátil no incluye ningún accesorio adicional.
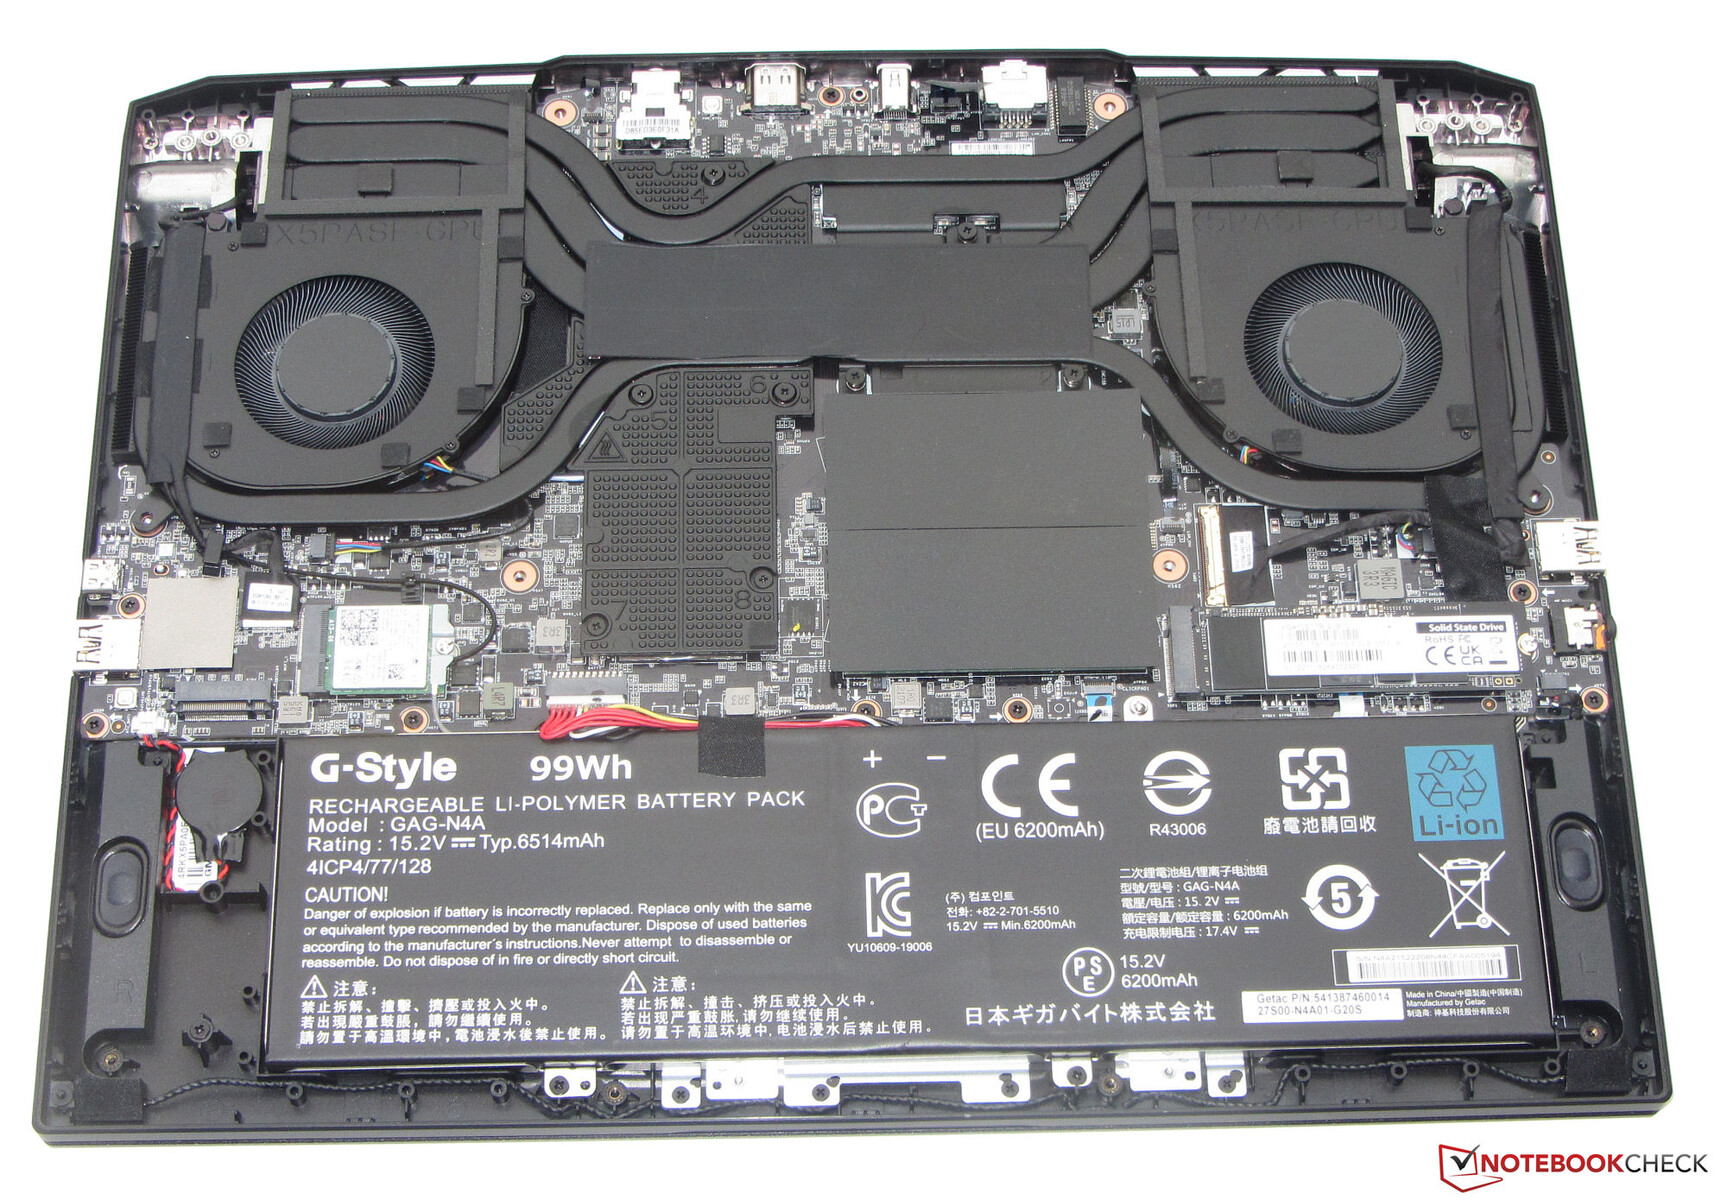
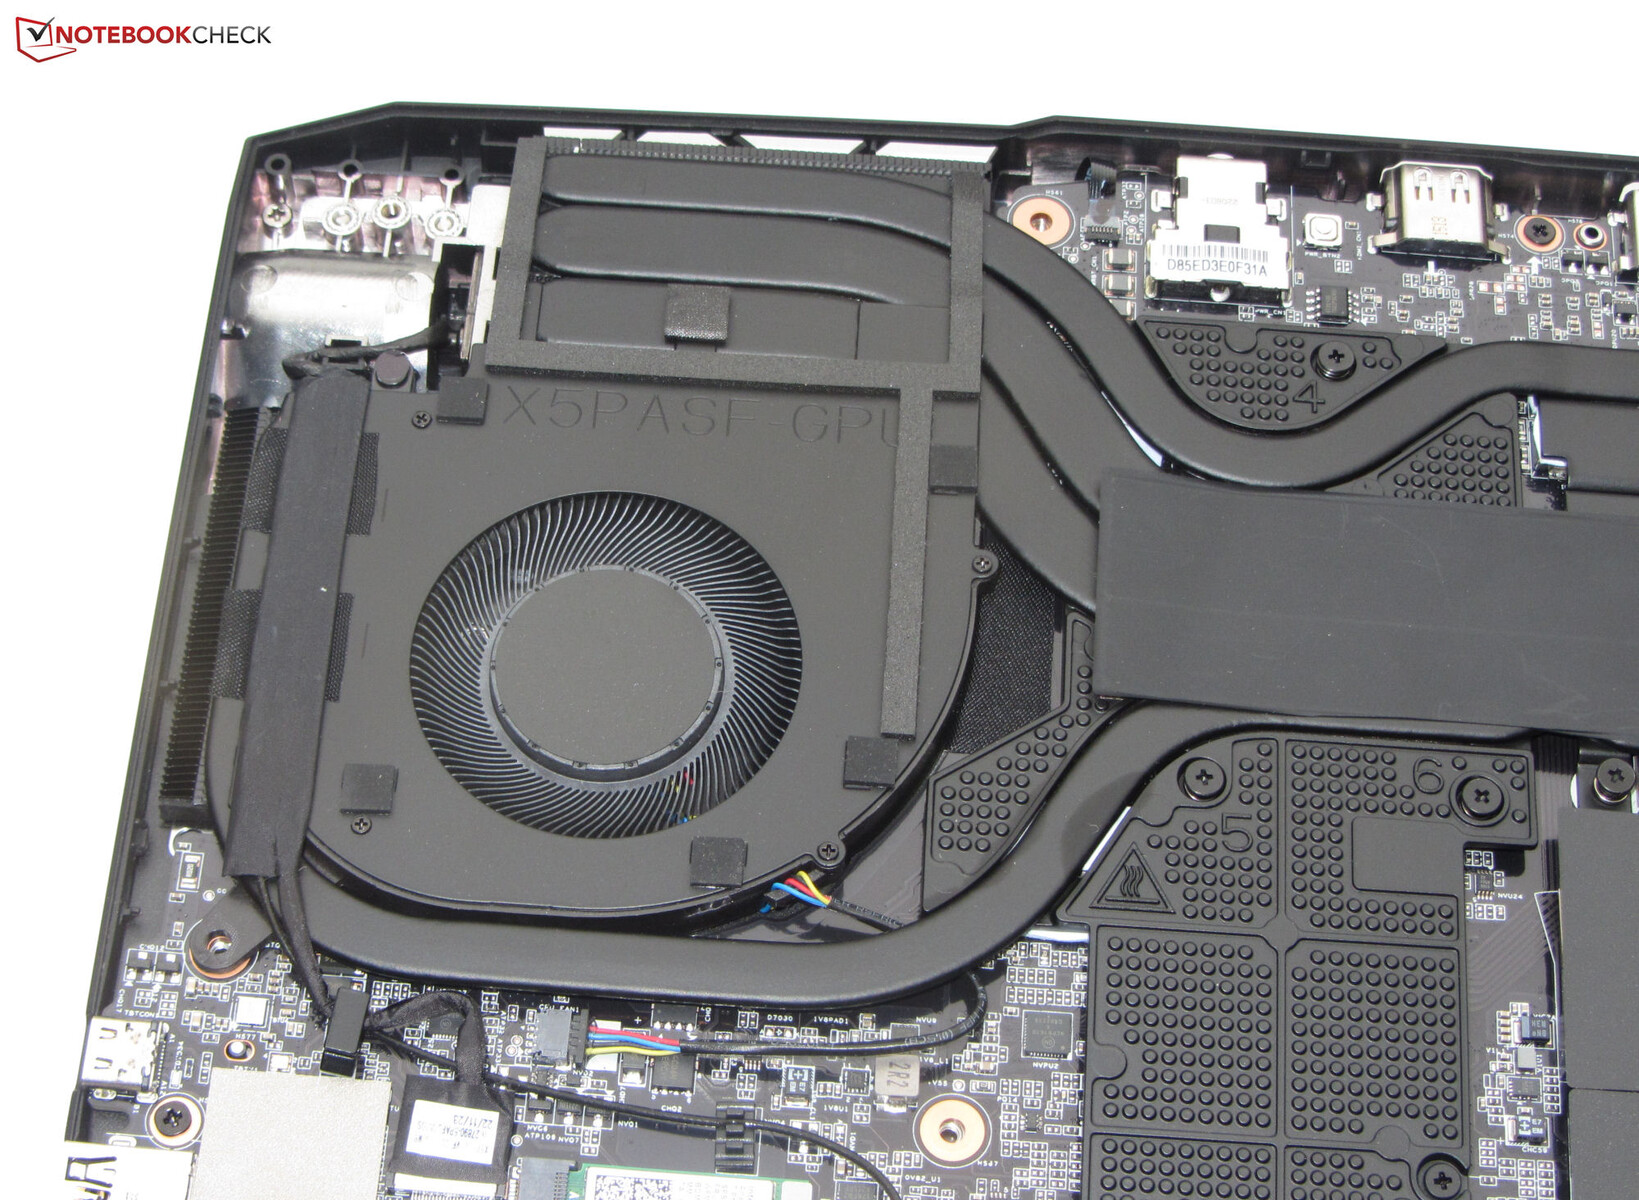
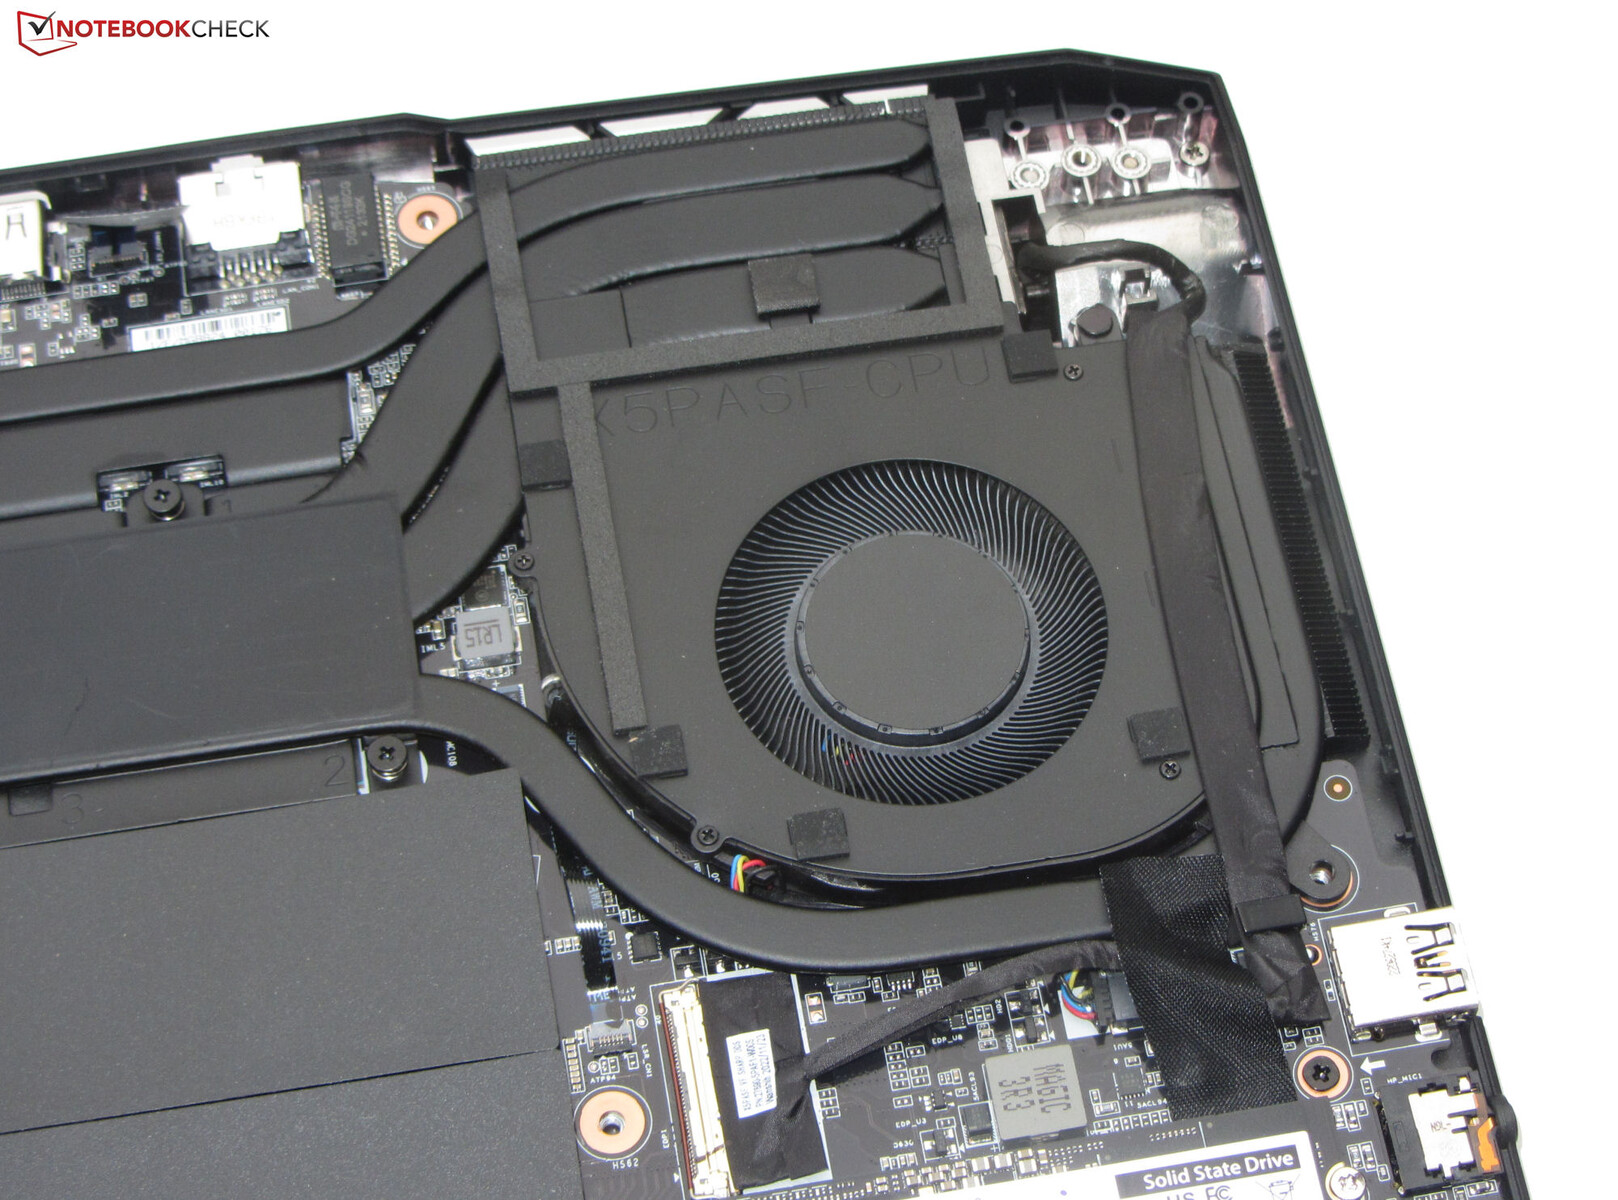
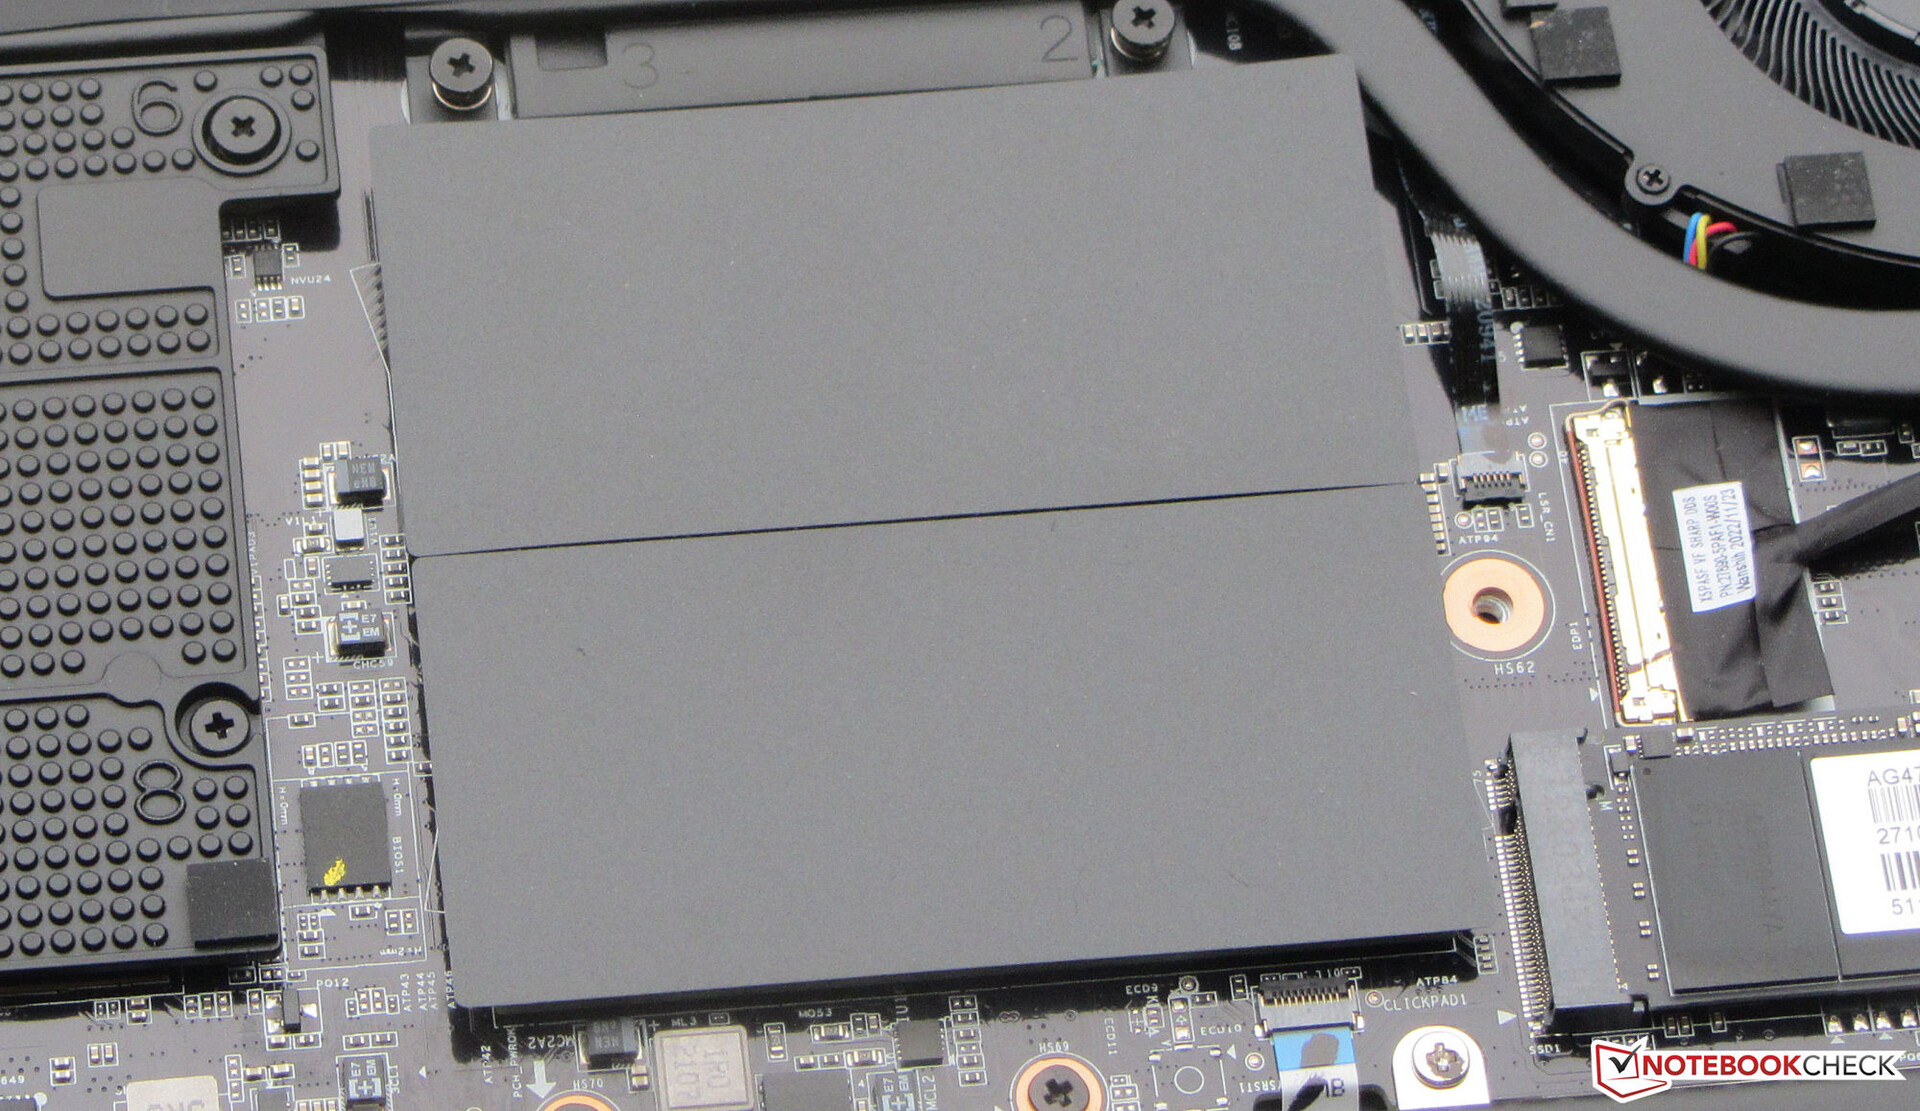
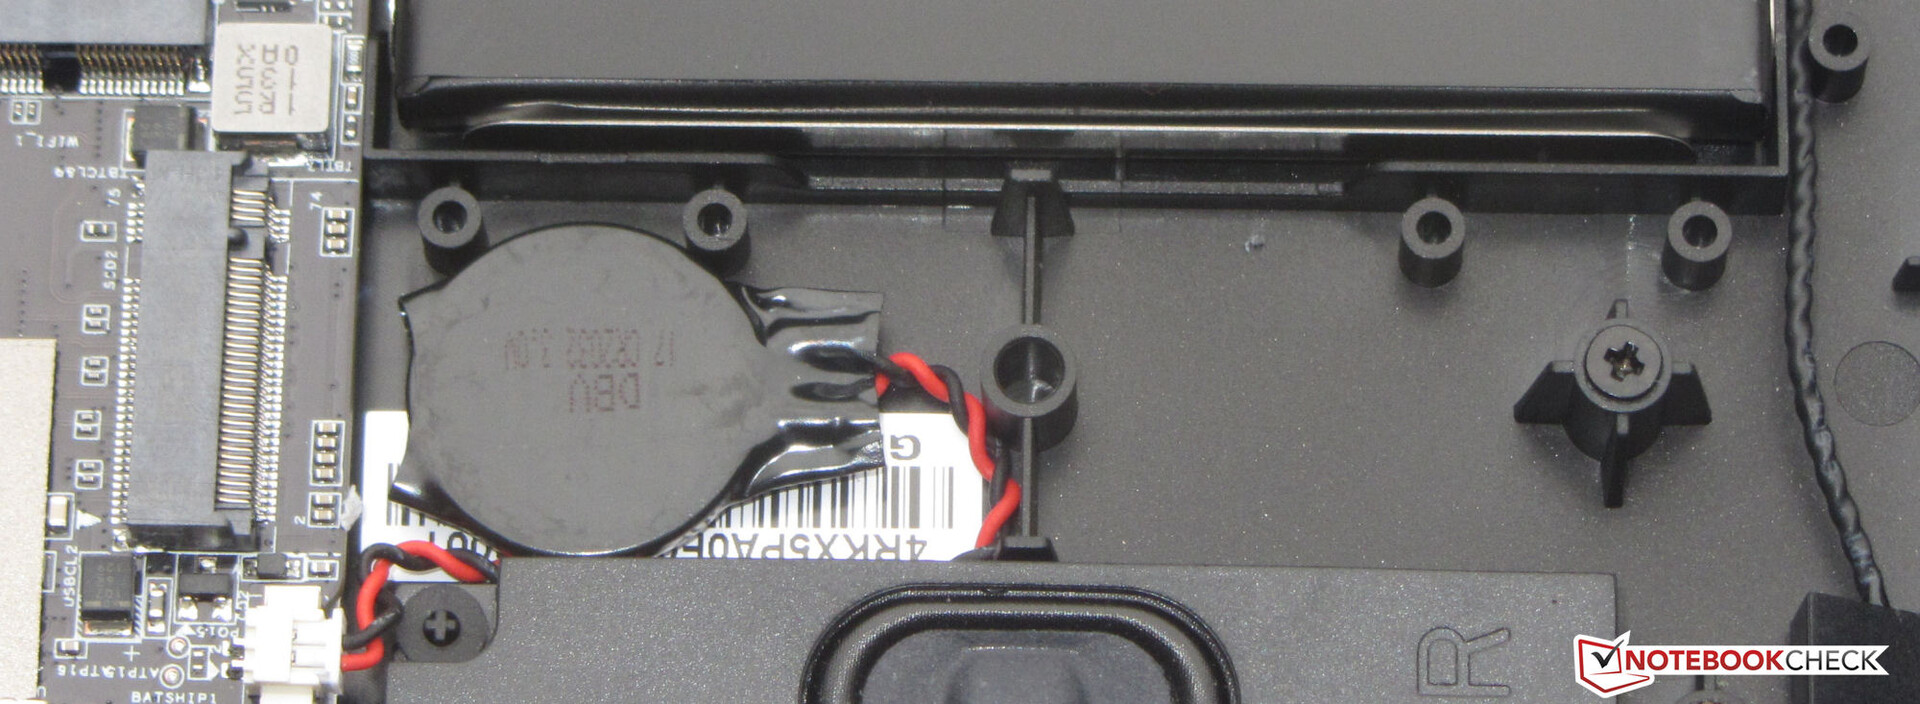
Mantenimiento
Una vez retirados todos los tornillos de la parte inferior del dispositivo, se puede retirar la carcasa inferior con la ayuda de una espátula plana o una espátula de paleta. Posteriormente, se puede acceder a las ranuras de RAM (ambas en uso), SSD (PCIe 4), segunda ranura M.2 2280 (PCIe 4), batería BIOS, módulo WLAN, ventiladores, altavoces y la batería.
Garantía
El portátil Gigabyte de 15,6 pulgadas tiene una garantía de dos años. No hay ampliaciones de garantía disponibles.
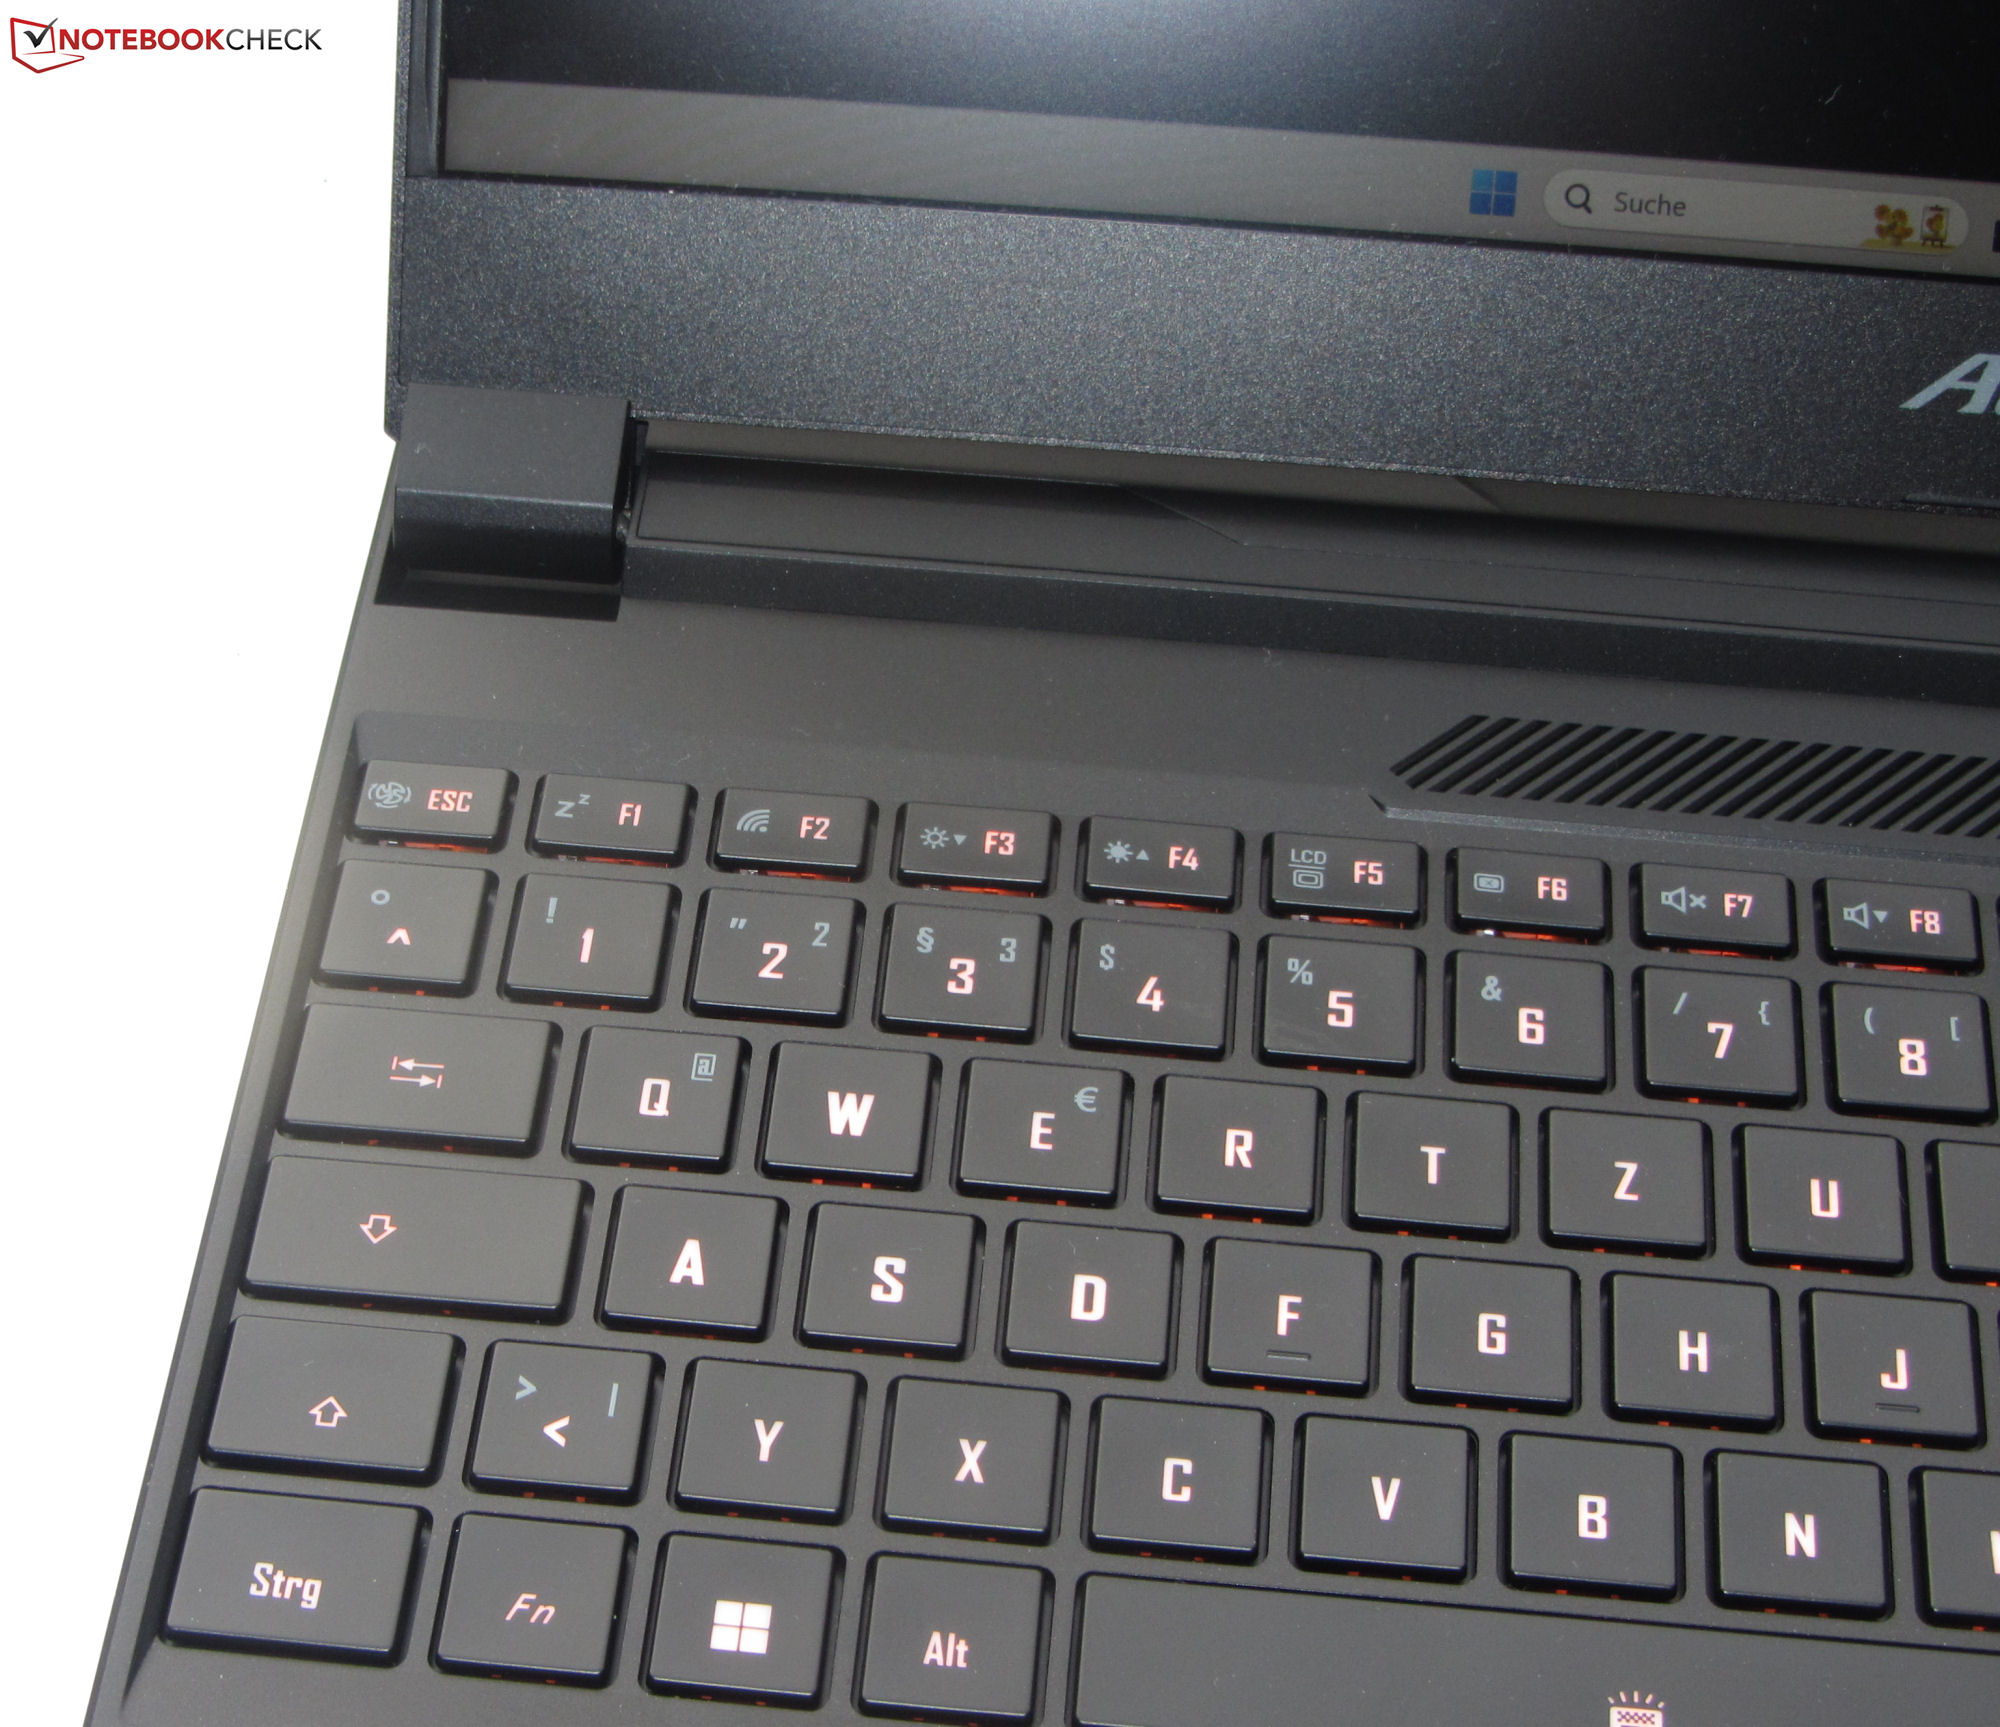
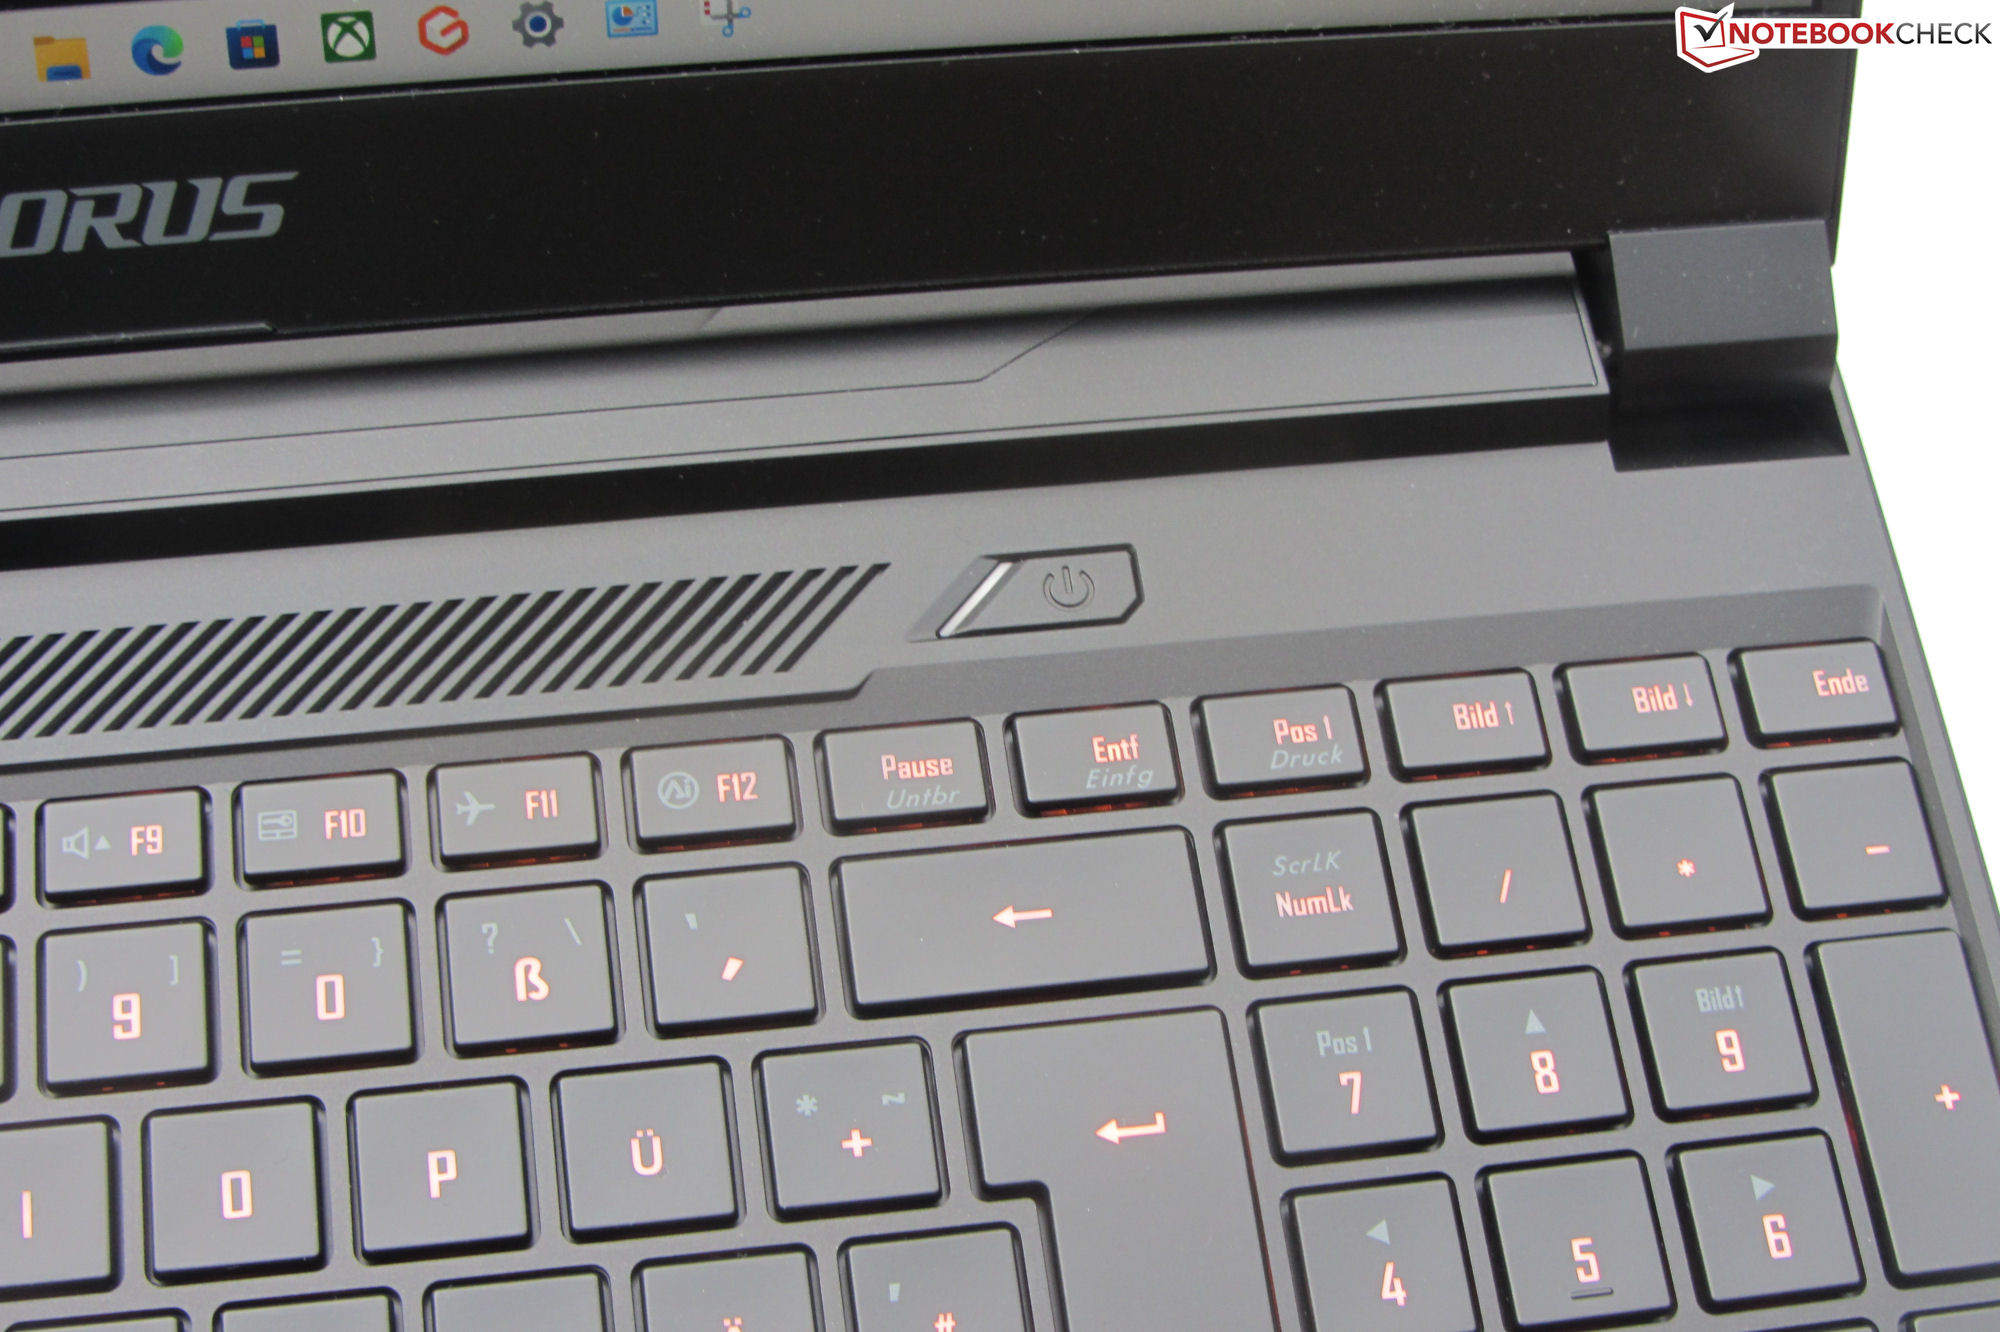
Dispositivos de entrada: un portátil para juegos con teclas iluminadas individualmente
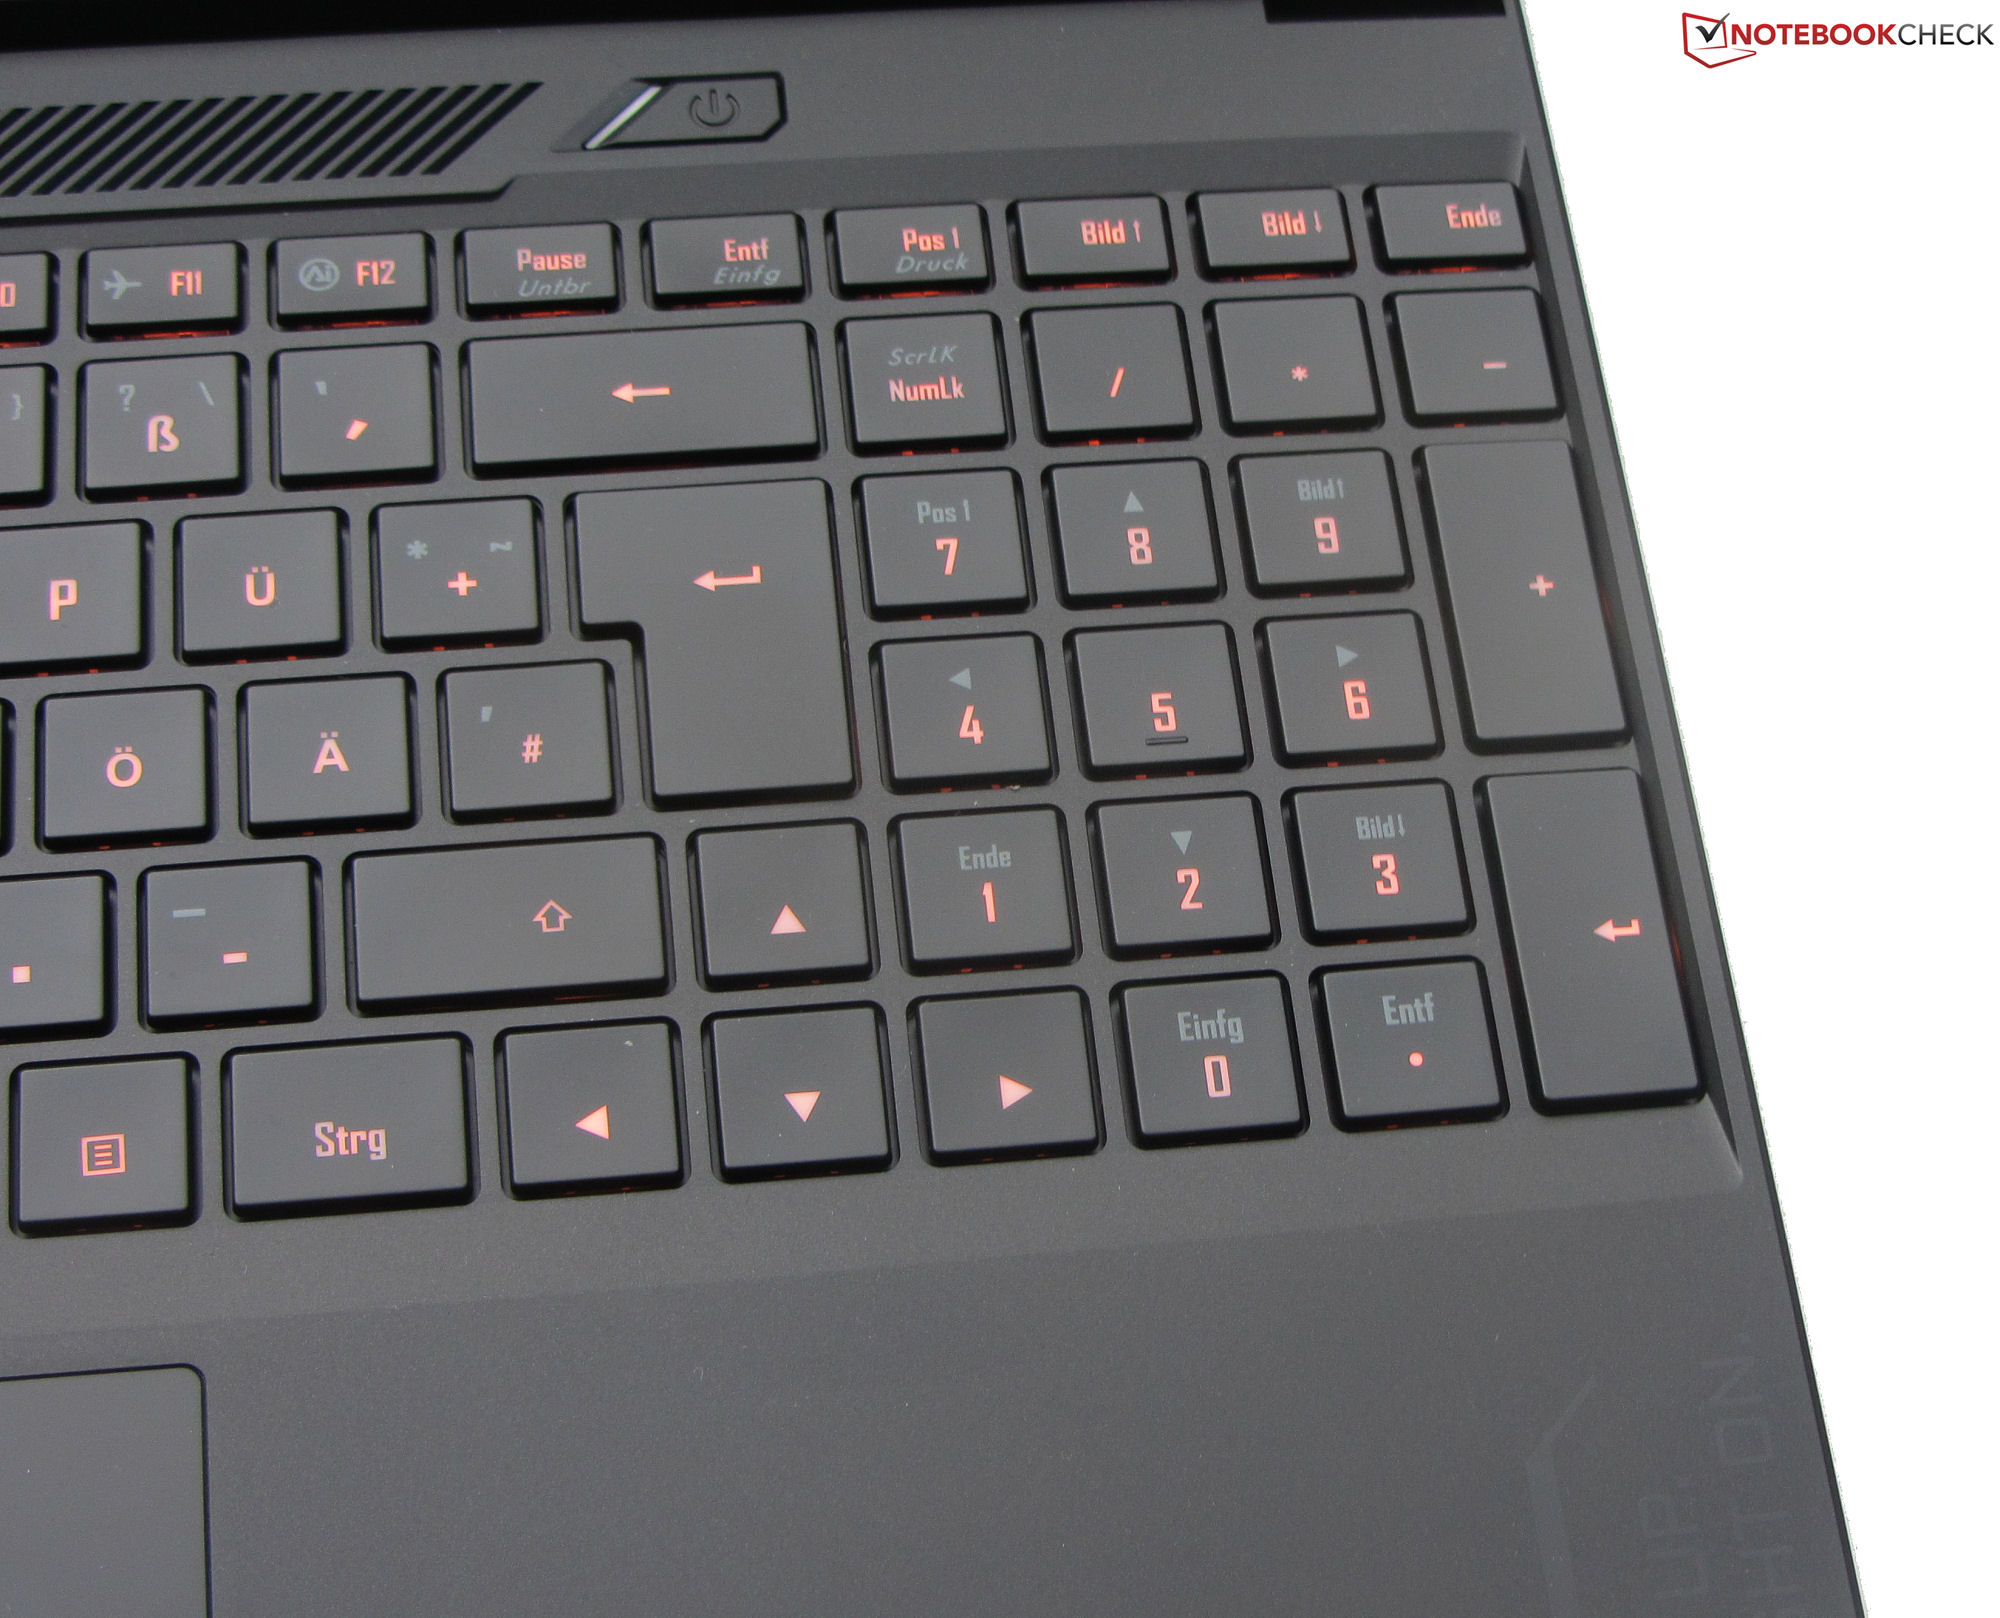
Teclado
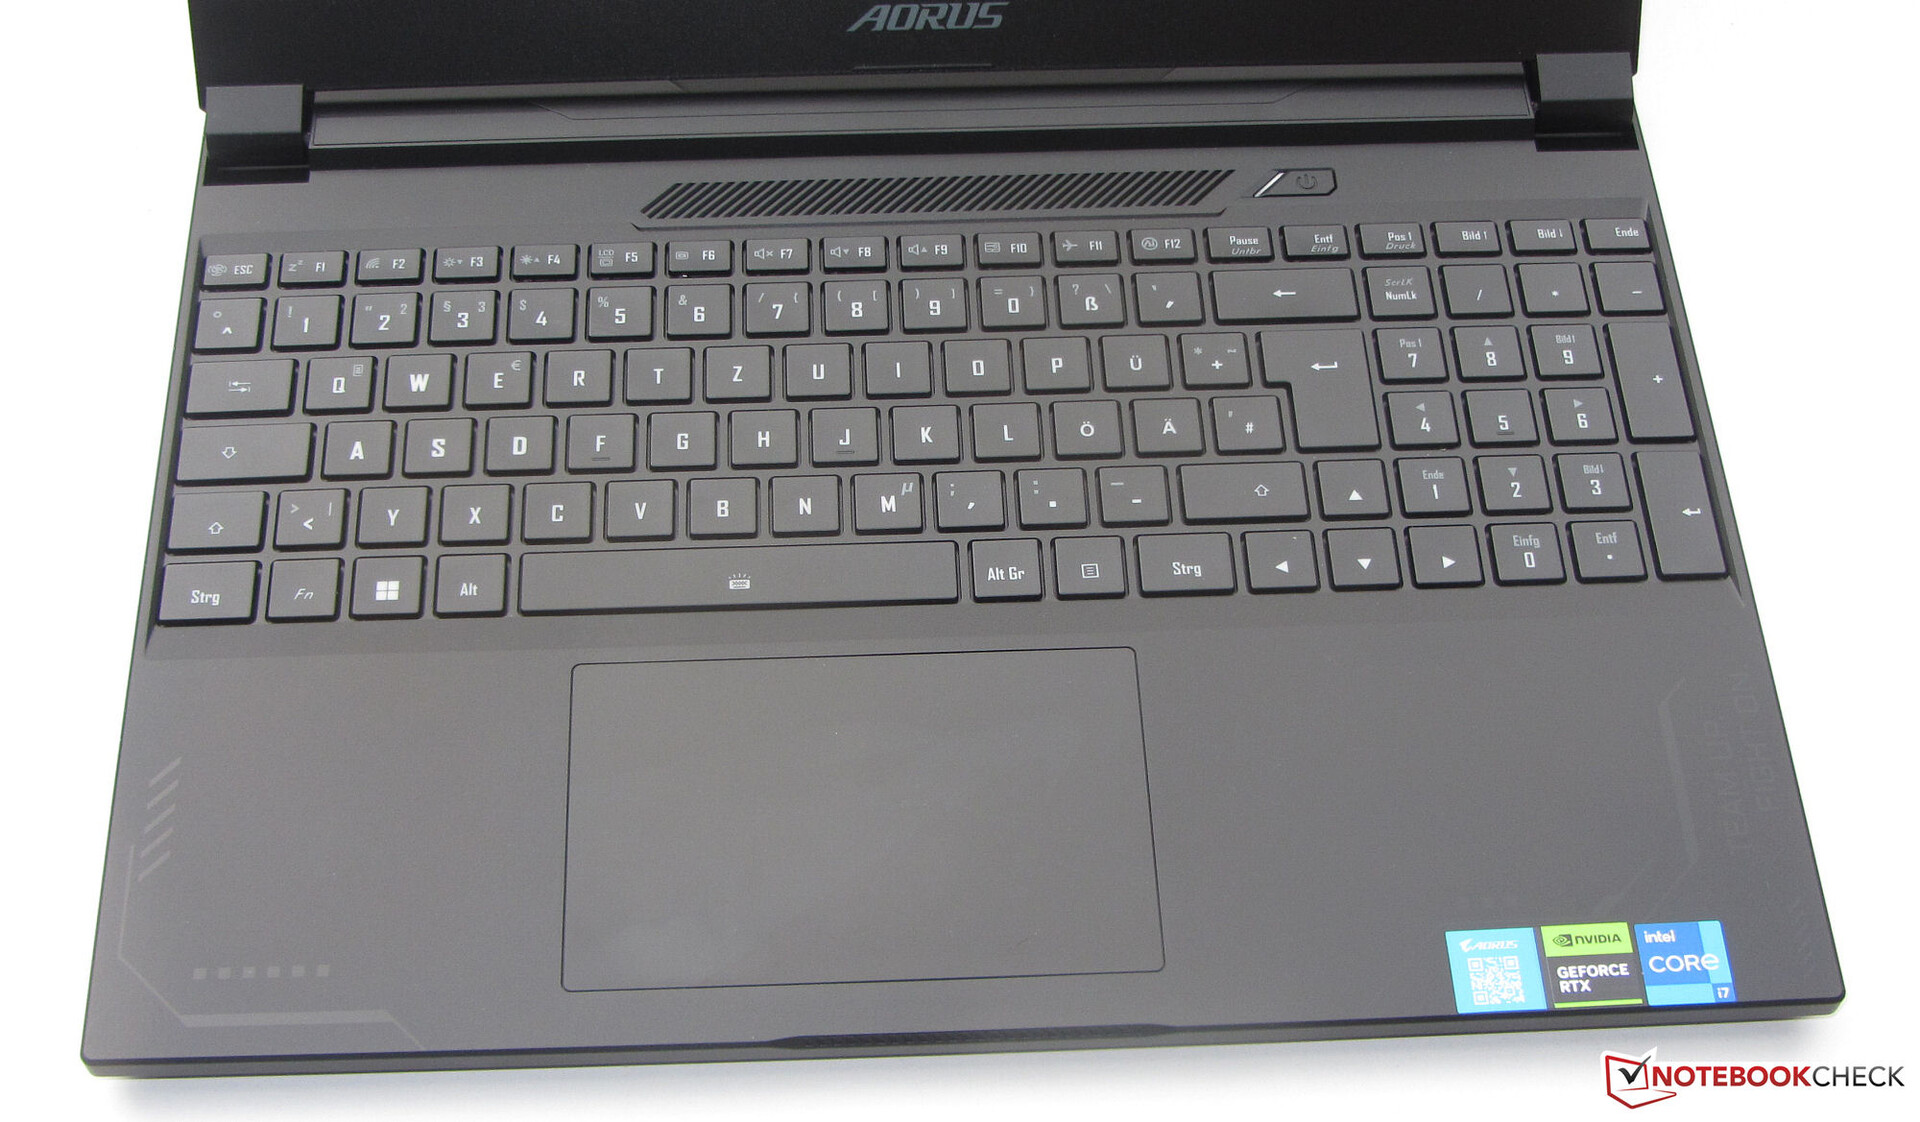
Las suaves teclas del teclado Chiclet tienen una elevación media y un punto de presión claro. Cada tecla se ilumina individualmente (tres niveles de brillo). Negativo: Las funciones secundarias de las teclas no captan la luz, por lo que apenas son legibles. Al teclear, las teclas ceden muy poco, pero no debería ser molesto. En definitiva, Gigabyte ha dotado a este dispositivo de un buen teclado para el día a día.
Panel táctil
Una almohadilla multitáctil (de unos 12,1 x 7,6 cm) sustituye al ratón en este ordenador: su superficie lisa facilita el uso. Las esquinas reaccionan a las entradas, ceden ligeramente y tienen un punto de presión claro.
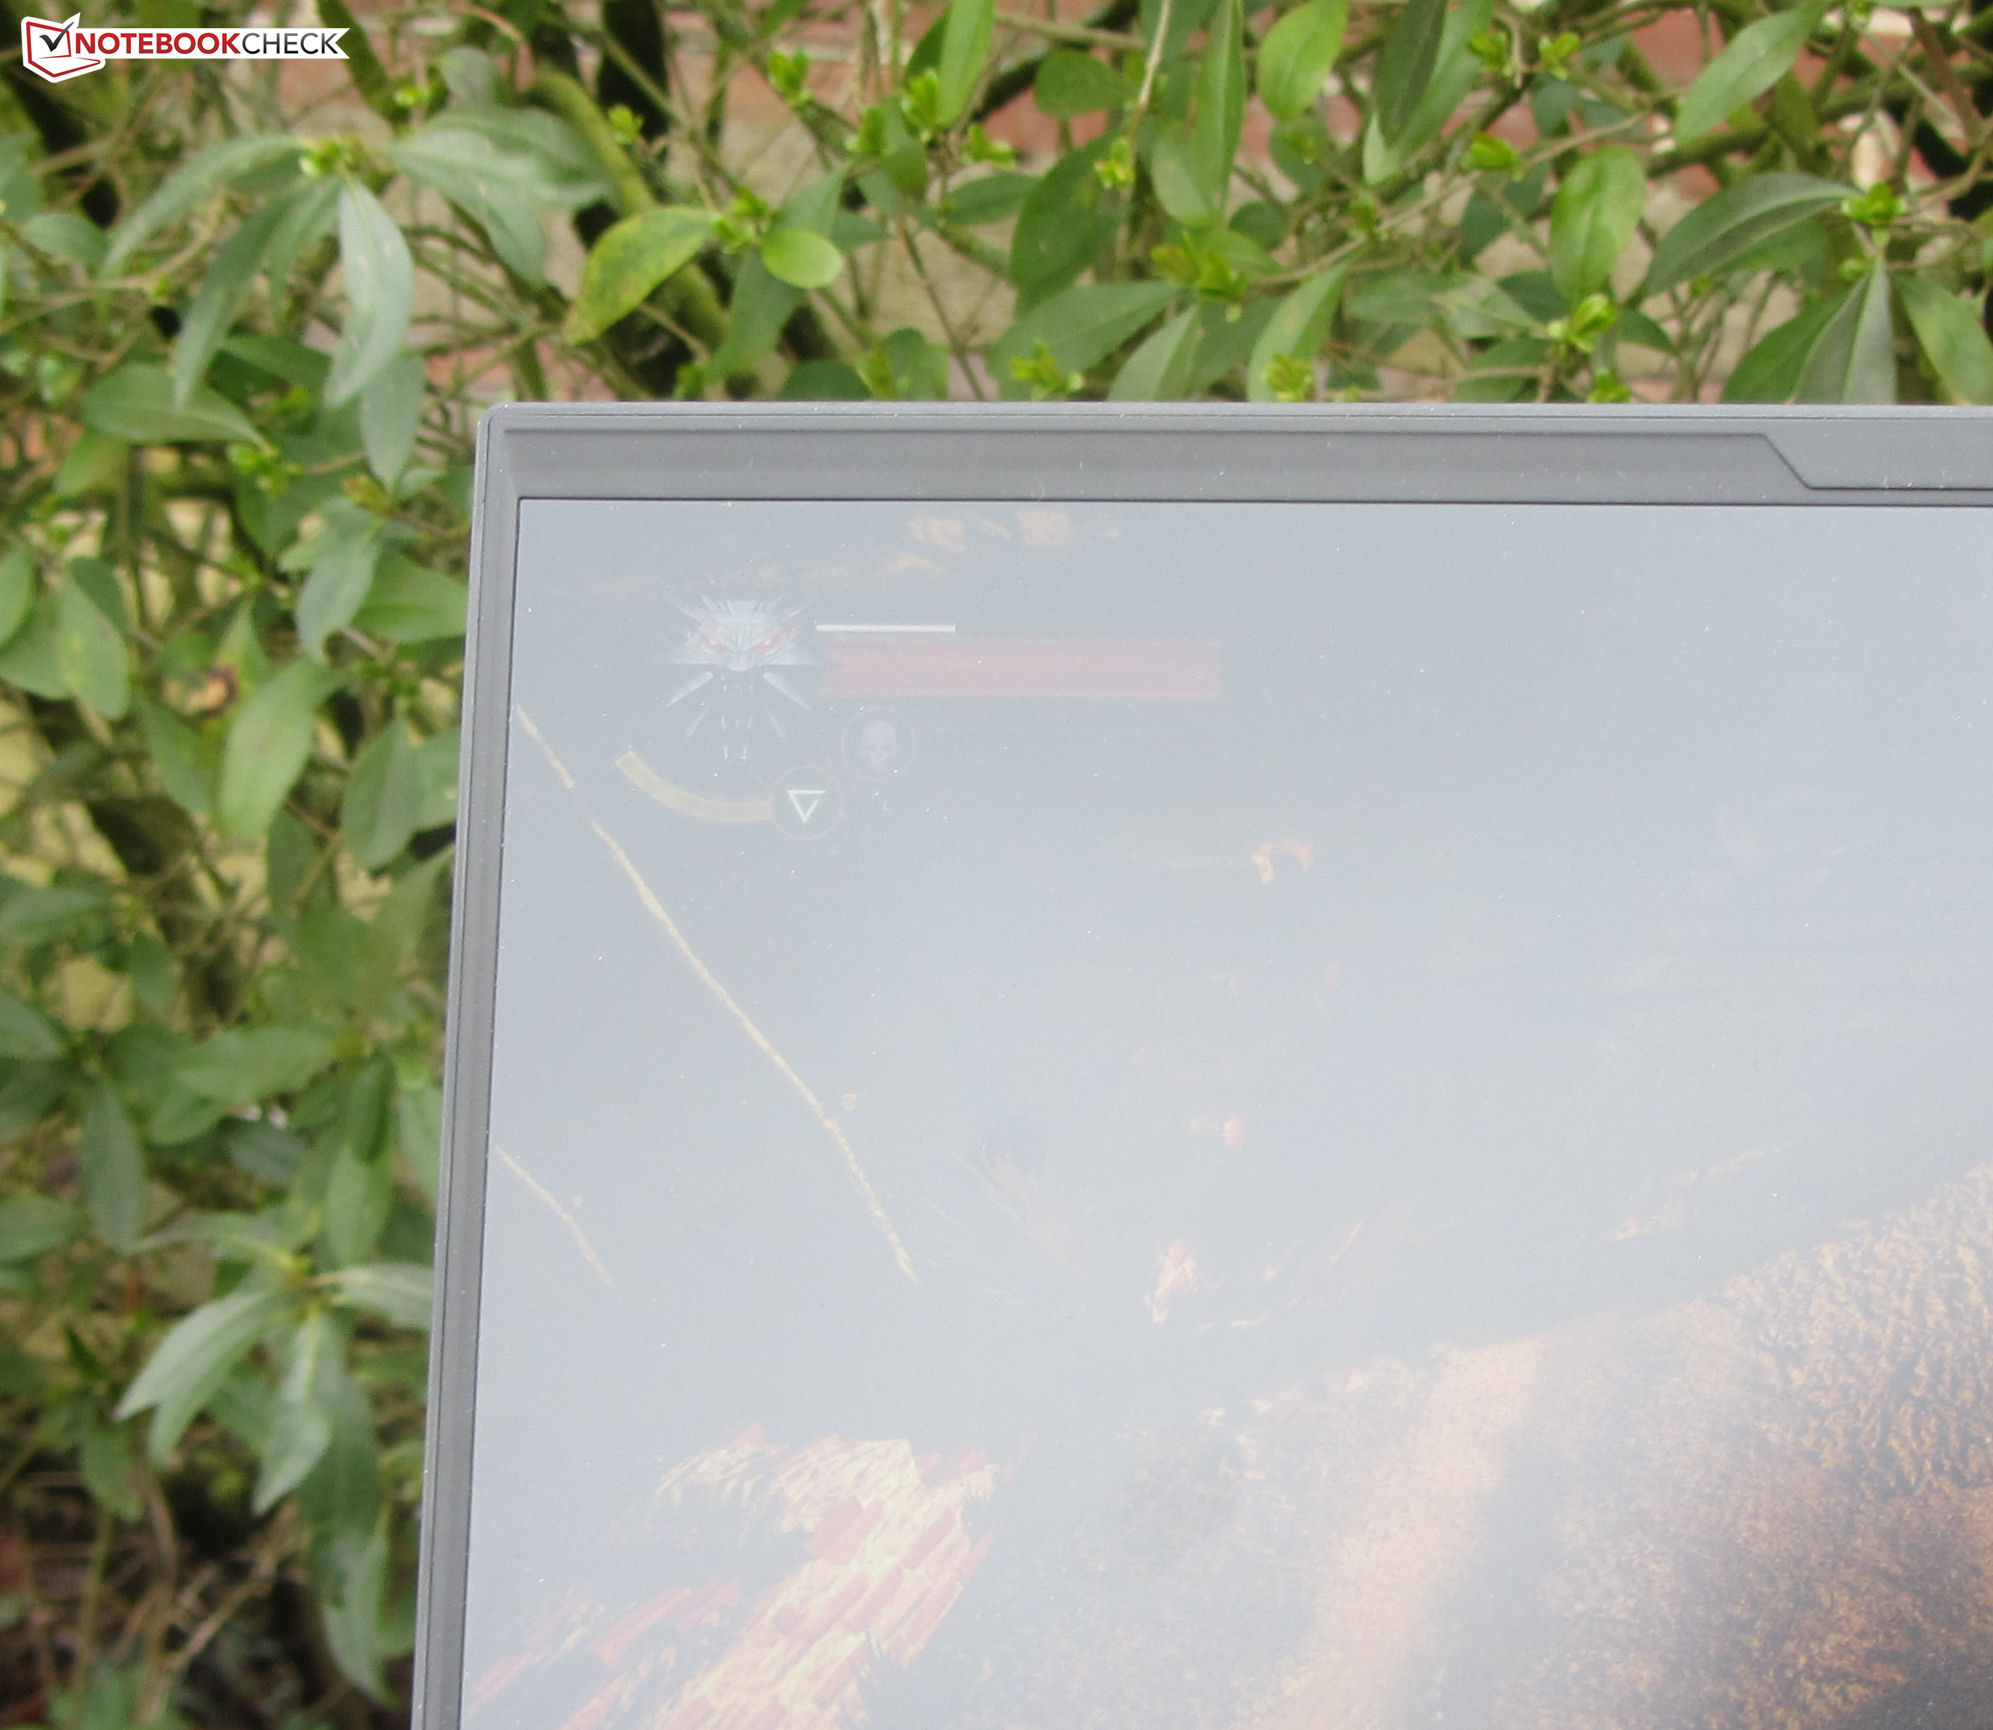
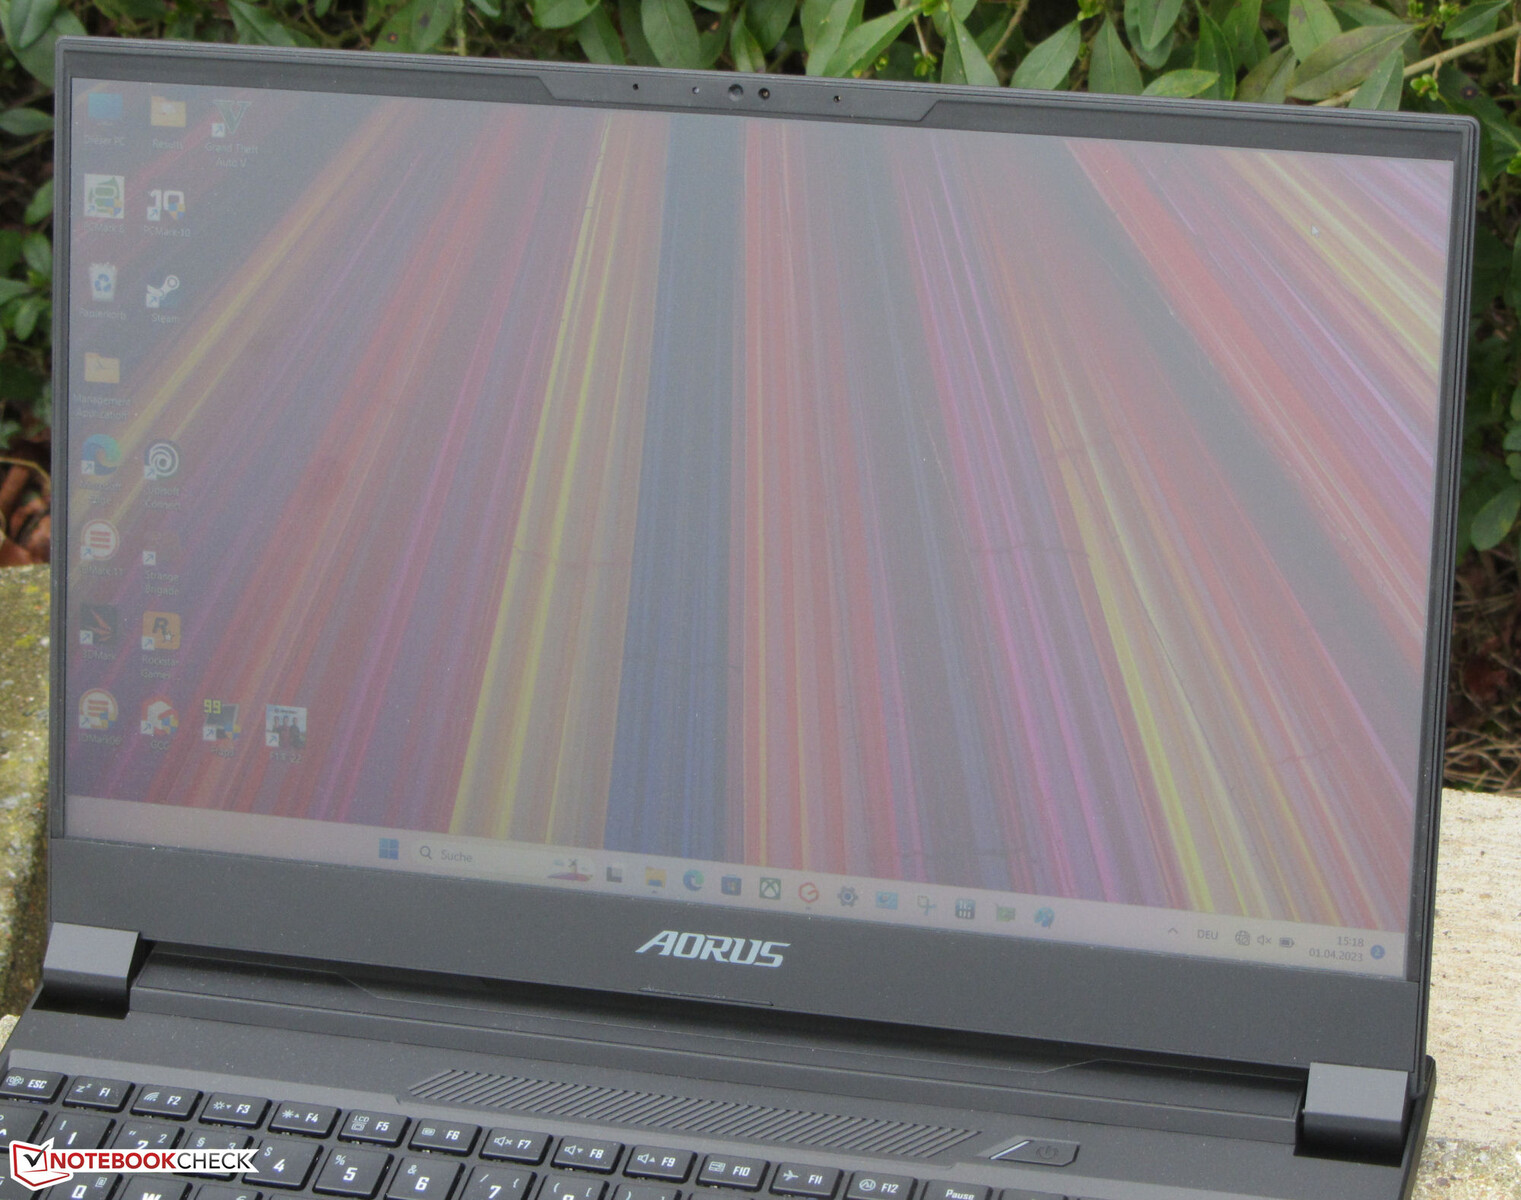
Pantalla: panel QHD de 240 Hz
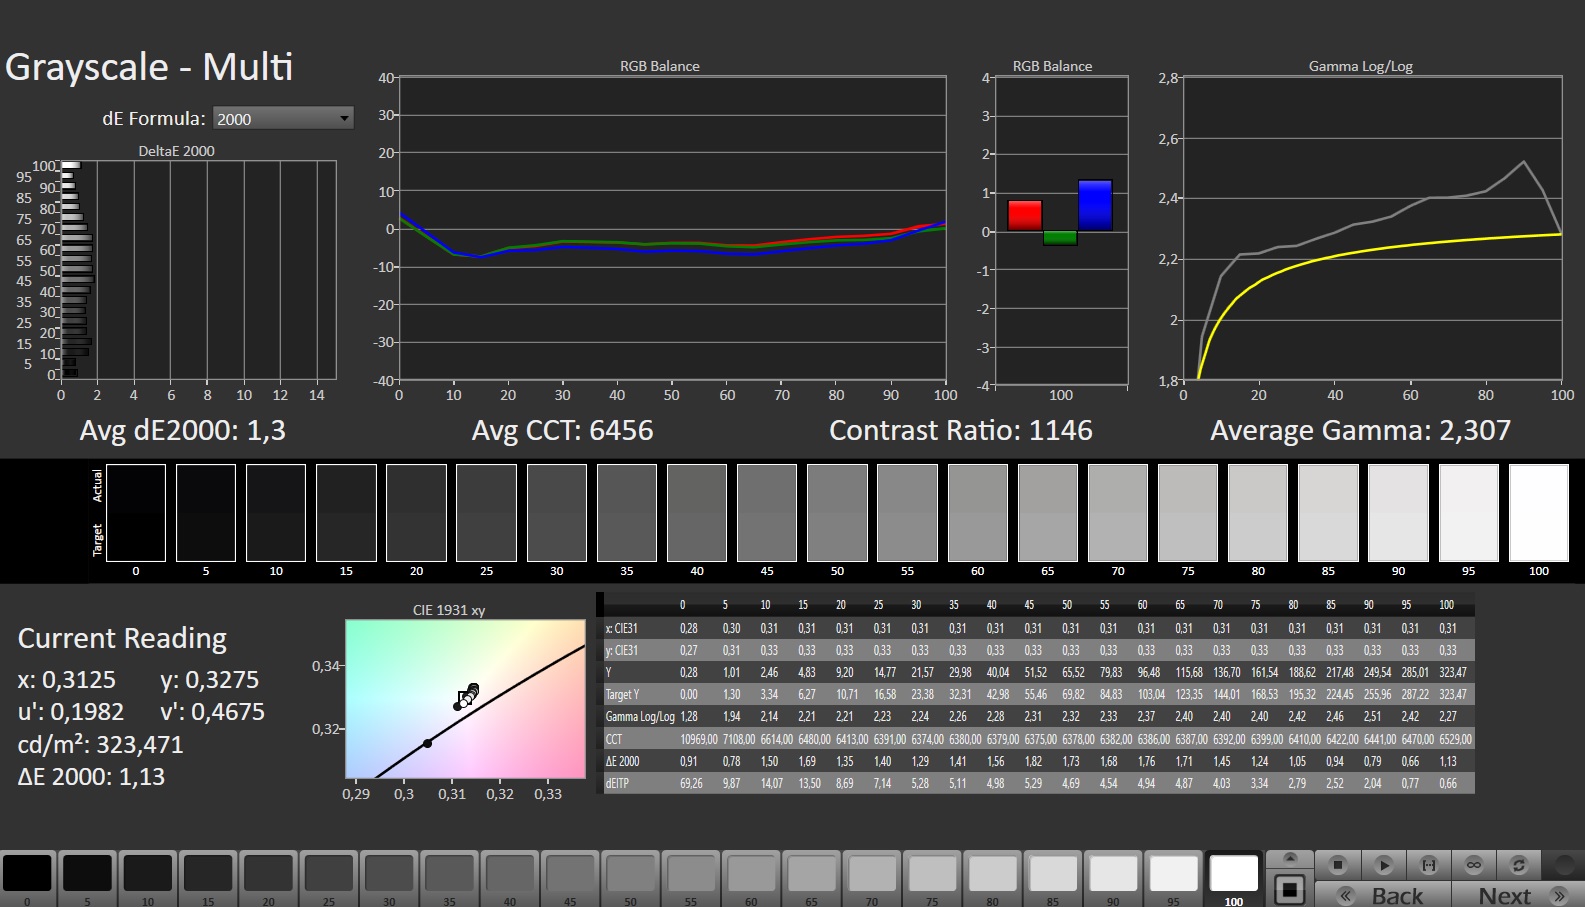
El 15X de Gigabyte está equipado con un panel de formato 16:9 de rápida reacción a 240 Hz, que no sufre de parpadeo PWM en ningún nivel de brillo. Los niveles de brillo y contraste de la pantalla mate de 15,6 pulgadas (2.560 x 1.440 píxeles) caen dentro de un rango aceptable (> 300 cd/m² y 1.000:1).
Comparado con sus competidores, el Blade 15 sobresale gracias a su panel OLED.
| |||||||||||||||||||||||||
iluminación: 90 %
Brillo con batería: 316 cd/m²
Contraste: 1129:1 (Negro: 0.28 cd/m²)
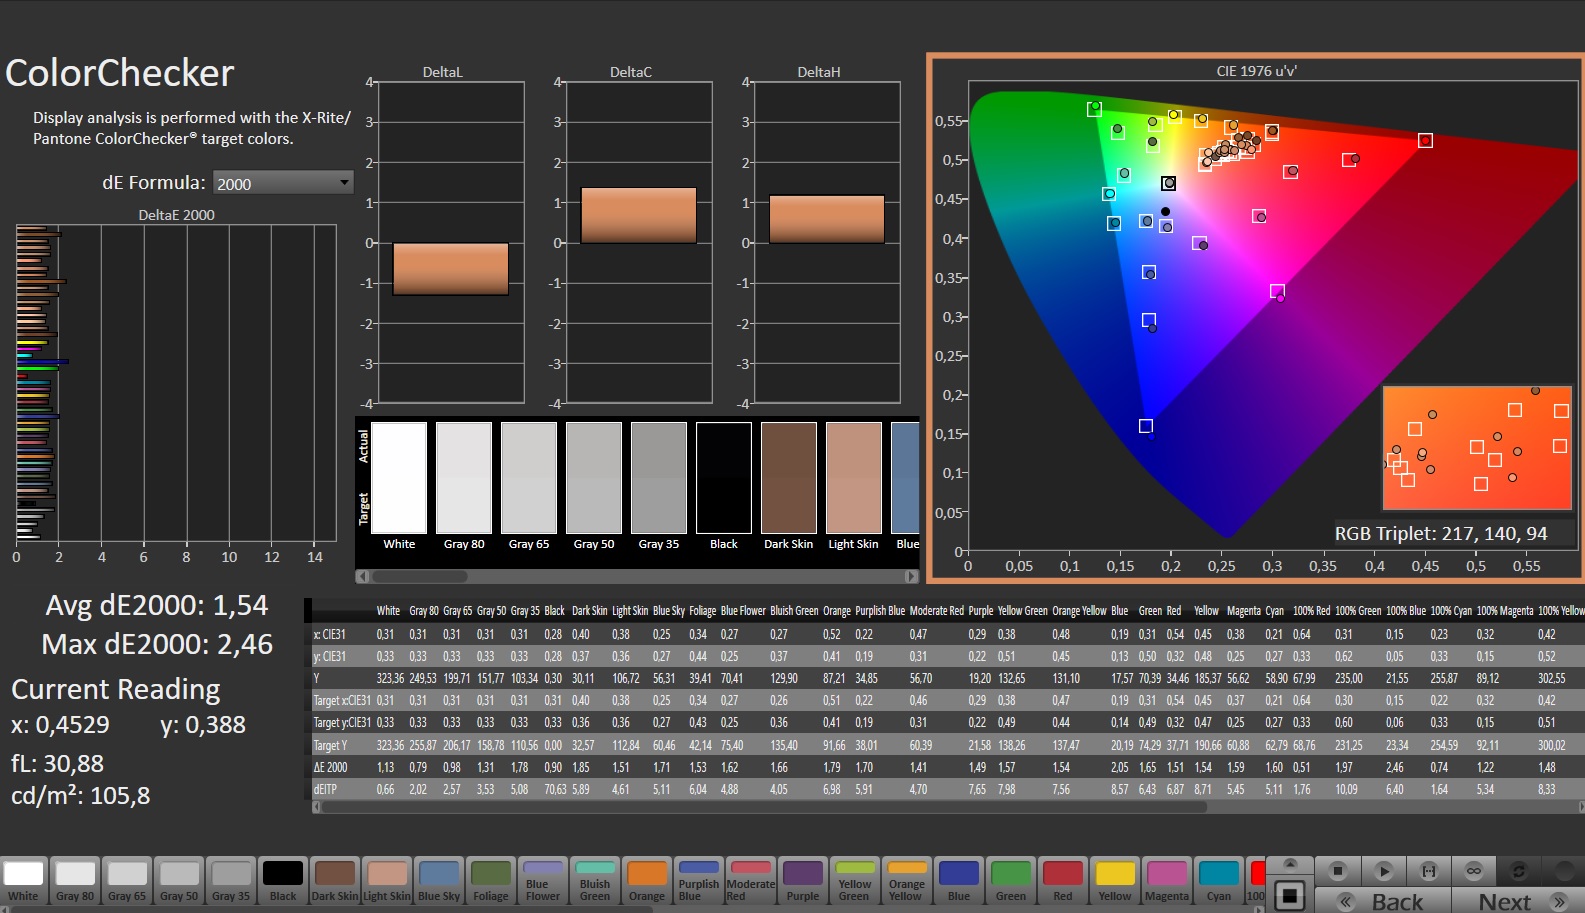
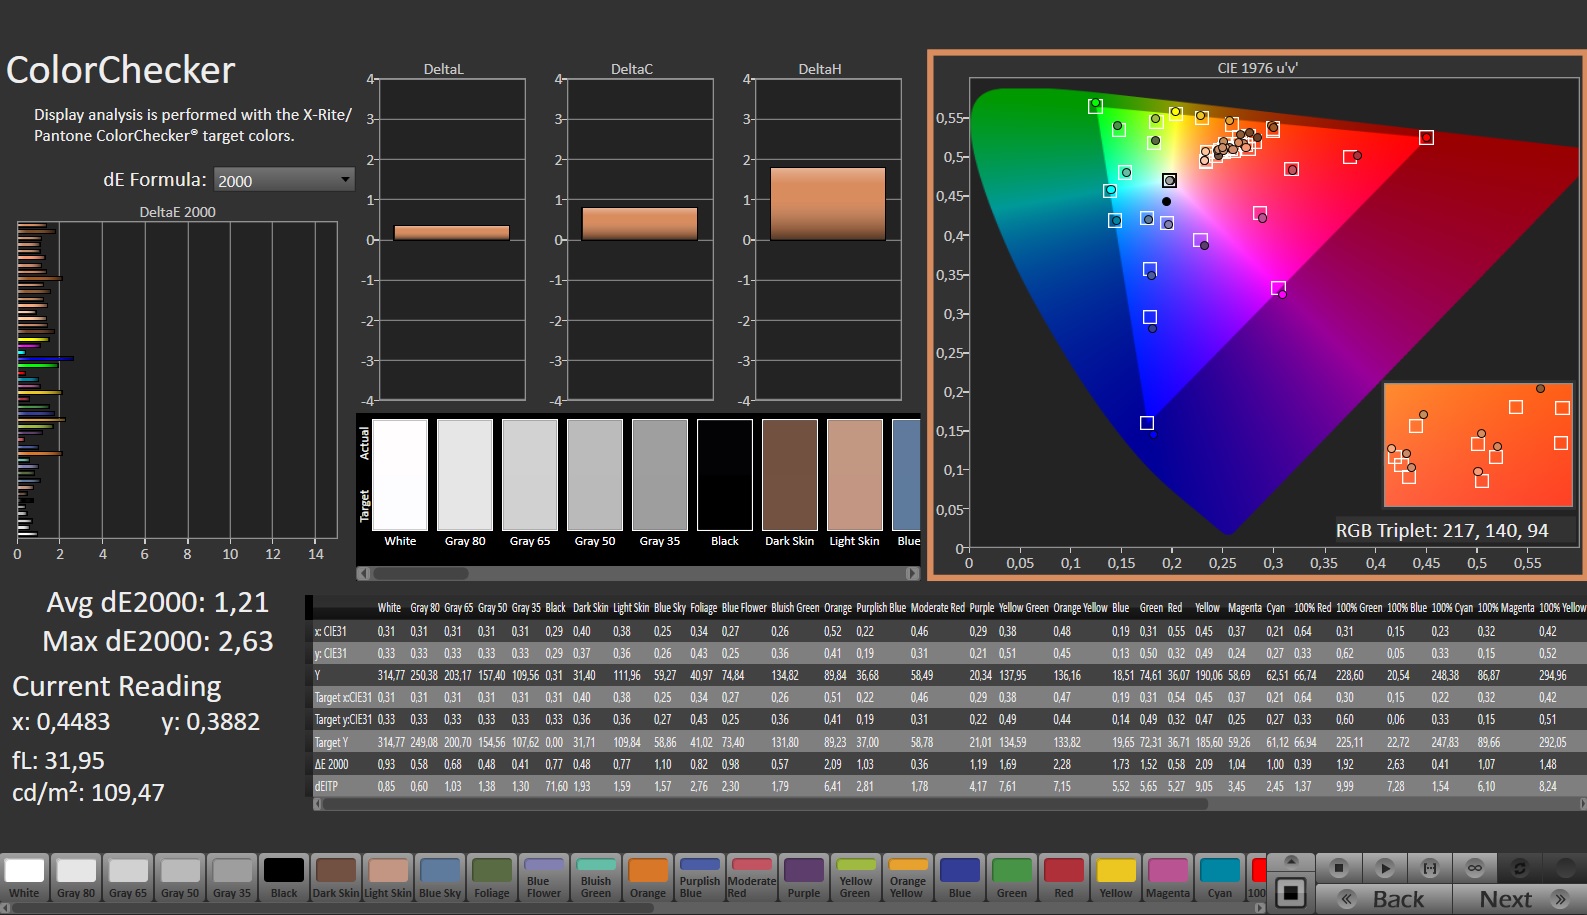
ΔE ColorChecker Calman: 1.54 | ∀{0.5-29.43 Ø4.71}
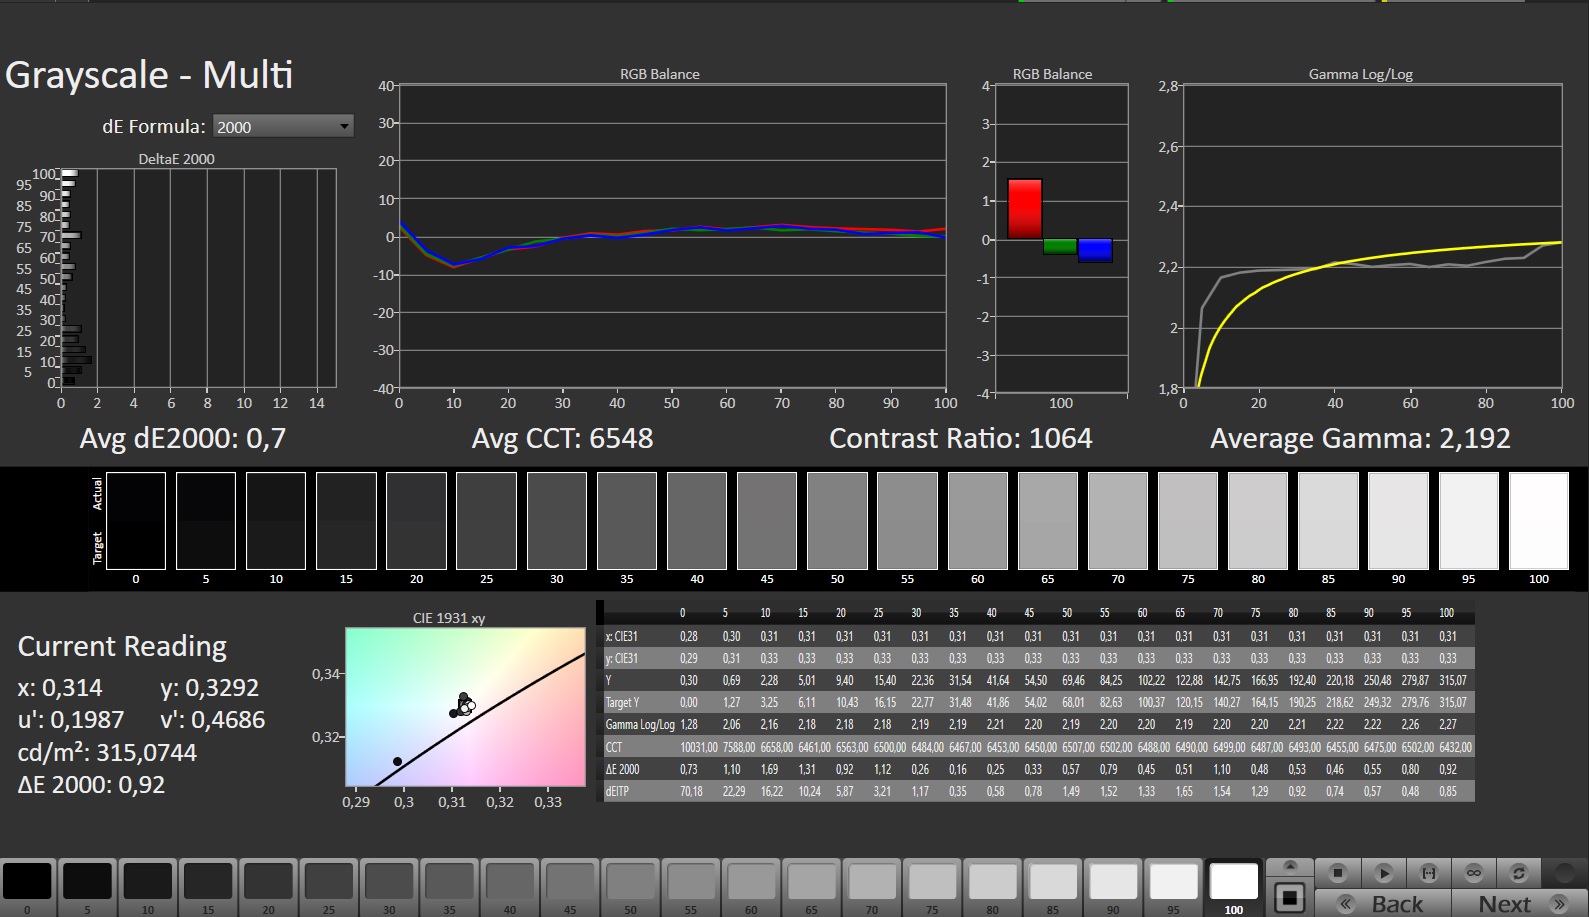
calibrated: 1.21
ΔE Greyscale Calman: 1.3 | ∀{0.09-98 Ø4.96}
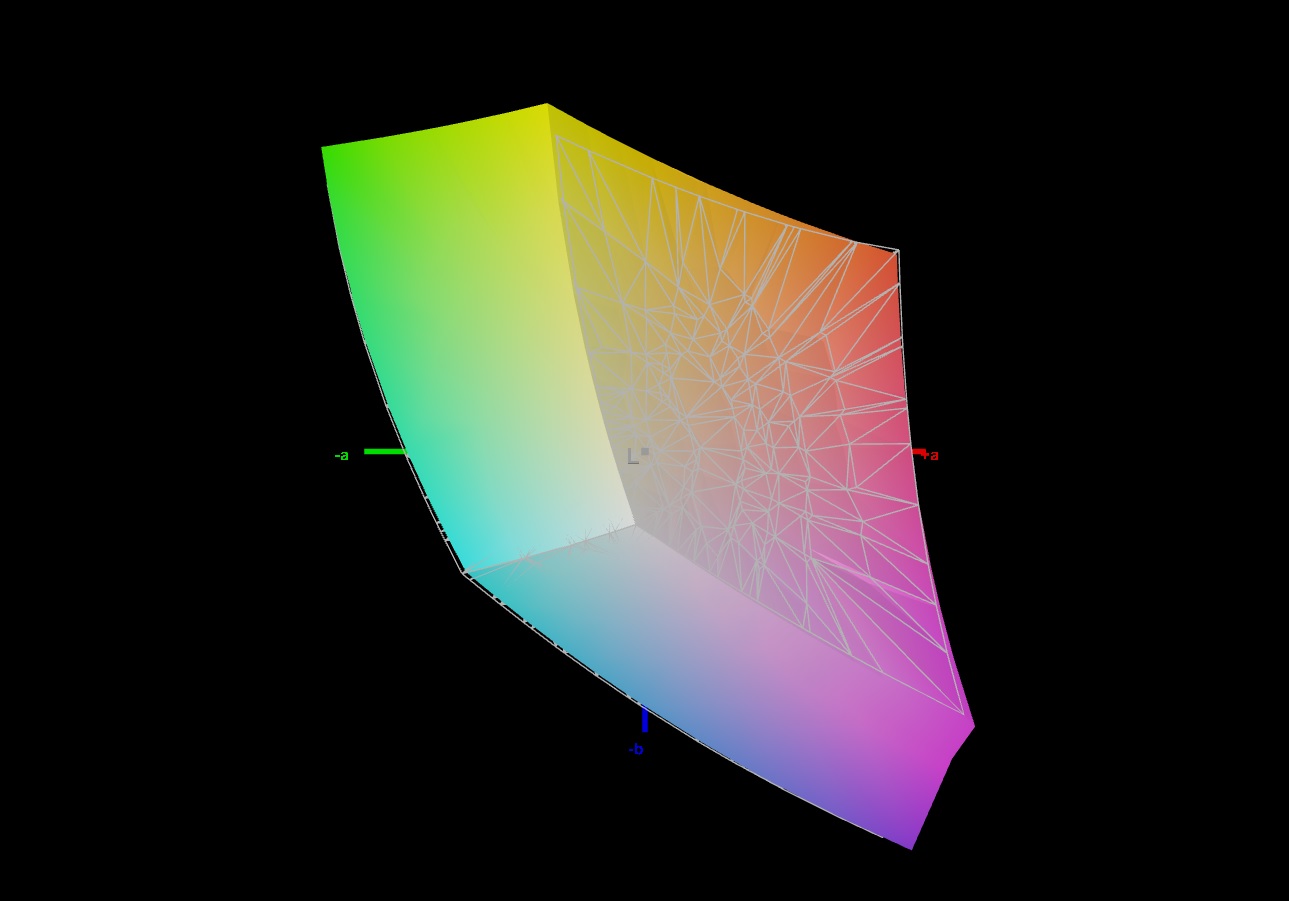
70.5% AdobeRGB 1998 (Argyll 3D)
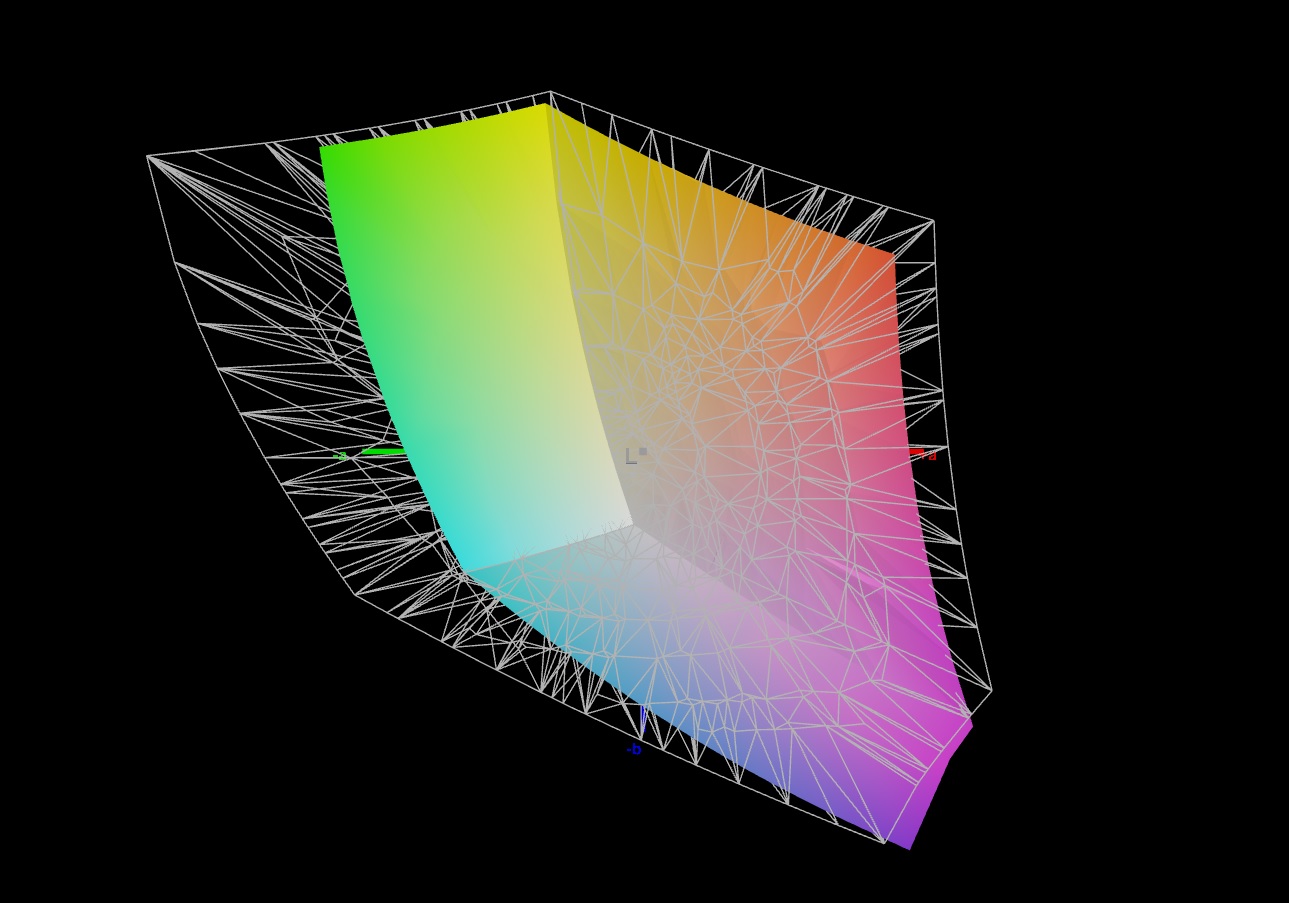
98.2% sRGB (Argyll 3D)
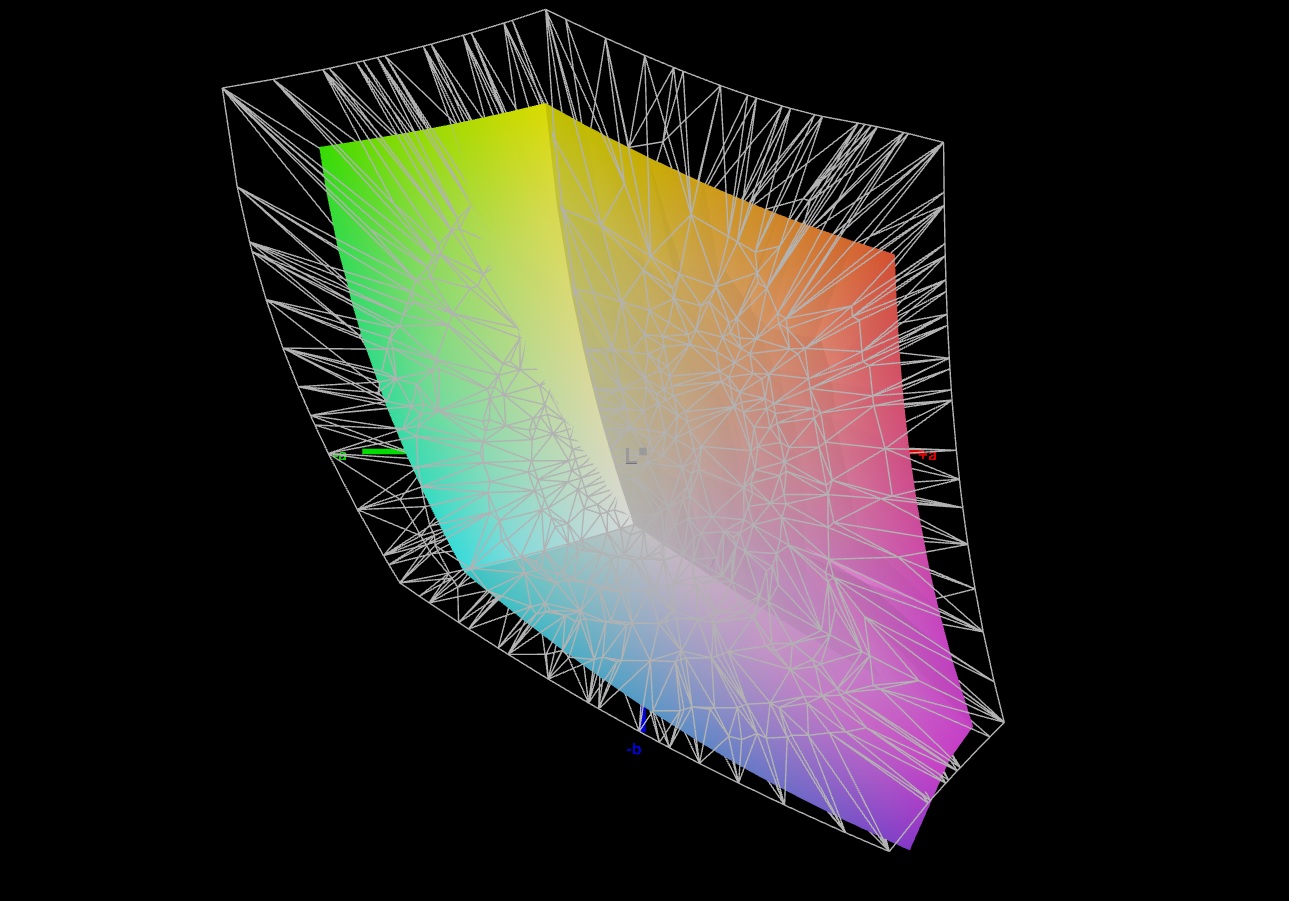
69.3% Display P3 (Argyll 3D)
Gamma: 2.307
CCT: 6456 K
| Aorus 15X ASF BOE CQ NE156QHM-NZ1, IPS, 2560x1440, 15.6" | Razer Blade 15 OLED (Early 2022) Samsung ATNA562P02-0, OLED, 2560x1440, 15.6" | MSI Katana 17 B13VFK B173HAN04.9, IPS LED, 1920x1080, 17.3" | Asus ROG Strix G17 G713PI BOE0B69, IPS, 2560x1440, 17.3" | Acer Predator Helios 300 (i7-12700H, RTX 3070 Ti) BOE0A1A, IPS, 2560x1440, 17.3" | |
|---|---|---|---|---|---|
| Display | 25% | -40% | 22% | 21% | |
| Display P3 Coverage (%) | 69.3 | 97.6 41% | 40.8 -41% | 98.3 42% | 96.8 40% |
| sRGB Coverage (%) | 98.2 | 99.4 1% | 61 -38% | 100 2% | 99.9 2% |
| AdobeRGB 1998 Coverage (%) | 70.5 | 94 33% | 42.2 -40% | 85.9 22% | 84.8 20% |
| Response Times | 82% | -172% | 33% | -26% | |
| Response Time Grey 50% / Grey 80% * (ms) | 12.4 ? | 2 ? 84% | 33 ? -166% | 5.3 ? 57% | 16.4 ? -32% |
| Response Time Black / White * (ms) | 9.4 ? | 2 ? 79% | 26 ? -177% | 8.6 ? 9% | 11.2 ? -19% |
| PWM Frequency (Hz) | 500 ? | ||||
| Screen | 109% | -135% | -4% | -60% | |
| Brightness middle (cd/m²) | 316 | 383 21% | 267 -16% | 327 3% | 366 16% |
| Brightness (cd/m²) | 301 | 384 28% | 256 -15% | 320 6% | 340 13% |
| Brightness Distribution (%) | 90 | 99 10% | 93 3% | 89 -1% | 85 -6% |
| Black Level * (cd/m²) | 0.28 | 0.03 89% | 0.21 25% | 0.38 -36% | 0.31 -11% |
| Contrast (:1) | 1129 | 12767 1031% | 1271 13% | 861 -24% | 1181 5% |
| Colorchecker dE 2000 * | 1.54 | 1.89 -23% | 4.7 -205% | 1.01 34% | 3.56 -131% |
| Colorchecker dE 2000 max. * | 2.46 | 3.76 -53% | 20.4 -729% | 4.01 -63% | 5.66 -130% |
| Colorchecker dE 2000 calibrated * | 1.21 | 2.67 -121% | 4.5 -272% | 0.41 66% | 3.31 -174% |
| Greyscale dE 2000 * | 1.3 | 1.26 3% | 1.5 -15% | 1.6 -23% | 2.84 -118% |
| Gamma | 2.307 95% | 2.41 91% | 2.12 104% | 2.168 101% | 2.29 96% |
| CCT | 6456 101% | 6386 102% | 6552 99% | 6659 98% | 6835 95% |
| Media total (Programa/Opciones) | 72% /
87% | -116% /
-120% | 17% /
7% | -22% /
-38% |
* ... más pequeño es mejor
Nada más sacarla de la caja, la pantalla ya muestra una gran reproducción del color: Con una desviación de 1,54, entra dentro de un rango aceptable (DeltaE < 3). La calibración reduce la cifra a 1,21 y ayuda a mostrar más uniformemente los tonos grises.
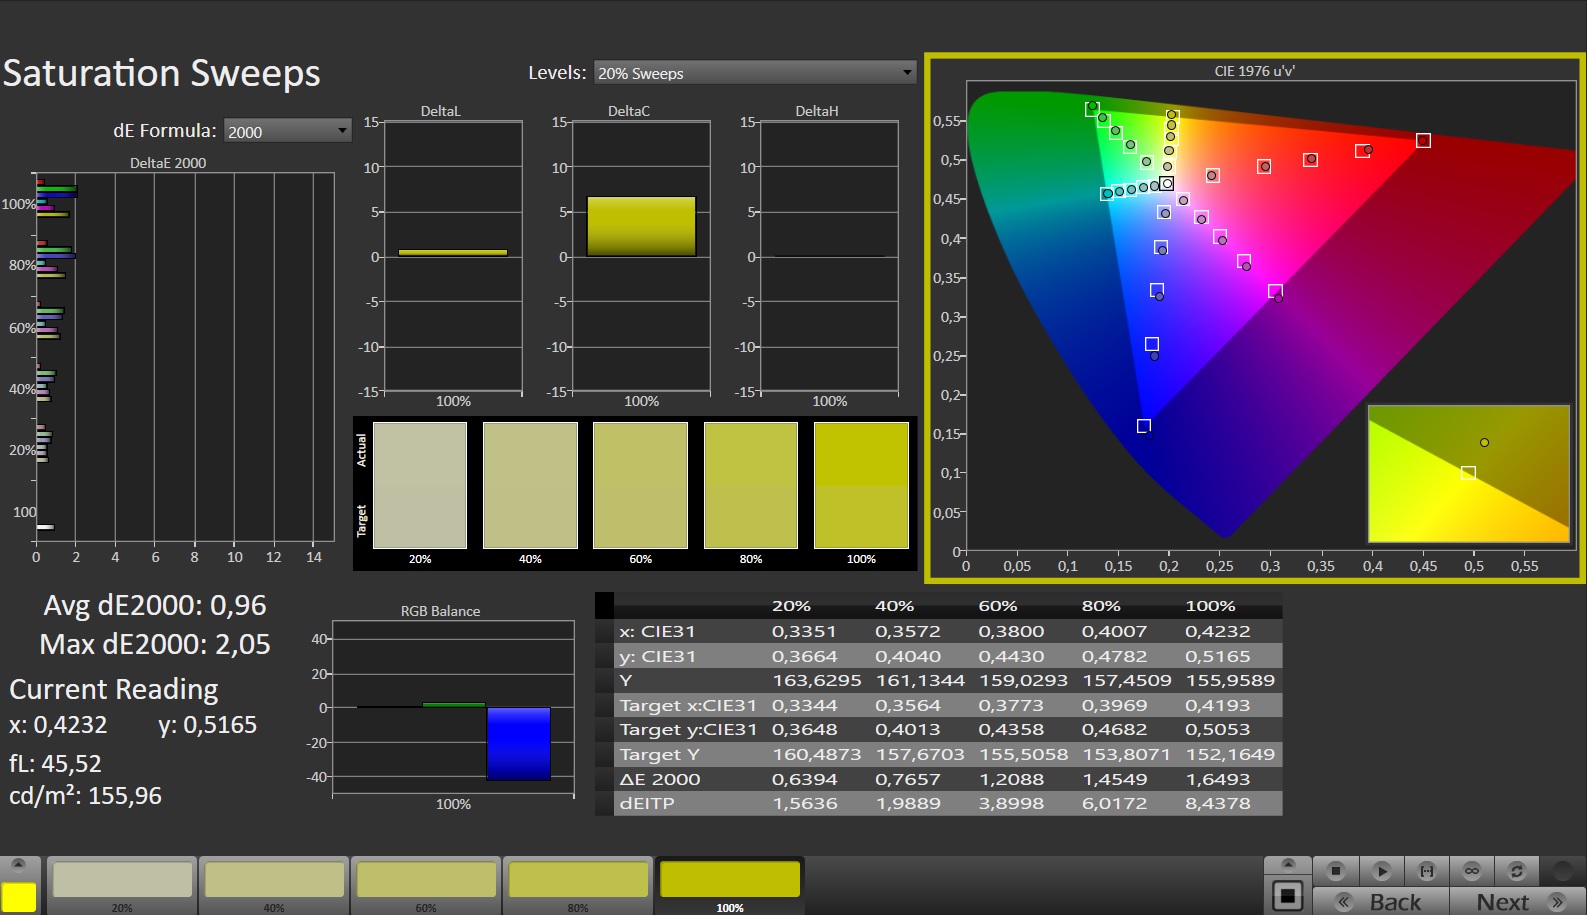
La pantalla puede representar casi todo el espacio de color sRGB, pero no los espacios de color AdobeRGB y DCI-P3. Esto significa que la mayoría de los competidores hacen un poco mejor trabajo con esto.

Tiempos de respuesta del display
| ↔ Tiempo de respuesta de Negro a Blanco | ||
|---|---|---|
| 9.4 ms ... subida ↗ y bajada ↘ combinada | ↗ 4.9 ms subida | 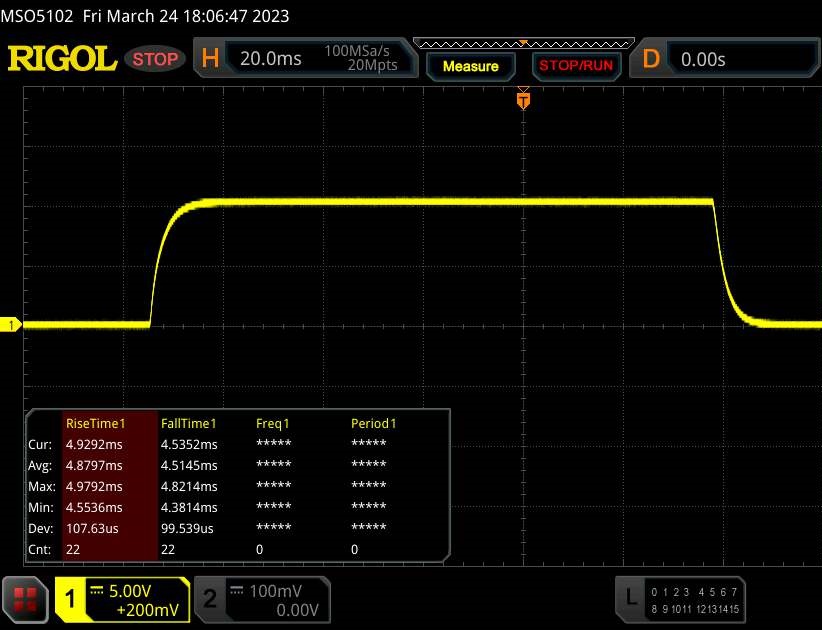 |
| ↘ 4.5 ms bajada | ||
| La pantalla mostró tiempos de respuesta rápidos en nuestros tests y debería ser adecuada para juegos. En comparación, todos los dispositivos de prueba van de ##min### (mínimo) a 240 (máximo) ms. » 26 % de todos los dispositivos son mejores. Esto quiere decir que el tiempo de respuesta medido es mejor que la media (19.8 ms) de todos los dispositivos testados. | ||
| ↔ Tiempo de respuesta 50% Gris a 80% Gris | ||
| 12.4 ms ... subida ↗ y bajada ↘ combinada | ↗ 6 ms subida | 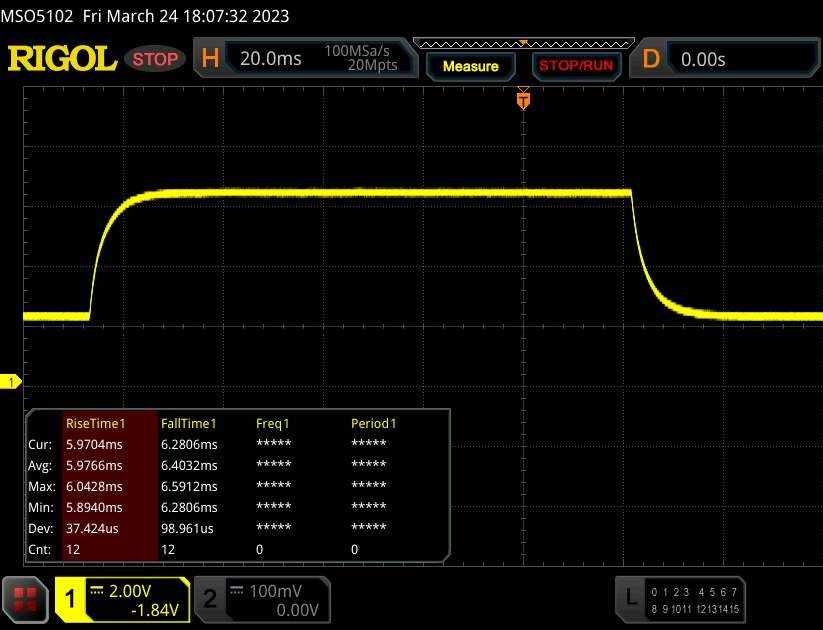 |
| ↘ 6.4 ms bajada | ||
| La pantalla mostró buenos tiempos de respuesta en nuestros tests pero podría ser demasiado lenta para los jugones competitivos. En comparación, todos los dispositivos de prueba van de ##min### (mínimo) a 636 (máximo) ms. » 26 % de todos los dispositivos son mejores. Esto quiere decir que el tiempo de respuesta medido es mejor que la media (31 ms) de todos los dispositivos testados. | ||
Parpadeo de Pantalla / PWM (Pulse-Width Modulation)
| Parpadeo de Pantalla / PWM no detectado | 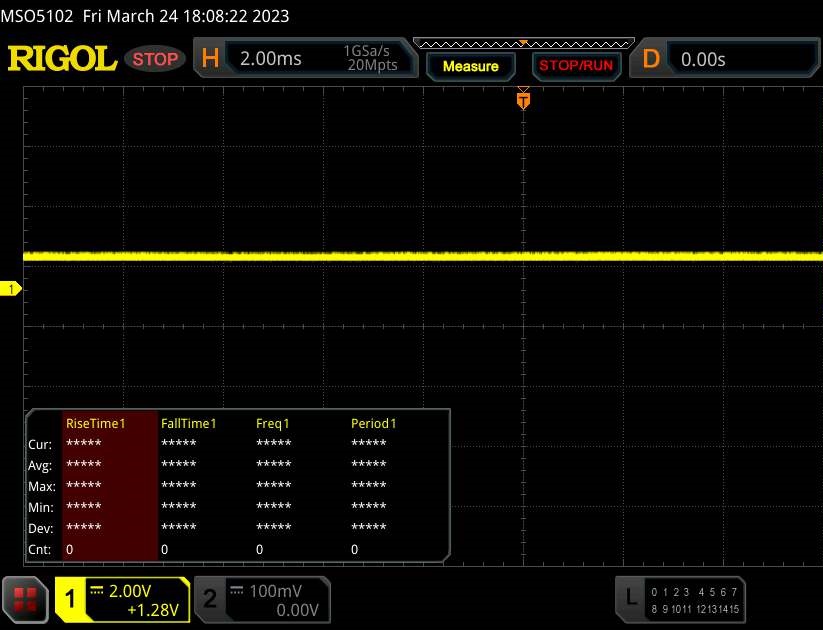 | ||
Comparación: 52 % de todos los dispositivos testados no usaron PWM para atenuar el display. Si se usó, medimos una media de 7754 (mínimo: 5 - máxmo: 343500) Hz. | |||
El panel IPS de ángulo de visión estable puede verse desde cualquier posición. En exteriores, la pantalla es visible en su mayor parte, siempre que el sol no brille demasiado.

Rendimiento
El Aorus 15X se clasifica como un potente portátil para juegos, pero no se limita sólo a este ámbito. Su buen rendimiento es posible gracias a Raptor Lake y Ada Lovelace. El dispositivo de pruebas presentado puede comprarse por unos 2.099 $.
Condiciones de ensayo
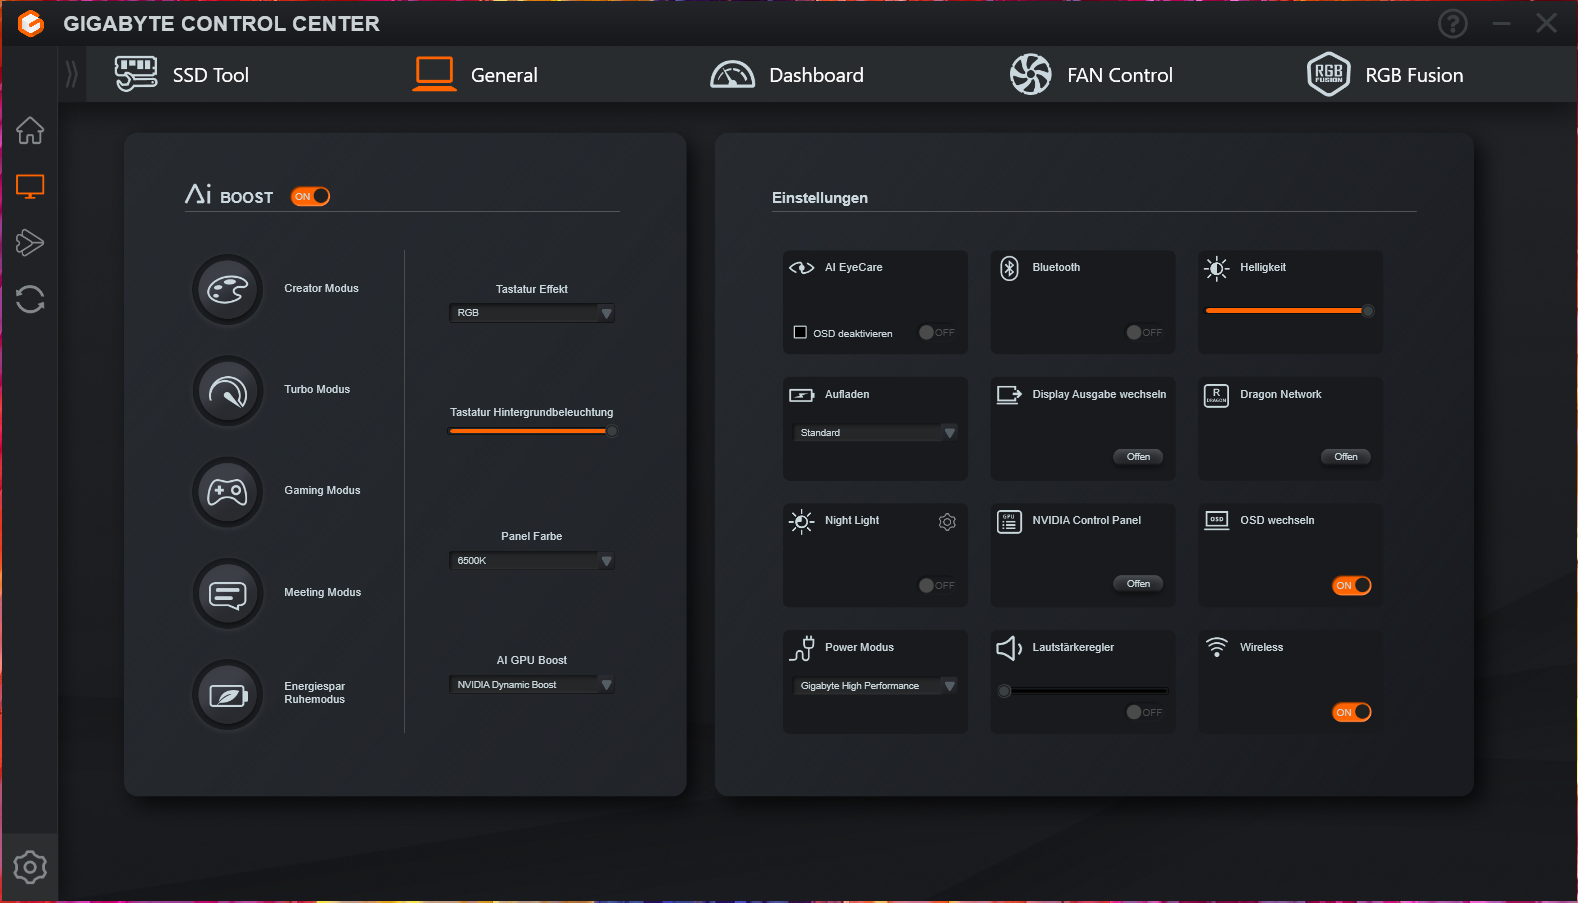
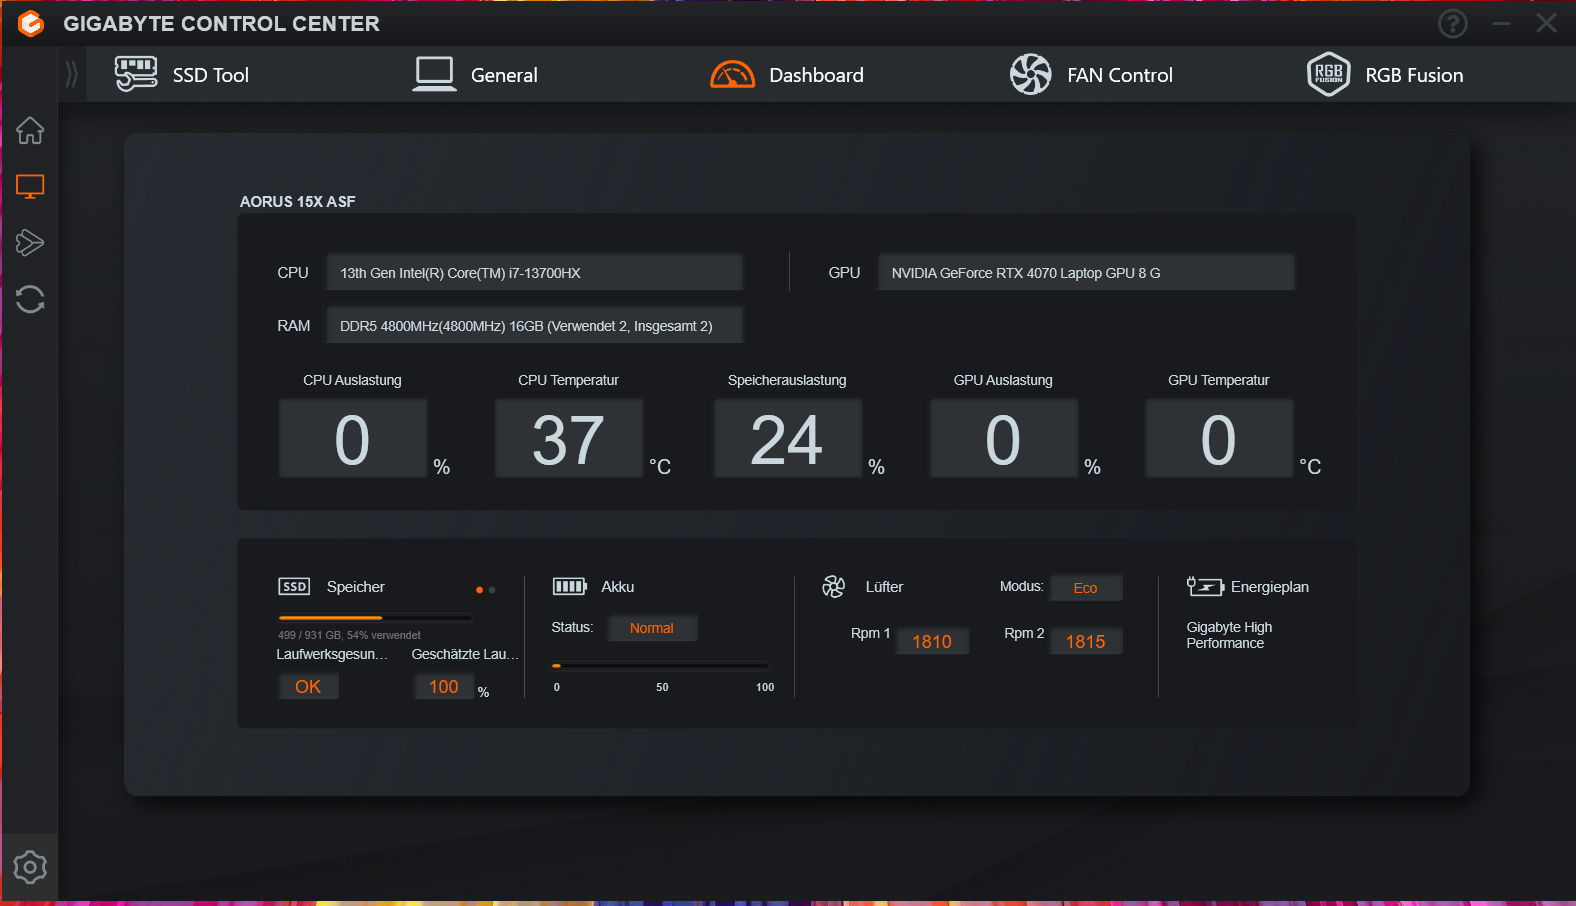
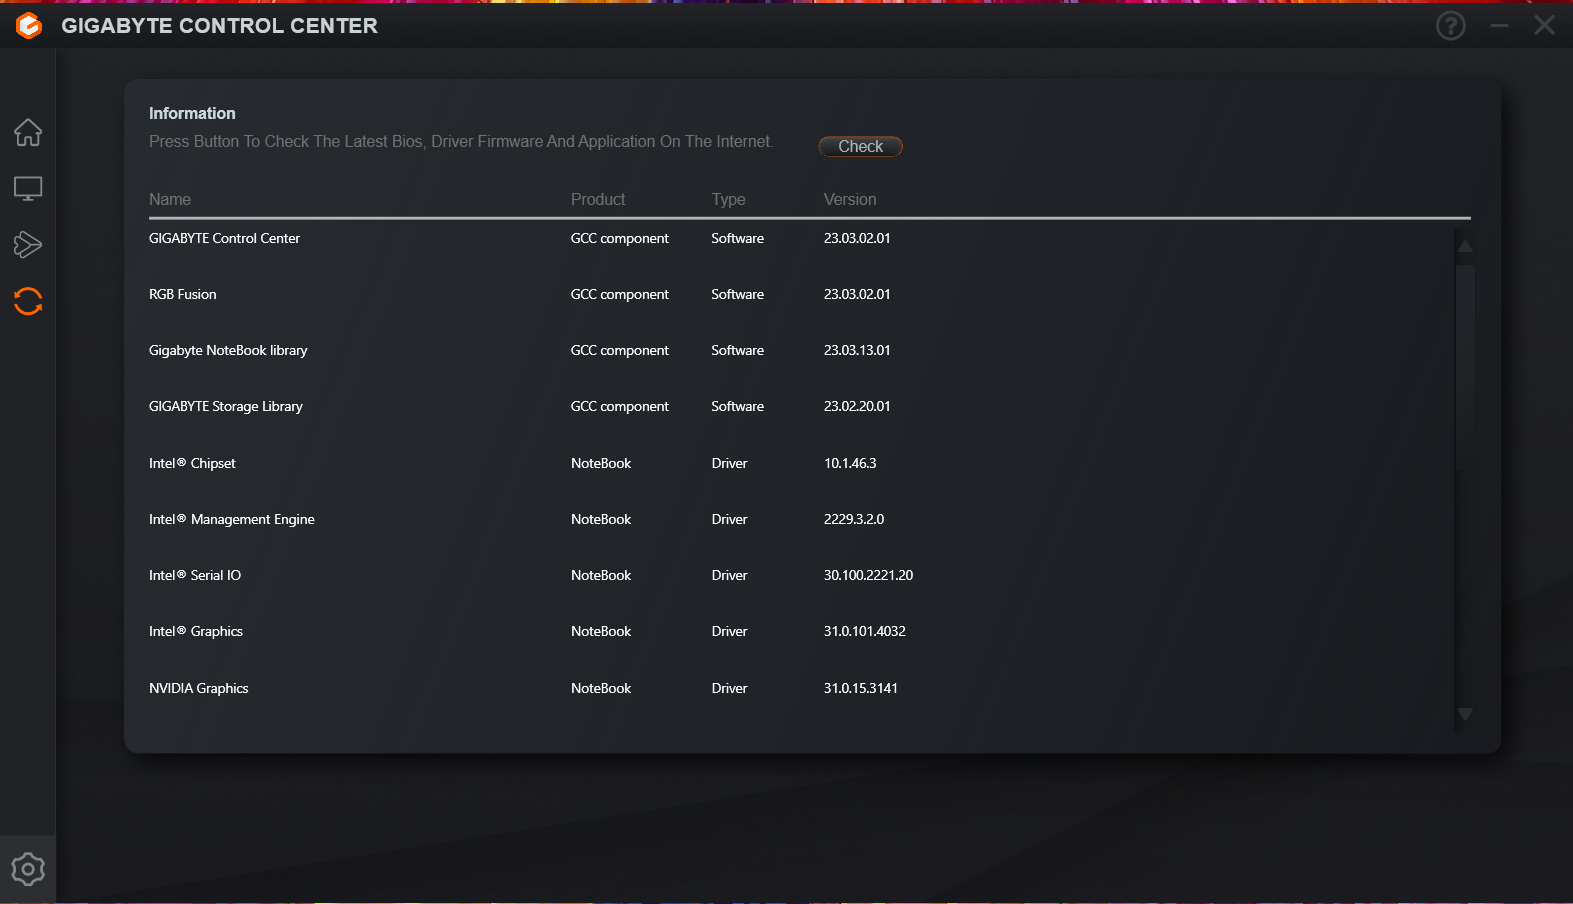
El centro de control del ordenador (Gigabyte Control Center) tiene todos los modos de rendimiento habituales (ver tabla) y una función superior de AI boost, que fue la que usamos. Esto significa que el centro de control eligió el perfil más adecuado - "modo juego" y "modo creador" para los benchmarks y "modo inactivo de ahorro de energía" para los tests de batería.
el "modo turbo" puede mejorar ligeramente el rendimiento en algunos casos, pero tiene un precio: Los ventiladores trabajan constantemente a plena potencia. Puedes alcanzar los niveles de trabajo más silenciosos -casi completamente silenciosos- utilizando el "modo reunión". Aquí, el rendimiento monohilo, que es más importante para el uso diario, se reduce en menor medida que el rendimiento multihilo. Incluso los juegos serían posibles con ajustes reducidos.
| Modo creador | Modo turbo | Modo juego | Modo reunión | Modo de ahorro de energía en reposo | |
|---|---|---|---|---|---|
| Límite de potencia 1 | 70 vatios | 70 vatios | 55 vatios | 15 vatios | 15 vatios |
| Límite de potencia 2 | 157 vatios | 157 vatios | 157 vatios | 30 vatios | 30 vatios |
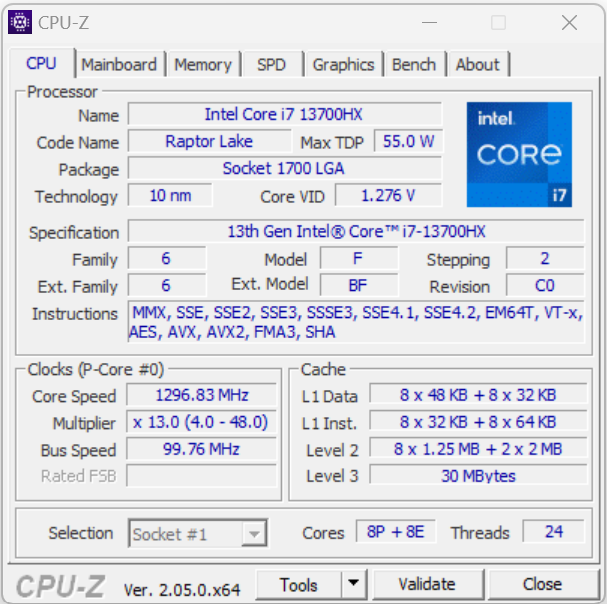
Procesador
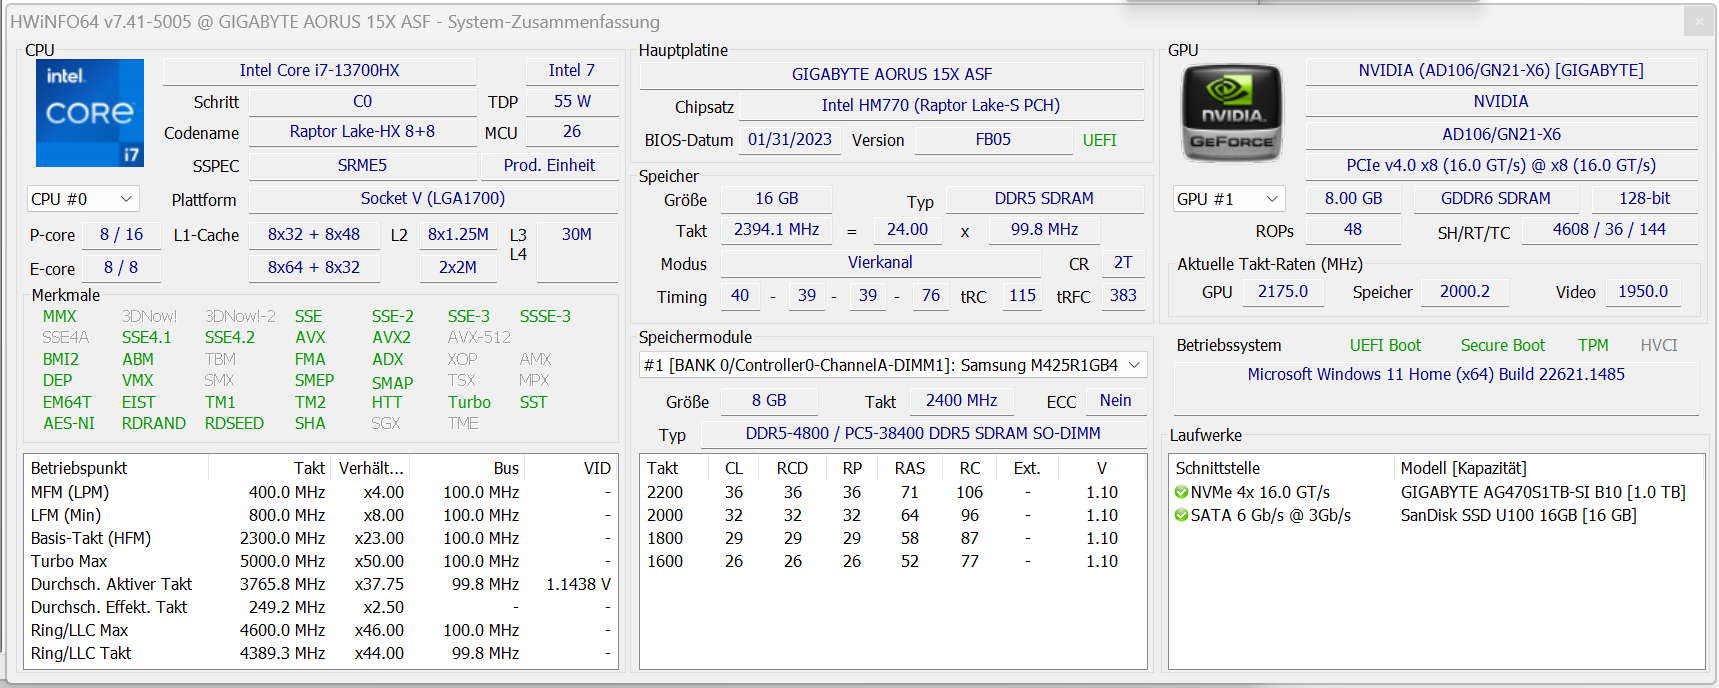
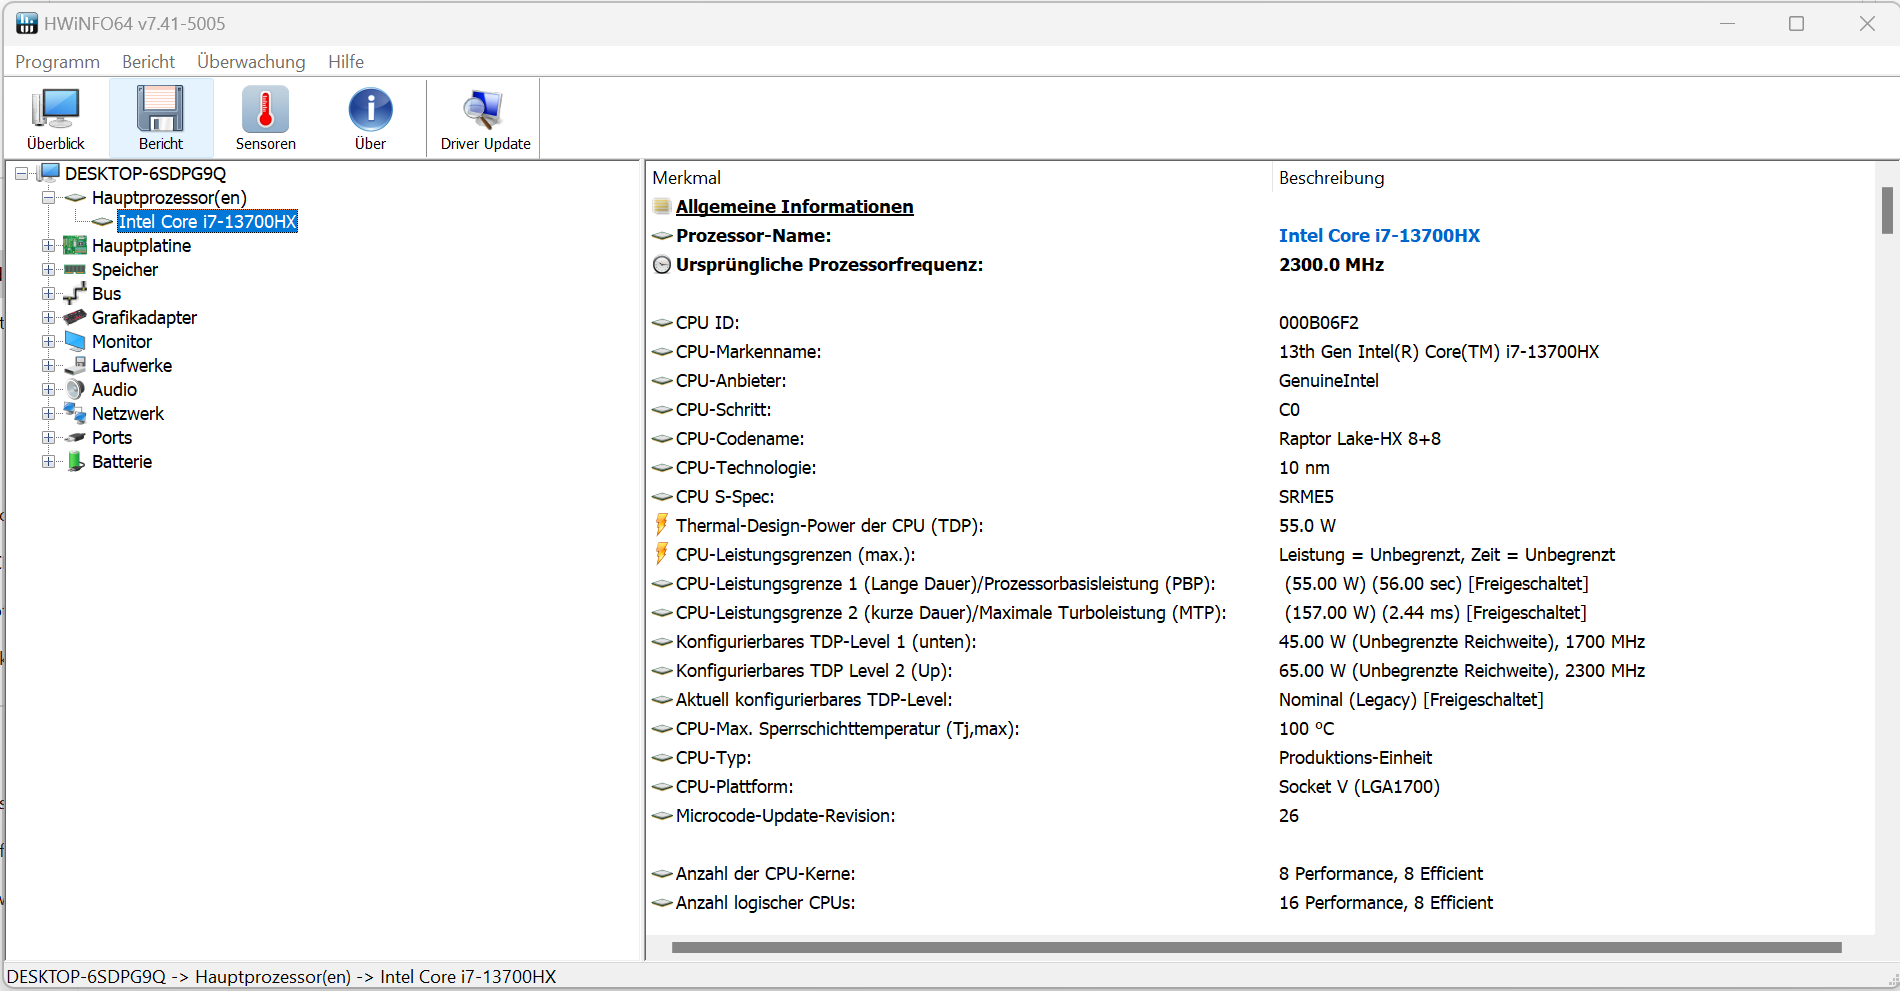
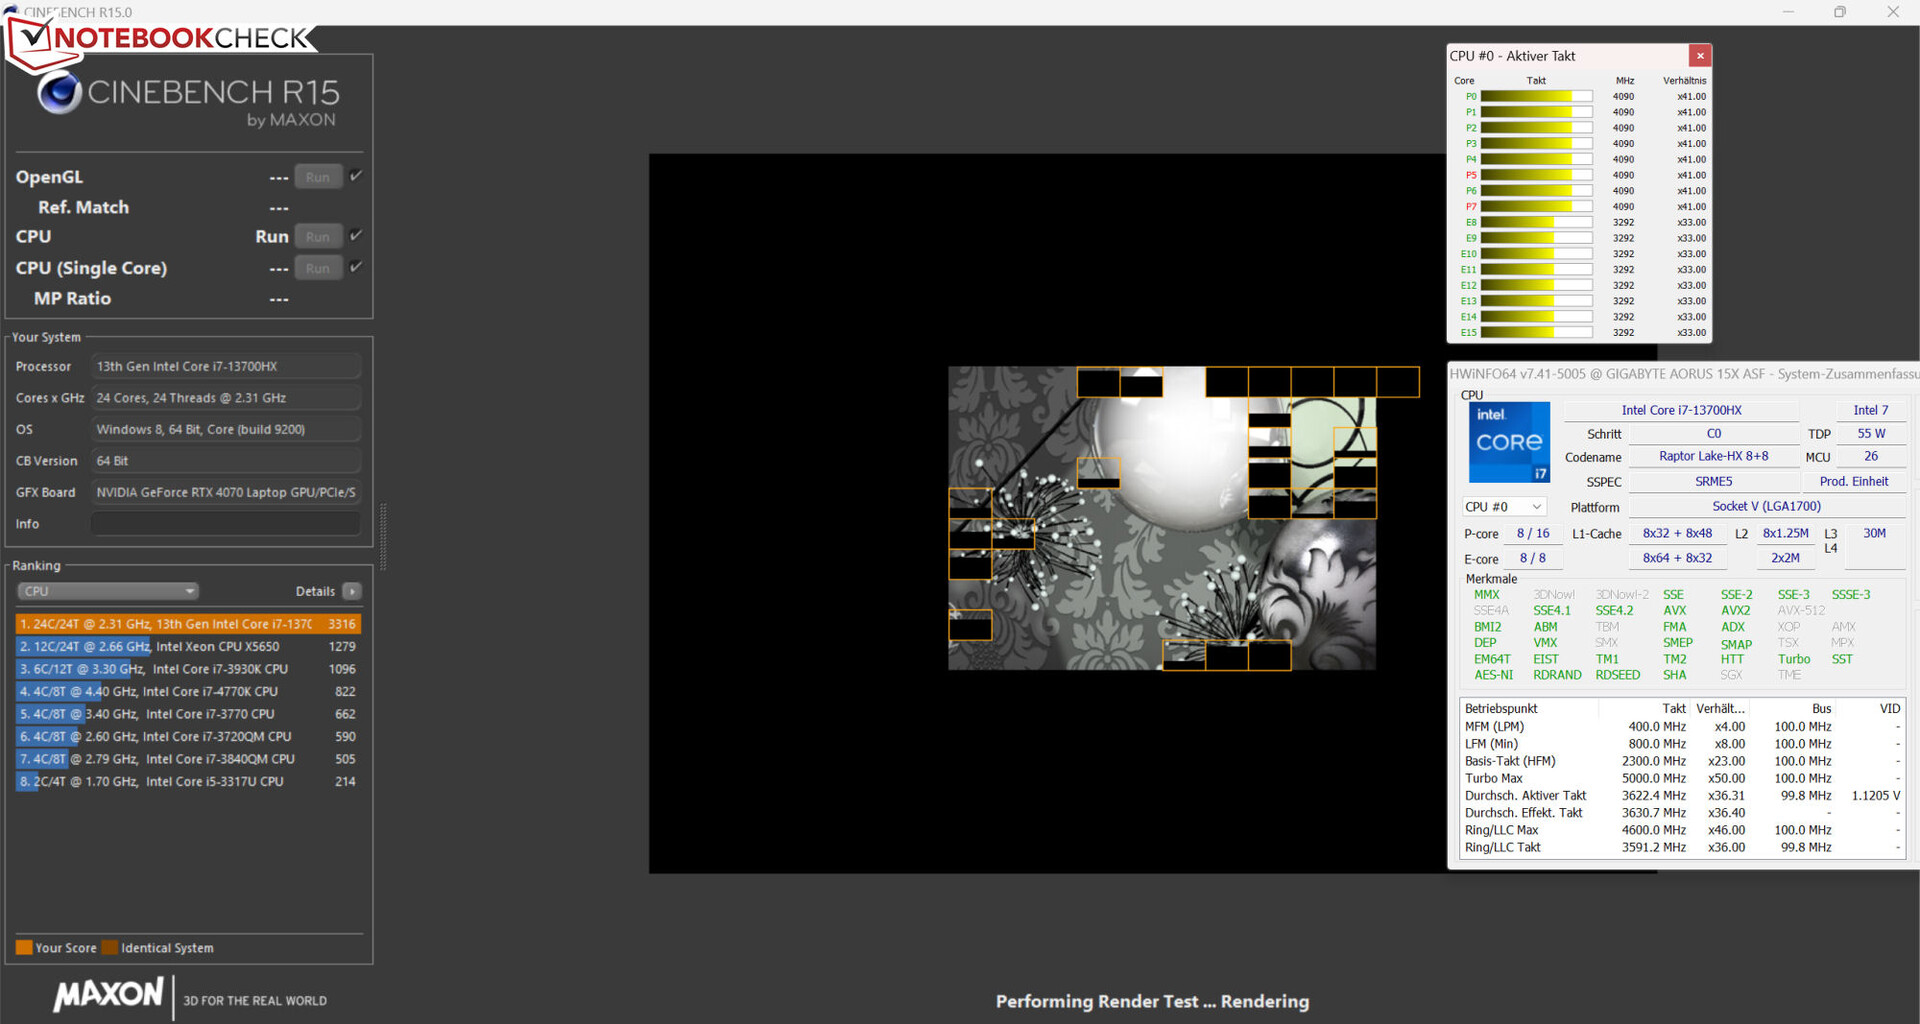
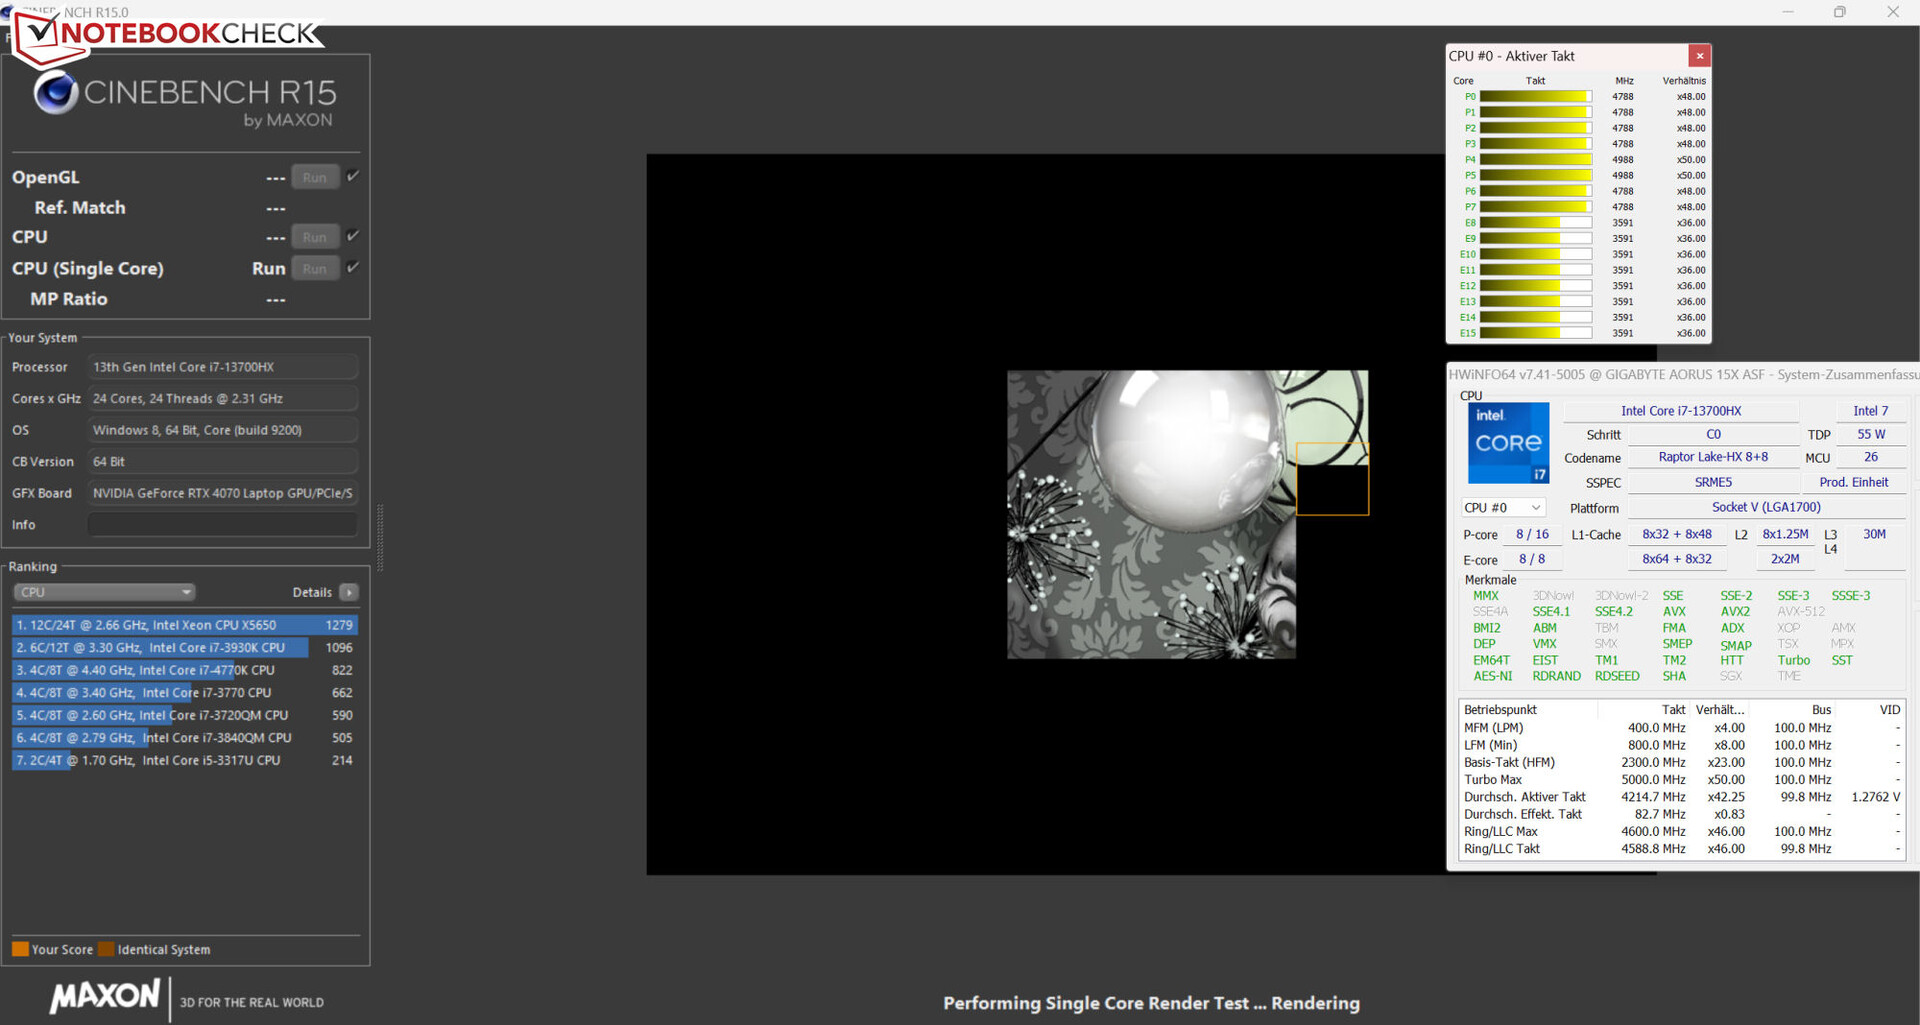
SuCore-i7-13700HX (Raptor Lake) consta de 8 núcleos de eficiencia (sin hiperhebrado, de 1,5 a 3,7 GHz) y 8 núcleos de rendimiento (hiperhebrado, de 2,1 a 5 GHz). En total, esto suma 24 núcleos de CPU logísticos. Las pruebas de rendimiento ofrecen resultados a la par de la media determinada de la CPU.
Las pruebas de CPU del benchmark Cinebench R15 se ejecutaron con velocidades de reloj altas (multihilo) o altas al máximo (un solo hilo) mientras estaba conectado a la red eléctrica. Usando la batería, estas tasas cayeron - significativamente más bajo carga monohilo que multihilo.
La prueba de bucle CB15 lo demostró: Se utilizó el turbo de la CPU y la carga multihilo continua hizo que las velocidades de reloj cayeran ligeramente de la primera a la tercera ejecución.
Cinebench R15 Multi Loop test
* ... más pequeño es mejor
AIDA64: FP32 Ray-Trace | FPU Julia | CPU SHA3 | CPU Queen | FPU SinJulia | FPU Mandel | CPU AES | CPU ZLib | FP64 Ray-Trace | CPU PhotoWorxx
| Performance rating | |
| Asus ROG Strix G17 G713PI | |
| Media de la clase Gaming | |
| Medio Intel Core i7-13700HX | |
| Aorus 15X ASF | |
| Acer Predator Helios 300 (i7-12700H, RTX 3070 Ti) | |
| Razer Blade 15 OLED (Early 2022) | |
| MSI Katana 17 B13VFK | |
| AIDA64 / FP32 Ray-Trace | |
| Asus ROG Strix G17 G713PI | |
| Media de la clase Gaming (10227 - 85542, n=105, últimos 2 años) | |
| Medio Intel Core i7-13700HX (14261 - 21999, n=11) | |
| Acer Predator Helios 300 (i7-12700H, RTX 3070 Ti) | |
| Aorus 15X ASF | |
| MSI Katana 17 B13VFK | |
| Razer Blade 15 OLED (Early 2022) | |
| AIDA64 / FPU Julia | |
| Asus ROG Strix G17 G713PI | |
| Media de la clase Gaming (51376 - 238426, n=105, últimos 2 años) | |
| Medio Intel Core i7-13700HX (74636 - 109364, n=11) | |
| Acer Predator Helios 300 (i7-12700H, RTX 3070 Ti) | |
| Aorus 15X ASF | |
| Razer Blade 15 OLED (Early 2022) | |
| MSI Katana 17 B13VFK | |
| AIDA64 / CPU SHA3 | |
| Asus ROG Strix G17 G713PI | |
| Media de la clase Gaming (2180 - 10115, n=105, últimos 2 años) | |
| Medio Intel Core i7-13700HX (3359 - 5053, n=11) | |
| Acer Predator Helios 300 (i7-12700H, RTX 3070 Ti) | |
| Aorus 15X ASF | |
| Razer Blade 15 OLED (Early 2022) | |
| MSI Katana 17 B13VFK | |
| AIDA64 / CPU Queen | |
| Asus ROG Strix G17 G713PI | |
| Media de la clase Gaming (49785 - 173351, n=90, últimos 2 años) | |
| Aorus 15X ASF | |
| Medio Intel Core i7-13700HX (86532 - 114717, n=11) | |
| Razer Blade 15 OLED (Early 2022) | |
| Acer Predator Helios 300 (i7-12700H, RTX 3070 Ti) | |
| MSI Katana 17 B13VFK | |
| AIDA64 / FPU SinJulia | |
| Asus ROG Strix G17 G713PI | |
| Media de la clase Gaming (4424 - 33636, n=105, últimos 2 años) | |
| Medio Intel Core i7-13700HX (9290 - 13519, n=11) | |
| Aorus 15X ASF | |
| Acer Predator Helios 300 (i7-12700H, RTX 3070 Ti) | |
| Razer Blade 15 OLED (Early 2022) | |
| MSI Katana 17 B13VFK | |
| AIDA64 / FPU Mandel | |
| Asus ROG Strix G17 G713PI | |
| Media de la clase Gaming (25115 - 128721, n=105, últimos 2 años) | |
| Medio Intel Core i7-13700HX (35751 - 53484, n=11) | |
| Acer Predator Helios 300 (i7-12700H, RTX 3070 Ti) | |
| Aorus 15X ASF | |
| Razer Blade 15 OLED (Early 2022) | |
| MSI Katana 17 B13VFK | |
| AIDA64 / CPU AES | |
| Asus ROG Strix G17 G713PI | |
| Aorus 15X ASF | |
| Medio Intel Core i7-13700HX (67846 - 182575, n=11) | |
| Media de la clase Gaming (39258 - 247074, n=105, últimos 2 años) | |
| Razer Blade 15 OLED (Early 2022) | |
| Acer Predator Helios 300 (i7-12700H, RTX 3070 Ti) | |
| MSI Katana 17 B13VFK | |
| AIDA64 / CPU ZLib | |
| Asus ROG Strix G17 G713PI | |
| Media de la clase Gaming (574 - 2531, n=105, últimos 2 años) | |
| Medio Intel Core i7-13700HX (981 - 1451, n=11) | |
| Acer Predator Helios 300 (i7-12700H, RTX 3070 Ti) | |
| Aorus 15X ASF | |
| Razer Blade 15 OLED (Early 2022) | |
| MSI Katana 17 B13VFK | |
| AIDA64 / FP64 Ray-Trace | |
| Asus ROG Strix G17 G713PI | |
| Media de la clase Gaming (5509 - 45446, n=105, últimos 2 años) | |
| Medio Intel Core i7-13700HX (7728 - 11837, n=11) | |
| Acer Predator Helios 300 (i7-12700H, RTX 3070 Ti) | |
| Aorus 15X ASF | |
| MSI Katana 17 B13VFK | |
| Razer Blade 15 OLED (Early 2022) | |
| AIDA64 / CPU PhotoWorxx | |
| Media de la clase Gaming (12271 - 89891, n=105, últimos 2 años) | |
| Acer Predator Helios 300 (i7-12700H, RTX 3070 Ti) | |
| Aorus 15X ASF | |
| Medio Intel Core i7-13700HX (19678 - 42415, n=11) | |
| Razer Blade 15 OLED (Early 2022) | |
| Razer Blade 15 OLED (Early 2022) | |
| MSI Katana 17 B13VFK | |
| Asus ROG Strix G17 G713PI | |
Rendimiento del sistema
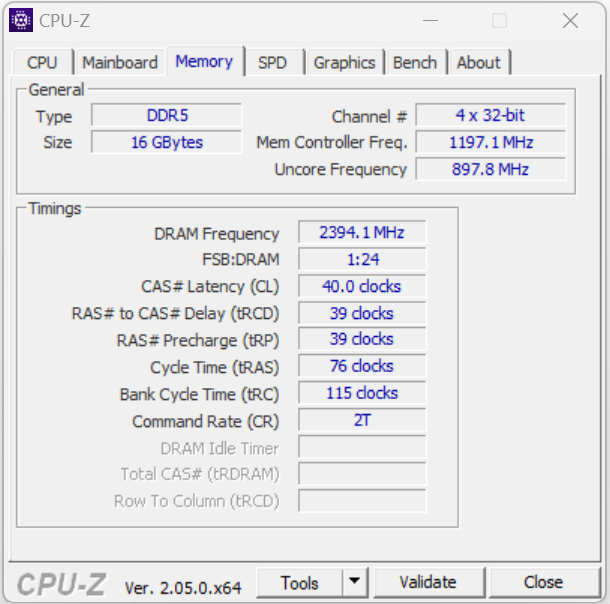
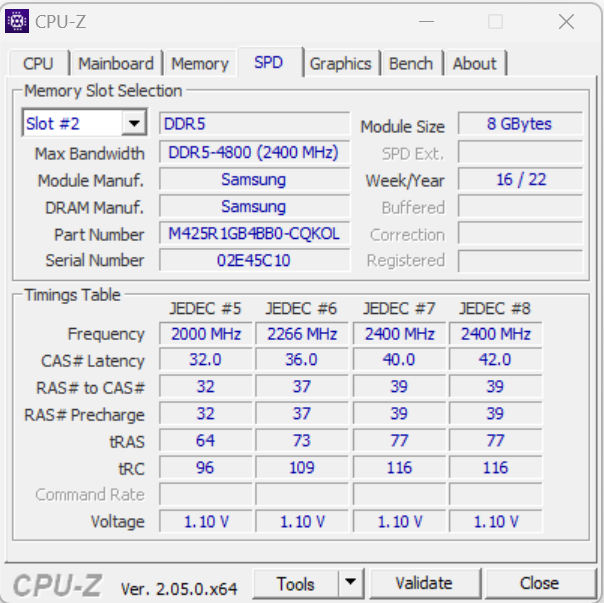
La hoja de especificaciones ya lo revela: los usuarios del 15X no tienen que preocuparse por la falta de rendimiento. El sistema de funcionamiento fluido está bien preparado para tareas exigentes como renderizado o juegos - los buenos resultados PCMark lo confirman. Las tasas de transferencia de RAM no muestran nada inusual y están en un nivel normal para RAM DDR5-4800.
CrossMark: Overall | Productivity | Creativity | Responsiveness
| PCMark 10 / Score | |
| Media de la clase Gaming (5828 - 12414, n=93, últimos 2 años) | |
| Acer Predator Helios 300 (i7-12700H, RTX 3070 Ti) | |
| Medio Intel Core i7-13700HX, NVIDIA GeForce RTX 4070 Laptop GPU (7178 - 8486, n=4) | |
| Asus ROG Strix G17 G713PI | |
| Razer Blade 15 OLED (Early 2022) | |
| Aorus 15X ASF | |
| MSI Katana 17 B13VFK | |
| PCMark 10 / Essentials | |
| Asus ROG Strix G17 G713PI | |
| MSI Katana 17 B13VFK | |
| Aorus 15X ASF | |
| Acer Predator Helios 300 (i7-12700H, RTX 3070 Ti) | |
| Media de la clase Gaming (8810 - 11935, n=97, últimos 2 años) | |
| Medio Intel Core i7-13700HX, NVIDIA GeForce RTX 4070 Laptop GPU (9679 - 11652, n=4) | |
| Razer Blade 15 OLED (Early 2022) | |
| PCMark 10 / Productivity | |
| Media de la clase Gaming (6845 - 25323, n=95, últimos 2 años) | |
| Asus ROG Strix G17 G713PI | |
| Razer Blade 15 OLED (Early 2022) | |
| Acer Predator Helios 300 (i7-12700H, RTX 3070 Ti) | |
| Medio Intel Core i7-13700HX, NVIDIA GeForce RTX 4070 Laptop GPU (9236 - 10517, n=4) | |
| Aorus 15X ASF | |
| MSI Katana 17 B13VFK | |
| PCMark 10 / Digital Content Creation | |
| Media de la clase Gaming (7602 - 19954, n=95, últimos 2 años) | |
| Acer Predator Helios 300 (i7-12700H, RTX 3070 Ti) | |
| Medio Intel Core i7-13700HX, NVIDIA GeForce RTX 4070 Laptop GPU (9731 - 13534, n=4) | |
| Razer Blade 15 OLED (Early 2022) | |
| MSI Katana 17 B13VFK | |
| Aorus 15X ASF | |
| Asus ROG Strix G17 G713PI | |
| CrossMark / Overall | |
| Aorus 15X ASF | |
| Asus ROG Strix G17 G713PI | |
| Media de la clase Gaming (1366 - 2409, n=94, últimos 2 años) | |
| Medio Intel Core i7-13700HX, NVIDIA GeForce RTX 4070 Laptop GPU (1756 - 2065, n=3) | |
| Acer Predator Helios 300 (i7-12700H, RTX 3070 Ti) | |
| MSI Katana 17 B13VFK | |
| Razer Blade 15 OLED (Early 2022) | |
| CrossMark / Productivity | |
| Aorus 15X ASF | |
| Asus ROG Strix G17 G713PI | |
| Media de la clase Gaming (1386 - 2254, n=94, últimos 2 años) | |
| Medio Intel Core i7-13700HX, NVIDIA GeForce RTX 4070 Laptop GPU (1731 - 1960, n=3) | |
| Acer Predator Helios 300 (i7-12700H, RTX 3070 Ti) | |
| MSI Katana 17 B13VFK | |
| Razer Blade 15 OLED (Early 2022) | |
| CrossMark / Creativity | |
| Asus ROG Strix G17 G713PI | |
| Media de la clase Gaming (1343 - 2786, n=94, últimos 2 años) | |
| Aorus 15X ASF | |
| Acer Predator Helios 300 (i7-12700H, RTX 3070 Ti) | |
| Medio Intel Core i7-13700HX, NVIDIA GeForce RTX 4070 Laptop GPU (1797 - 2193, n=3) | |
| MSI Katana 17 B13VFK | |
| Razer Blade 15 OLED (Early 2022) | |
| CrossMark / Responsiveness | |
| Aorus 15X ASF | |
| Medio Intel Core i7-13700HX, NVIDIA GeForce RTX 4070 Laptop GPU (1708 - 2016, n=3) | |
| MSI Katana 17 B13VFK | |
| Acer Predator Helios 300 (i7-12700H, RTX 3070 Ti) | |
| Media de la clase Gaming (1226 - 2334, n=94, últimos 2 años) | |
| Asus ROG Strix G17 G713PI | |
| Razer Blade 15 OLED (Early 2022) | |
| PCMark 8 Home Score Accelerated v2 | 4764 puntos | |
| PCMark 8 Work Score Accelerated v2 | 5976 puntos | |
| PCMark 10 Score | 7178 puntos | |
ayuda | ||
| AIDA64 / Memory Copy | |
| Media de la clase Gaming (21750 - 129946, n=105, últimos 2 años) | |
| Aorus 15X ASF | |
| Acer Predator Helios 300 (i7-12700H, RTX 3070 Ti) | |
| Razer Blade 15 OLED (Early 2022) | |
| Medio Intel Core i7-13700HX (36125 - 63990, n=11) | |
| MSI Katana 17 B13VFK | |
| Asus ROG Strix G17 G713PI | |
| AIDA64 / Memory Read | |
| Media de la clase Gaming (22956 - 118858, n=105, últimos 2 años) | |
| Aorus 15X ASF | |
| MSI Katana 17 B13VFK | |
| Razer Blade 15 OLED (Early 2022) | |
| Medio Intel Core i7-13700HX (36510 - 69729, n=11) | |
| Asus ROG Strix G17 G713PI | |
| Acer Predator Helios 300 (i7-12700H, RTX 3070 Ti) | |
| AIDA64 / Memory Write | |
| Media de la clase Gaming (22297 - 135096, n=105, últimos 2 años) | |
| Medio Intel Core i7-13700HX (33598 - 85675, n=11) | |
| Asus ROG Strix G17 G713PI | |
| Razer Blade 15 OLED (Early 2022) | |
| Acer Predator Helios 300 (i7-12700H, RTX 3070 Ti) | |
| Aorus 15X ASF | |
| MSI Katana 17 B13VFK | |
| AIDA64 / Memory Latency | |
| Media de la clase Gaming (75.3 - 259, n=105, últimos 2 años) | |
| MSI Katana 17 B13VFK | |
| Razer Blade 15 OLED (Early 2022) | |
| Acer Predator Helios 300 (i7-12700H, RTX 3070 Ti) | |
| Medio Intel Core i7-13700HX (81.5 - 97.9, n=11) | |
| Asus ROG Strix G17 G713PI | |
| Aorus 15X ASF | |
* ... más pequeño es mejor
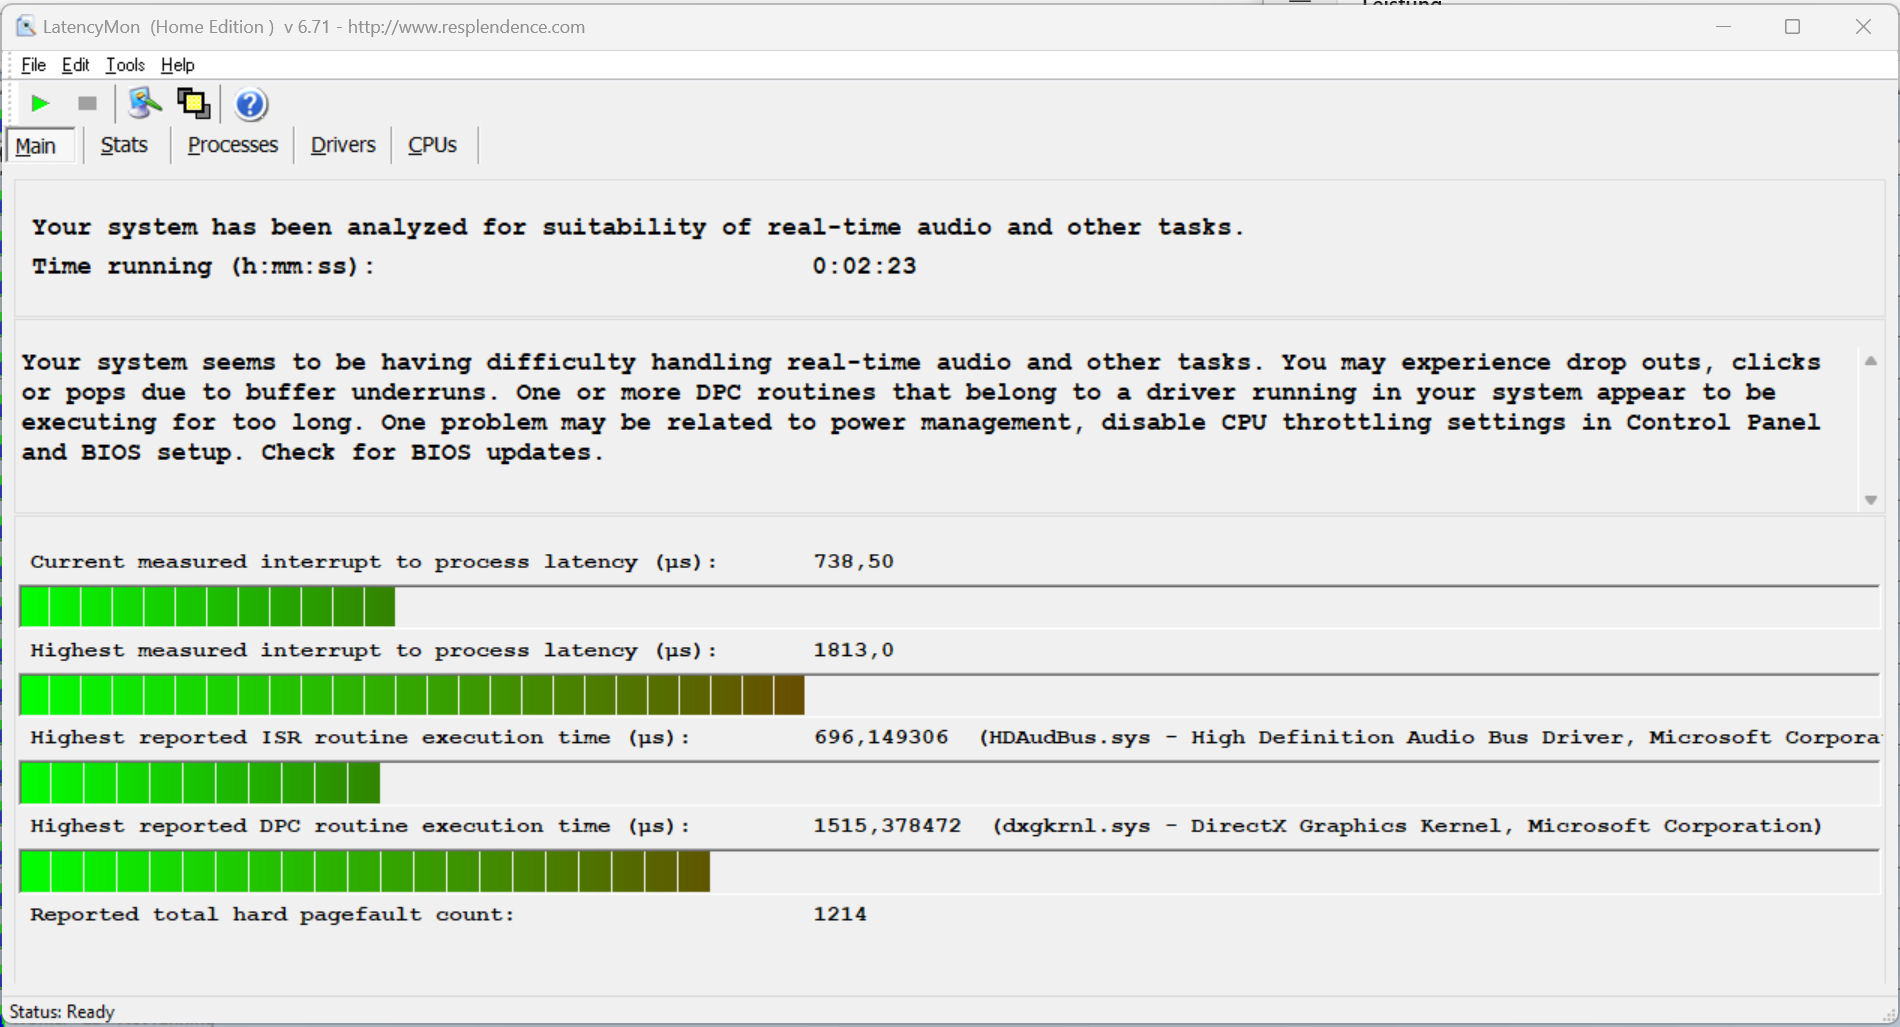
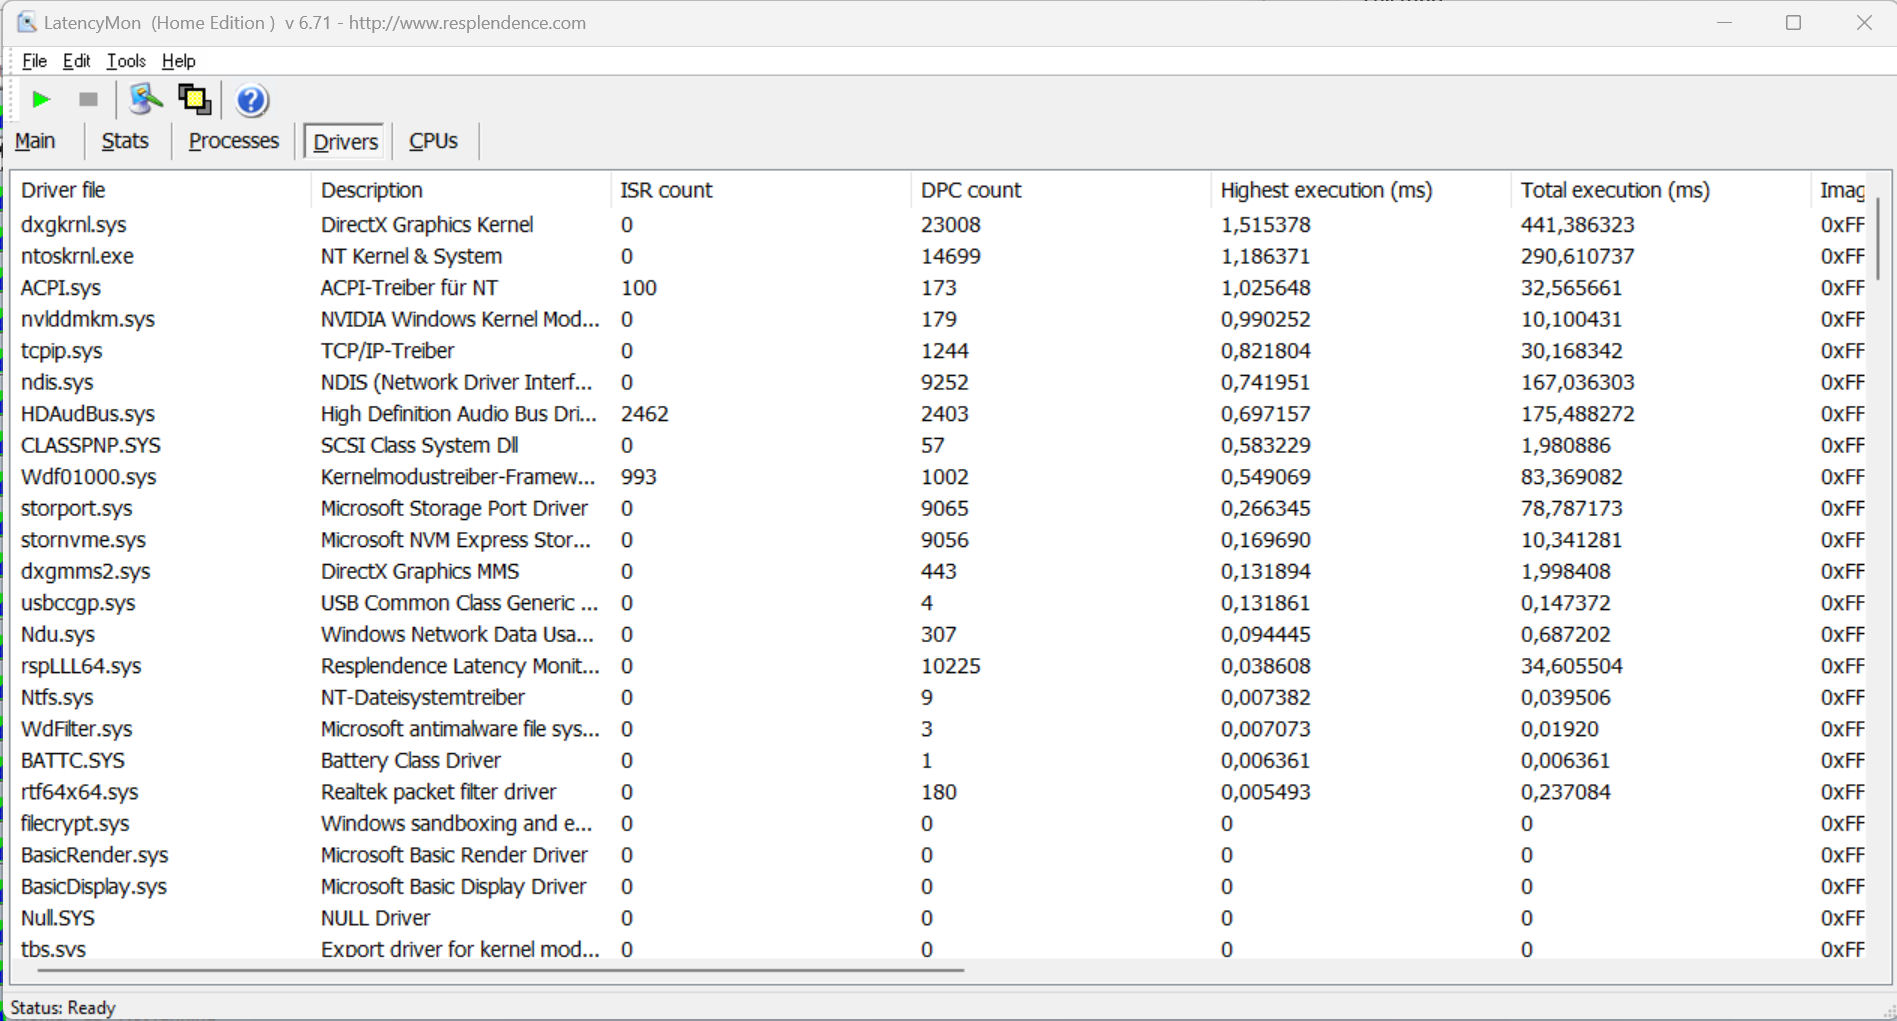
Latencia del CPD
La prueba de monitorización de latencia estandarizada (navegación web, reproducción de vídeo 4k, Prime95 a alta carga) reveló algunas anomalías. Este sistema no parece adecuado para la edición de vídeo y audio en tiempo real. Las futuras actualizaciones de software podrían aportar algunas mejoras, pero también podrían empeorar este problema.
| DPC Latencies / LatencyMon - interrupt to process latency (max), Web, Youtube, Prime95 | |
| MSI Katana 17 B13VFK | |
| Aorus 15X ASF | |
| Acer Predator Helios 300 (i7-12700H, RTX 3070 Ti) | |
| Asus ROG Strix G17 G713PI | |
| Razer Blade 15 OLED (Early 2022) | |
* ... más pequeño es mejor
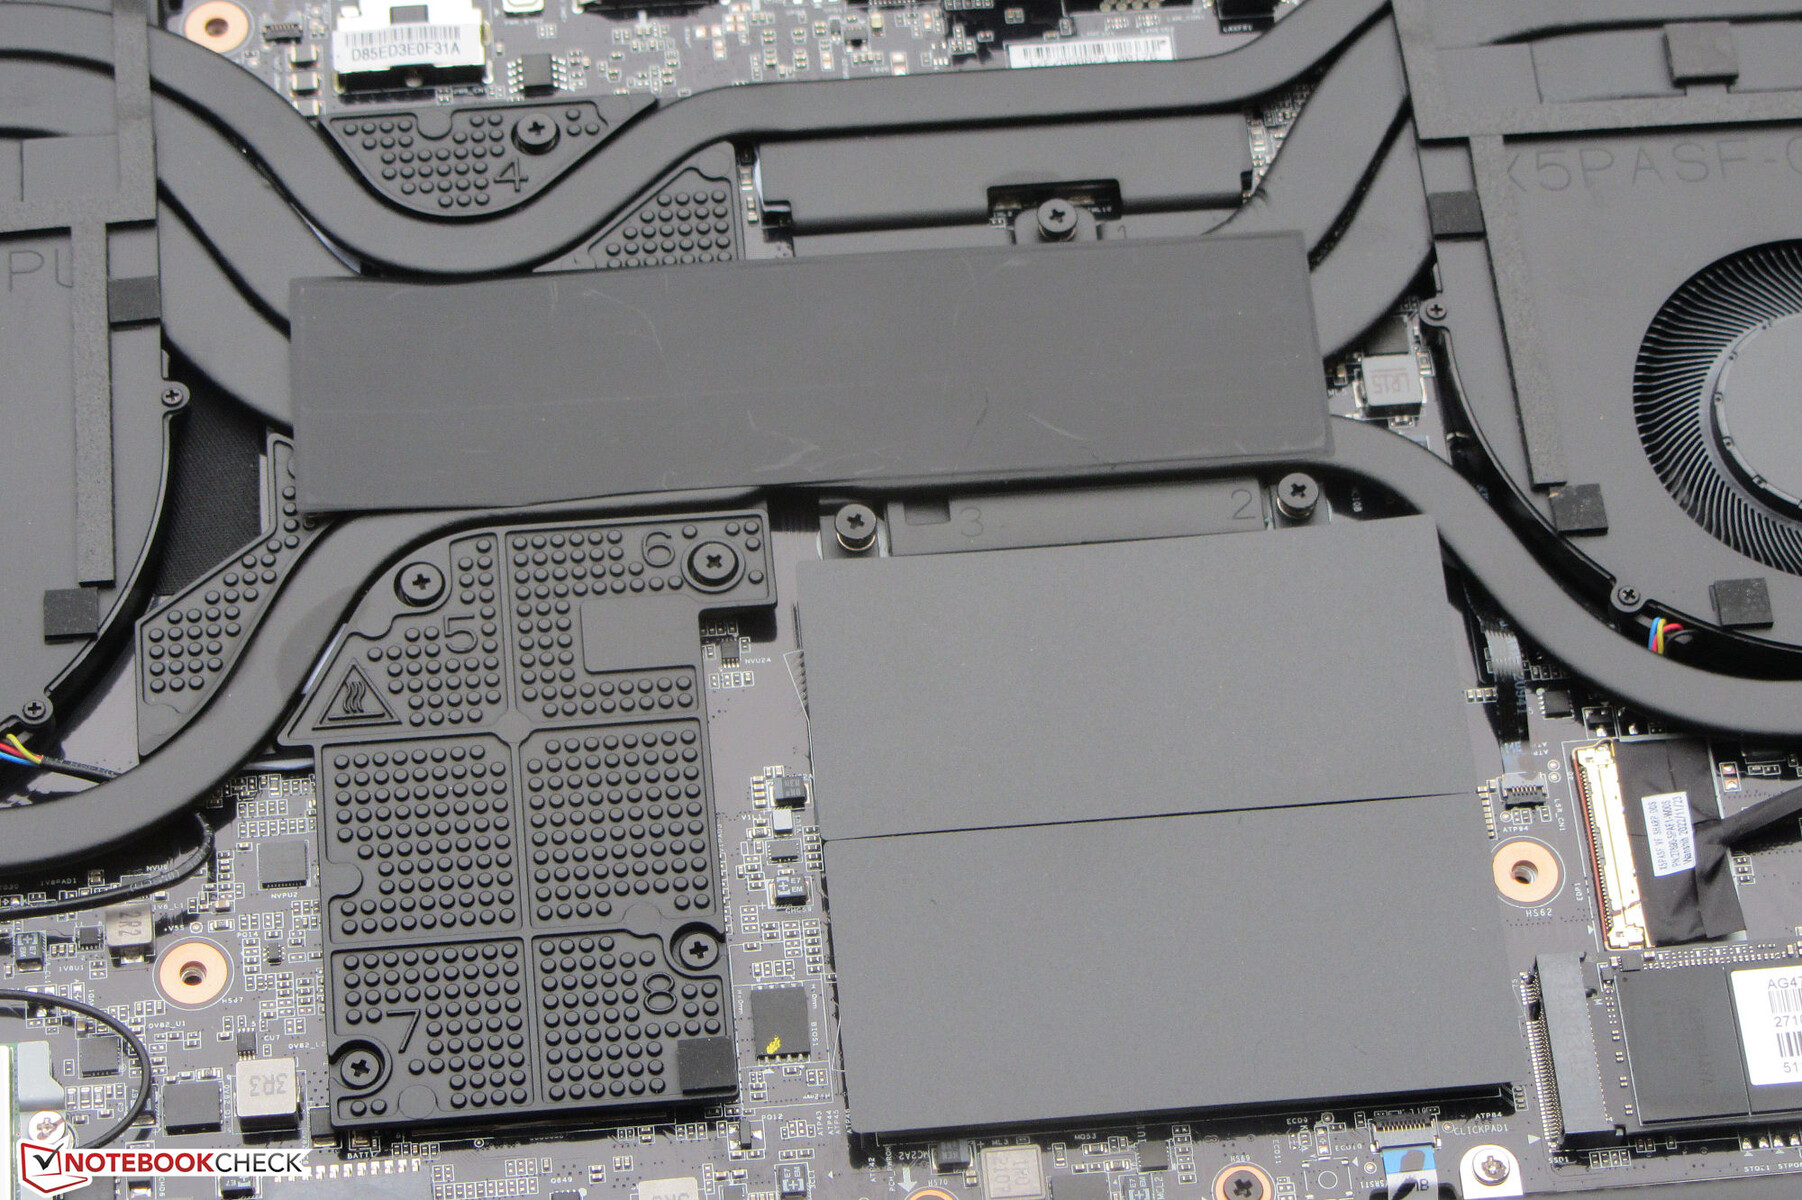
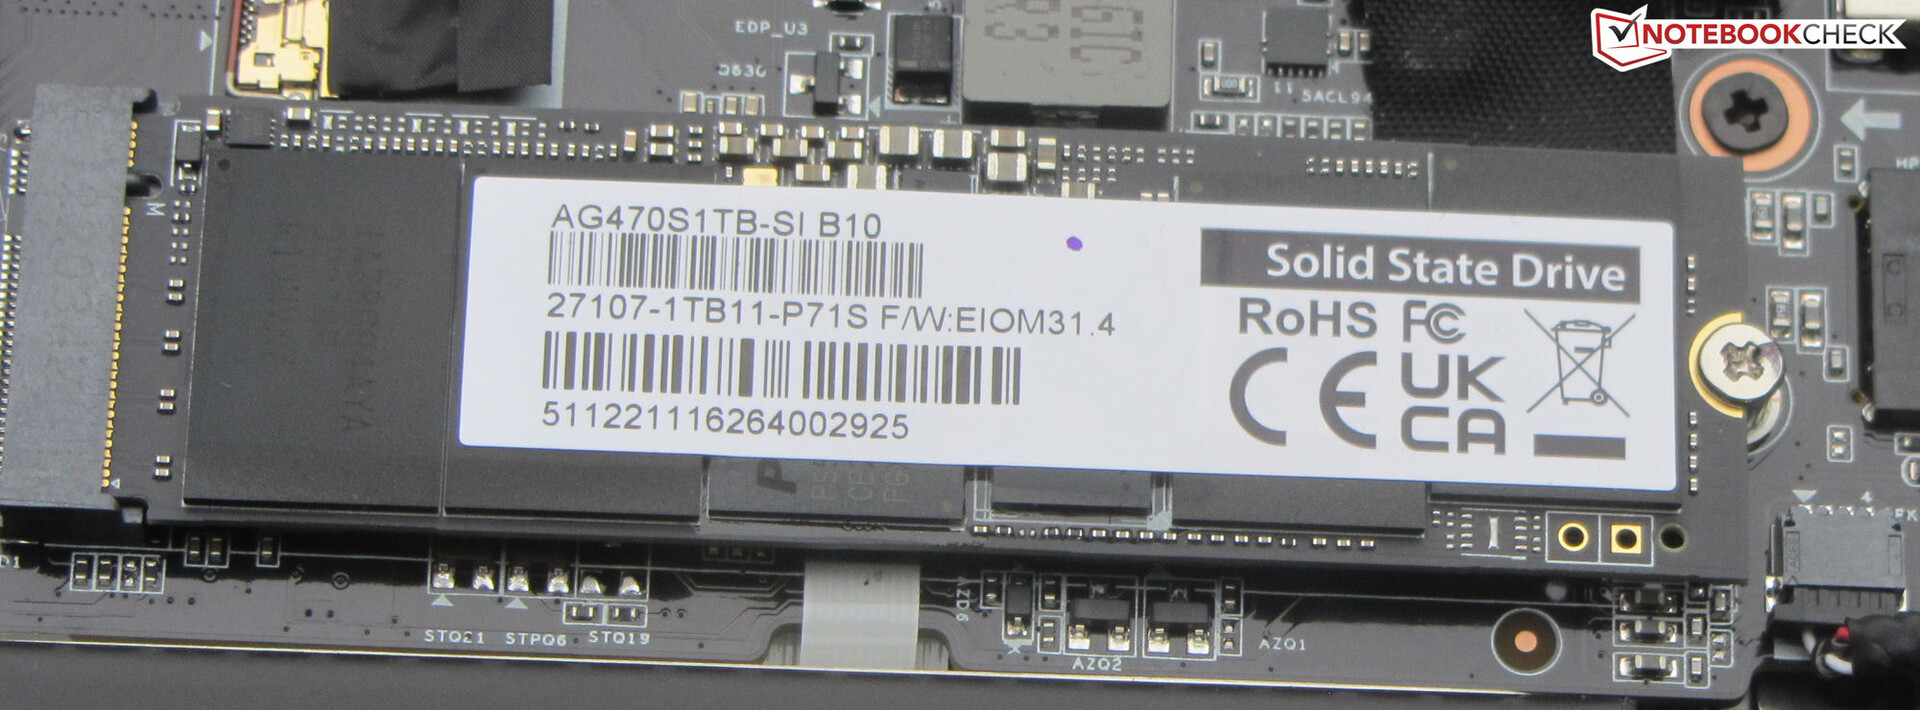
Dispositivos de almacenamiento
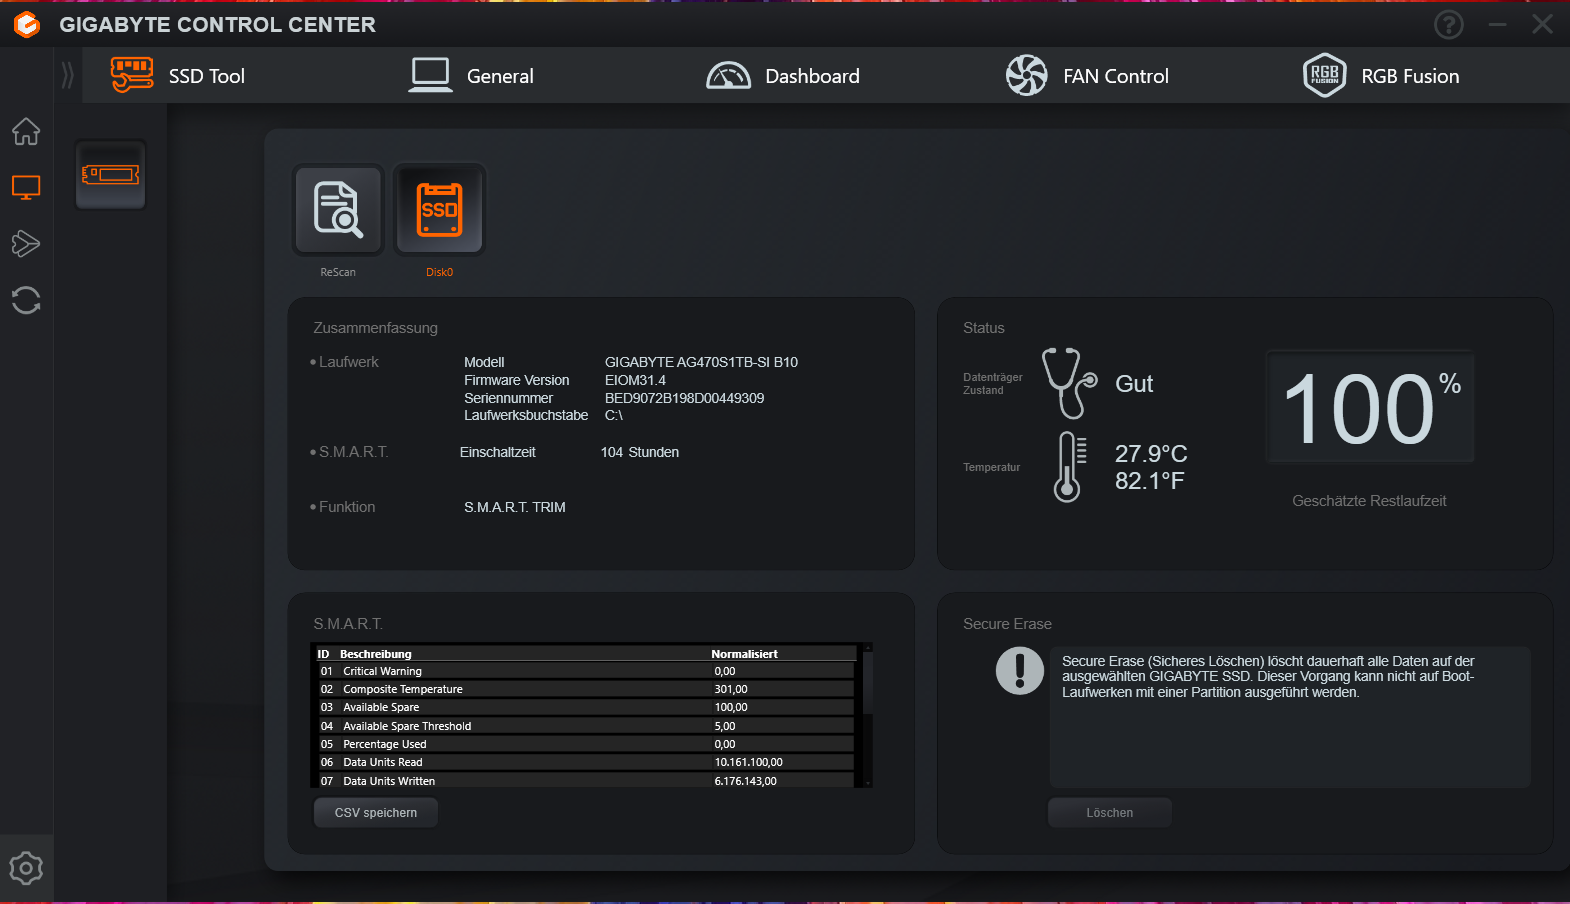
El 15X tiene espacio para dos SSDs PCIe-4 en formato M.2-2280 - sin embargo, sólo se incluye uno con el portátil. El modelo PCIe-4 instalado (1 TB) de Gigabyte ofrece muy buenas tasas de transferencia. Sin embargo: En el transcurso posterior del bucle DiskSpd, se pudieron observar caídas ocasionales de rendimiento - probablemente debido al ahogo térmico.

* ... más pequeño es mejor
Reading continuous performance: DiskSpd Read Loop, Queue Depth 8
Tarjeta gráfica
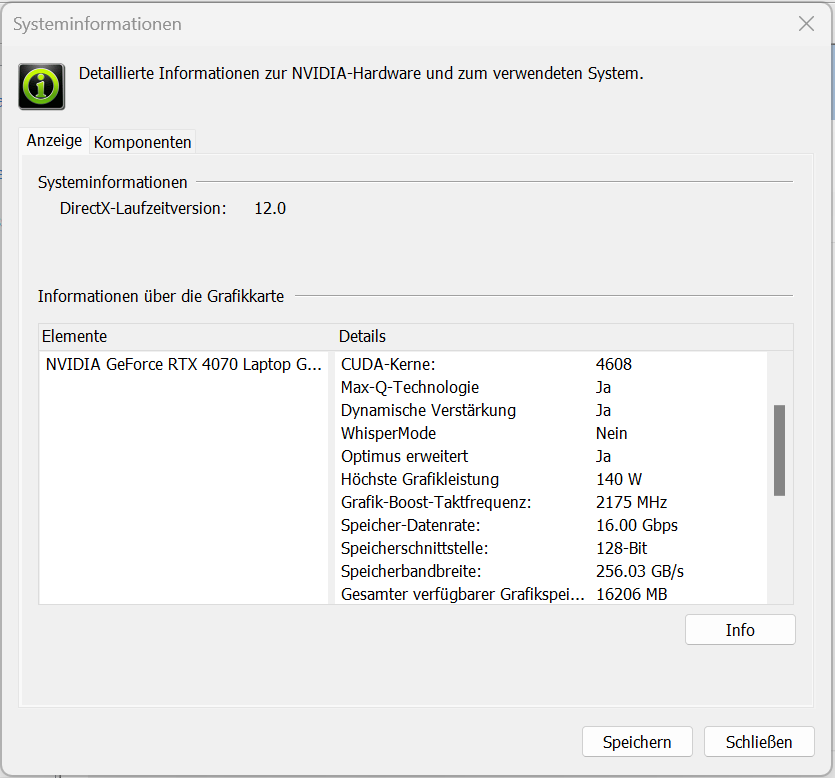
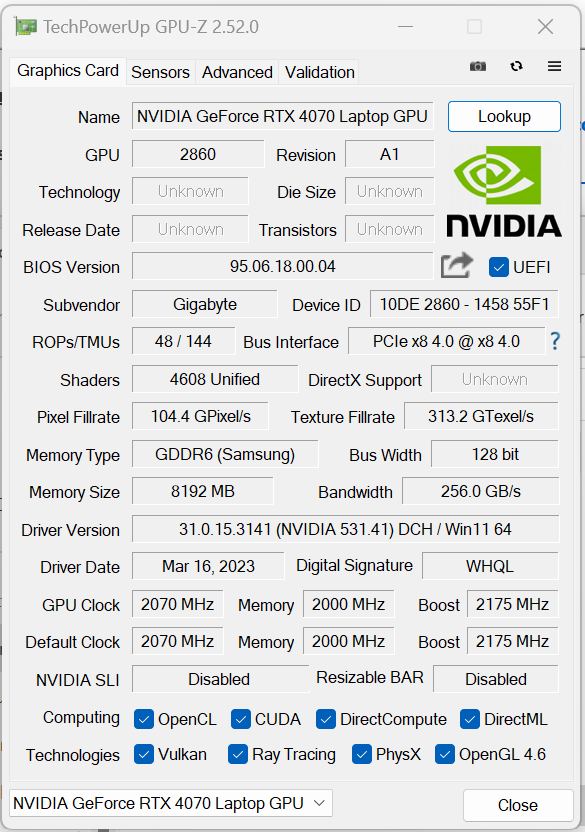
Aorus confía en unaGeForce-RTX-4070 gPU de portátil y le concede el máximo TGP posible de 140w (115w + 25w Dynamic Boost) - esto no se usa completamente según el Witcher 3 prueba. La GPU tiene 4.608 shaders, un bus de 128 bits de ancho y memoria GDDR6 rápida (8.192 MB).
Los resultados del benchmark fueron superiores a la media de la anterior RTX 4070. El modo dGPU no produjo ninguna mejora. Alternar entre dGPU y Optimus no requirió reiniciar - Advanced Optimus es compatible.

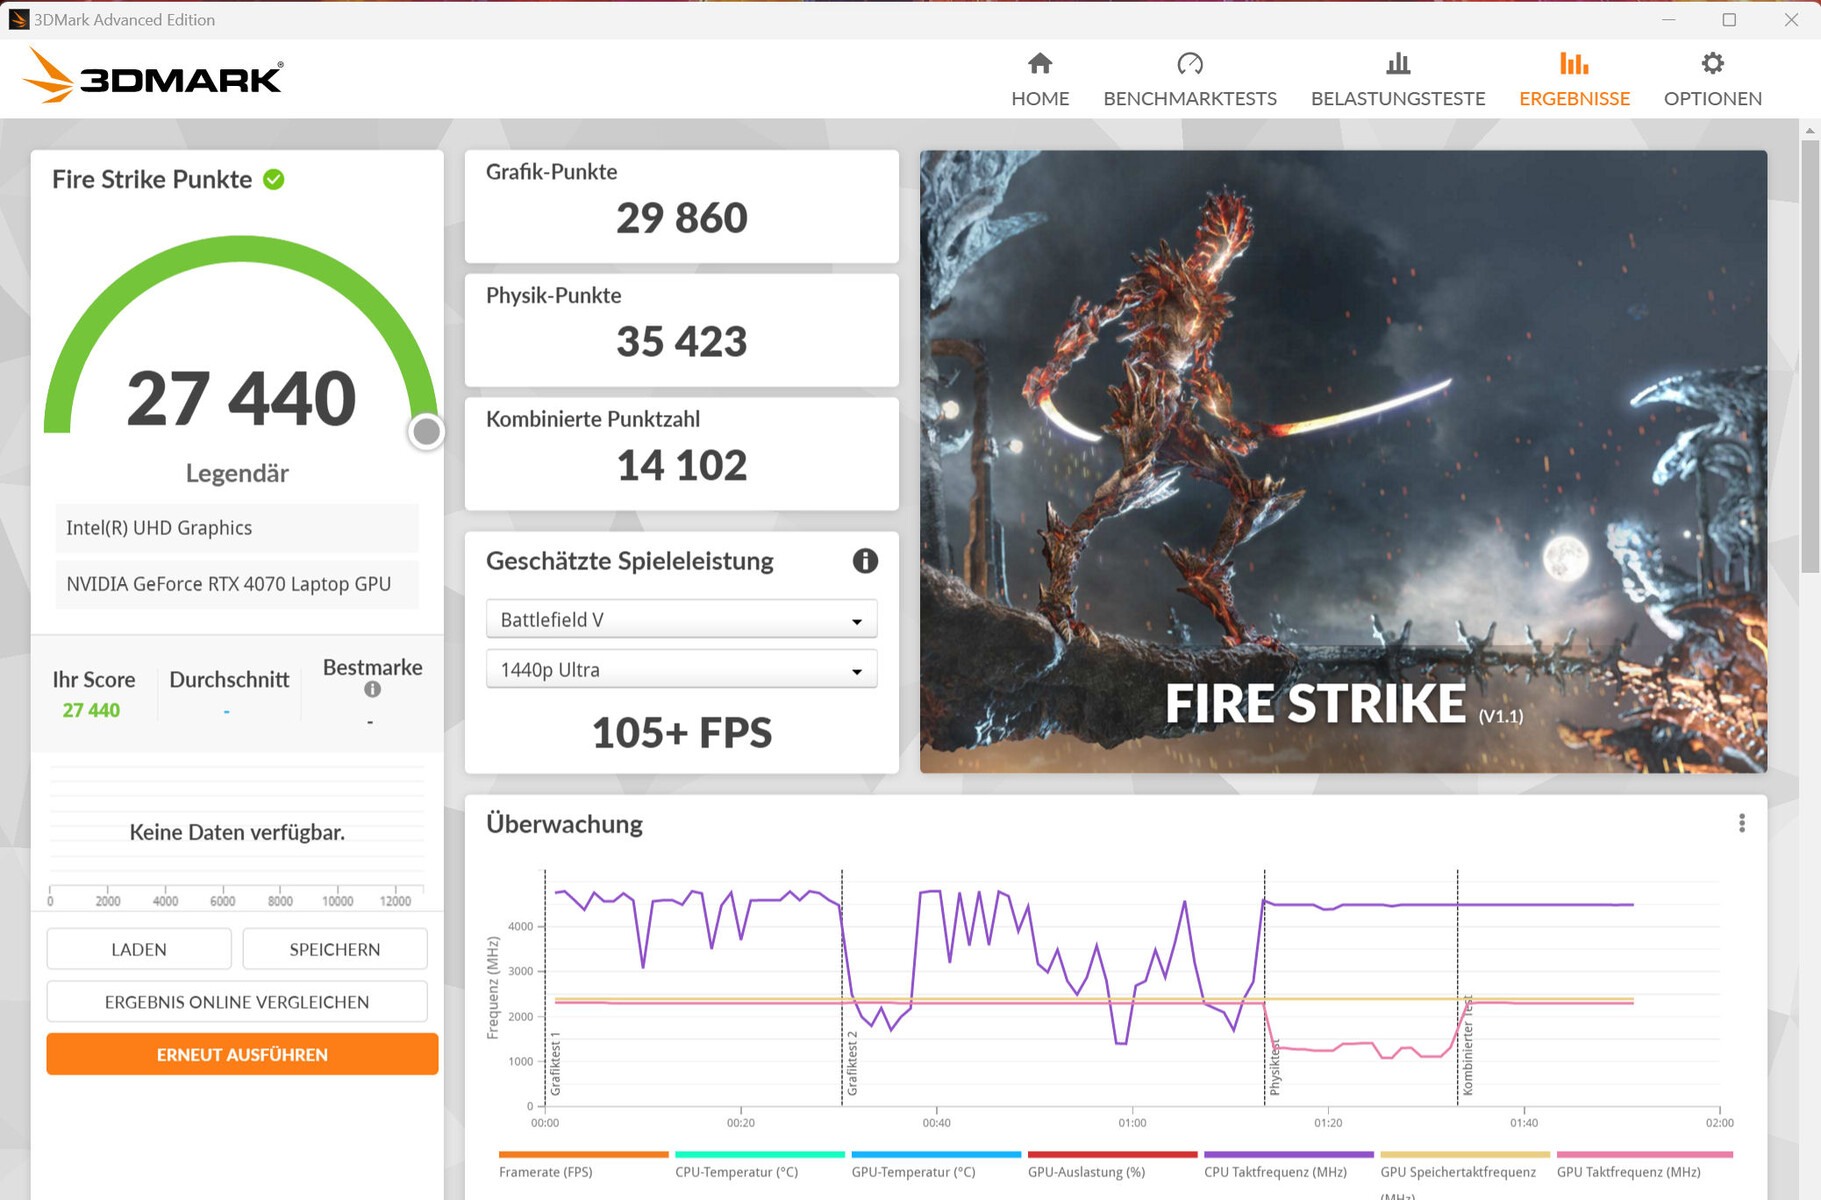

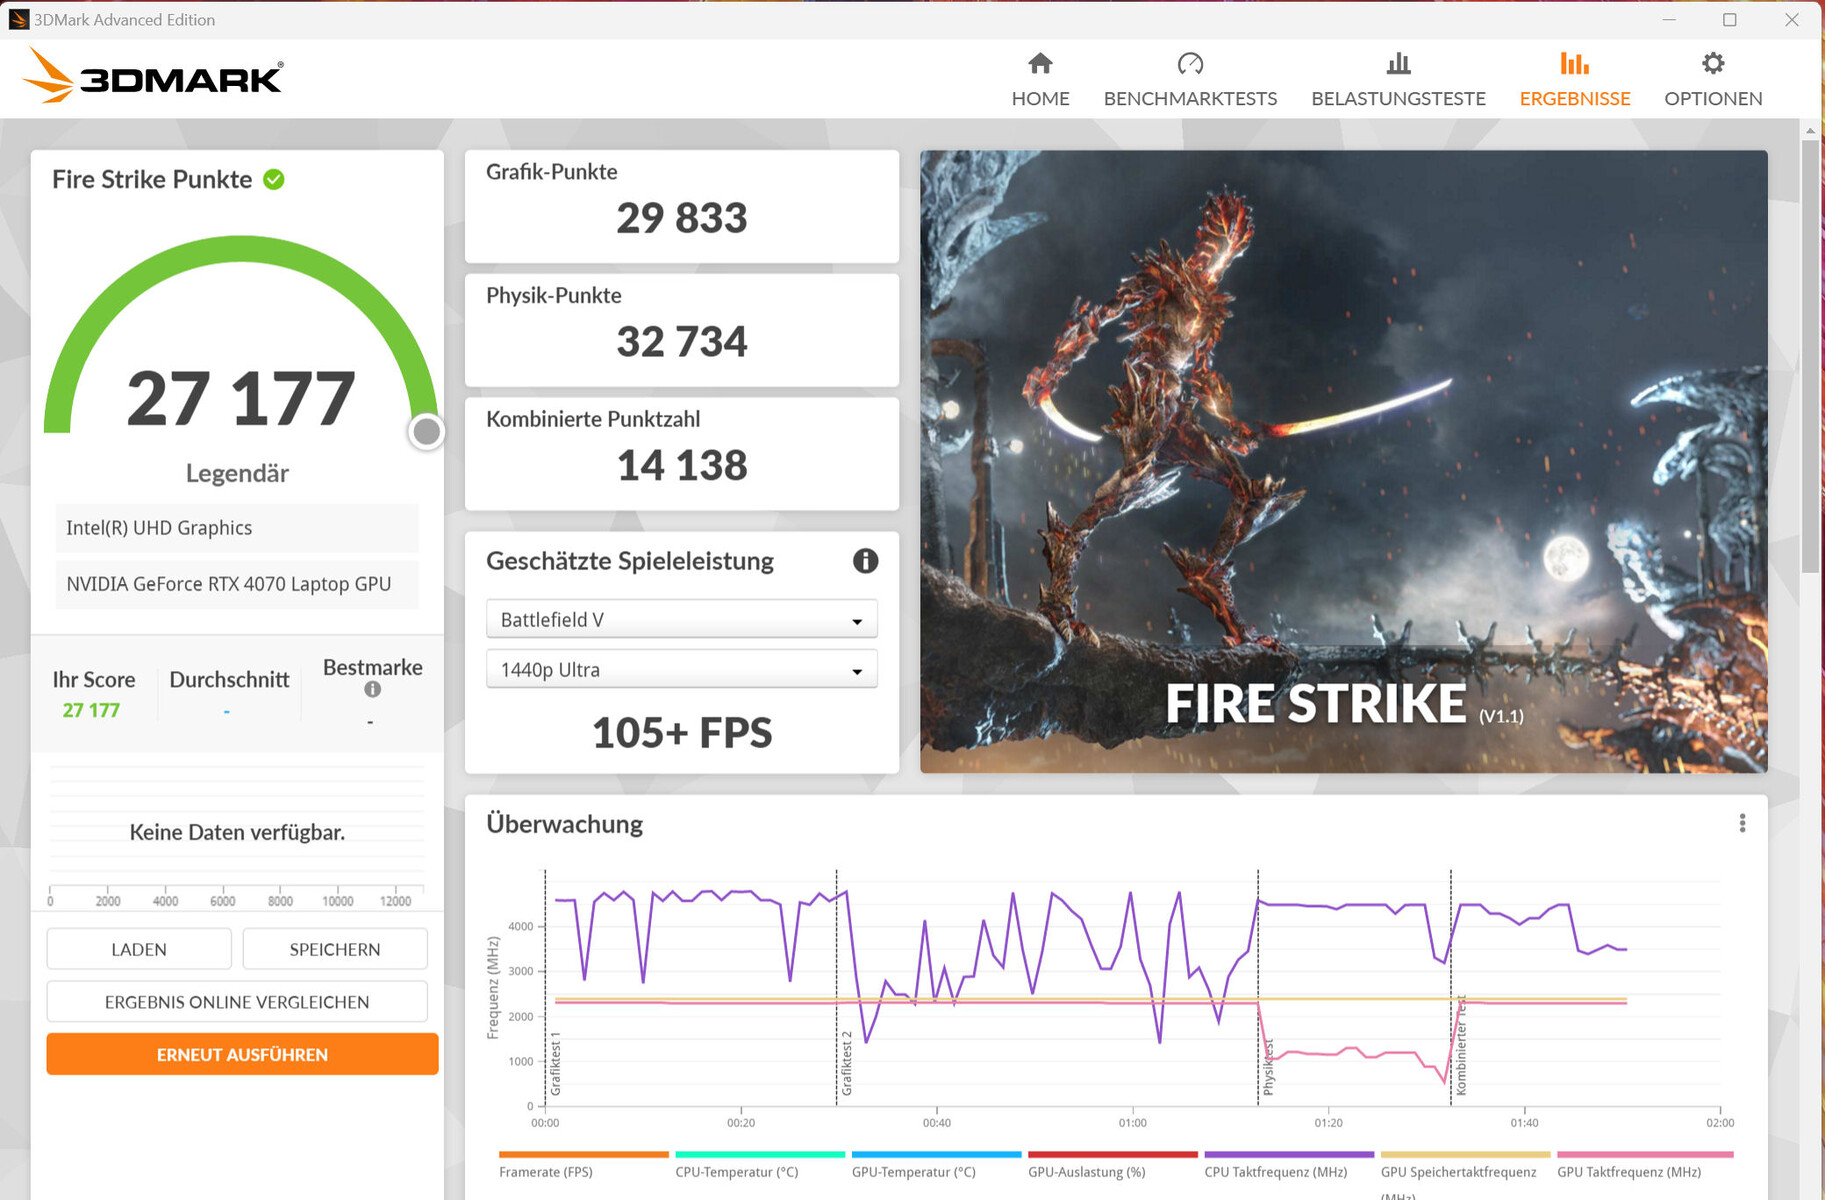
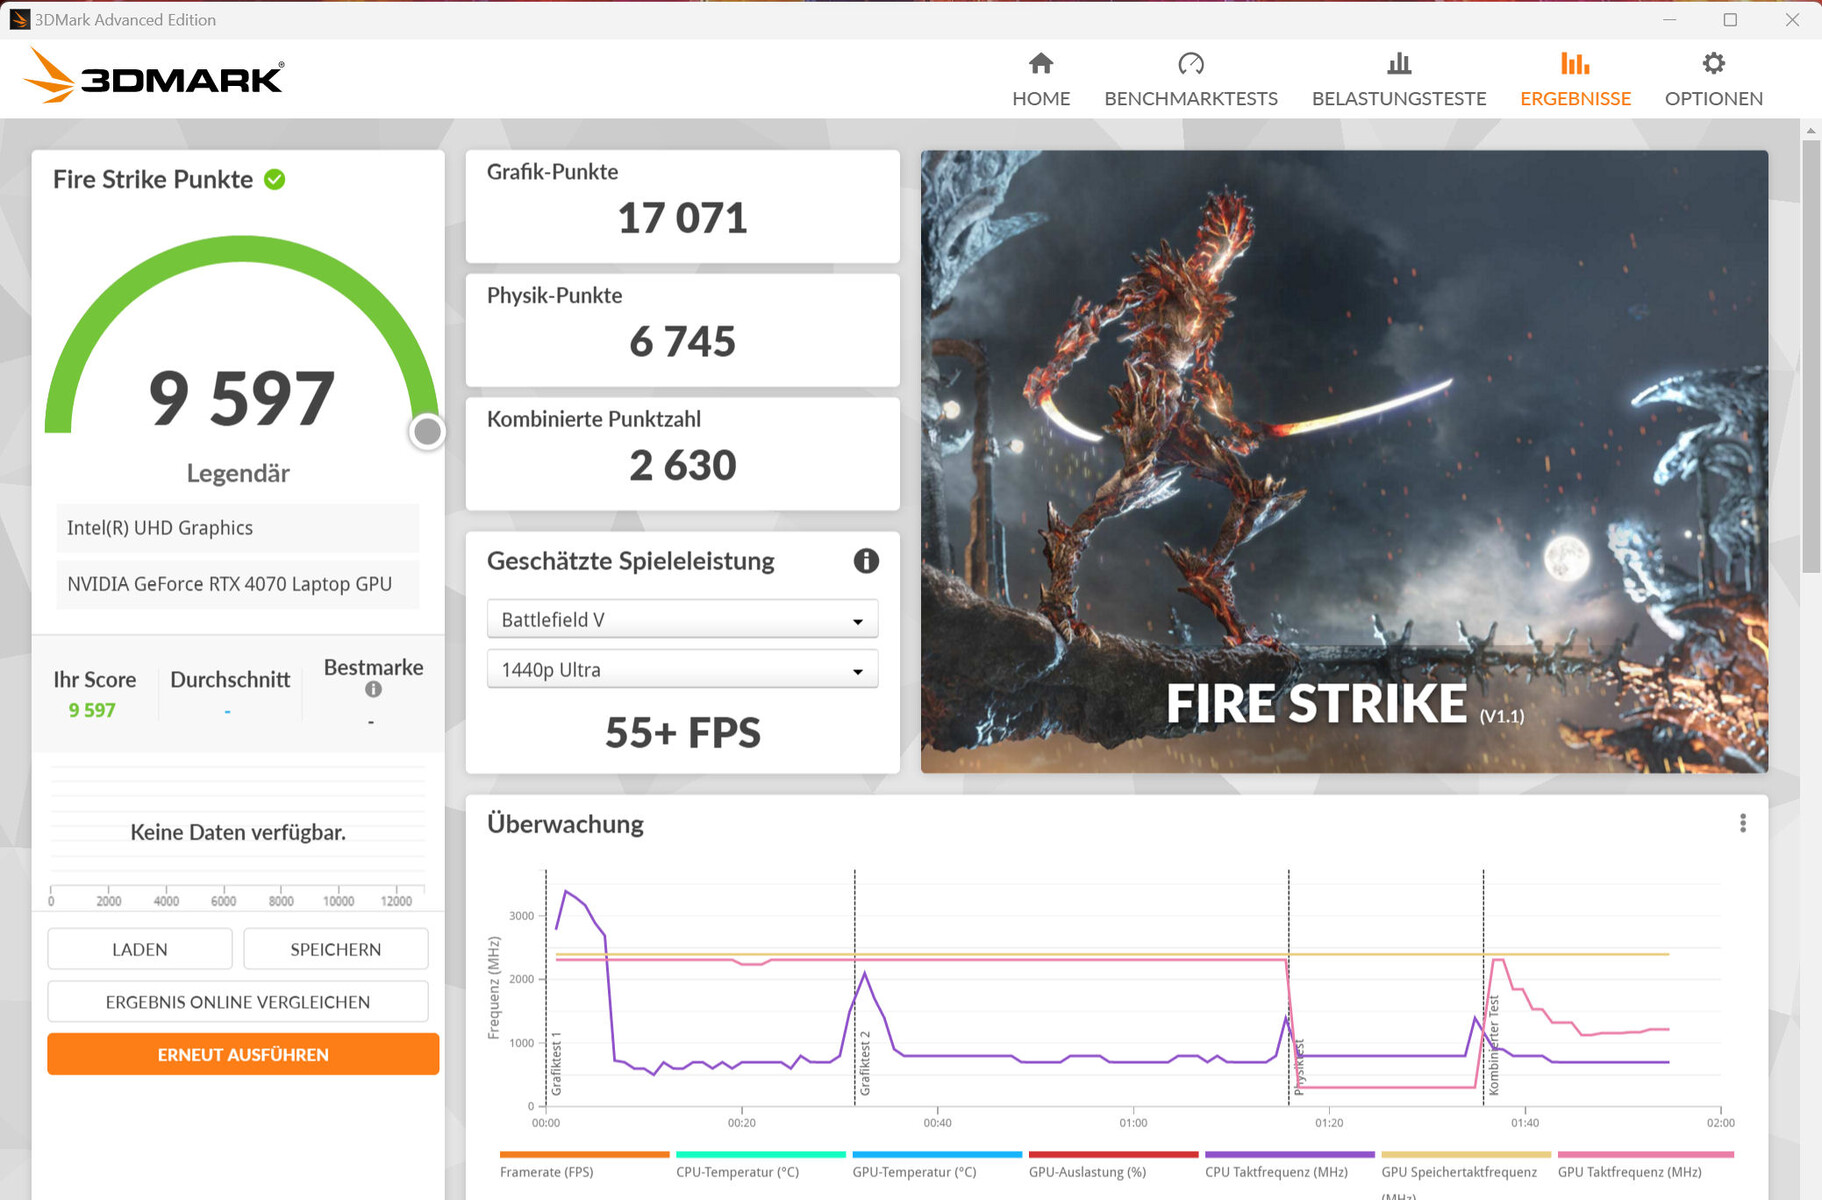
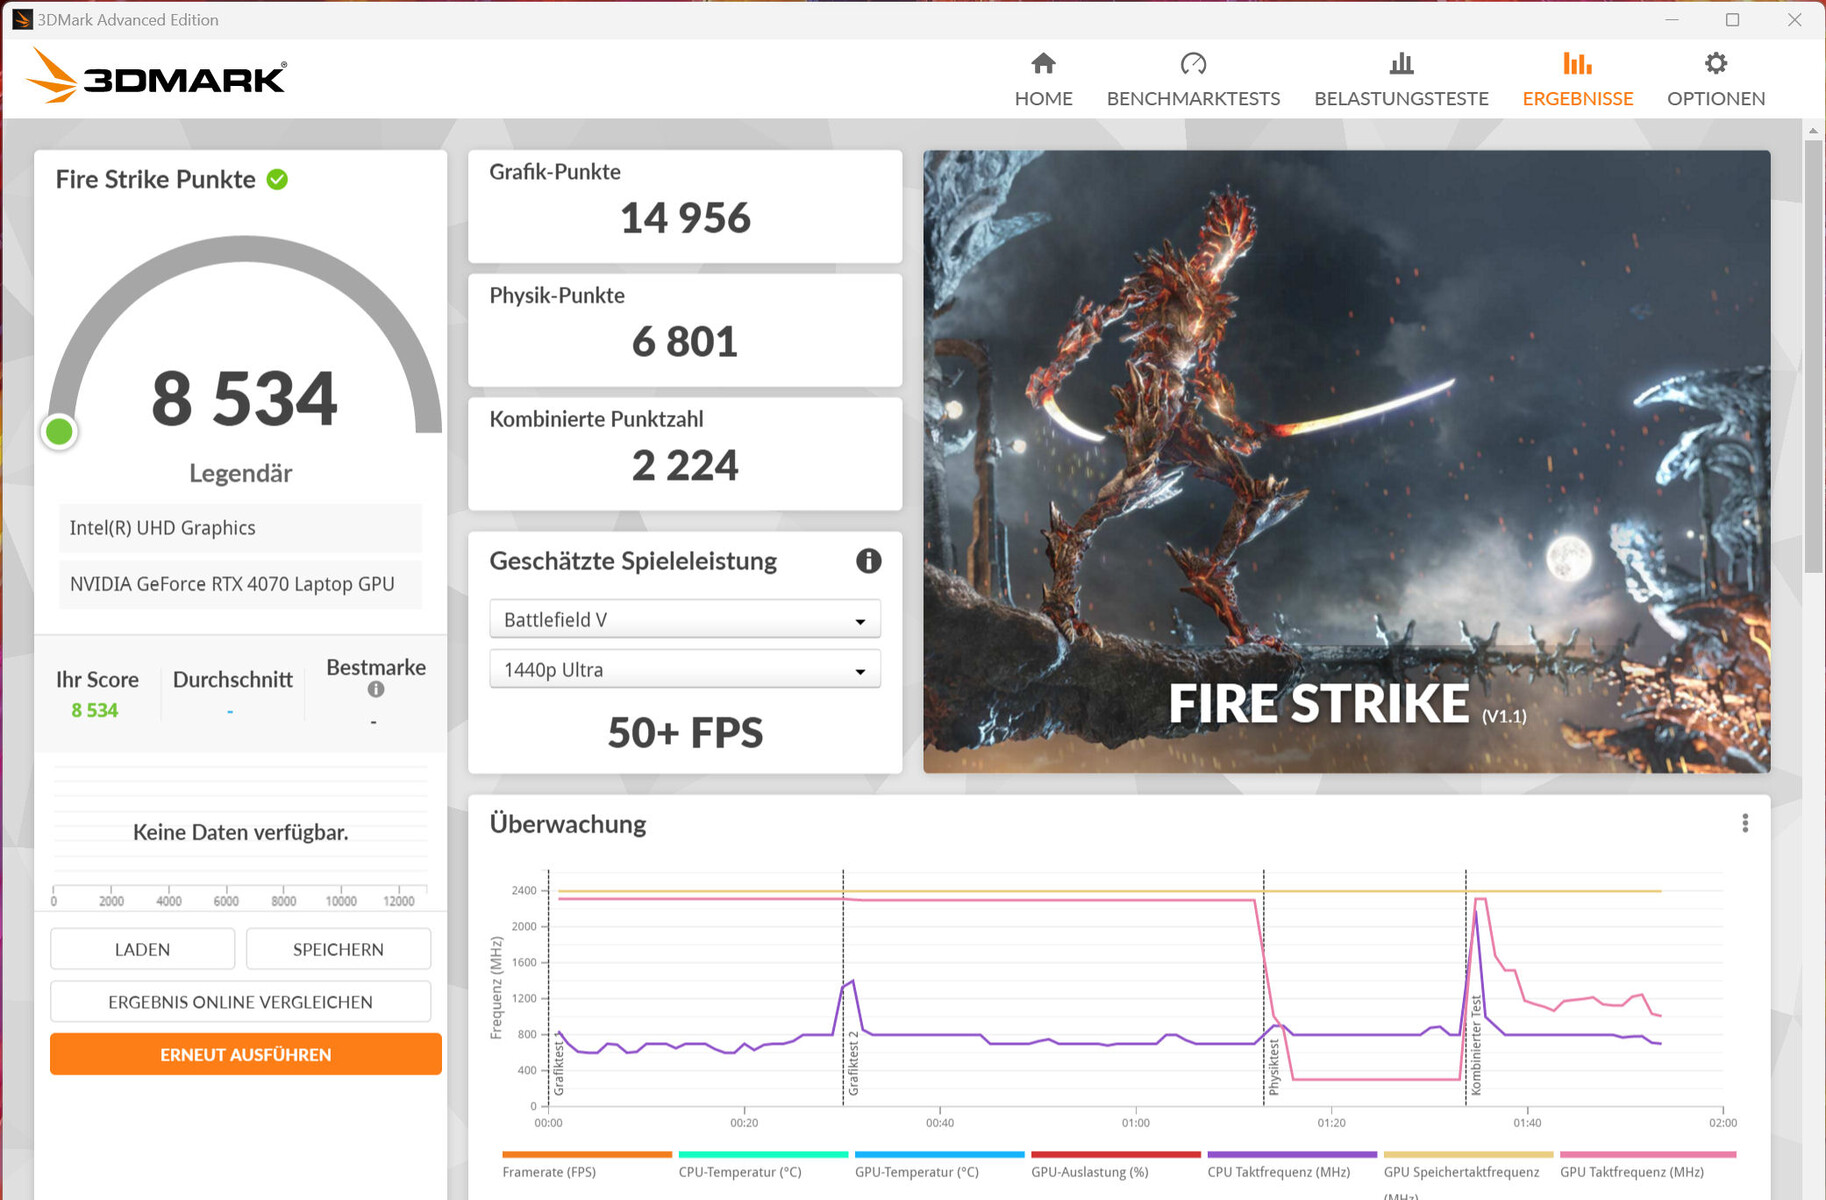

| 3DMark 06 Standard Score | 55615 puntos | |
| 3DMark 11 Performance | 34985 puntos | |
| 3DMark Cloud Gate Standard Score | 65819 puntos | |
| 3DMark Fire Strike Score | 27468 puntos | |
| 3DMark Time Spy Score | 12421 puntos | |
ayuda | ||
* ... más pequeño es mejor
Rendimiento de juego
El portátil está diseñado para juegos QHD con ajustes de altos a máximos. Resoluciones superiores serían posibles con el monitor correspondiente - posiblemente con ajustes reducidos. Las tasas de frames de los juegos que probamos estaban a la par con la media determinada de RTX 4070. El modo dGPU aumentó ligeramente las frecuencias de cuadro de algunos juegos.
| The Witcher 3 - 1920x1080 Ultra Graphics & Postprocessing (HBAO+) | |
| Media de la clase Gaming (104.7 - 240, n=7, últimos 2 años) | |
| Asus ROG Strix G17 G713PI | |
| Acer Predator Helios 300 (i7-12700H, RTX 3070 Ti) | |
| Aorus 15X ASF | |
| Medio NVIDIA GeForce RTX 4070 Laptop GPU (69.8 - 133.7, n=57) | |
| MSI Katana 17 B13VFK | |
| Razer Blade 15 OLED (Early 2022) | |
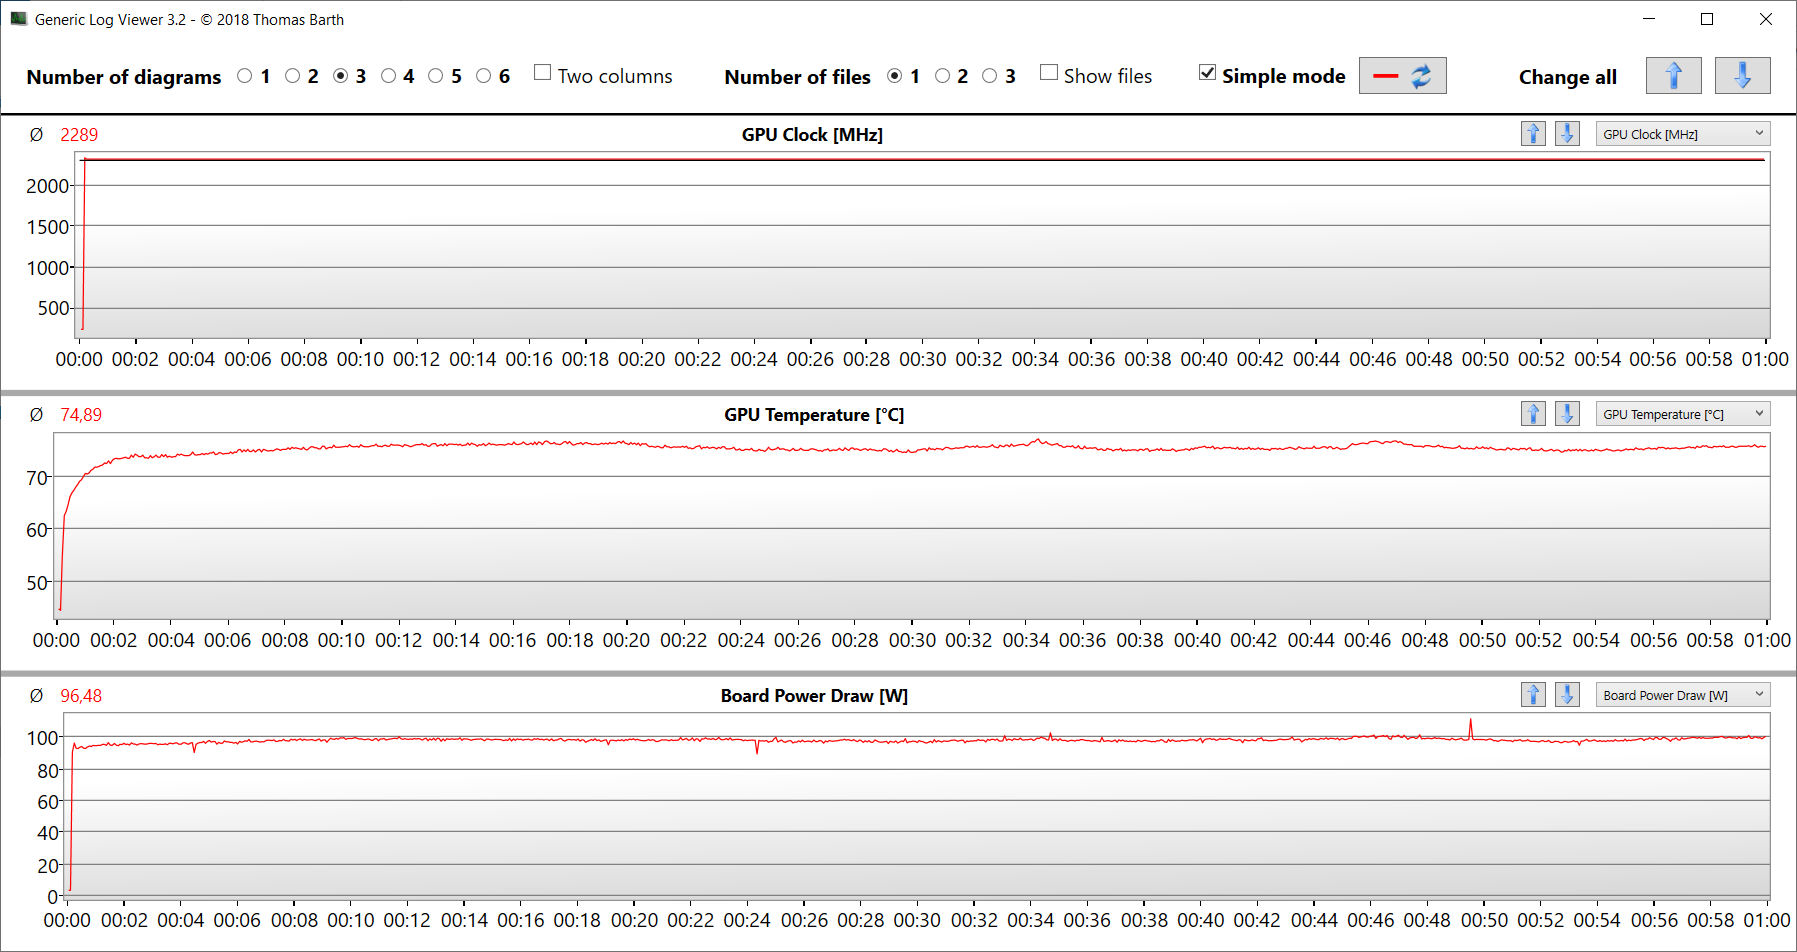
Para comprobar si la frecuencia de imagen se mantenía constante durante un periodo de uso prolongado, ejecutamos el juego The Witcher 3 durante unos 60 minutos en resolución Full HD utilizando los ajustes de máxima calidad. El personaje del juego no se movió. No se notó una caída de la velocidad de fotogramas.
Witcher 3 FPS diagram
| bajo | medio | alto | ultra | QHD | |
|---|---|---|---|---|---|
| GTA V (2015) | 185.1 | 185.9 | 180.2 | 117.8 | 88.8 |
| The Witcher 3 (2015) | 484.7 | 366.3 | 228.3 | 117 | |
| Dota 2 Reborn (2015) | 191.9 | 181.1 | 161.1 | 149.4 | |
| Final Fantasy XV Benchmark (2018) | 208 | 167.2 | 117.5 | 83.7 | |
| X-Plane 11.11 (2018) | 164.9 | 145.5 | 117.1 | ||
| Far Cry 5 (2018) | 183 | 157 | 151 | 141 | 111 |
| Strange Brigade (2018) | 537 | 300 | 235 | 201 | 133.2 |
| Flight Simulator 2020 (2020) | 158.8 | 117.2 | 82.5 | 64.8 | 50.1 |
| F1 22 (2022) | 256 | 251 | 193.7 | 78.7 | 52.2 |
| FIFA 23 (2022) | 166.2 | ||||
| Uncharted Legacy of Thieves Collection (2022) | 92.7 | 89.4 | 84.4 | 82.1 | 61 |
| The Callisto Protocol (2022) | 155.6 | 127.5 | 121.8 | 79.7 | 58.4 |
| Need for Speed Unbound (2022) | 118.1 | 112.1 | 101 | 89.1 | 77.7 |
| High On Life (2023) | 236 | 185.9 | 141.6 | 114 | 68.5 |
| Dead Space Remake (2023) | 100.9 | 95.7 | 85.3 | 82.4 | 53.1 |
| Returnal (2023) | 119 | 117 | 106 | 90 | 66 |
| Atomic Heart (2023) | 199.8 | 158.3 | 96.4 | 79 | 58.9 |
| Company of Heroes 3 (2023) | 228.9 | 205.1 | 159.7 | 157.5 | 115.1 |
| Sons of the Forest (2023) | 98.3 | 86.8 | 83.3 | 82.3 | 69.5 |
| Resident Evil 4 Remake (2023) | 185.9 | 133.5 | 120.8 | 86.7 | 61.5 |
| The Last of Us (2023) | 73.1 | 60.9 | 56.9 | 56 | 53.3 |
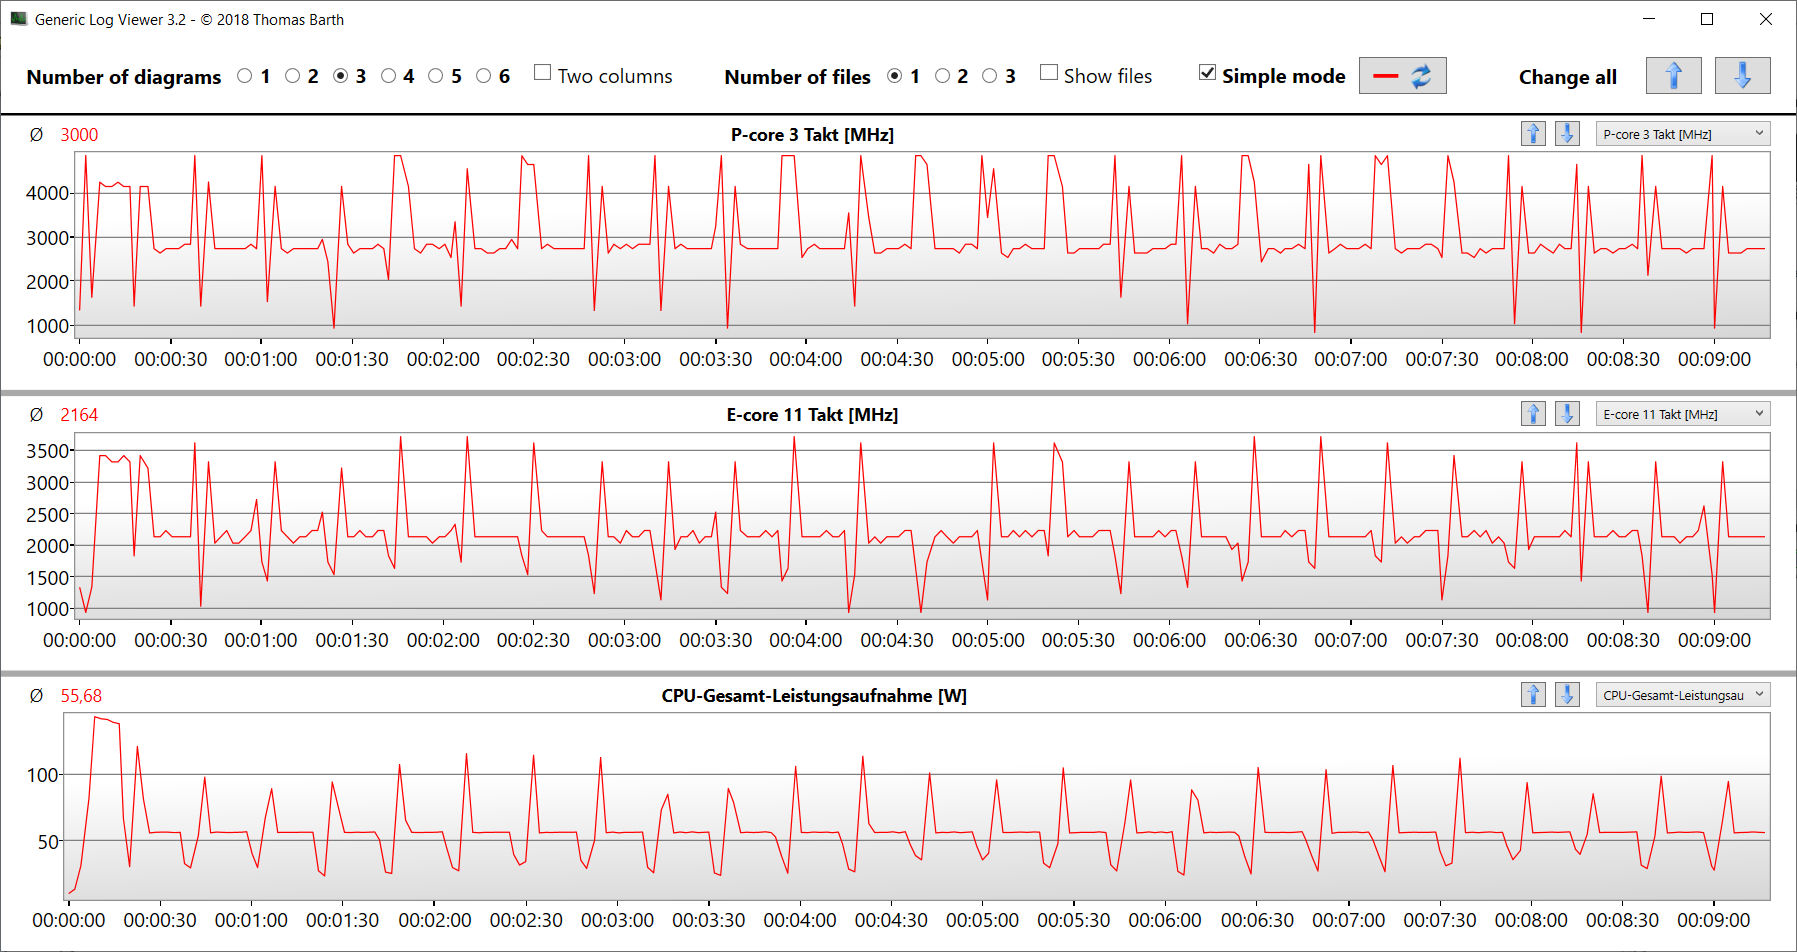
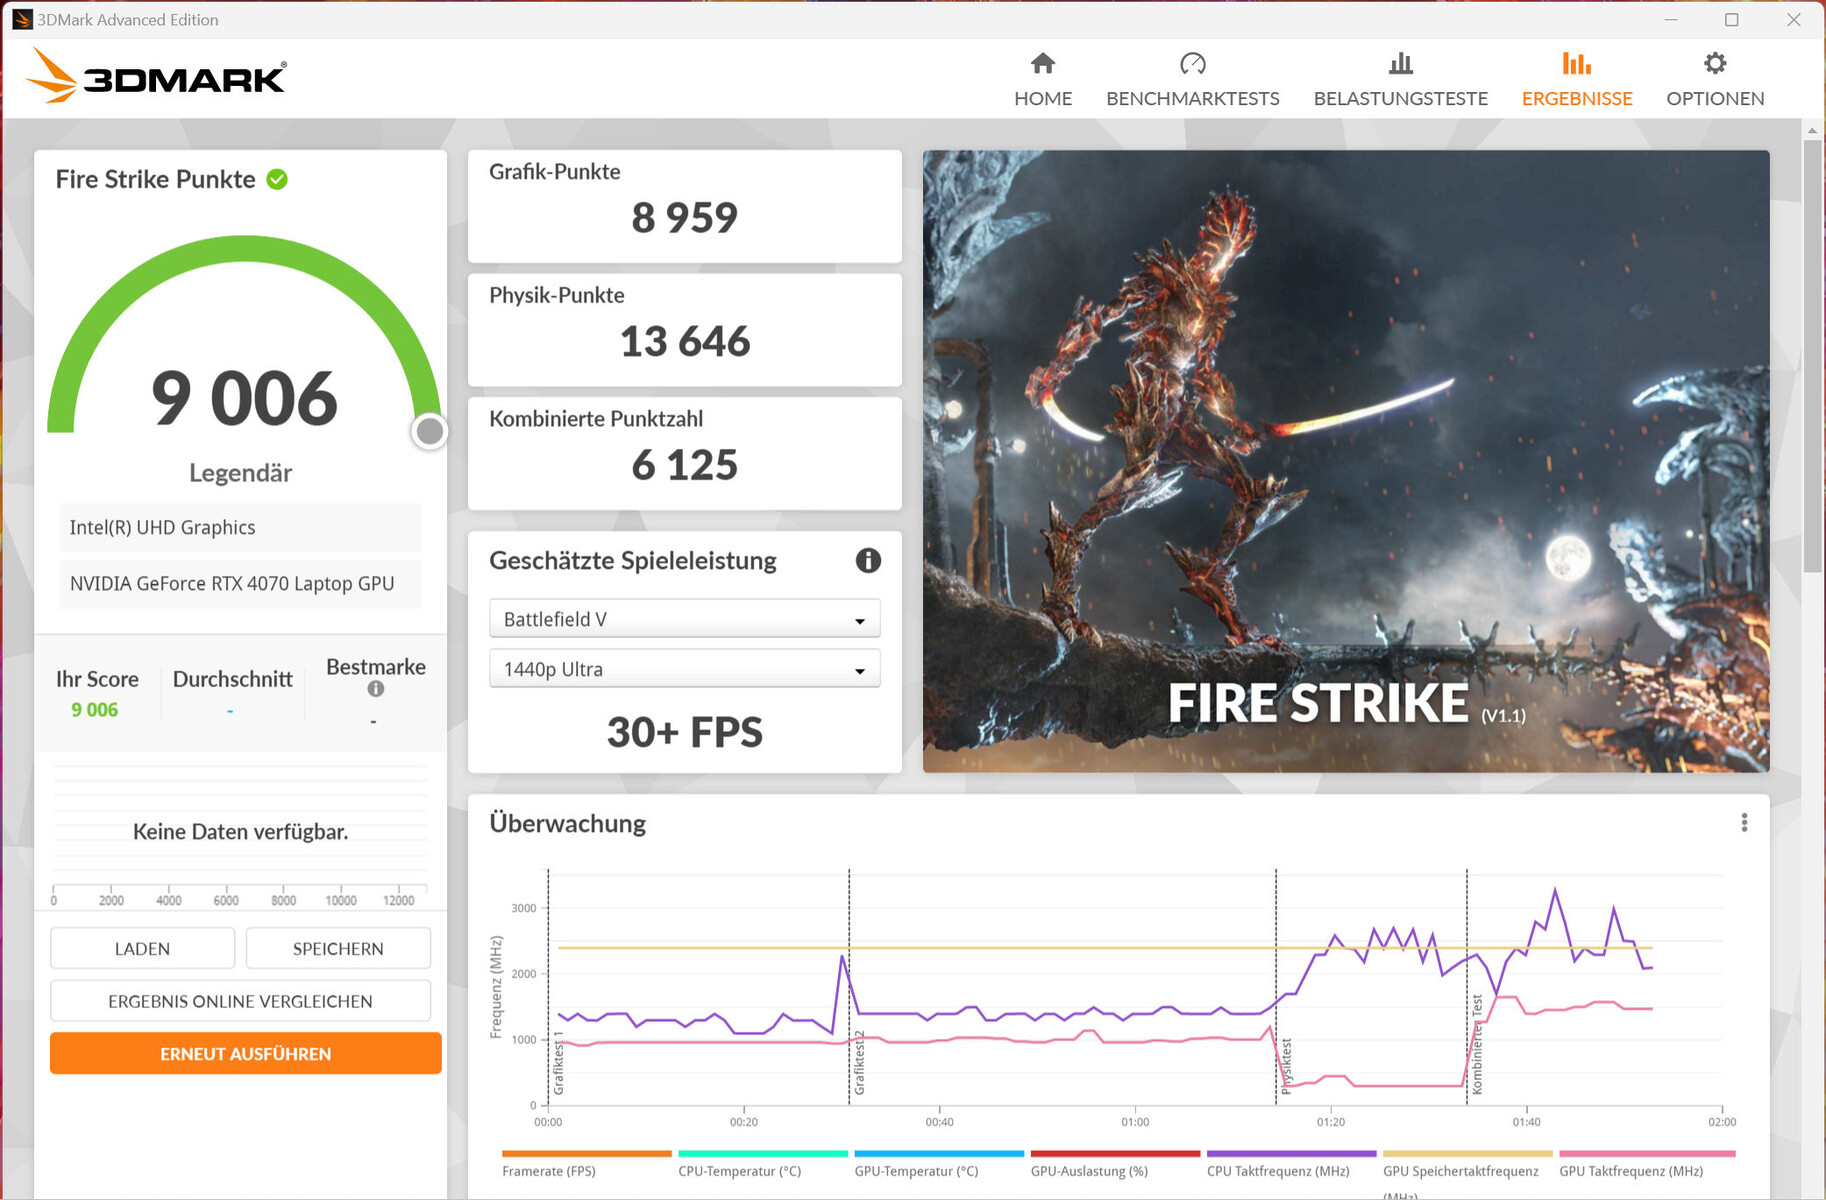
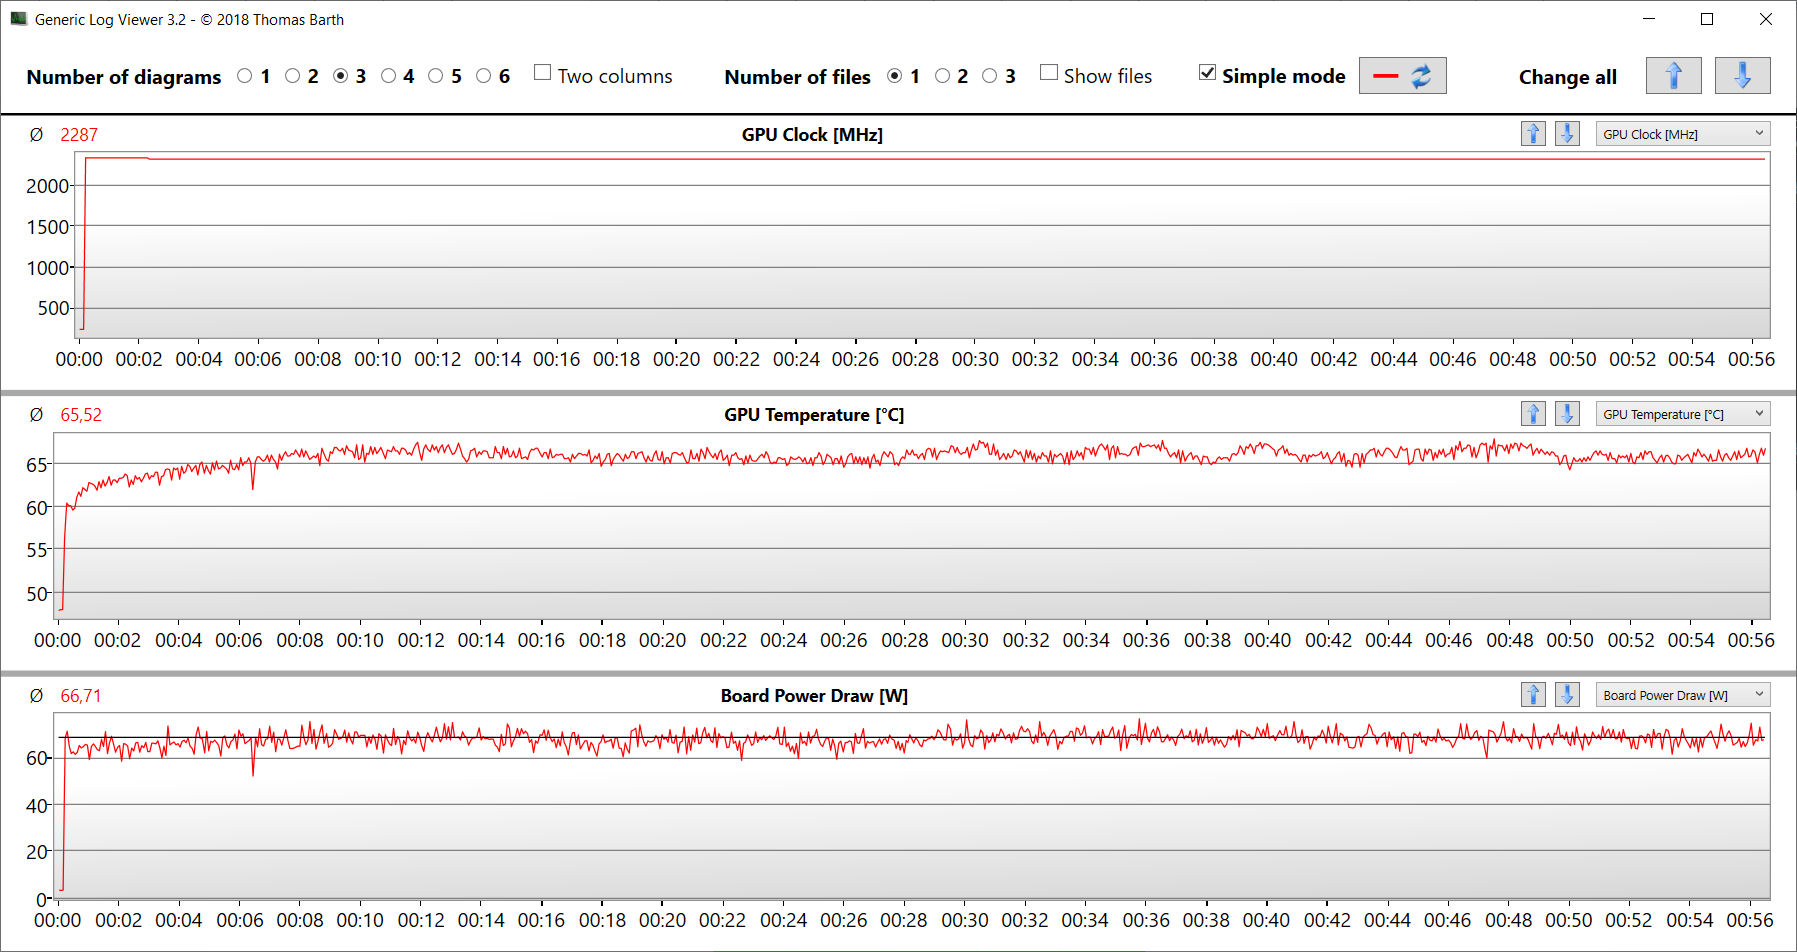
Rendimiento de juego a volumen reducido
Hasta cierto punto, el 15X puede satisfacer los deseos de los usuarios que no quieren un portátil de juegos demasiado ruidoso. El perfil de energía "modo reunión" garantiza un volumen de funcionamiento general más bajo con una potencia de procesamiento reducida. Esta última sigue siendo suficiente para jugar con configuraciones medias o parcialmente altas. La prueba Witcher 3 prueba se realizó a una frecuencia de imagen media de 69 FPS con una GPU TGP de unos 67 vatios.
| HD bajo | FHD bajo | FHD medio | FHD alto | FHD ultra | |
|---|---|---|---|---|---|
| GTA V | - | 73,7 fps | 68,2 fps | 50,3 fps | 27,2 fps |
| Dota 2 Reborn | 87,1 fps | - | - | 61,8 fps | 52,7 fps |
| Final Fantasy XV Benchmark | 56,7 fps | - | 49 fps | 40,7 fps | - |
| X-Plane 11.11 | 59,5 fps | - | 52,2 fps | 45,6 fps | - |
| Strange Brigade | 123,8 fps | - | 96,4 fps | 92,3 fps | 88,8 fps |
Emisiones - El Aorus ASF puede funcionar silenciosamente
Emisiones sonoras
Los dos ventiladores suelen funcionar a baja velocidad en vacío y en el uso cotidiano (oficina, Internet). Sin embargo, no es imposible que se aceleren: es posible alcanzar niveles de hasta 38 dB(A). Bajo carga, se vuelve muy ruidoso con valores máximos de 58 dB(A) (prueba de esfuerzo) y 54 dB(A) (Witcher 3 test).
El Aorus 15X es capaz de funcionar de forma silenciosa a prácticamente silenciosa. Para ello es necesario utilizar los perfiles de energía "modo reunión" o "modo inactivo de ahorro de energía". El subsiguiente rendimiento reducido del ordenador sigue siendo más que suficiente para el uso diario e incluso permite jugar con ajustes reducidos.
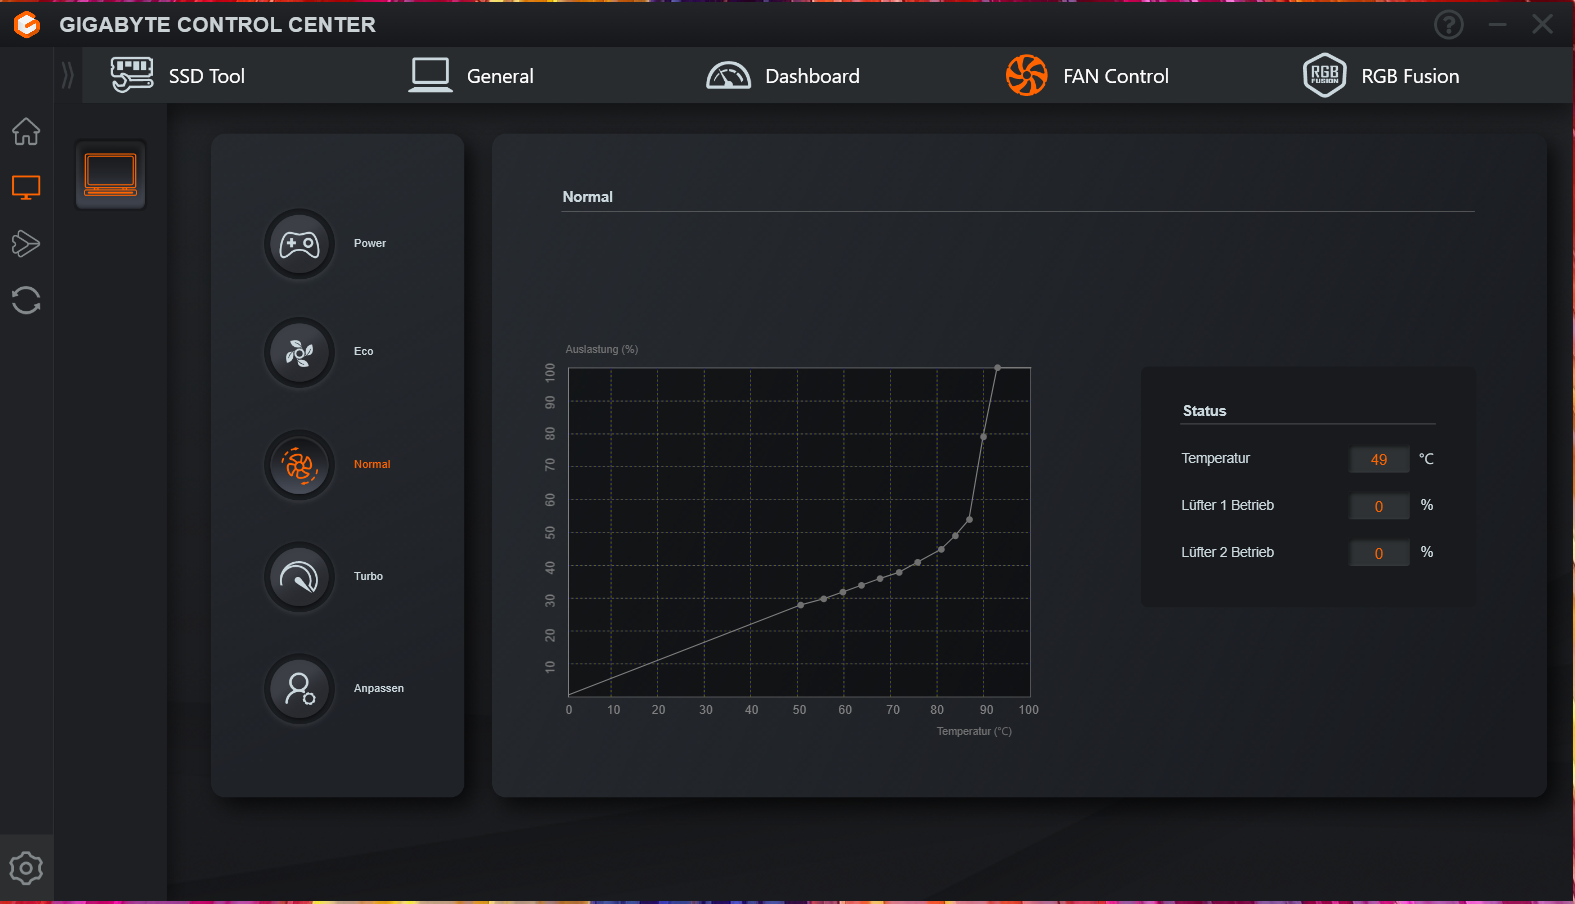
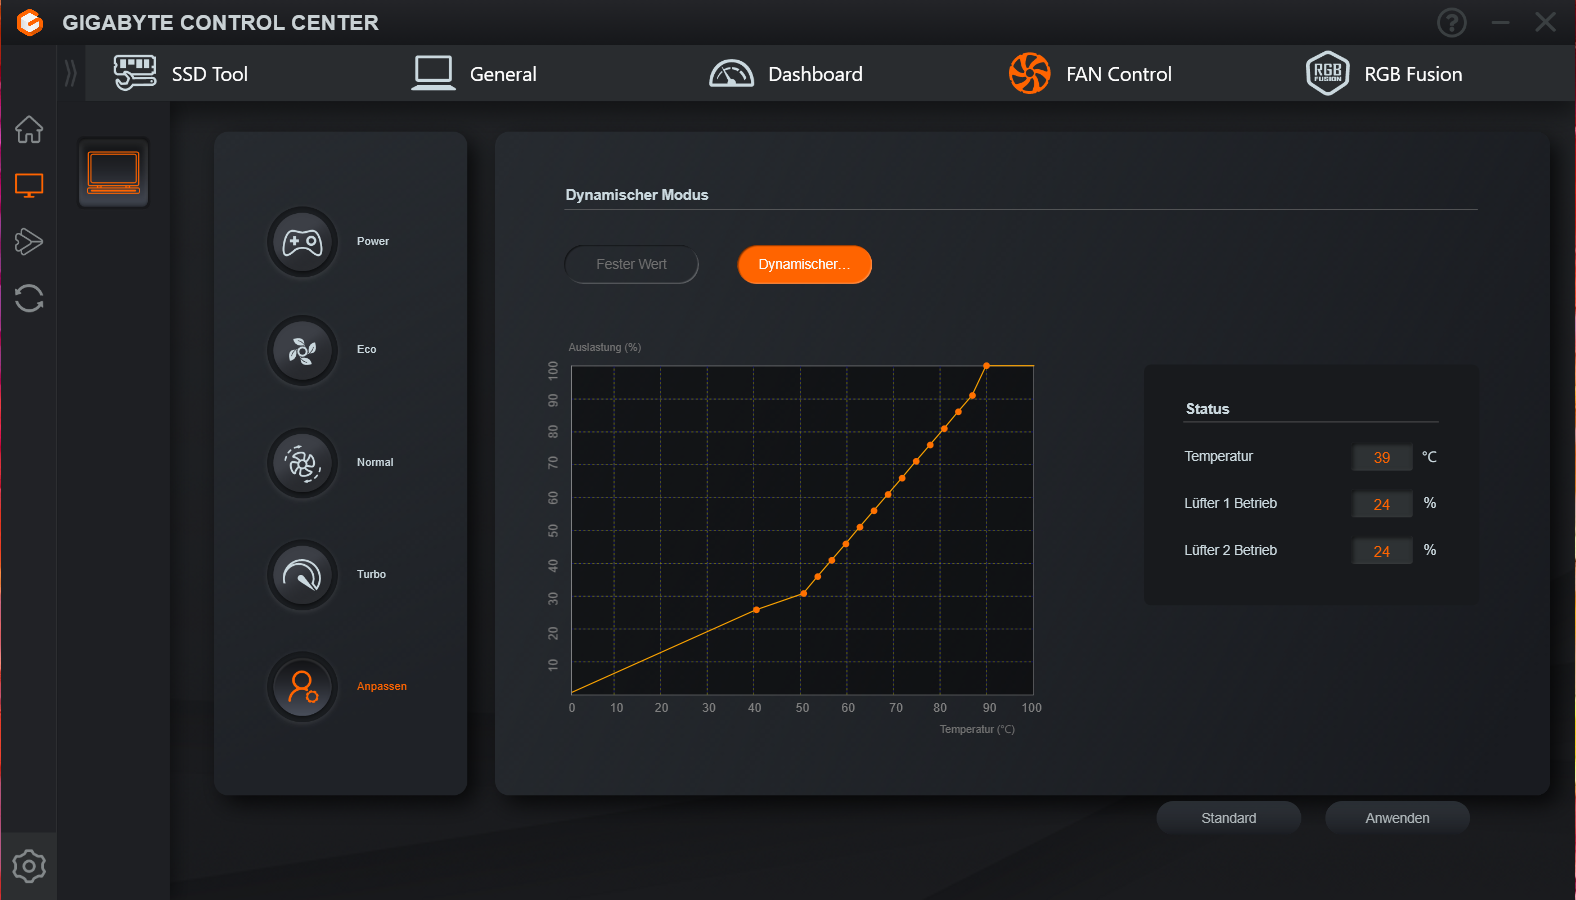
El Centro de Control de Gigabyte permite controlar el ventilador. Hay varios perfiles de ventilador disponibles, y también se puede crear una curva de ventilador individual.
Ruido
| Ocioso |
| 28 / 29 / 36 dB(A) |
| Carga |
| 50 / 58 dB(A) |
 | ||
30 dB silencioso 40 dB(A) audible 50 dB(A) ruidosamente alto |
||
min: | ||
| Aorus 15X ASF i7-13700HX, GeForce RTX 4070 Laptop GPU | Razer Blade 15 OLED (Early 2022) i9-12900H, GeForce RTX 3070 Ti Laptop GPU | MSI Katana 17 B13VFK i7-13620H, GeForce RTX 4060 Laptop GPU | Asus ROG Strix G17 G713PI R9 7945HX, GeForce RTX 4070 Laptop GPU | Acer Predator Helios 300 (i7-12700H, RTX 3070 Ti) i7-12700H, GeForce RTX 3070 Ti Laptop GPU | |
|---|---|---|---|---|---|
| Noise | 11% | 2% | 9% | 2% | |
| apagado / medio ambiente * (dB) | 25 | 26 -4% | 24.5 2% | 25 -0% | 23 8% |
| Idle Minimum * (dB) | 28 | 28 -0% | 24.5 12% | 26 7% | 23 18% |
| Idle Average * (dB) | 29 | 28 3% | 24.5 16% | 29 -0% | 25.92 11% |
| Idle Maximum * (dB) | 36 | 28 22% | 40 -11% | 30 17% | 40.67 -13% |
| Load Average * (dB) | 50 | 38.5 23% | 48.3 3% | 46 8% | 42.7 15% |
| Witcher 3 ultra * (dB) | 54 | 56 -4% | 46 15% | 62.48 -16% | |
| Load Maximum * (dB) | 58 | 43.9 24% | 59.1 -2% | 47 19% | 62.67 -8% |
* ... más pequeño es mejor
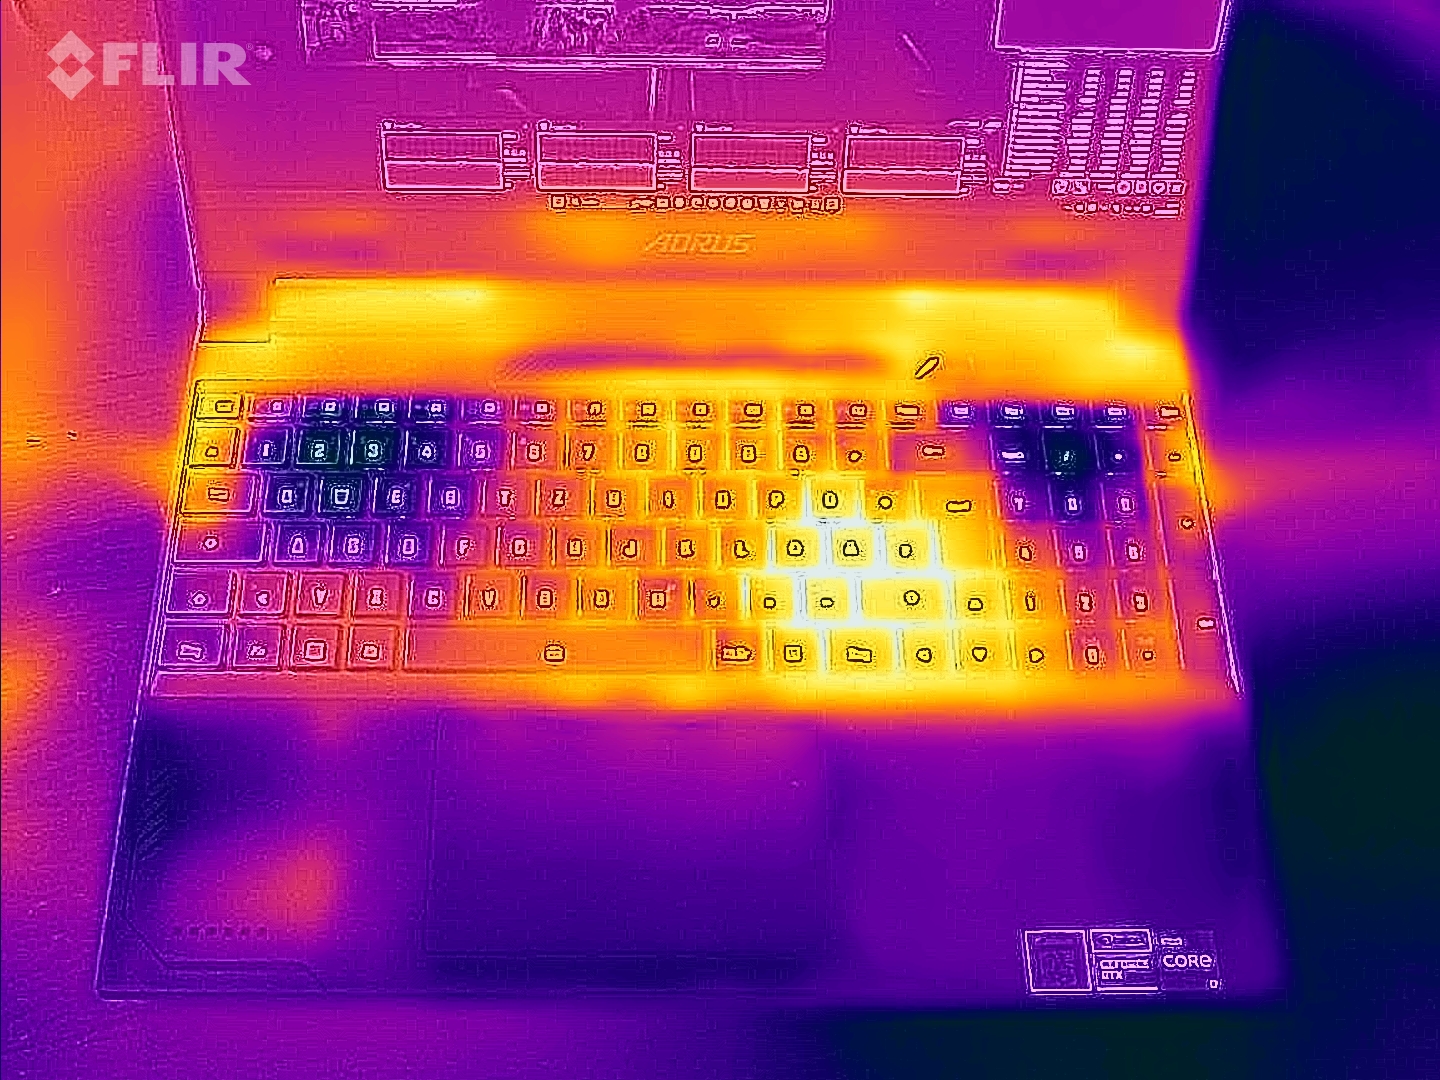
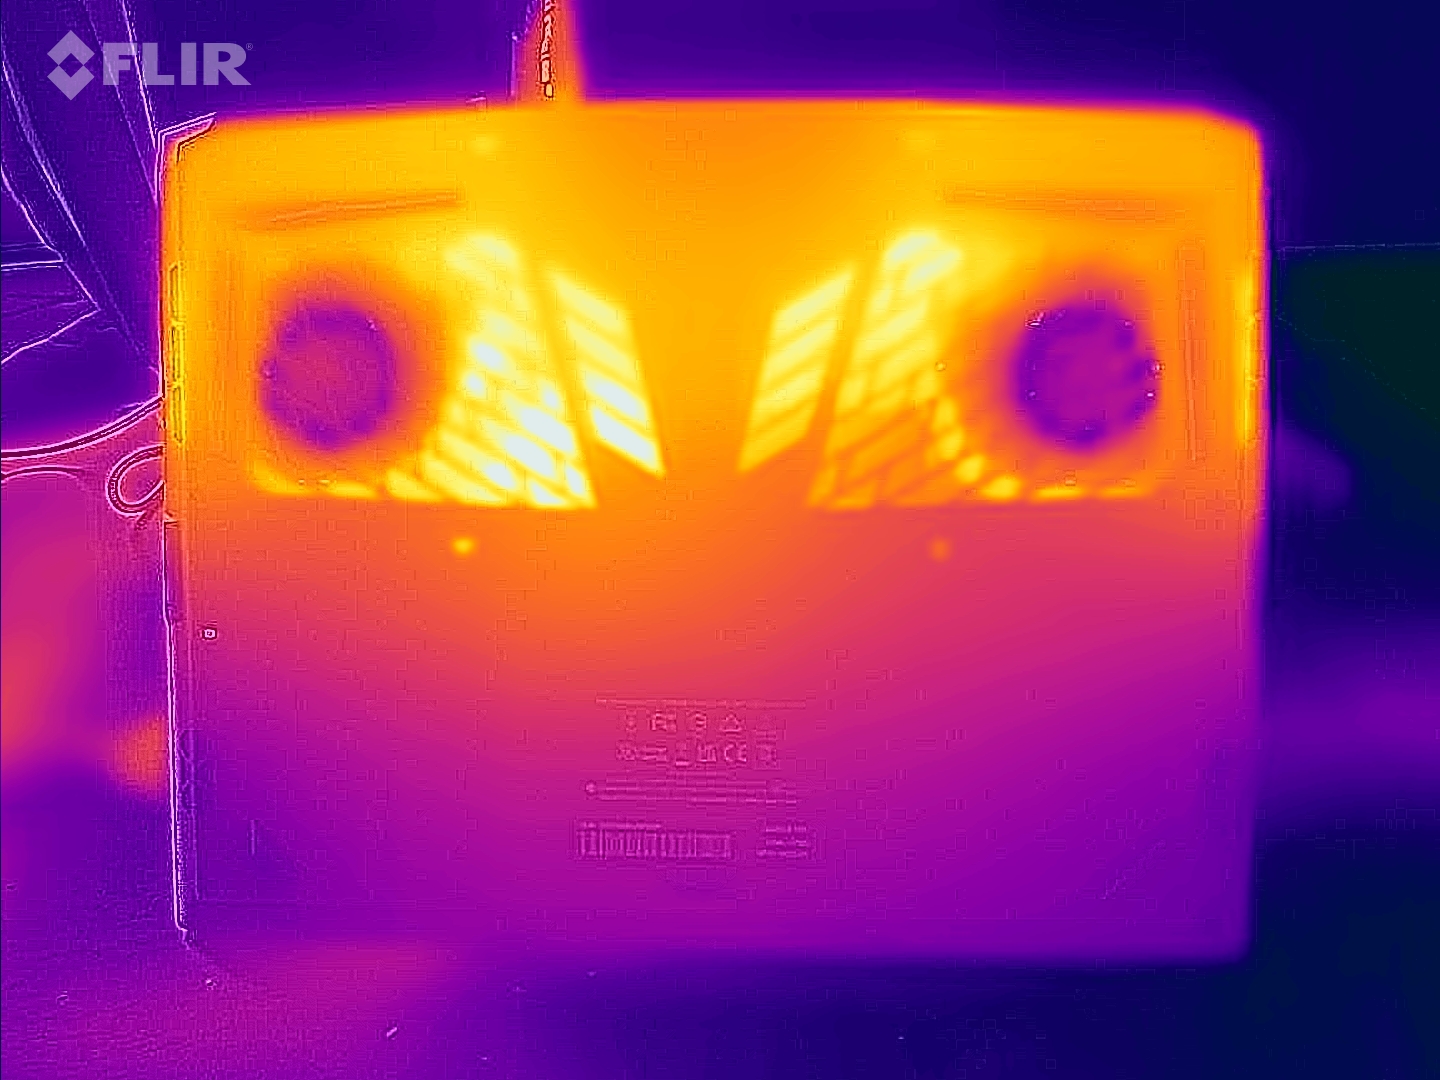
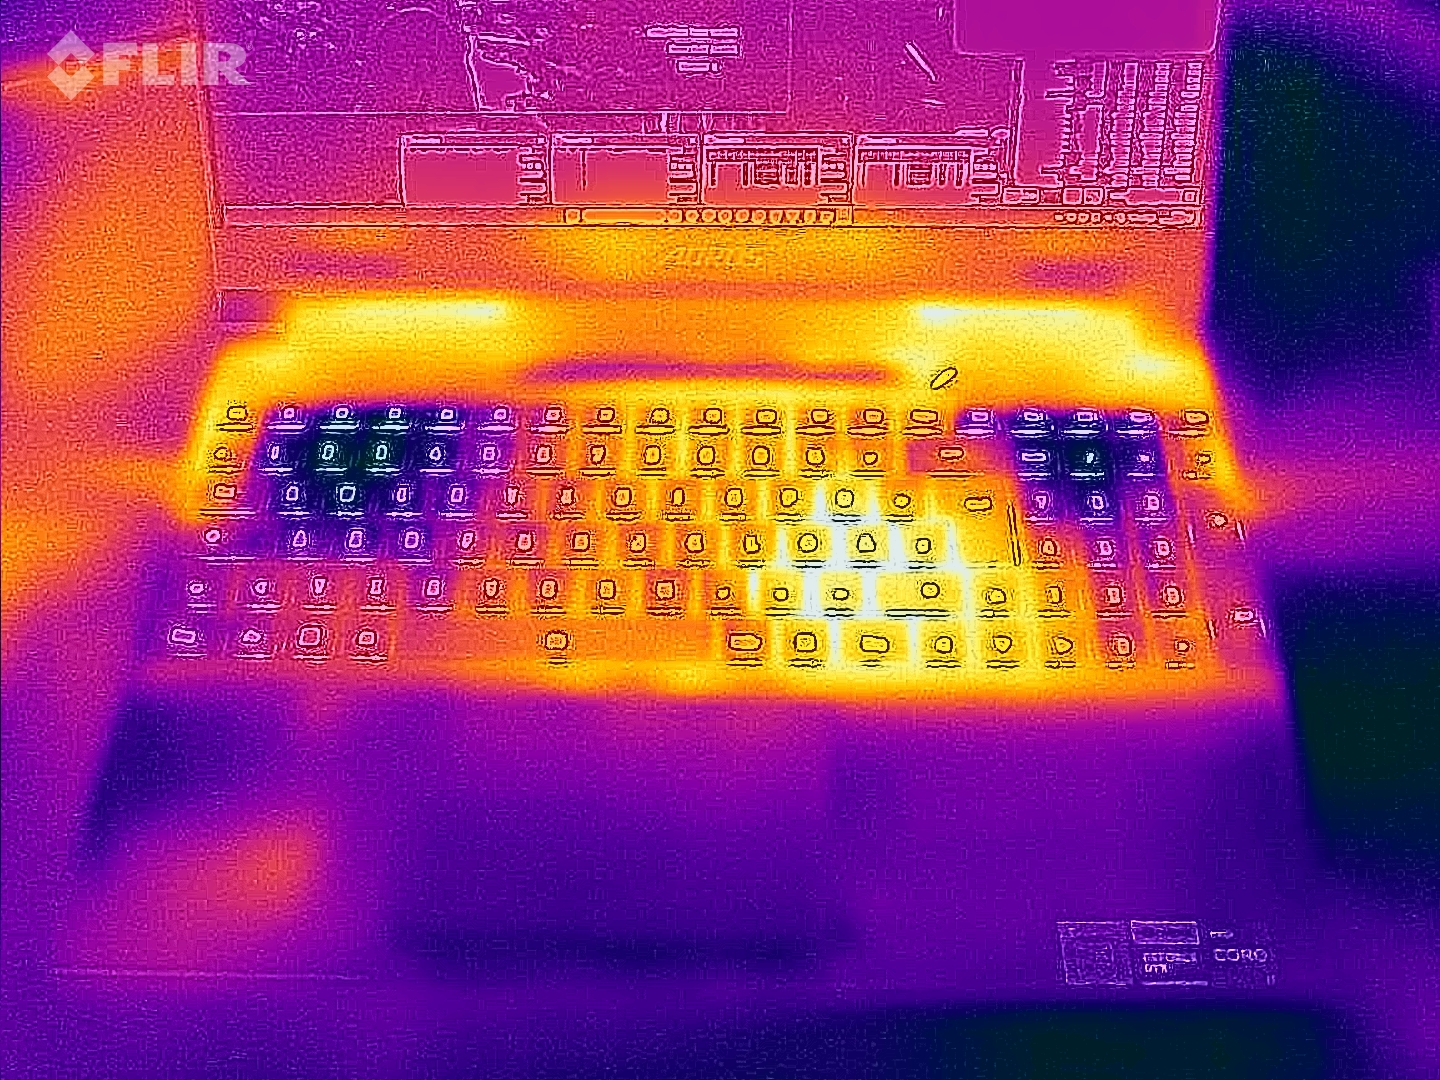
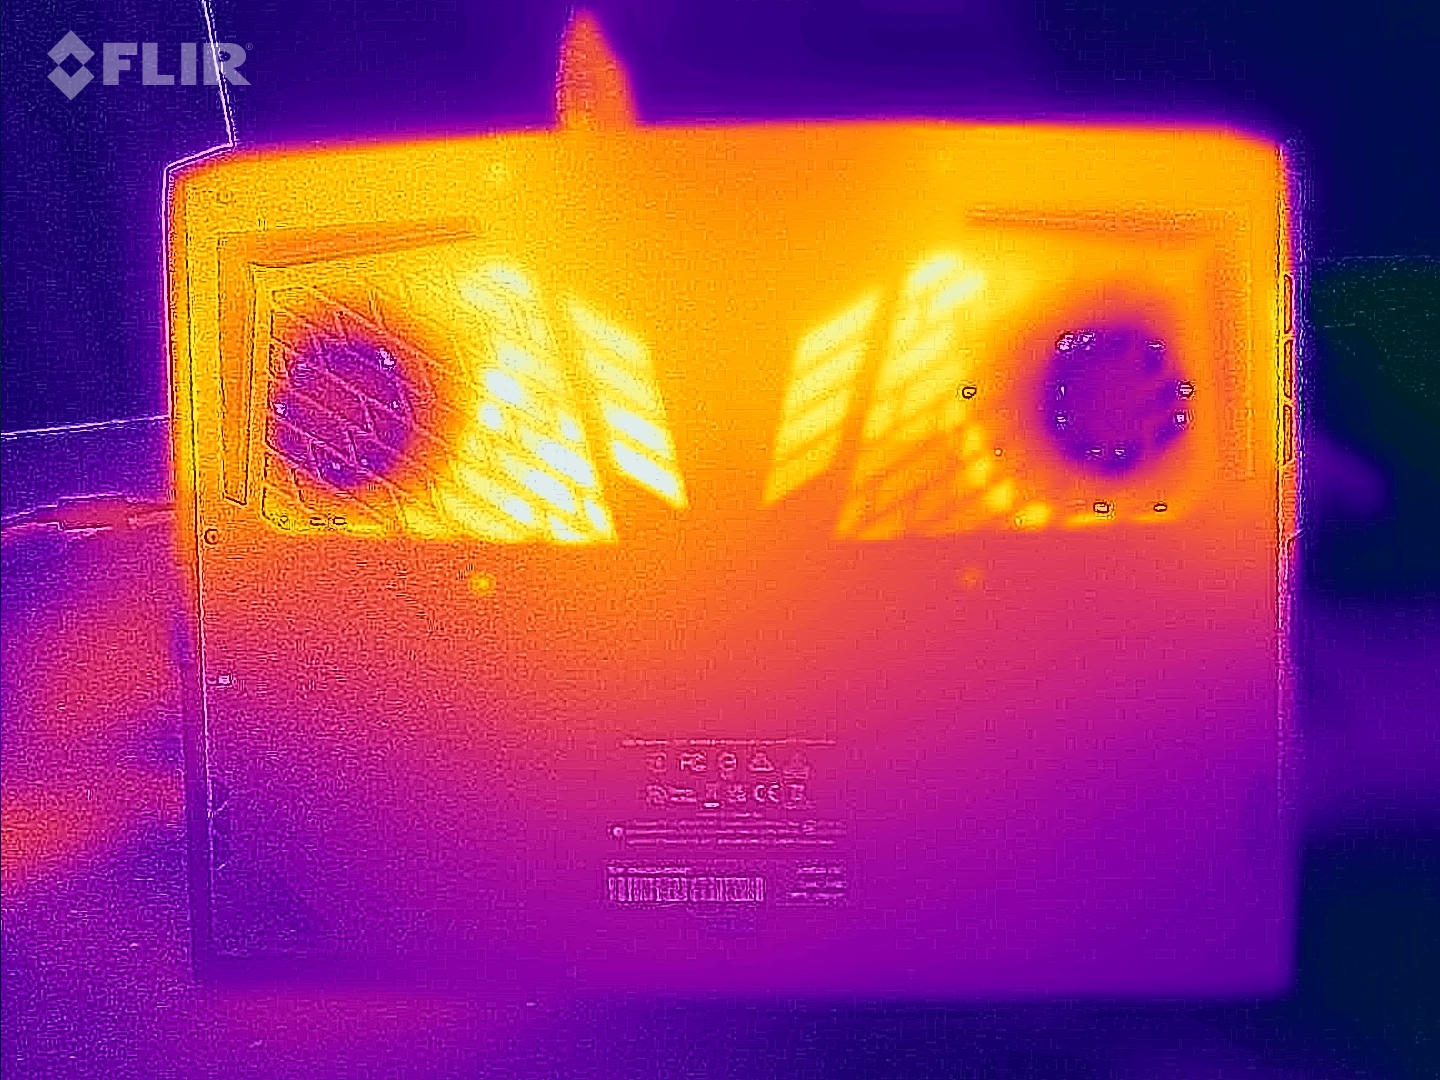
Temperatura
Las temperaturas de la carcasa se mantuvieron dentro de la zona verde en el uso diario (oficina, Internet). Bajo carga (prueba de estrés, Witcher 3 test), el portátil se calentó notablemente, pero no en exceso. Las temperaturas de la CPU no son motivo de preocupación.
(±) La temperatura máxima en la parte superior es de 42 °C / 108 F, frente a la media de 40.4 °C / 105 F, que oscila entre 21.2 y 68.8 °C para la clase Gaming.
(-) El fondo se calienta hasta un máximo de 51 °C / 124 F, frente a la media de 43.2 °C / 110 F
(+) En reposo, la temperatura media de la parte superior es de 25.7 °C / 78# F, frente a la media del dispositivo de 33.9 °C / 93 F.
(±) Jugando a The Witcher 3, la temperatura media de la parte superior es de 34.2 °C / 94 F, frente a la media del dispositivo de 33.9 °C / 93 F.
(+) El reposamanos y el panel táctil están a una temperatura inferior a la de la piel, con un máximo de 28 °C / 82.4 F y, por tanto, son fríos al tacto.
(±) La temperatura media de la zona del reposamanos de dispositivos similares fue de 28.8 °C / 83.8 F (+0.8 °C / 1.4 F).
| Aorus 15X ASF Intel Core i7-13700HX, NVIDIA GeForce RTX 4070 Laptop GPU | Razer Blade 15 OLED (Early 2022) Intel Core i9-12900H, NVIDIA GeForce RTX 3070 Ti Laptop GPU | MSI Katana 17 B13VFK Intel Core i7-13620H, NVIDIA GeForce RTX 4060 Laptop GPU | Asus ROG Strix G17 G713PI AMD Ryzen 9 7945HX, NVIDIA GeForce RTX 4070 Laptop GPU | Acer Predator Helios 300 (i7-12700H, RTX 3070 Ti) Intel Core i7-12700H, NVIDIA GeForce RTX 3070 Ti Laptop GPU | |
|---|---|---|---|---|---|
| Heat | -18% | -10% | -8% | -6% | |
| Maximum Upper Side * (°C) | 42 | 49.5 -18% | 41.6 1% | 42 -0% | 35 17% |
| Maximum Bottom * (°C) | 51 | 47.5 7% | 43.1 15% | 41 20% | 53 -4% |
| Idle Upper Side * (°C) | 27 | 33.4 -24% | 32 -19% | 33 -22% | 29 -7% |
| Idle Bottom * (°C) | 26 | 35 -35% | 35.8 -38% | 34 -31% | 34 -31% |
* ... más pequeño es mejor
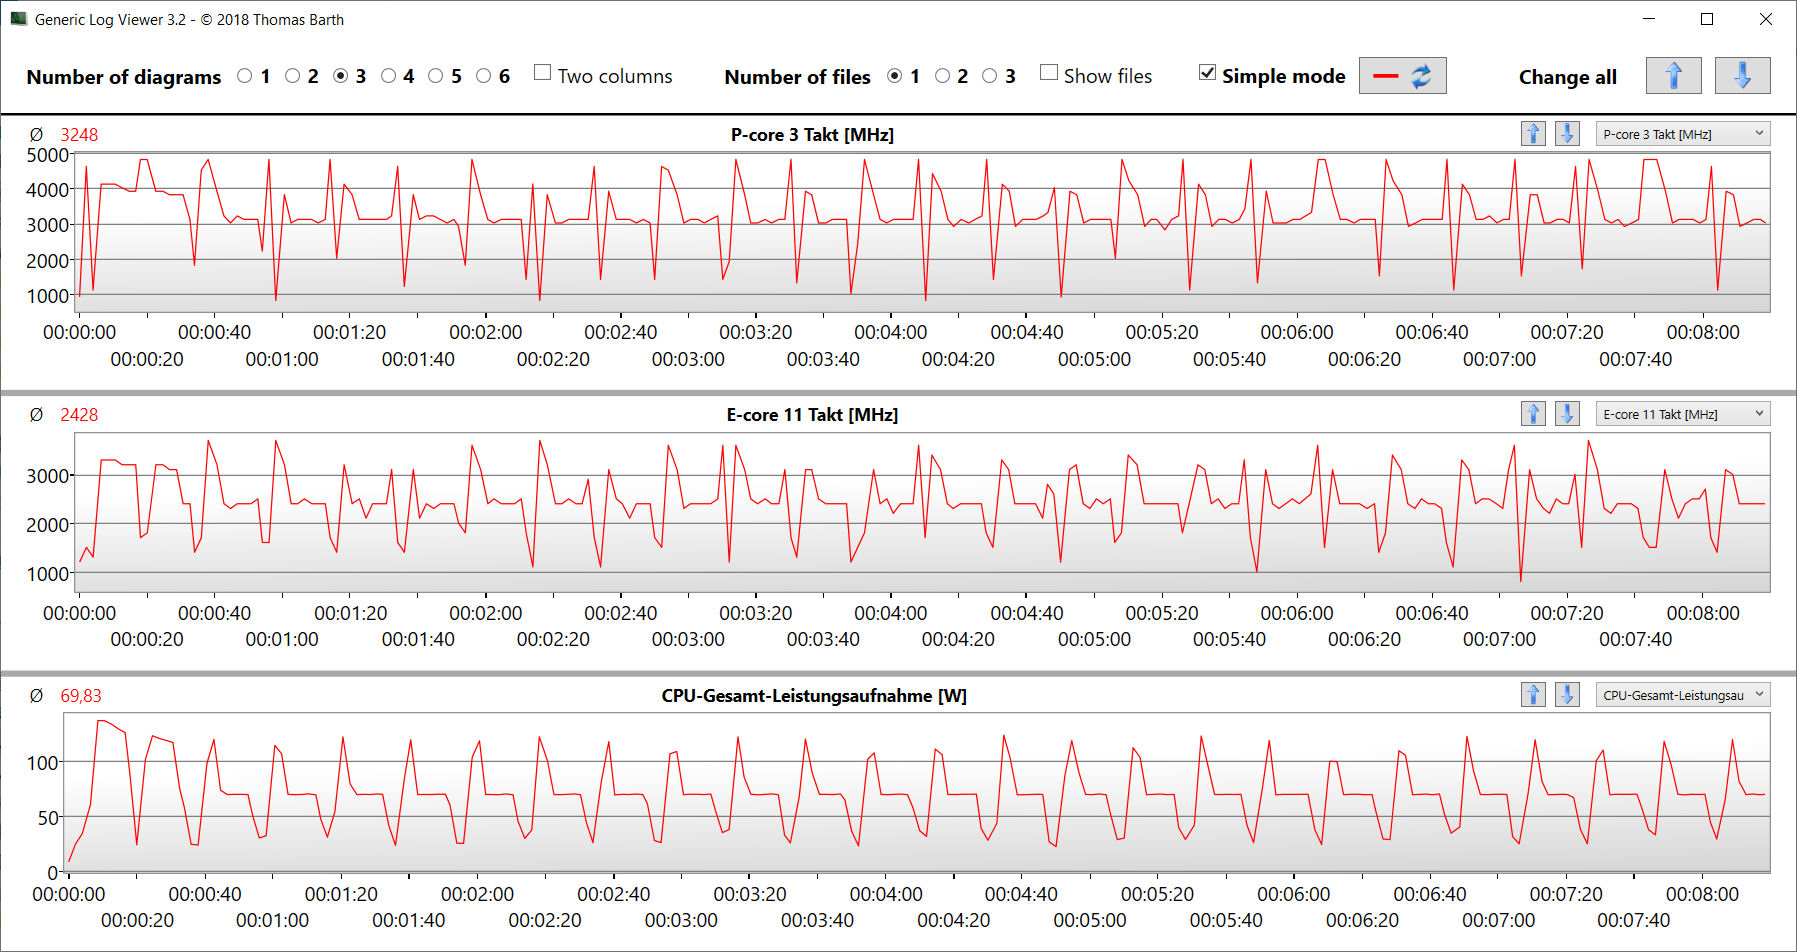
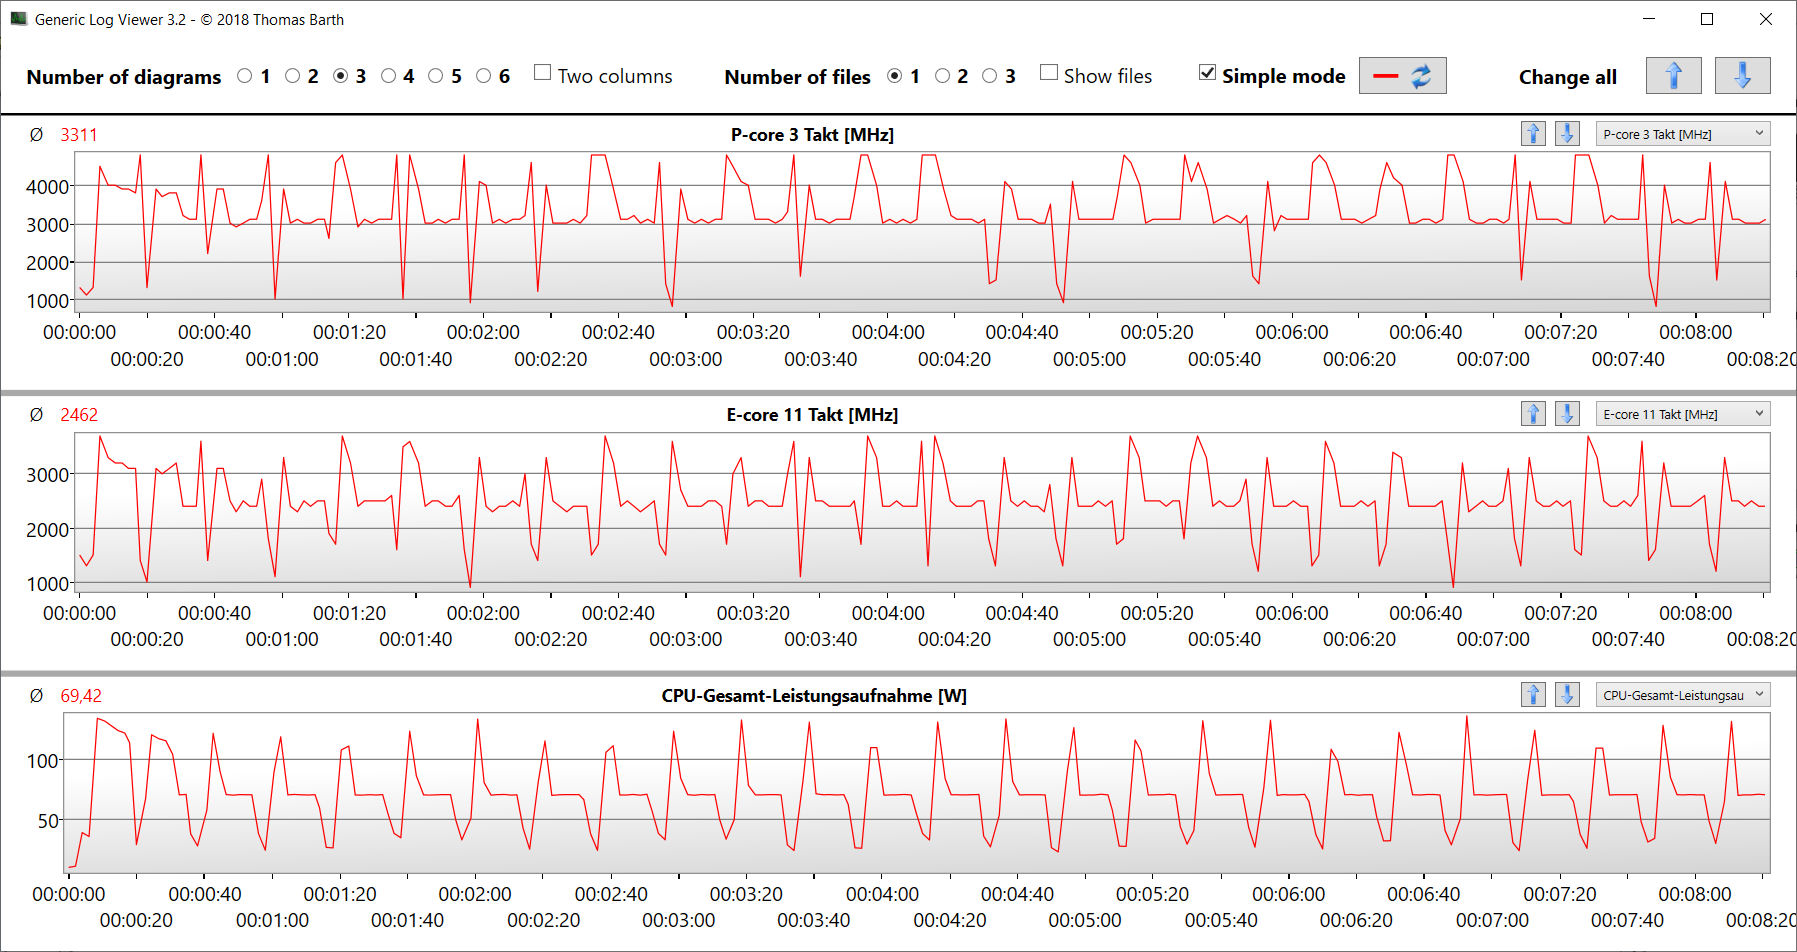
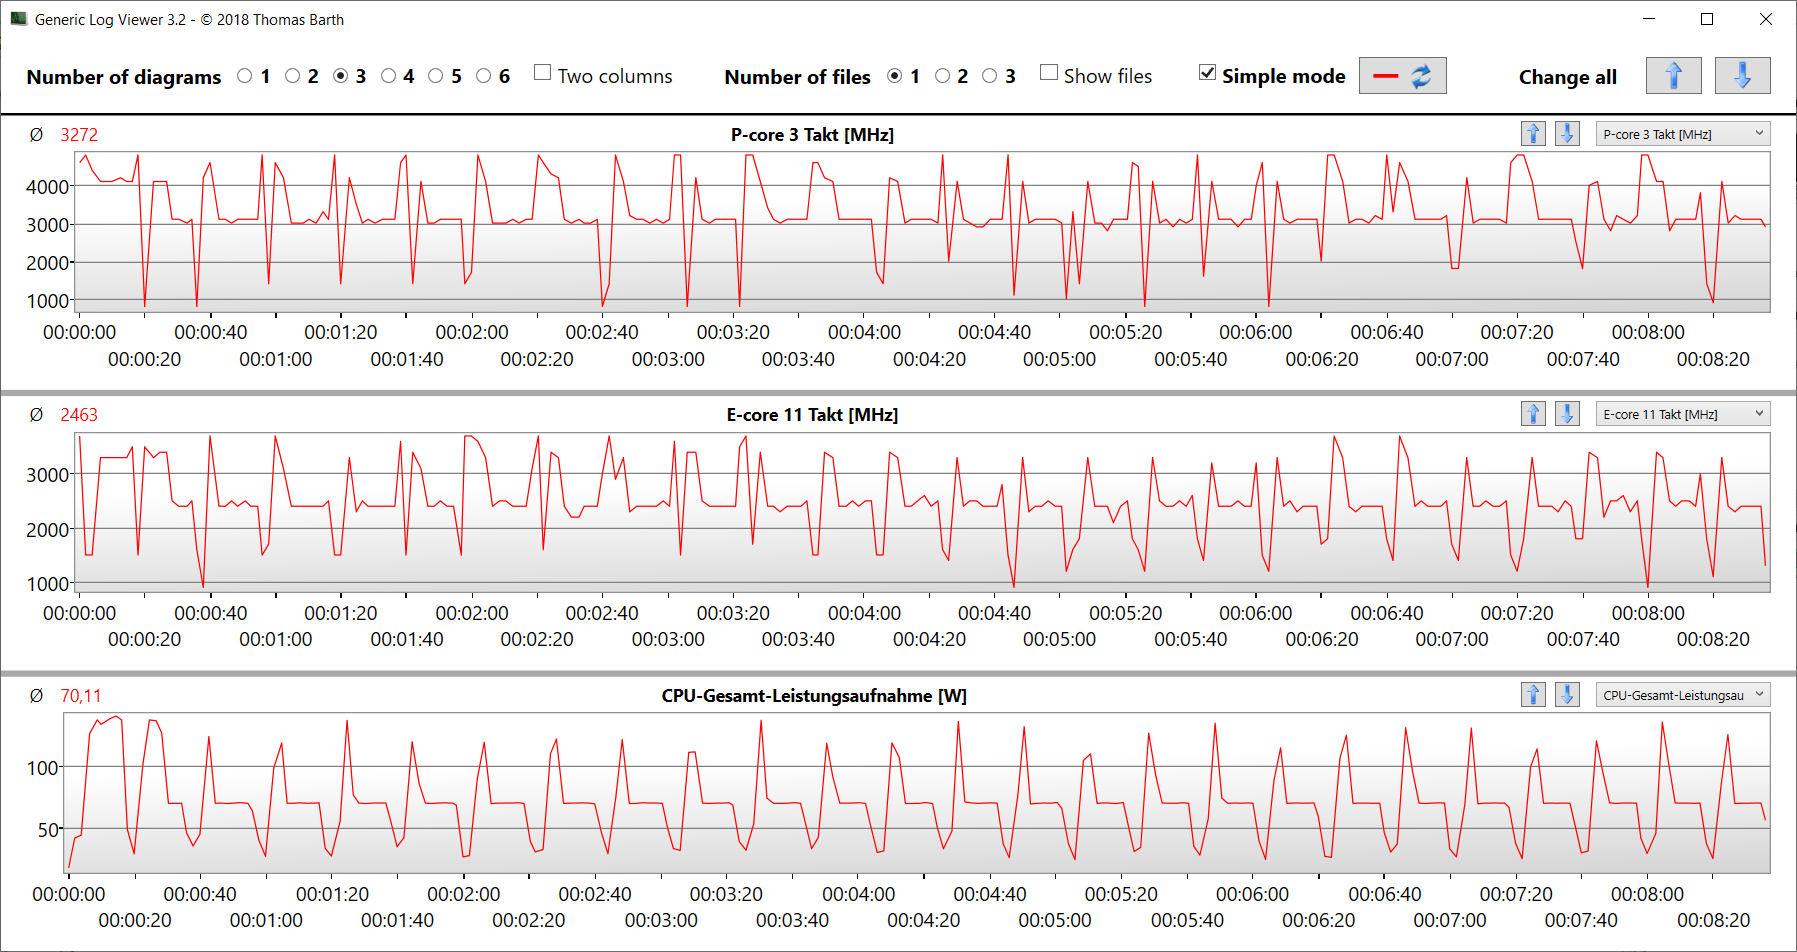
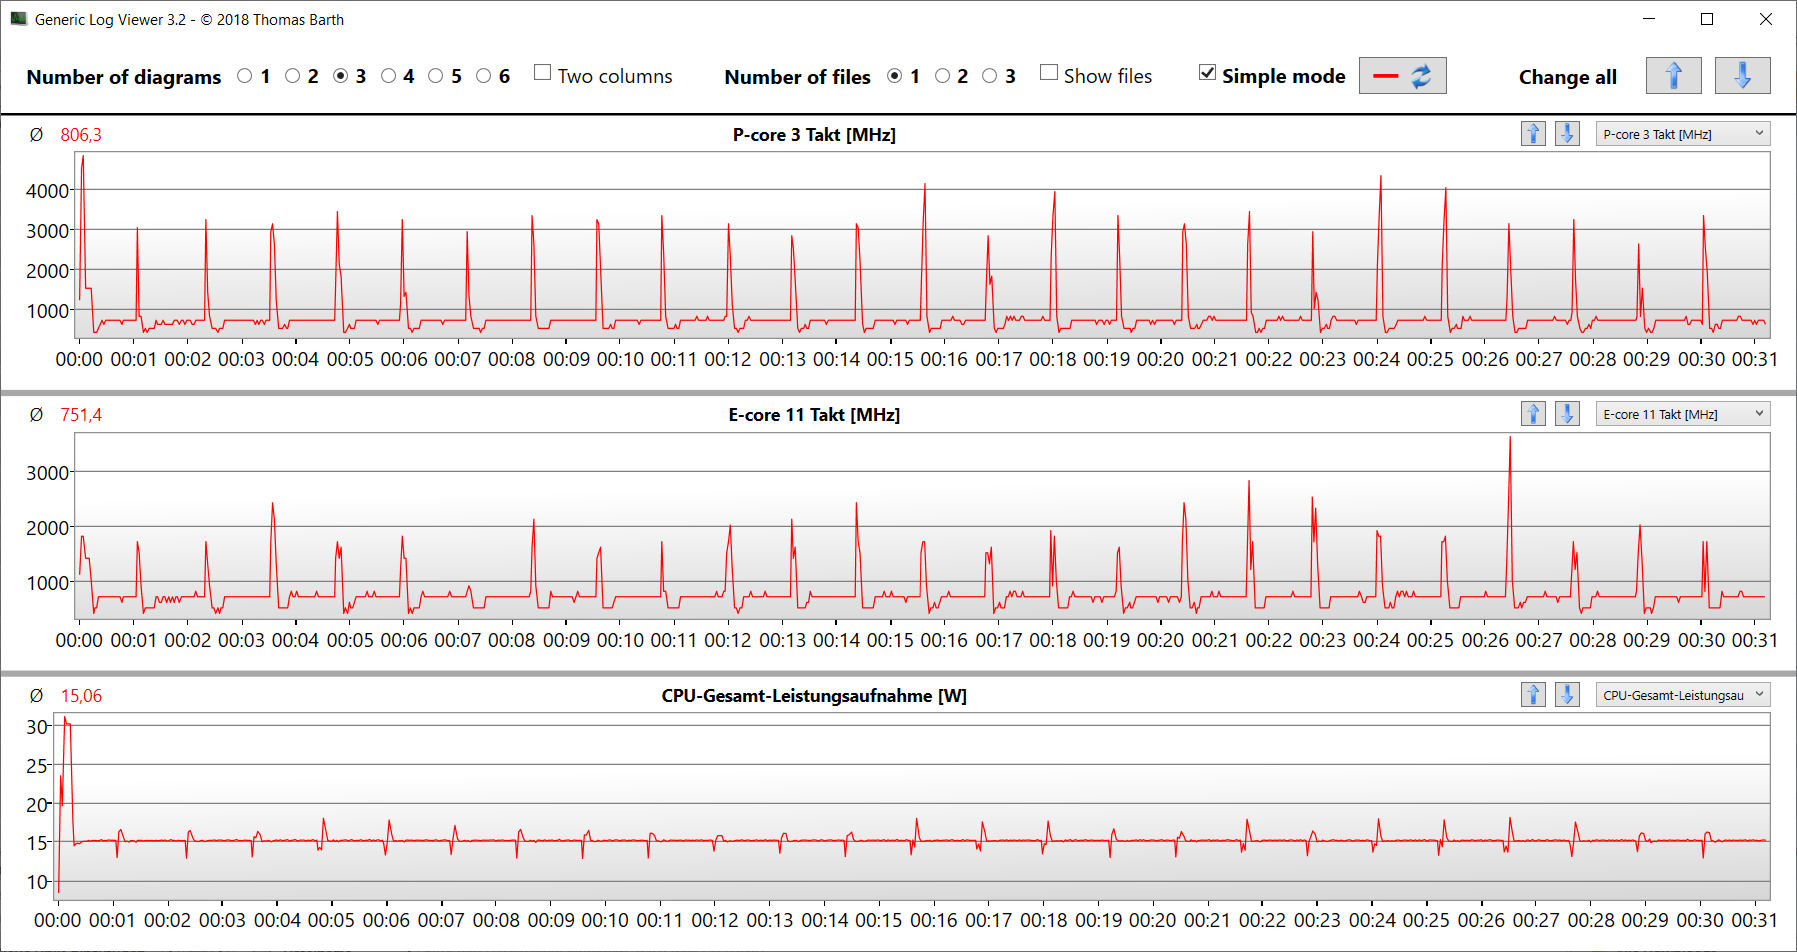
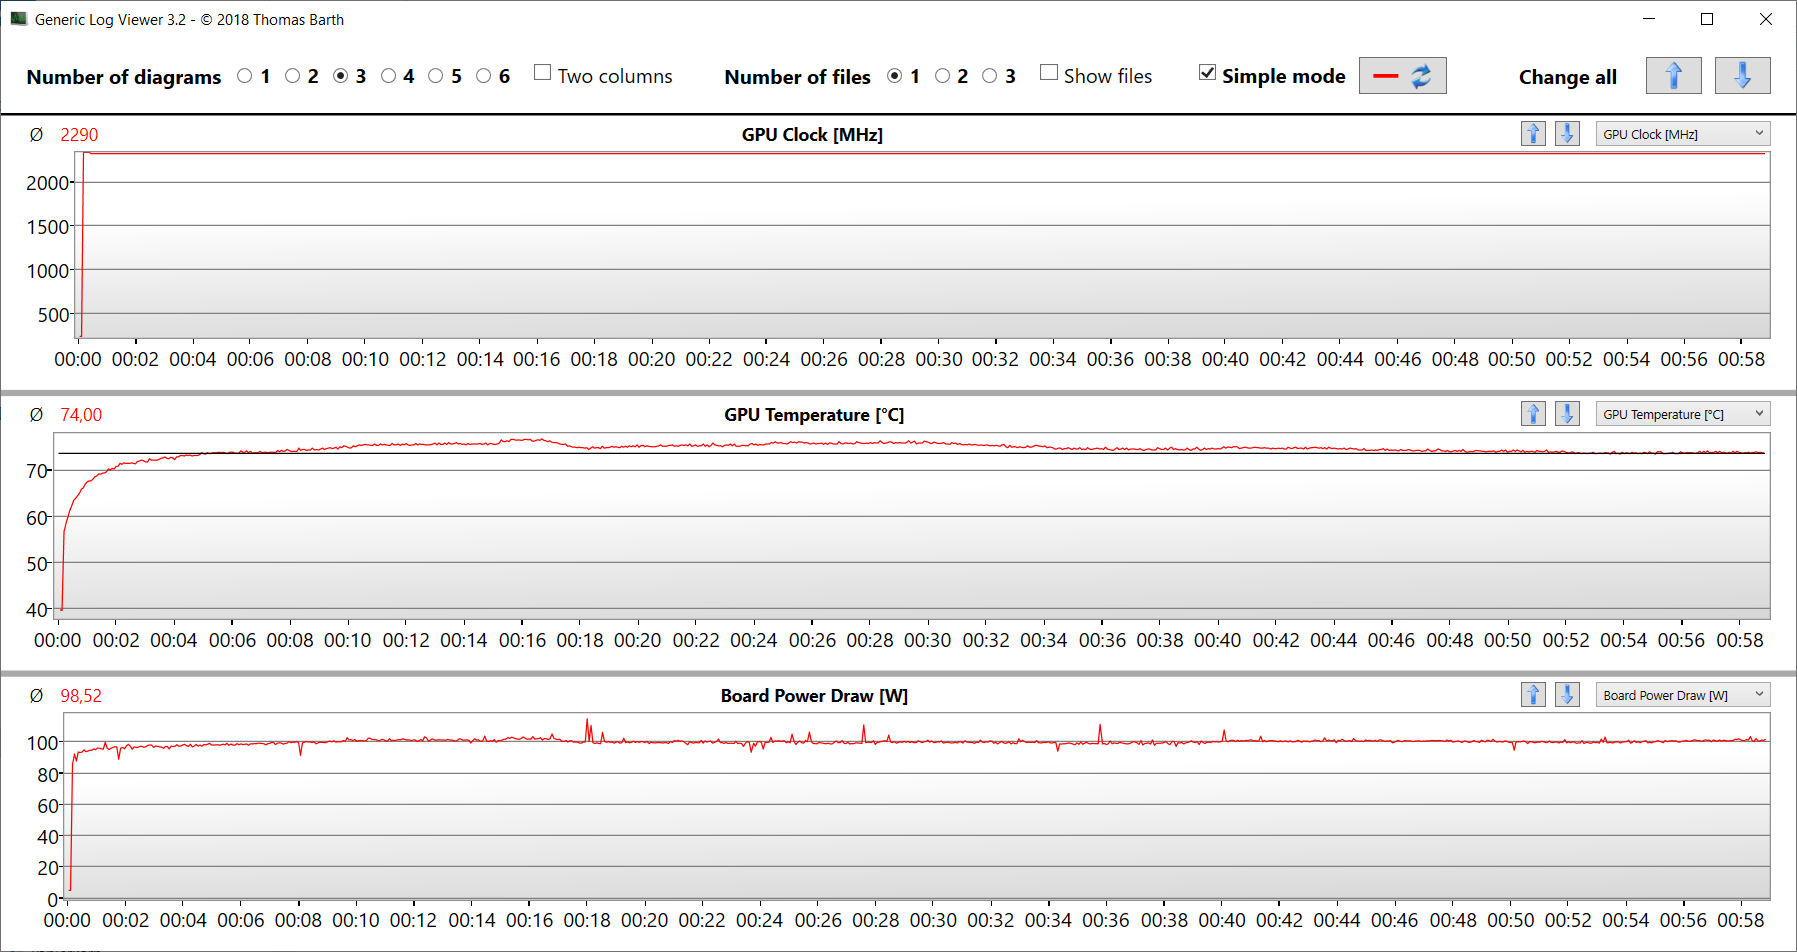
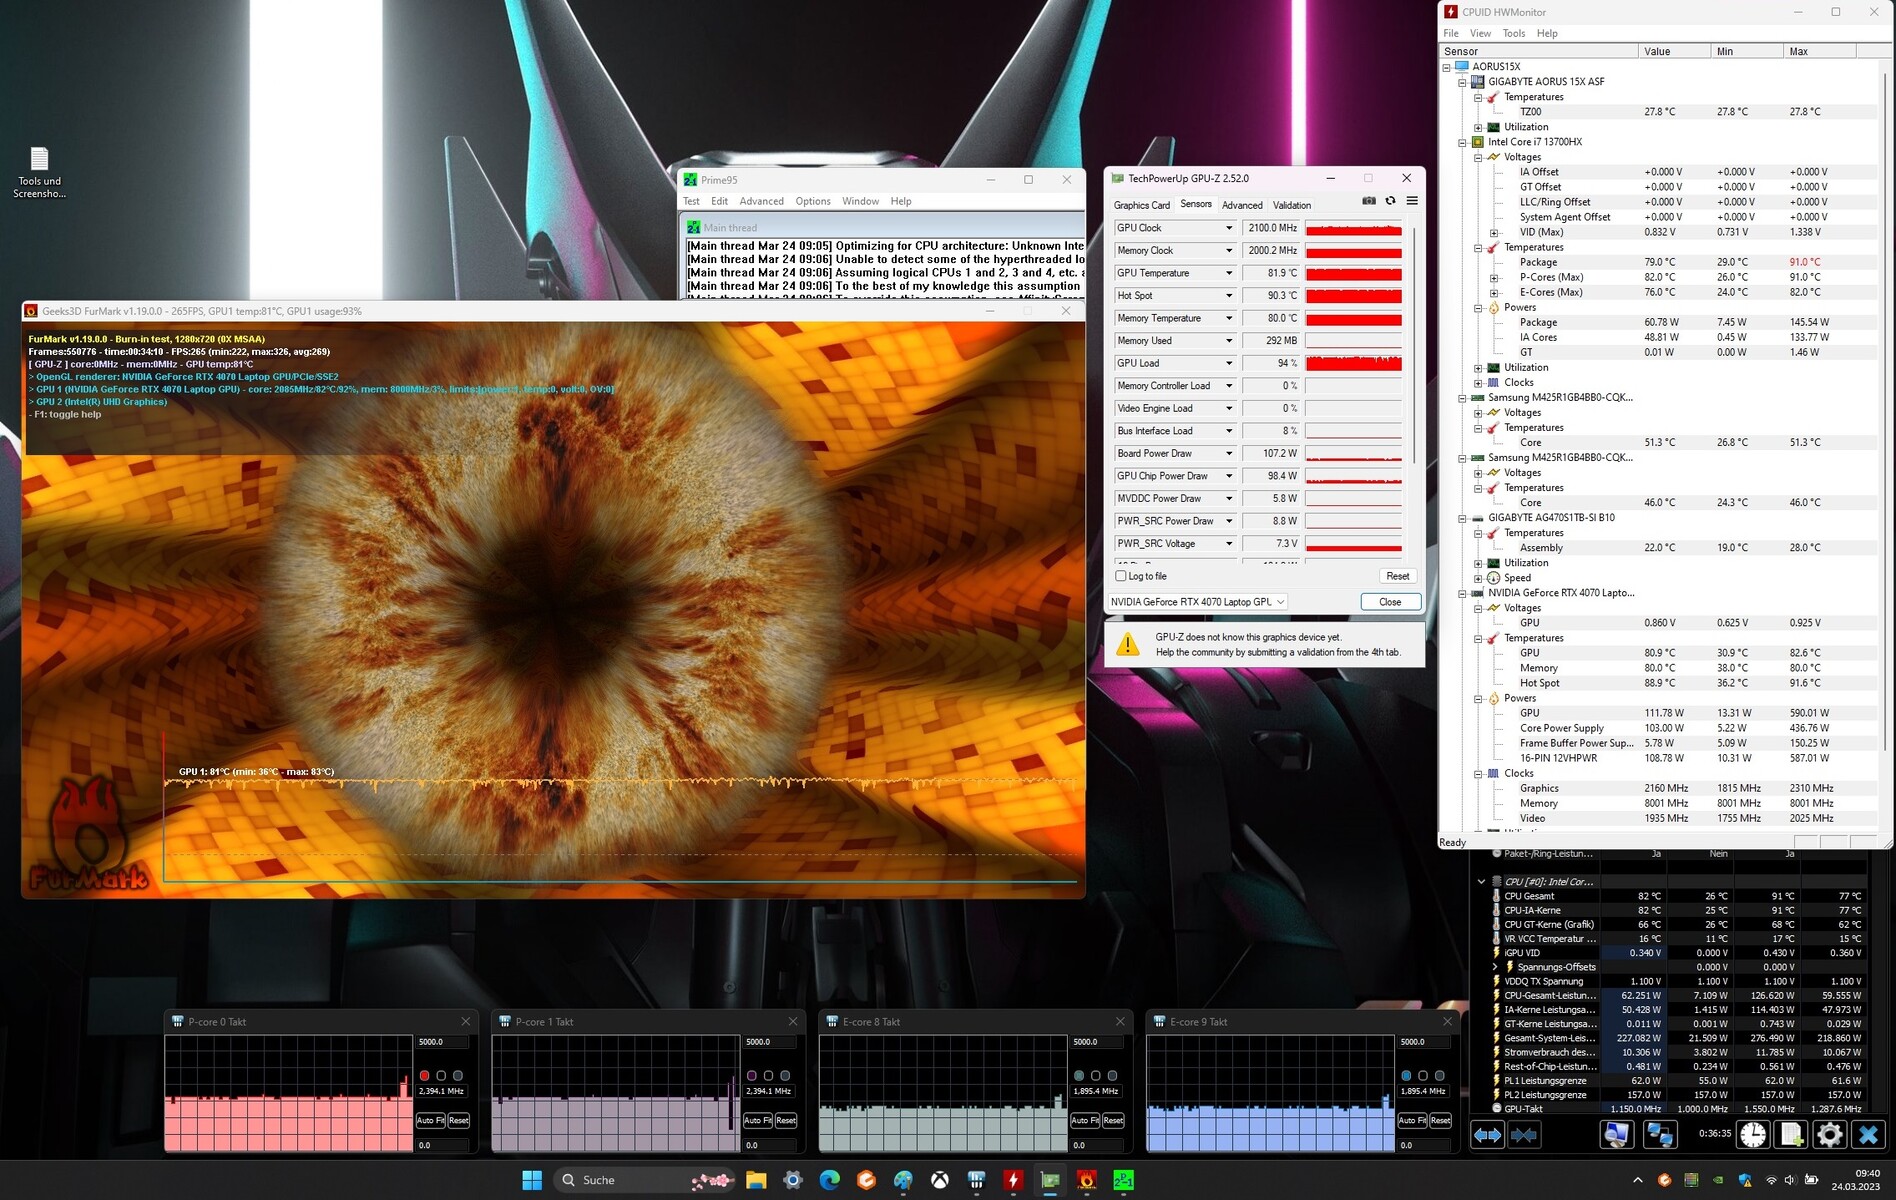
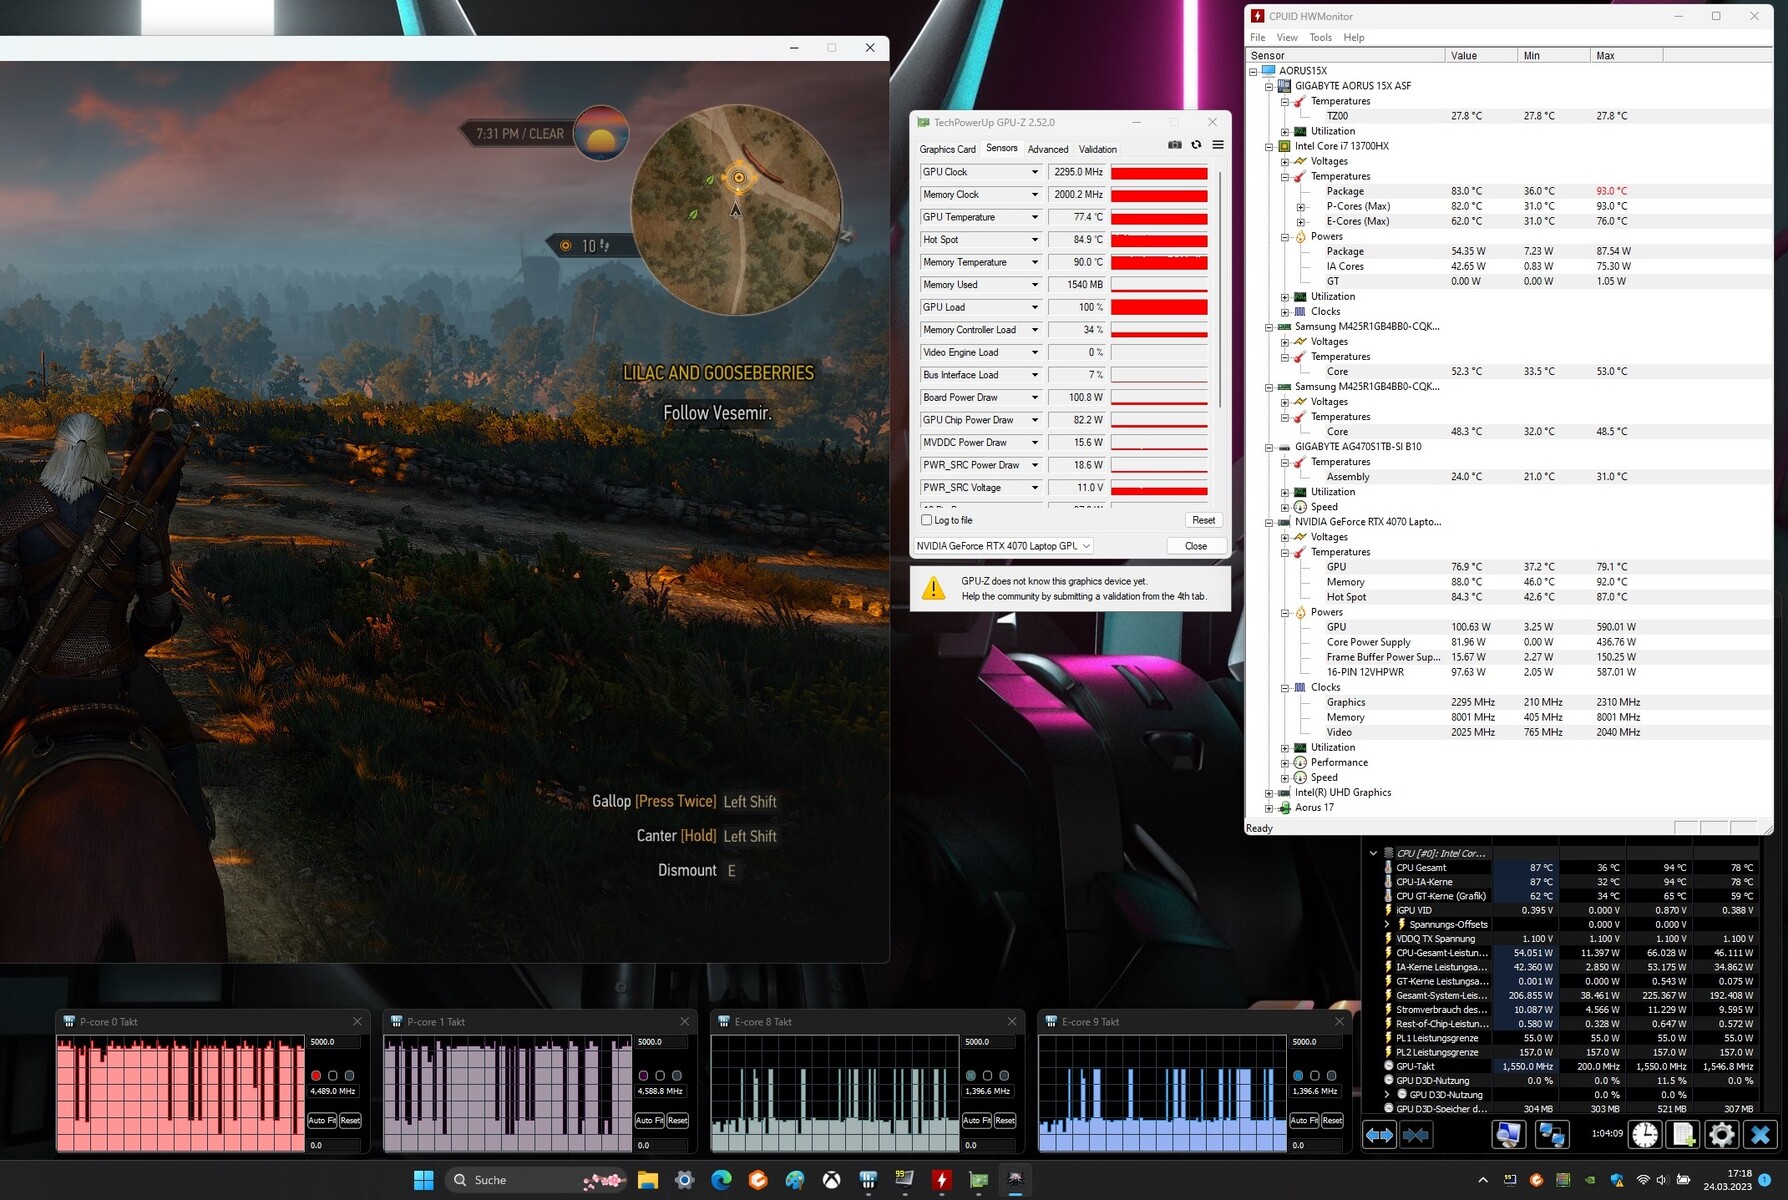
Prueba de esfuerzo
La prueba de estrés (Prime95 y Furmark en uso continuo) simula un escenario extremo para comprobar la estabilidad del sistema bajo carga máxima.
La CPU (P: 2,7 a 2,8 GHz, E: 2,1 a 2,2 GHz) comenzó la prueba con velocidades de reloj medias. Al cabo de poco tiempo, las frecuencias se redujeron a entre 2 y 2,5 GHz (núcleos P) y entre 1,8 y 1,9 GHz (núcleos E). La velocidad de reloj de la GPU bajó de 2,4 GHz a 2,1 GHz.
Altavoces
Los altavoces estéreo producen un sonido decente, pero apenas hay graves. Se recomiendan auriculares o altavoces externos para una mejor experiencia de sonido.
Aorus 15X ASF análisis de audio
(+) | los altavoces pueden reproducir a un volumen relativamente alto (#83 dB)
Graves 100 - 315 Hz
(-) | casi sin bajos - de media 27.3% inferior a la mediana
(-) | los graves no son lineales (15.1% delta a la frecuencia anterior)
Medios 400 - 2000 Hz
(±) | medias más altas - de media 5.8% más altas que la mediana
(+) | los medios son lineales (4.8% delta a la frecuencia anterior)
Altos 2 - 16 kHz
(+) | máximos equilibrados - a sólo 3.1% de la mediana
(+) | los máximos son lineales (6.3% delta a la frecuencia anterior)
Total 100 - 16.000 Hz
(±) | la linealidad del sonido global es media (20.1% de diferencia con la mediana)
En comparación con la misma clase
» 71% de todos los dispositivos probados de esta clase eran mejores, 6% similares, 23% peores
» El mejor tuvo un delta de 6%, la media fue 18%, el peor fue ###max##%
En comparación con todos los dispositivos probados
» 52% de todos los dispositivos probados eran mejores, 8% similares, 40% peores
» El mejor tuvo un delta de 4%, la media fue 23%, el peor fue ###max##%
Asus ROG Strix G17 G713PI análisis de audio
(±) | la sonoridad del altavoz es media pero buena (81 dB)
Graves 100 - 315 Hz
(+) | buen bajo - sólo 4.6% lejos de la mediana
(+) | el bajo es lineal (6.5% delta a la frecuencia anterior)
Medios 400 - 2000 Hz
(+) | medios equilibrados - a sólo 3.1% de la mediana
(+) | los medios son lineales (5.9% delta a la frecuencia anterior)
Altos 2 - 16 kHz
(+) | máximos equilibrados - a sólo 3.5% de la mediana
(+) | los máximos son lineales (6.8% delta a la frecuencia anterior)
Total 100 - 16.000 Hz
(+) | el sonido global es lineal (9.5% de diferencia con la mediana)
En comparación con la misma clase
» 3% de todos los dispositivos probados de esta clase eran mejores, 1% similares, 95% peores
» El mejor tuvo un delta de 6%, la media fue 18%, el peor fue ###max##%
En comparación con todos los dispositivos probados
» 4% de todos los dispositivos probados eran mejores, 1% similares, 95% peores
» El mejor tuvo un delta de 4%, la media fue 23%, el peor fue ###max##%
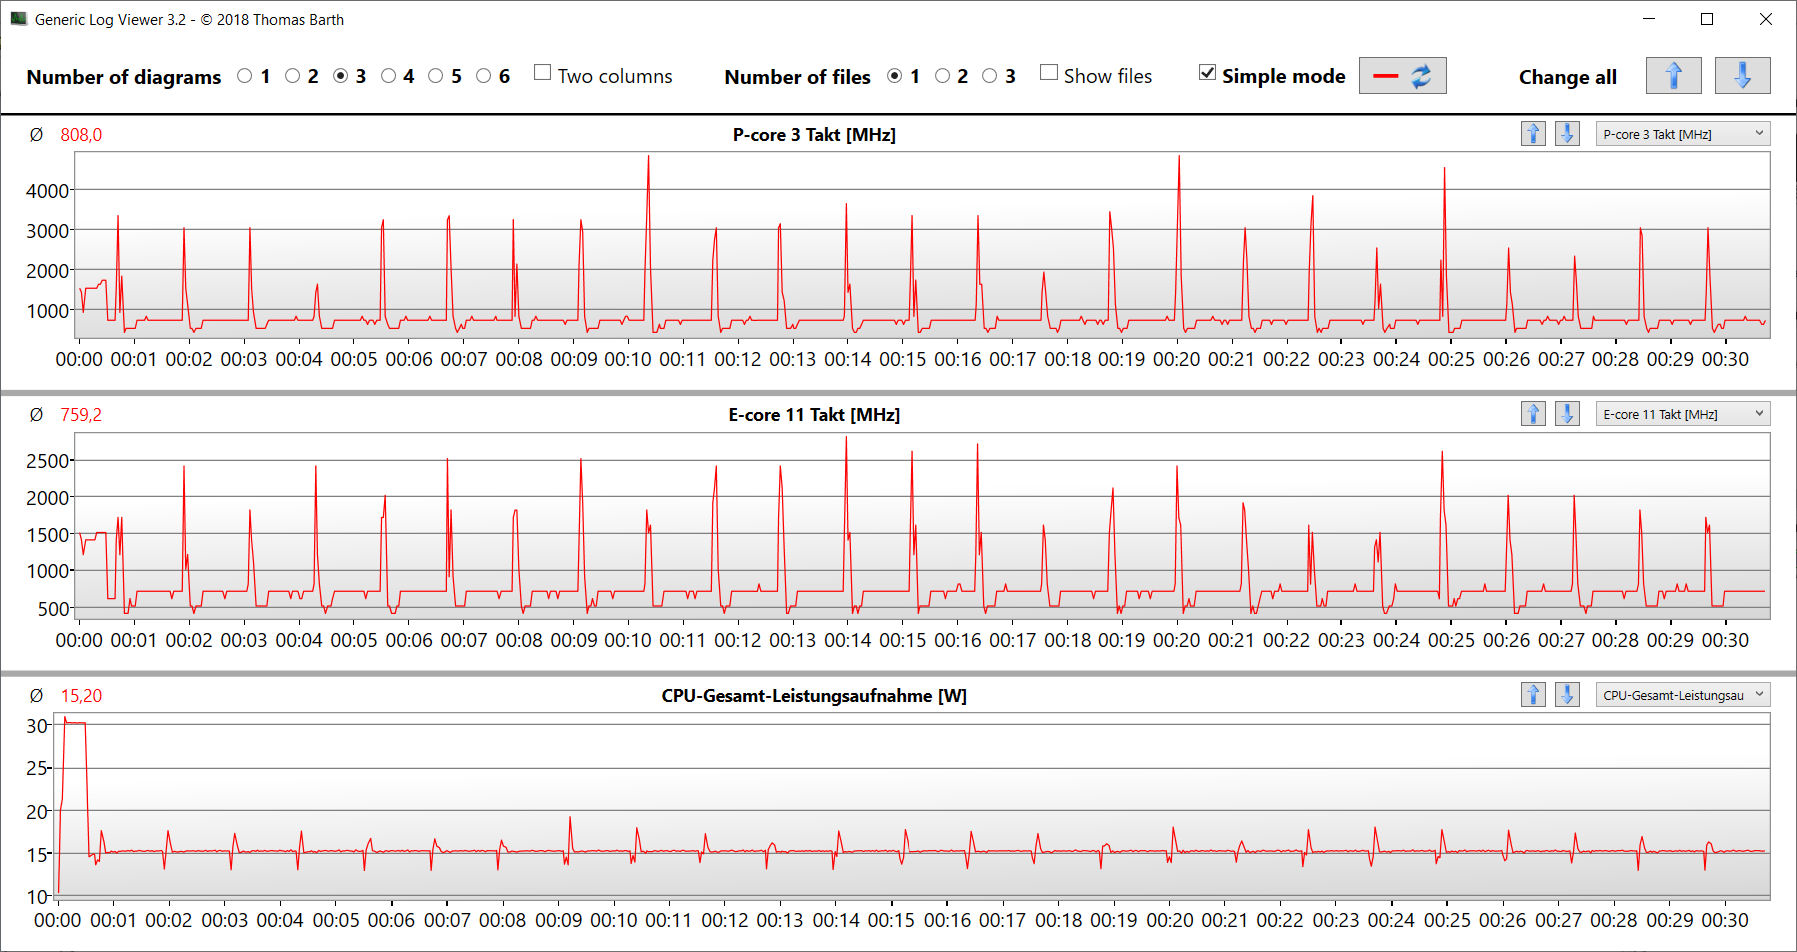
Gestión de la energía: al ordenador Aorus no le falta resistencia
Consumo de energía
El portátil Gigabyte no mostró ninguna anomalía en términos de consumo de energía. Los índices estaban en un nivel normal para el hardware instalado. La prueba Witcher 3 test y el test de estrés se ejecutaron con un consumo de energía relativamente constante. El conector de alimentación (280 vatios) tiene un tamaño suficiente.
| Off / Standby | |
| Ocioso | |
| Carga |
|
Clave:
min: | |
| Aorus 15X ASF i7-13700HX, GeForce RTX 4070 Laptop GPU | Razer Blade 15 OLED (Early 2022) i9-12900H, GeForce RTX 3070 Ti Laptop GPU | MSI Katana 17 B13VFK i7-13620H, GeForce RTX 4060 Laptop GPU | Asus ROG Strix G17 G713PI R9 7945HX, GeForce RTX 4070 Laptop GPU | Acer Predator Helios 300 (i7-12700H, RTX 3070 Ti) i7-12700H, GeForce RTX 3070 Ti Laptop GPU | Medio NVIDIA GeForce RTX 4070 Laptop GPU | Media de la clase Gaming | |
|---|---|---|---|---|---|---|---|
| Power Consumption | -57% | 15% | -14% | -19% | -2% | -8% | |
| Idle Minimum * (Watt) | 11 | 31.6 -187% | 12.2 -11% | 15 -36% | 15 -36% | 13.2 ? -20% | 13 ? -18% |
| Idle Average * (Watt) | 16 | 33.3 -108% | 14.9 7% | 20 -25% | 20 -25% | 18.2 ? -14% | 19 ? -19% |
| Idle Maximum * (Watt) | 24 | 38.6 -61% | 15.8 34% | 29 -21% | 22.3 7% | 24.6 ? -3% | 24.6 ? -3% |
| Load Average * (Watt) | 104 | 149 -43% | 85.22 18% | 121 -16% | 133 -28% | 97 ? 7% | 110.7 ? -6% |
| Witcher 3 ultra * (Watt) | 185.4 | 149.6 19% | 151.1 19% | 179.8 3% | 231 -25% | ||
| Load Maximum * (Watt) | 272 | 160 41% | 212.8 22% | 246 10% | 290 -7% | 221 ? 19% | 259 ? 5% |
* ... más pequeño es mejor
Power consumption Witcher 3 / stress test
Power consumption with external monitor
Tiempos de ejecución
El dispositivo de 15,6 pulgadas logró tiempos de ejecución de 8:09 horas y 7:52 horas en la prueba WLAN (llamando a sitios web a través de un script) y la prueba de vídeo (película corta Big Buck Bunny (codificación H.264, FHD) en bucle), respectivamente. Durante ambas pruebas, se desactivaron las funciones de ahorro de energía del portátil y el brillo de la pantalla se ajustó a unos 150 cd/m². Los módulos inalámbricos también se desactivaron para la prueba de vídeo.
El Aorus 15 ofreció una buena duración de batería en general - no sólo para un portátil de juegos. Teniendo en cuenta la enorme capacidad de la batería (99 Wh), estos valores no son sorprendentes. No obstante, el portátil de Gigabyte también está por delante en términos de vatios-hora.
| Aorus 15X ASF i7-13700HX, GeForce RTX 4070 Laptop GPU, 99 Wh | Razer Blade 15 OLED (Early 2022) i9-12900H, GeForce RTX 3070 Ti Laptop GPU, 80 Wh | MSI Katana 17 B13VFK i7-13620H, GeForce RTX 4060 Laptop GPU, 53.5 Wh | Asus ROG Strix G17 G713PI R9 7945HX, GeForce RTX 4070 Laptop GPU, 90 Wh | Acer Predator Helios 300 (i7-12700H, RTX 3070 Ti) i7-12700H, GeForce RTX 3070 Ti Laptop GPU, 90 Wh | Media de la clase Gaming | |
|---|---|---|---|---|---|---|
| Duración de Batería | -26% | -58% | -54% | -21% | -15% | |
| Reader / Idle (h) | 11.3 | 6.7 -41% | 8.27 ? -27% | |||
| H.264 (h) | 7.9 | 5.9 -25% | 2.8 -65% | 5.9 -25% | 8.32 ? 5% | |
| WiFi v1.3 (h) | 8.2 | 4.6 -44% | 2.9 -65% | 4.3 -48% | 6 -27% | 7.11 ? -13% |
| Load (h) | 2 | 2.1 5% | 1 -50% | 1 -50% | 1.8 -10% | 1.502 ? -25% |
| Witcher 3 ultra (h) | 1.1 |
Pro
Contra
Veredicto - Un portátil para juegos muy completo
Aunque el Aorus 15X está diseñado para juegos QHD con configuraciones altas o máximas, también rinde bien en otras áreas exigentes como la edición y renderización de vídeo. ElCore i7-13700HX yGeForce RTX 4070 proporcionan la potencia de procesamiento necesaria. Un PCIe-4-SSD superrápido (1 TB) garantiza tiempos de carga cortos.
Potente, duradero, silencioso cuando es necesario: el Aorus 15X ASF puede satisfacer muchas de las exigencias que se le plantean a un portátil de juego moderno.
La CPU y la GPU funcionan con frecuencias de reloj constantemente altas. El ruido y el desarrollo de calor están en el alto nivel habitual. Sin embargo, es posible un funcionamiento de silencioso a completamente silencioso - con una potencia de procesado significativamente reducida. No obstante, esto seguiría satisfaciendo las demandas de los usuarios para el uso diario y permitiría jugar con ajustes reducidos.
La pantalla mate QHD (15.6 pulgadas, IPS, 240 Hz) no necesita crítica. Un puerto Thunderbolt 4 abre opciones de expansión (solución de acoplamiento, GPU externa). También puede usarse para alimentar el portátil con un adaptador de corriente USB-C (mínimo 65 vatios) - soporta Power Delivery. La duración de la batería, de unas 8 horas, completa el conjunto.
El sitioRazer Blade 15 OLED podría ser una alternativa viable a este dispositivo. Ofrece menos potencia de procesamiento que el portátil Aorus, pero gana puntos extra con sus dimensiones más compactas, menor peso y una pantalla OLED de alto contraste y color real.
Precio y disponibilidad
El Aorus 15X ASF se puede comprar en la configuración que probamos por 2.099 dólares en Amazon.
Aorus 15X ASF
- 04/05/2023 v7 (old)
Sascha Mölck
Transparencia
La selección de los dispositivos que se van a reseñar corre a cargo de nuestro equipo editorial. La muestra de prueba fue proporcionada al autor en calidad de préstamo por el fabricante o el minorista a los efectos de esta reseña. El prestamista no tuvo ninguna influencia en esta reseña, ni el fabricante recibió una copia de la misma antes de su publicación. No había ninguna obligación de publicar esta reseña. Como empresa de medios independiente, Notebookcheck no está sujeta a la autoridad de fabricantes, minoristas o editores.
Así es como prueba Notebookcheck
Cada año, Notebookcheck revisa de forma independiente cientos de portátiles y smartphones utilizando procedimientos estandarizados para asegurar que todos los resultados son comparables. Hemos desarrollado continuamente nuestros métodos de prueba durante unos 20 años y hemos establecido los estándares de la industria en el proceso. En nuestros laboratorios de pruebas, técnicos y editores experimentados utilizan equipos de medición de alta calidad. Estas pruebas implican un proceso de validación en varias fases. Nuestro complejo sistema de clasificación se basa en cientos de mediciones y puntos de referencia bien fundamentados, lo que mantiene la objetividad.Price comparison

