Asus ROG Strix G17 G713PI: El portátil gaming impresiona en la prueba con el nuevo Ryzen 9
Con el ROG Strix G17, Asus presenta un portátil para juegos que se supone que causará impresión sobre todo con su procesador. Y en efecto, 16 núcleos, 32 hilos, una enorme caché L3 de 64 MB y la arquitectura Zen4 delAMD Ryzen 9 7945HX al menos suenan impresionantes. Resulta que esto no sólo va por la hoja de especificaciones técnicas, sino que la CPU también hace un buen trabajo en nuestros benchmarks.
También puedes elegir entre los tres chips gráficos móviles más pequeños de la serie RTX 4000, que aseguran que los 240 hercios de la por lo demás sencilla pantalla de 17 pulgadas reciban un número suficiente de fotogramas. También mantienen el precio dentro de límites aceptables, empezando en los 2.000 Euros para el ROG Strix. Aparte del convincente rendimiento de juego y los dignos efectos visuales, también hay algunos ahorros menores que no estropean la impresión general e impiden el rendimiento de juego como mucho mínimamente.
Nuestra configuración de pruebas del G713PI-LL005W con 32 GB de RAM, la Nvidia GeForce RTX 4070, y un SSD M.2 de 1 TB compite directamente con el ligeramente mayor Asus ROG Strix G18 yRazer Blade 18que también están equipados con la misma Nvidia GeForce RTX 4070y procesadores Intel. La comparación con la generación anterior de tarjetas gráficas también debería ser interesante. Nuestros benchmarks deberían mostrar hasta qué punto es capaz de superar a una impresionantemente equipada Asus ROG Strix Scar 17 SEcon laRTX 3080 Ti o unAlienware m17 R5con la AMD Radeon RX 6850M XT.
Posibles contendientes en la comparación
Valoración | Fecha | Modelo | Peso | Altura | Tamaño | Resolución | Precio |
|---|---|---|---|---|---|---|---|
| 88.4 % v7 (old) | 04/2023 | Asus ROG Strix G17 G713PI R9 7945HX, GeForce RTX 4070 Laptop GPU | 2.8 kg | 30.7 mm | 17.30" | 2560x1440 | |
| 87.4 % v7 (old) | 03/2023 | Asus ROG Strix G18 G814JI i7-13650HX, GeForce RTX 4070 Laptop GPU | 3 kg | 31 mm | 18.00" | 2560x1600 | |
| 91.4 % v7 (old) | 02/2023 | Razer Blade 18 RTX 4070 i9-13950HX, GeForce RTX 4070 Laptop GPU | 3 kg | 21.9 mm | 18.00" | 2560x1600 | |
| 86.9 % v7 (old) | 11/2022 | Asus ROG Strix Scar 17 SE G733CX-LL014W i9-12950HX, GeForce RTX 3080 Ti Laptop GPU | 2.9 kg | 28.3 mm | 17.30" | 2560x1440 | |
| 88 % v7 (old) | 04/2023 | Asus Zephyrus Duo 16 GX650PY-NM006W R9 7945HX, GeForce RTX 4090 Laptop GPU | 2.7 kg | 29.7 mm | 16.00" | 2560x1600 | |
| 86.1 % v7 (old) | 01/2023 | Alienware m17 R5 (R9 6900HX, RX 6850M XT) R9 6900HX, Radeon RX 6850M XT | 3.4 kg | 26.7 mm | 17.00" | 3840x2160 | |
| 88.4 % v7 (old) | 03/2023 | Asus ROG Strix G16 G614JZ i9-13980HX, GeForce RTX 4080 Laptop GPU | 2.4 kg | 30.4 mm | 16.00" | 2560x1600 |
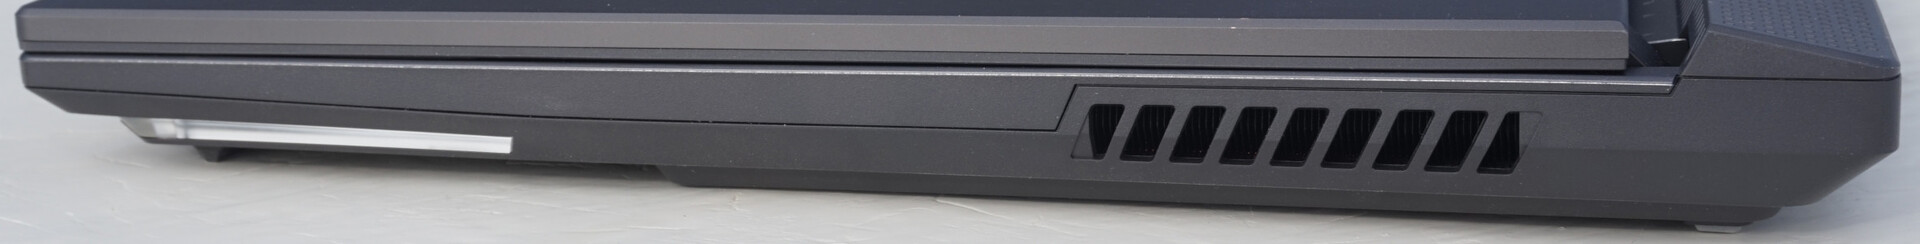
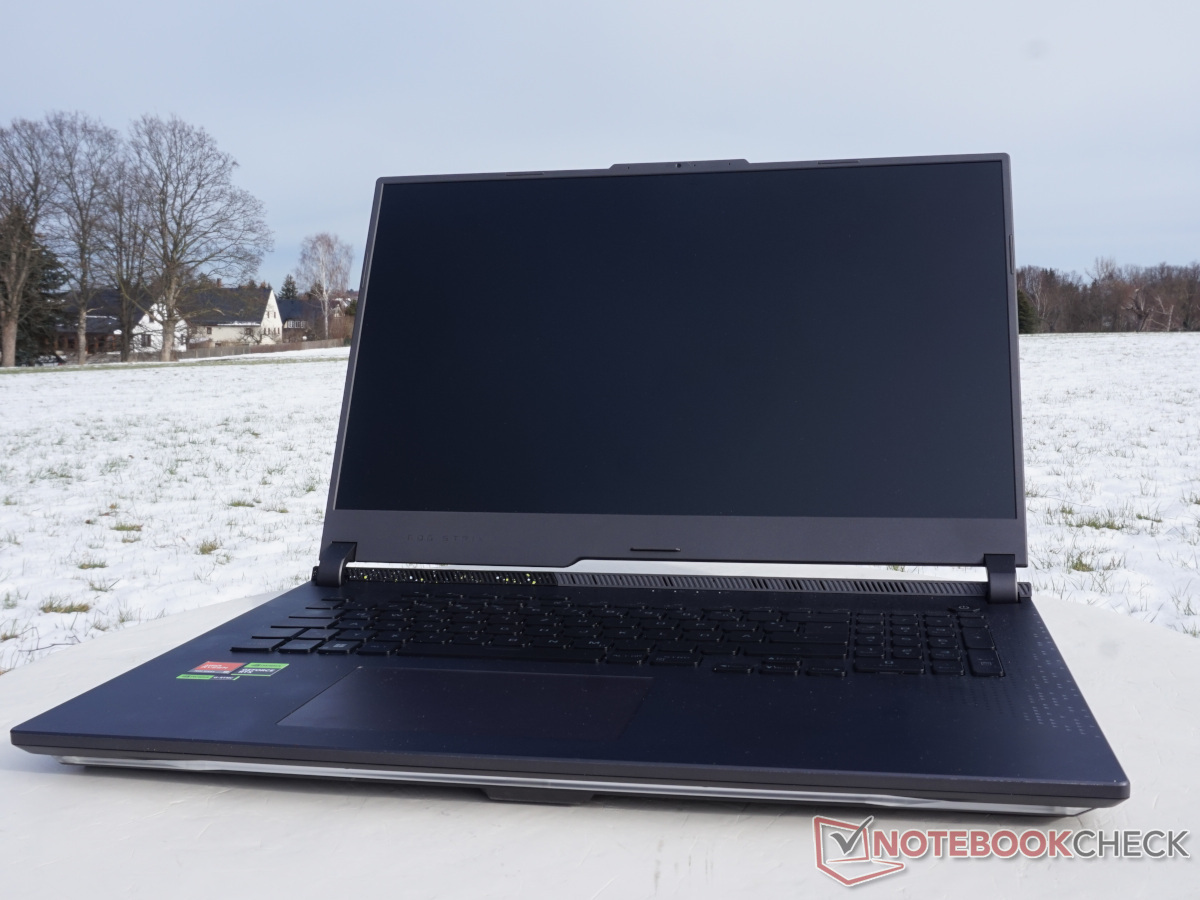
Caja - Robusta y juguetona ROG Strix
La enorme carcasa del portátil de juego muestra una estabilidad excelente. A pesar de su elevado peso de casi 3 kg, no detectamos deformación alguna, a pesar de que toda la unidad base está hecha exclusivamente de plástico. Por el contrario, la gran pantalla de 17,3 pulgadas está enmarcada en una tapa metálica. La construcción general parece correspondientemente robusta, sin dar motivo de queja.
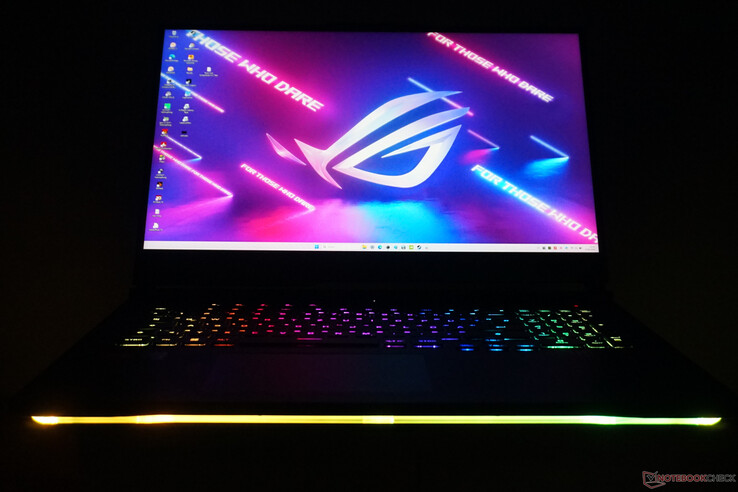
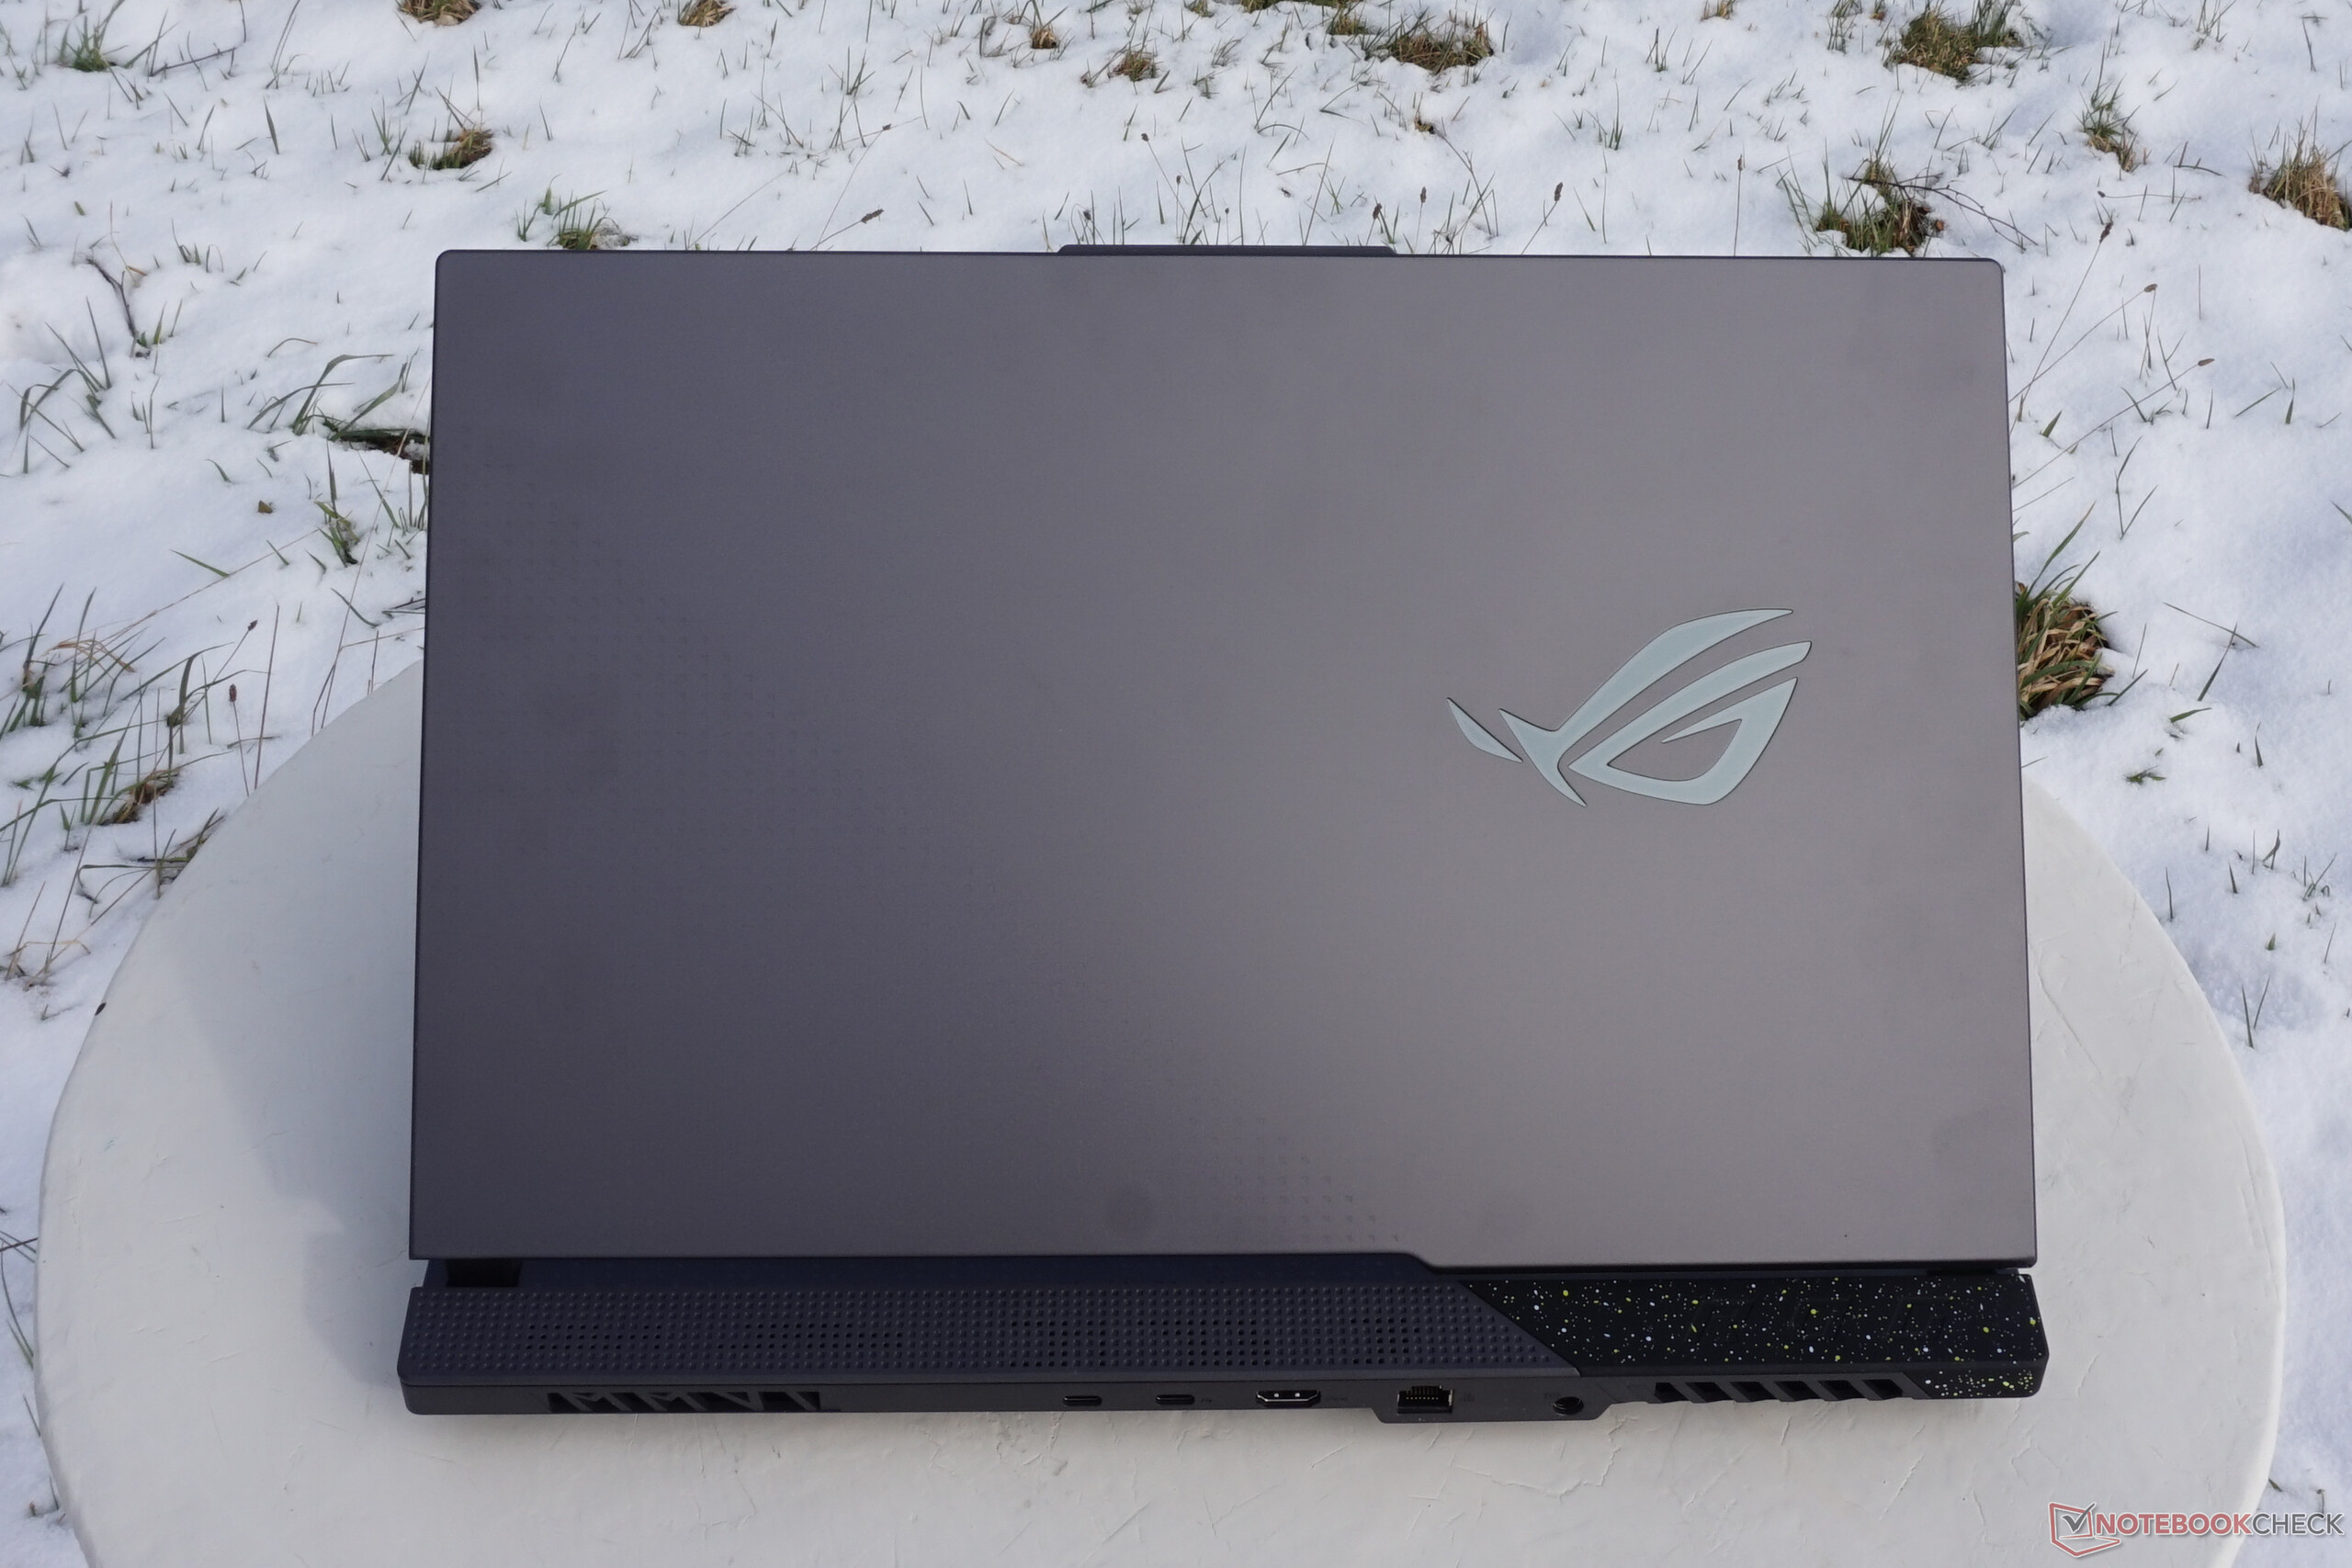
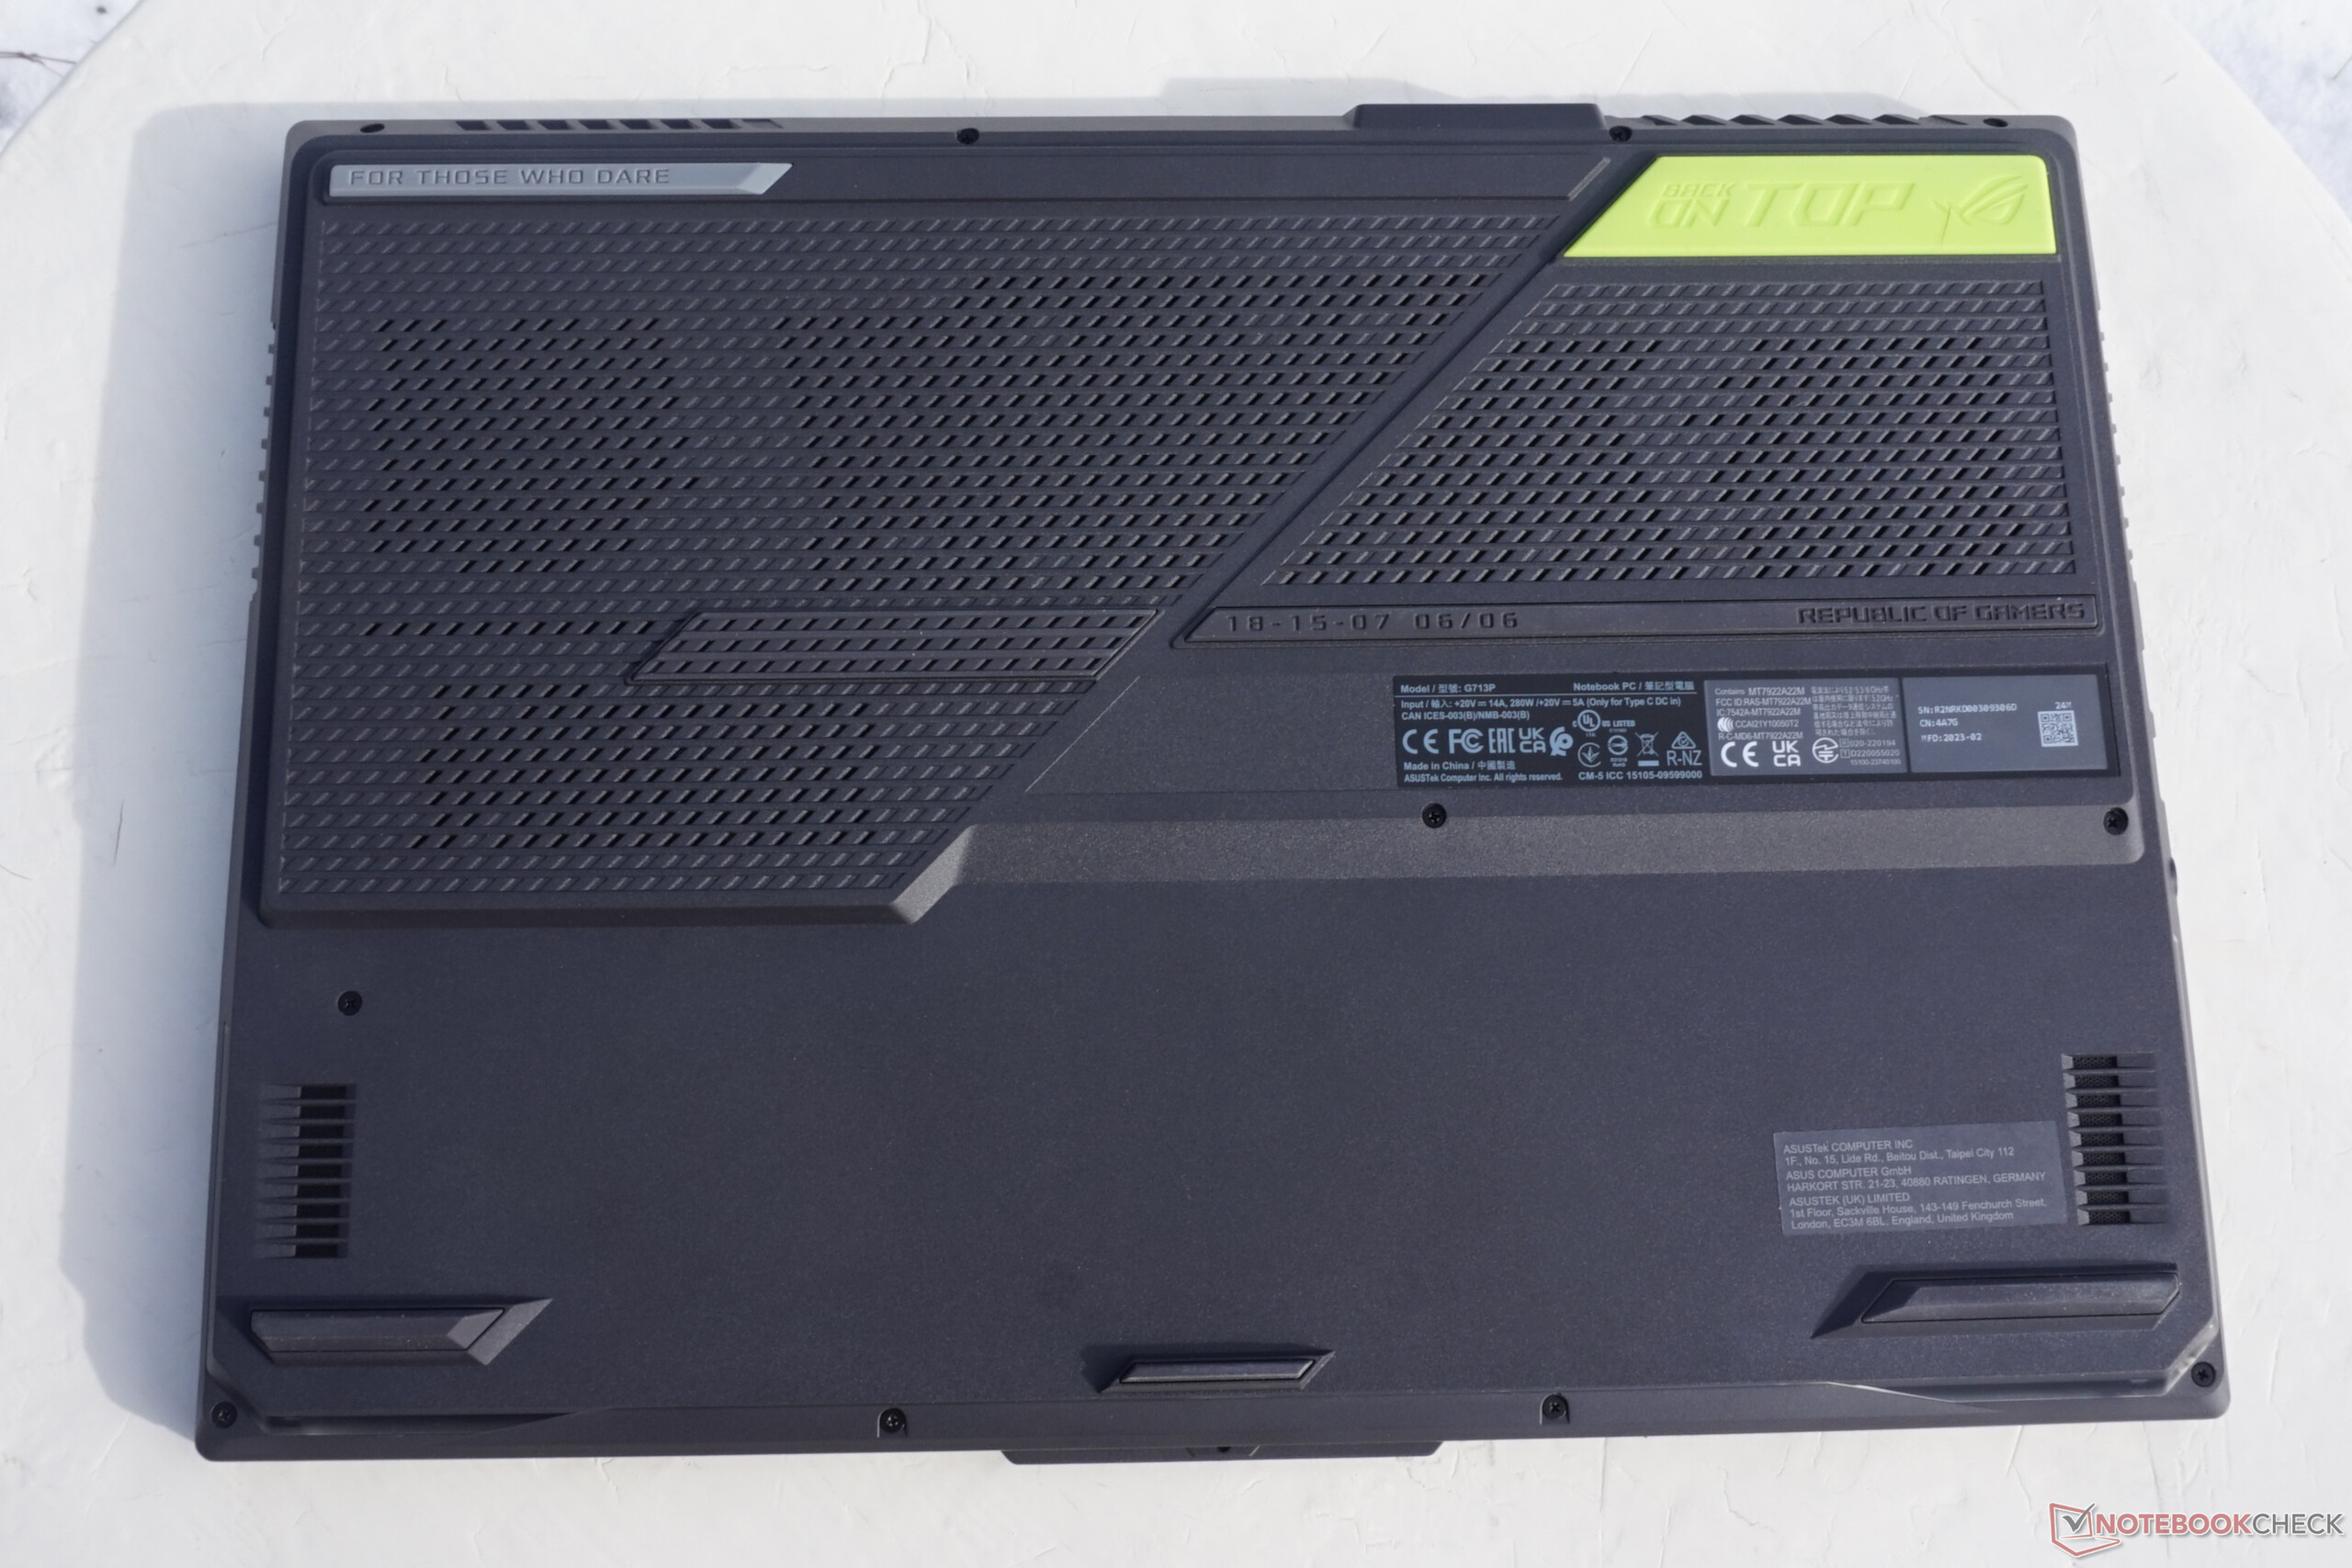
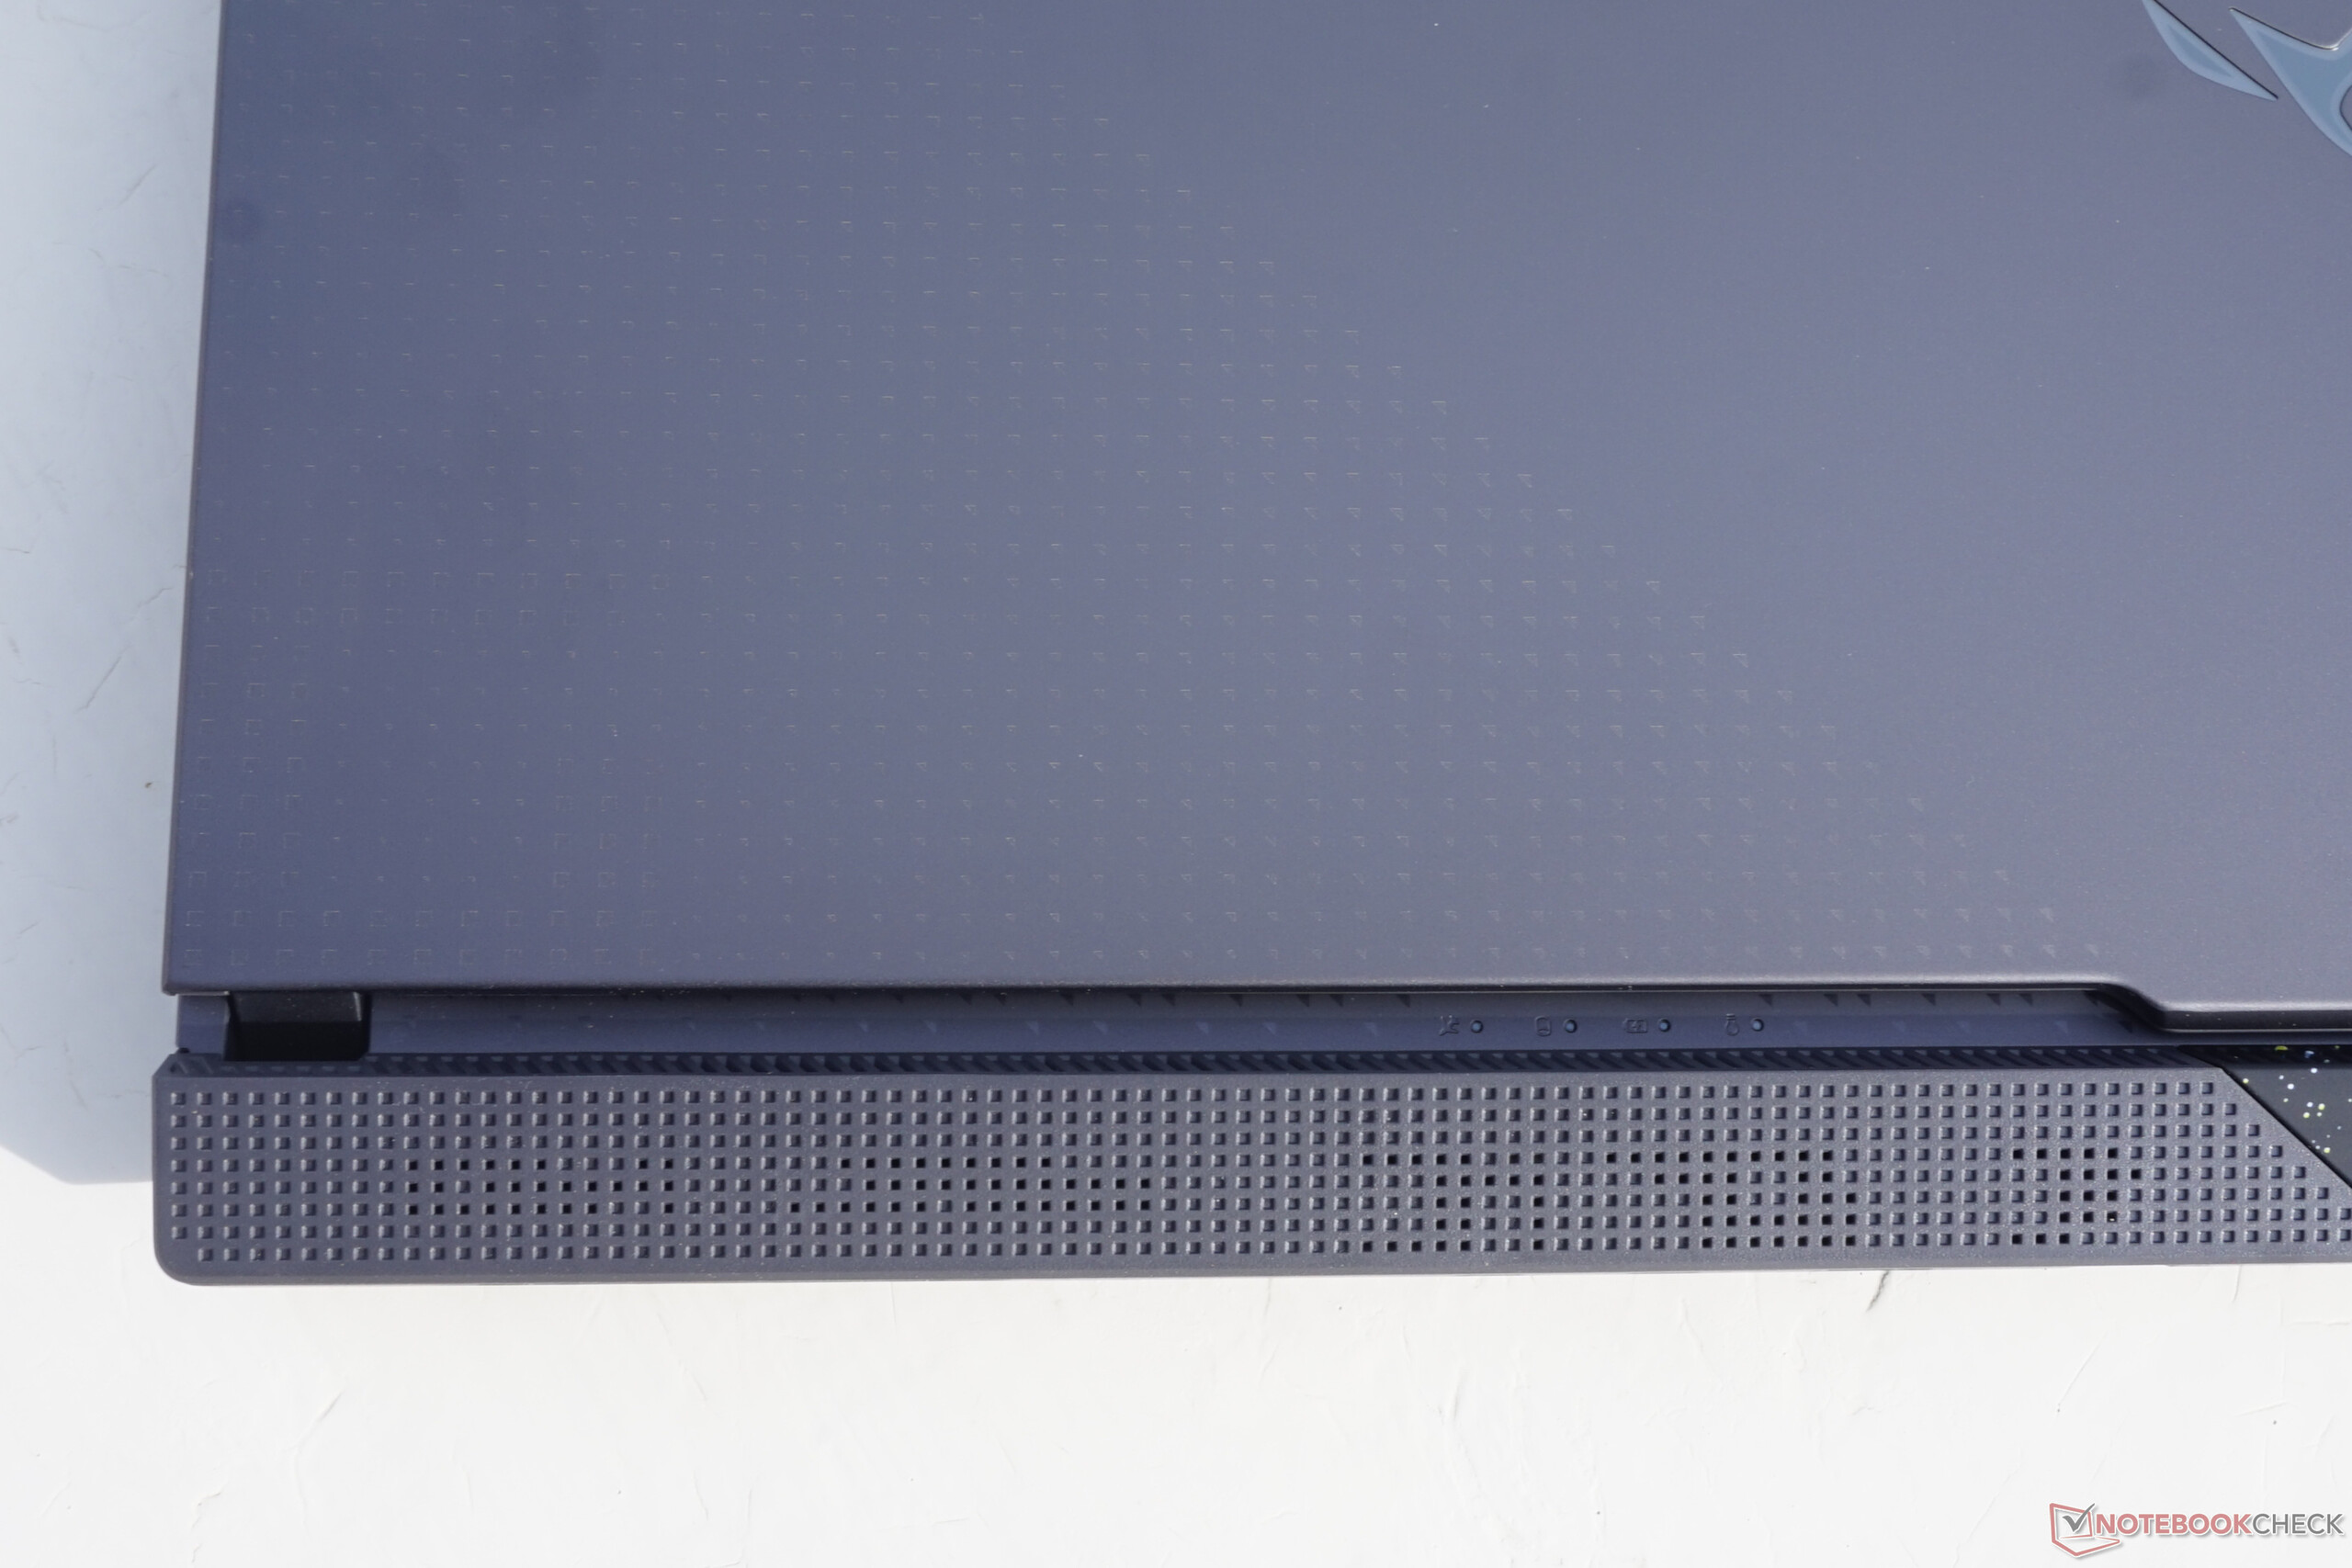
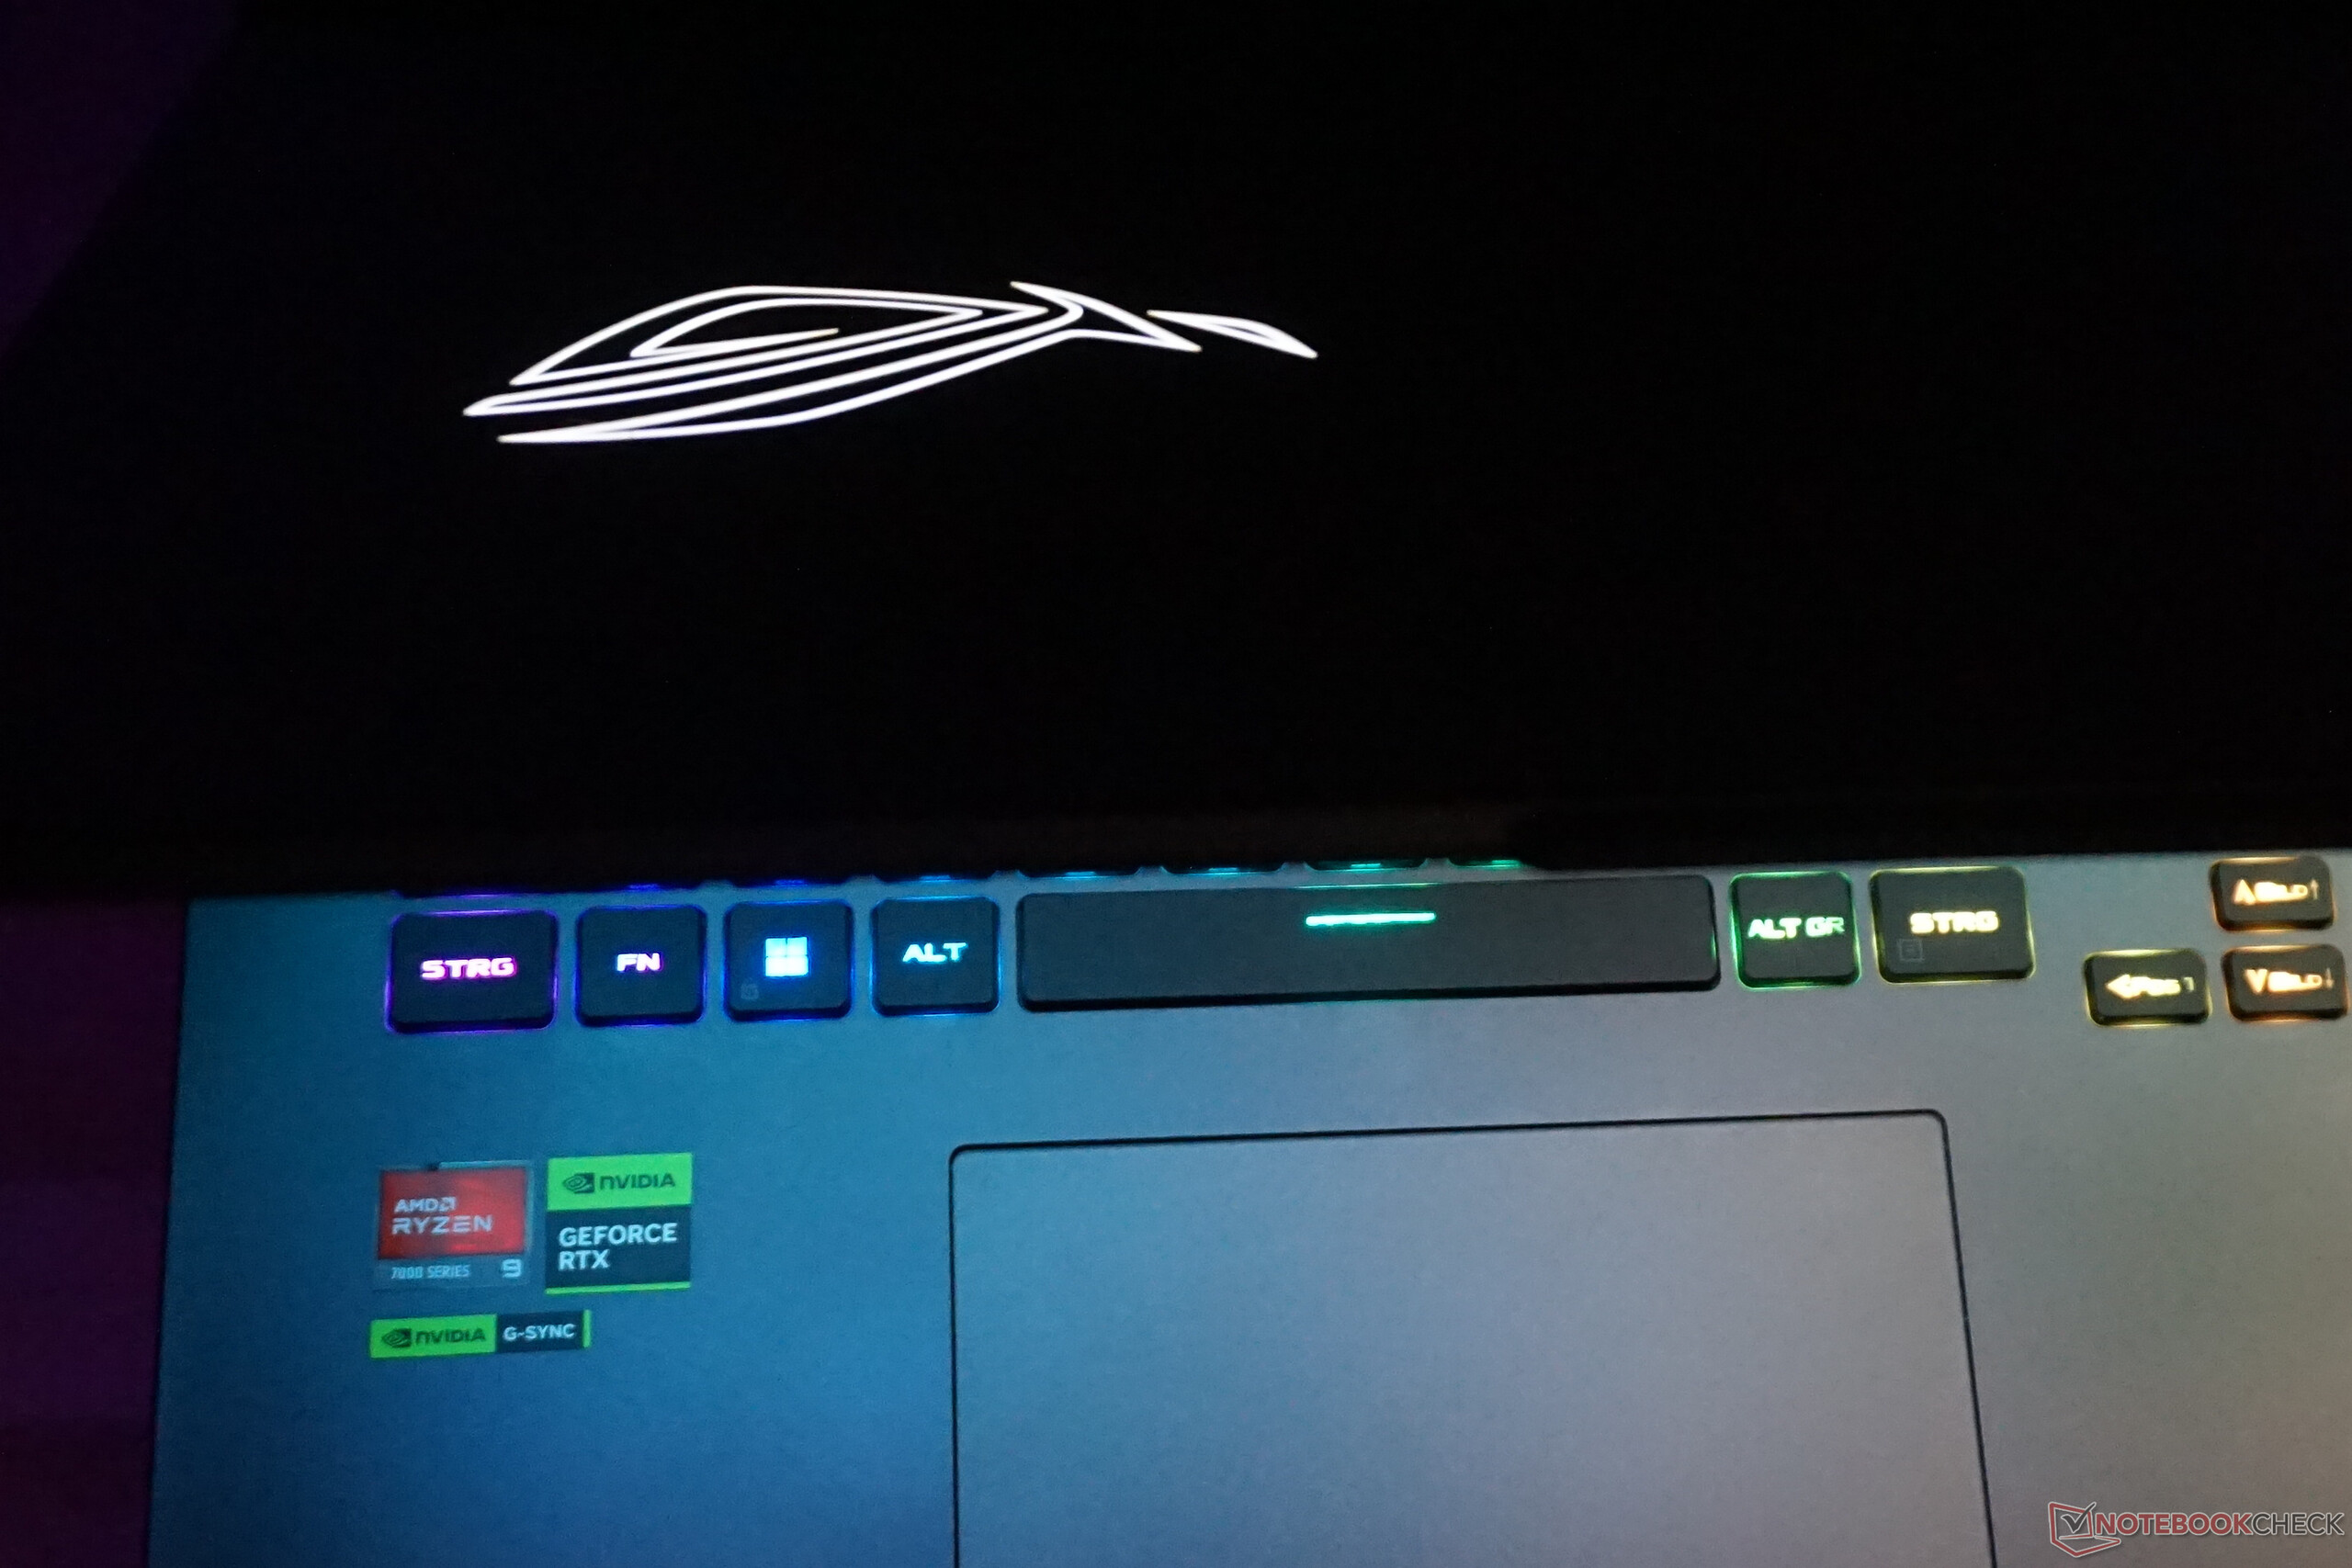
Destacan los numerosos elementos de acento grandes y pequeños. La tapa contiene un brillante logotipo que permanece siempre iluminado en blanco. La parte inferior también alberga una barra RGB de libre configuración que puede iluminarse junto con el teclado RGB o de forma independiente. Además, hay letras y eslóganes alrededor de la carcasa.
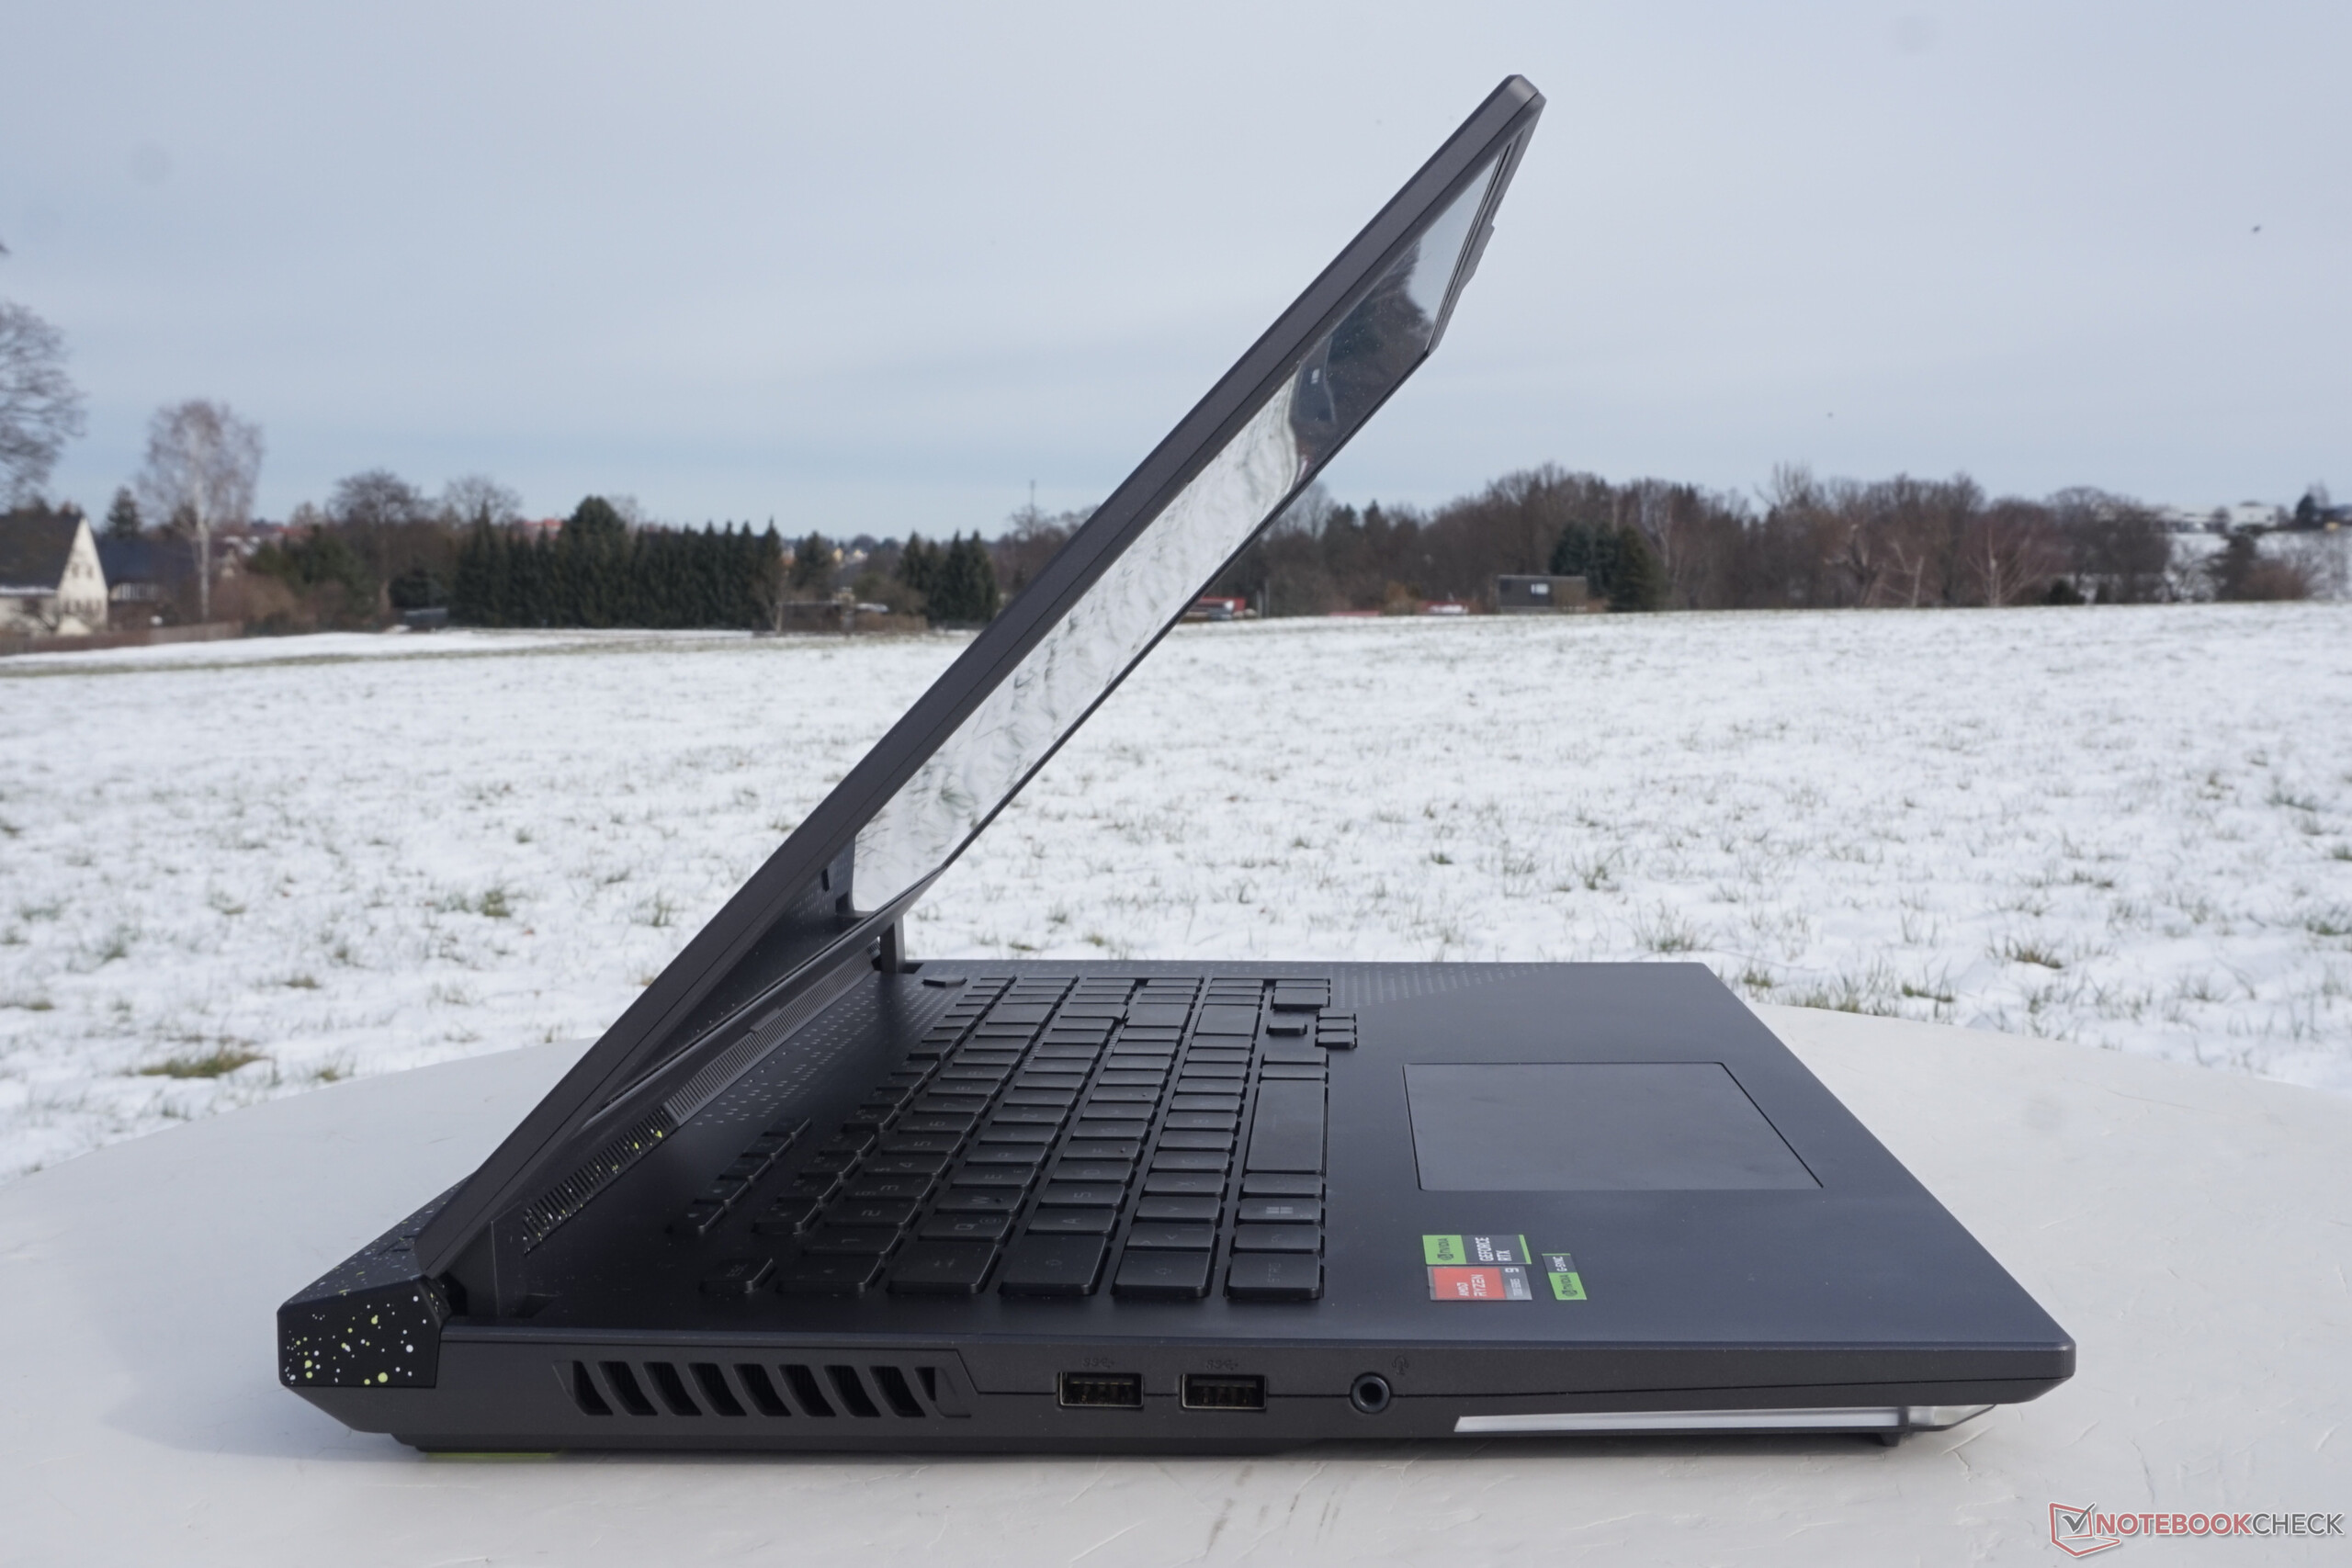
La gran distancia entre la pantalla y la parte trasera de la carcasa con las rejillas de ventilación parece bien pensada. Cuando la carcasa está cerrada, todos los LED de estado permanecen visibles y los ventiladores siguen funcionando sin ningún impedimento, mientras que puedes seguir jugando con un monitor externo y un teclado de sobremesa.

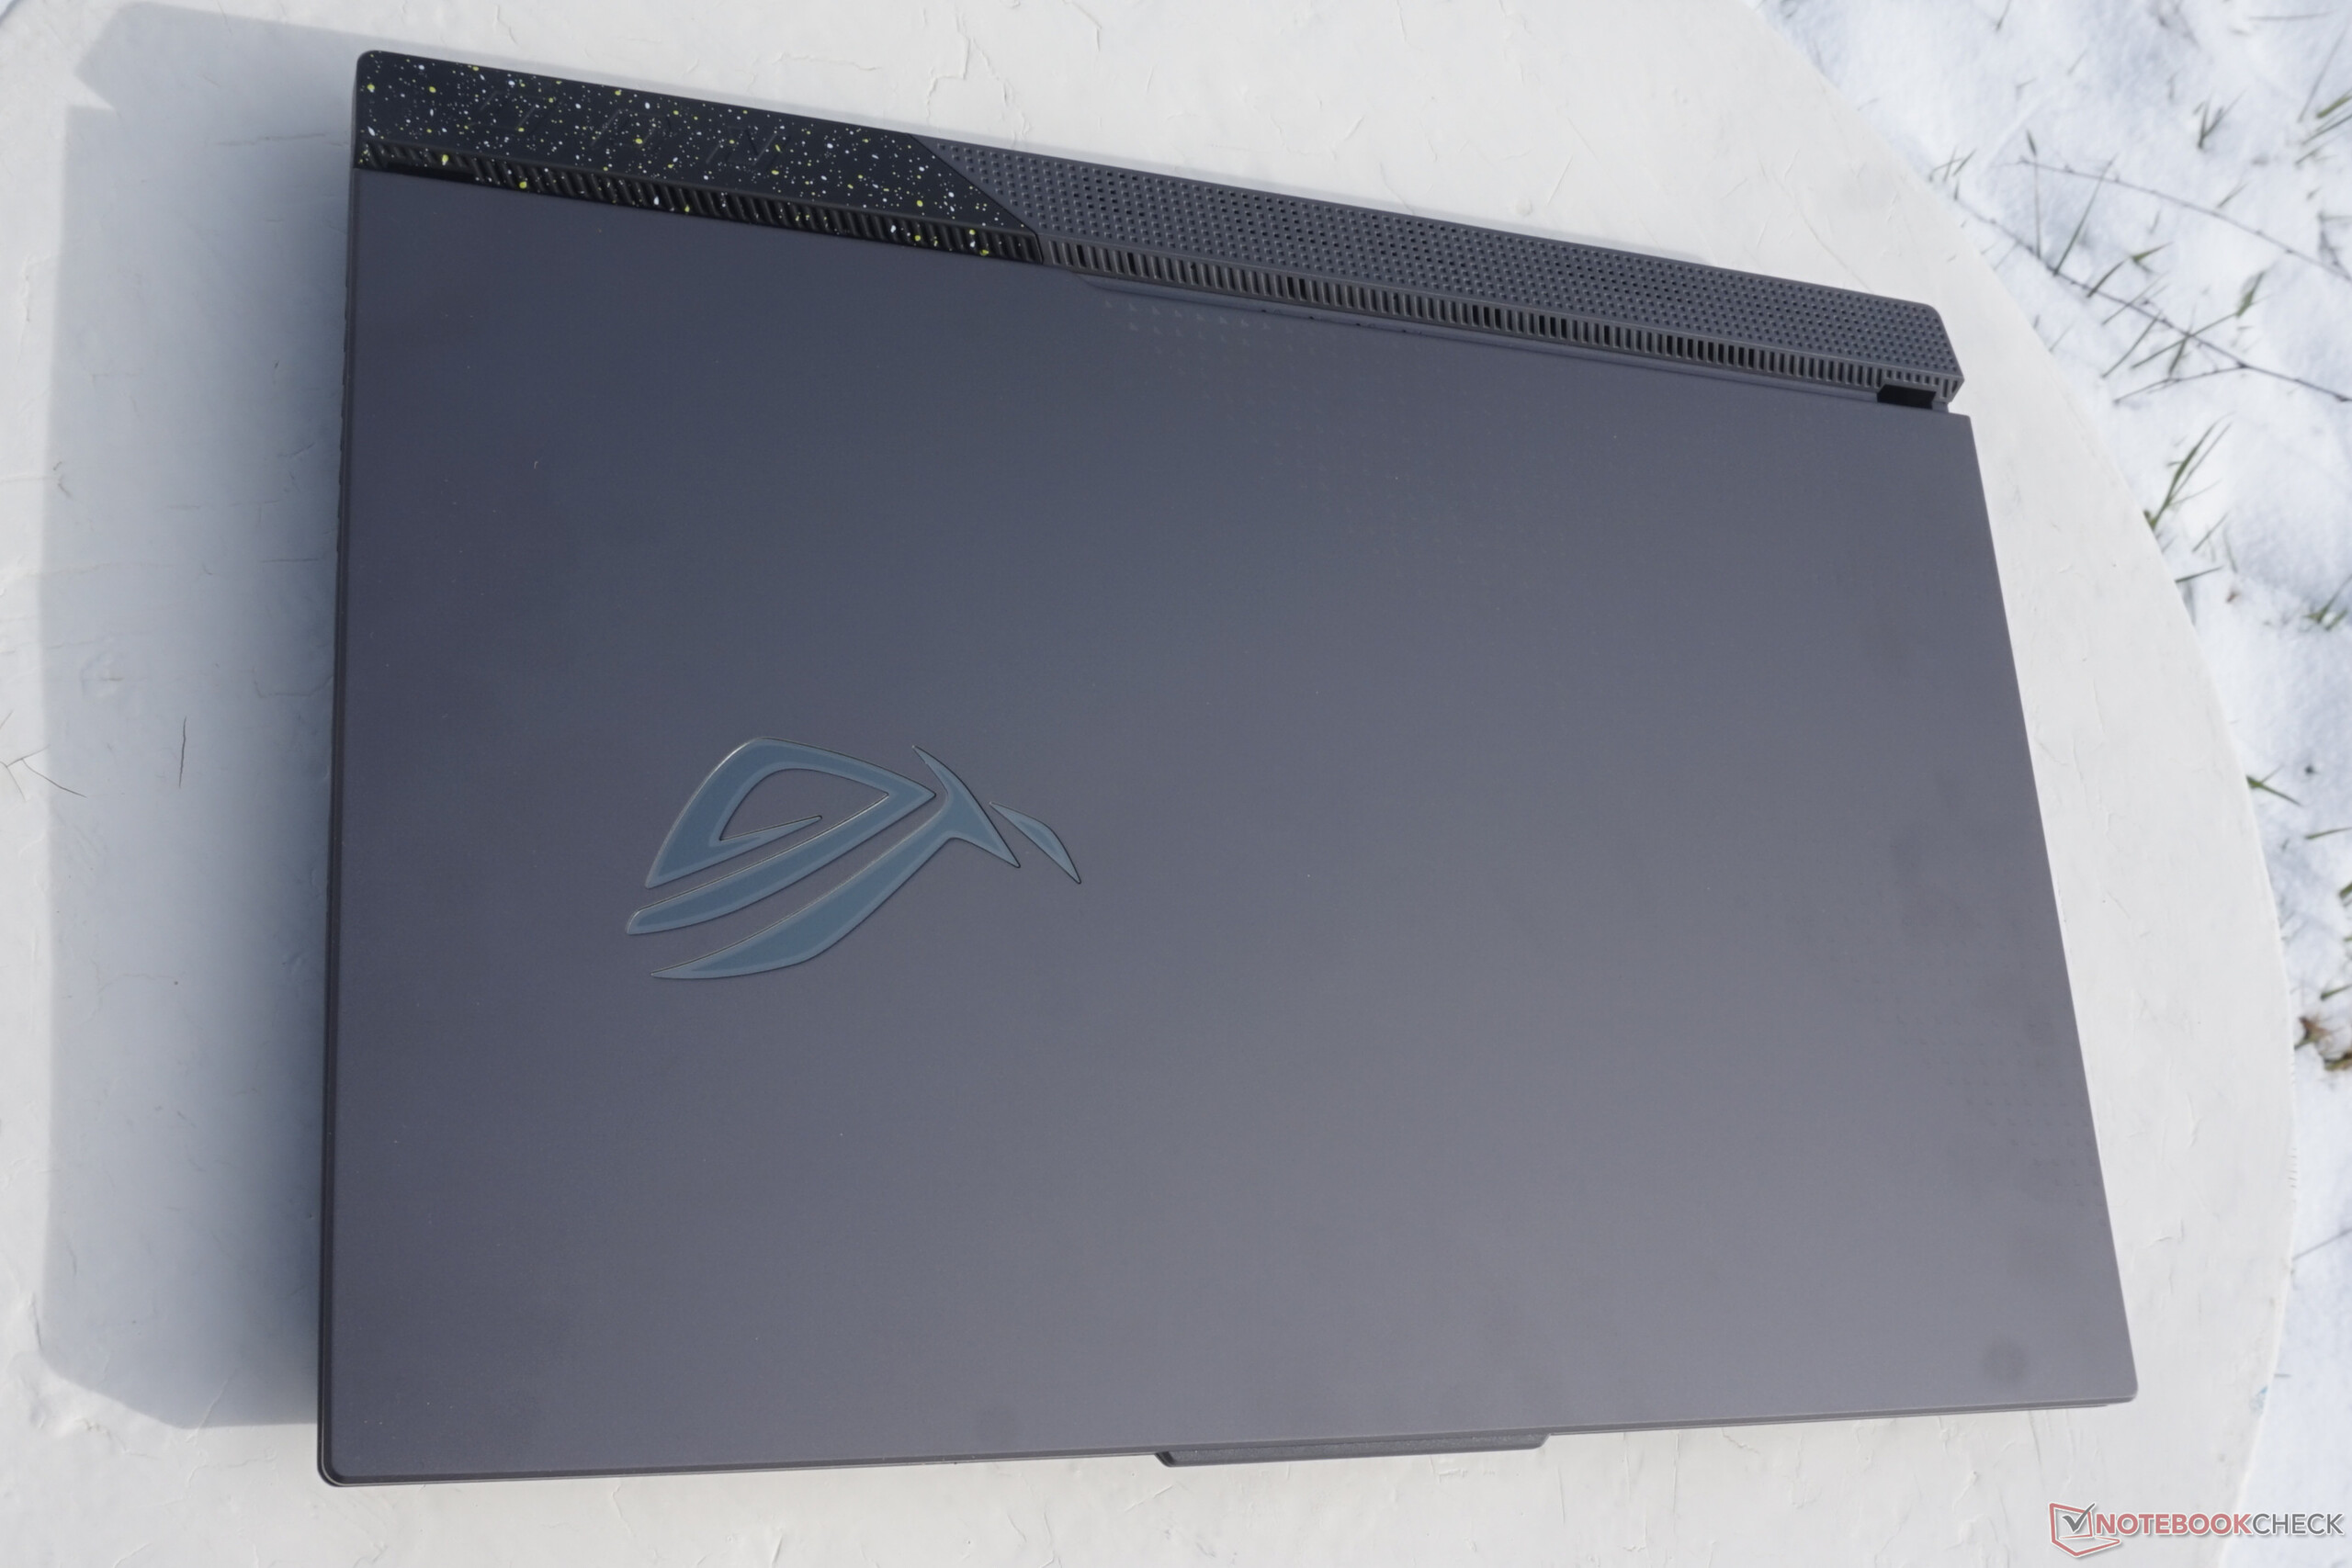
Teniendo en cuenta la pantalla de 17 pulgadas, el Asus ROG Strix es uno de los portátiles más grandes. Comparado con la generación predecesora del ROG Strix Scar 17 SEel grosor de la carcasa ha aumentado en casi 2 mm. A pesar de los atractivos y delgados biseles de la pantalla de 5 mm, las grandes áreas de refrigeración lo convierten en un portátil grande. Sin embargo, los competidores están en un rango de tamaño similar, y lo mismo cabe decir del peso de casi 3 kg.
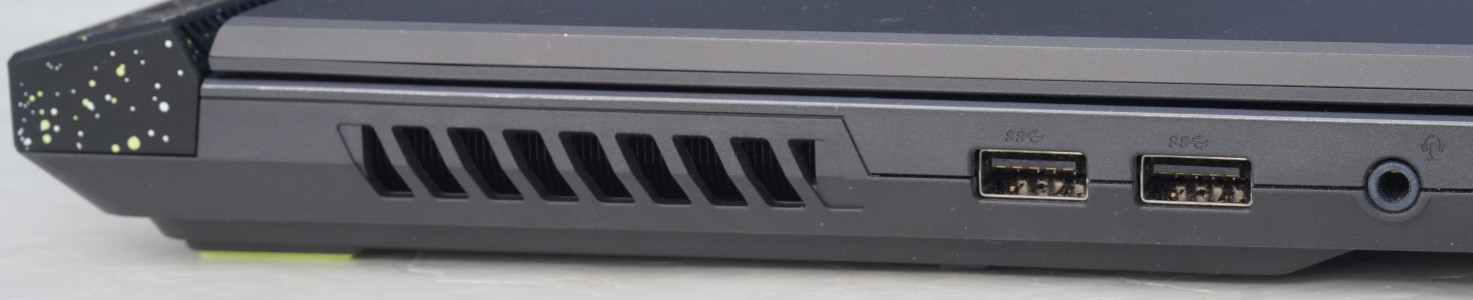
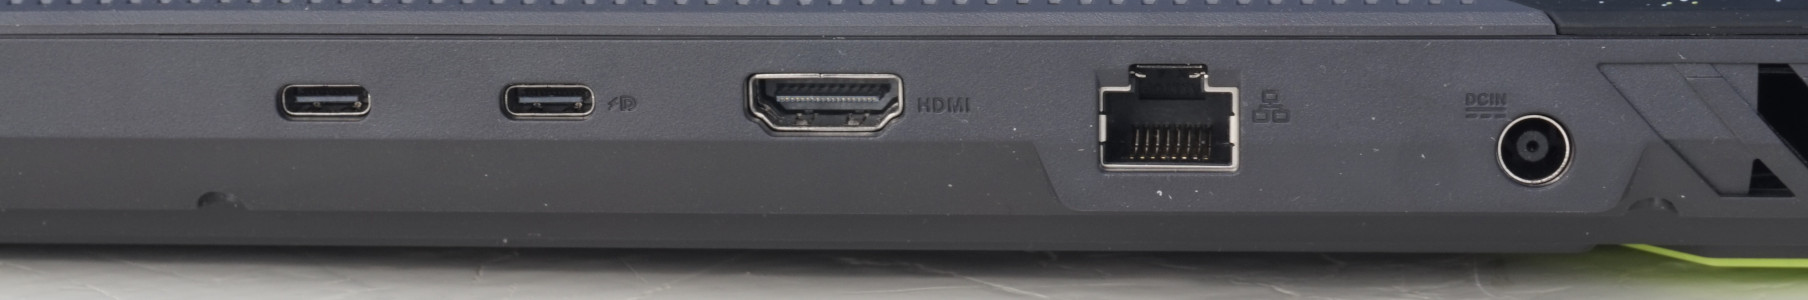
Equipo de conexión - Nada especial en el portátil para juegos
Sólo lo absolutamente necesario y además con una velocidad apenas suficiente: el equipamiento de conexión es muy limitado. Sólo dos conexiones USB-A en el lado izquierdo permiten conectar un ratón para juegos, una impresora, etc. Además, hay un puerto de audio sencillo pero suficiente para unos auriculares.
Dado que el resto de conexiones están situadas en la trasera, tu escritorio puede mantenerse cómodamente libre de desorden, aunque el ROG Strix rara vez puede arreglárselas completamente sin conexiones cableadas, como mostraremos a continuación. Las dos conexiones USB-C apenas alcanzan los 10 Gbit/s, lo que apenas basta para arrancar también juegos desde un SSD externo. Nos habría gustado al menos un puerto USB que ofreciera el doble o incluso el cuádruple de velocidad. Vemos una imagen similar con el puerto LAN: Mientras que actualmente solemos encontrar puertos de 2.5 Gbit, Asus sólo ofrece 1 Gbit. Es suficiente, pero nada más.
Al menos hay tres puertos de salida de vídeo, pero sólo el primer puerto USB-C soporta G-Sync. Si bien un portátil gaming no necesita una gran variedad de conexiones, las tasas de transferencia de las pocas conexiones disponibles podrían al menos haber resultado más altas.
Comunicación
Mirar las tasas de transferencia alcanzadas por el módulo WLAN nos ayuda a olvidar rápidamente el débil puerto LAN. El Asus ROG Strix G17 es capaz de superar a todos los competidores aquí, situándose en lo más alto e impresionante en nuestras mediciones del rango de 5-GHz. Al menos a corta distancia del router, puedes conseguir tasas de transferencia inalámbrica muy superiores a 1 Gbit/s. Además, es compatible con Wi-Fi 6E, cuyo gran alcance de comunicación garantiza menos interferencias en zonas con muchas redes WLAN diferentes.
Con esto, entra en el rango de la mayoría de portátiles Intel, al tiempo que supera significativamente a los competidores AMD con CPU de la generación anterior. Por ejemplo, el rendimiento de envío y recepción delAlienware m17 R5es un 40% más lento.
Cámara web
La pequeña cámara parece tener una ubicación desafortunada, ya que los dedos tienden a tocar directamente sobre la lente de la cámara al intentar abrir el portátil. Con una resolución HD, las imágenes muestran una resolución débil, pero siguen siendo fácilmente reconocibles incluso en condiciones de poca luz, aunque aparezcan ligeramente granuladas. Aunque esto debería ser suficiente para videollamadas sencillas, si tu interlocutor utiliza Full-HD o superior, las diferencias de calidad son inmediatamente evidentes.
El micrófono resulta significativamente mejor. No notamos ningún sonido metálico ni distorsiones audibles. Las voces grabadas suenan naturales y se registran uniformemente desde varias direcciones y distancias cambiantes. Estos son los mejores requisitos para un chat en el juego.


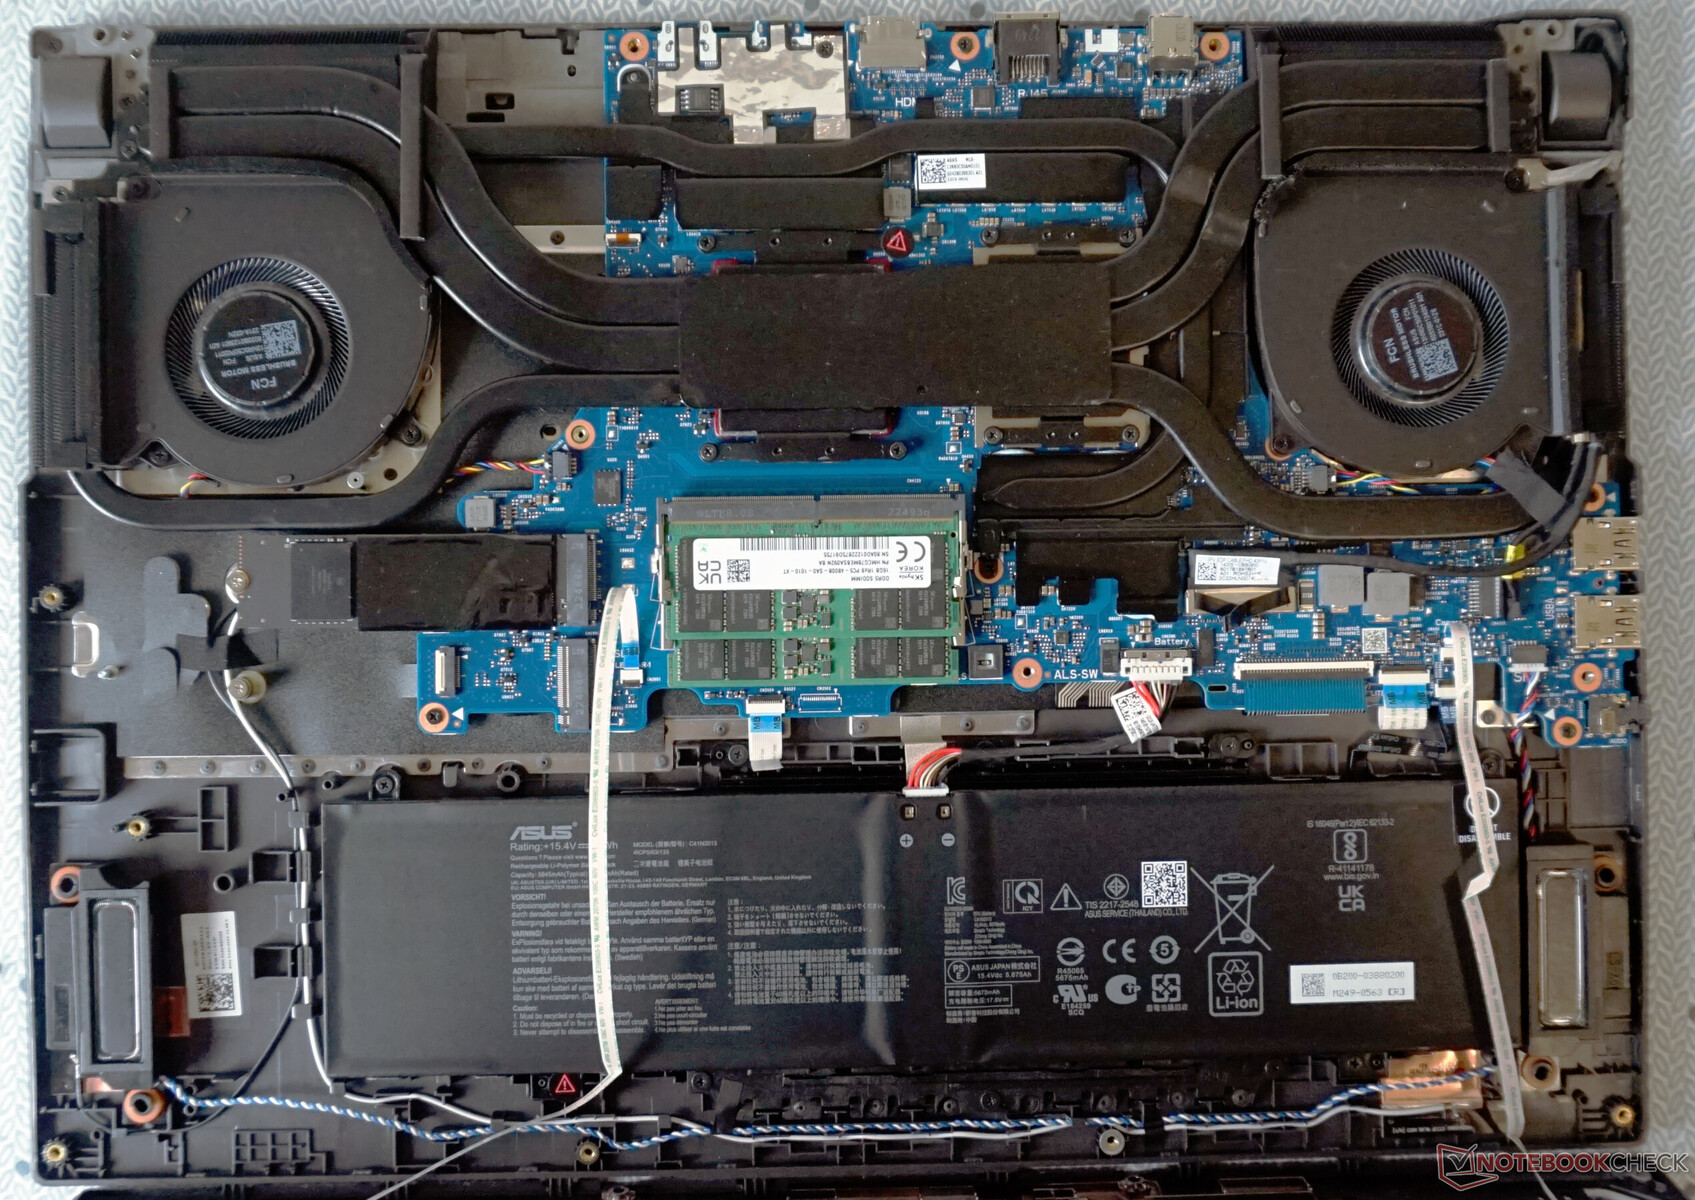
Mantenimiento
Asus facilita la apertura del portátil para juegos. Después de quitar once tornillos Philips, no se necesita mucha fuerza sino sólo un toque delicado para quitar la placa inferior.
Pero ten cuidado: debido a la iluminación RGB, la placa inferior está conectada a la carcasa con dos cables. No obstante, los cables están colocados de forma que puedas abrir la parte inferior sin desenchufarlos.
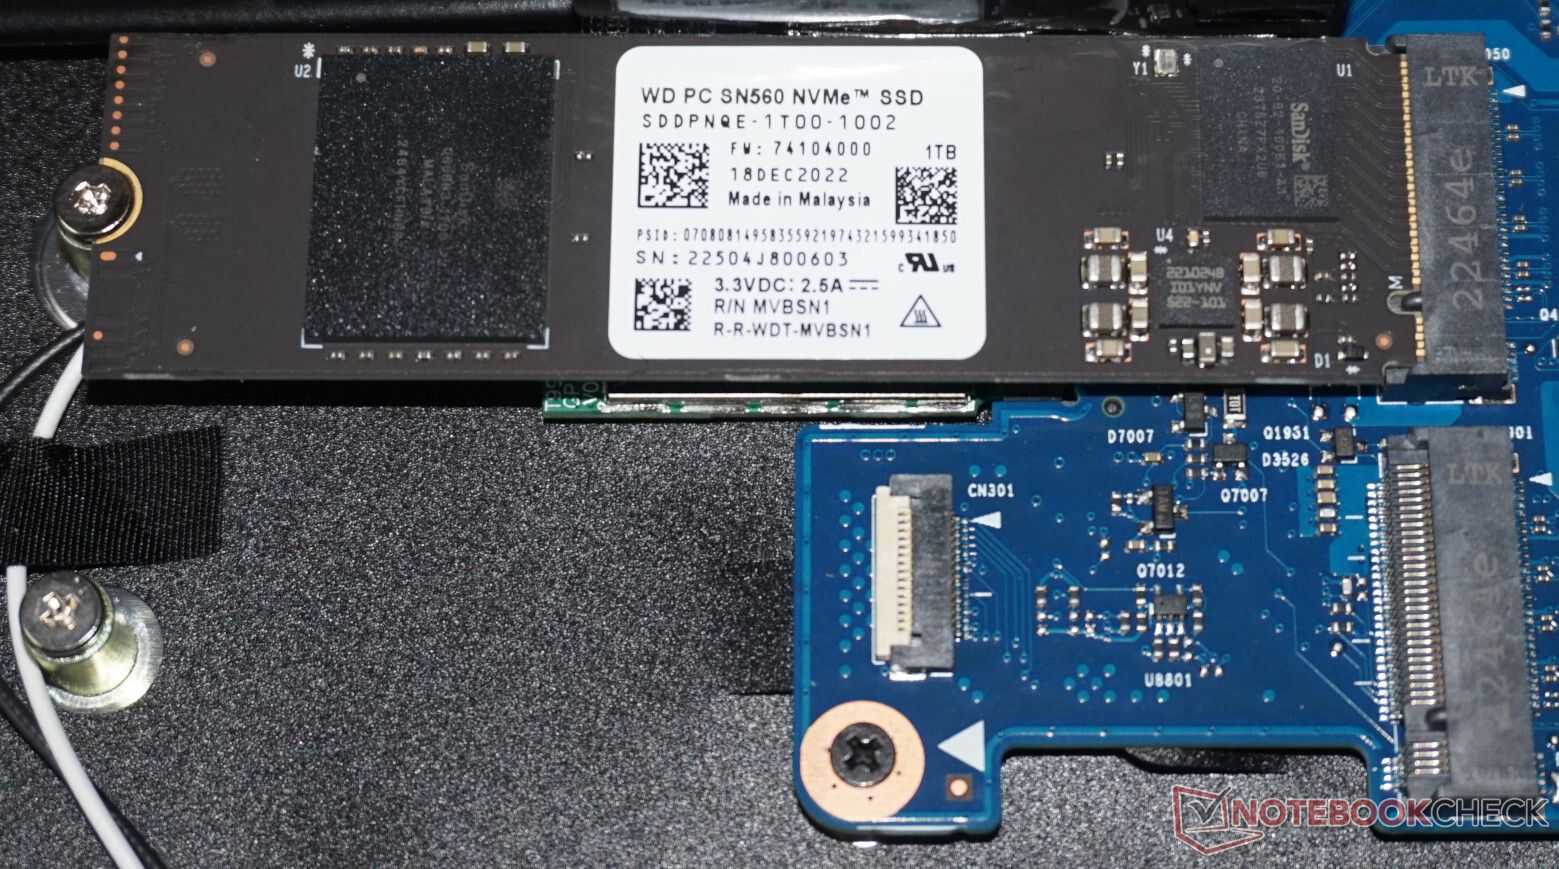
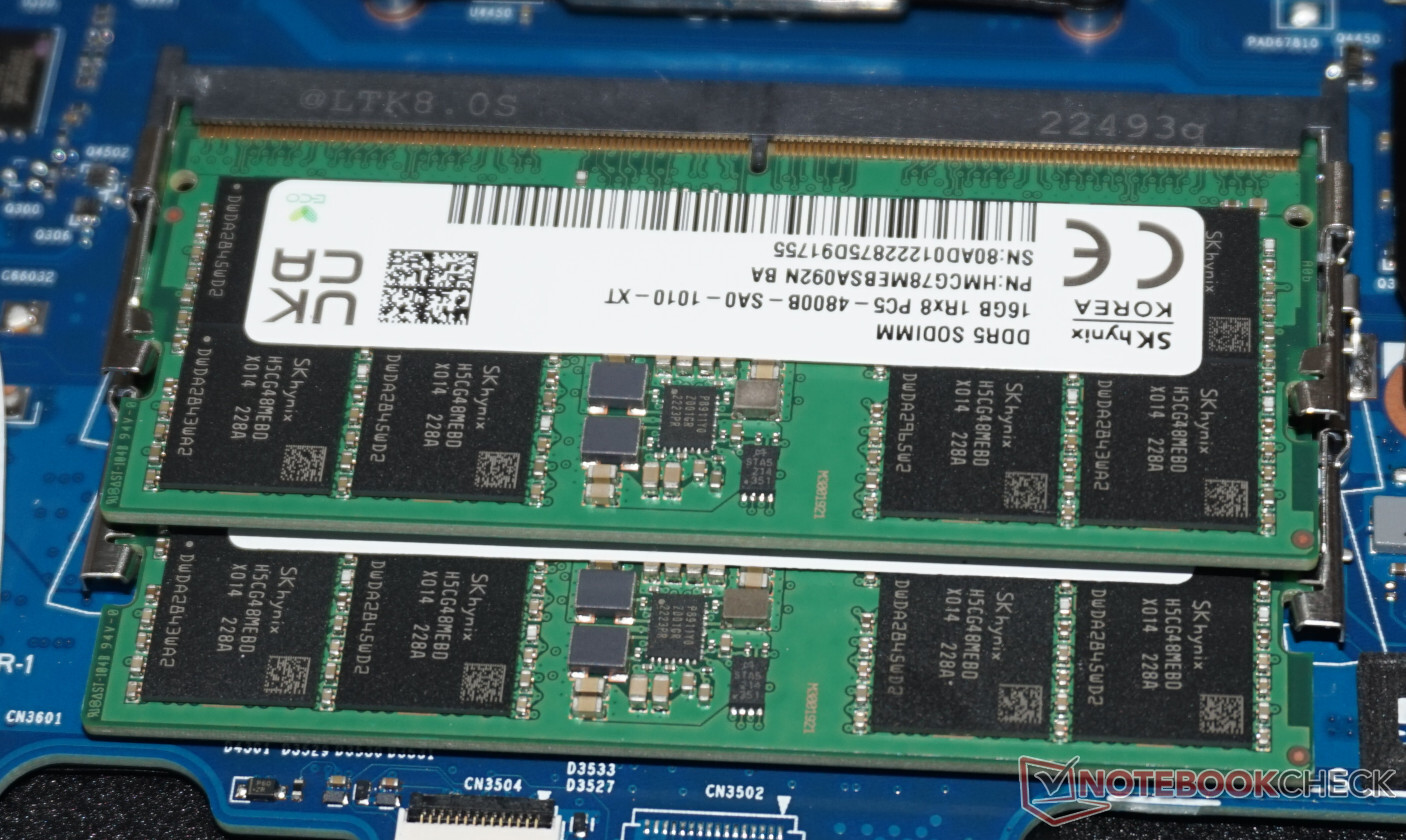
El interior de la ROG Strix está bien organizado y es especialmente espacioso. Se puede acceder fácilmente a los ventiladores y cambiar rápidamente la batería. Hay una ranura libre para ampliar el almacenamiento, lo que permite insertar un nuevo SSD de forma muy sencilla. También es fácil cambiar la RAM y el módulo WLAN (oculto bajo el SSD).
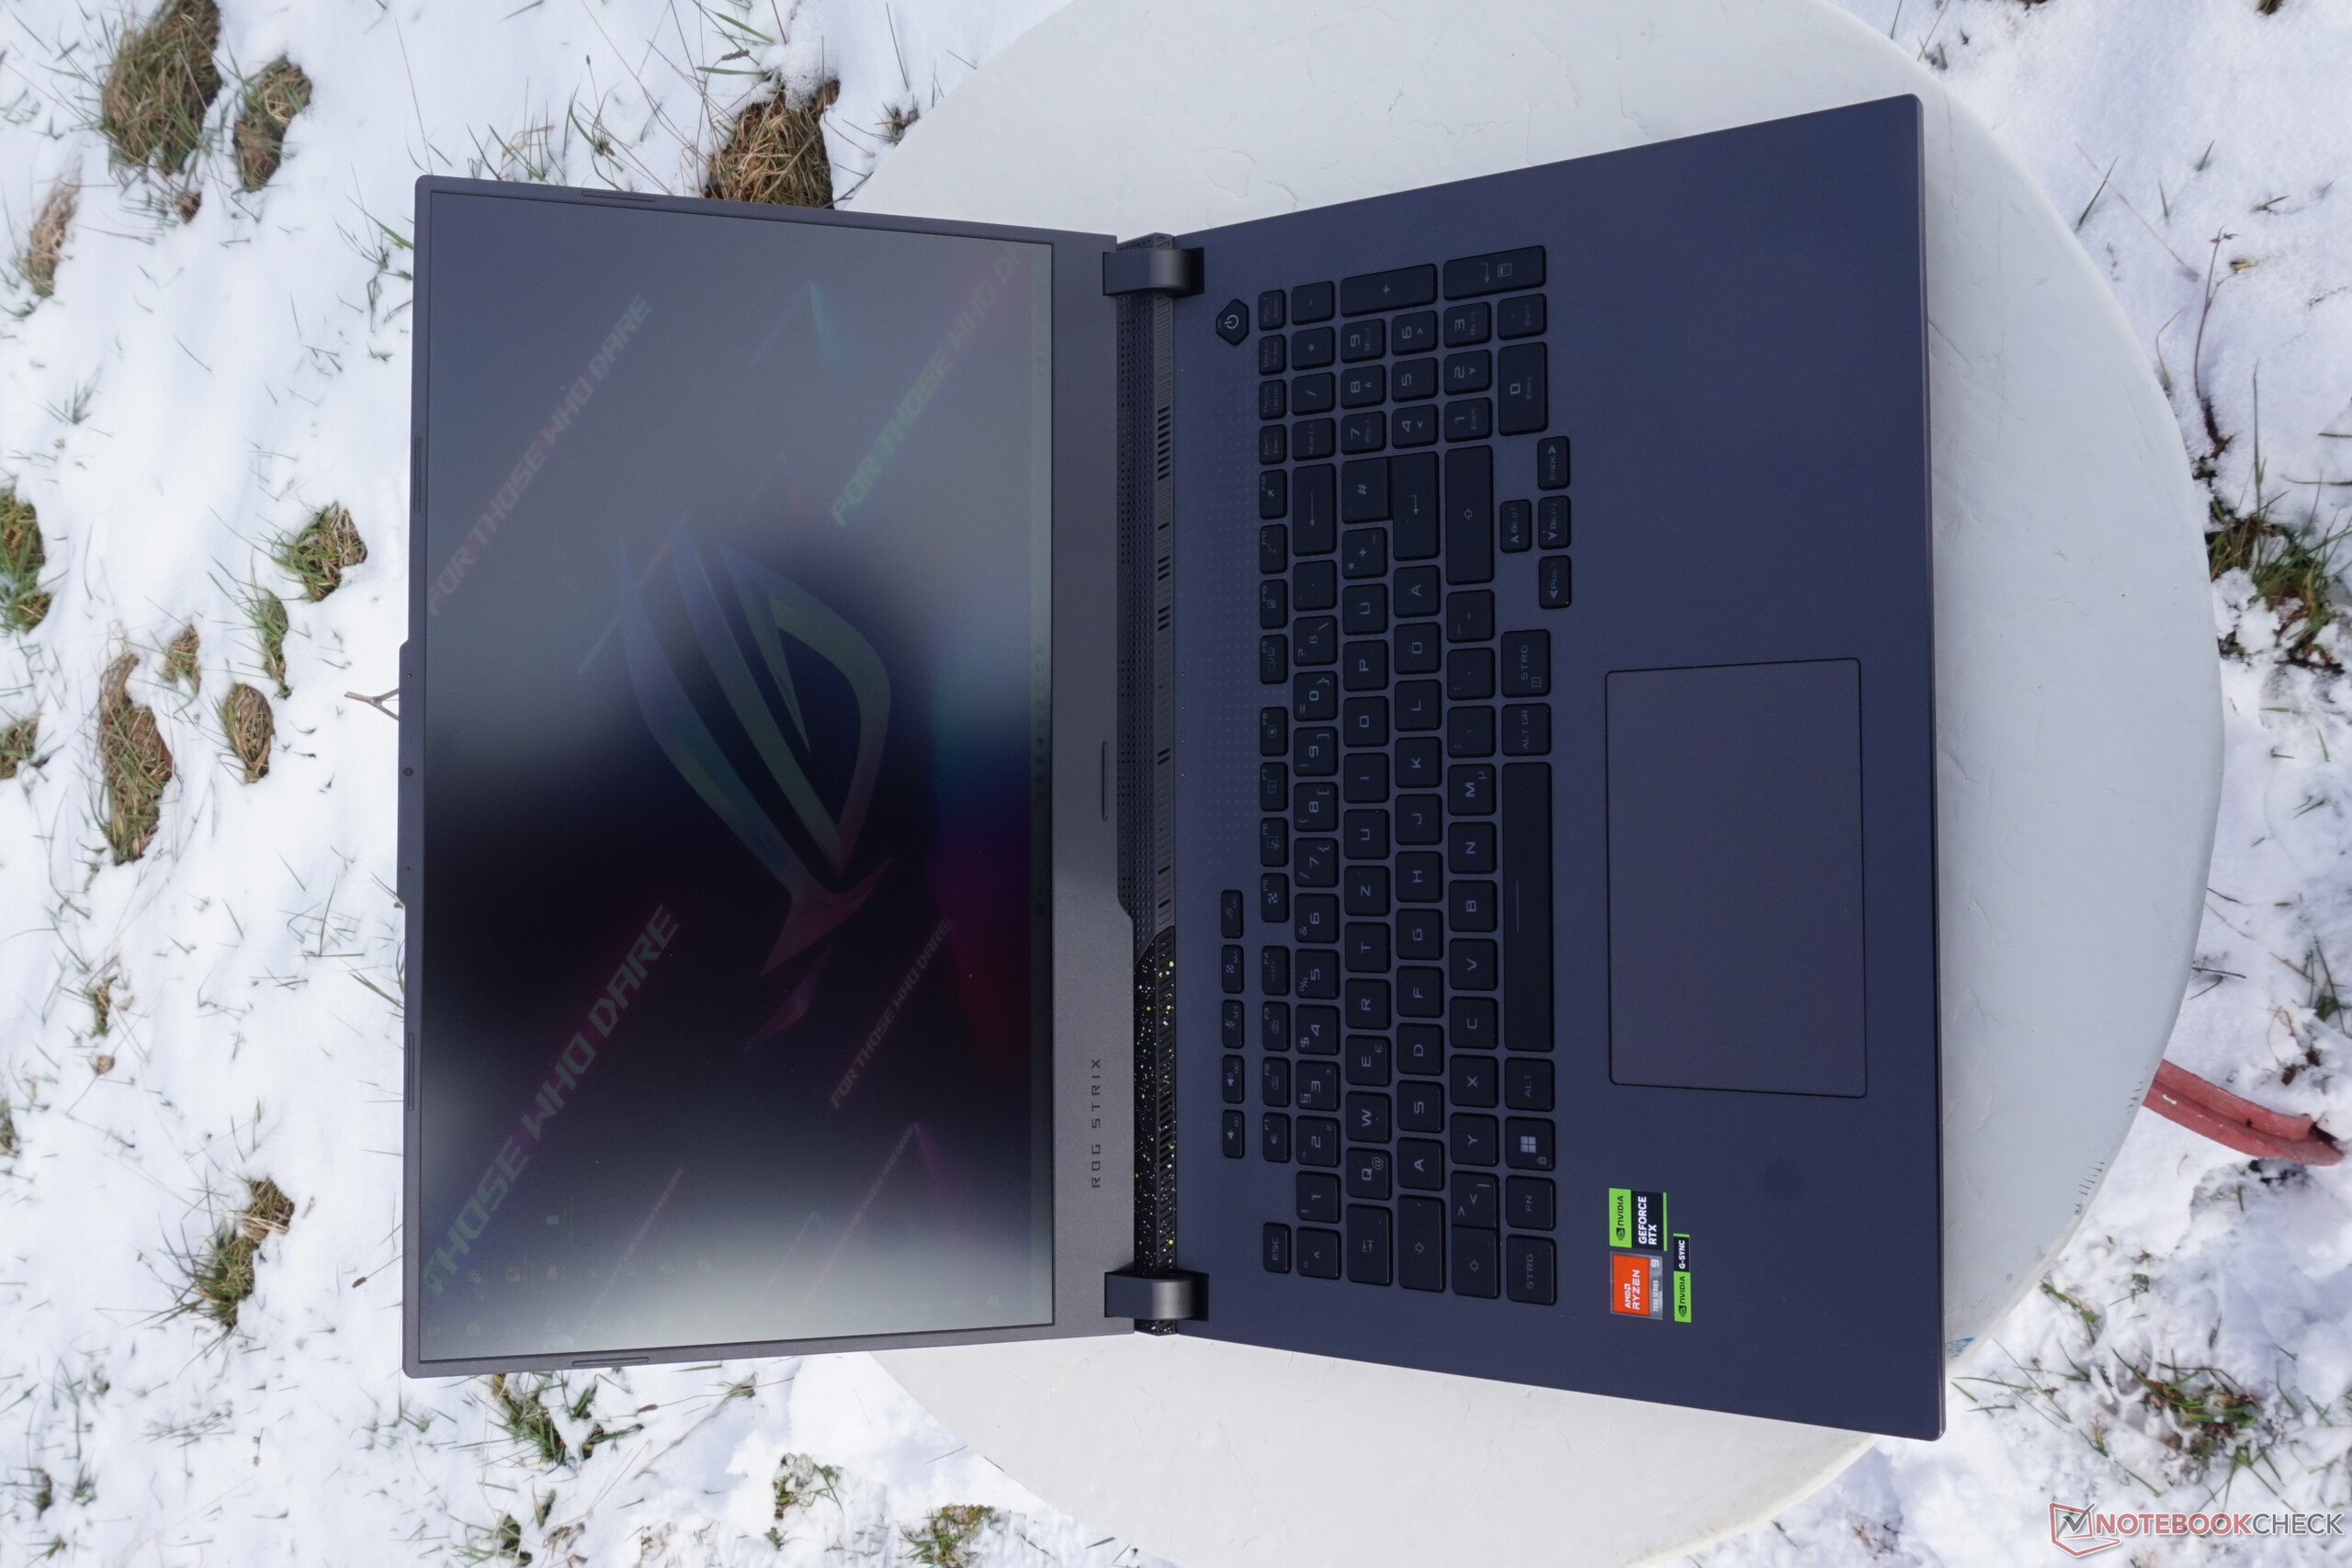
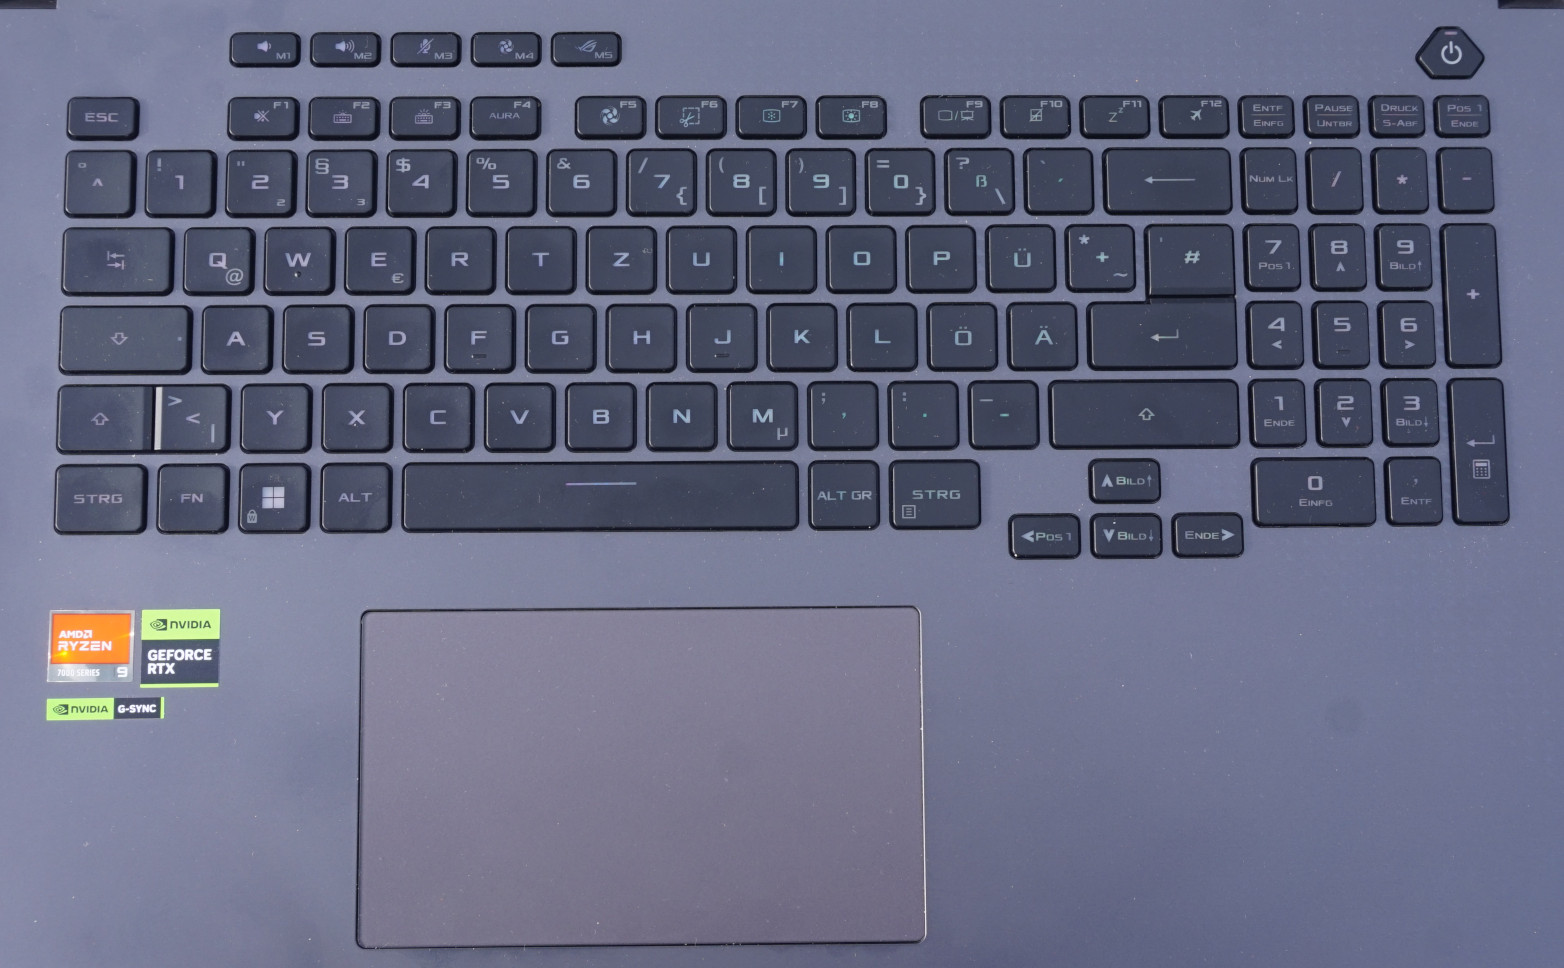
Dispositivos de entrada - Un teclado enfocado a los juegos
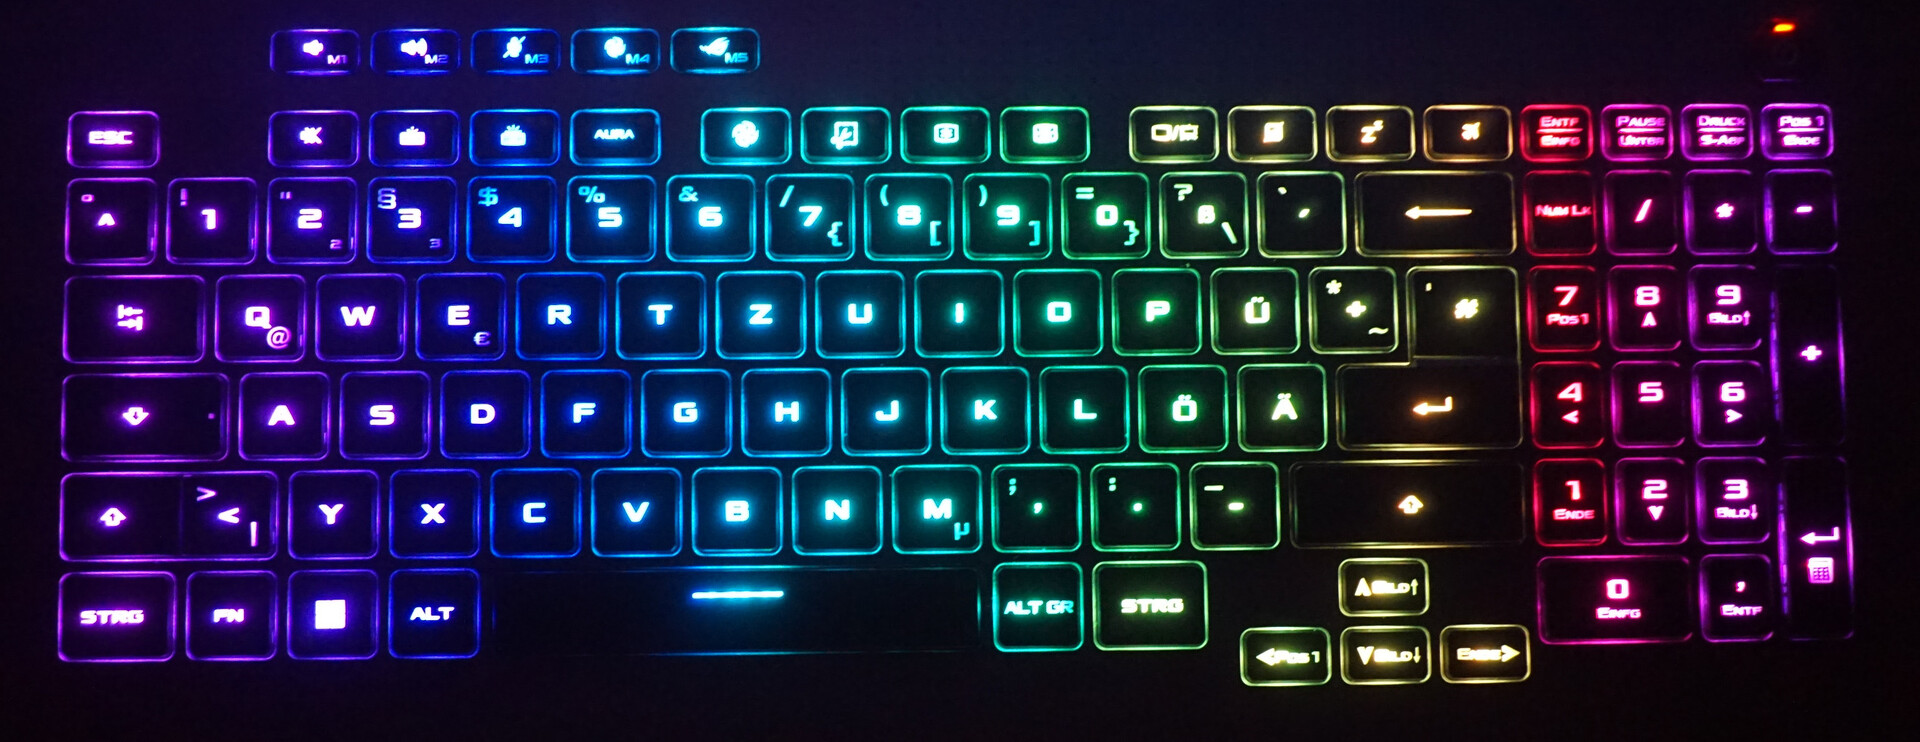
El teclado se presenta muy adecuado para juegos. Además del bloque numérico de tamaño completo y las teclas F que, efectivamente, vienen por defecto con sus funciones básicas, el ROG Strix ofrece cinco teclas adicionales, que controlan los modos de rendimiento, el volumen y el micrófono. Sin embargo, también puedes configurarlas con tus propias macros.
El recorrido de las teclas de casi 1,5 mm hace que teclear sea muy cómodo. También nos gusta el punto de presión bien ajustado.
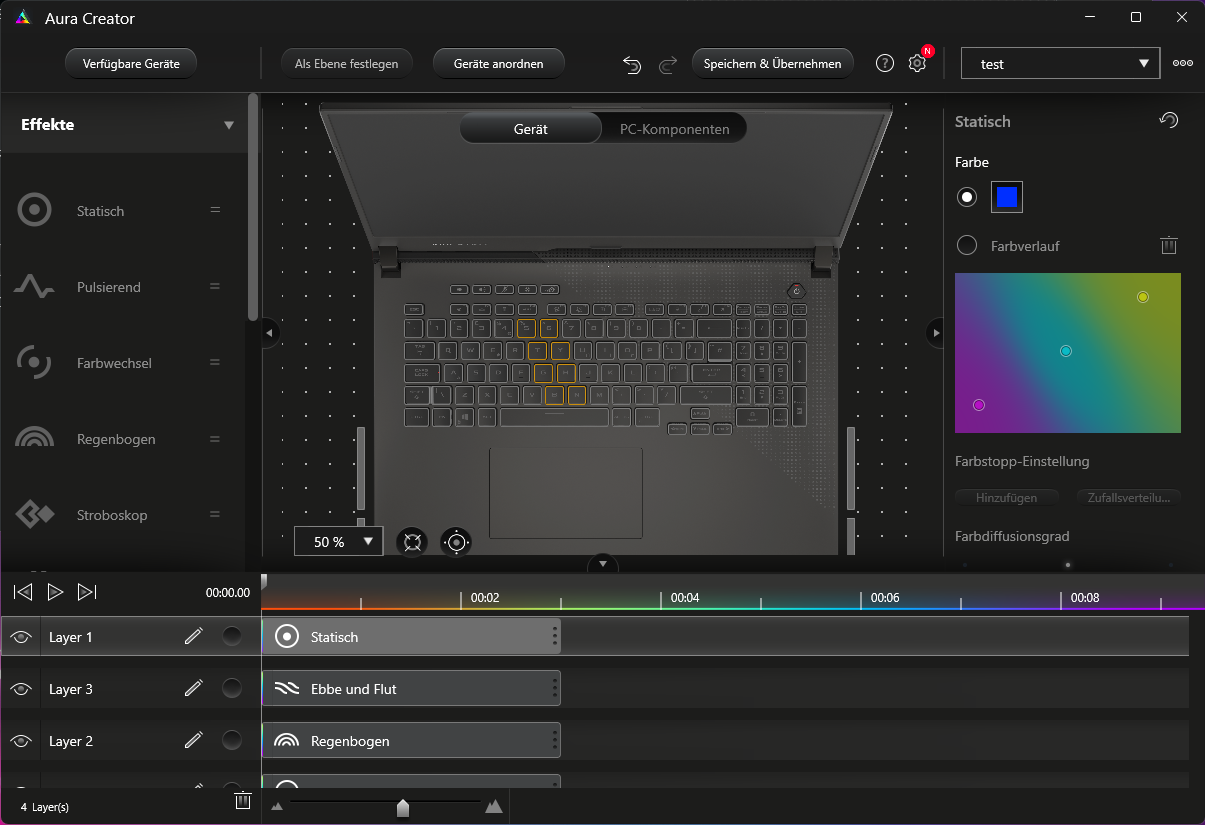
La iluminación del teclado no deja nada que desear. Desde el clásico efecto arco iris hasta la conexión de teclas individuales a los valores de los sensores, a la música reproducida o a los colores de la pantalla, el Aura Creator permite programar cualquier comportamiento que se te ocurra, incluso individualmente para cada tecla y los seis elementos de la parte inferior. Con los accesorios correspondientes, también puedes ampliarlo a todo tu escritorio.
El touchpad es grande, y sus teclas ocultas responden con precisión y con puntos de presión bien ajustados. Pero normalmente esto no importará mucho en cuanto conectes un ratón.
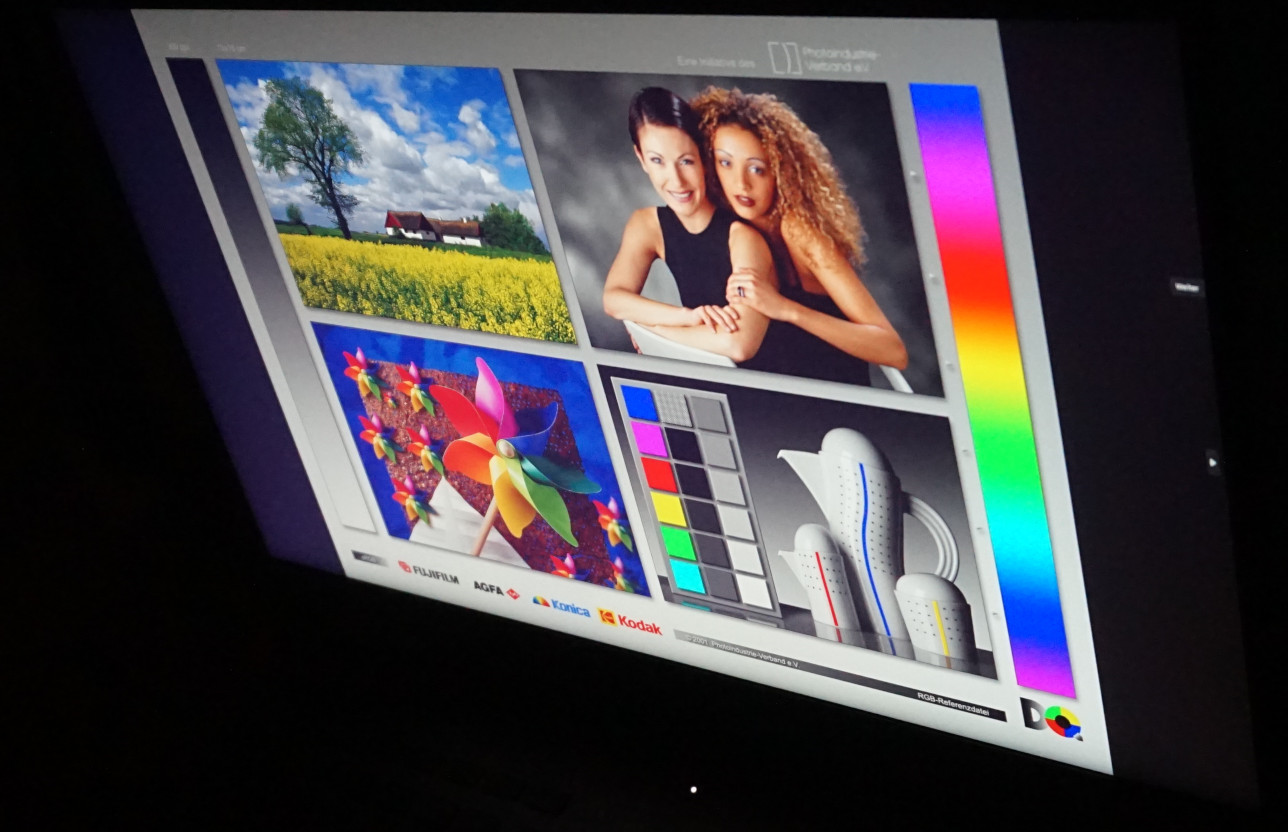
Pantalla - Portátil para juegos con una alta frecuencia de imagen
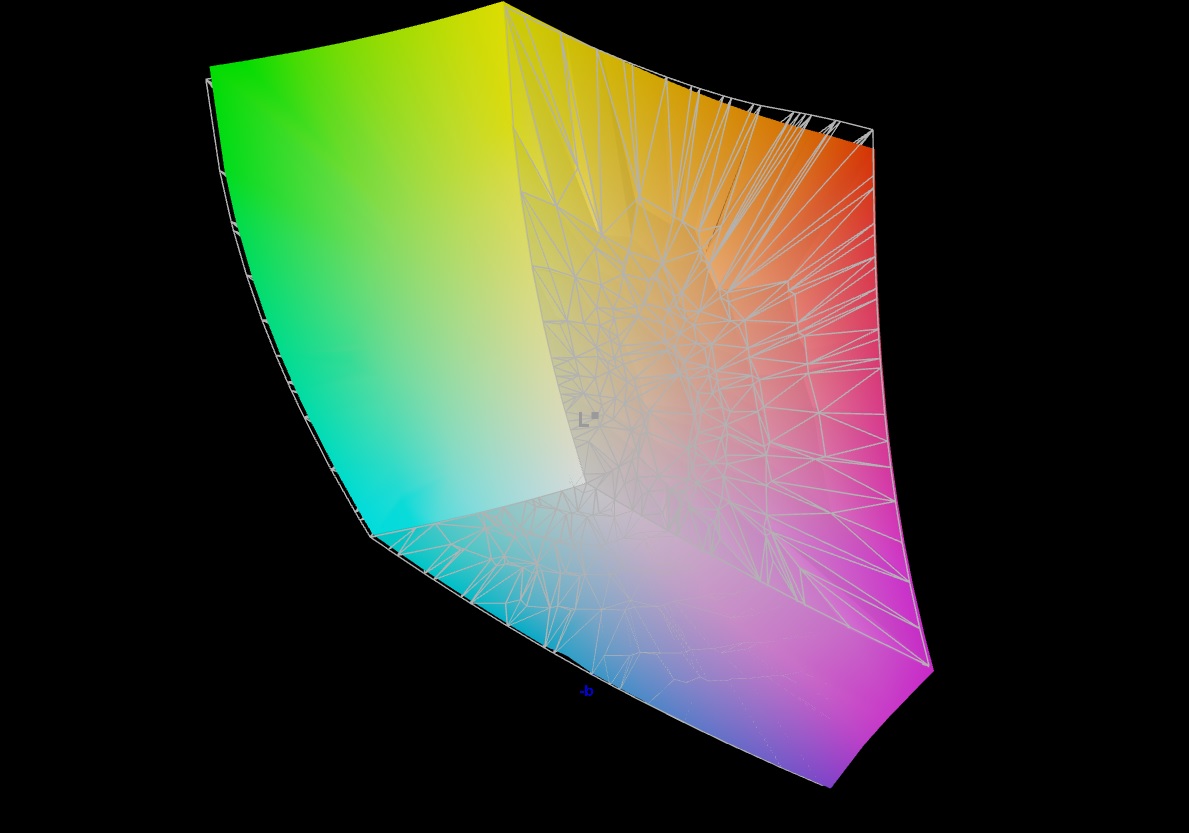
Aparte de la elevada tasa de refresco y la amplísima cobertura del espacio de color que cubre al menos el Display-P3 casi por completo, el display del ROG Strix G17 ofrece valores medios. El brillo limitado y el contraste medio no son particularmente atractivos. Sin embargo, los competidores apenas son mejores aquí. Pero si el portátil de juego está en tu escritorio en casa y tu entorno no está inundado por la luz del sol, esto no debería importar mucho de todos modos.
Por otro lado, la gran diagonal de 17 pulgadas, el amplio espacio de color, la resolución QHD y, por supuesto, la tasa de refresco de 240 Hz muestran plenamente sus ventajas a la hora de jugar.
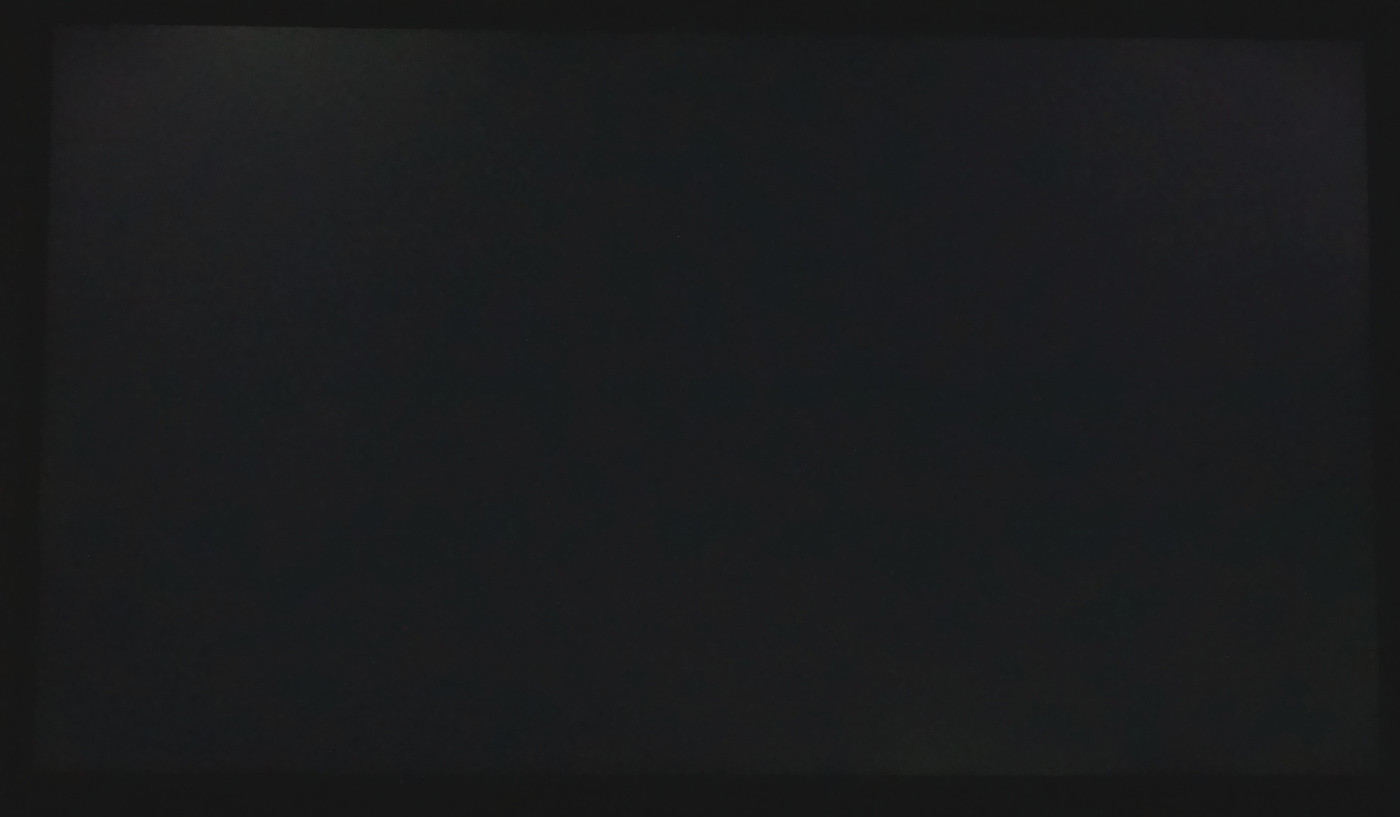
Con algunas imágenes muy oscuras, el sangrado de pantalla puede convertirse en un obstáculo. Nuestra unidad de pruebas se ve afectada por esto en la esquina superior izquierda, y es visible incluso sin largas exposiciones. Sin embargo, en cuanto las imágenes o escenas son ligeramente más brillantes, ya no se nota.
| |||||||||||||||||||||||||
iluminación: 89 %
Brillo con batería: 327 cd/m²
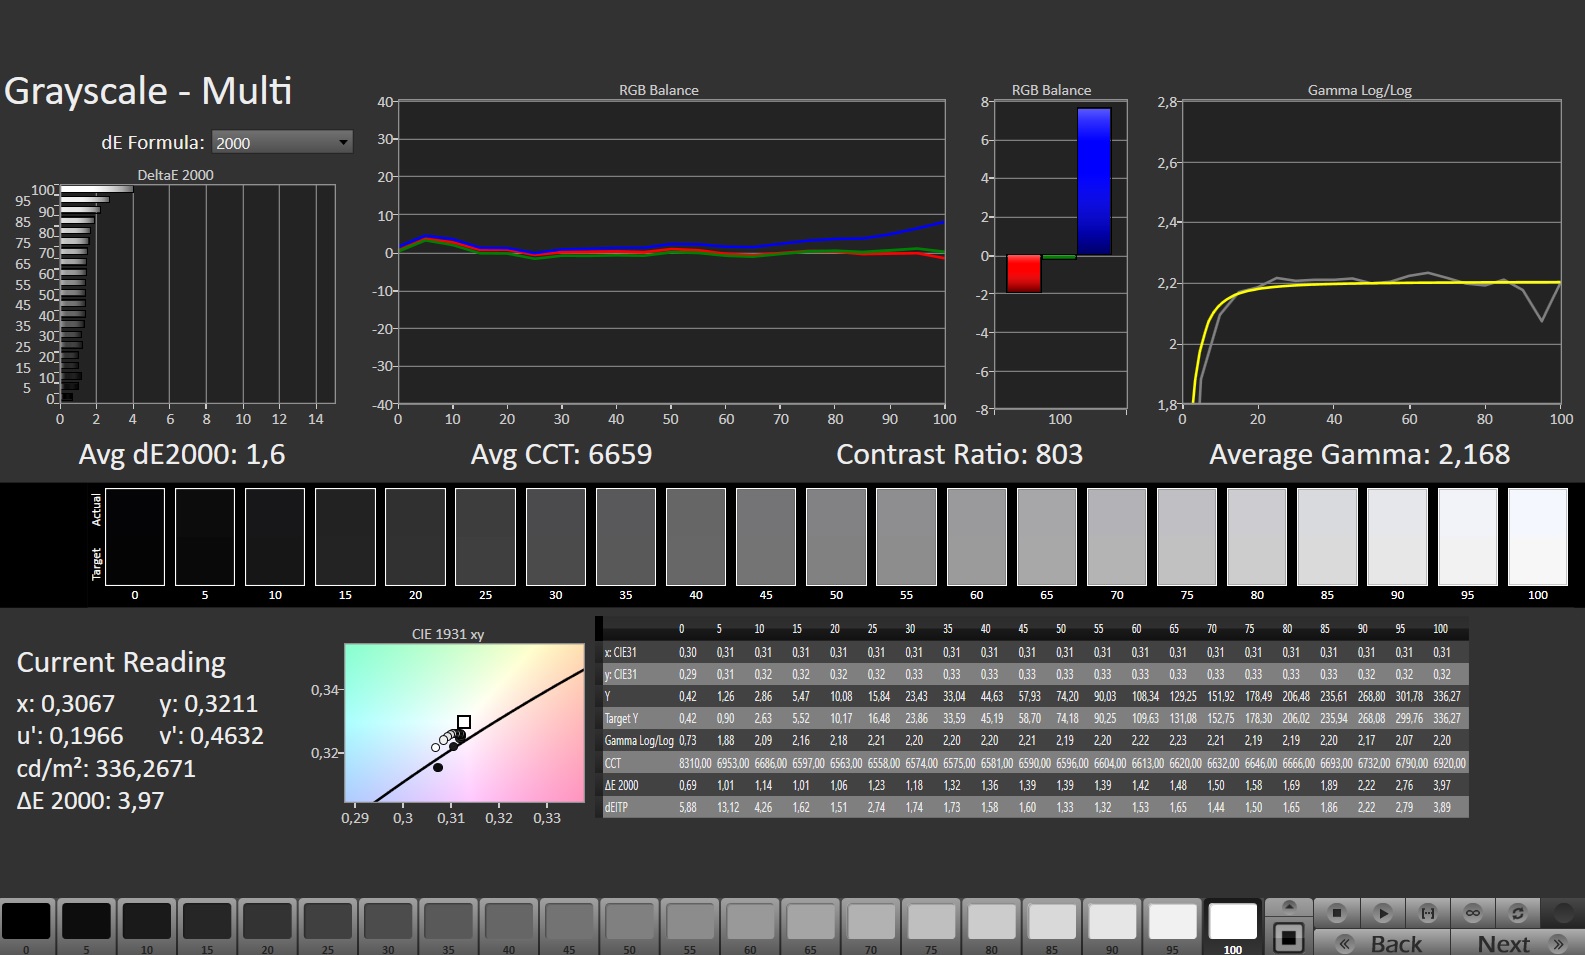
Contraste: 861:1 (Negro: 0.38 cd/m²)
ΔE ColorChecker Calman: 1.01 | ∀{0.5-29.43 Ø4.72}
calibrated: 0.41
ΔE Greyscale Calman: 1.6 | ∀{0.09-98 Ø4.97}
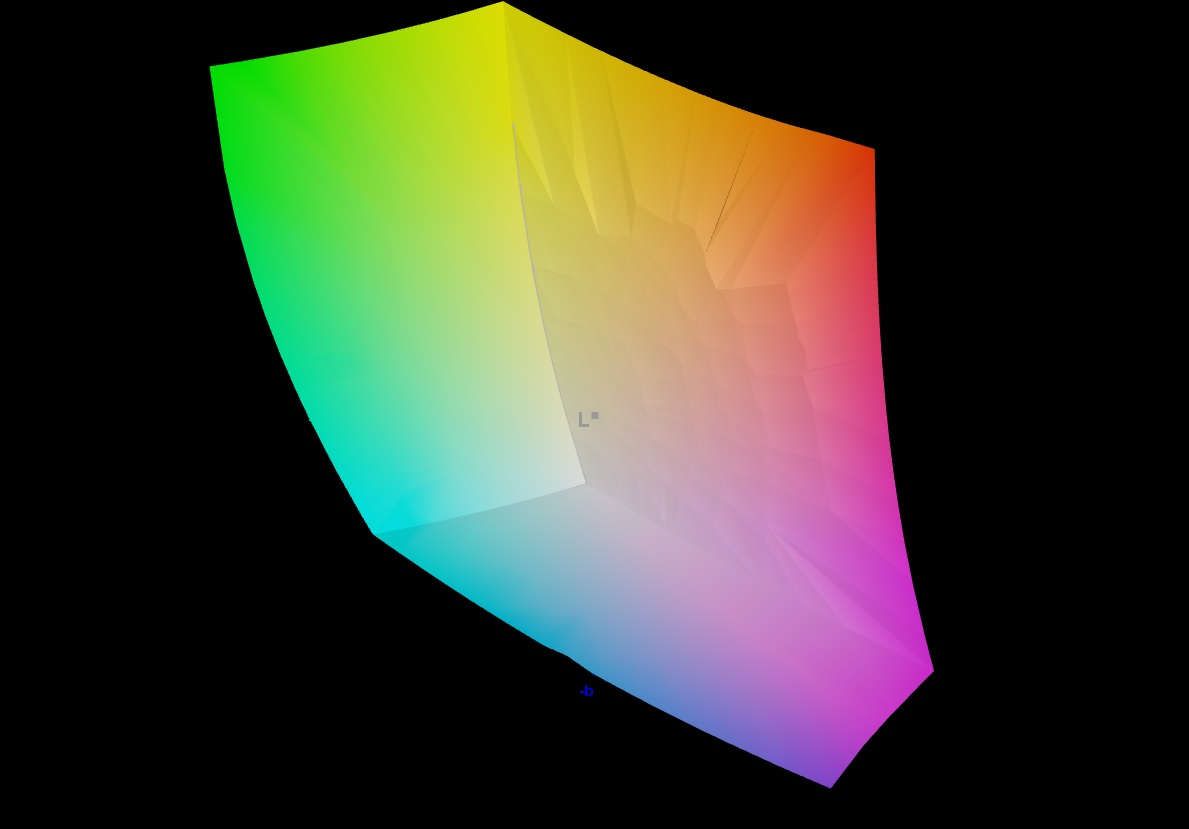
85.9% AdobeRGB 1998 (Argyll 3D)
100% sRGB (Argyll 3D)
98.3% Display P3 (Argyll 3D)
Gamma: 2.168
CCT: 6659 K
| Asus ROG Strix G17 G713PI BOE0B69, IPS, 2560x1440, 17.3" | Asus ROG Strix G18 G814JI NE180QDM-NZ2 (BOE0B35), IPS, 2560x1600, 18" | Razer Blade 18 RTX 4070 AU Optronics B180QAN01.0, IPS, 2560x1600, 18" | Asus ROG Strix Scar 17 SE G733CX-LL014W NE173QHM-NZ2, IPS, 2560x1440, 17.3" | Asus Zephyrus Duo 16 GX650PY-NM006W NE160QDM-NM4, MiniLED, 2560x1600, 16" | Alienware m17 R5 (R9 6900HX, RX 6850M XT) AU Optronics AUODBA3, IPS, 3840x2160, 17" | Asus ROG Strix G16 G614JZ TL160ADMP03-0, IPS, 2560x1600, 16" | |
|---|---|---|---|---|---|---|---|
| Display | 0% | -1% | -1% | 2% | 1% | -1% | |
| Display P3 Coverage (%) | 98.3 | 98.1 0% | 96.9 -1% | 97.1 -1% | 99.4 1% | 97.2 -1% | 97 -1% |
| sRGB Coverage (%) | 100 | 99.9 0% | 99.8 0% | 99.9 0% | 100 0% | 99.6 0% | 99.9 0% |
| AdobeRGB 1998 Coverage (%) | 85.9 | 85.6 0% | 85.3 -1% | 84.8 -1% | 90.8 6% | 88.4 3% | 84.9 -1% |
| Response Times | -6% | 14% | -13% | -154% | -122% | 14% | |
| Response Time Grey 50% / Grey 80% * (ms) | 5.3 ? | 5.6 ? -6% | 4.2 ? 21% | 5.7 ? -8% | 15.2 ? -187% | 16.4 ? -209% | 5.1 ? 4% |
| Response Time Black / White * (ms) | 8.6 ? | 9 ? -5% | 8 ? 7% | 10.1 ? -17% | 19 ? -121% | 11.6 ? -35% | 6.6 ? 23% |
| PWM Frequency (Hz) | 12000 ? | ||||||
| Screen | -24% | -85% | 11% | 119% | -191% | -19% | |
| Brightness middle (cd/m²) | 327 | 471 44% | 549.6 68% | 320 -2% | 712 118% | 484 48% | 470 44% |
| Brightness (cd/m²) | 320 | 422 32% | 524 64% | 303 -5% | 703 120% | 449 40% | 459 43% |
| Brightness Distribution (%) | 89 | 83 -7% | 89 0% | 87 -2% | 95 7% | 87 -2% | 93 4% |
| Black Level * (cd/m²) | 0.38 | 0.47 -24% | 0.53 -39% | 0.3 21% | 0.07 82% | 0.55 -45% | 0.42 -11% |
| Contrast (:1) | 861 | 1002 16% | 1037 20% | 1067 24% | 10171 1081% | 880 2% | 1119 30% |
| Colorchecker dE 2000 * | 1.01 | 2.05 -103% | 3.32 -229% | 1.1 -9% | 1.7 -68% | 4.8 -375% | 1.86 -84% |
| Colorchecker dE 2000 max. * | 4.01 | 4.15 -3% | 6.63 -65% | 2.7 33% | 4 -0% | 7.48 -87% | 3.87 3% |
| Colorchecker dE 2000 calibrated * | 0.41 | 0.8 -95% | 2.7 -559% | 1.2 -193% | 4.74 -1056% | 0.93 -127% | |
| Greyscale dE 2000 * | 1.6 | 2.8 -75% | 2 -25% | 1.1 31% | 2.8 -75% | 5.5 -244% | 2.7 -69% |
| Gamma | 2.168 101% | 2.204 100% | 2.29 96% | 2.13 103% | 2.21 100% | 2.42 91% | 2.246 98% |
| CCT | 6659 98% | 7122 91% | 6319 103% | 6599 98% | 6978 93% | 6148 106% | 6711 97% |
| Media total (Programa/Opciones) | -10% /
-16% | -24% /
-53% | -1% /
5% | -11% /
55% | -104% /
-140% | -2% /
-10% |
* ... más pequeño es mejor
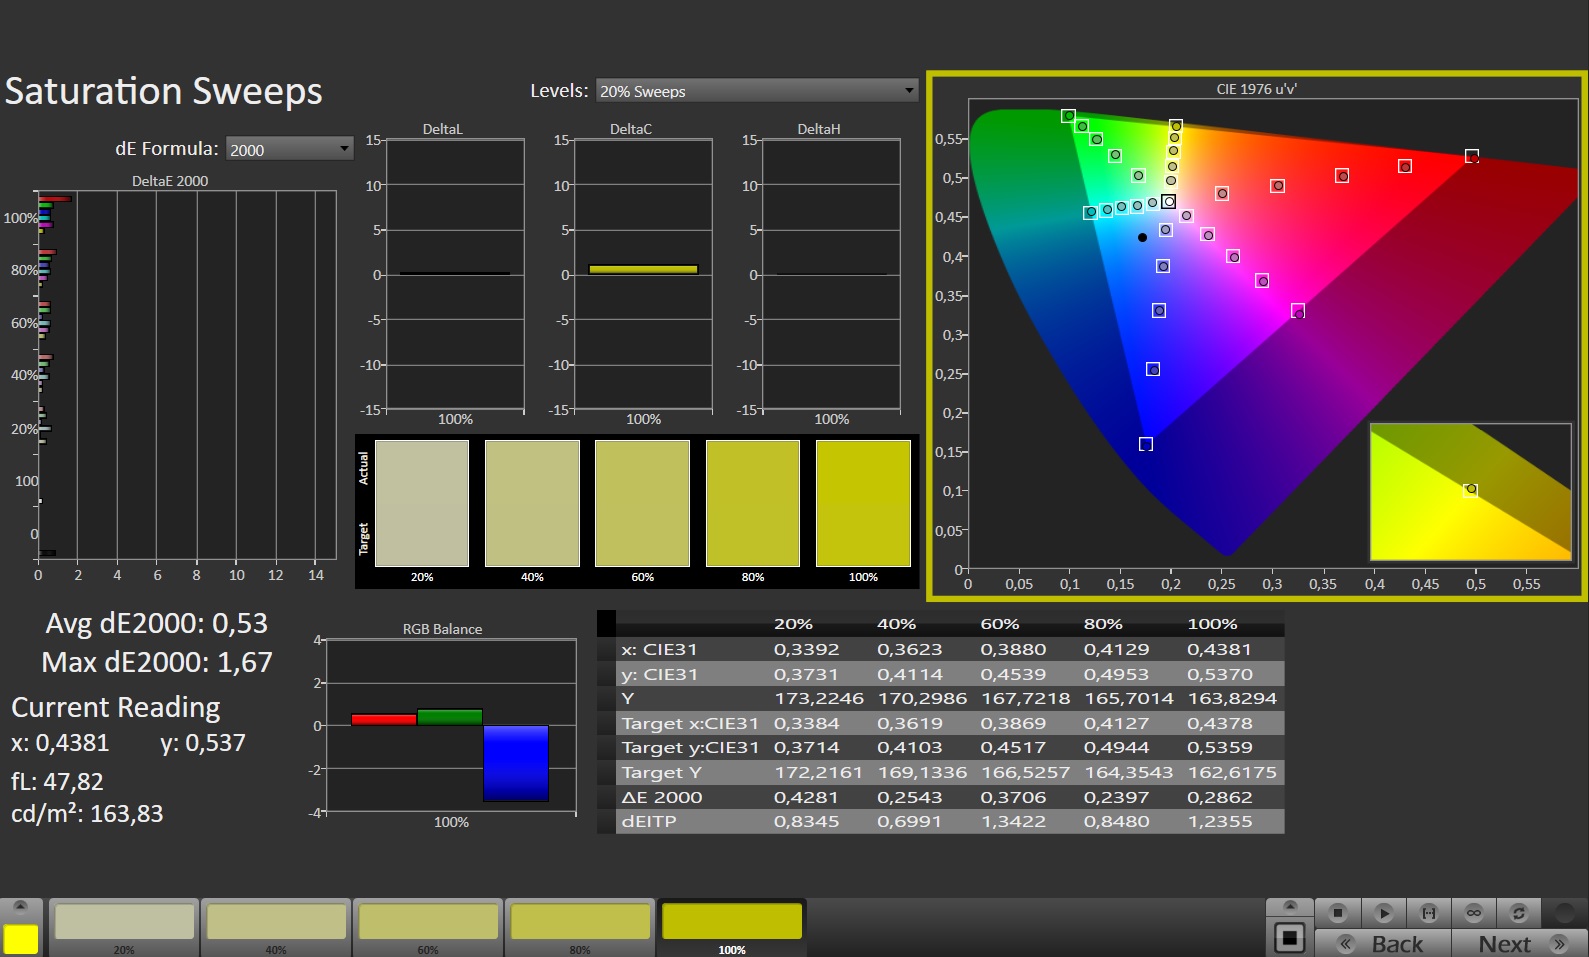
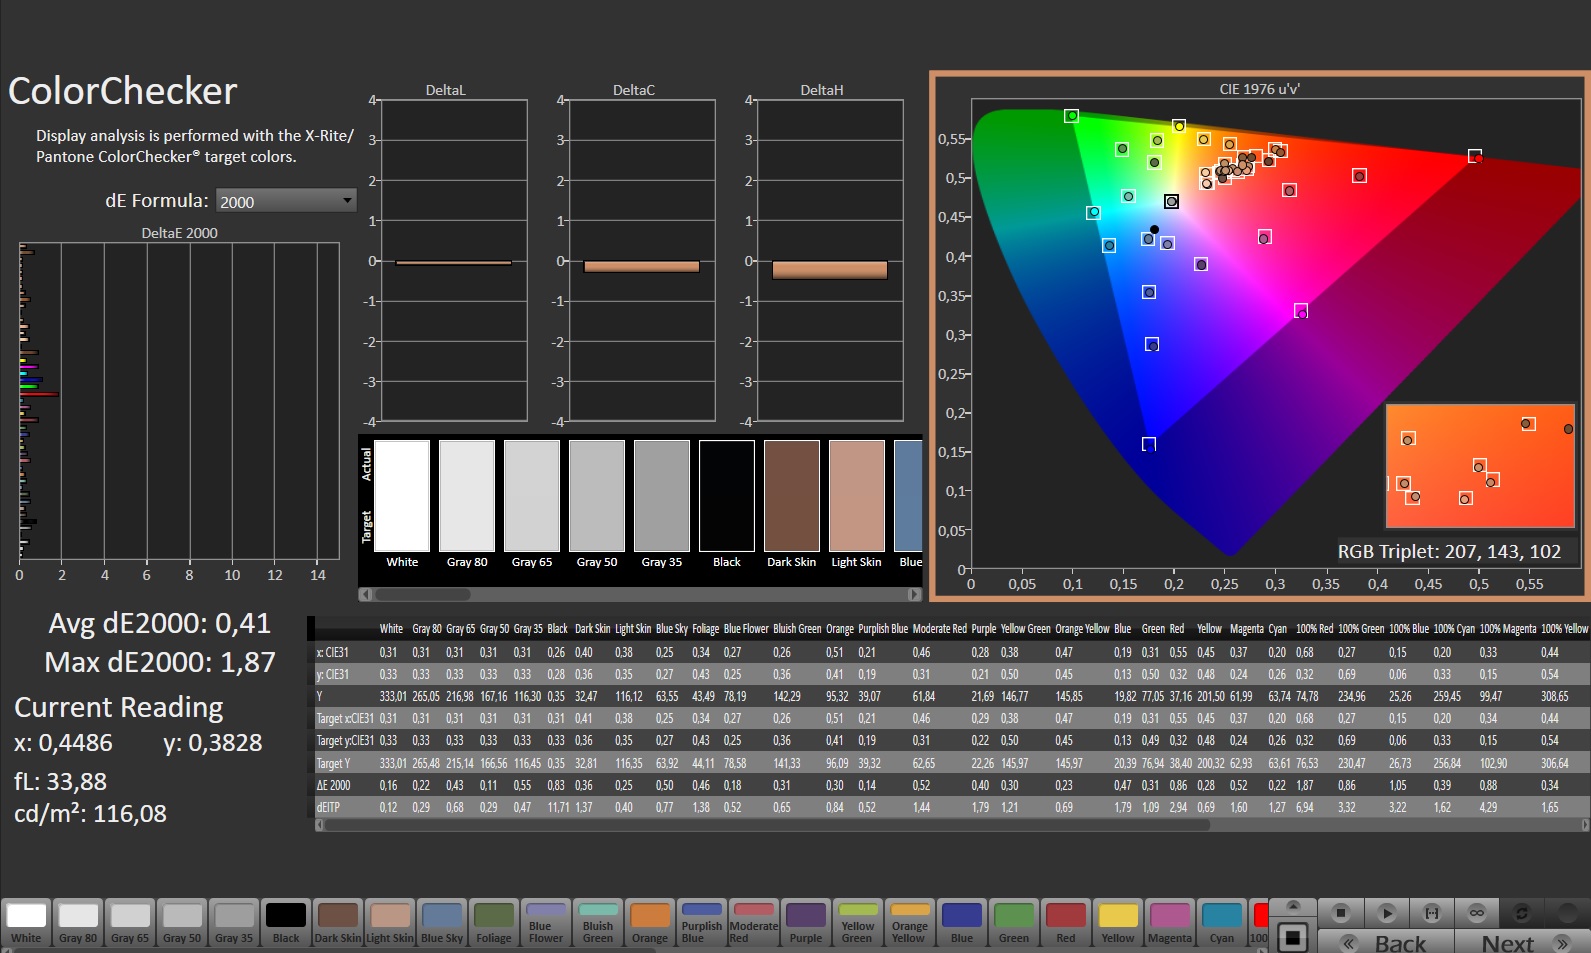
La visualización del color es muy precisa incluso sin una calibración adicional. Las desviaciones apenas son perceptibles a simple vista. Tras un calibrado, todas las desviaciones caen por debajo de los límites perceptibles. De este modo, la pantalla también es adecuada para el procesamiento de imágenes. Puede descargar el perfil de color correspondiente desde el enlace anterior en el área con los valores de visualización.

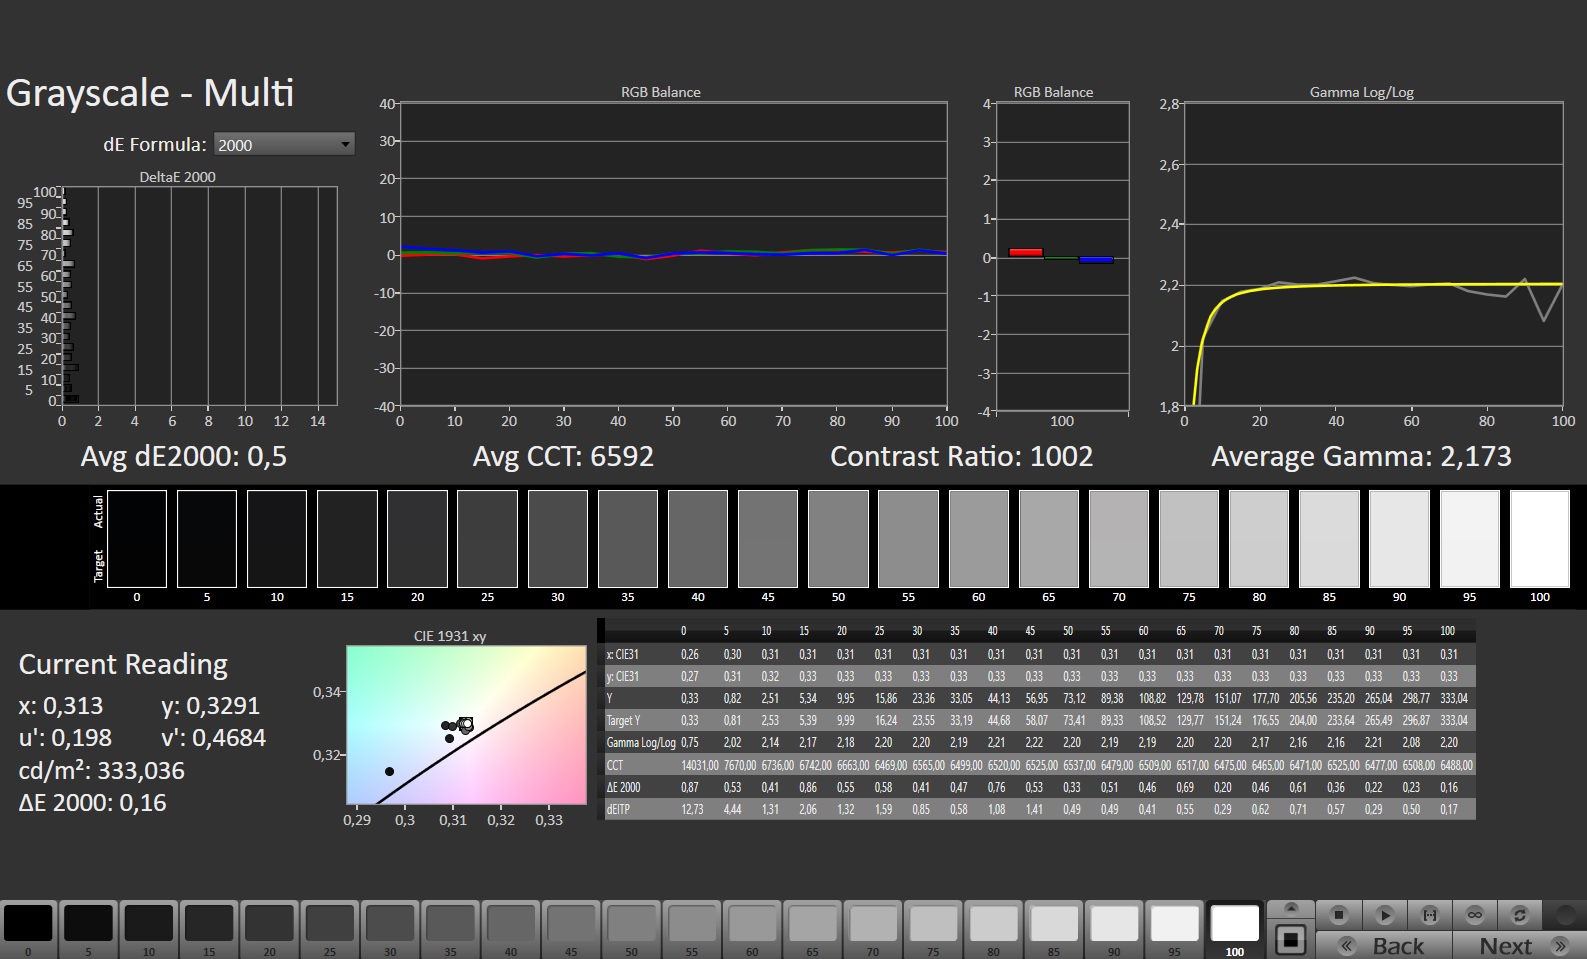
Los cortos tiempos de respuesta que son significativamente inferiores a 10 ms, la falta de parpadeo PWM, y el gran espacio de color hacen que este display sea muy adecuado para un portátil de juegos.
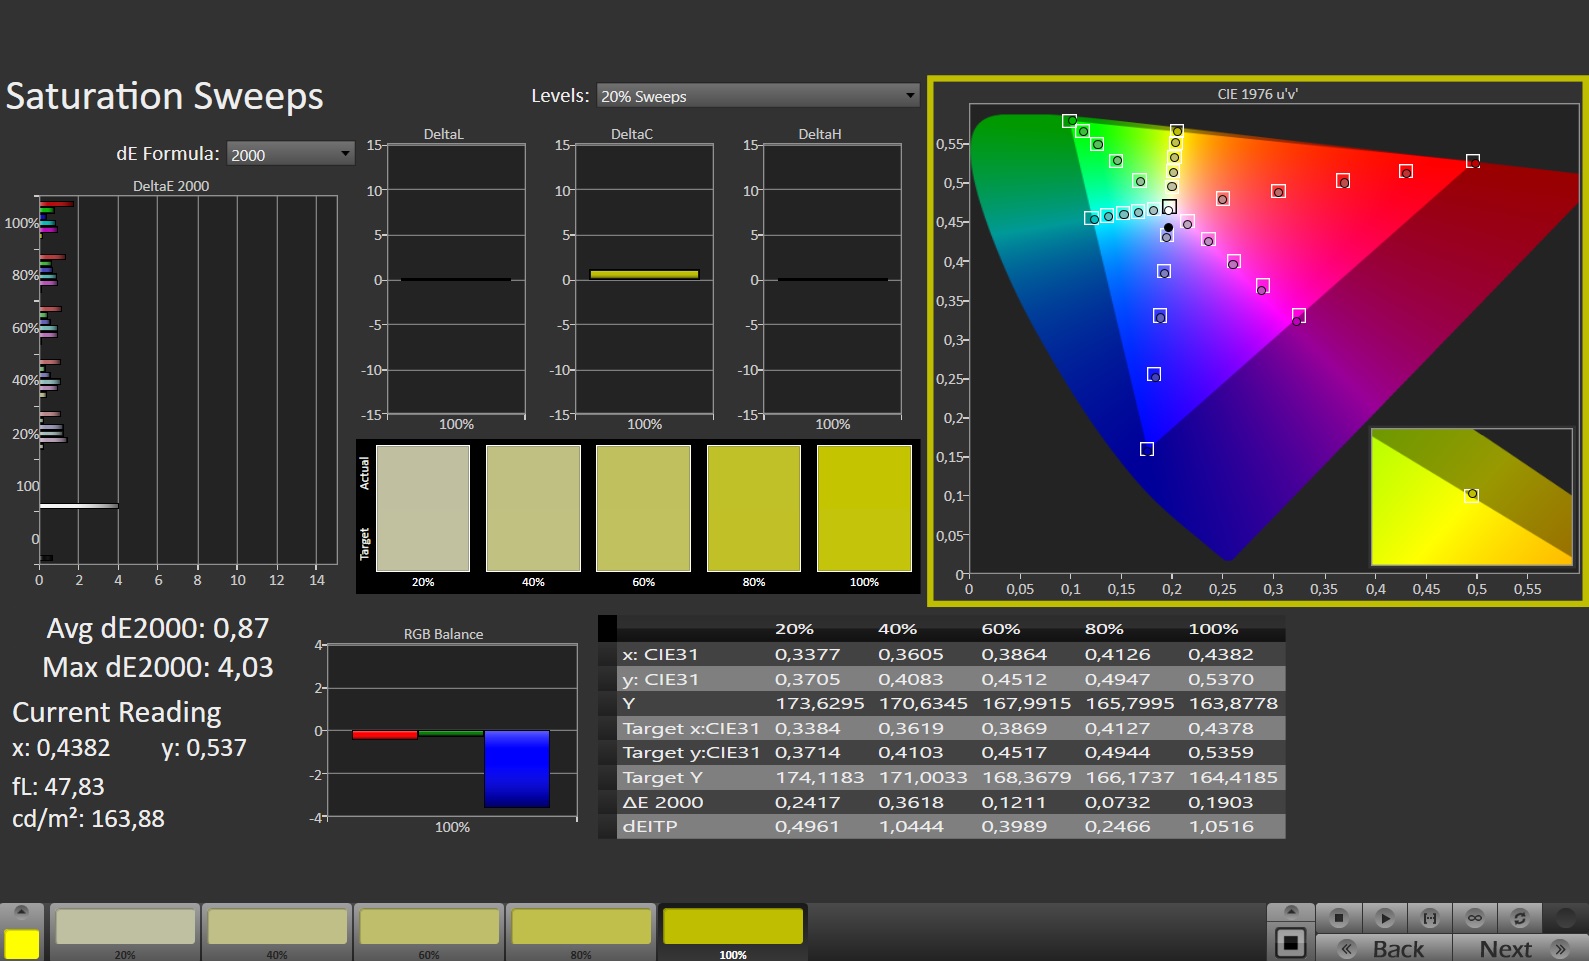
La reproducción del color tampoco da motivos de queja. Nuestras mediciones de la reproducción del color resultan en un casi perfecto 100% sRGB, 98% DCI-P3, y al menos 86% AdobeRGB. Además de las magníficas secuencias de juego correspondientes, los creadores también tendrán lo que necesitan. Sólo para exigencias profesionales en el procesamiento de imágenes sería necesario utilizar una pantalla con cobertura completa del espacio de color AdobeRGB.

Tiempos de respuesta del display
| ↔ Tiempo de respuesta de Negro a Blanco | ||
|---|---|---|
| 8.6 ms ... subida ↗ y bajada ↘ combinada | ↗ 3.7 ms subida | 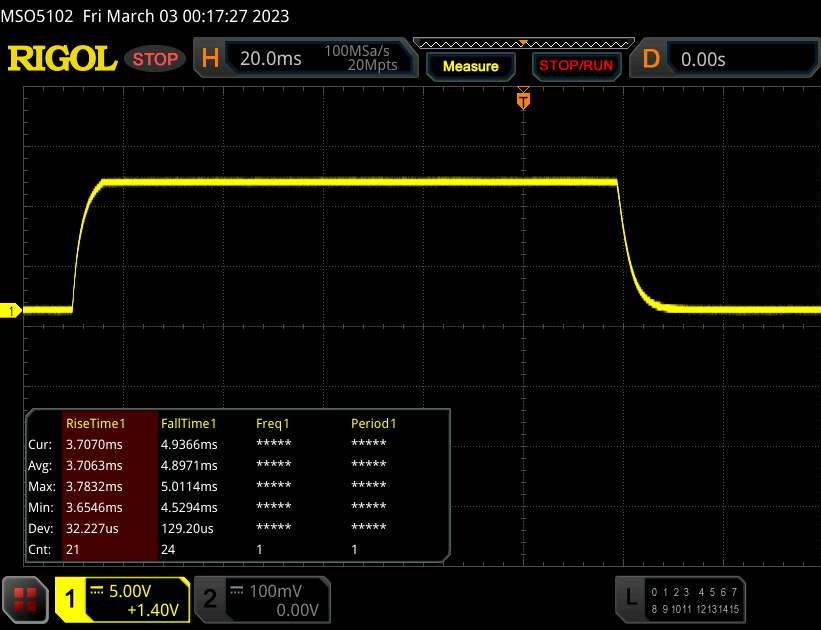 |
| ↘ 4.9 ms bajada | ||
| La pantalla mostró tiempos de respuesta rápidos en nuestros tests y debería ser adecuada para juegos. En comparación, todos los dispositivos de prueba van de ##min### (mínimo) a 240 (máximo) ms. » 24 % de todos los dispositivos son mejores. Esto quiere decir que el tiempo de respuesta medido es mejor que la media (19.8 ms) de todos los dispositivos testados. | ||
| ↔ Tiempo de respuesta 50% Gris a 80% Gris | ||
| 5.3 ms ... subida ↗ y bajada ↘ combinada | ↗ 2.4 ms subida | 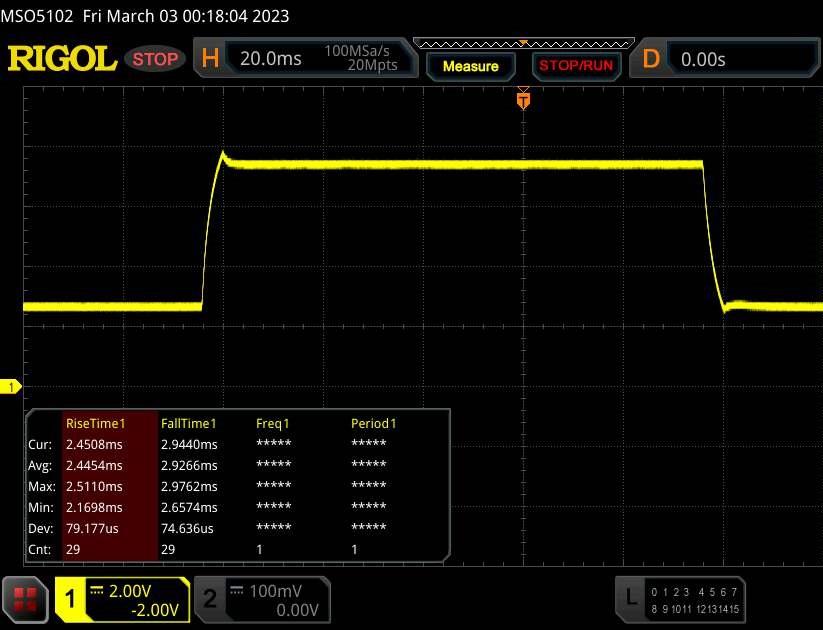 |
| ↘ 2.9 ms bajada | ||
| La pantalla mostró tiempos de respuesta muy rápidos en nuestros tests y debería ser adecuada para juegos frenéticos. En comparación, todos los dispositivos de prueba van de ##min### (mínimo) a 636 (máximo) ms. » 18 % de todos los dispositivos son mejores. Esto quiere decir que el tiempo de respuesta medido es mejor que la media (31 ms) de todos los dispositivos testados. | ||
Parpadeo de Pantalla / PWM (Pulse-Width Modulation)
| Parpadeo de Pantalla / PWM no detectado | 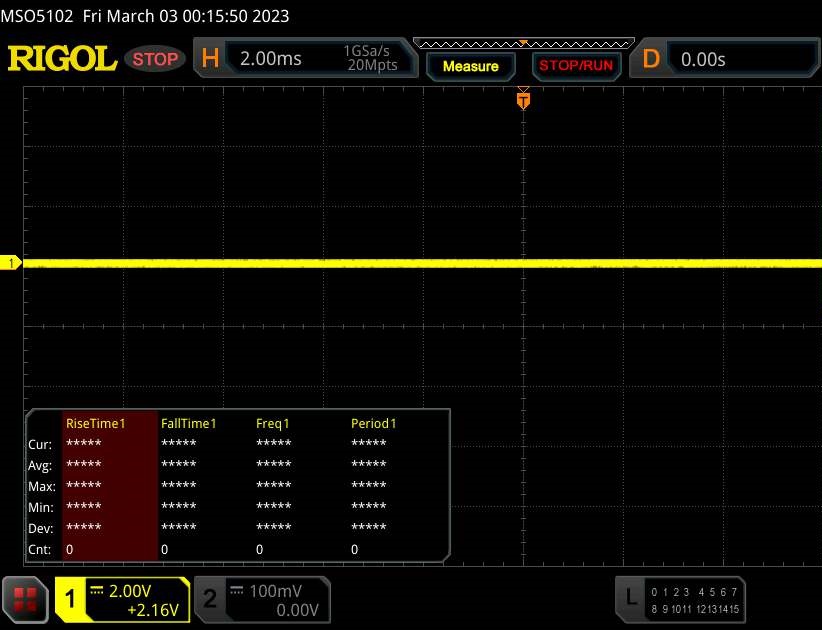 | ||
Comparación: 52 % de todos los dispositivos testados no usaron PWM para atenuar el display. Si se usó, medimos una media de 7772 (mínimo: 5 - máxmo: 343500) Hz. | |||
El brillo relativamente bajo y el contraste limitado hacen casi imposible usar el portátil en exteriores. En un lugar soleado, aunque haya un poco de sombra, particularmente los colores ya casi no son reconocibles, aunque aún se pueda leer el texto.


Sólo hay tanta estabilidad de ángulo de visión como sea necesaria para un portátil gaming como el ROG Strix G17. Dado que normalmente casi siempre se mira directamente a la pantalla desde el frente, apenas debería importar que desde ángulos significativamente superiores a 45º, cualquier área negra quede cubierta por un velo gris y los colores también parezcan ligeramente pálidos.


Rendimiento - ROG Strix en la gama media-alta
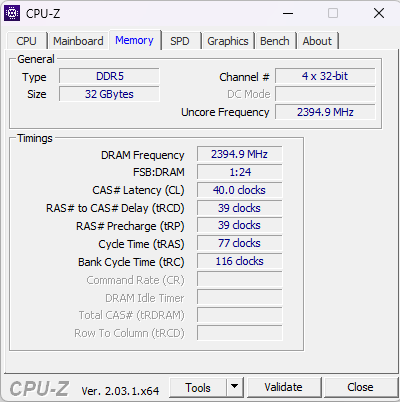
El Asus ROG Strix G17 apenas pierde un puesto en el segmento de gama alta, pero esto seguramente no es culpa de la CPU, que actualmente es uno de los modelos más potentes. Junto con los 32 GB de RAM DDR5 de nuestra unidad de pruebas G713PI-LL005W, esto no deja dudas en el alto rendimiento informático. La tarjeta gráfica, por otro lado, aún deja cierto margen de mejora.
Sin embargo, la RTX 4070 debería seguir permitiéndote jugar cómodamente a la mayoría de juegos, incluso a los más complejos, con los niveles de detalle más altos y a máxima resolución. Si quieres frecuencias de cuadro lo más altas posible, es más probable que lo consigas en resolución Full-HD. Con los modelos con RTX 4060 y RTX 4050, tendrás que esperar algunos compromisos más.
Condiciones de la prueba
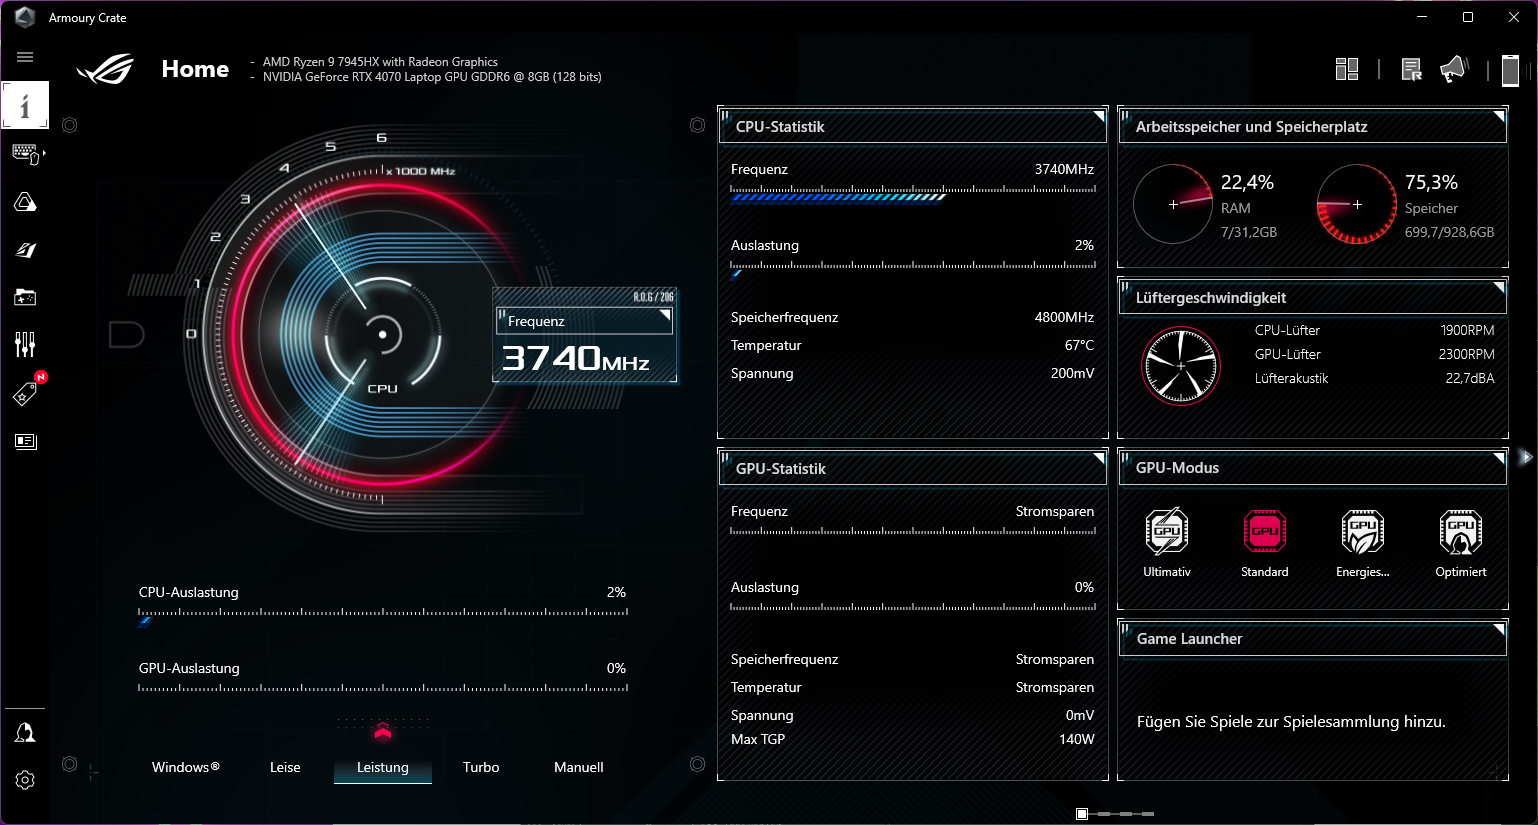
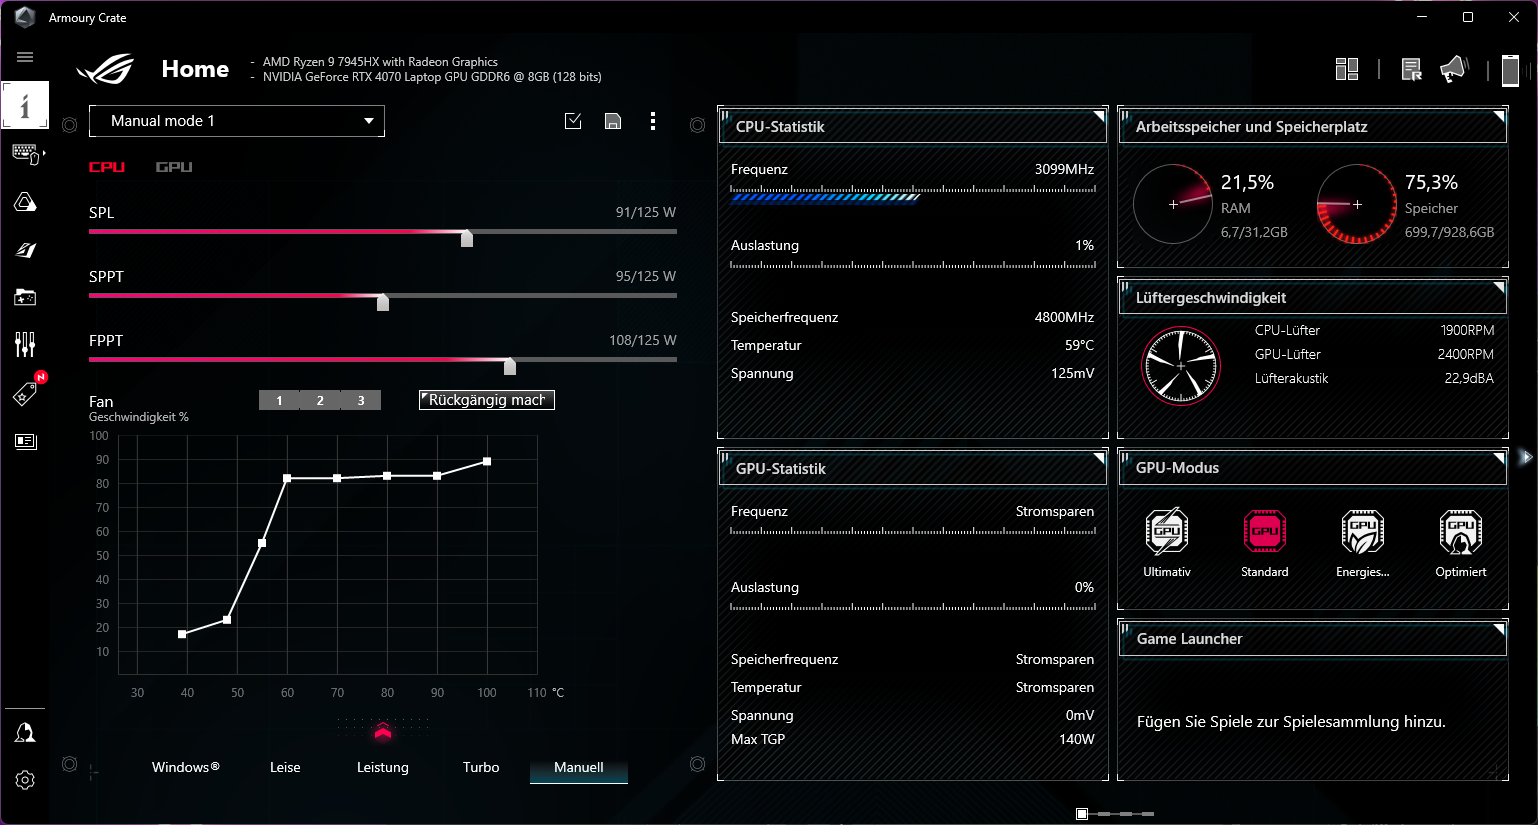
Asus incluye una serie de perfiles de energía en el ROG Strix G17 que ofrecen ajustes del rendimiento del sistema así como emisiones para diversas situaciones. Usando las opciones de configuración manual, puedes ajustarlos más o incluso cambiarlos completamente.
Realizamos todos nuestros benchmarks usando el modo "Rendimiento". Según Asus, este modo ofrece un alto rendimiento informático, limitando al menos el desarrollo de ruido. Para comparar, también incluimos una medición adicional con el modo "Turbo" en la prueba de carga constante Cinebench-R15, para mostrar el máximo rendimiento posible. Sin embargo, sin usar auriculares o en temperaturas ambientales altas, este modo no se recomienda.
El procesador funciona con diferentes límites de potencia en casi todas las situaciones, pero el consumo de energía es siempre considerable, aunque sigue siendo adecuado para el alto rendimiento informático.
| PL2 | PL1 | |
| Modo de rendimiento | 120 W | 90 W |
| Modo turbo | 125 W | 125 W |
| Modo silencioso | 100 W | 65 W |
| Rendimiento (batería) | 120 W | 60 W |
| Silencioso (batería) | 100 W | 40 W |
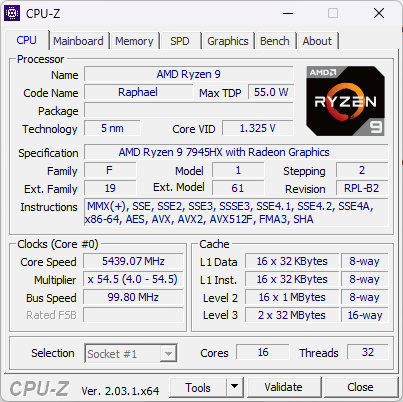
Procesador
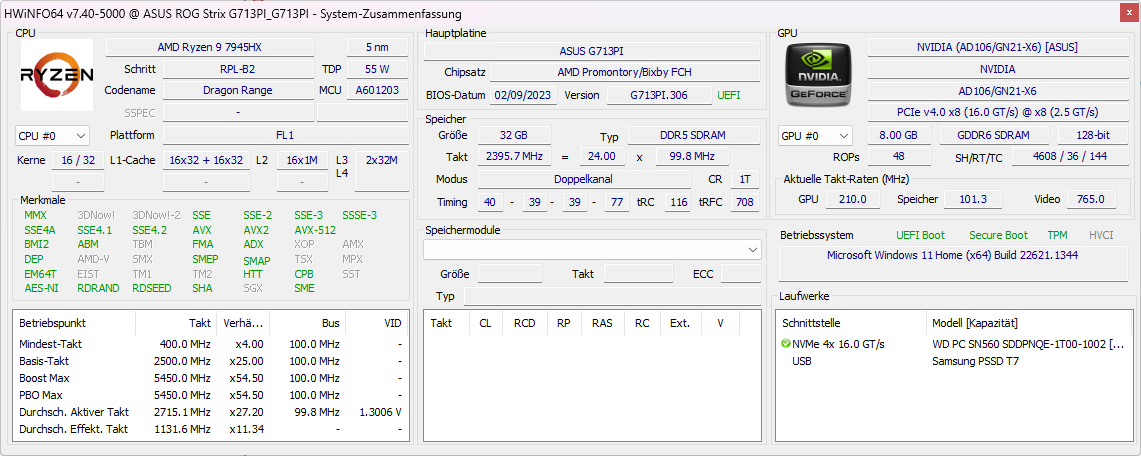
EnAMD Ryzen 9 7945HXcon la actual arquitectura Zen4 es capaz de ofrecer valores de rendimiento considerables. Sus 16 núcleos y 32 hilos aseguran por sí solos una gran cantidad de reservas de rendimiento, permitiendo velocidades de reloj máximas de hasta 5,4 GHz. Tampoco hay carencias en términos de caché, y 16 MB de caché L2 y particularmente 64 MB de caché L3 aseguran tiempos de carga mínimos.
Nuestra clasificación de rendimiento en varios benchmarks de CPU muestra lo que esto significa en la práctica. El procesador Zen4 de AMD se sitúa en lo más alto casi en todo. Sólo en las tareas realizadas por un único núcleo de cálculo, las CPUs de Intel quedan por delante. En la prueba de carga constante con Cinebench R15, el 7945HX en modo Turbo es capaz de superar los valores de un Intel Core i9-13980HX (también en modo Turbo) en aproximadamente un 20%. En el Cinebench R23, esto es al menos todavía un 5%. La diferencia de rendimiento con la generación anterior de procesadores AMD con arquitectura Zen3 es aún más notable. El AMD Ryzen 9 6900HXalcanza apenas la mitad de puntos, con el Intel Core i9-12950HXtampoco lo hace mucho mejor.
El consumo de energía se mantiene más o menos al mismo nivel. Con esto, AMD pudo lograr un enorme aumento en la eficiencia de sus núcleos de computación. Actualmente apenas se puede conseguir un rendimiento mucho mayor con ningún procesador móvil.
Puedes encontrar más datos de rendimiento y comparaciones en nuestra Lista de pruebas de CPU.
Cinebench R15 Multi Constant Load Test
Cinebench R23: Multi Core | Single Core
Cinebench R20: CPU (Multi Core) | CPU (Single Core)
Cinebench R15: CPU Multi 64Bit | CPU Single 64Bit
Blender: v2.79 BMW27 CPU
7-Zip 18.03: 7z b 4 | 7z b 4 -mmt1
Geekbench 5.5: Multi-Core | Single-Core
HWBOT x265 Benchmark v2.2: 4k Preset
LibreOffice : 20 Documents To PDF
R Benchmark 2.5: Overall mean
| CPU Performance rating | |
| Medio AMD Ryzen 9 7945HX | |
| Asus Zephyrus Duo 16 GX650PY-NM006W | |
| Asus ROG Strix G16 G614JZ | |
| Asus ROG Strix G17 G713PI | |
| Razer Blade 18 RTX 4070 | |
| Media de la clase Gaming | |
| Asus ROG Strix Scar 17 SE G733CX-LL014W | |
| Asus ROG Strix G18 G814JI | |
| Alienware m17 R5 (R9 6900HX, RX 6850M XT) | |
| Cinebench R23 / Multi Core | |
| Asus Zephyrus Duo 16 GX650PY-NM006W | |
| Medio AMD Ryzen 9 7945HX (30783 - 34613, n=9) | |
| Asus ROG Strix G17 G713PI | |
| Asus ROG Strix G16 G614JZ | |
| Razer Blade 18 RTX 4070 | |
| Media de la clase Gaming (10488 - 40970, n=111, últimos 2 años) | |
| Asus ROG Strix G18 G814JI | |
| Asus ROG Strix Scar 17 SE G733CX-LL014W | |
| Alienware m17 R5 (R9 6900HX, RX 6850M XT) | |
| Cinebench R23 / Single Core | |
| Asus ROG Strix G16 G614JZ | |
| Razer Blade 18 RTX 4070 | |
| Media de la clase Gaming (1166 - 2356, n=111, últimos 2 años) | |
| Asus Zephyrus Duo 16 GX650PY-NM006W | |
| Medio AMD Ryzen 9 7945HX (1861 - 1957, n=9) | |
| Asus ROG Strix Scar 17 SE G733CX-LL014W | |
| Asus ROG Strix G18 G814JI | |
| Asus ROG Strix G17 G713PI | |
| Alienware m17 R5 (R9 6900HX, RX 6850M XT) | |
| Cinebench R20 / CPU (Multi Core) | |
| Asus Zephyrus Duo 16 GX650PY-NM006W | |
| Medio AMD Ryzen 9 7945HX (10025 - 13769, n=9) | |
| Asus ROG Strix G16 G614JZ | |
| Razer Blade 18 RTX 4070 | |
| Asus ROG Strix G17 G713PI | |
| Media de la clase Gaming (4029 - 16108, n=110, últimos 2 años) | |
| Asus ROG Strix G18 G814JI | |
| Asus ROG Strix Scar 17 SE G733CX-LL014W | |
| Alienware m17 R5 (R9 6900HX, RX 6850M XT) | |
| Cinebench R20 / CPU (Single Core) | |
| Asus ROG Strix G16 G614JZ | |
| Razer Blade 18 RTX 4070 | |
| Media de la clase Gaming (442 - 895, n=110, últimos 2 años) | |
| Asus Zephyrus Duo 16 GX650PY-NM006W | |
| Medio AMD Ryzen 9 7945HX (712 - 760, n=9) | |
| Asus ROG Strix Scar 17 SE G733CX-LL014W | |
| Asus ROG Strix G18 G814JI | |
| Asus ROG Strix G17 G713PI | |
| Alienware m17 R5 (R9 6900HX, RX 6850M XT) | |
| Cinebench R15 / CPU Multi 64Bit | |
| Asus Zephyrus Duo 16 GX650PY-NM006W | |
| Medio AMD Ryzen 9 7945HX (4998 - 5663, n=10) | |
| Asus ROG Strix G17 G713PI | |
| Asus ROG Strix G16 G614JZ | |
| Asus ROG Strix G16 G614JZ | |
| Razer Blade 18 RTX 4070 | |
| Media de la clase Gaming (1578 - 6271, n=109, últimos 2 años) | |
| Asus ROG Strix G18 G814JI | |
| Asus ROG Strix Scar 17 SE G733CX-LL014W | |
| Alienware m17 R5 (R9 6900HX, RX 6850M XT) | |
| Cinebench R15 / CPU Single 64Bit | |
| Asus Zephyrus Duo 16 GX650PY-NM006W | |
| Asus ROG Strix G16 G614JZ | |
| Asus ROG Strix G16 G614JZ | |
| Medio AMD Ryzen 9 7945HX (290 - 311, n=10) | |
| Razer Blade 18 RTX 4070 | |
| Media de la clase Gaming (188.8 - 343, n=110, últimos 2 años) | |
| Asus ROG Strix G17 G713PI | |
| Asus ROG Strix G18 G814JI | |
| Asus ROG Strix Scar 17 SE G733CX-LL014W | |
| Alienware m17 R5 (R9 6900HX, RX 6850M XT) | |
| Blender / v2.79 BMW27 CPU | |
| Alienware m17 R5 (R9 6900HX, RX 6850M XT) | |
| Asus ROG Strix Scar 17 SE G733CX-LL014W | |
| Asus ROG Strix G18 G814JI | |
| Media de la clase Gaming (80 - 330, n=108, últimos 2 años) | |
| Razer Blade 18 RTX 4070 | |
| Asus ROG Strix G16 G614JZ | |
| Asus ROG Strix G17 G713PI | |
| Medio AMD Ryzen 9 7945HX (87 - 100, n=9) | |
| Asus Zephyrus Duo 16 GX650PY-NM006W | |
| 7-Zip 18.03 / 7z b 4 | |
| Asus Zephyrus Duo 16 GX650PY-NM006W | |
| Medio AMD Ryzen 9 7945HX (123364 - 140932, n=9) | |
| Asus ROG Strix G17 G713PI | |
| Razer Blade 18 RTX 4070 | |
| Asus ROG Strix G16 G614JZ | |
| Media de la clase Gaming (33491 - 148086, n=109, últimos 2 años) | |
| Asus ROG Strix G18 G814JI | |
| Asus ROG Strix Scar 17 SE G733CX-LL014W | |
| Alienware m17 R5 (R9 6900HX, RX 6850M XT) | |
| 7-Zip 18.03 / 7z b 4 -mmt1 | |
| Medio AMD Ryzen 9 7945HX (7319 - 7711, n=9) | |
| Asus ROG Strix G17 G713PI | |
| Asus Zephyrus Duo 16 GX650PY-NM006W | |
| Asus ROG Strix G16 G614JZ | |
| Razer Blade 18 RTX 4070 | |
| Media de la clase Gaming (4199 - 7436, n=109, últimos 2 años) | |
| Asus ROG Strix Scar 17 SE G733CX-LL014W | |
| Asus ROG Strix G18 G814JI | |
| Alienware m17 R5 (R9 6900HX, RX 6850M XT) | |
| Geekbench 5.5 / Multi-Core | |
| Razer Blade 18 RTX 4070 | |
| Medio AMD Ryzen 9 7945HX (18372 - 20394, n=9) | |
| Asus Zephyrus Duo 16 GX650PY-NM006W | |
| Asus ROG Strix G16 G614JZ | |
| Asus ROG Strix G17 G713PI | |
| Media de la clase Gaming (6460 - 27010, n=109, últimos 2 años) | |
| Asus ROG Strix Scar 17 SE G733CX-LL014W | |
| Asus ROG Strix G18 G814JI | |
| Alienware m17 R5 (R9 6900HX, RX 6850M XT) | |
| Geekbench 5.5 / Single-Core | |
| Asus Zephyrus Duo 16 GX650PY-NM006W | |
| Medio AMD Ryzen 9 7945HX (1960 - 2158, n=9) | |
| Asus ROG Strix G17 G713PI | |
| Media de la clase Gaming (986 - 2474, n=109, últimos 2 años) | |
| Asus ROG Strix G16 G614JZ | |
| Razer Blade 18 RTX 4070 | |
| Asus ROG Strix Scar 17 SE G733CX-LL014W | |
| Asus ROG Strix G18 G814JI | |
| Alienware m17 R5 (R9 6900HX, RX 6850M XT) | |
| HWBOT x265 Benchmark v2.2 / 4k Preset | |
| Medio AMD Ryzen 9 7945HX (33.8 - 37.6, n=8) | |
| Asus Zephyrus Duo 16 GX650PY-NM006W | |
| Asus ROG Strix G17 G713PI | |
| Razer Blade 18 RTX 4070 | |
| Asus ROG Strix G16 G614JZ | |
| Media de la clase Gaming (11.5 - 44.3, n=109, últimos 2 años) | |
| Asus ROG Strix G18 G814JI | |
| Asus ROG Strix Scar 17 SE G733CX-LL014W | |
| Alienware m17 R5 (R9 6900HX, RX 6850M XT) | |
| LibreOffice / 20 Documents To PDF | |
| Asus Zephyrus Duo 16 GX650PY-NM006W | |
| Asus ROG Strix G18 G814JI | |
| Alienware m17 R5 (R9 6900HX, RX 6850M XT) | |
| Media de la clase Gaming (19 - 88.8, n=109, últimos 2 años) | |
| Asus ROG Strix G16 G614JZ | |
| Asus ROG Strix G17 G713PI | |
| Medio AMD Ryzen 9 7945HX (35.5 - 60.4, n=8) | |
| Razer Blade 18 RTX 4070 | |
| Asus ROG Strix Scar 17 SE G733CX-LL014W | |
| R Benchmark 2.5 / Overall mean | |
| Alienware m17 R5 (R9 6900HX, RX 6850M XT) | |
| Asus ROG Strix G18 G814JI | |
| Media de la clase Gaming (0.3439 - 0.759, n=110, últimos 2 años) | |
| Asus ROG Strix Scar 17 SE G733CX-LL014W | |
| Asus ROG Strix G17 G713PI | |
| Medio AMD Ryzen 9 7945HX (0.3884 - 0.4159, n=8) | |
| Asus Zephyrus Duo 16 GX650PY-NM006W | |
| Razer Blade 18 RTX 4070 | |
| Asus ROG Strix G16 G614JZ | |
* ... más pequeño es mejor
AIDA64: FP32 Ray-Trace | FPU Julia | CPU SHA3 | CPU Queen | FPU SinJulia | FPU Mandel | CPU AES | CPU ZLib | FP64 Ray-Trace | CPU PhotoWorxx
| Performance rating | |
| Medio AMD Ryzen 9 7945HX | |
| Asus ROG Strix G17 G713PI | |
| Razer Blade 18 RTX 4070 | |
| Asus ROG Strix G16 G614JZ | |
| Media de la clase Gaming | |
| Asus ROG Strix Scar 17 SE G733CX-LL014W | |
| Asus ROG Strix G18 G814JI | |
| AIDA64 / FP32 Ray-Trace | |
| Medio AMD Ryzen 9 7945HX (50388 - 60169, n=7) | |
| Asus ROG Strix G17 G713PI | |
| Media de la clase Gaming (10227 - 85542, n=108, últimos 2 años) | |
| Asus ROG Strix G16 G614JZ | |
| Razer Blade 18 RTX 4070 | |
| Asus ROG Strix G18 G814JI | |
| Asus ROG Strix Scar 17 SE G733CX-LL014W | |
| AIDA64 / FPU Julia | |
| Asus ROG Strix G17 G713PI | |
| Medio AMD Ryzen 9 7945HX (201874 - 252486, n=7) | |
| Media de la clase Gaming (51376 - 238426, n=108, últimos 2 años) | |
| Asus ROG Strix G16 G614JZ | |
| Razer Blade 18 RTX 4070 | |
| Asus ROG Strix G18 G814JI | |
| Asus ROG Strix Scar 17 SE G733CX-LL014W | |
| AIDA64 / CPU SHA3 | |
| Medio AMD Ryzen 9 7945HX (8525 - 10389, n=7) | |
| Asus ROG Strix G17 G713PI | |
| Asus ROG Strix G16 G614JZ | |
| Razer Blade 18 RTX 4070 | |
| Media de la clase Gaming (2180 - 9817, n=108, últimos 2 años) | |
| Asus ROG Strix G18 G814JI | |
| Asus ROG Strix Scar 17 SE G733CX-LL014W | |
| AIDA64 / CPU Queen | |
| Medio AMD Ryzen 9 7945HX (175041 - 200651, n=7) | |
| Asus ROG Strix G17 G713PI | |
| Asus ROG Strix G16 G614JZ | |
| Razer Blade 18 RTX 4070 | |
| Media de la clase Gaming (49785 - 173351, n=96, últimos 2 años) | |
| Asus ROG Strix G18 G814JI | |
| Asus ROG Strix Scar 17 SE G733CX-LL014W | |
| AIDA64 / FPU SinJulia | |
| Medio AMD Ryzen 9 7945HX (28794 - 32988, n=7) | |
| Asus ROG Strix G17 G713PI | |
| Asus ROG Strix G16 G614JZ | |
| Razer Blade 18 RTX 4070 | |
| Media de la clase Gaming (4424 - 33636, n=108, últimos 2 años) | |
| Asus ROG Strix Scar 17 SE G733CX-LL014W | |
| Asus ROG Strix G18 G814JI | |
| AIDA64 / FPU Mandel | |
| Medio AMD Ryzen 9 7945HX (105740 - 134044, n=7) | |
| Asus ROG Strix G17 G713PI | |
| Media de la clase Gaming (25115 - 128721, n=108, últimos 2 años) | |
| Asus ROG Strix G16 G614JZ | |
| Razer Blade 18 RTX 4070 | |
| Asus ROG Strix G18 G814JI | |
| Asus ROG Strix Scar 17 SE G733CX-LL014W | |
| AIDA64 / CPU AES | |
| Medio AMD Ryzen 9 7945HX (126790 - 325960, n=7) | |
| Asus ROG Strix G17 G713PI | |
| Asus ROG Strix Scar 17 SE G733CX-LL014W | |
| Asus ROG Strix G16 G614JZ | |
| Razer Blade 18 RTX 4070 | |
| Media de la clase Gaming (39258 - 247074, n=108, últimos 2 años) | |
| Asus ROG Strix G18 G814JI | |
| AIDA64 / CPU ZLib | |
| Medio AMD Ryzen 9 7945HX (2022 - 2409, n=7) | |
| Asus ROG Strix G17 G713PI | |
| Asus ROG Strix G16 G614JZ | |
| Razer Blade 18 RTX 4070 | |
| Media de la clase Gaming (574 - 2531, n=108, últimos 2 años) | |
| Asus ROG Strix G18 G814JI | |
| Asus ROG Strix Scar 17 SE G733CX-LL014W | |
| AIDA64 / FP64 Ray-Trace | |
| Medio AMD Ryzen 9 7945HX (26875 - 31796, n=7) | |
| Asus ROG Strix G17 G713PI | |
| Media de la clase Gaming (5509 - 45446, n=108, últimos 2 años) | |
| Asus ROG Strix G16 G614JZ | |
| Razer Blade 18 RTX 4070 | |
| Asus ROG Strix G18 G814JI | |
| Asus ROG Strix Scar 17 SE G733CX-LL014W | |
| AIDA64 / CPU PhotoWorxx | |
| Razer Blade 18 RTX 4070 | |
| Media de la clase Gaming (12271 - 89891, n=108, últimos 2 años) | |
| Asus ROG Strix Scar 17 SE G733CX-LL014W | |
| Asus ROG Strix G18 G814JI | |
| Asus ROG Strix G16 G614JZ | |
| Medio AMD Ryzen 9 7945HX (31421 - 40095, n=7) | |
| Asus ROG Strix G17 G713PI | |
Rendimiento del sistema
Básicamente, todo funciona rápido con el Asus ROG Strix. Instalar programas, borrar, y ejecutar fácilmente varias aplicaciones en paralelo no supone ningún problema en absoluto para el portátil de juegos. Casi no hay tiempos de espera en absoluto, sobre todo porque el procesador funciona a un alto nivel en todo momento.
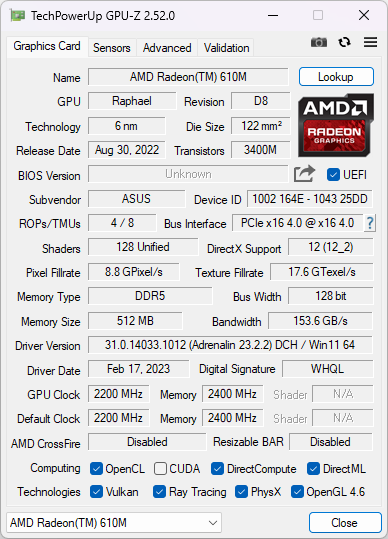
Por otro lado, el cambio entre el procesador interno AMD Radeon 610My laNvidia GeForce RTX 4070no funciona sin problemas. Ocasionalmente, verás una pantalla negra al iniciar algún programa, y eso no sólo mientras juegas. Lo mismo ocurre al activar Nvidia Optimus. También tenemos que notar que la dGPU recibe repetidamente algunas tareas, por ejemplo mientras se navega. Esto aumenta innecesariamente el consumo de energía o disminuye la duración durante el funcionamiento con batería.
Sin embargo, deberíamos esperar que algunas actualizaciones adicionales de drivers remedien estos comportamientos. Pero hasta entonces, probablemente sea aconsejable desactivar los gráficos integrados en funcionamiento de red a través de Armoury Crate. Esto mejorará la experiencia del usuario, sobre todo cuando se cambia a menudo entre programas. Una cooperación sin fricciones entre los dos chips gráficos habría sido mejor.
CrossMark: Overall | Productivity | Creativity | Responsiveness
| PCMark 10 / Score | |
| Asus Zephyrus Duo 16 GX650PY-NM006W | |
| Media de la clase Gaming (5828 - 11574, n=96, últimos 2 años) | |
| Medio AMD Ryzen 9 7945HX, NVIDIA GeForce RTX 4070 Laptop GPU (7449 - 8334, n=2) | |
| Razer Blade 18 RTX 4070 | |
| Asus ROG Strix G17 G713PI | |
| Alienware m17 R5 (R9 6900HX, RX 6850M XT) | |
| Asus ROG Strix G16 G614JZ | |
| Asus ROG Strix Scar 17 SE G733CX-LL014W | |
| Asus ROG Strix G18 G814JI | |
| PCMark 10 / Essentials | |
| Asus Zephyrus Duo 16 GX650PY-NM006W | |
| Asus ROG Strix G16 G614JZ | |
| Razer Blade 18 RTX 4070 | |
| Medio AMD Ryzen 9 7945HX, NVIDIA GeForce RTX 4070 Laptop GPU (11166 - 11364, n=2) | |
| Asus ROG Strix G17 G713PI | |
| Media de la clase Gaming (8810 - 12600, n=100, últimos 2 años) | |
| Asus ROG Strix Scar 17 SE G733CX-LL014W | |
| Alienware m17 R5 (R9 6900HX, RX 6850M XT) | |
| Asus ROG Strix G18 G814JI | |
| PCMark 10 / Productivity | |
| Asus Zephyrus Duo 16 GX650PY-NM006W | |
| Asus ROG Strix G17 G713PI | |
| Media de la clase Gaming (6845 - 21327, n=98, últimos 2 años) | |
| Medio AMD Ryzen 9 7945HX, NVIDIA GeForce RTX 4070 Laptop GPU (10441 - 11087, n=2) | |
| Asus ROG Strix Scar 17 SE G733CX-LL014W | |
| Razer Blade 18 RTX 4070 | |
| Alienware m17 R5 (R9 6900HX, RX 6850M XT) | |
| Asus ROG Strix G18 G814JI | |
| Asus ROG Strix G16 G614JZ | |
| PCMark 10 / Digital Content Creation | |
| Asus Zephyrus Duo 16 GX650PY-NM006W | |
| Media de la clase Gaming (7602 - 19657, n=98, últimos 2 años) | |
| Alienware m17 R5 (R9 6900HX, RX 6850M XT) | |
| Medio AMD Ryzen 9 7945HX, NVIDIA GeForce RTX 4070 Laptop GPU (9062 - 13239, n=2) | |
| Asus ROG Strix G16 G614JZ | |
| Razer Blade 18 RTX 4070 | |
| Asus ROG Strix Scar 17 SE G733CX-LL014W | |
| Asus ROG Strix G17 G713PI | |
| Asus ROG Strix G18 G814JI | |
| CrossMark / Overall | |
| Asus ROG Strix G16 G614JZ | |
| Razer Blade 18 RTX 4070 | |
| Asus ROG Strix Scar 17 SE G733CX-LL014W | |
| Asus Zephyrus Duo 16 GX650PY-NM006W | |
| Medio AMD Ryzen 9 7945HX, NVIDIA GeForce RTX 4070 Laptop GPU (2037 - 2044, n=2) | |
| Asus ROG Strix G17 G713PI | |
| Media de la clase Gaming (1366 - 2409, n=96, últimos 2 años) | |
| Alienware m17 R5 (R9 6900HX, RX 6850M XT) | |
| CrossMark / Productivity | |
| Asus ROG Strix G16 G614JZ | |
| Razer Blade 18 RTX 4070 | |
| Asus ROG Strix Scar 17 SE G733CX-LL014W | |
| Asus Zephyrus Duo 16 GX650PY-NM006W | |
| Asus ROG Strix G17 G713PI | |
| Medio AMD Ryzen 9 7945HX, NVIDIA GeForce RTX 4070 Laptop GPU (1909 - 1917, n=2) | |
| Media de la clase Gaming (1386 - 2254, n=96, últimos 2 años) | |
| Alienware m17 R5 (R9 6900HX, RX 6850M XT) | |
| CrossMark / Creativity | |
| Asus ROG Strix G16 G614JZ | |
| Razer Blade 18 RTX 4070 | |
| Asus Zephyrus Duo 16 GX650PY-NM006W | |
| Asus ROG Strix Scar 17 SE G733CX-LL014W | |
| Medio AMD Ryzen 9 7945HX, NVIDIA GeForce RTX 4070 Laptop GPU (2313 - 2335, n=2) | |
| Asus ROG Strix G17 G713PI | |
| Media de la clase Gaming (1343 - 2729, n=96, últimos 2 años) | |
| Alienware m17 R5 (R9 6900HX, RX 6850M XT) | |
| CrossMark / Responsiveness | |
| Asus ROG Strix G16 G614JZ | |
| Asus ROG Strix Scar 17 SE G733CX-LL014W | |
| Razer Blade 18 RTX 4070 | |
| Media de la clase Gaming (1226 - 2334, n=96, últimos 2 años) | |
| Asus Zephyrus Duo 16 GX650PY-NM006W | |
| Medio AMD Ryzen 9 7945HX, NVIDIA GeForce RTX 4070 Laptop GPU (1671 - 1682, n=2) | |
| Asus ROG Strix G17 G713PI | |
| Alienware m17 R5 (R9 6900HX, RX 6850M XT) | |
| PCMark 10 Score | 7449 puntos | |
ayuda | ||
| AIDA64 / Memory Copy | |
| Razer Blade 18 RTX 4070 | |
| Media de la clase Gaming (21750 - 129946, n=108, últimos 2 años) | |
| Asus ROG Strix G18 G814JI | |
| Asus ROG Strix Scar 17 SE G733CX-LL014W | |
| Asus ROG Strix G16 G614JZ | |
| Medio AMD Ryzen 9 7945HX (48948 - 57953, n=7) | |
| Alienware m17 R5 (R9 6900HX, RX 6850M XT) | |
| Asus ROG Strix G17 G713PI | |
| AIDA64 / Memory Read | |
| Razer Blade 18 RTX 4070 | |
| Media de la clase Gaming (22956 - 118858, n=108, últimos 2 años) | |
| Asus ROG Strix G16 G614JZ | |
| Asus ROG Strix Scar 17 SE G733CX-LL014W | |
| Asus ROG Strix G18 G814JI | |
| Medio AMD Ryzen 9 7945HX (56910 - 67753, n=7) | |
| Asus ROG Strix G17 G713PI | |
| Alienware m17 R5 (R9 6900HX, RX 6850M XT) | |
| AIDA64 / Memory Write | |
| Media de la clase Gaming (22297 - 135096, n=108, últimos 2 años) | |
| Razer Blade 18 RTX 4070 | |
| Asus ROG Strix Scar 17 SE G733CX-LL014W | |
| Medio AMD Ryzen 9 7945HX (58602 - 70063, n=7) | |
| Asus ROG Strix G18 G814JI | |
| Asus ROG Strix G16 G614JZ | |
| Asus ROG Strix G17 G713PI | |
| Alienware m17 R5 (R9 6900HX, RX 6850M XT) | |
| AIDA64 / Memory Latency | |
| Media de la clase Gaming (75.3 - 259, n=108, últimos 2 años) | |
| Alienware m17 R5 (R9 6900HX, RX 6850M XT) | |
| Asus ROG Strix G16 G614JZ | |
| Asus ROG Strix G17 G713PI | |
| Asus ROG Strix Scar 17 SE G733CX-LL014W | |
| Razer Blade 18 RTX 4070 | |
| Medio AMD Ryzen 9 7945HX (77.1 - 91.3, n=7) | |
| Asus ROG Strix G18 G814JI | |
* ... más pequeño es mejor
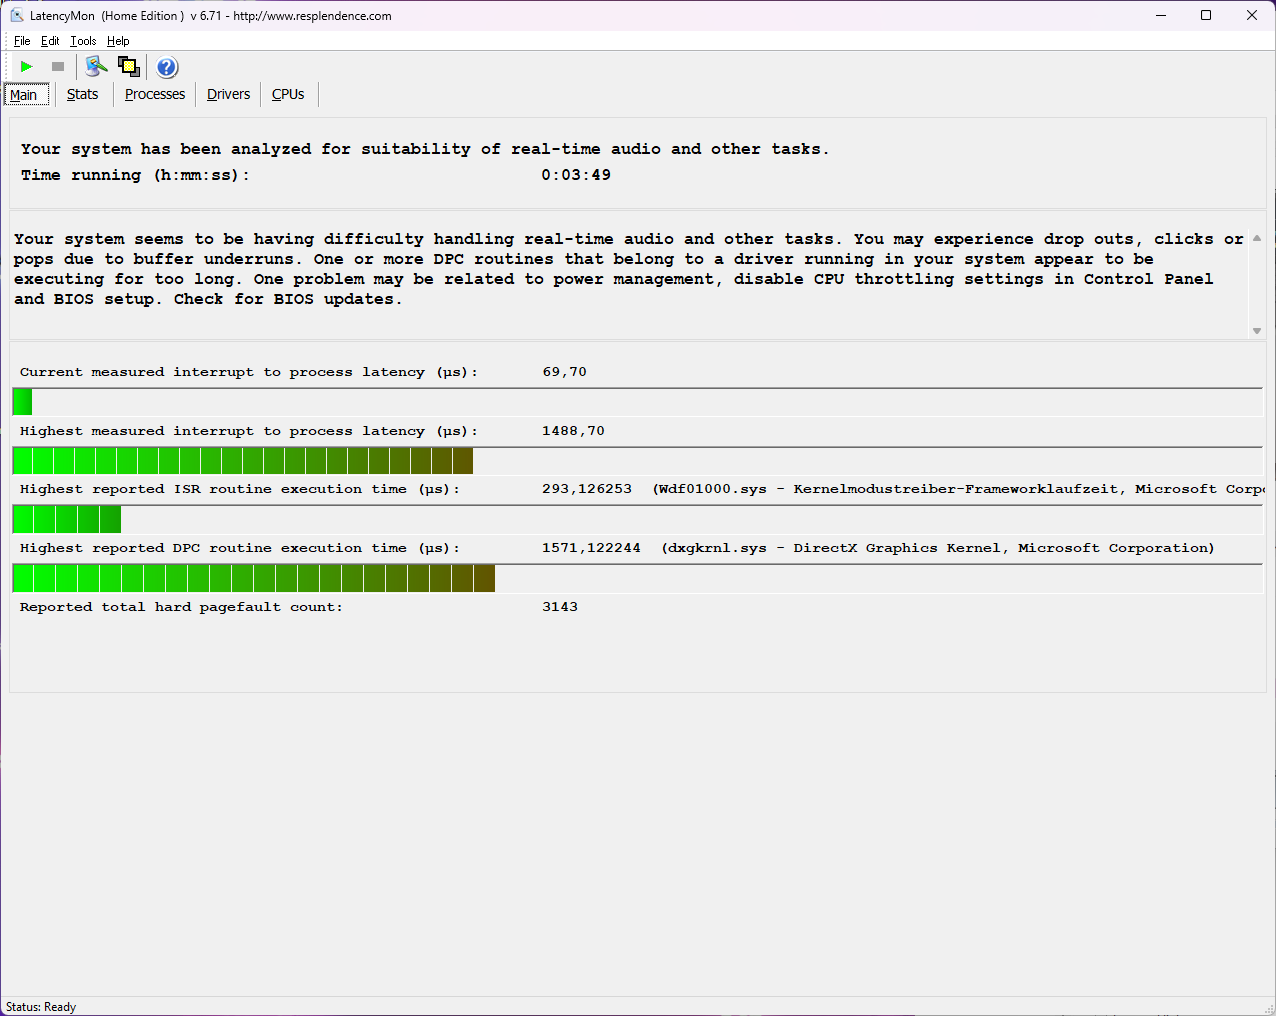
Latencias del CPD
La evaluación de las latencias no resulta ni especialmente buena ni realmente mala. Sin embargo, el programa LatencyMon advierte de que podría haber algunos problemas con el procesamiento de audio en tiempo real. Pero, de todos modos, sólo muy pocos portátiles pueden evitarlo.
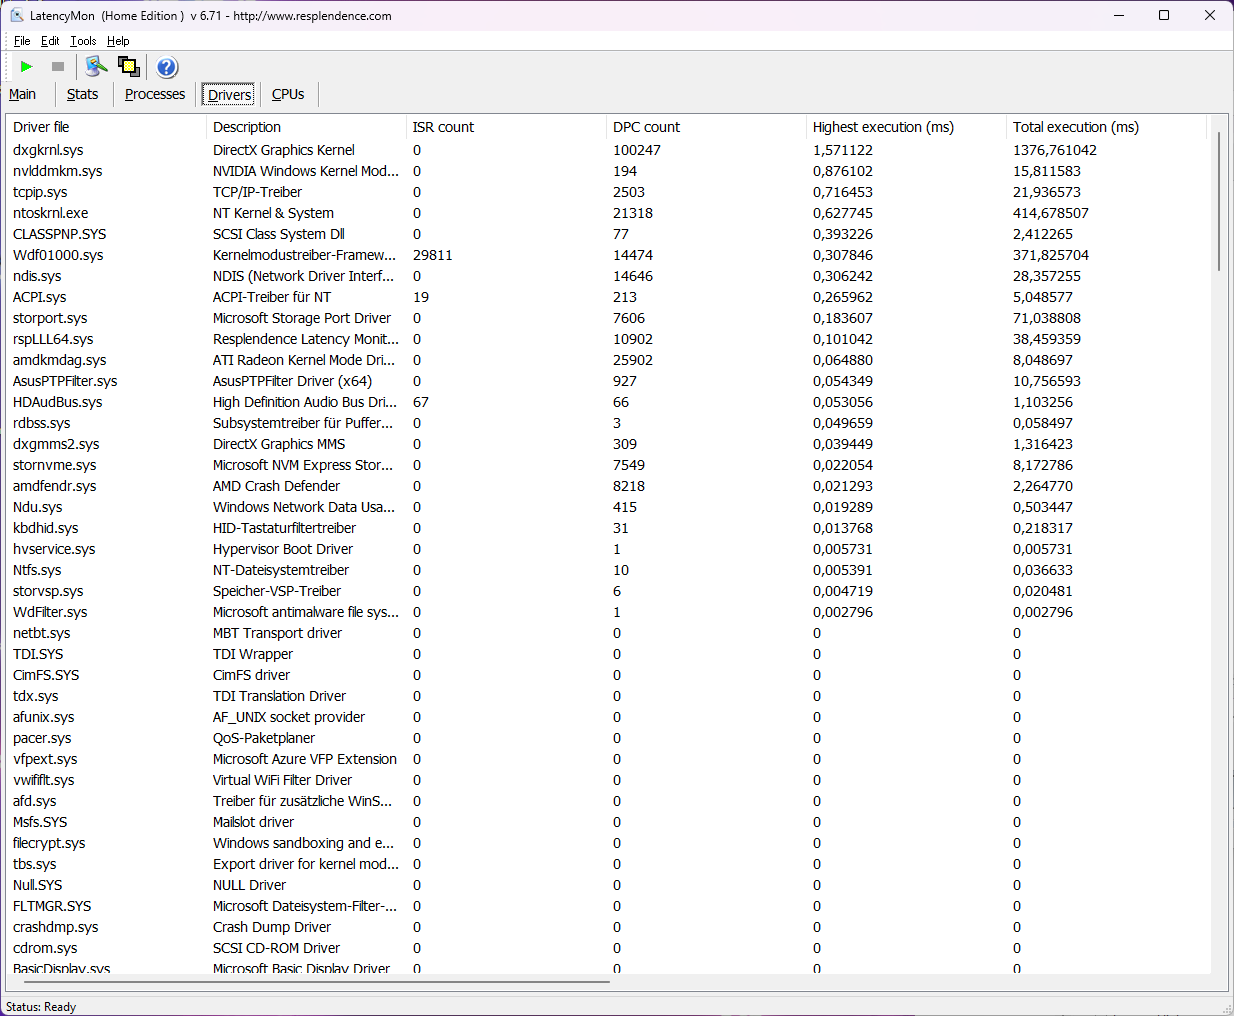
Actualmente, Nvidia advierte de problemas con el aumento de latencias con sus controladores. En realidad, la lista de controladores de LatencyMon muestra sólo ese controlador DirectX en particular como el principal culpable de la evaluación menos que óptima. Actualizar algunos otros drivers también podría cambiar el resultado positiva o negativamente.
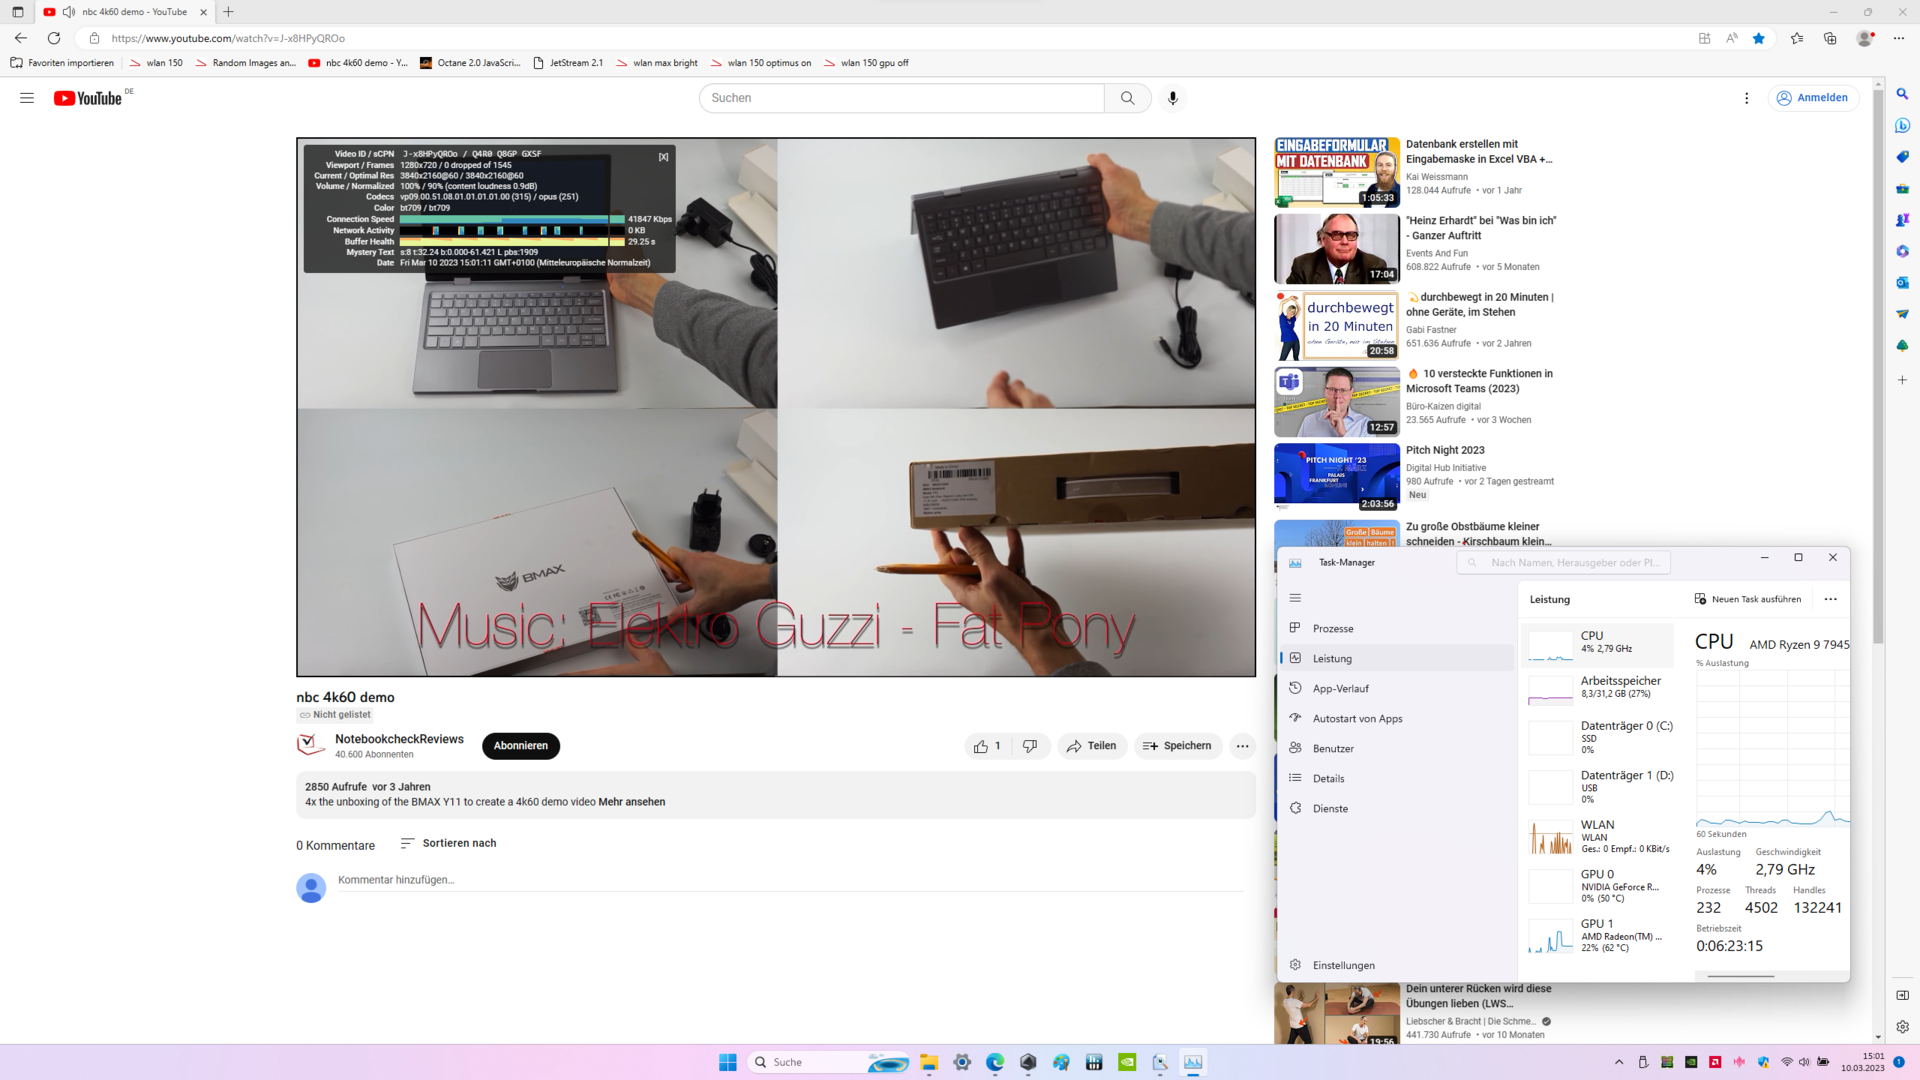
El ROG Strix G17 resulta muy bueno pero no perfecto en el test de streaming de vídeo 4K. La CPU sólo se carga al 4%, y sólo hay un frame caído en la reproducción de vídeo.
| DPC Latencies / LatencyMon - interrupt to process latency (max), Web, Youtube, Prime95 | |
| Asus Zephyrus Duo 16 GX650PY-NM006W | |
| Asus ROG Strix Scar 17 SE G733CX-LL014W | |
| Asus ROG Strix G16 G614JZ | |
| Asus ROG Strix G17 G713PI | |
| Alienware m17 R5 (R9 6900HX, RX 6850M XT) | |
| Razer Blade 18 RTX 4070 | |
| Asus ROG Strix G18 G814JI | |
* ... más pequeño es mejor
Solución de almacenamiento
El SSD resulta un poco débil. Comparado con los competidores, el rendimiento de lectura y escritura es incapaz de mantener el ritmo. Pero al menos en la prueba de tasas de transferencia estables y constantes, el resultado es positivo, ya que la velocidad no tiene que reducirse debido a las altas temperaturas. Un ejemplo negativo aquí es el Asus ROG Strix Scar 17con M.2 SSD RAID, cuyas tasas de transferencia extremas caen al valor de un SSD SATA a largo plazo.
Sin embargo, en el uso práctico mientras se juega, renderiza o navega, el rendimiento ligeramente inferior del SSD no tiene un efecto notable.

* ... más pequeño es mejor
Disk Throttling: DiskSpd Read Loop, Queue Depth 8
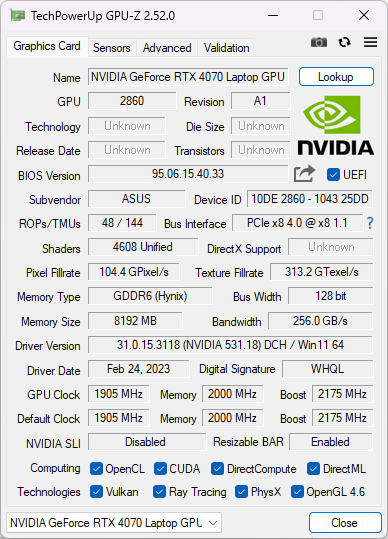
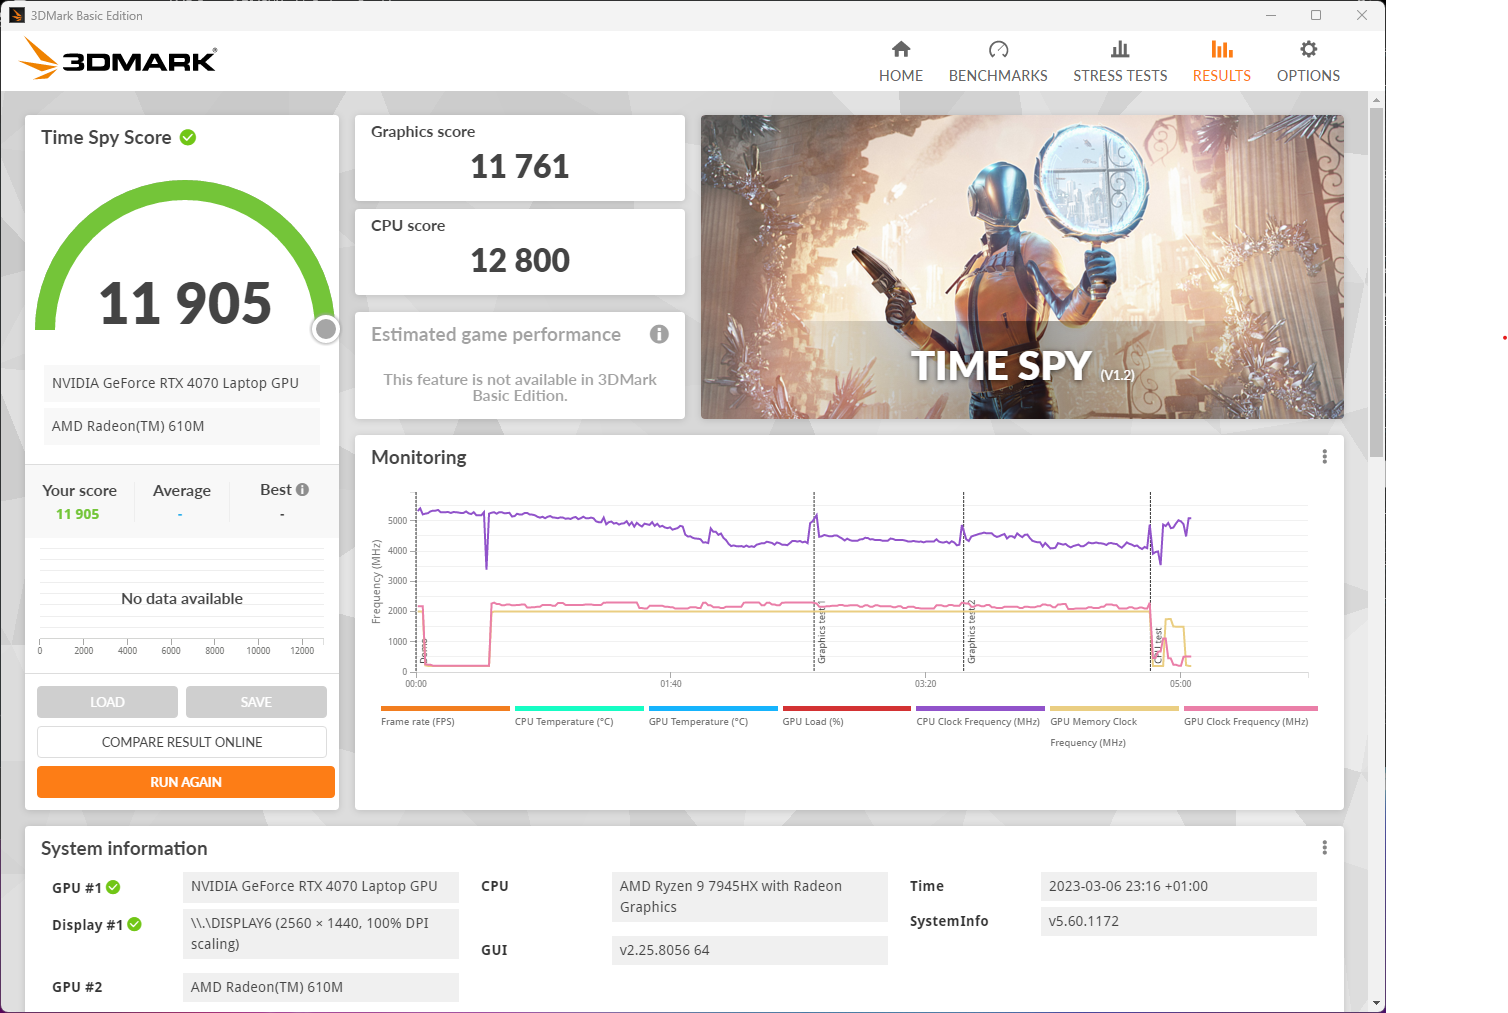
Tarjeta gráfica
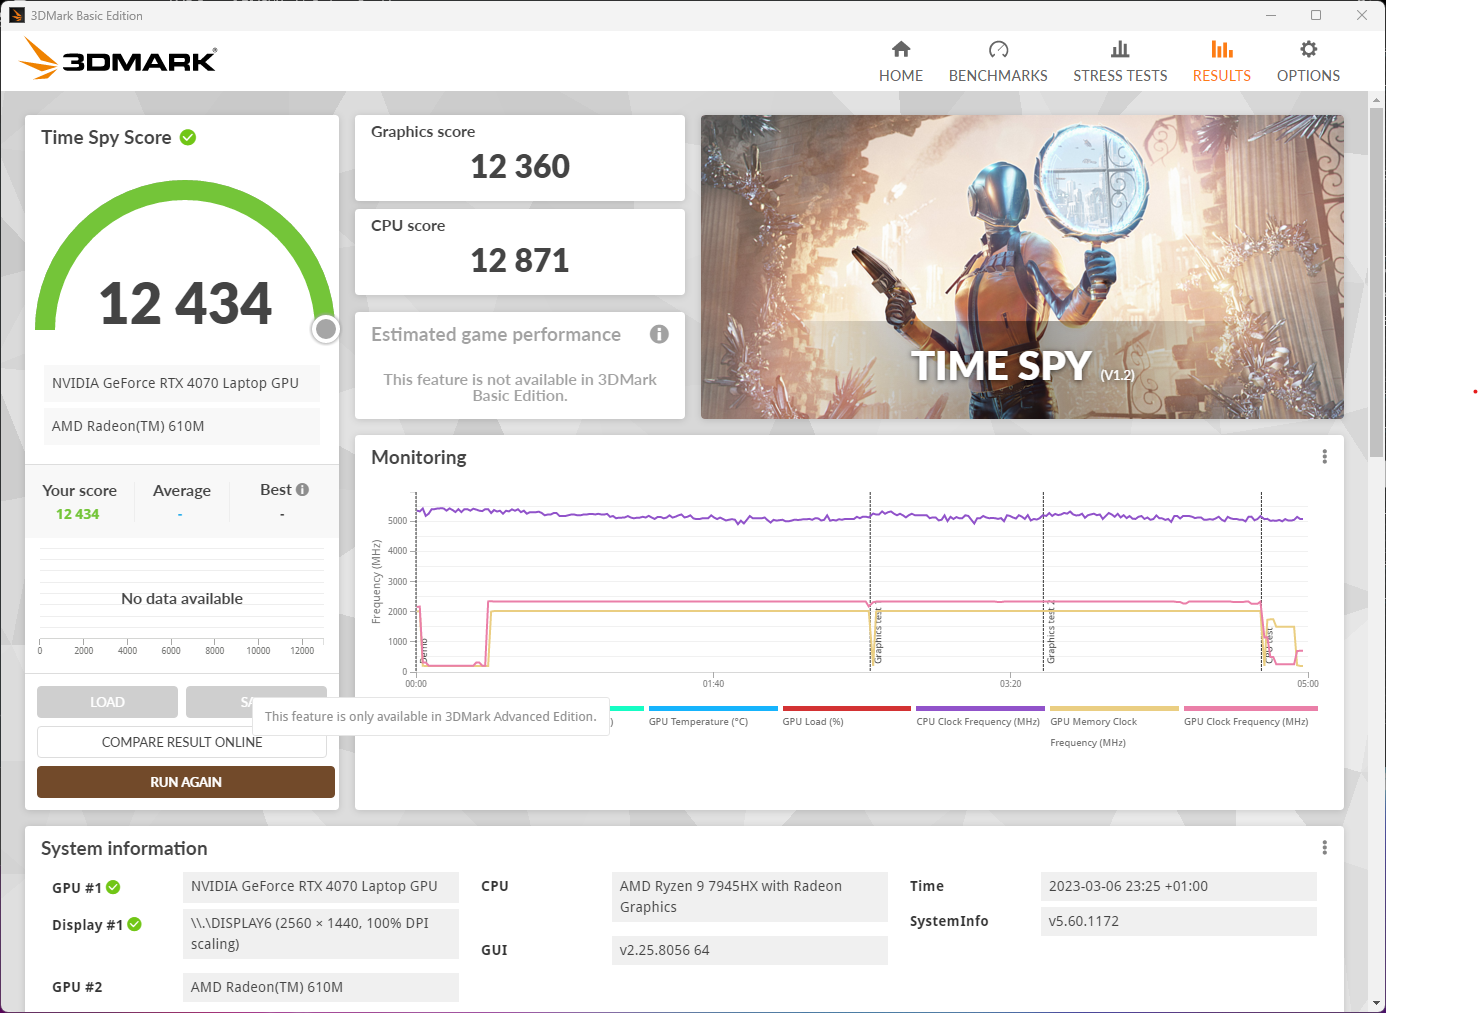
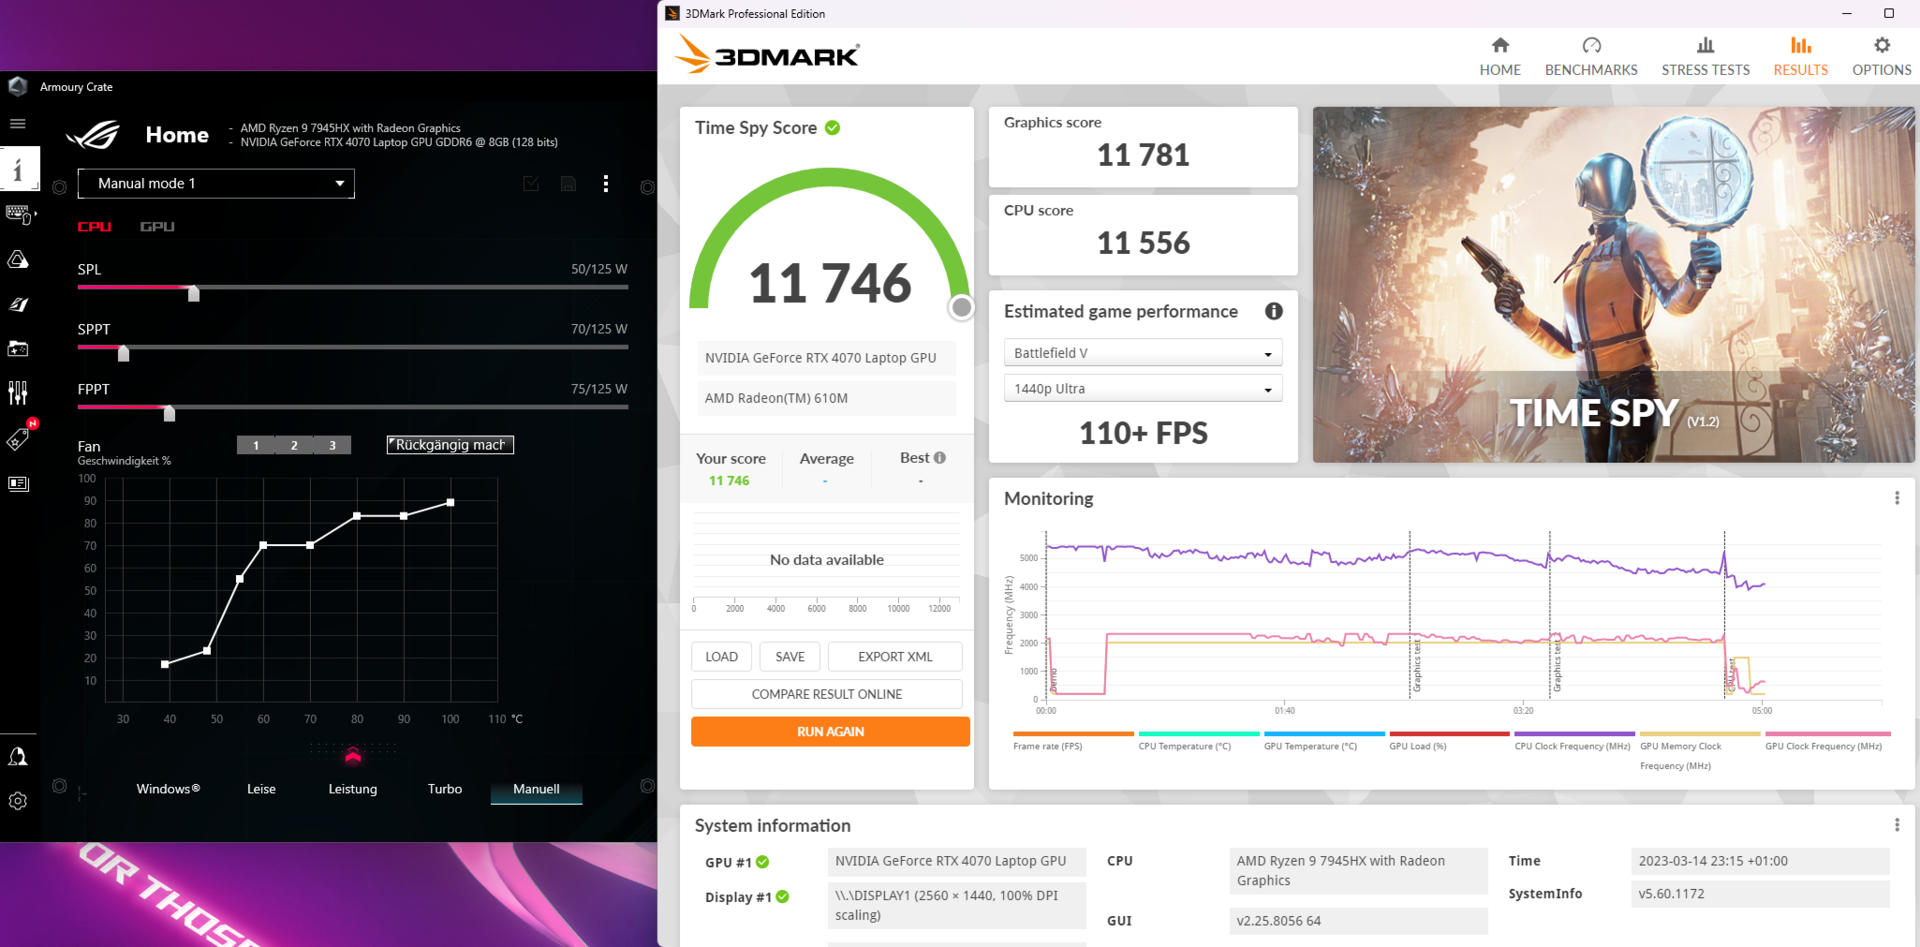
ElNvidia GeForce RTX 4070funciona en la ROG Strix G17 con el consumo máximo de 115 W permitido por el fabricante. Además, se pueden desviar otros 25 W del procesador, lo que da un total de 140 W para la GPU. Asus ha aumentado ligeramente la velocidad de reloj. El sistema especifica 2.225 MHz, mientras que según Nvidia son posibles 2.175 MHz. Esto es un aumento de algo más del 2%, que apenas marca diferencias.
La GPU se comporta como esperábamos en nuestras pruebas. Es capaz de alcanzar aproximadamente el nivel de la RTX 3080 Ti, aunque esta es capaz de consumir 35 W más de energía en el caso concreto. Así que queda por señalar que la serie RTX-4000 ha logrado un salto notable, no sólo en términos de rendimiento, sino también de eficiencia. Puedes encontrar resultados adicionales que hemos recopilado en nuestra lista de pruebas de GPU de Tarjetas gráficas moviles - lista de Benchmarks (nueva) .
| 3DMark 11 Performance | 34661 puntos | |
| 3DMark Cloud Gate Standard Score | 68557 puntos | |
| 3DMark Fire Strike Score | 28377 puntos | |
| 3DMark Time Spy Score | 11905 puntos | |
ayuda | ||
* ... más pequeño es mejor
Rendimiento en juegos
Incluso los juegos actuales pueden jugarse sin problemas en resolución QHD nativa con los ajustes de detalle máximos. Si la cantidad de píxeles que hay que computar se reduce a la mitad, como ocurre en la resolución Full-HD, las frecuencias de cuadro pueden duplicarse casi en su totalidad.
El resultado es considerable. La pantalla de 240 Hz hace brillar las altas frecuencias de cuadro, mientras que la pérdida de detalle de QHD a Full-HD es fácil de soportar. Pero la alta frecuencia de refresco también tiene ventajas a 60 fotogramas por segundo, ya que el retardo de entrada sigue reduciéndose significativamente. Esto significa que el display siempre hace justicia a sus tareas, incluso a bastante menos de 240 fps.
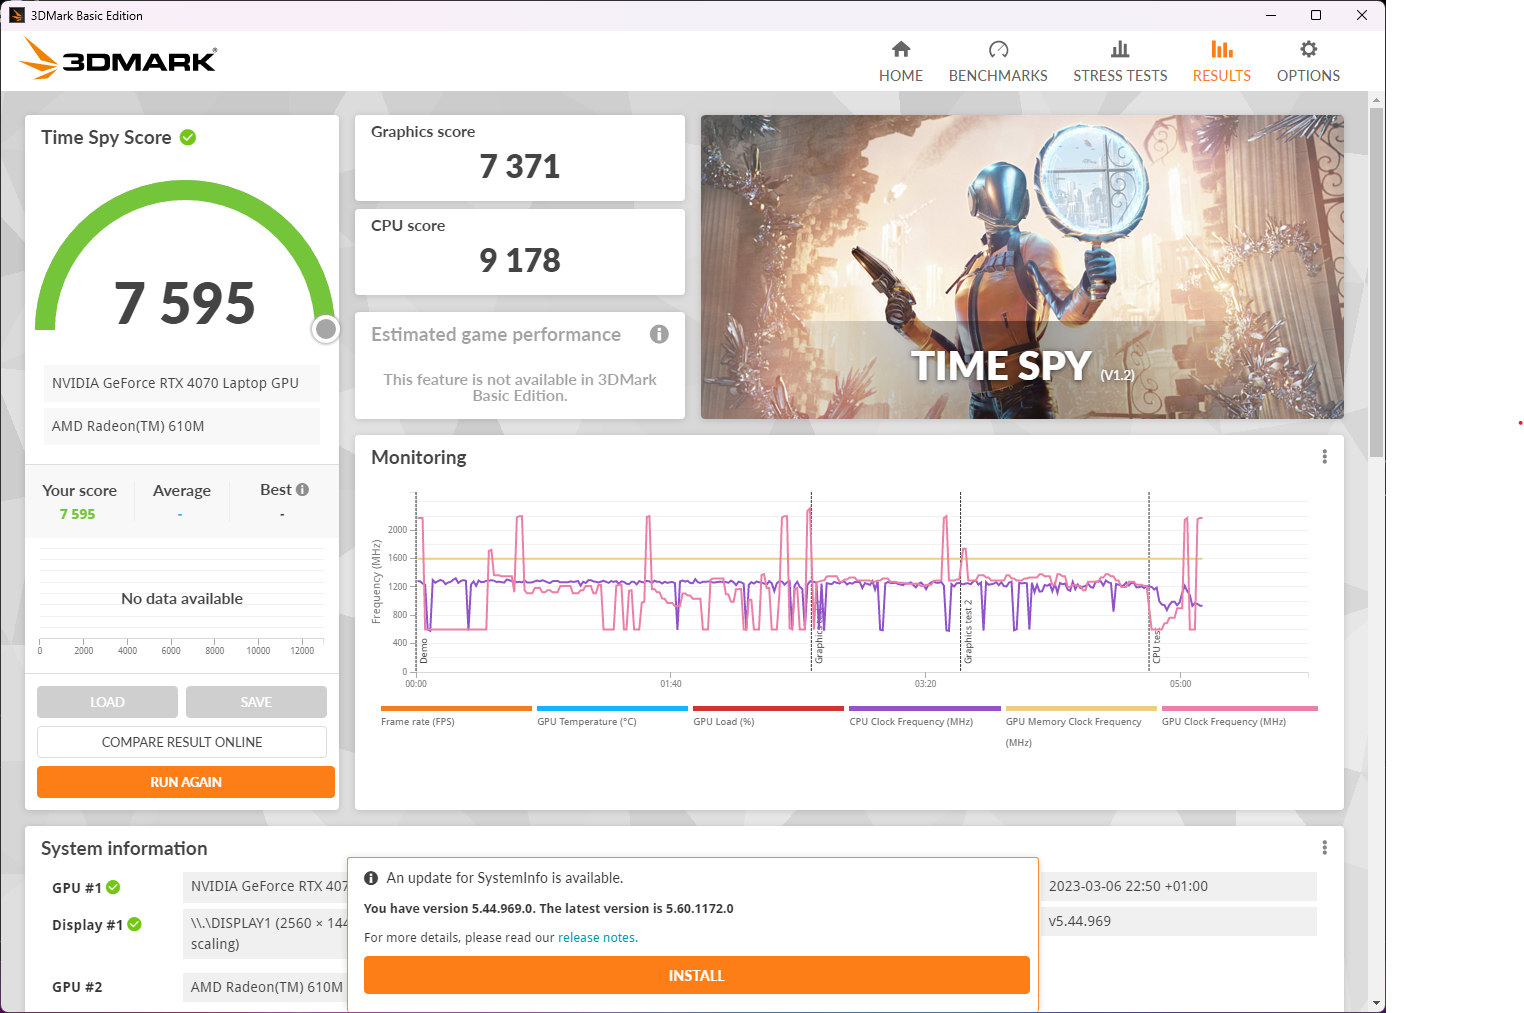
El modo Turbo apenas aporta mejoras (5% en la prueba Time-Spy), mientras que el nivel de ruido aumenta enormemente. El sistema no se comporta mal con la batería. Aunque el consumo de energía se reduce significativamente, sigue alcanzando el 65% del rendimiento en funcionamiento con red eléctrica.
El potente procesador no puede contribuir mucho a los resultados aquí. Los ajustes manuales de energía te permiten reducir su consumo a un máximo de 75 W y a 50 W constantes, sin causar un peor resultado en el benchmark. Pero este procedimiento no es realmente necesario, ya que a la CPU sólo se le permite un consumo de energía significativamente menor bajo carga constante. Si un modelo similar con un procesador más débil llega a estar disponible en algún momento en el futuro, probablemente sólo rendiría mínimamente peor en juegos, por lo que podría ser la mejor elección.
| The Witcher 3 - 1920x1080 Ultra Graphics & Postprocessing (HBAO+) | |
| Asus Zephyrus Duo 16 GX650PY-NM006W | |
| Asus ROG Strix G16 G614JZ | |
| Media de la clase Gaming (95 - 240, n=8, últimos 2 años) | |
| Alienware m17 R5 (R9 6900HX, RX 6850M XT) | |
| Asus ROG Strix G17 G713PI | |
| Asus ROG Strix G18 G814JI | |
| Asus ROG Strix Scar 17 SE G733CX-LL014W | |
| Razer Blade 18 RTX 4070 | |
| Hogwarts Legacy | |
| 1920x1080 Ultra Preset AA:High T | |
| Asus ROG Strix G16 G614JZ | |
| Asus ROG Strix G17 G713PI | |
| Asus ROG Strix G18 G814JI | |
| Media de la clase Gaming (76 - 108.3, n=2, últimos 2 años) | |
| Medio NVIDIA GeForce RTX 4070 Laptop GPU (41 - 107, n=7) | |
| 2560x1440 Ultra Preset AA:High T | |
| Asus ROG Strix G16 G614JZ | |
| Media de la clase Gaming (52 - 96.8, n=2, últimos 2 años) | |
| Asus ROG Strix G18 G814JI | |
| Medio NVIDIA GeForce RTX 4070 Laptop GPU (35 - 71, n=7) | |
| Asus ROG Strix G17 G713PI | |
El Witcher 3 funciona de forma estable a un alto nivel en la prueba de carga constante. Los valores del Asus ROG Strix Scar 17 SE con la RTX 3080 Ti son casi idénticos. Al mismo tiempo, la distancia detrás de la RTX 4090es muy grande, pero eso también va por los costes financieros.
The Witcher 3 FPS Chart
| bajo | medio | alto | ultra | QHD DLSS | QHD FSR | QHD | 4K DLSS | 4K FSR | 4K | |
|---|---|---|---|---|---|---|---|---|---|---|
| GTA V (2015) | 178.1 | 114 | ||||||||
| The Witcher 3 (2015) | 216 | 121 | ||||||||
| Dota 2 Reborn (2015) | 169.8 | 163.4 | ||||||||
| Final Fantasy XV Benchmark (2018) | 114.3 | 83.3 | ||||||||
| X-Plane 11.11 (2018) | 128.5 | |||||||||
| Far Cry 5 (2018) | 141 | 132 | 114 | |||||||
| Strange Brigade (2018) | 249 | 210 | 138.1 | |||||||
| Cyberpunk 2077 1.6 (2022) | 86 | 83.3 | 53.1 | |||||||
| F1 22 (2022) | 195.2 | 76.6 | 48.4 | |||||||
| Hogwarts Legacy (2023) | 123 | 107 | 50 | |||||||
| Baldur's Gate 3 (2023) | 164.2 | 129.3 | 114.4 | 109.4 | 110.5 | 60 | 104.7 | 71.5 | 37.2 | |
| Cyberpunk 2077 (2023) | 154.7 | 123.7 | 100.4 | 87.5 | 58.6 | 49.1 | 21.2 | 20.3 | ||
| F1 24 (2024) | 284 | 269 | 220 | 77.4 | 76.1 | 77.3 | 47.7 | 27.3 | 36.3 | 21.3 |
| Star Wars Outlaws (2024) | 40.5 | 40.2 | 29.4 | 25.5 | 15.6 | |||||
| Space Marine 2 (2024) | 84 | 79.9 | 60.7 | 45.5 | 28.9 | |||||
| Call of Duty Black Ops 6 (2024) | 91 | 73 | 96 | 67 | 41 | 38 | 38 | |||
| Stalker 2 (2024) | 49.8 | 47.2 | 35.5 | 1.358 | 1.845 | |||||
| Indiana Jones and the Great Circle (2024) | 71.5 | 28.9 | 24.7 | 15.6 | ||||||
| Kingdom Come Deliverance 2 (2025) | 58.9 | 44.6 | 35.5 | 23.4 | ||||||
| Monster Hunter Wilds (2025) | 82.4 | 63.1 | 35.6 | 35.3 | 22.9 | 16.4 | 12.5 | |||
| Civilization 7 (2025) | 121.2 | 131.8 | 72.8 | 56.4 | 30.3 | |||||
| Assassin's Creed Shadows (2025) | 63 | 55 | 48 | 31 | 37 | 35 | 26 | 22 | 22 | 16 |
Emisiones - El portátil para juegos sigue siendo muy discreto
Niveles de ruido
El ruido del ventilador resulta moderado. El Asus Zephyrus Duo 16por ejemplo, puede volverse notablemente más ruidoso. Sin embargo, si activas el modo Turbo, el ROG Strix G17 también muestra su lado ruidoso. Pero no notamos ningún aullido espontáneo al acelerar o cambios bruscos de velocidad durante nuestras pruebas.
Por otro lado, lo que sí notamos fue algo de zumbido de bobina en nuestra unidad de pruebas, aunque esto permanece relativamente silencioso y desaparece cuando se encienden los ventiladores. Cuando el sonido está activado, la mayoría de la gente no debería notarlo, pero es fácilmente audible en entornos muy silenciosos.
Ruido
| Ocioso |
| 26 / 29 / 30 dB(A) |
| Carga |
| 46 / 47 dB(A) |
 | ||
30 dB silencioso 40 dB(A) audible 50 dB(A) ruidosamente alto |
||
min: | ||
| Asus ROG Strix G17 G713PI R9 7945HX, GeForce RTX 4070 Laptop GPU | Asus ROG Strix G18 G814JI i7-13650HX, GeForce RTX 4070 Laptop GPU | Razer Blade 18 RTX 4070 i9-13950HX, GeForce RTX 4070 Laptop GPU | Asus ROG Strix Scar 17 SE G733CX-LL014W i9-12950HX, GeForce RTX 3080 Ti Laptop GPU | Asus Zephyrus Duo 16 GX650PY-NM006W R9 7945HX, GeForce RTX 4090 Laptop GPU | Alienware m17 R5 (R9 6900HX, RX 6850M XT) R9 6900HX, Radeon RX 6850M XT | Asus ROG Strix G16 G614JZ i9-13980HX, GeForce RTX 4080 Laptop GPU | |
|---|---|---|---|---|---|---|---|
| Noise | 3% | 6% | 13% | -7% | 7% | -3% | |
| apagado / medio ambiente * (dB) | 25 | 25 -0% | 23.5 6% | 23.9 4% | 23.9 4% | 23 8% | 25 -0% |
| Idle Minimum * (dB) | 26 | 26 -0% | 23.8 8% | 23.9 8% | 23.9 8% | 23 12% | 26 -0% |
| Idle Average * (dB) | 29 | 28 3% | 23.8 18% | 23.9 18% | 32.9 -13% | 28.11 3% | 28 3% |
| Idle Maximum * (dB) | 30 | 29 3% | 26.8 11% | 23.9 20% | 36.5 -22% | 28.11 6% | 30 -0% |
| Load Average * (dB) | 46 | 41 11% | 37.3 19% | 34.3 25% | 42.9 7% | 30.62 33% | 48 -4% |
| Witcher 3 ultra * (dB) | 46 | 44 4% | 48 -4% | 51.2 -11% | 49.75 -8% | 49 -7% | |
| Load Maximum * (dB) | 47 | 46 2% | 53.5 -14% | 45.9 2% | 56 -19% | 50.17 -7% | 52 -11% |
* ... más pequeño es mejor
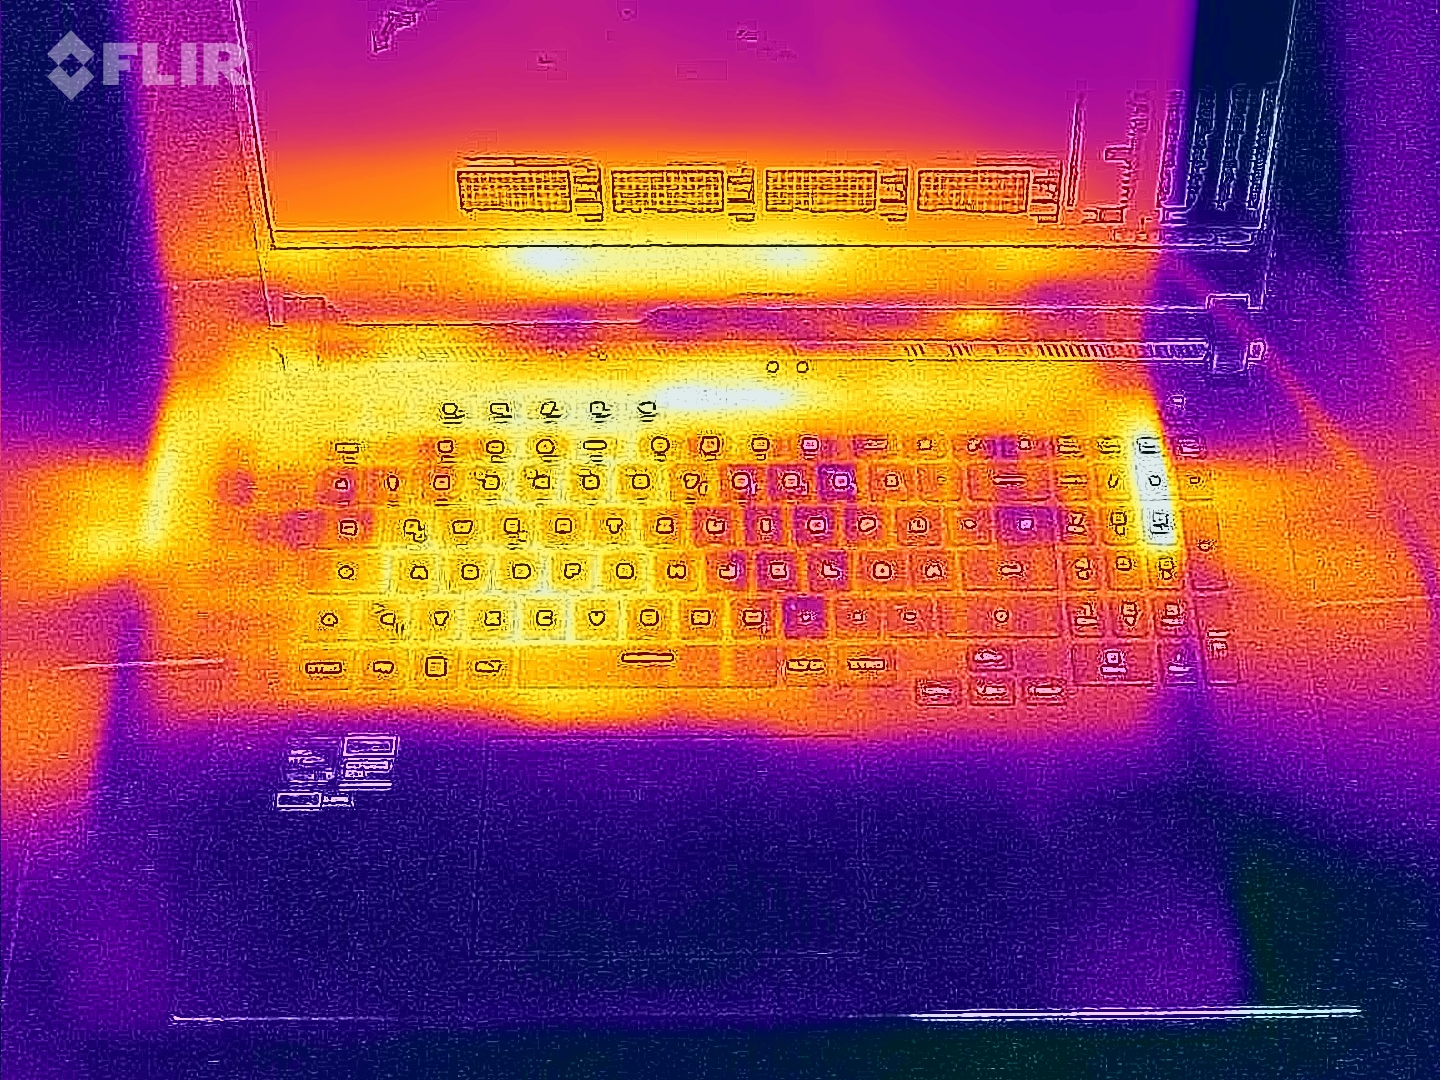
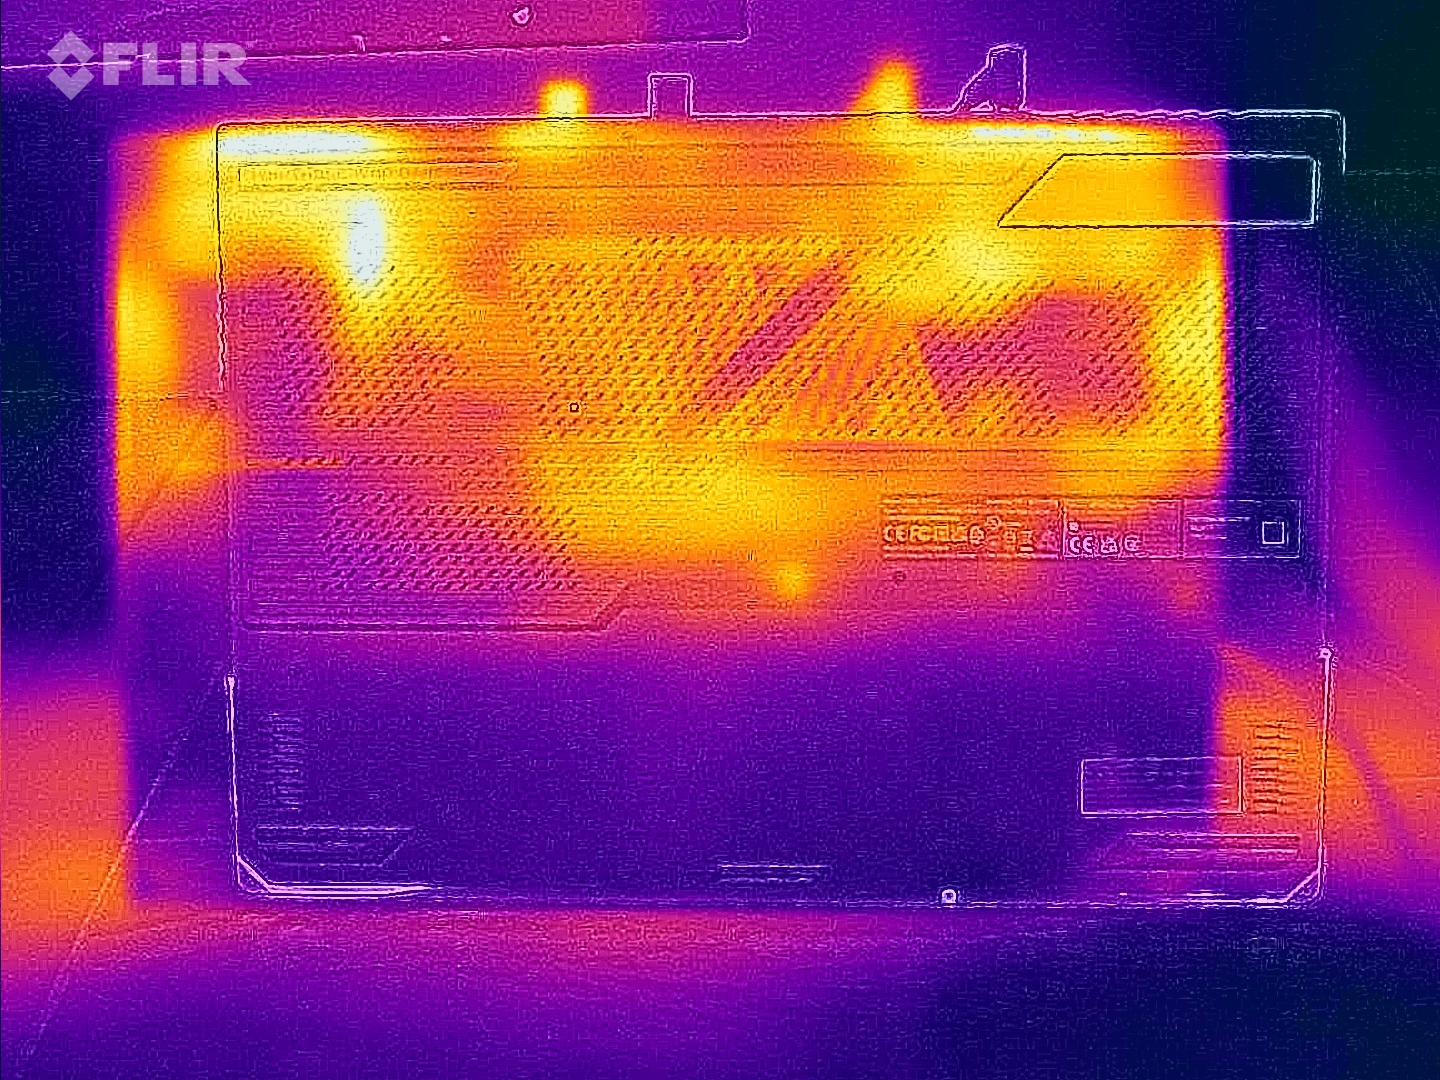
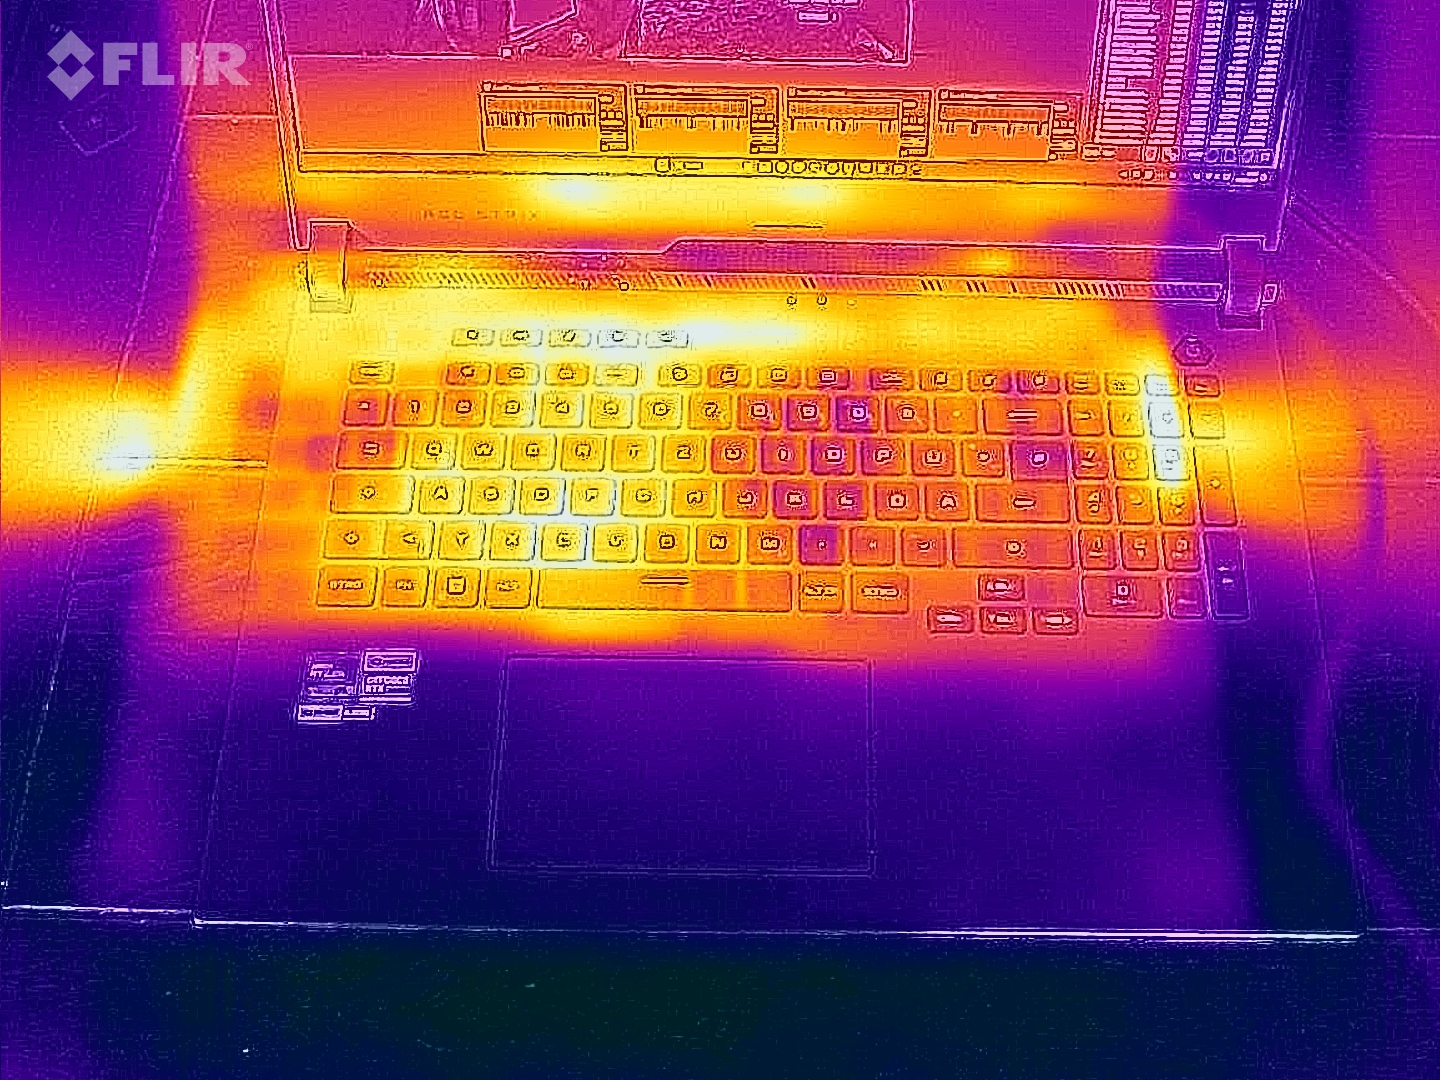
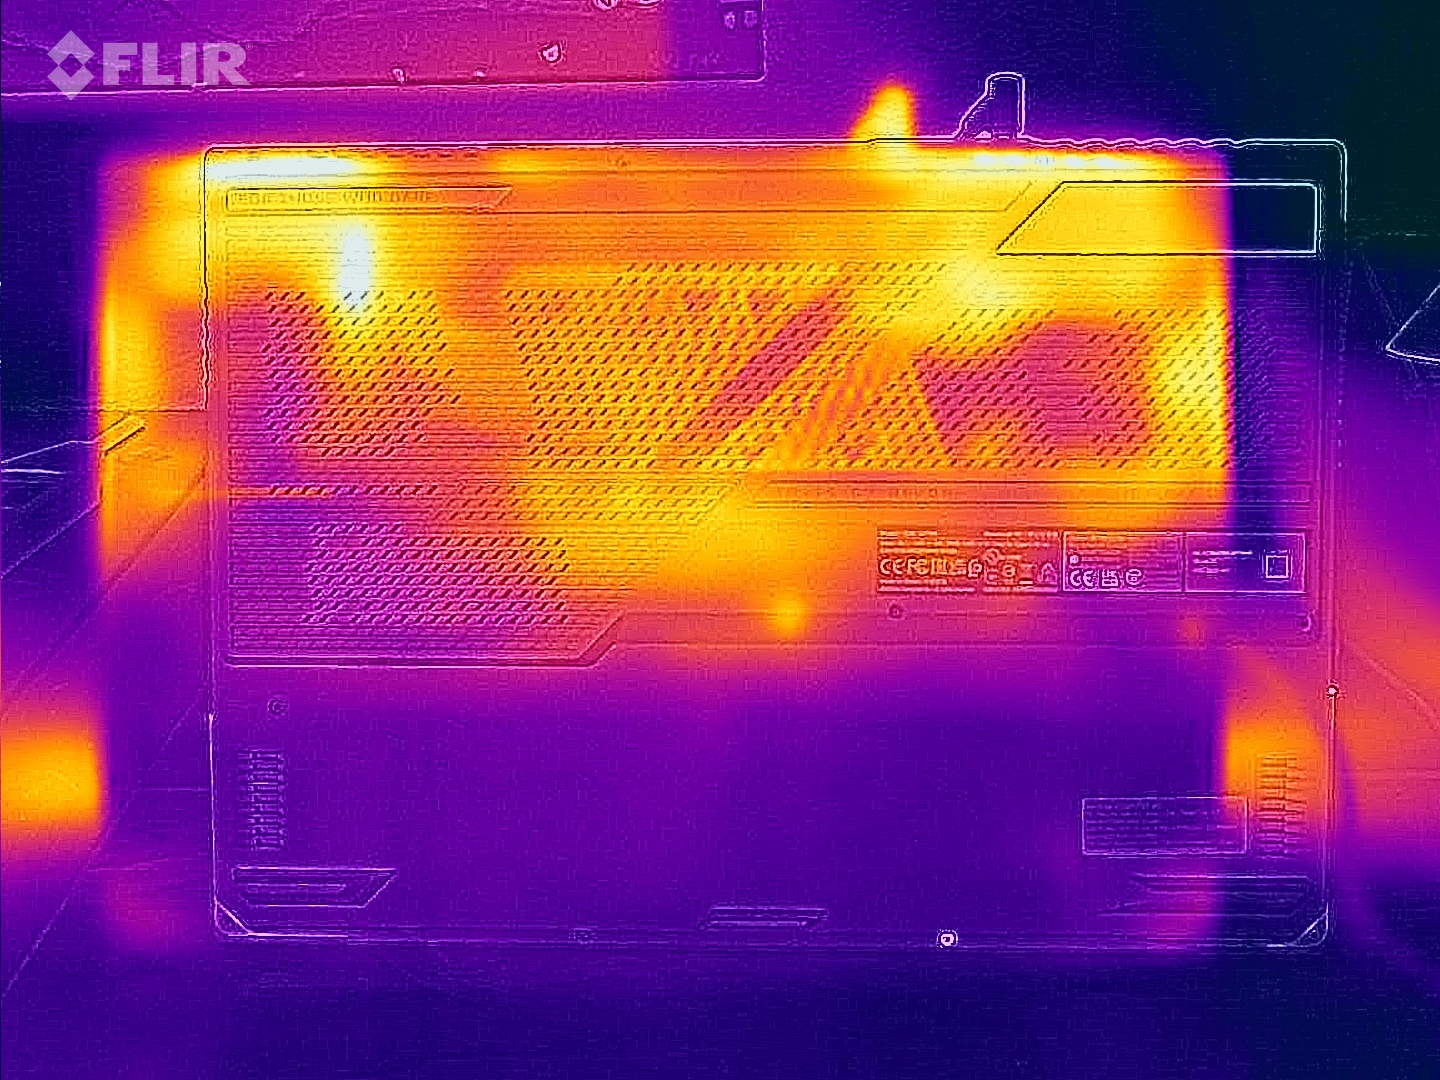
Temperaturas
El portátil para juegos casi siempre está caliente. Basta con navegar para que la temperatura aumente notablemente en la zona del teclado.
Sin embargo, no hay sorpresas incómodas en los valores máximos. Incluso bajo carga, las temperaturas superficiales sólo alcanzan algo más de 40 °C, y el reposamanos incluso se mantiene por debajo de los 30 °C. La transferencia de calor a la parte posterior de la carcasa se realiza muy bien.
(±) La temperatura máxima en la parte superior es de 42 °C / 108 F, frente a la media de 40.4 °C / 105 F, que oscila entre 21.2 y 68.8 °C para la clase Gaming.
(±) El fondo se calienta hasta un máximo de 41 °C / 106 F, frente a la media de 43.2 °C / 110 F
(+) En reposo, la temperatura media de la parte superior es de 28.8 °C / 84# F, frente a la media del dispositivo de 33.9 °C / 93 F.
(±) Jugando a The Witcher 3, la temperatura media de la parte superior es de 36.6 °C / 98 F, frente a la media del dispositivo de 33.9 °C / 93 F.
(+) El reposamanos y el panel táctil están a una temperatura inferior a la de la piel, con un máximo de 28 °C / 82.4 F y, por tanto, son fríos al tacto.
(±) La temperatura media de la zona del reposamanos de dispositivos similares fue de 28.8 °C / 83.8 F (+0.8 °C / 1.4 F).
| Asus ROG Strix G17 G713PI AMD Ryzen 9 7945HX, NVIDIA GeForce RTX 4070 Laptop GPU | Asus ROG Strix G18 G814JI Intel Core i7-13650HX, NVIDIA GeForce RTX 4070 Laptop GPU | Razer Blade 18 RTX 4070 Intel Core i9-13950HX, NVIDIA GeForce RTX 4070 Laptop GPU | Asus ROG Strix Scar 17 SE G733CX-LL014W Intel Core i9-12950HX, NVIDIA GeForce RTX 3080 Ti Laptop GPU | Asus Zephyrus Duo 16 GX650PY-NM006W AMD Ryzen 9 7945HX, NVIDIA GeForce RTX 4090 Laptop GPU | Alienware m17 R5 (R9 6900HX, RX 6850M XT) AMD Ryzen 9 6900HX, AMD Radeon RX 6850M XT | Asus ROG Strix G16 G614JZ Intel Core i9-13980HX, NVIDIA GeForce RTX 4080 Laptop GPU | |
|---|---|---|---|---|---|---|---|
| Heat | 1% | 7% | -9% | 1% | -10% | -12% | |
| Maximum Upper Side * (°C) | 42 | 45 -7% | 39.2 7% | 48.8 -16% | 44.2 -5% | 53 -26% | 54 -29% |
| Maximum Bottom * (°C) | 41 | 47 -15% | 35.6 13% | 52.4 -28% | 46.8 -14% | 56 -37% | 55 -34% |
| Idle Upper Side * (°C) | 33 | 28 15% | 31.8 4% | 30.4 8% | 29.2 12% | 30 9% | 29 12% |
| Idle Bottom * (°C) | 34 | 31 9% | 33.2 2% | 34.1 -0% | 30.2 11% | 29 15% | 33 3% |
* ... más pequeño es mejor
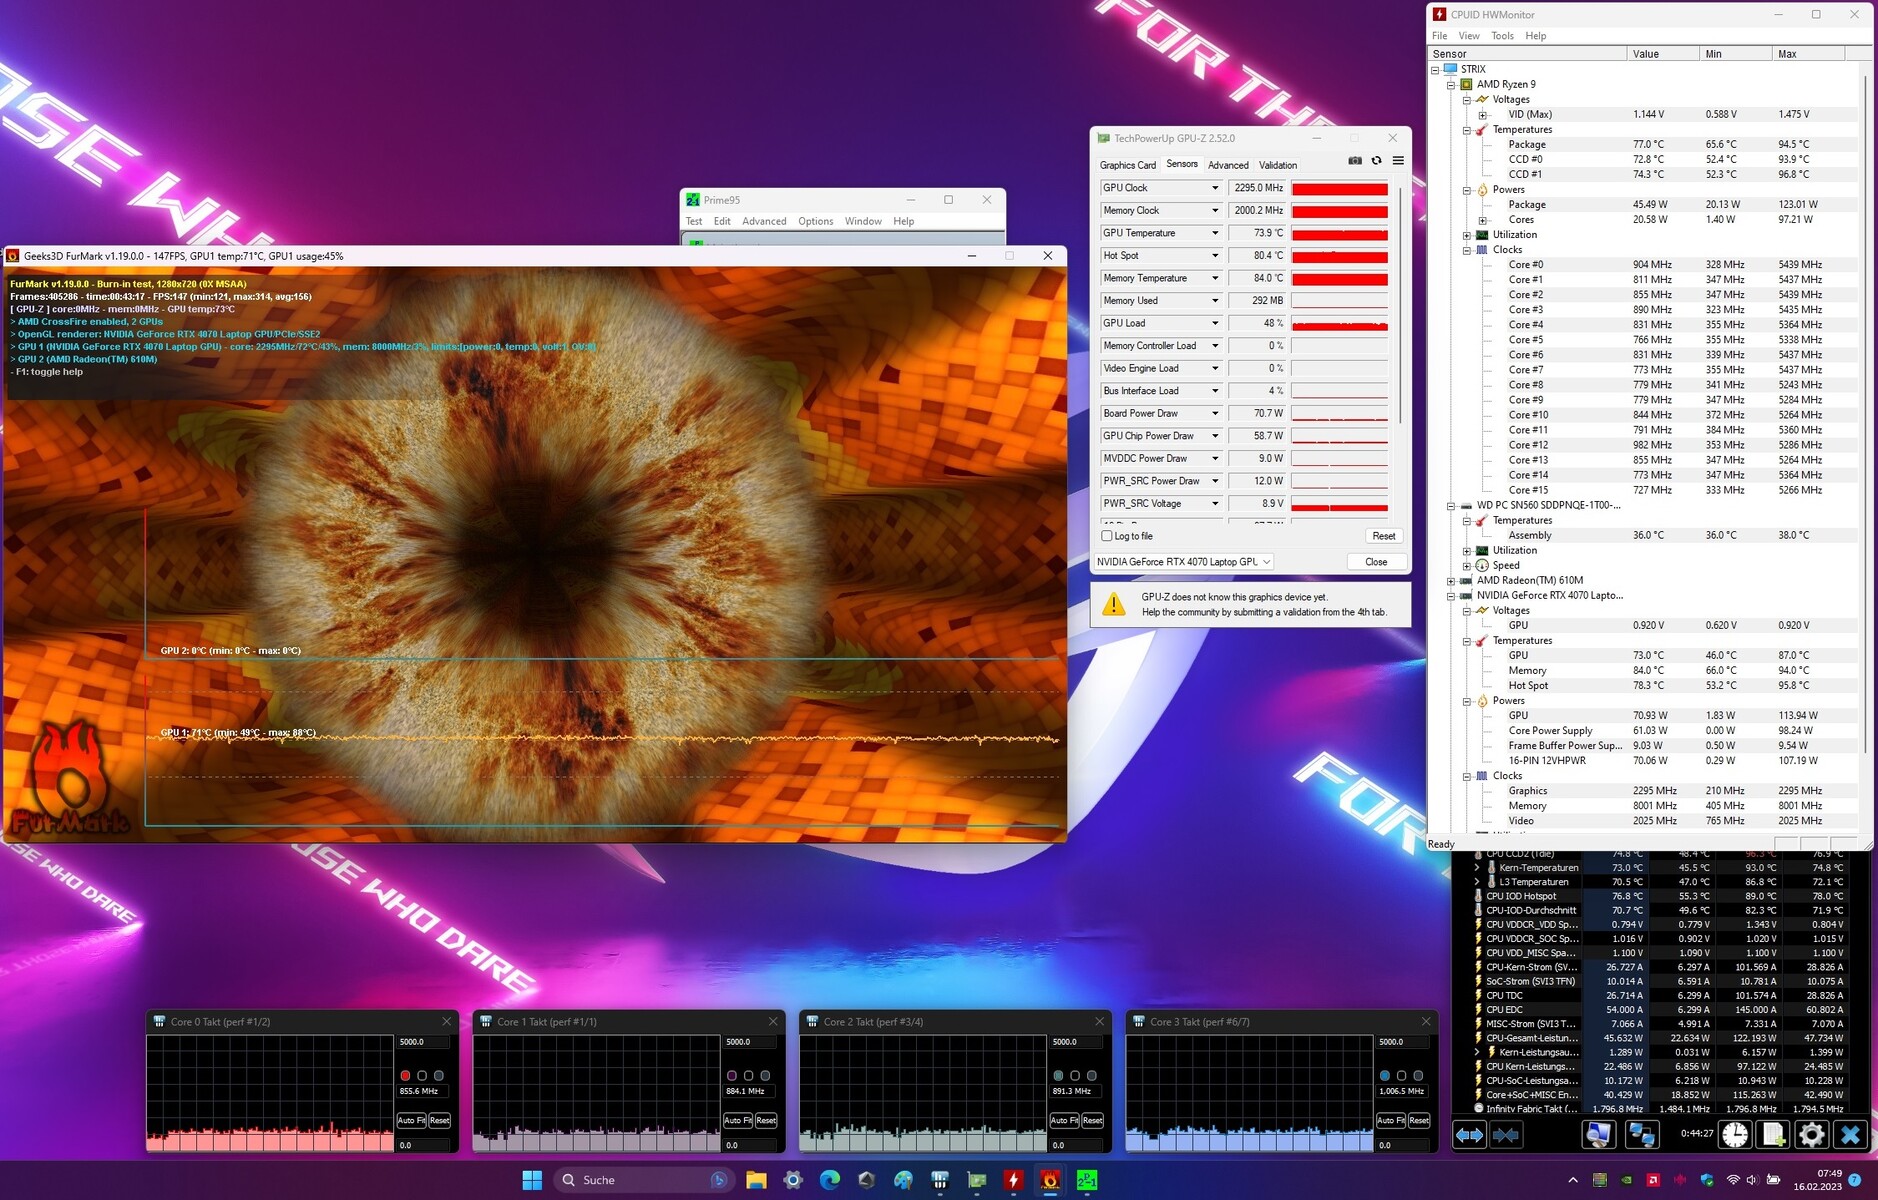
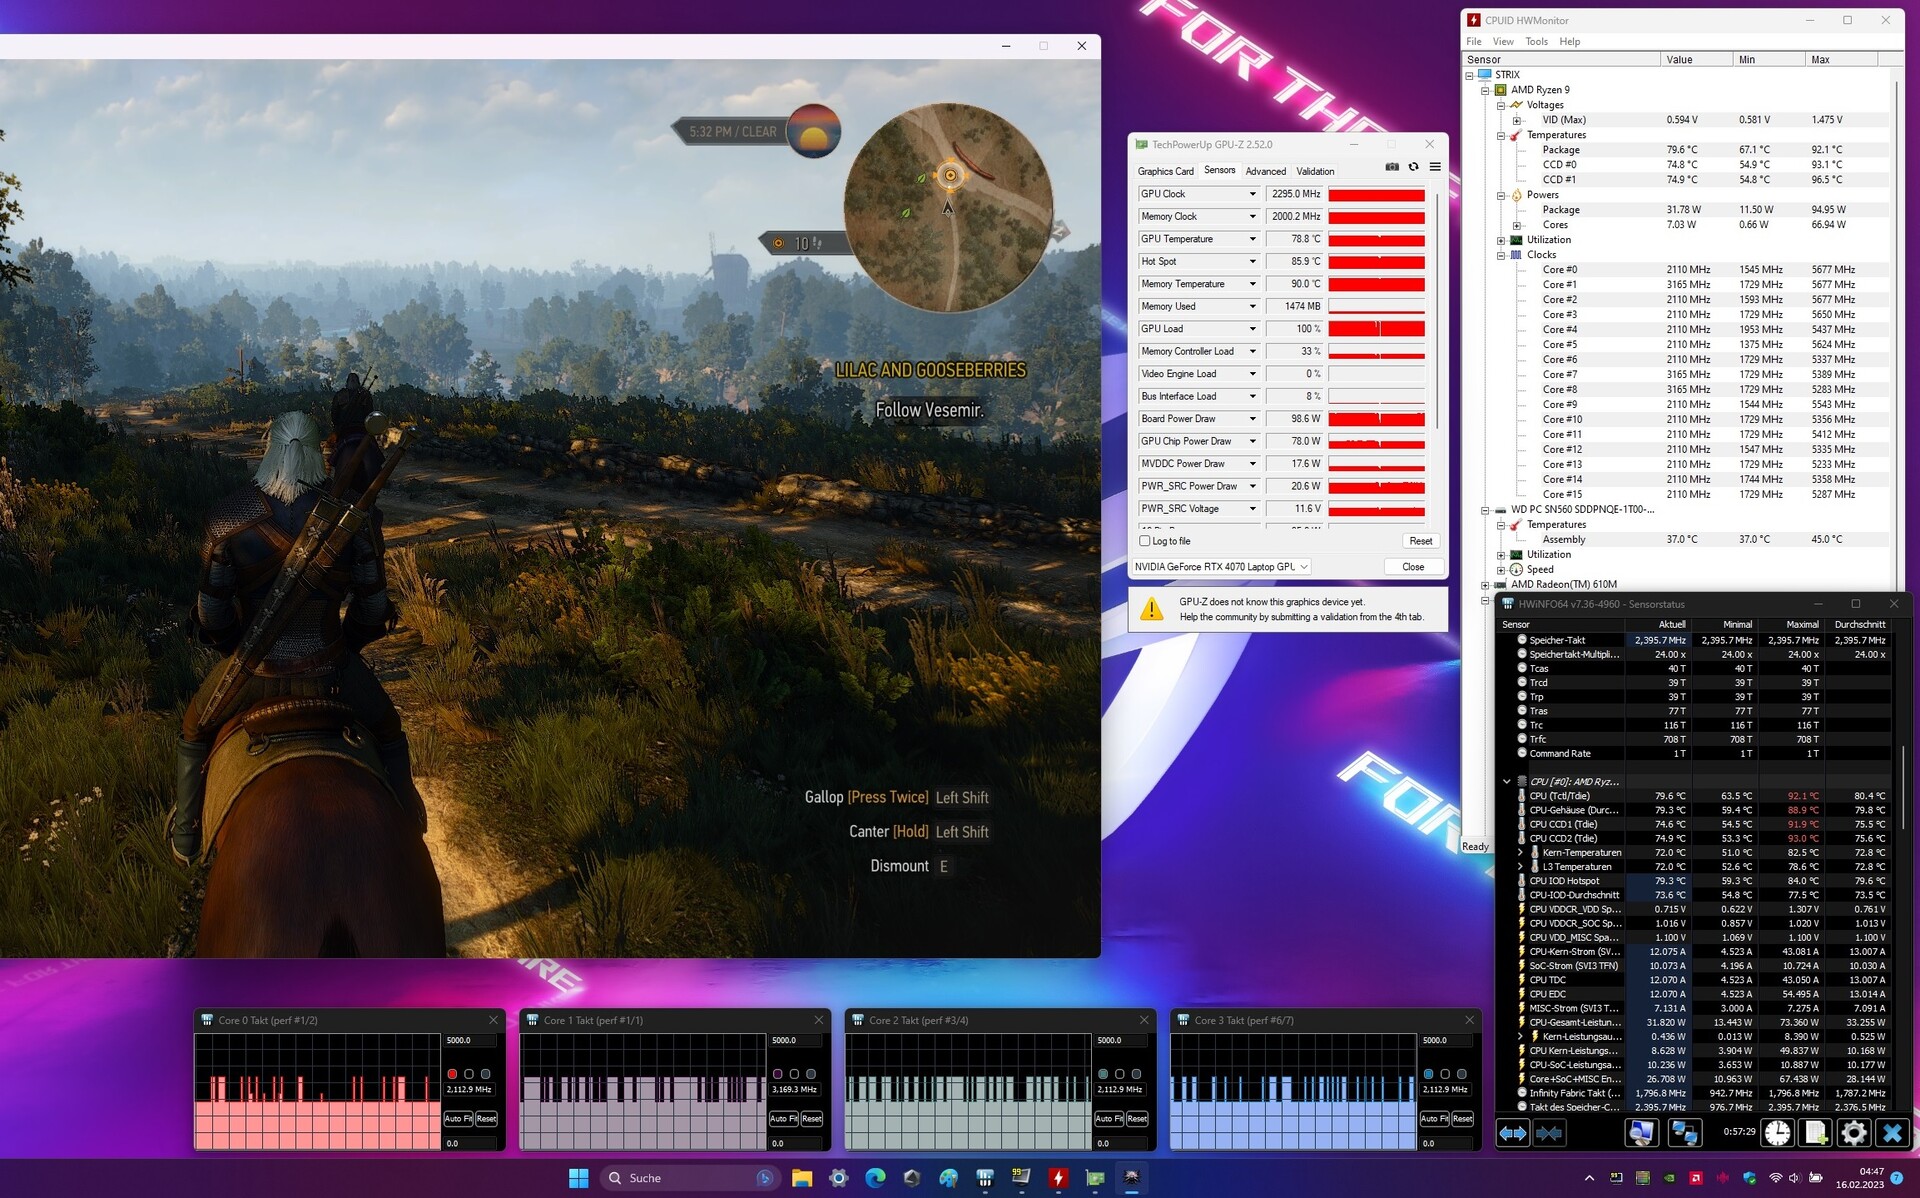
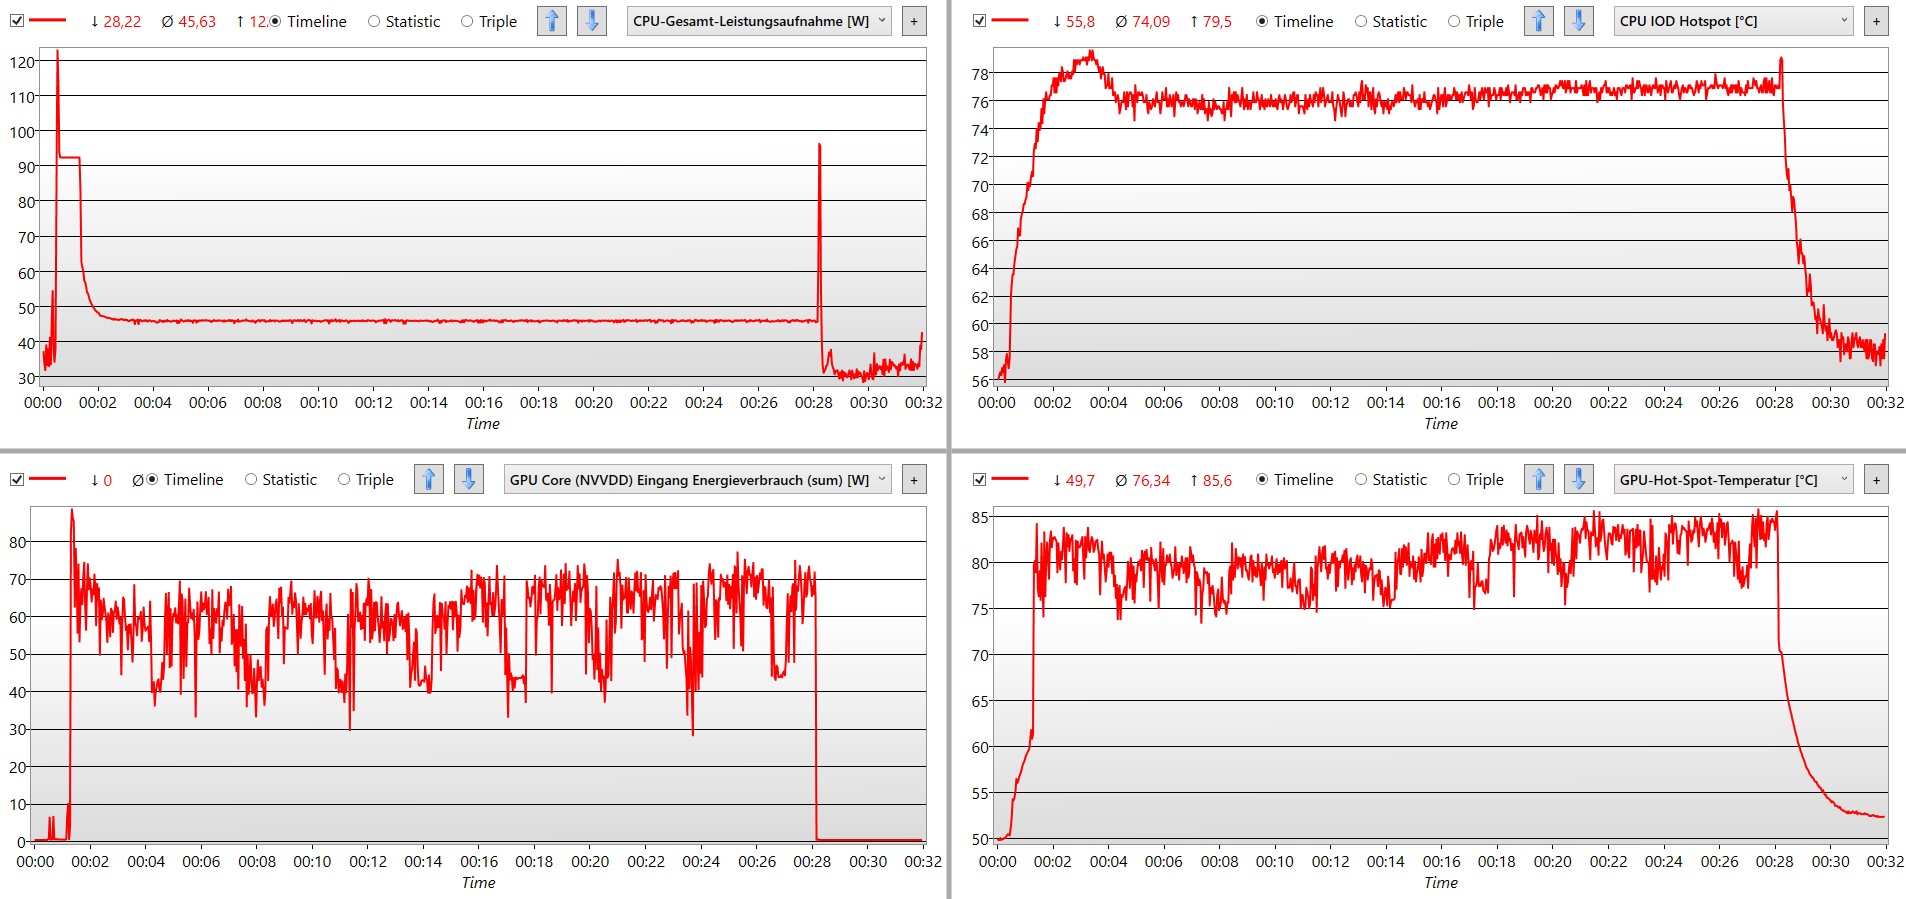
Prueba de resistencia
Tras apenas 1 minuto, el consumo de energía de la CPU se reduce drásticamente. Después, las temperaturas de la CPU y la GPU se mantienen en torno a los 70-80 °C y pueden mantenerse de forma fiable en este nivel. El consumo inicial del procesador y el chip gráfico juntos se reduce de unos 220 W a casi 100 W con carga constante.
Altavoces
Los altavoces integrados suenan realmente bien, sin mostrar ninguna debilidad en todo el espectro de frecuencias. Incluso producen unos graves especialmente impresionantes. También se oyen algunos detalles finos. Si queremos quejarnos a un nivel muy alto, podríamos decir que a los medios bajos les falta algo de pegada.
Puedes utilizar los altavoces para escuchar música, desde rock hasta clásica, para ver películas y, por supuesto, también para jugar. Sin embargo, durante estos últimos, los ventiladores audibles pueden llegar a ser molestos. El resultado es notable para un portátil, cuya calidad de sonido no suele estar predestinada para reproducir música en la mayoría de los casos. Asus demuestra con el ROG Strix G17 que esto se puede hacer significativamente mejor.
Asus ROG Strix G17 G713PI análisis de audio
(±) | la sonoridad del altavoz es media pero buena (81 dB)
Graves 100 - 315 Hz
(+) | buen bajo - sólo 4.6% lejos de la mediana
(+) | el bajo es lineal (6.5% delta a la frecuencia anterior)
Medios 400 - 2000 Hz
(+) | medios equilibrados - a sólo 3.1% de la mediana
(+) | los medios son lineales (5.9% delta a la frecuencia anterior)
Altos 2 - 16 kHz
(+) | máximos equilibrados - a sólo 3.5% de la mediana
(+) | los máximos son lineales (6.8% delta a la frecuencia anterior)
Total 100 - 16.000 Hz
(+) | el sonido global es lineal (9.5% de diferencia con la mediana)
En comparación con la misma clase
» 3% de todos los dispositivos probados de esta clase eran mejores, 1% similares, 95% peores
» El mejor tuvo un delta de 6%, la media fue 18%, el peor fue ###max##%
En comparación con todos los dispositivos probados
» 4% de todos los dispositivos probados eran mejores, 1% similares, 95% peores
» El mejor tuvo un delta de 4%, la media fue 24%, el peor fue ###max##%
Apple MacBook Pro 16 2021 M1 Pro análisis de audio
(+) | los altavoces pueden reproducir a un volumen relativamente alto (#84.7 dB)
Graves 100 - 315 Hz
(+) | buen bajo - sólo 3.8% lejos de la mediana
(+) | el bajo es lineal (5.2% delta a la frecuencia anterior)
Medios 400 - 2000 Hz
(+) | medios equilibrados - a sólo 1.3% de la mediana
(+) | los medios son lineales (2.1% delta a la frecuencia anterior)
Altos 2 - 16 kHz
(+) | máximos equilibrados - a sólo 1.9% de la mediana
(+) | los máximos son lineales (2.7% delta a la frecuencia anterior)
Total 100 - 16.000 Hz
(+) | el sonido global es lineal (4.6% de diferencia con la mediana)
En comparación con la misma clase
» 0% de todos los dispositivos probados de esta clase eran mejores, 0% similares, 100% peores
» El mejor tuvo un delta de 5%, la media fue 17%, el peor fue ###max##%
En comparación con todos los dispositivos probados
» 0% de todos los dispositivos probados eran mejores, 0% similares, 100% peores
» El mejor tuvo un delta de 4%, la media fue 24%, el peor fue ###max##%
Gestión de energía - ROG Strix siempre con un alto consumo
Consumo de energía
En ningún momento el portátil de juegos es realmente eficiente. Incluso sin realizar ninguna tarea explícita, consume casi 20 W. El pico del consumo de energía aumenta hasta unos 250 W. Con esto, la fuente de alimentación bastante grande de 280 W ofrece reservas suficientes en todos los casos.
Echando un vistazo alAsus ROG Strix Scar 17 SEque rinde a la altura de los ojos en nuestras pruebas de rendimiento a pesar de que su CPU y GPU ya no son del todo actuales, también es interesante: Al ejecutar The Witcher 3, donde también alcanza casi idénticos fps, su consumo de energía es un 25% superior. Así que, al menos bajo carga elevada, nuestra unidad de pruebas ROG Strix G17 es eficiente.
| Off / Standby | |
| Ocioso | |
| Carga |
|
Clave:
min: | |
| Asus ROG Strix G17 G713PI R9 7945HX, GeForce RTX 4070 Laptop GPU | Asus ROG Strix G18 G814JI i7-13650HX, GeForce RTX 4070 Laptop GPU | Razer Blade 18 RTX 4070 i9-13950HX, GeForce RTX 4070 Laptop GPU | Asus ROG Strix Scar 17 SE G733CX-LL014W i9-12950HX, GeForce RTX 3080 Ti Laptop GPU | Alienware m17 R5 (R9 6900HX, RX 6850M XT) R9 6900HX, Radeon RX 6850M XT | Asus ROG Strix G16 G614JZ i9-13980HX, GeForce RTX 4080 Laptop GPU | Media de la clase Gaming | |
|---|---|---|---|---|---|---|---|
| Power Consumption | 15% | -39% | -20% | 10% | -4% | 8% | |
| Idle Minimum * (Watt) | 15 | 8 47% | 24.5 -63% | 19.3 -29% | 13 13% | 10 33% | 13.1 ? 13% |
| Idle Average * (Watt) | 20 | 15 25% | 34.1 -71% | 26.5 -33% | 16.5 17% | 16 20% | 18.8 ? 6% |
| Idle Maximum * (Watt) | 29 | 26 10% | 47.7 -64% | 27.1 7% | 17 41% | 27 7% | 24.4 ? 16% |
| Load Average * (Watt) | 121 | 102 16% | 140 -16% | 141 -17% | 93 23% | 129 -7% | 108.5 ? 10% |
| Witcher 3 ultra * (Watt) | 179.8 | 178.6 1% | 202 -12% | 225 -25% | 239 -33% | 247 -37% | |
| Load Maximum * (Watt) | 246 | 267 -9% | 261 -6% | 307.9 -25% | 251 -2% | 342 -39% | 254 ? -3% |
* ... más pequeño es mejor
Power Consumption The Witcher 3 / Stress Test
Power Consumption with External Monitor
Duración de la batería
Largos periodos de funcionamiento de la batería definitivamente no son parte del plan, a pesar de la gran batería de 90-Wh. El ROG Strix G17 queda incluso por debajo de los valores medios de la clase de portátiles de juego, que ya son muy bajos, durando apenas 4 horas en nuestro test WLAN con un brillo de pantalla limitado.
Podría ser posible alcanzar una duración medianamente usable con algunos ajustes manuales. Al menos, Asus muestra que son posibles duraciones mucho mayores con el ROG Strix G16que es igual de potente y ofrece la misma capacidad de batería.
Por cierto, desactivar la dGPU no llevó a una mejora notable de los resultados. Con los ajustes usados aquí, el uso móvil del portátil apenas tiene sentido, particularmente dado que sólo fue capaz de reproducir un vídeo Full-HD en modo avión durante menos de 3 horas.
| Asus ROG Strix G17 G713PI R9 7945HX, GeForce RTX 4070 Laptop GPU, 90 Wh | Asus ROG Strix G18 G814JI i7-13650HX, GeForce RTX 4070 Laptop GPU, 90 Wh | Razer Blade 18 RTX 4070 i9-13950HX, GeForce RTX 4070 Laptop GPU, 91.7 Wh | Asus ROG Strix Scar 17 SE G733CX-LL014W i9-12950HX, GeForce RTX 3080 Ti Laptop GPU, 90 Wh | Alienware m17 R5 (R9 6900HX, RX 6850M XT) R9 6900HX, Radeon RX 6850M XT, 97 Wh | Asus ROG Strix G16 G614JZ i9-13980HX, GeForce RTX 4080 Laptop GPU, 90 Wh | Media de la clase Gaming | |
|---|---|---|---|---|---|---|---|
| Duración de Batería | 54% | 12% | -2% | 56% | 68% | 101% | |
| H.264 (h) | 2.8 | 4.9 75% | 8.26 ? 195% | ||||
| WiFi v1.3 (h) | 4.3 | 8.1 88% | 4 -7% | 4.2 -2% | 4.8 12% | 9.7 126% | 6.98 ? 62% |
| Witcher 3 ultra (h) | 1.1 | ||||||
| Load (h) | 1 | 1.2 20% | 1.3 30% | 1.8 80% | 1.1 10% | 1.47 ? 47% |
Pro
Contra
Veredicto - Un paquete completo para jugar
Desde el extraordinario rendimiento de la CPU hasta las sólidas pruebas de juego al nivel de una RTX 3080 Tiel ROG Strix G17 no muestra ninguna debilidad. Con esto, las expectativas sobre la nueva Nvidia GeForce RTX 4070se cumplen. El potente chip de gama media computa al nivel de una tarjeta gráfica premium de la generación anterior (pero debido a solo 8 GB de VRAM no está muy preparada para el futuro). Gracias a la R9 7945HXel portátil para juegos es capaz de jugar al máximo nivel con su alto rendimiento informático.
La pantalla también está a la altura de este rendimiento. Con su precisa reproducción del color, la resolución QHD, y la tasa de refresco de 240-Hz que encaja con el rendimiento del sistema, parece casi hecho a medida. El débil brillo apenas marca diferencias al usarlo en el escritorio. La iluminación también es visualmente atractiva. No llevará mucho tiempo encontrar una opción de iluminación individual que incluso ofrezca información sobre el estado del sistema.
Sus principales debilidades no marcan ninguna diferencia al jugar. Esto hace del Asus ROG Strix G17 un portátil para juegos que es exitoso en todas partes, pero también sólo debe ser usado de esa manera.
La construcción del portátil también parece bien pensada. El ruido del ventilador y el desarrollo de calor son moderados para el segmento gaming. Con una ranura libre para un SSD y accesibilidad sin complicaciones a las entrañas, no hay nada que impida realizar tareas de mantenimiento o reemplazar componentes importantes.
Afortunadamente, sólo encontramos puntos débiles en áreas que no afectan al rendimiento de juego. Las conexiones USB son decepcionantes, ya que un máximo de 10 Gbit/s queda muy por debajo de las posibilidades actuales de USB4 (que tampoco es compatible). La webcam HD ya no parece actualizada. Además, a pesar de una capacidad de batería suficiente, la duración de la batería sigue estando por debajo de la media incluso para un portátil de juegos.
Aunque esto reduce las cualidades del ROG Strix G17 como todoterreno, no cambia nada sobre la idoneidad para jugar a juegos actuales. En comparación, el Razer Blade 18parece más adecuado en general, ofreciendo Thunderbolt 4, una pantalla más brillante, y un rendimiento por lo demás comparable e idéntico chip gráfico. Al mismo tiempo, también es mucho más caro sin ofrecer ninguna ganancia en el rendimiento del sistema, por lo que realmente sólo representa una alternativa si necesitas un portátil más versátil.
Por otro lado, si el Asus ROG Strix G17 llegara a estar disponible con un procesador ligeramente más pequeño en el futuro, sería con toda probabilidad el competidor más cercano, siempre que el sistema se use casi exclusivamente para jugar.
Precio y disponibilidad
En EE.UU., el Asus ROG Strix G17 (2023) G713 está disponible en la tienda web de Asus a partir de 1799,99 $.
Asus ROG Strix G17 G713PI
- 03/16/2023 v7 (old)
Mario Petzold
Transparencia
La selección de los dispositivos que se van a reseñar corre a cargo de nuestro equipo editorial. La muestra de prueba fue proporcionada al autor en calidad de préstamo por el fabricante o el minorista a los efectos de esta reseña. El prestamista no tuvo ninguna influencia en esta reseña, ni el fabricante recibió una copia de la misma antes de su publicación. No había ninguna obligación de publicar esta reseña. Como empresa de medios independiente, Notebookcheck no está sujeta a la autoridad de fabricantes, minoristas o editores.
Así es como prueba Notebookcheck
Cada año, Notebookcheck revisa de forma independiente cientos de portátiles y smartphones utilizando procedimientos estandarizados para asegurar que todos los resultados son comparables. Hemos desarrollado continuamente nuestros métodos de prueba durante unos 20 años y hemos establecido los estándares de la industria en el proceso. En nuestros laboratorios de pruebas, técnicos y editores experimentados utilizan equipos de medición de alta calidad. Estas pruebas implican un proceso de validación en varias fases. Nuestro complejo sistema de clasificación se basa en cientos de mediciones y puntos de referencia bien fundamentados, lo que mantiene la objetividad.Price comparison

