Análisis del mini PC Maxtang MTN-FP750: AMD Ryzen 7 7735HS ralentizado por una configuración mal concebida

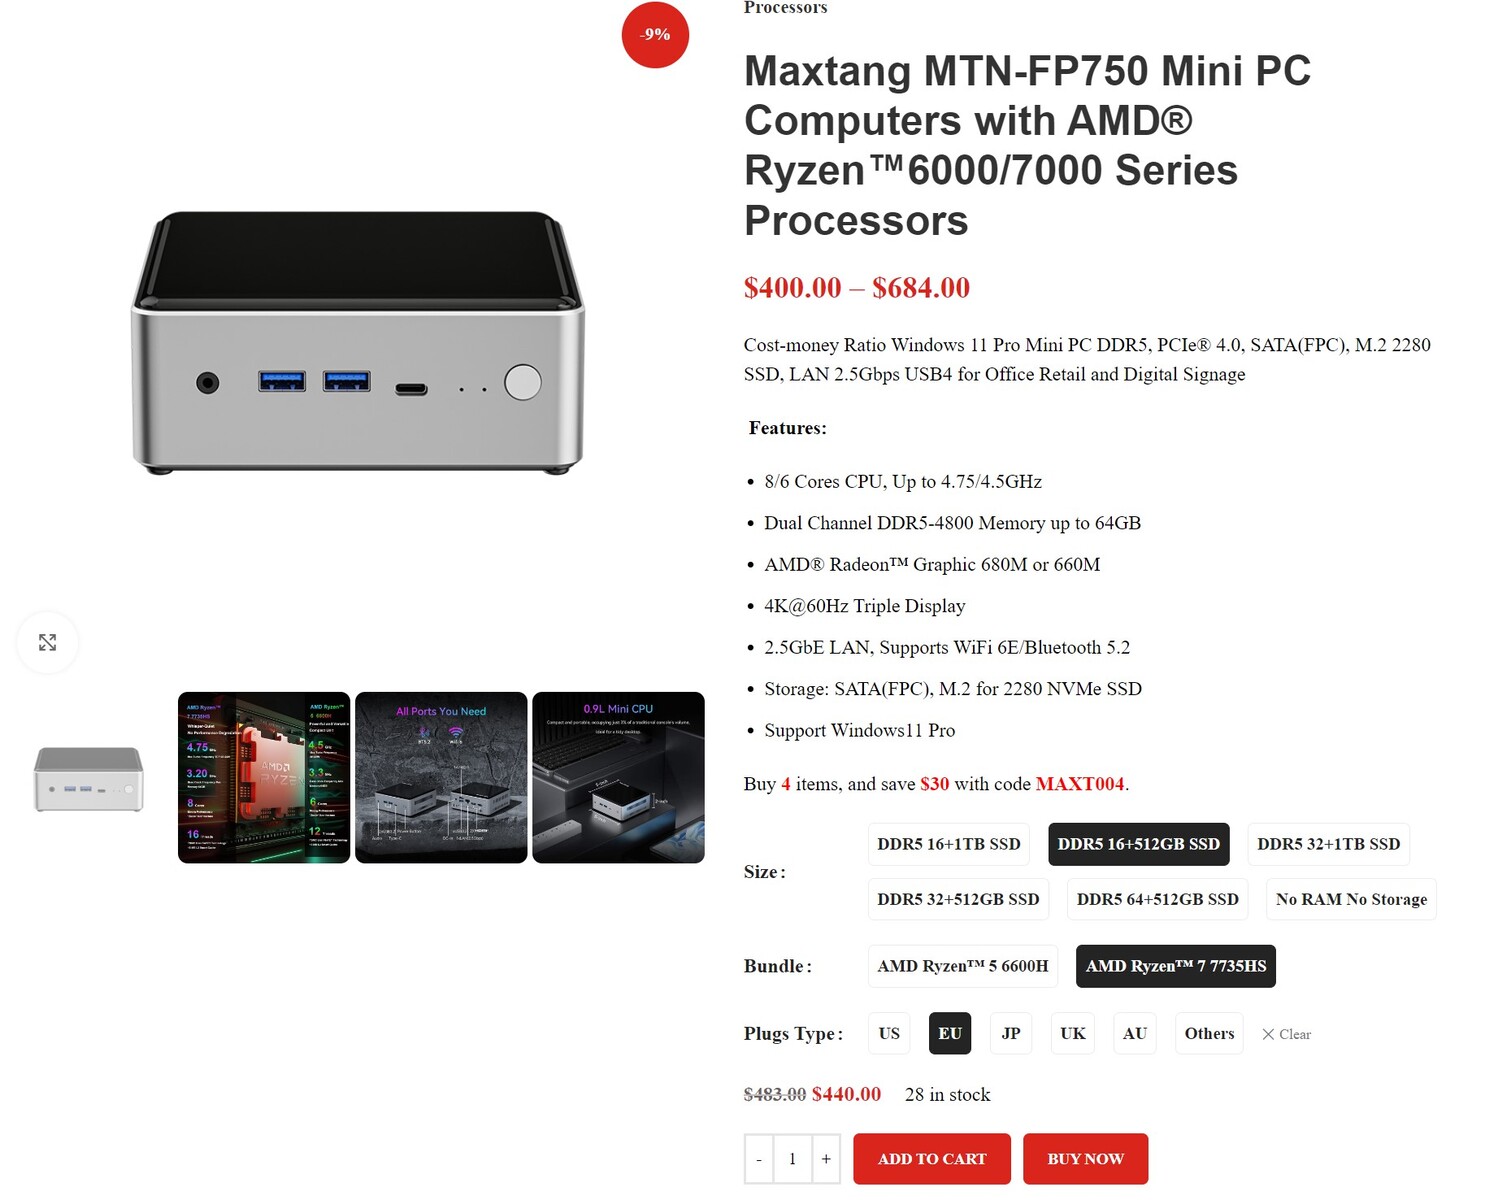
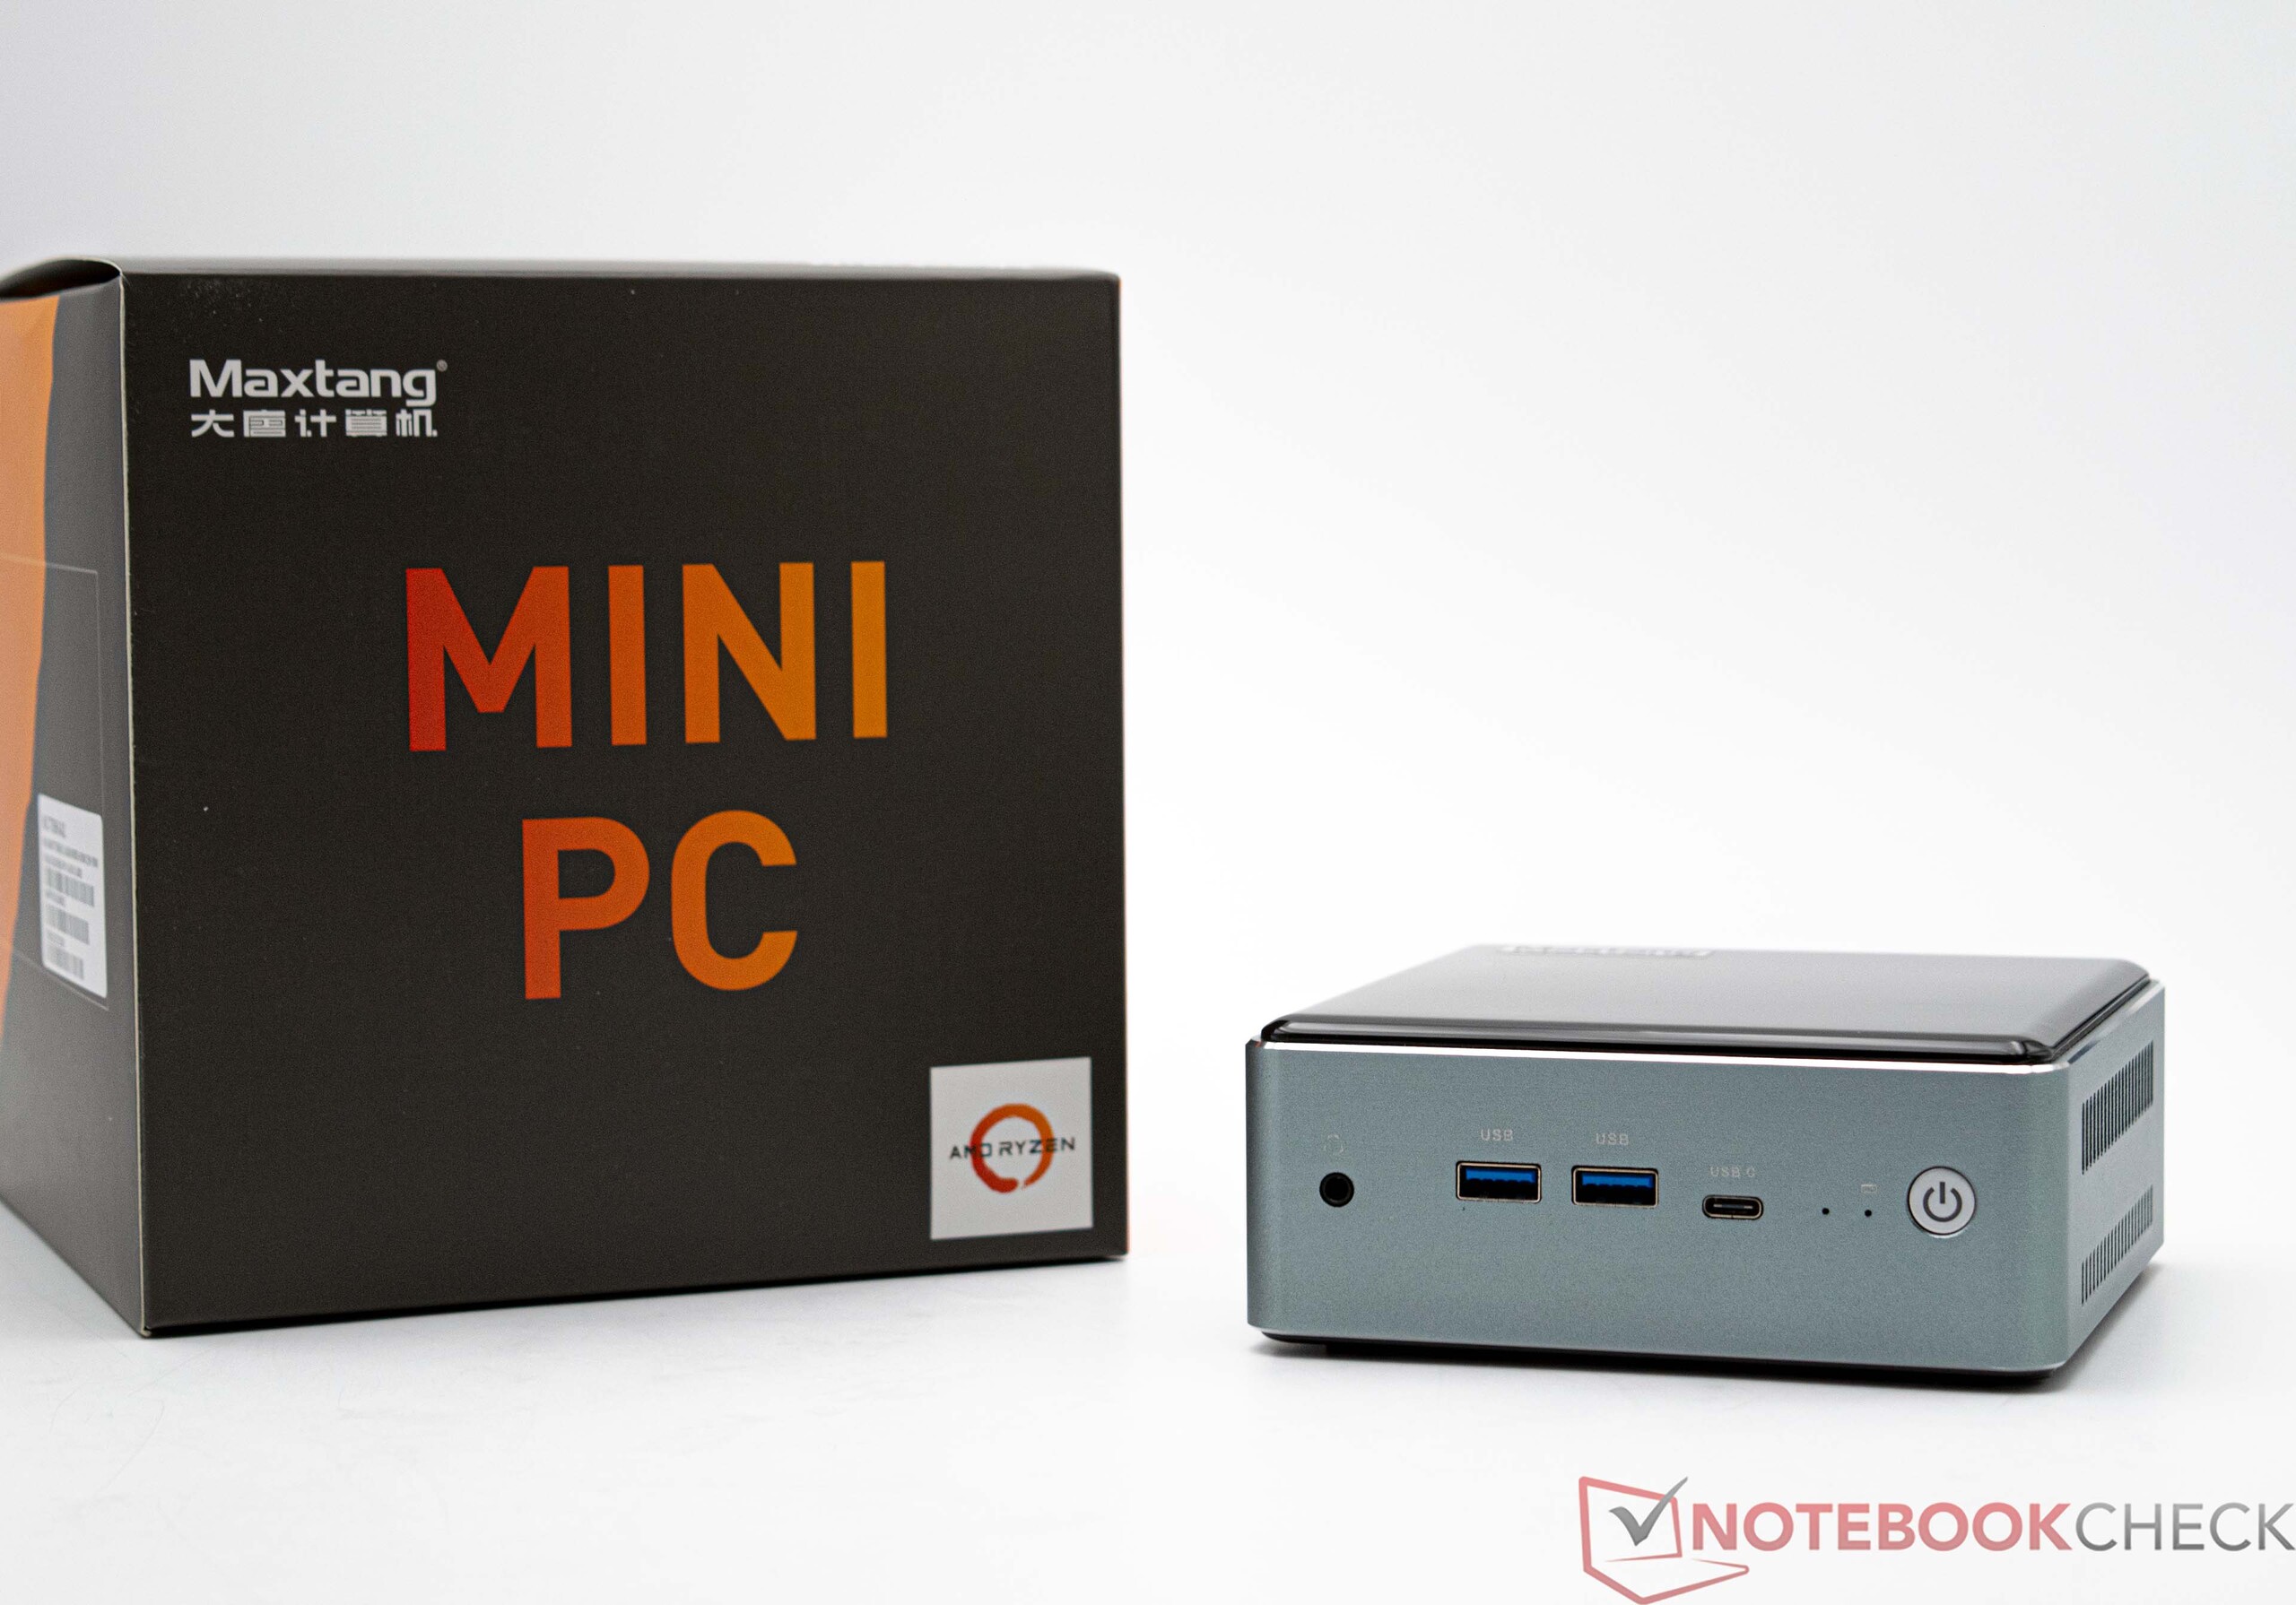
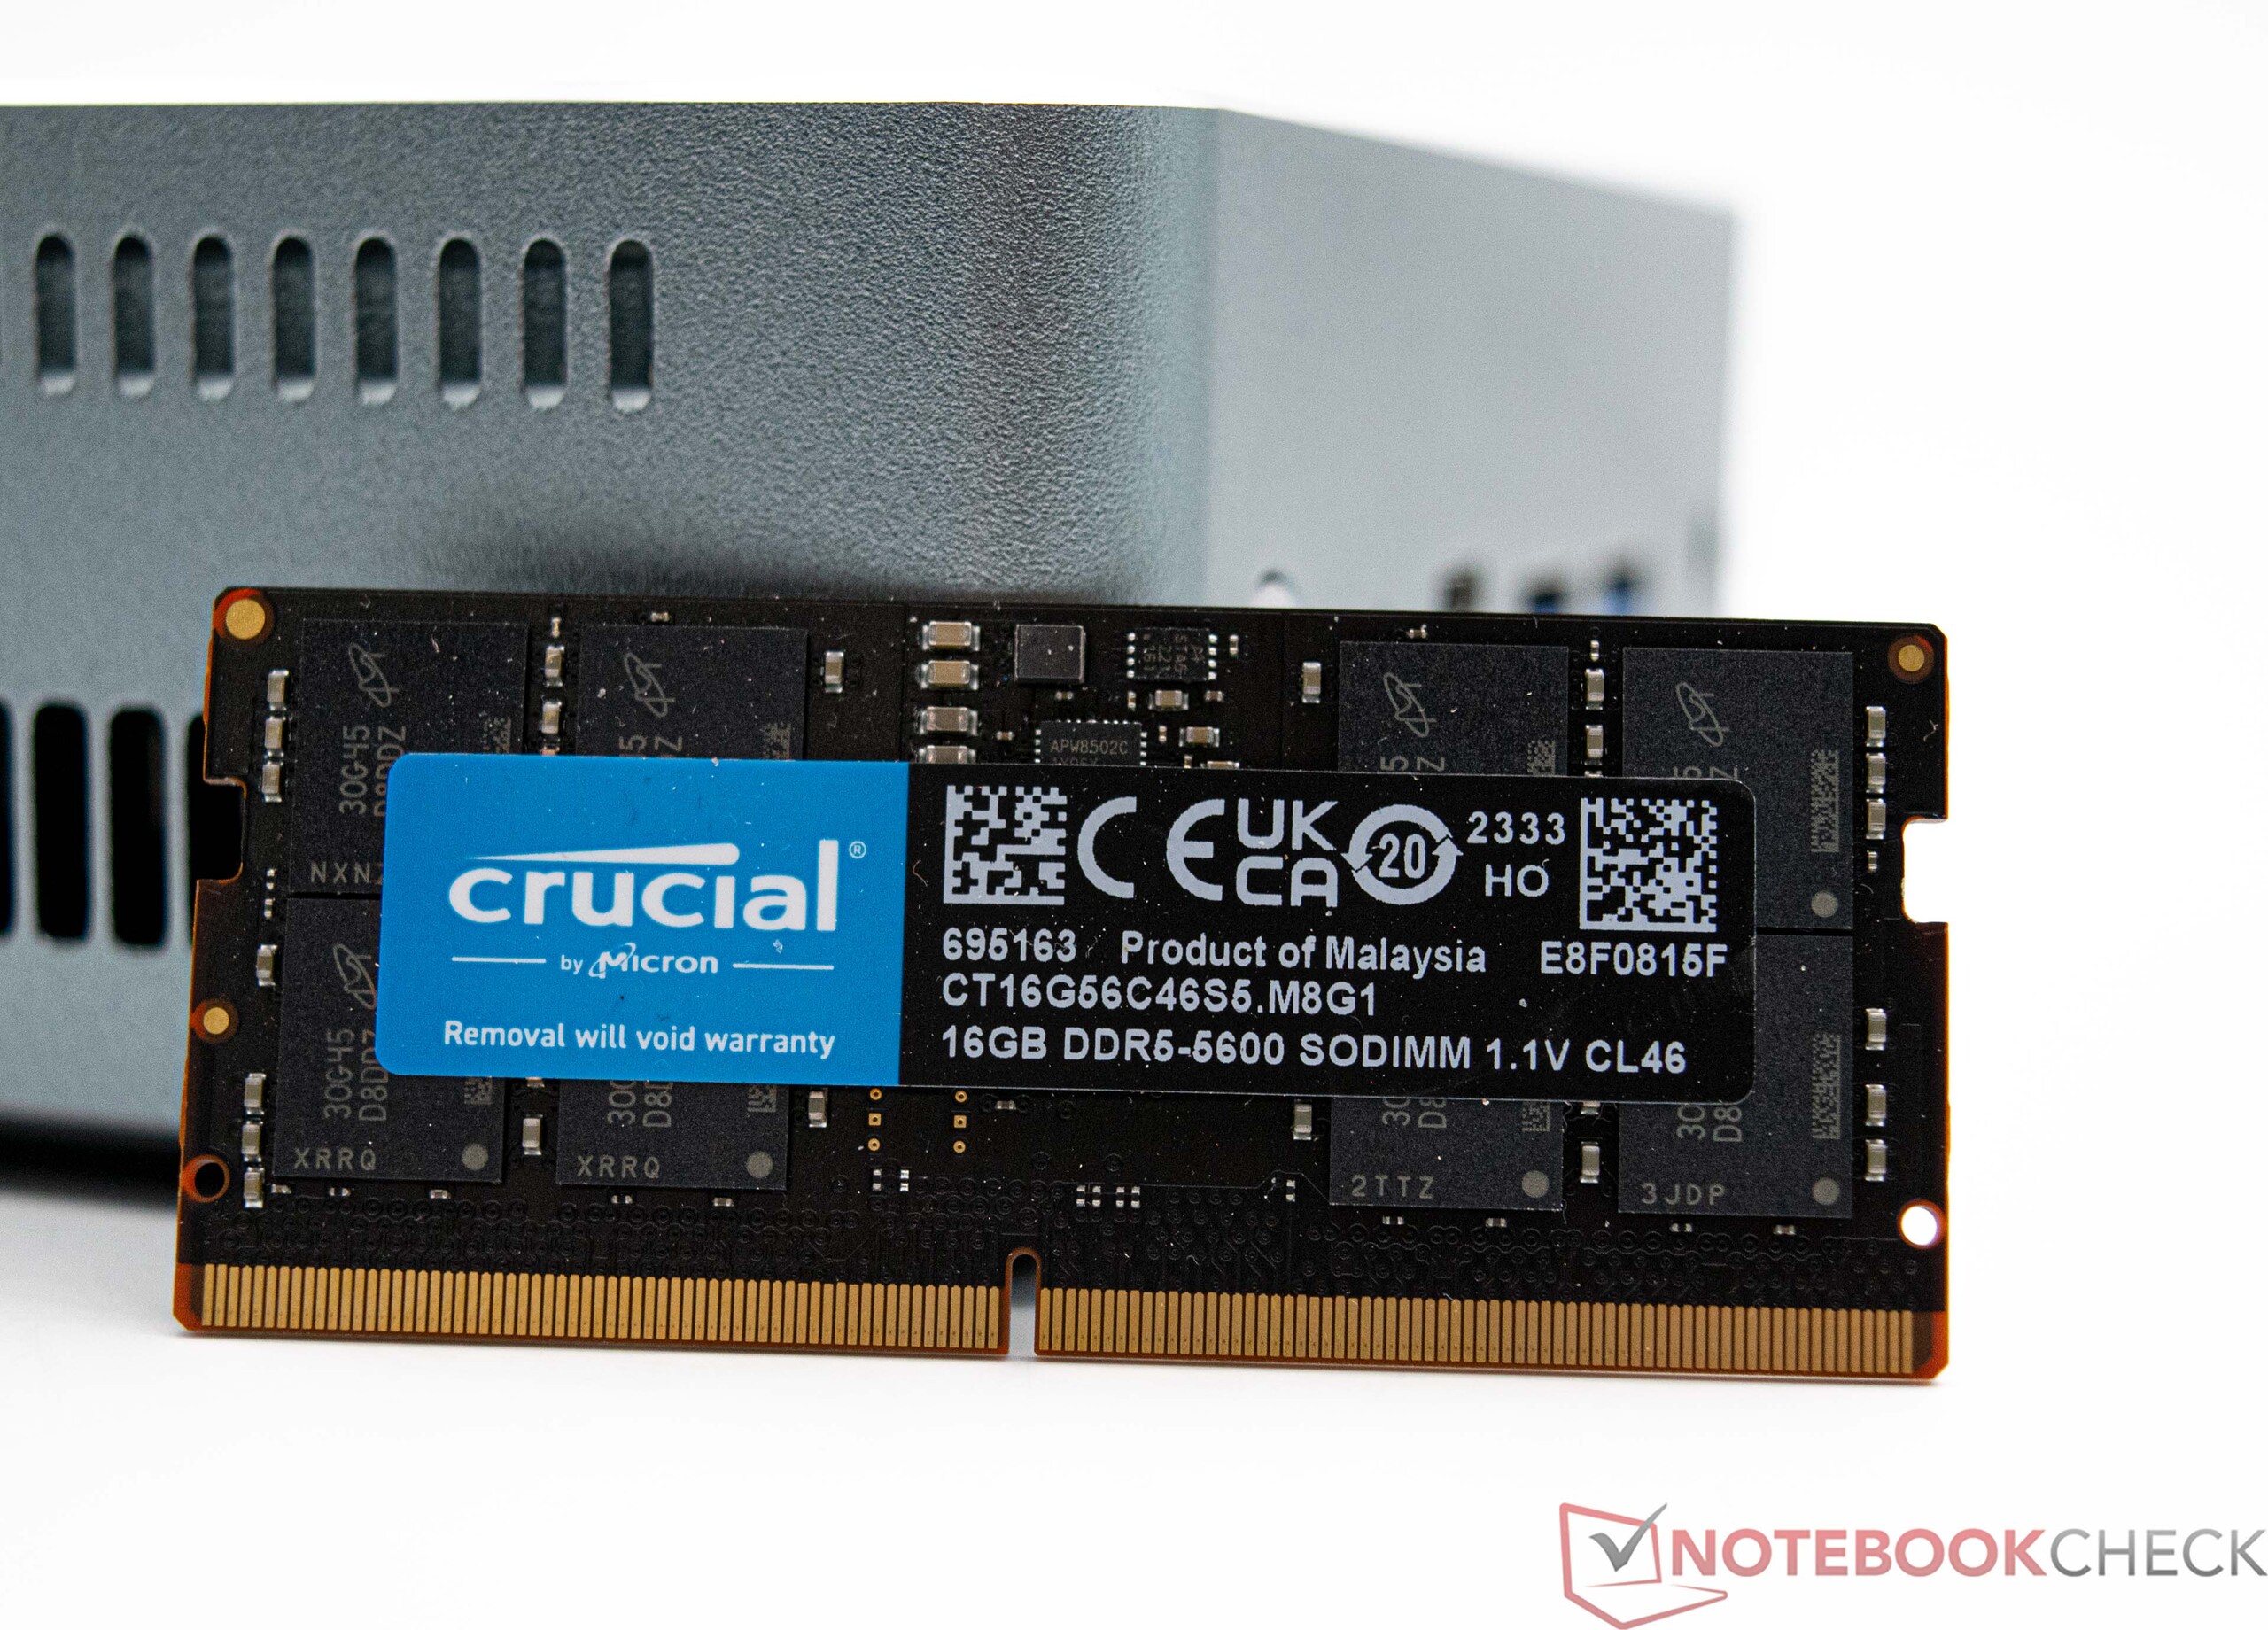
Maxtang es un fabricante de sistemas chino que vende soluciones industriales especiales en forma de sistemas integrados, así como mini PC diseñados para uso de oficina. En este análisis, nos centraremos en el Maxtang MTN-FP750, que cuesta 440 dólares estadounidenses. El sistema está compuesto por un AMD Ryzen 7 7735HS y 16 GB de RAM DDR5, así como una unidad SSD de 512 GB. Como alternativa, un AMD Ryzen 5 6600H también está disponible. Además, el mini PC se puede pedir con RAM adicional y una SSD más grande. Maxtang también ofrece una opción barebones, sin embargo, ésta sólo viene con el AMD Ryzen 7 7735HS.
En este análisis, el Maxtang MTN-FP750 se enfrenta a los mini PC actuales. Una lista más detallada de los dispositivos de comparación encontrados en esta revisión se resume en la siguiente tabla.
Posibles contendientes en la comparación
Valoración | Fecha | Modelo | Peso | Altura | Precio |
|---|---|---|---|---|---|
| 79.5 % v7 (old) | 02/2024 | Maxtang MTN-FP750 R7 7735HS, Radeon 680M | 601 g | 52 mm | |
| 85.1 % v7 (old) | 01/2023 | Minisforum Neptune Series NAD9 i9-12900H, Iris Xe G7 96EUs | 1.2 kg | 66 mm | |
| 82.8 % v7 (old) | 07/2023 | Geekom AS 6, R9 6900HX R9 6900HX, Radeon 680M | 753 g | 58 mm | |
| 82.3 % v7 (old) | 05/2023 | Geekom Mini IT12 i7-1260P, Iris Xe G7 96EUs | 572 g | 45.6 mm | |
| 81.2 % v7 (old) | 10/2023 | Geekom A5 R7 5800H, Vega 8 | 555 g | 49.2 mm | |
| 81.9 % v7 (old) | 05/2023 | Minisforum Venus Series NAB6 i7-12650H, UHD Graphics 64EUs | 616 g | 55 mm | |
| 78.4 % v7 (old) | 01/2024 | NiPoGi AD08 i7-12650H, UHD Graphics 64EUs | 878 g | 188.5 mm |
El Maxtang MTN-FP750 en detalle
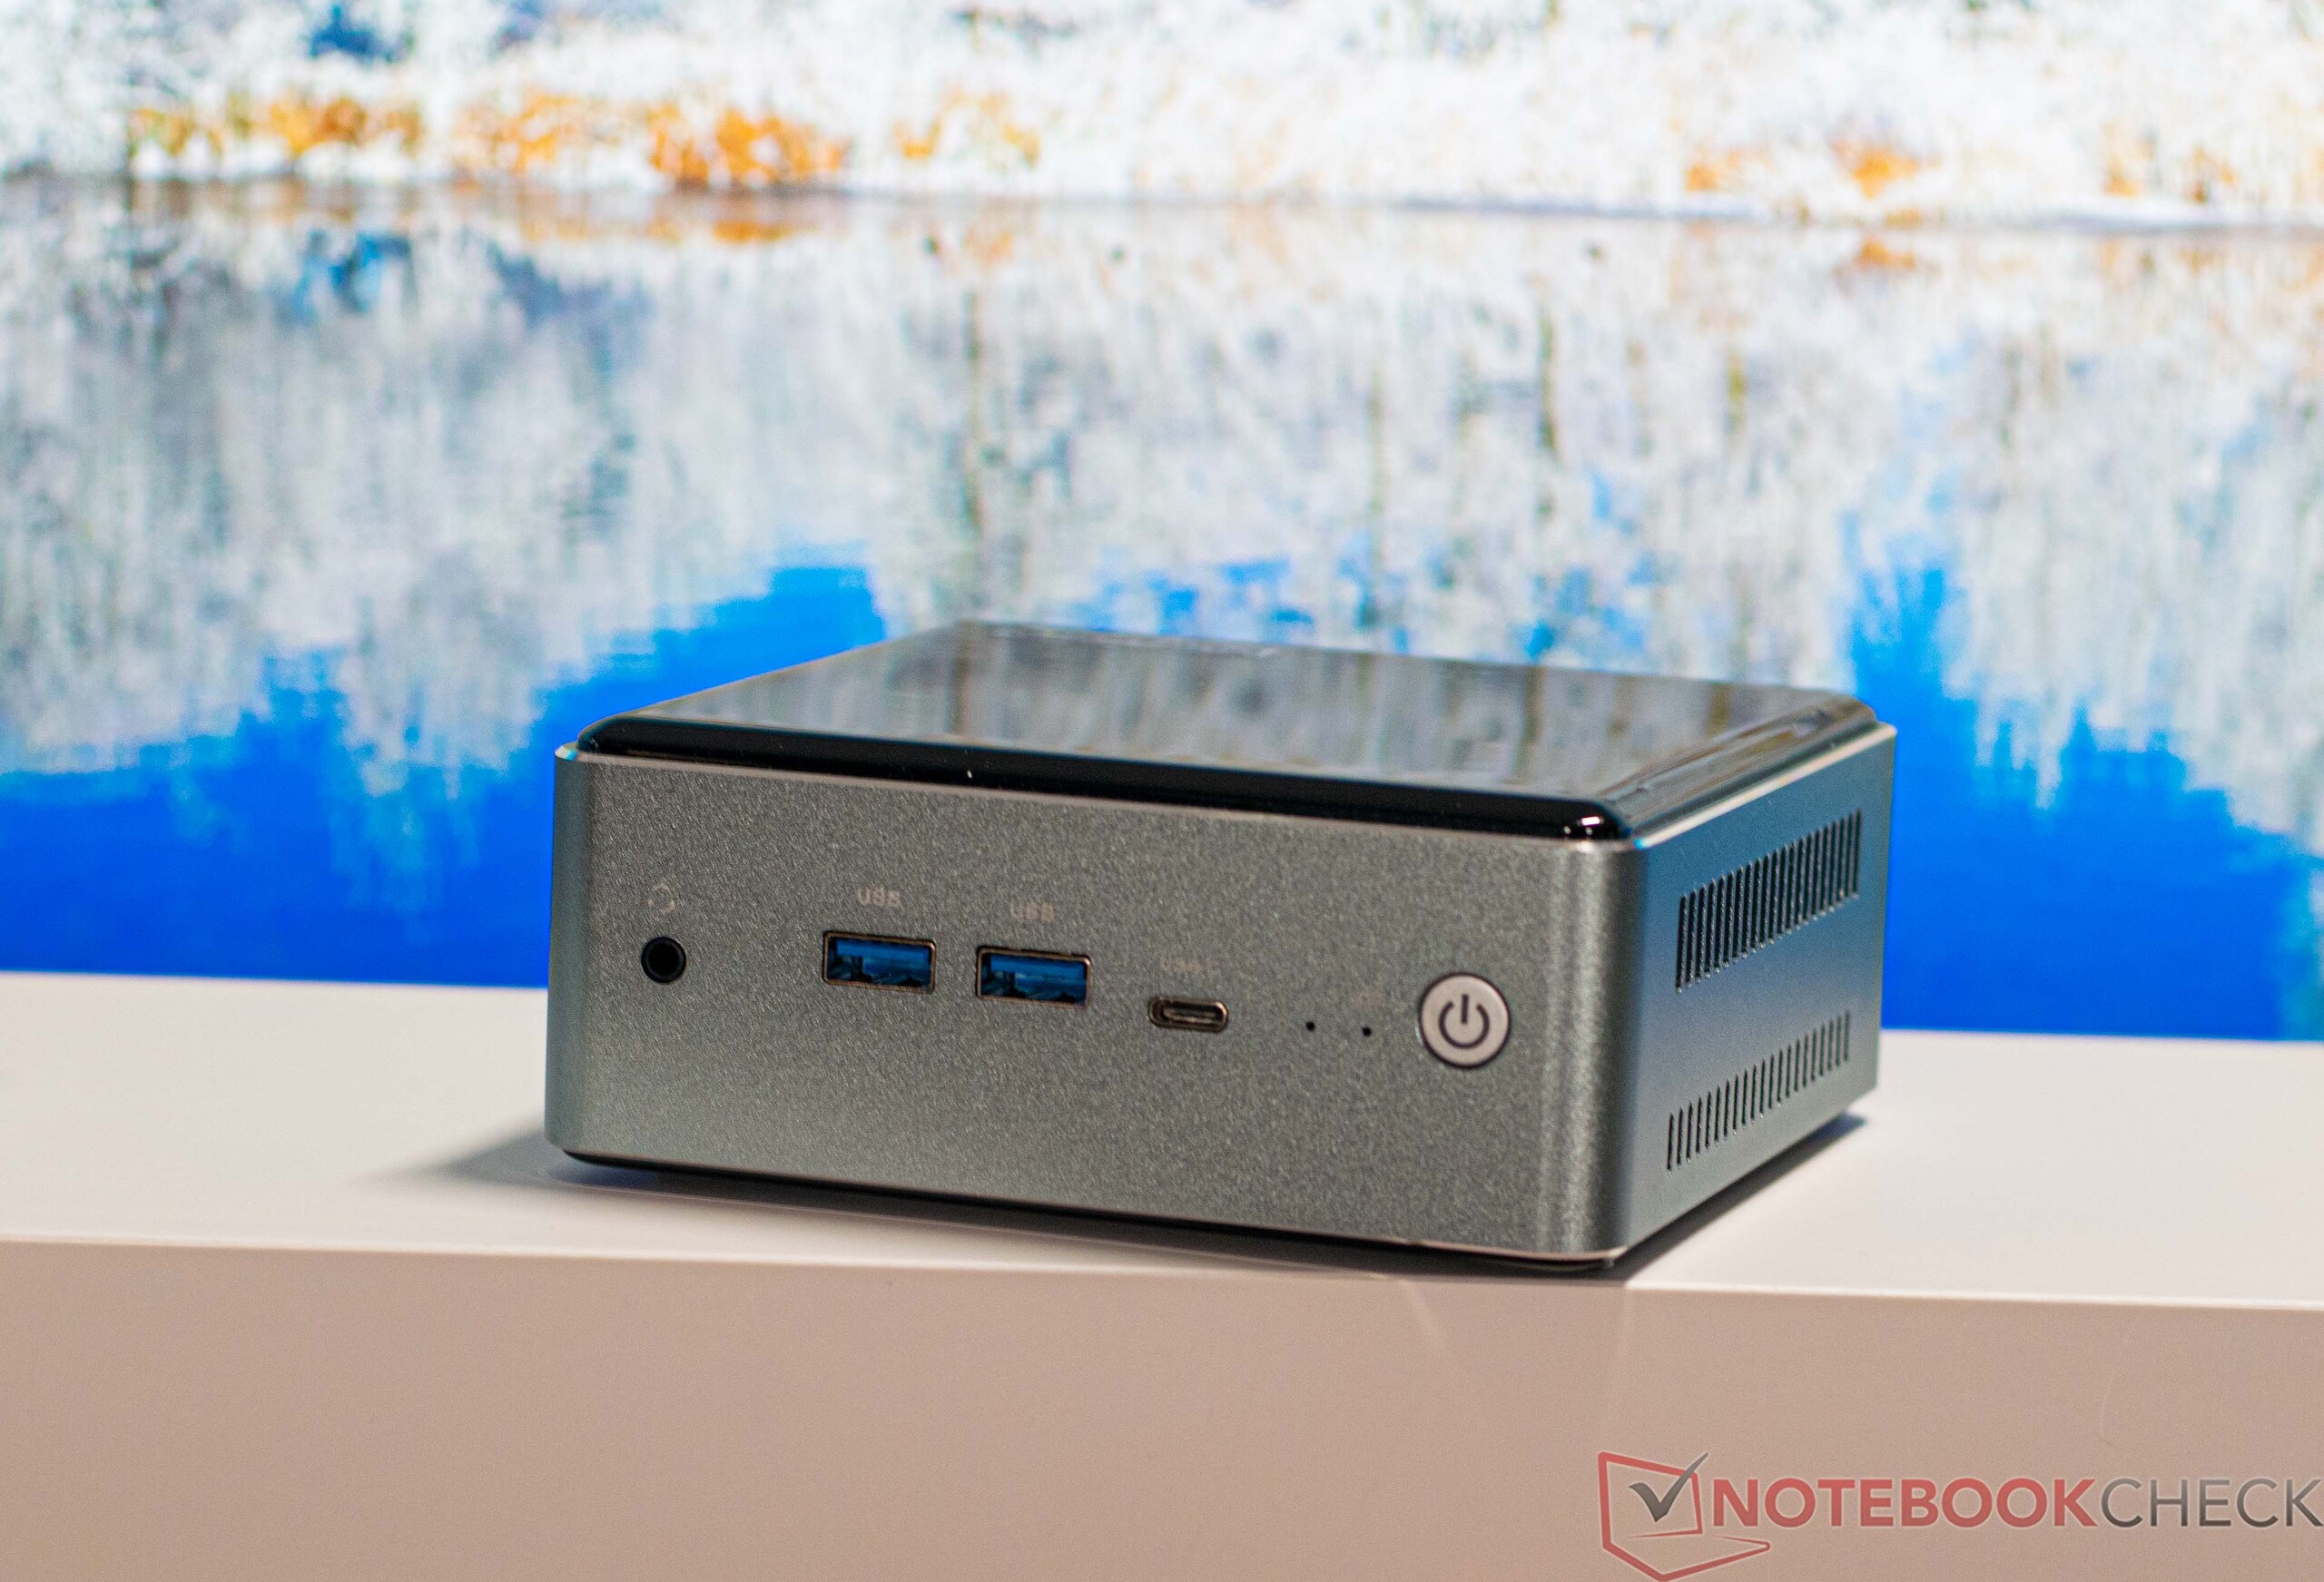
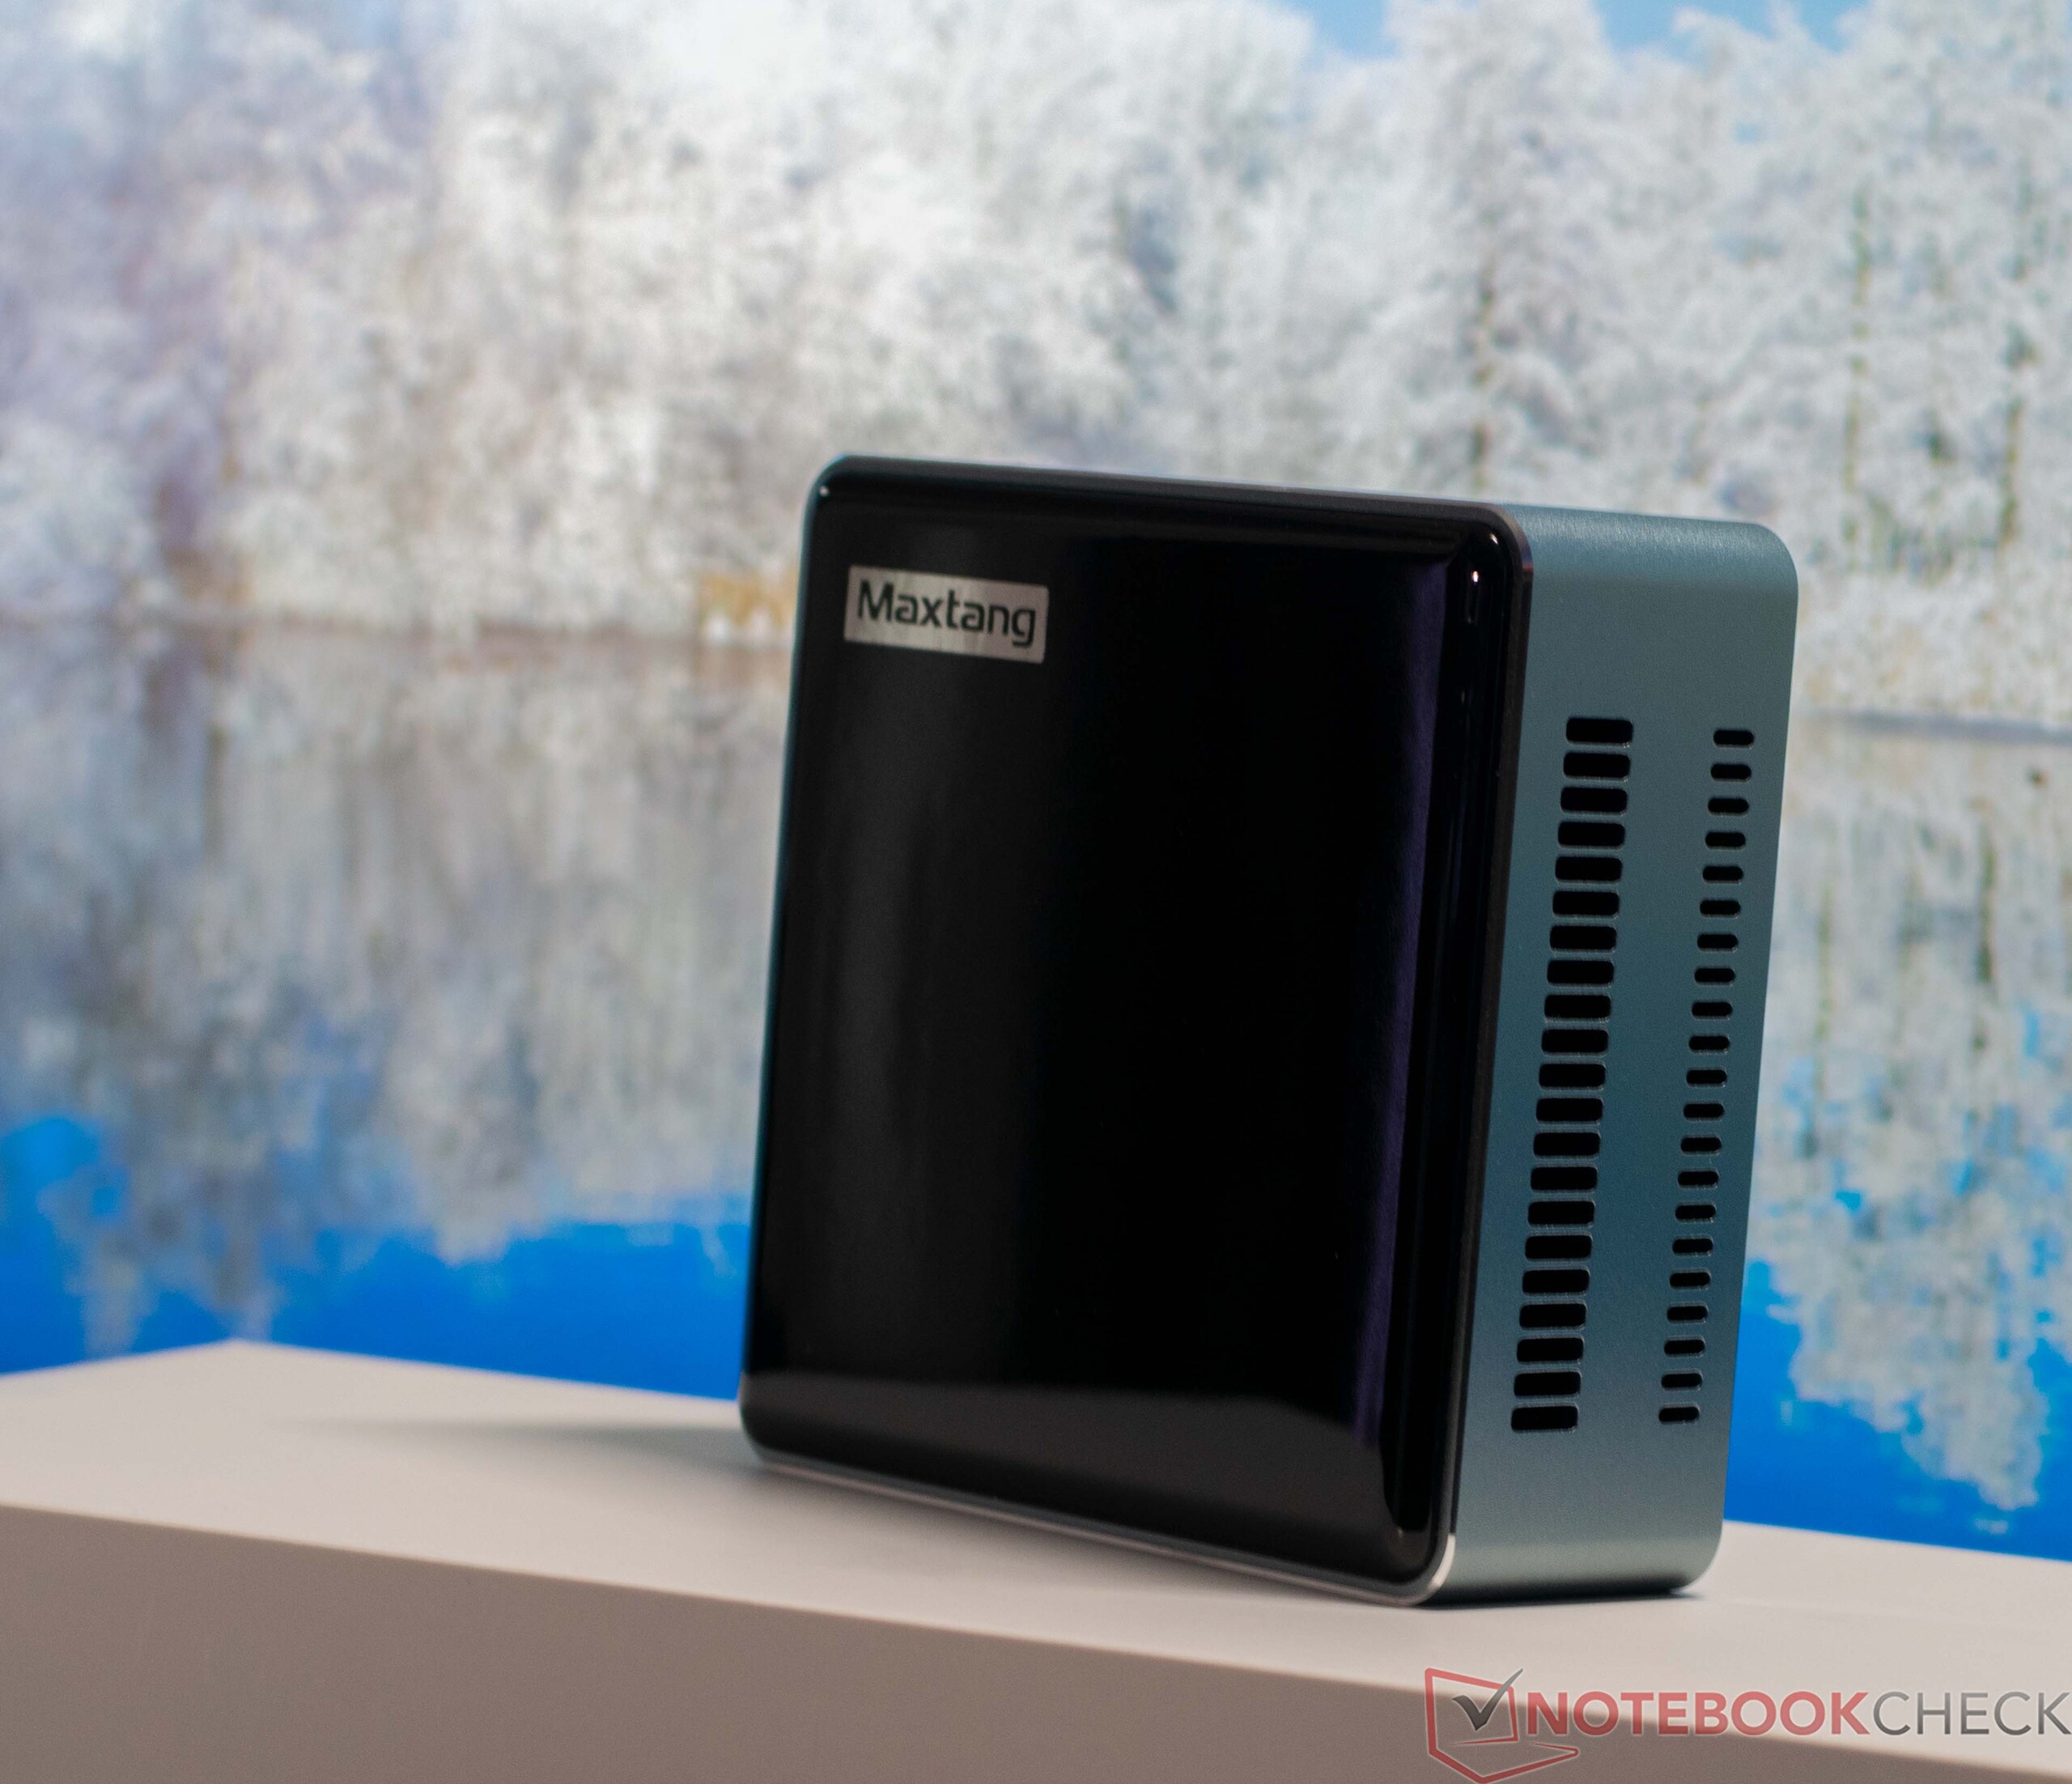
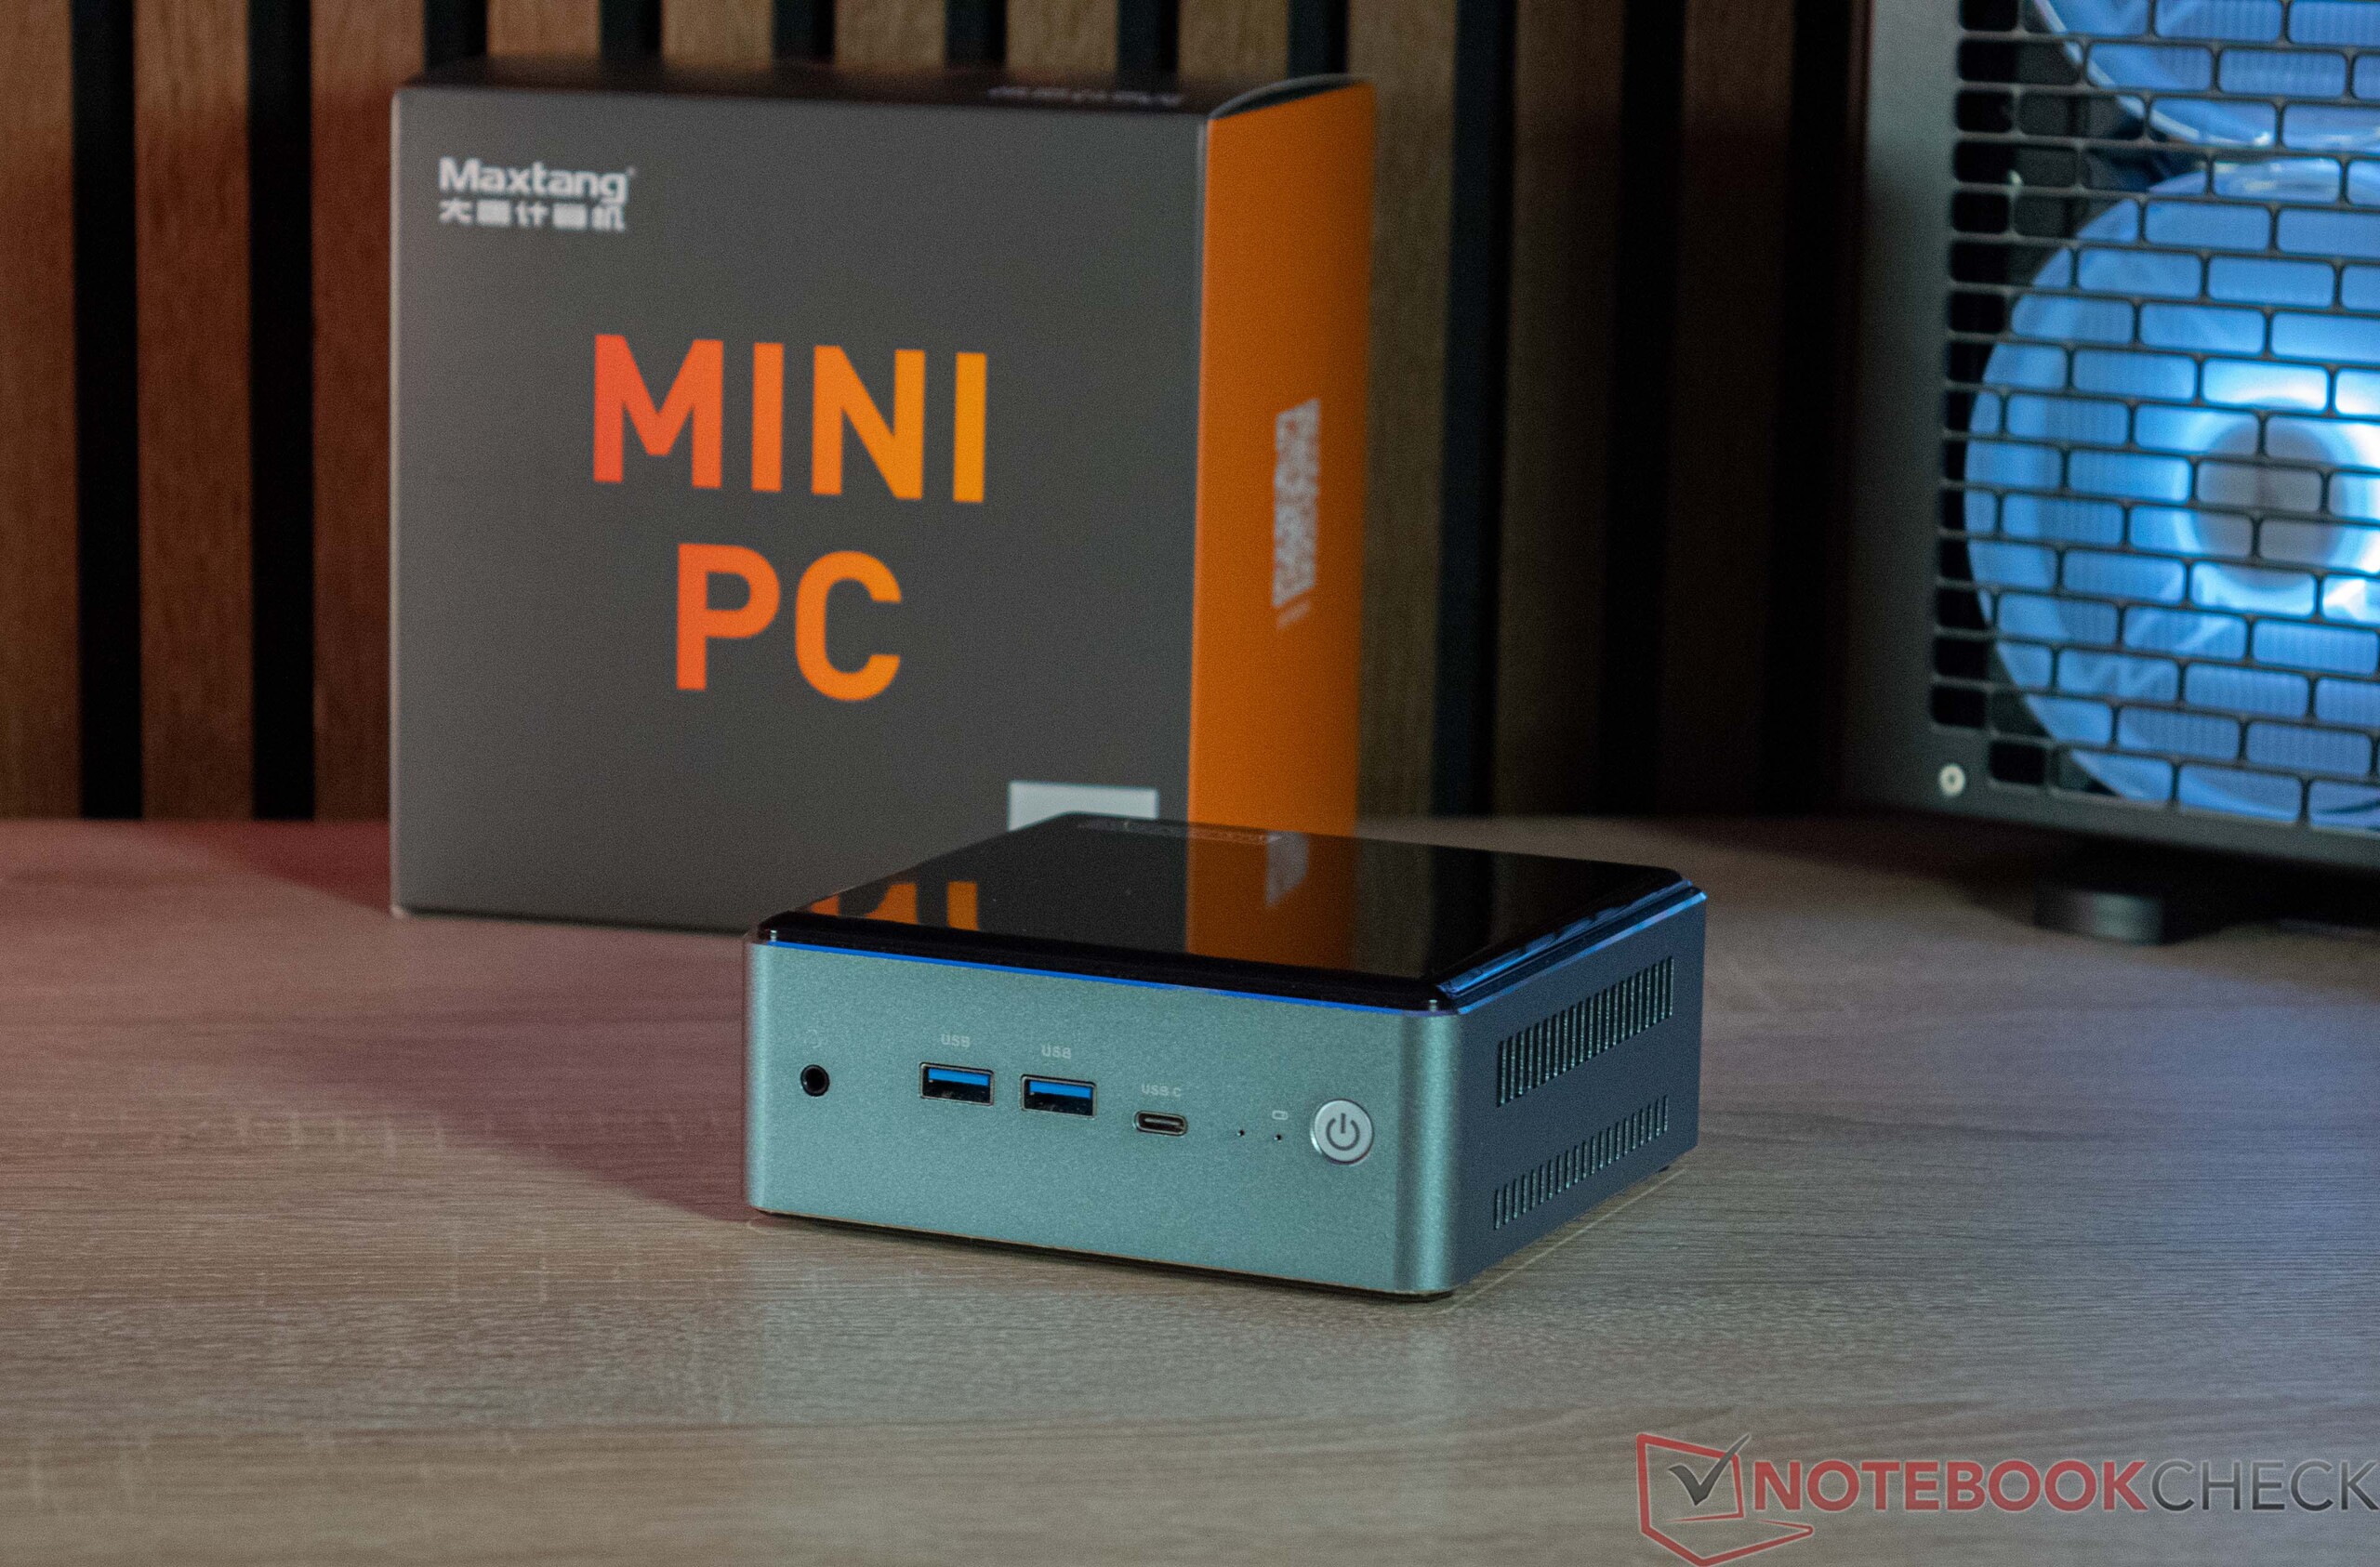

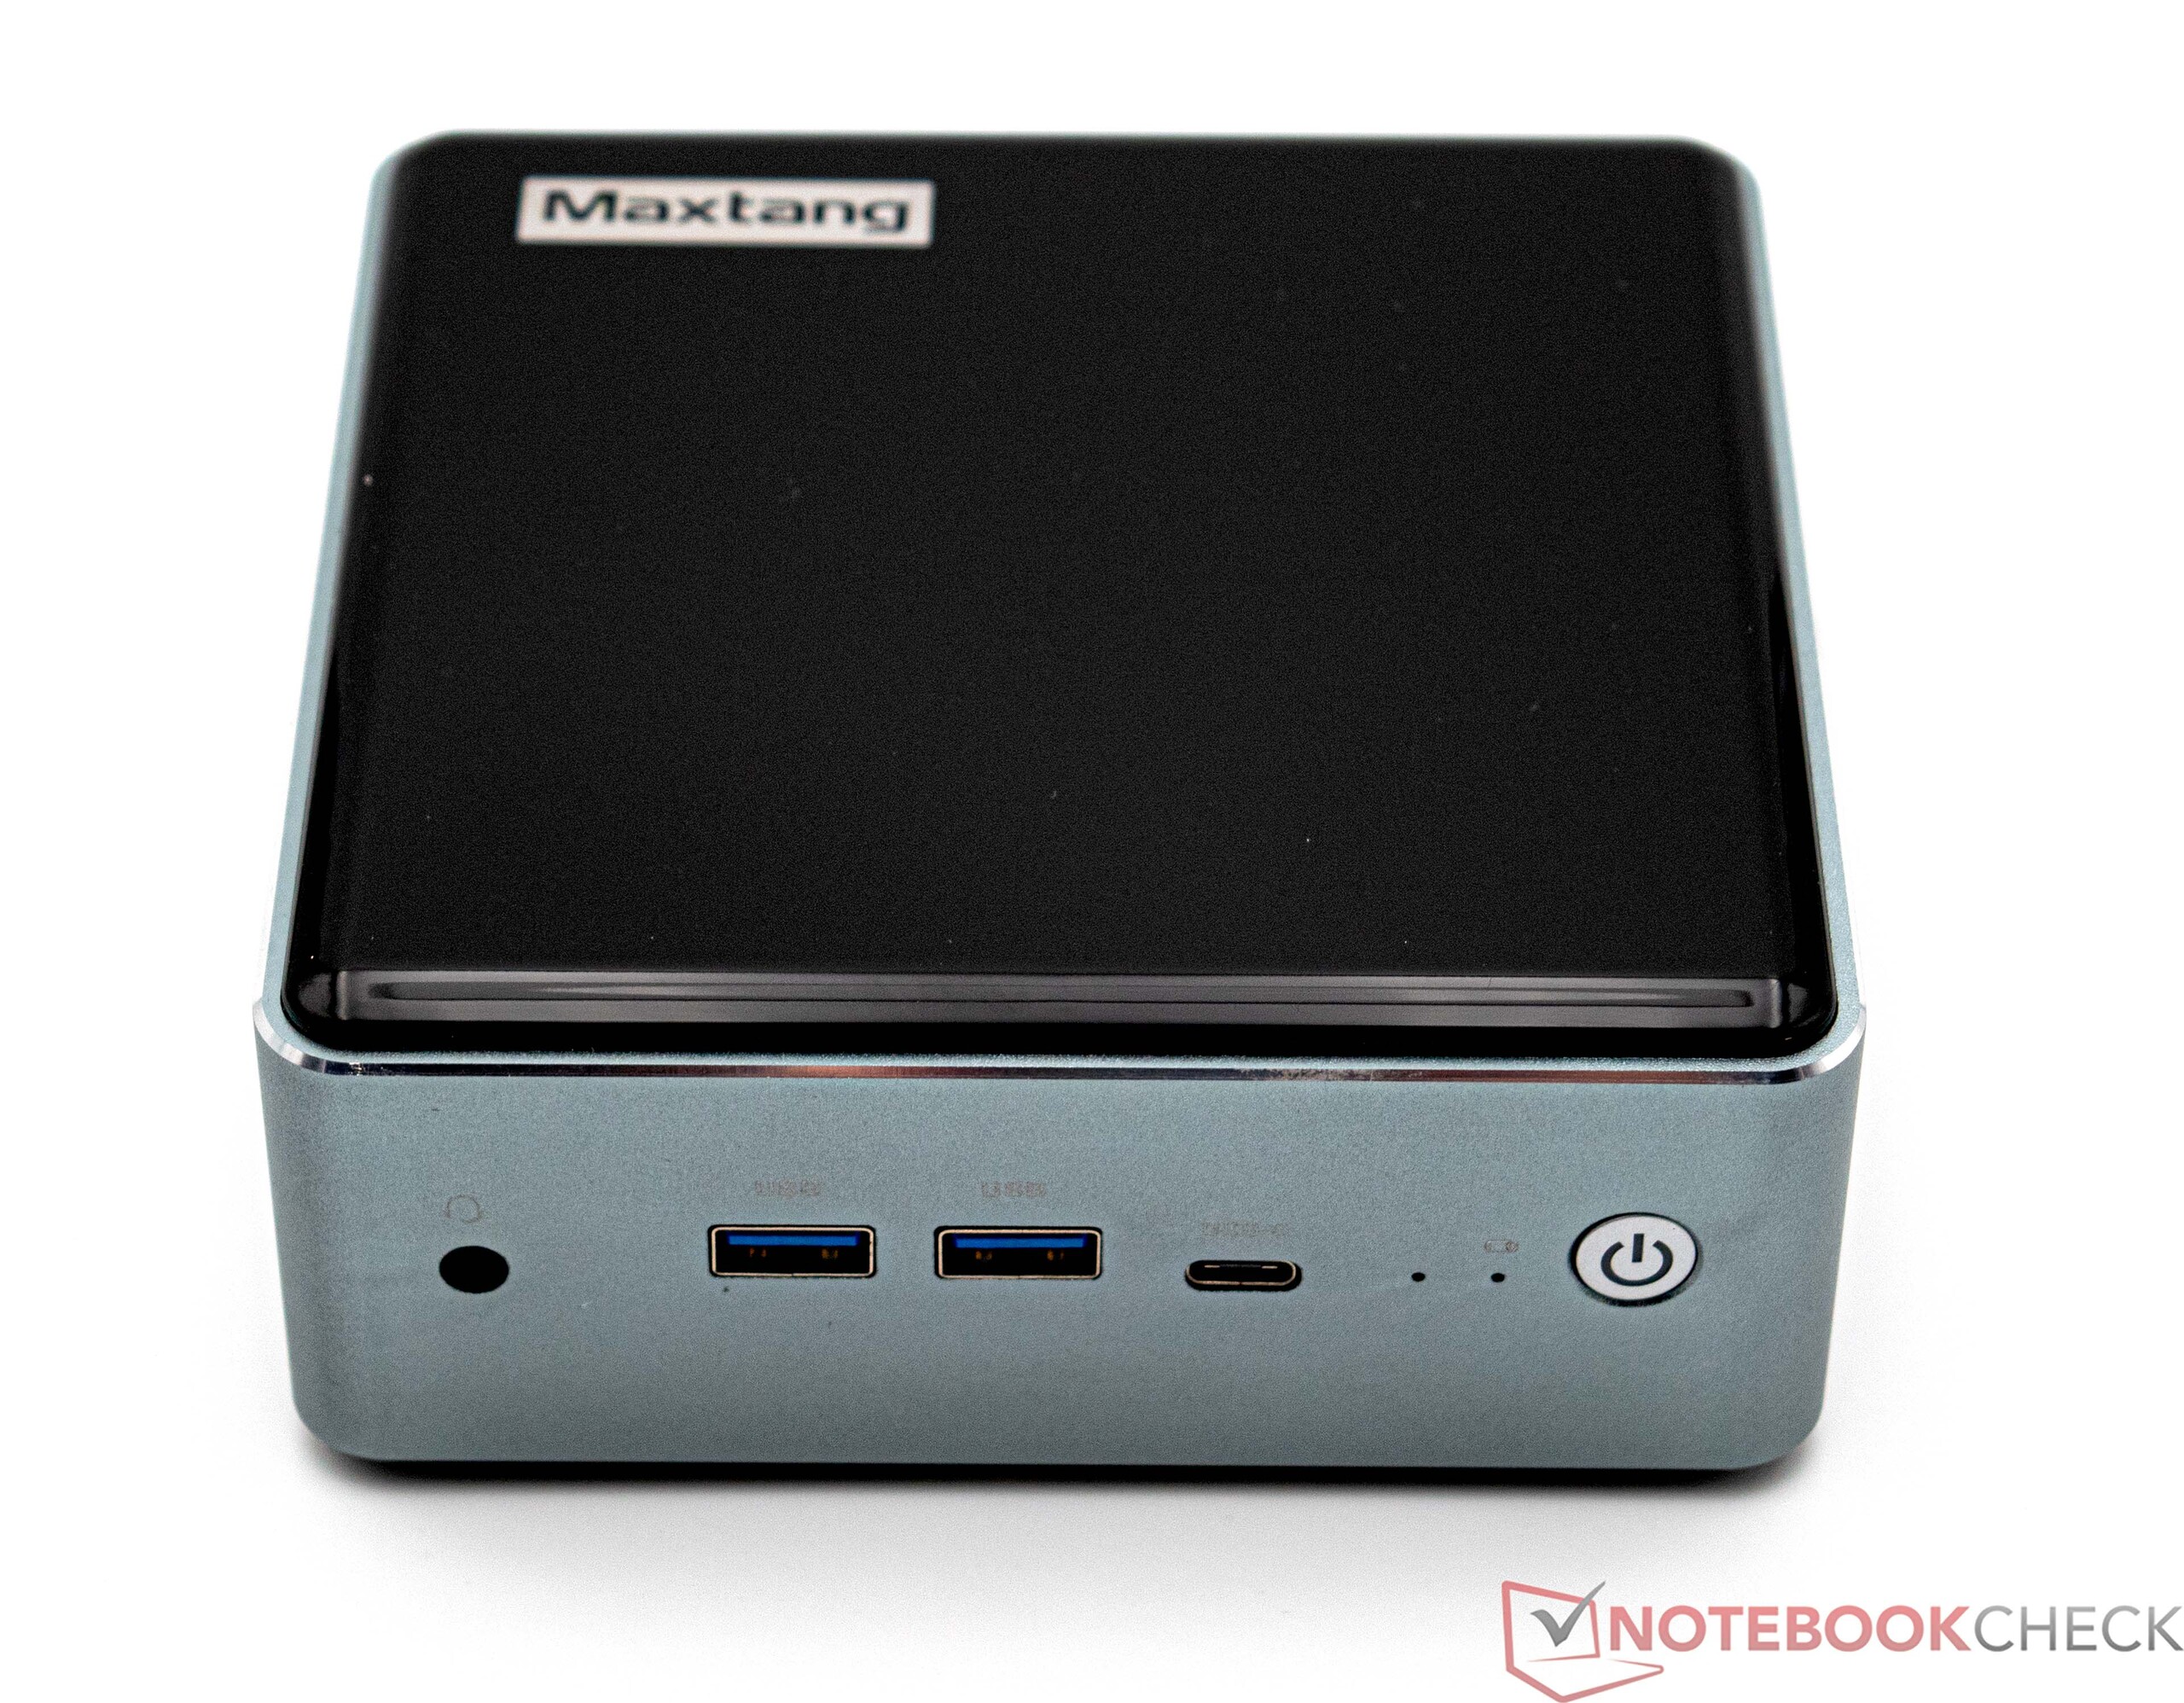
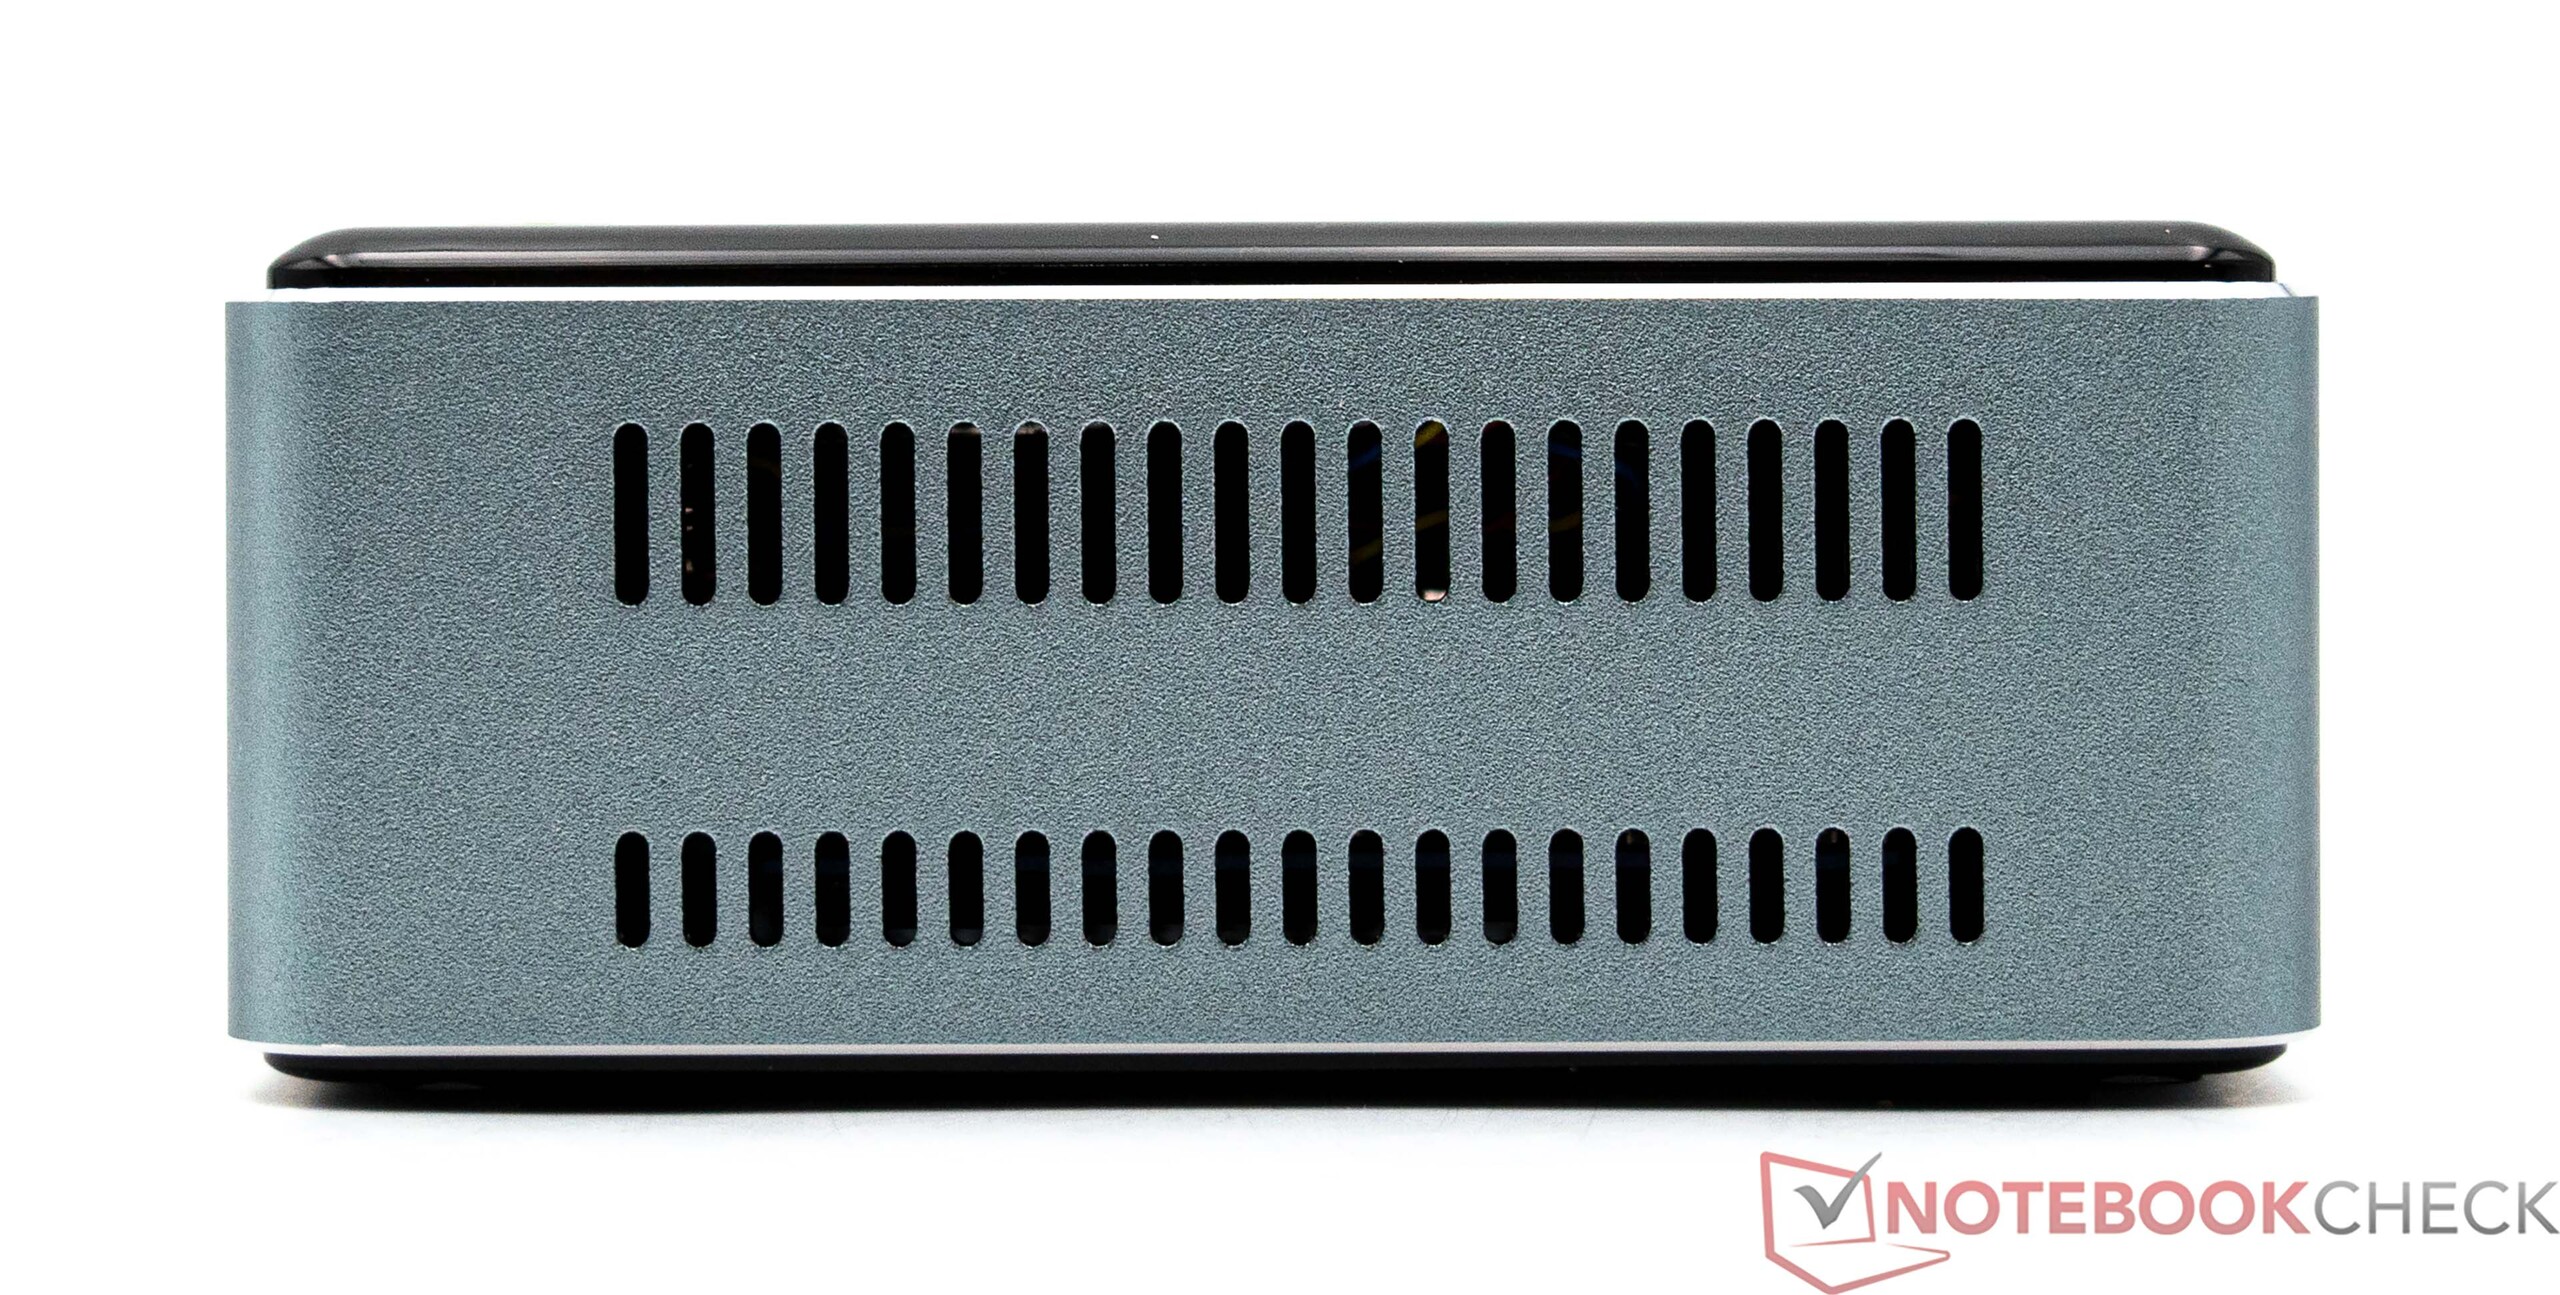

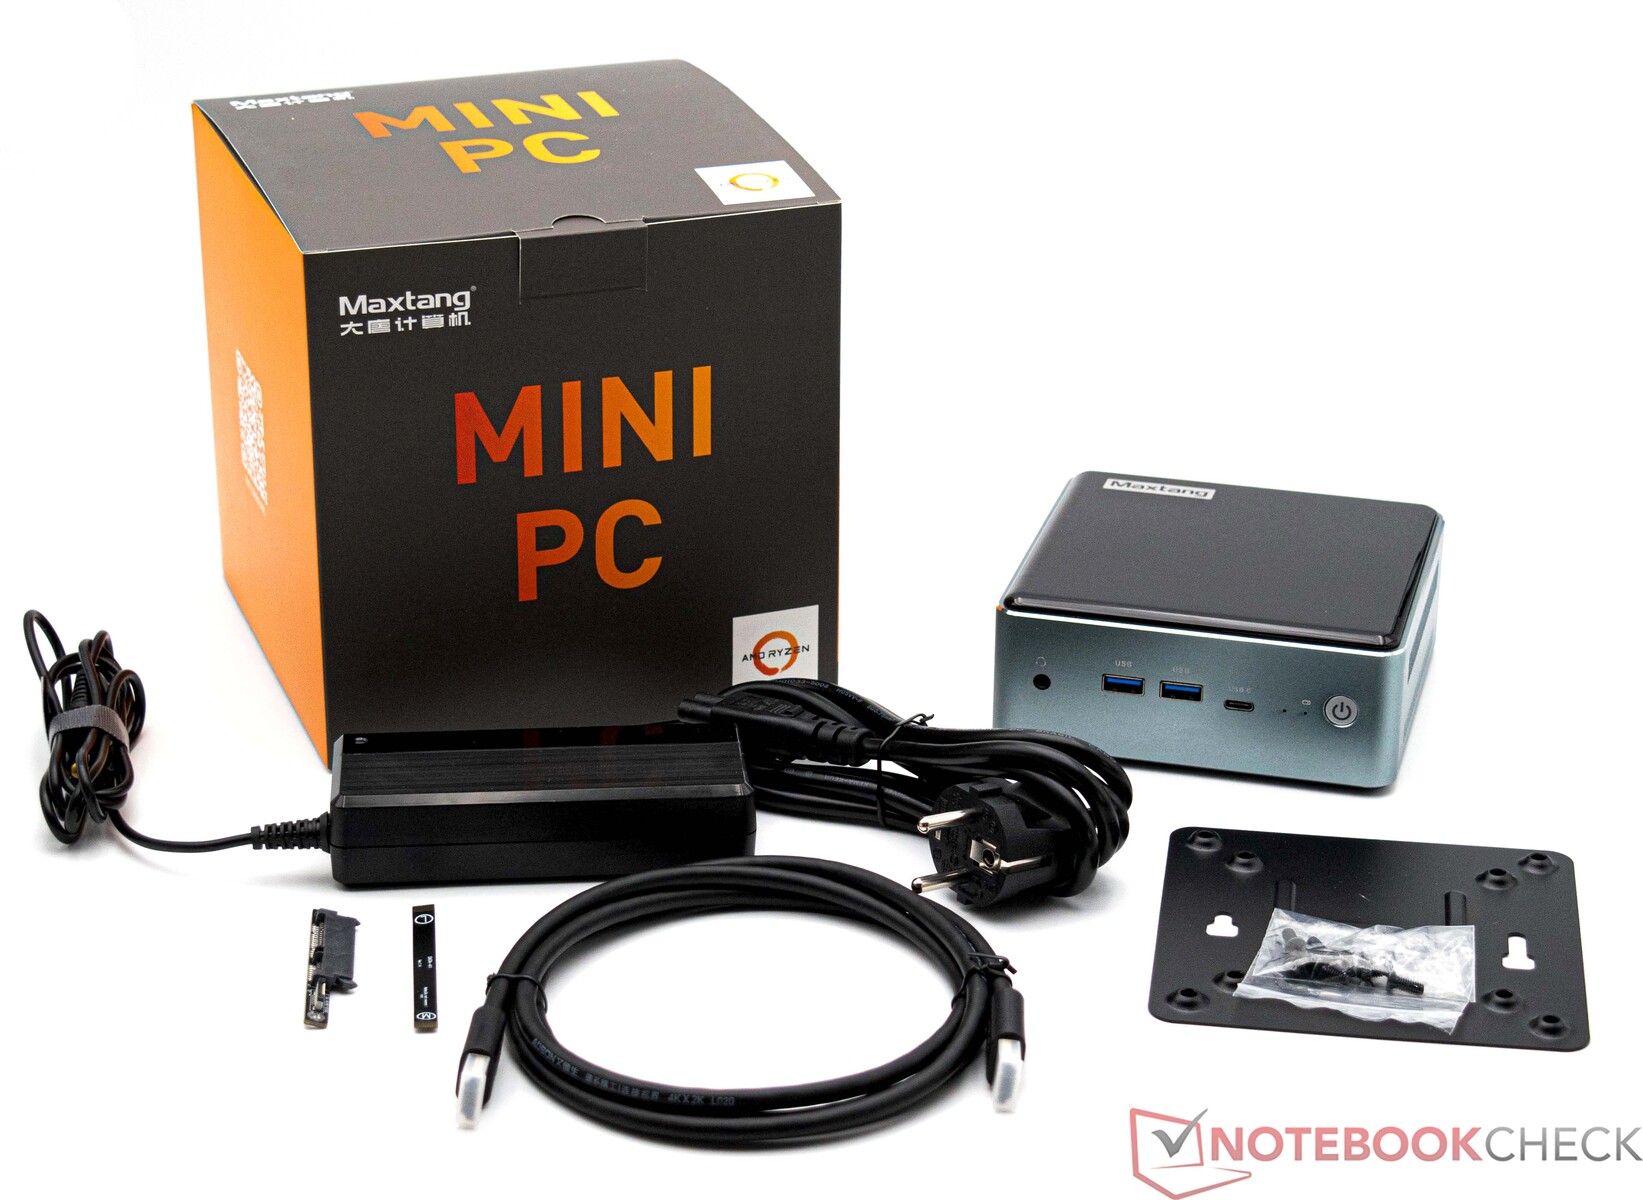
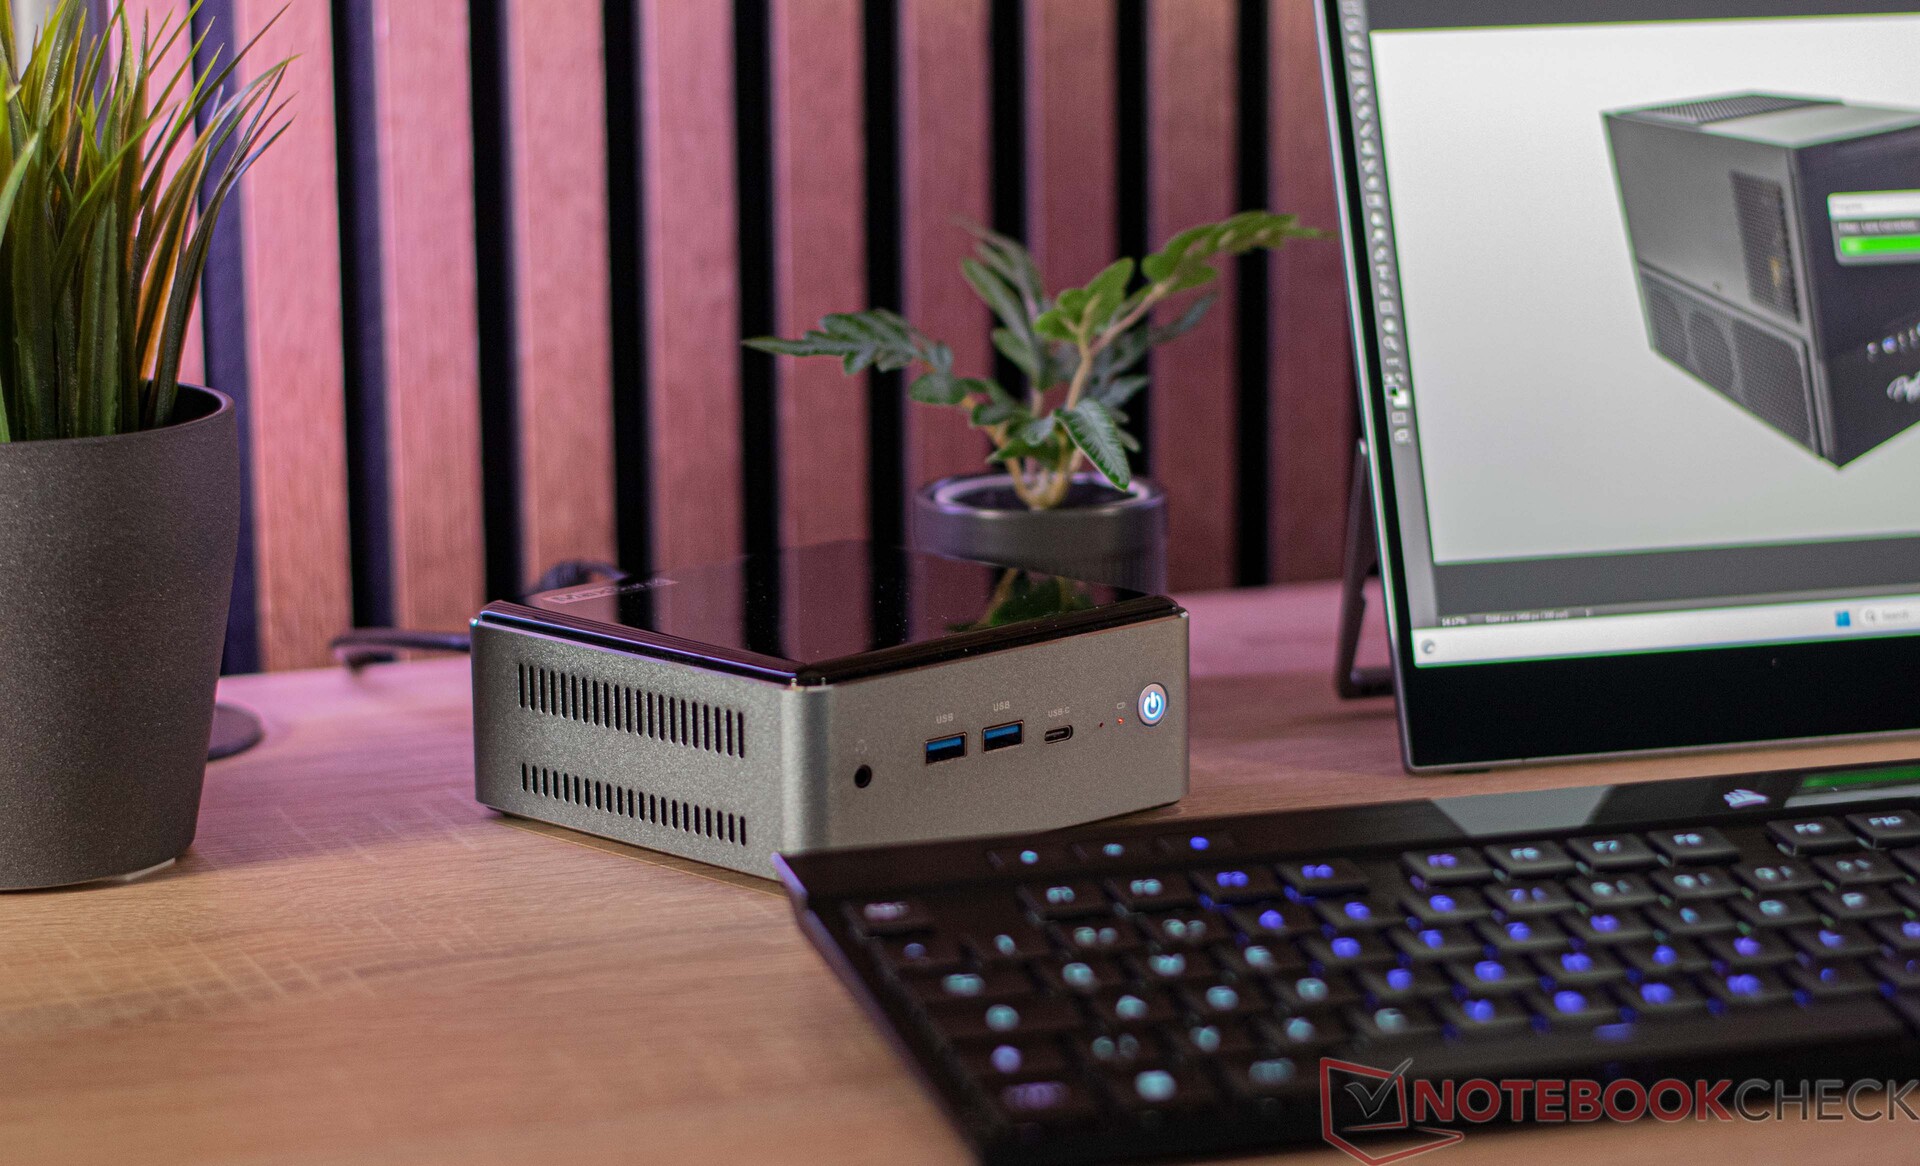
Caja - Metal y plástico en negro piano
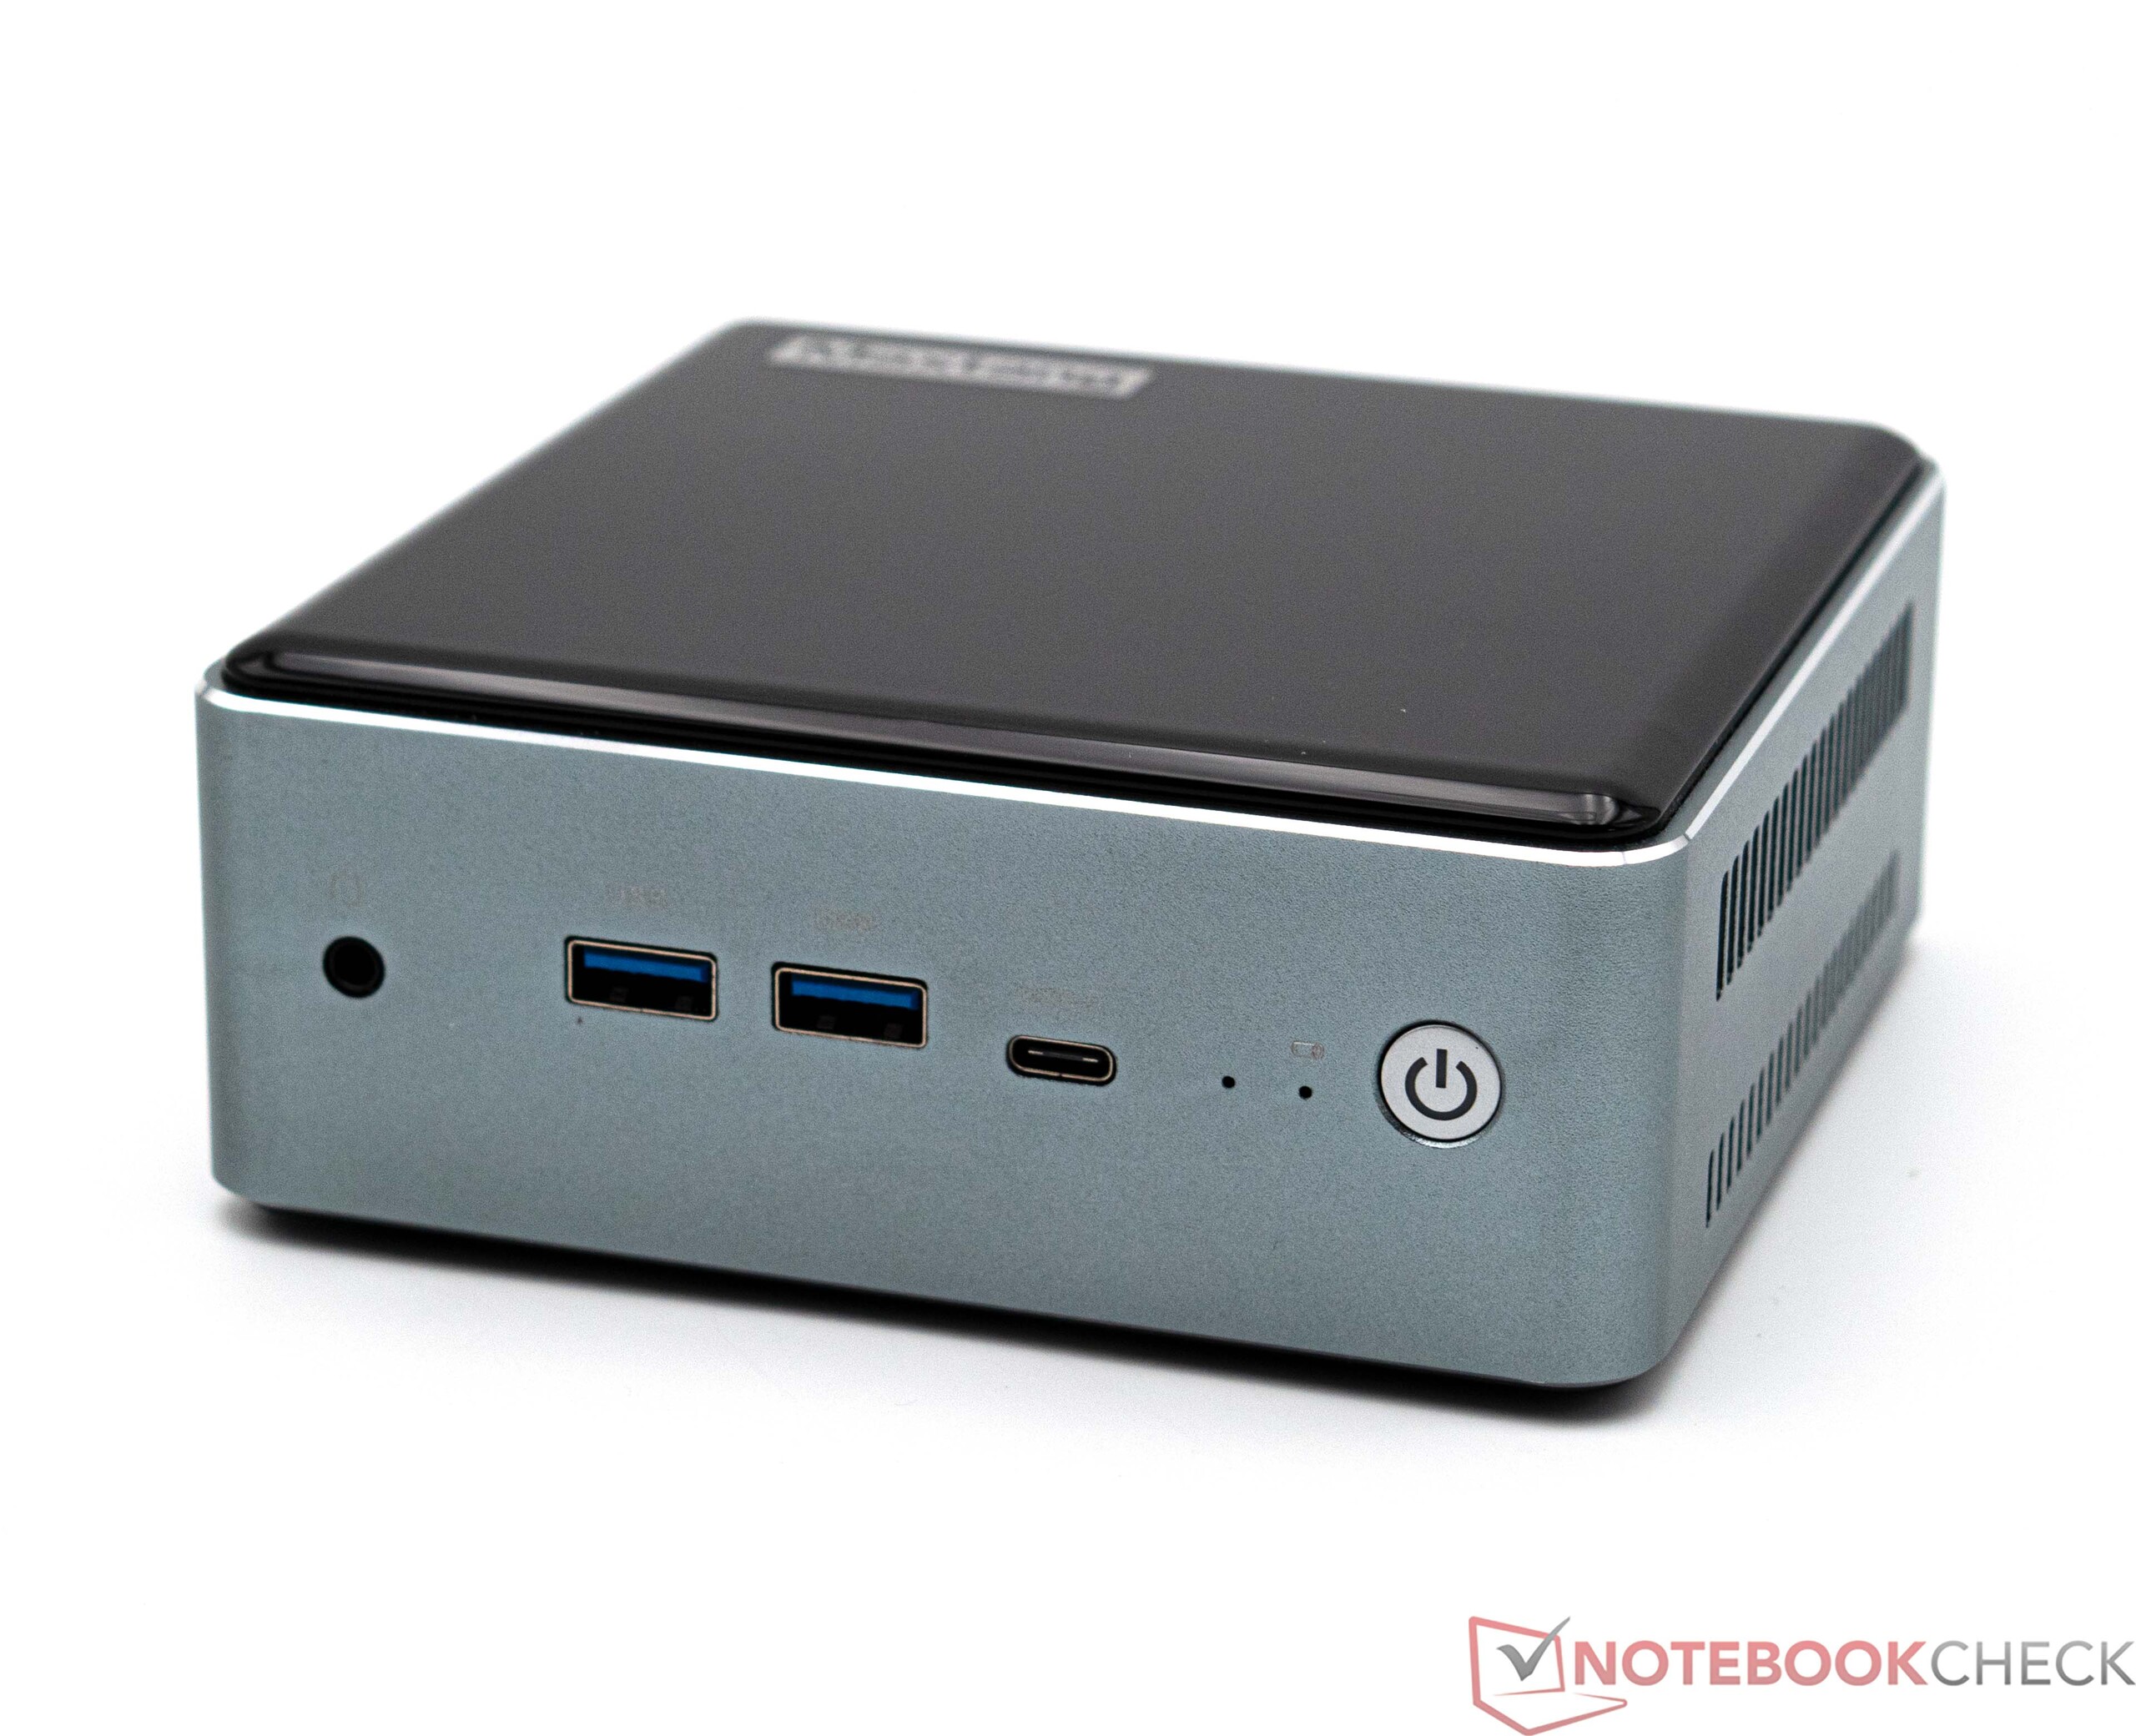
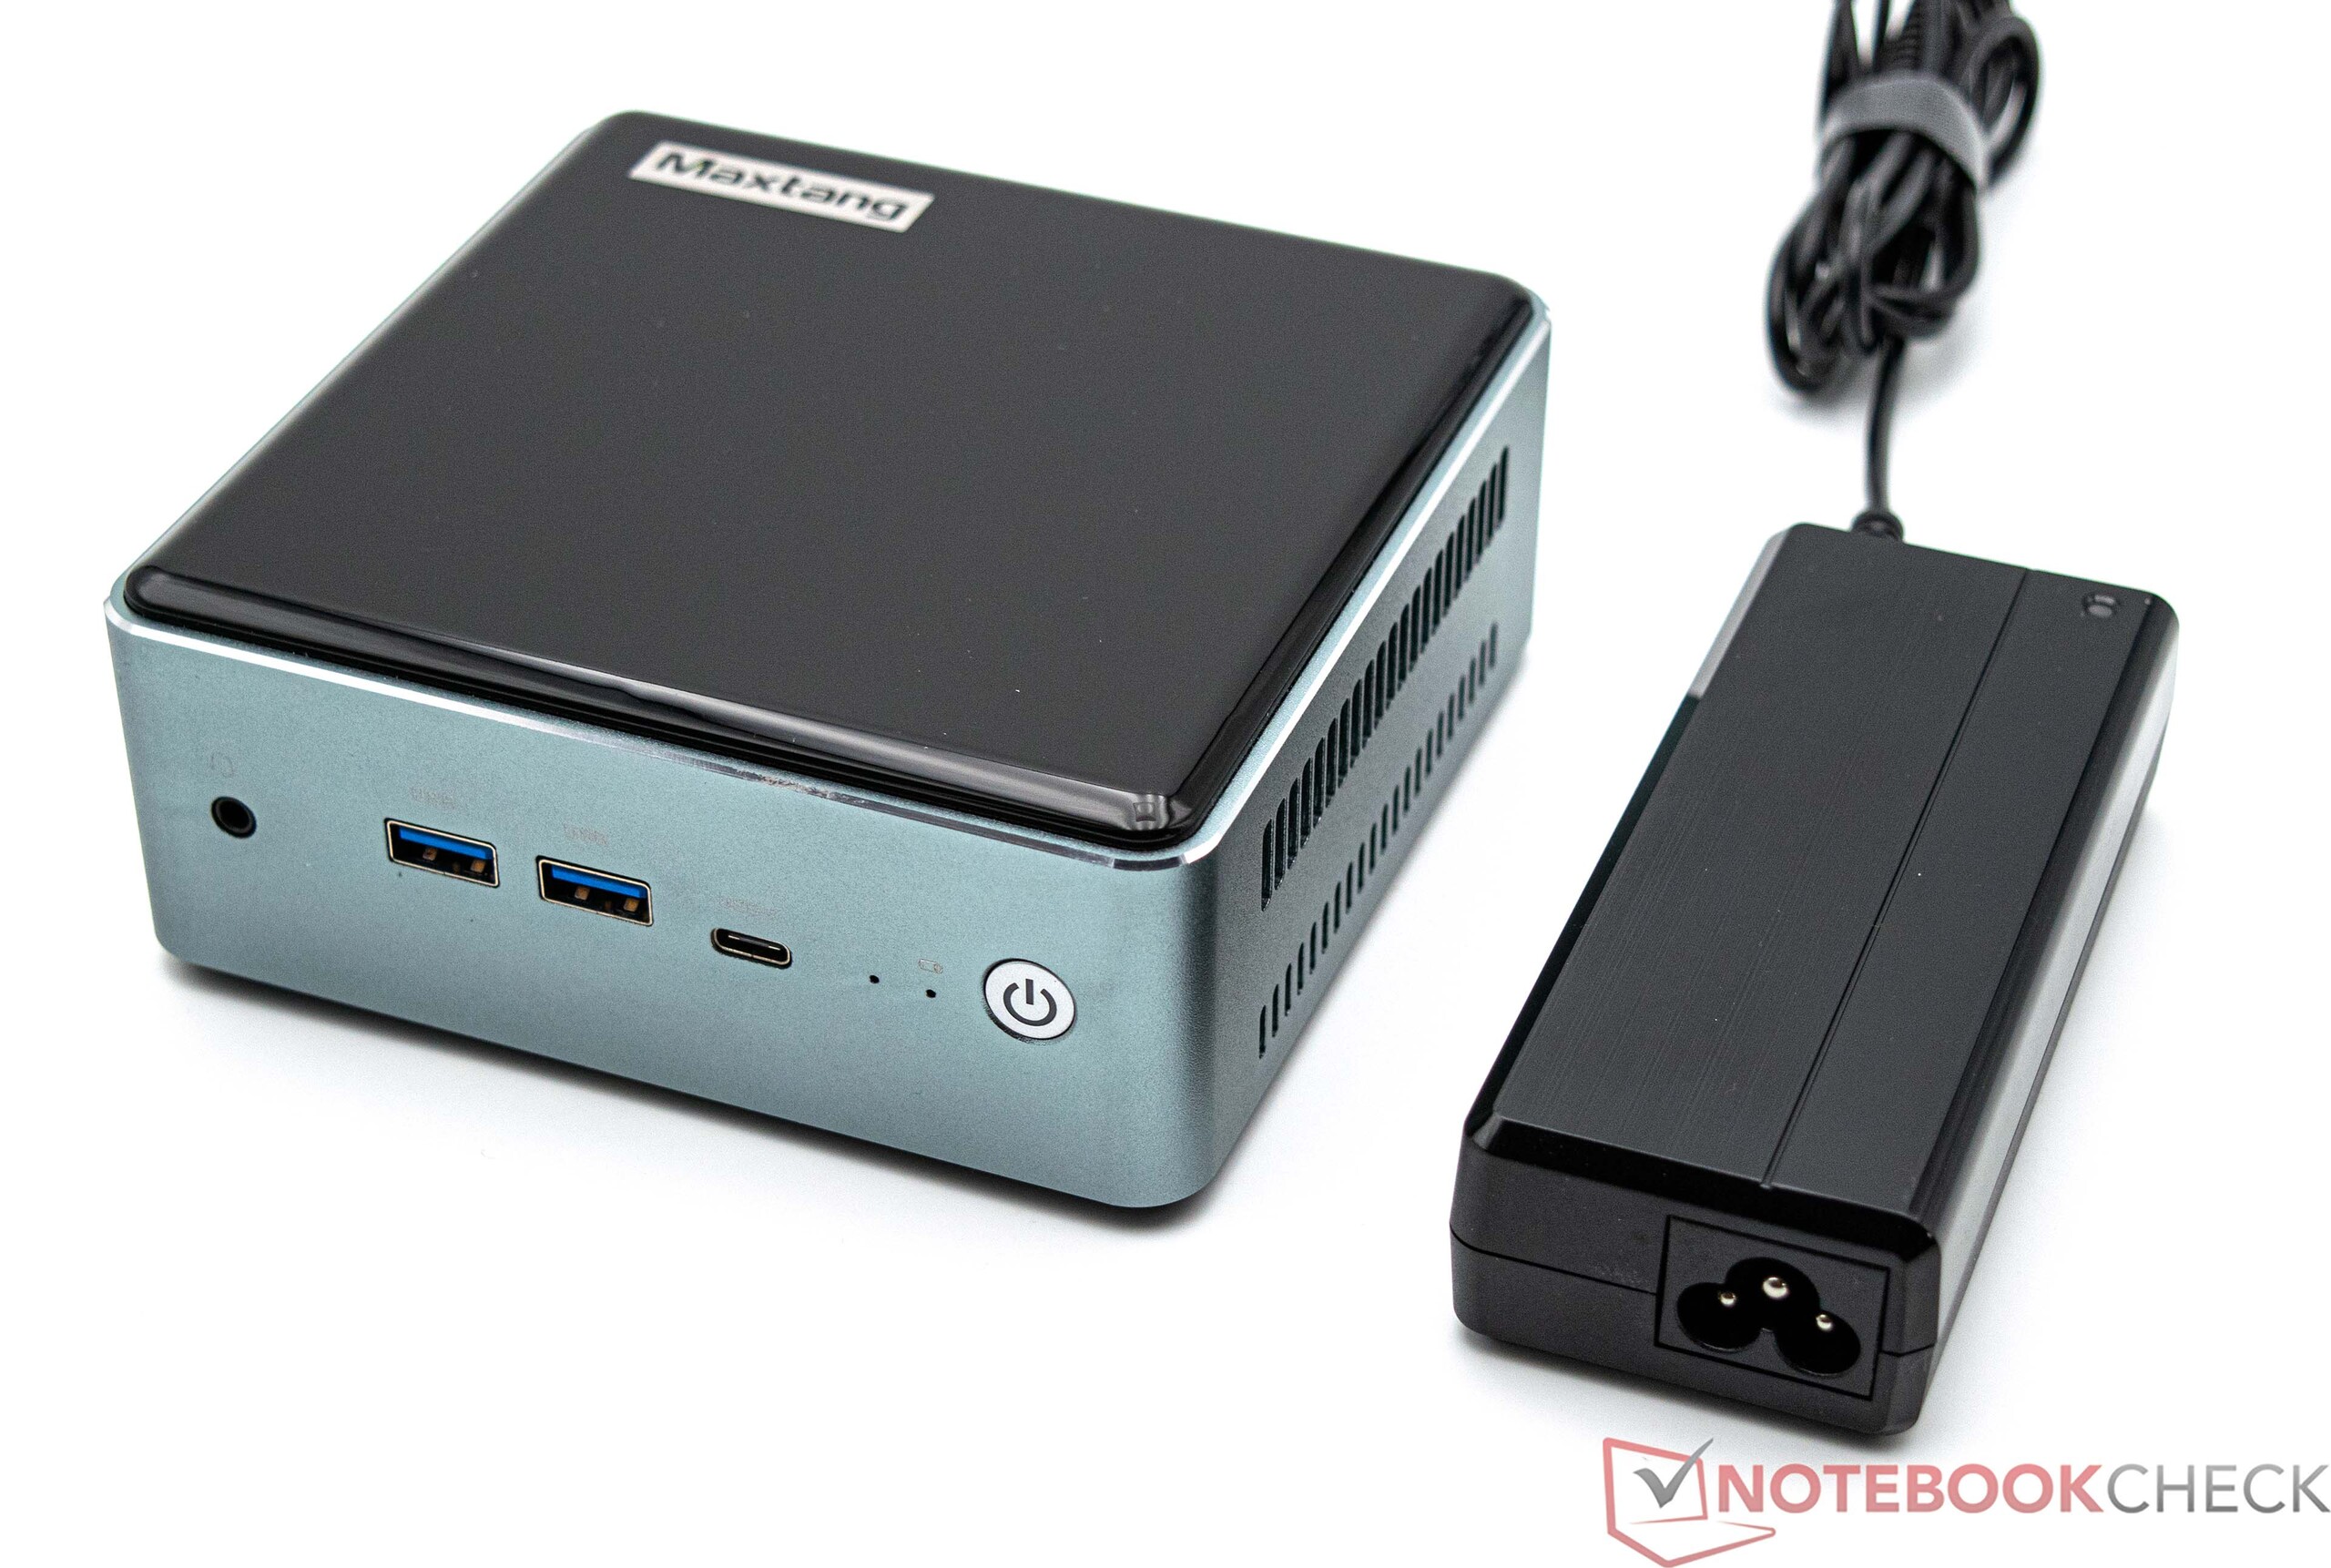
El Maxtang MTN-FP750 tiene una robusta carcasa metálica que se complementa con superficies de plástico negro brillante en la parte superior e inferior del dispositivo. Rápidamente, las huellas dactilares se hacen visibles y, tarde o temprano, los arañazos son inevitables. En cuanto a la estabilidad, el aparato no parece sufrir por tener cubiertas de plástico. La marca Maxtang está estampada en la parte superior del mini PC.
Con unas dimensiones de 13 x 13 centímetros, el aparato ocupa un poco más de espacio en el escritorio que la competencia y, con un peso de 600 gramos, el Maxtang MTN-FP750 es relativamente ligero. La fuente de alimentación inclina la balanza con poco menos de 290 gramos. El Maxtang MTN-FP750 también puede fijarse a un monitor y en la caja se incluye un soporte VESA.
Características
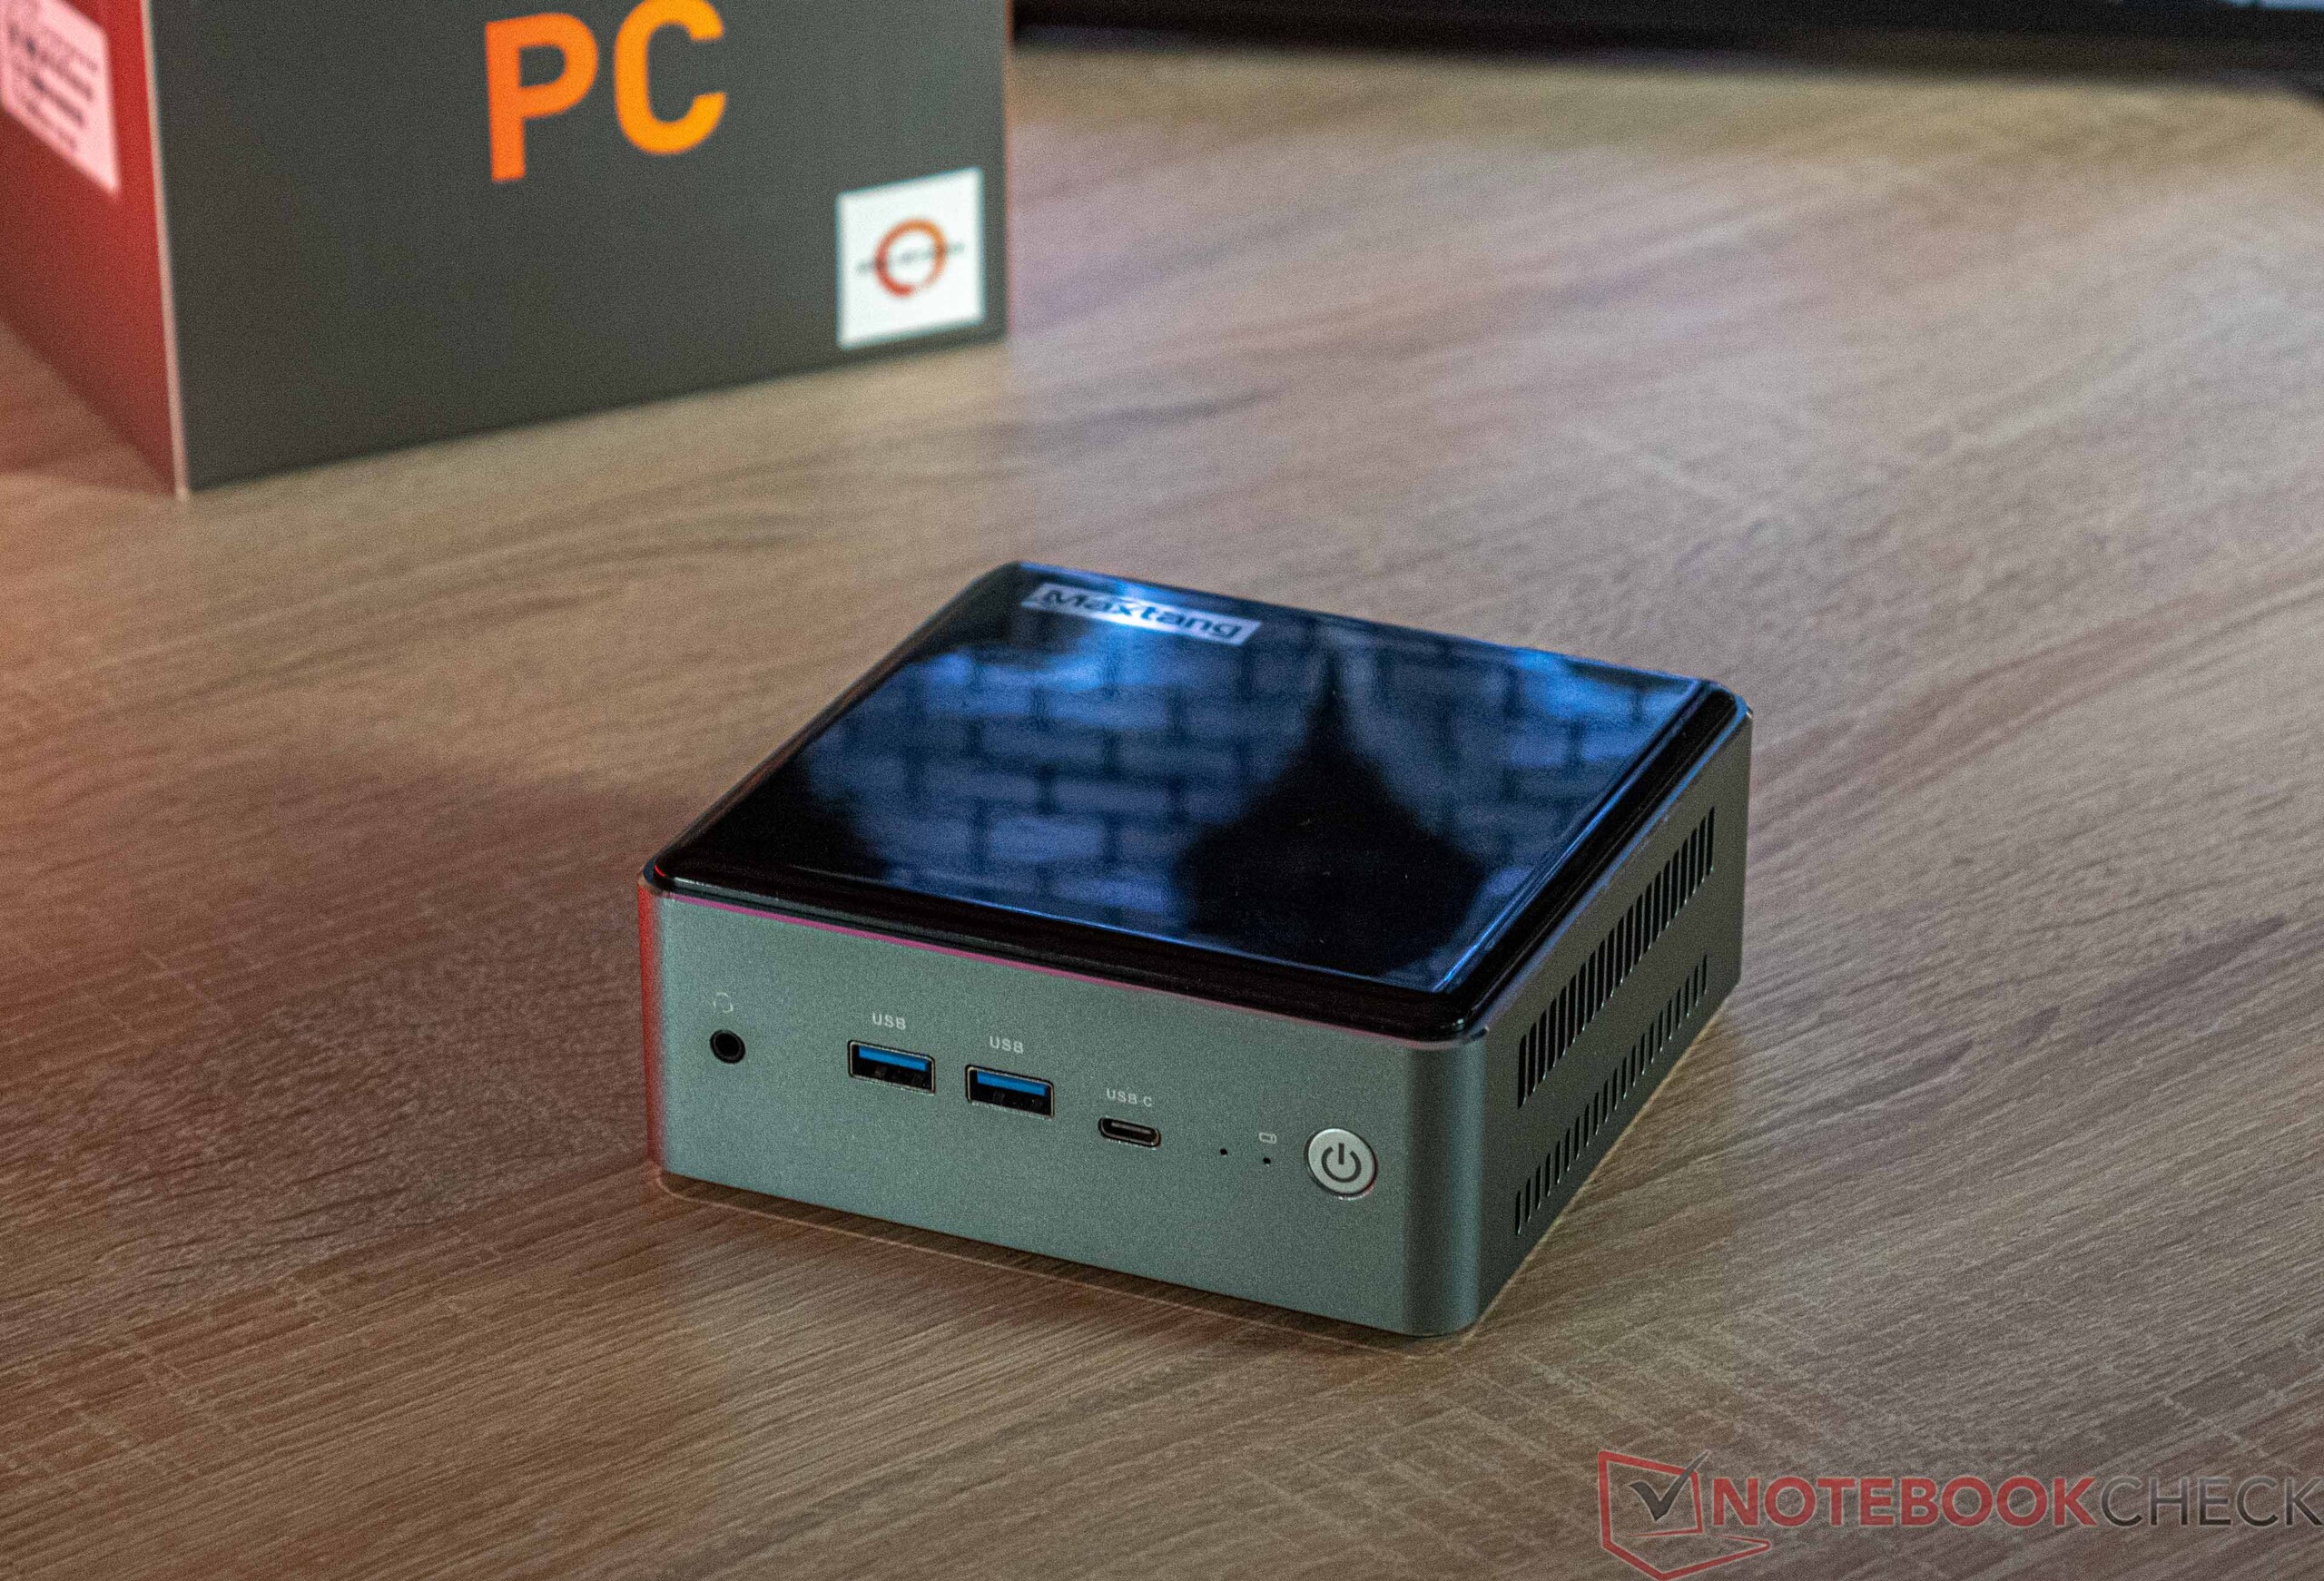
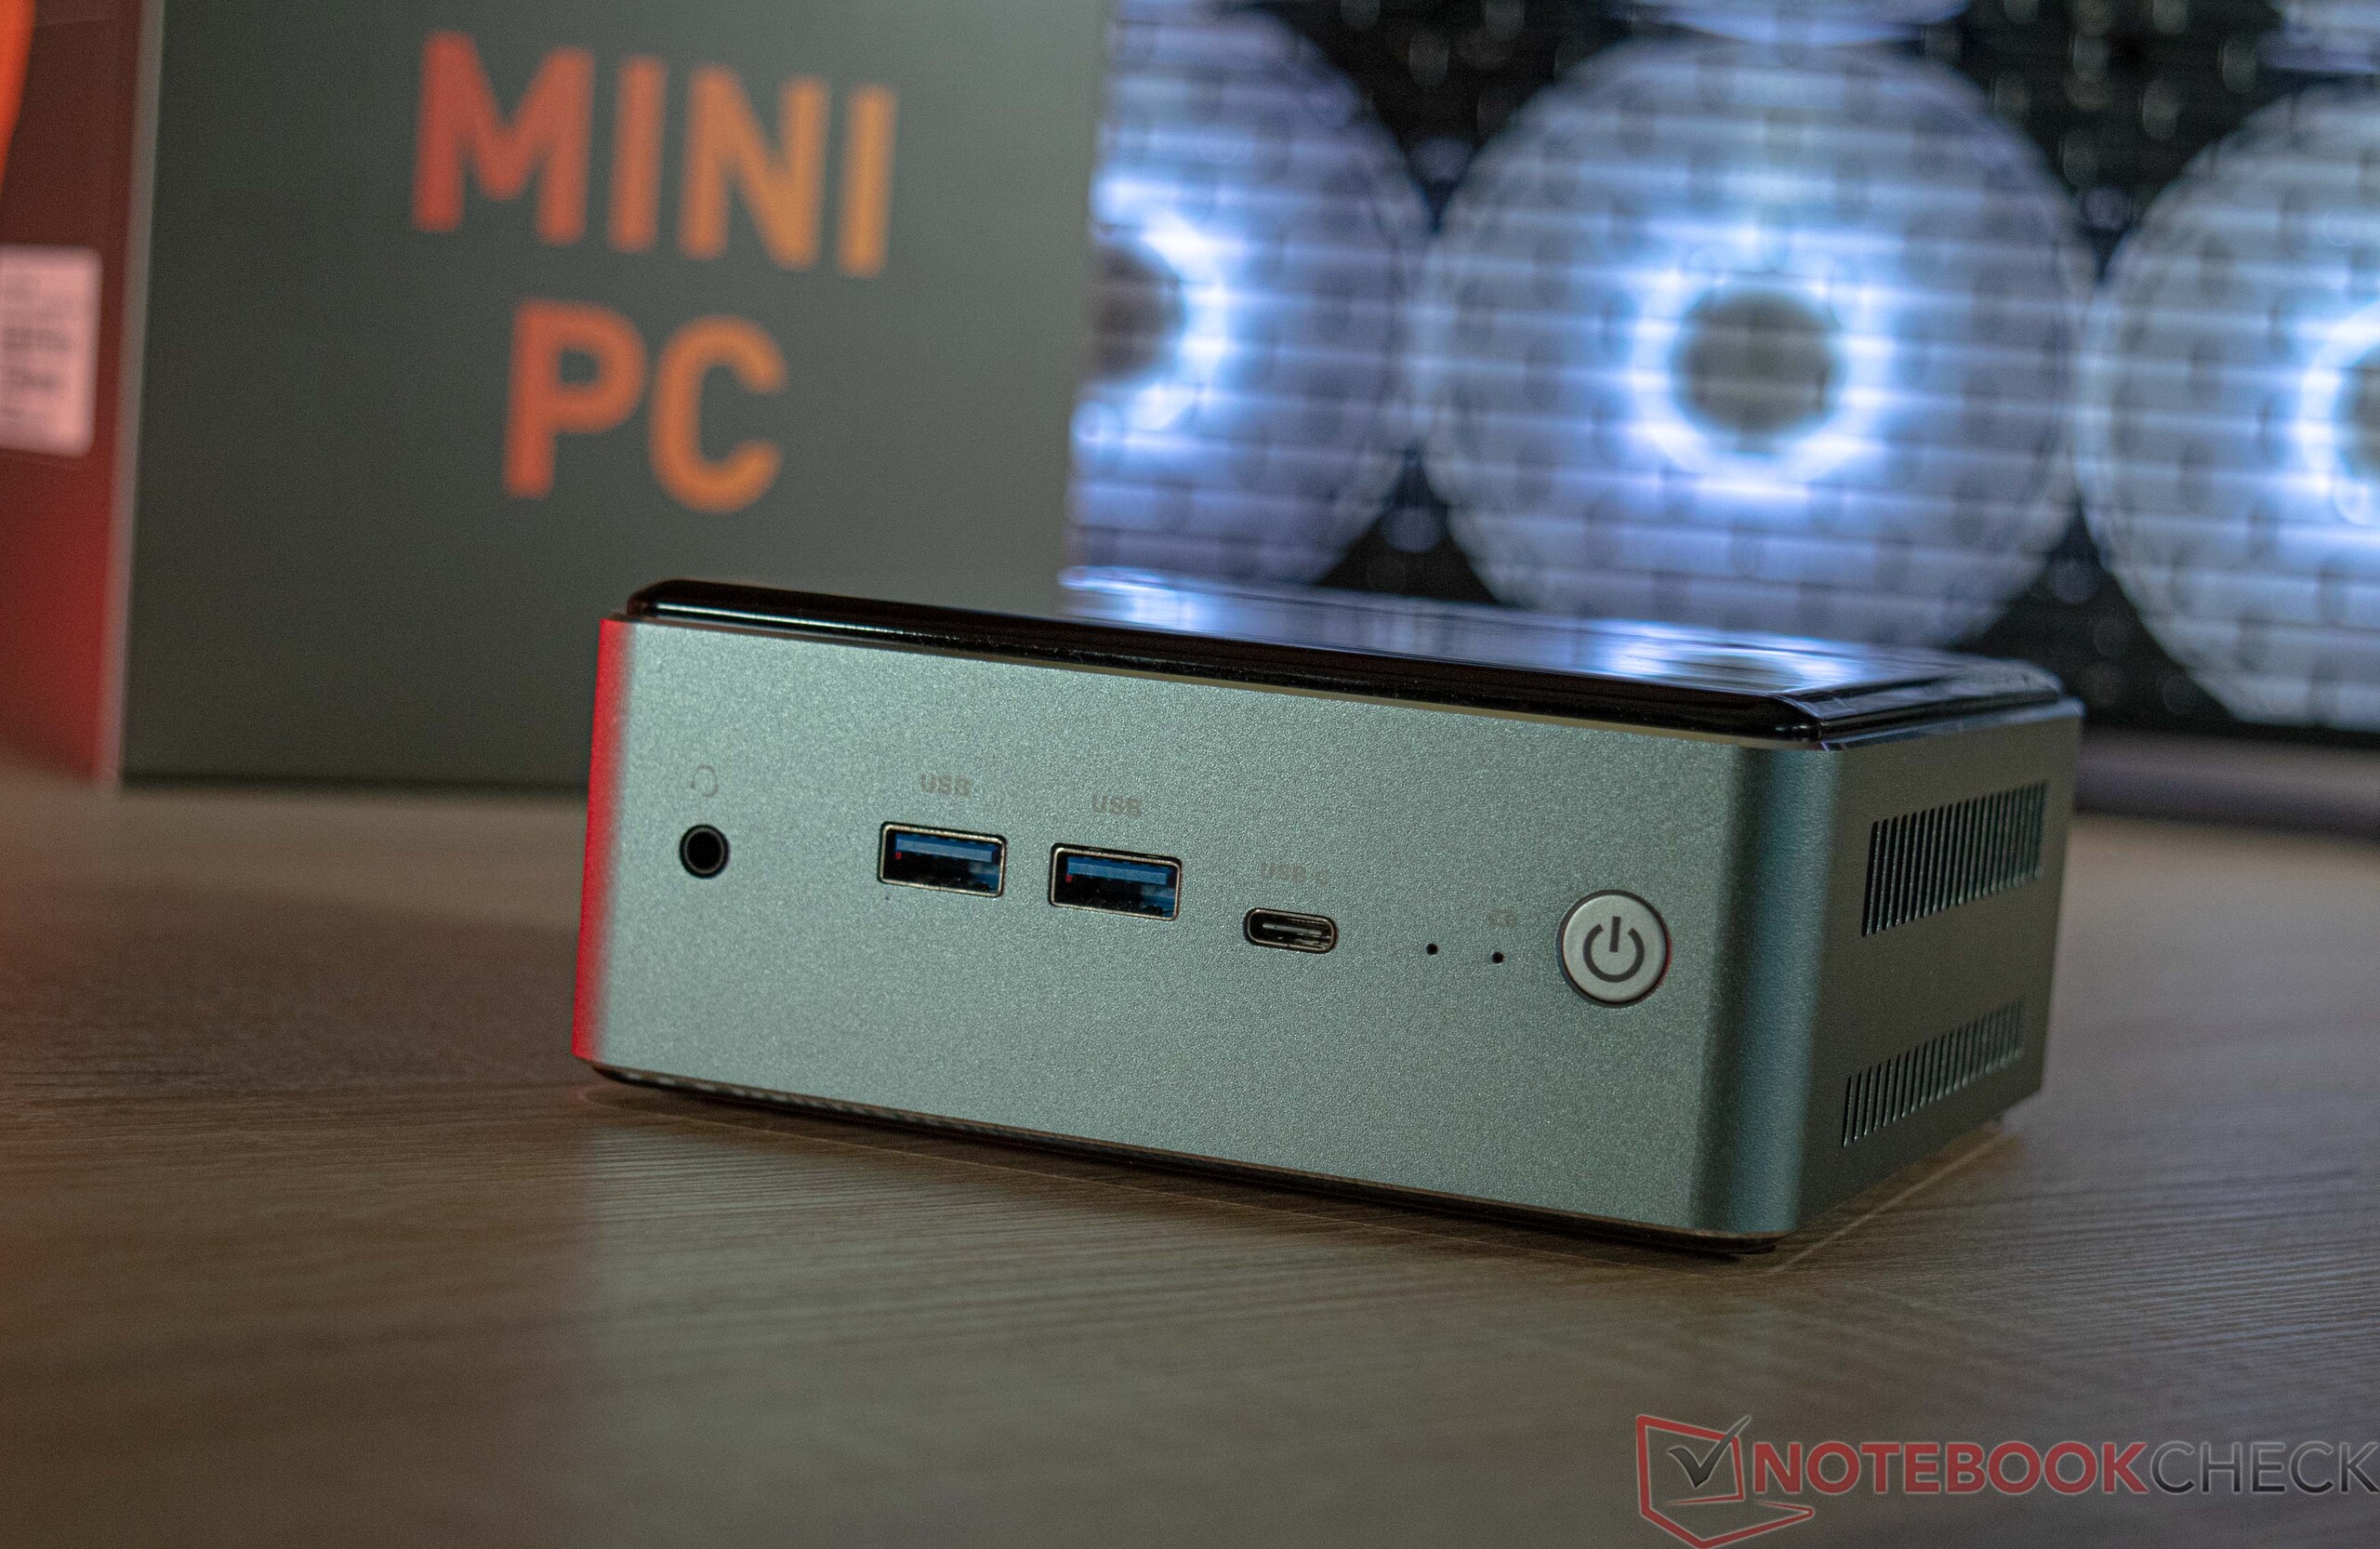
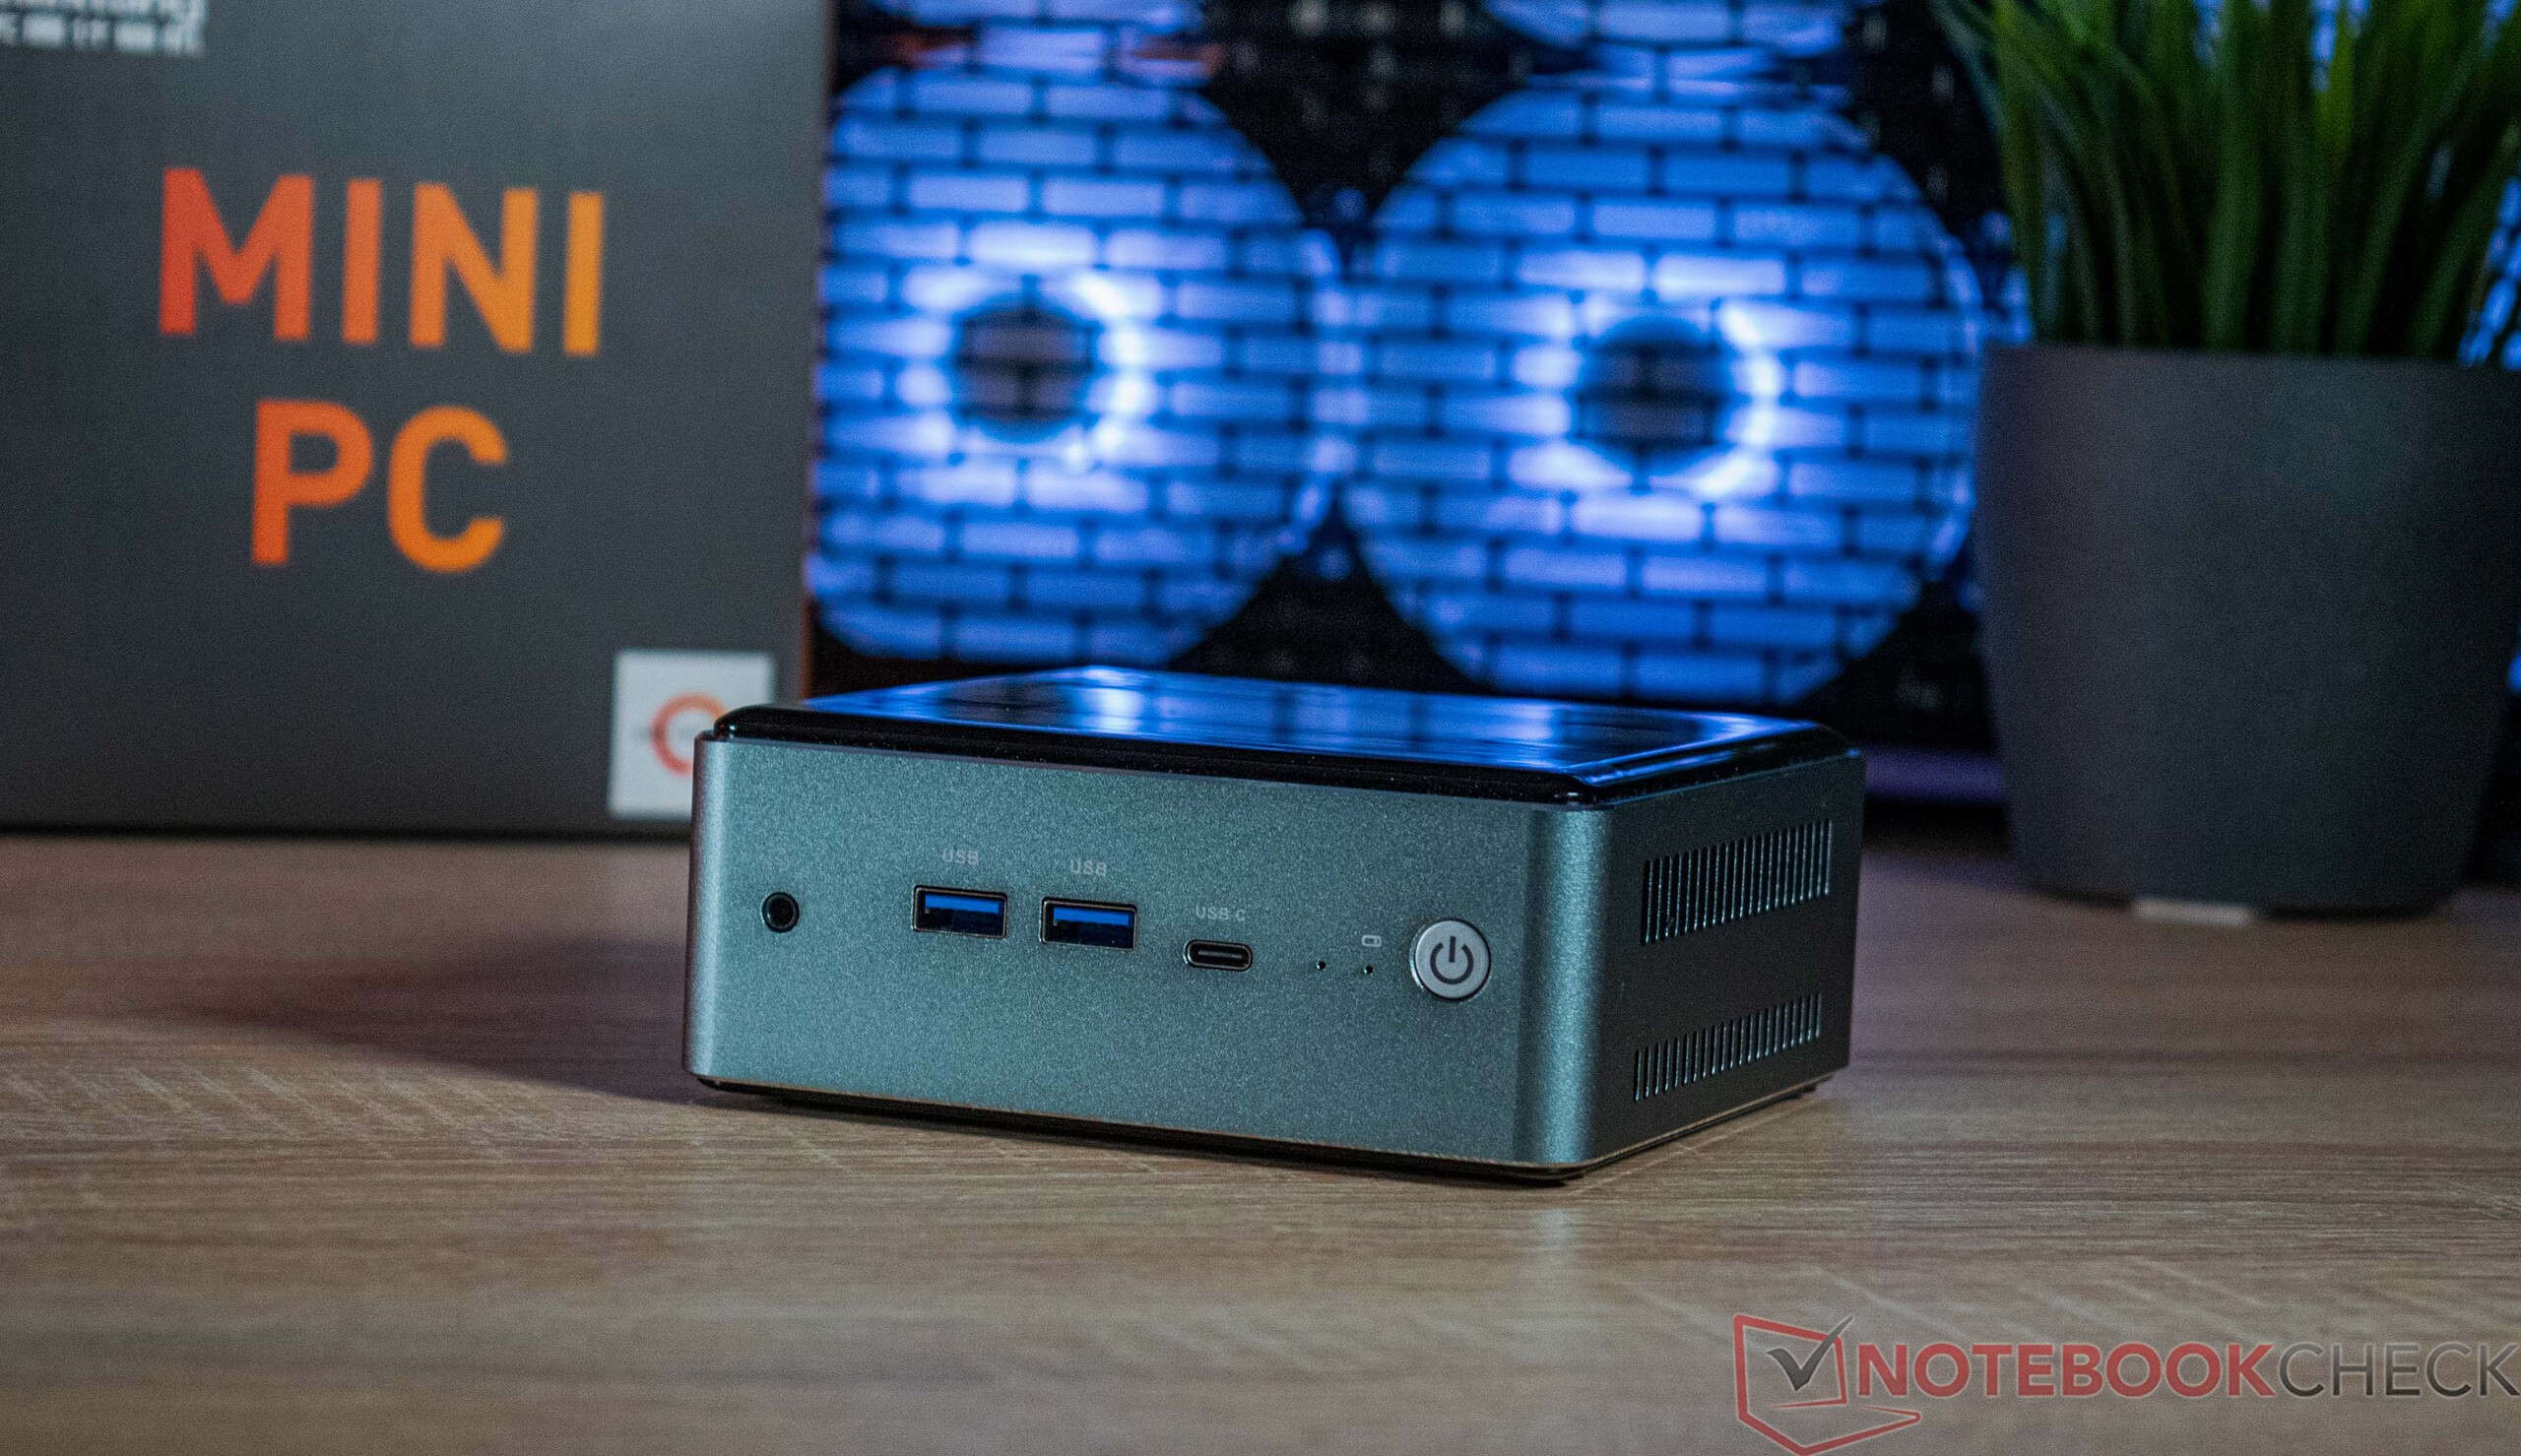
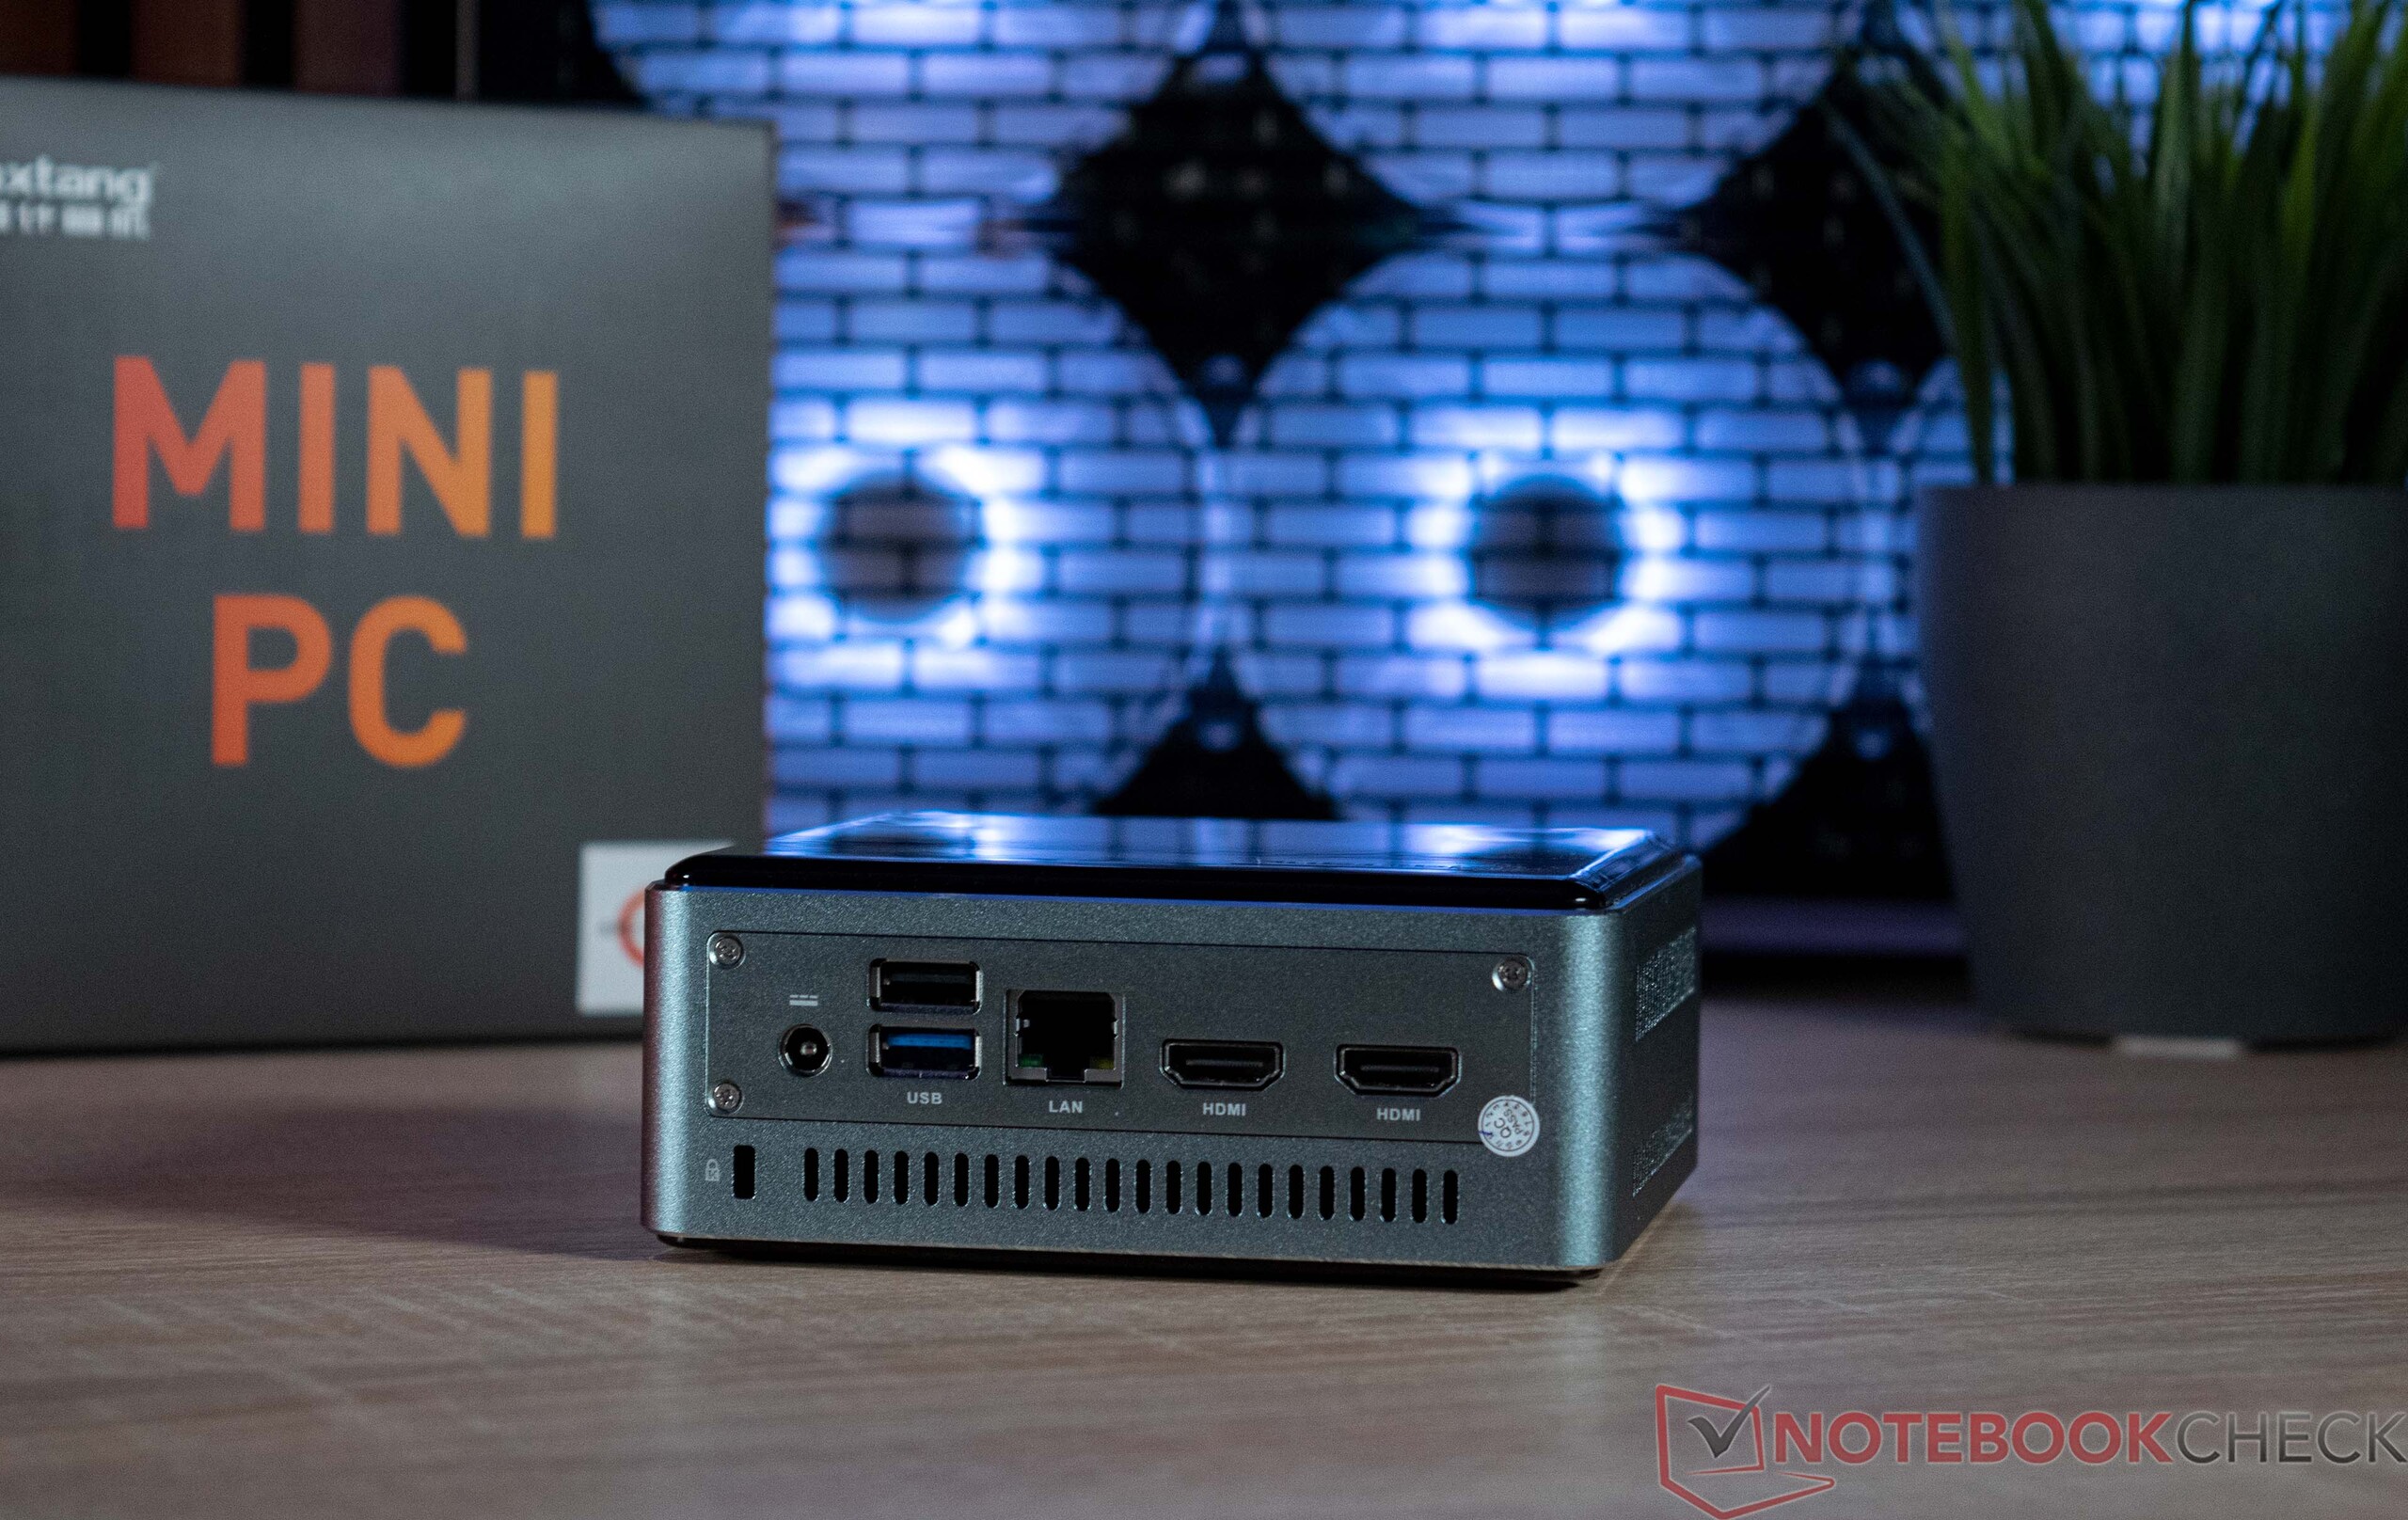
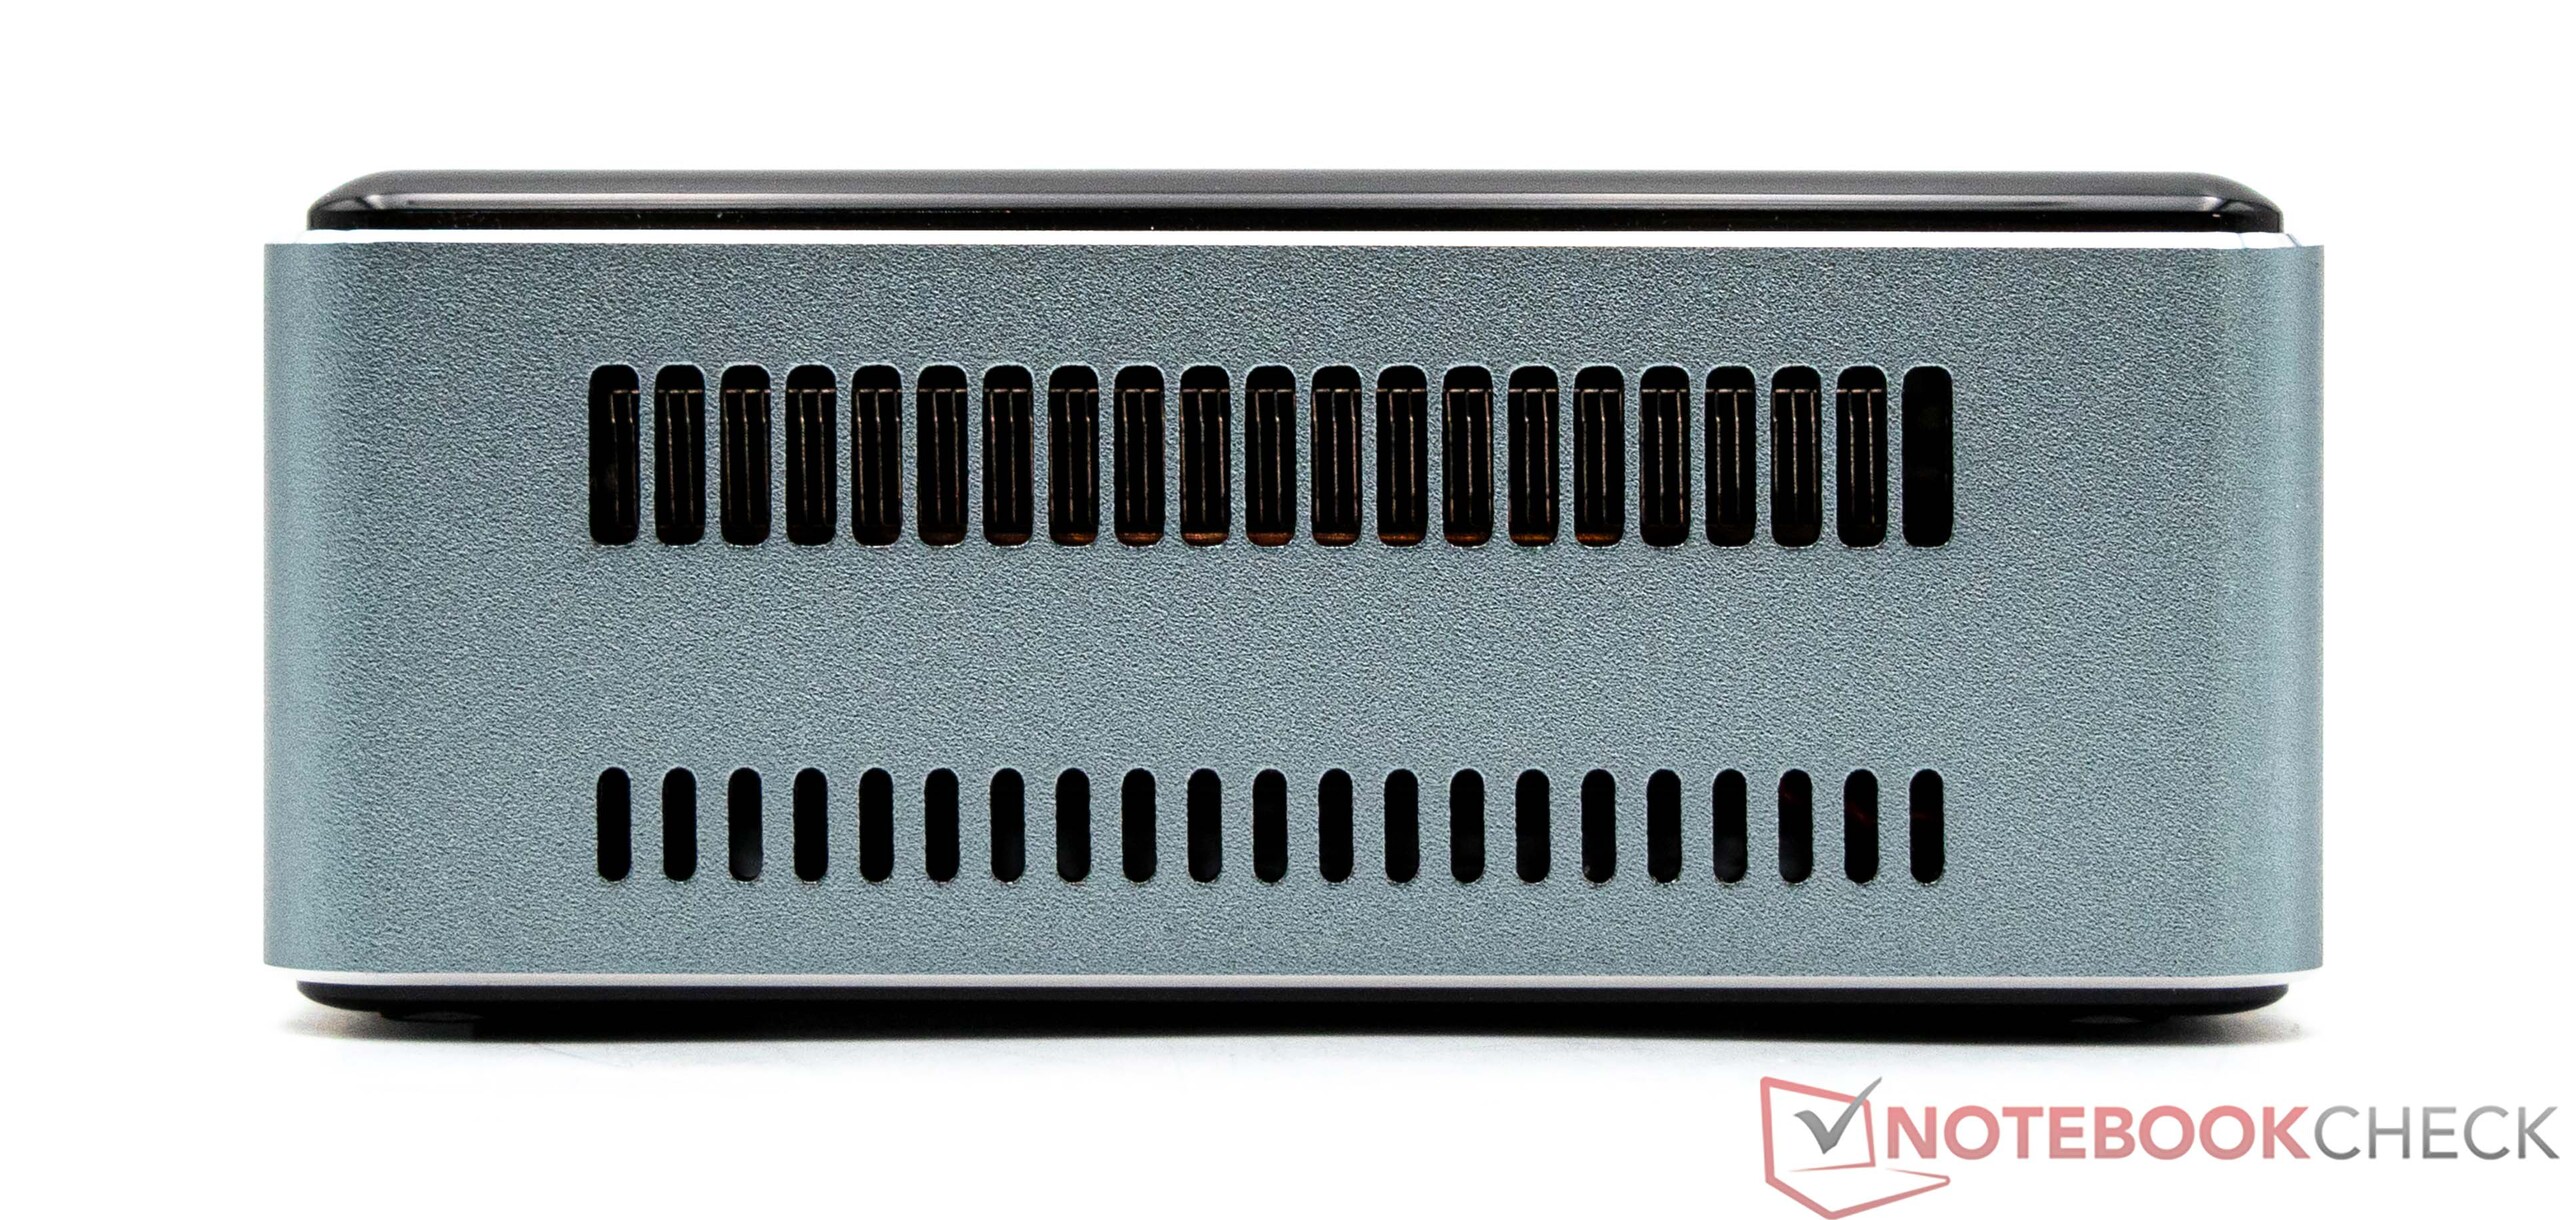
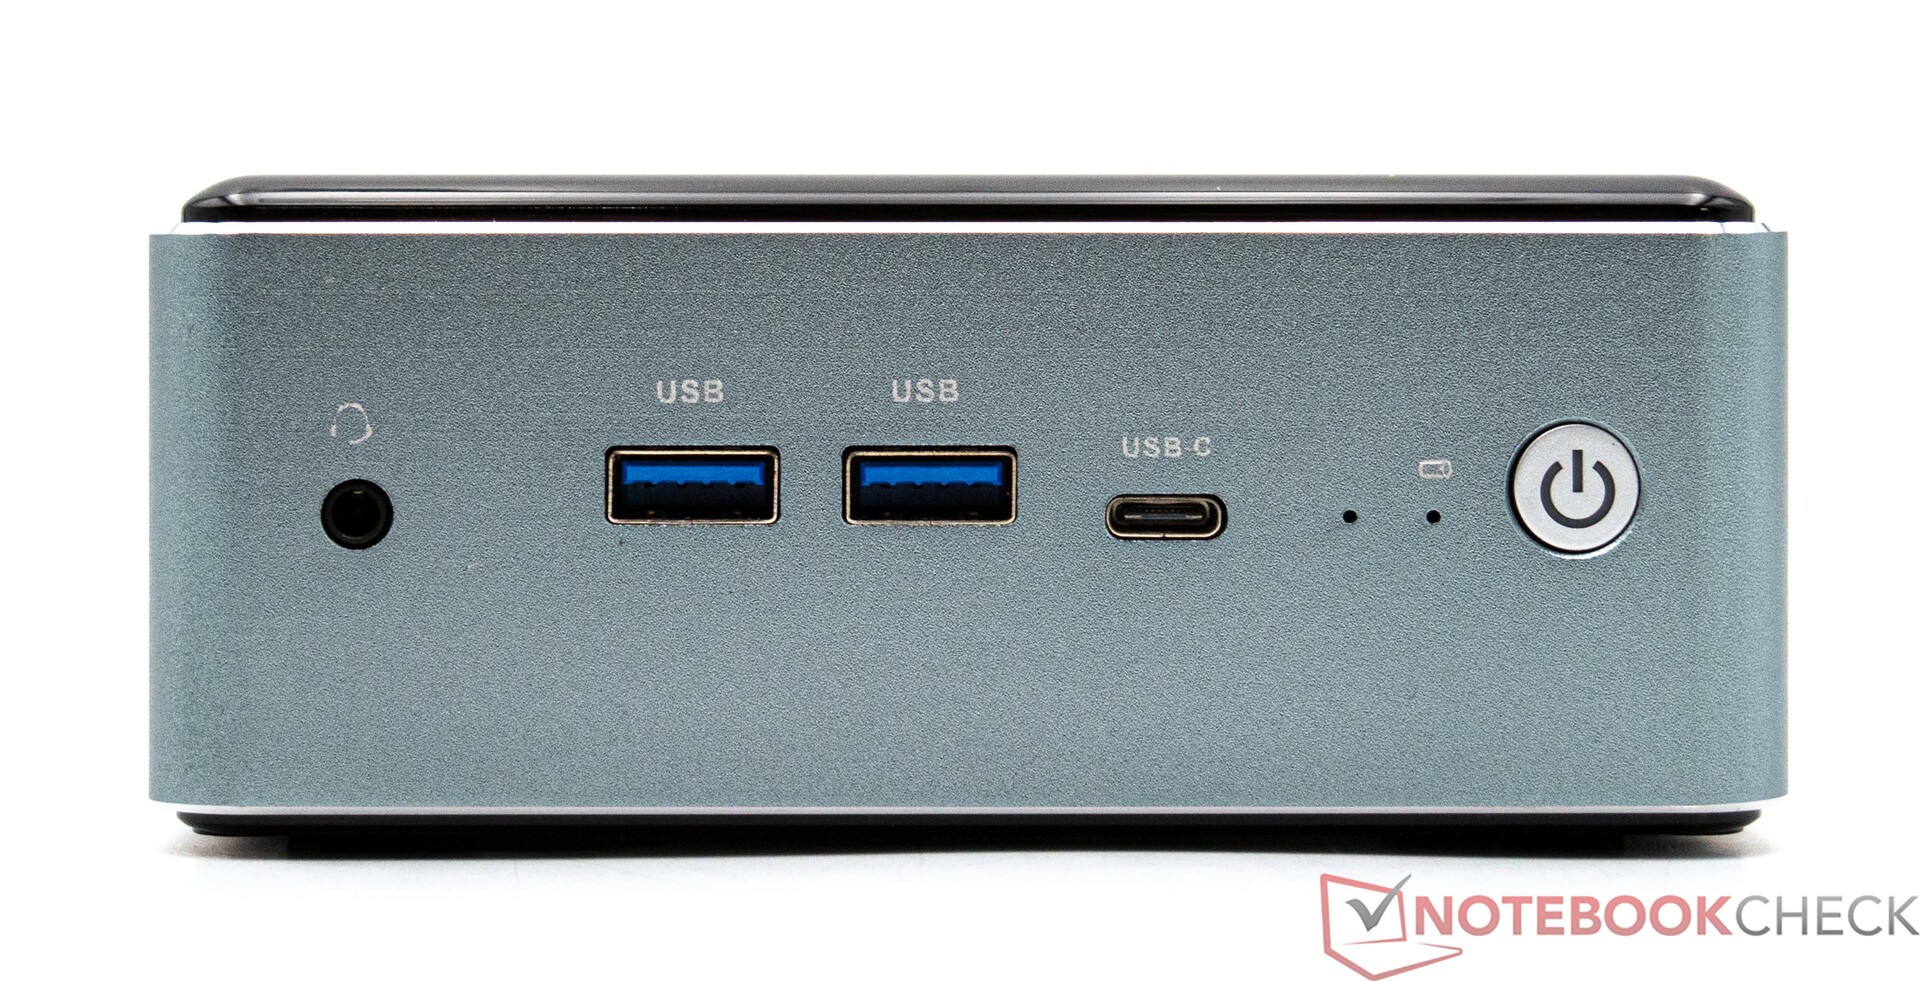
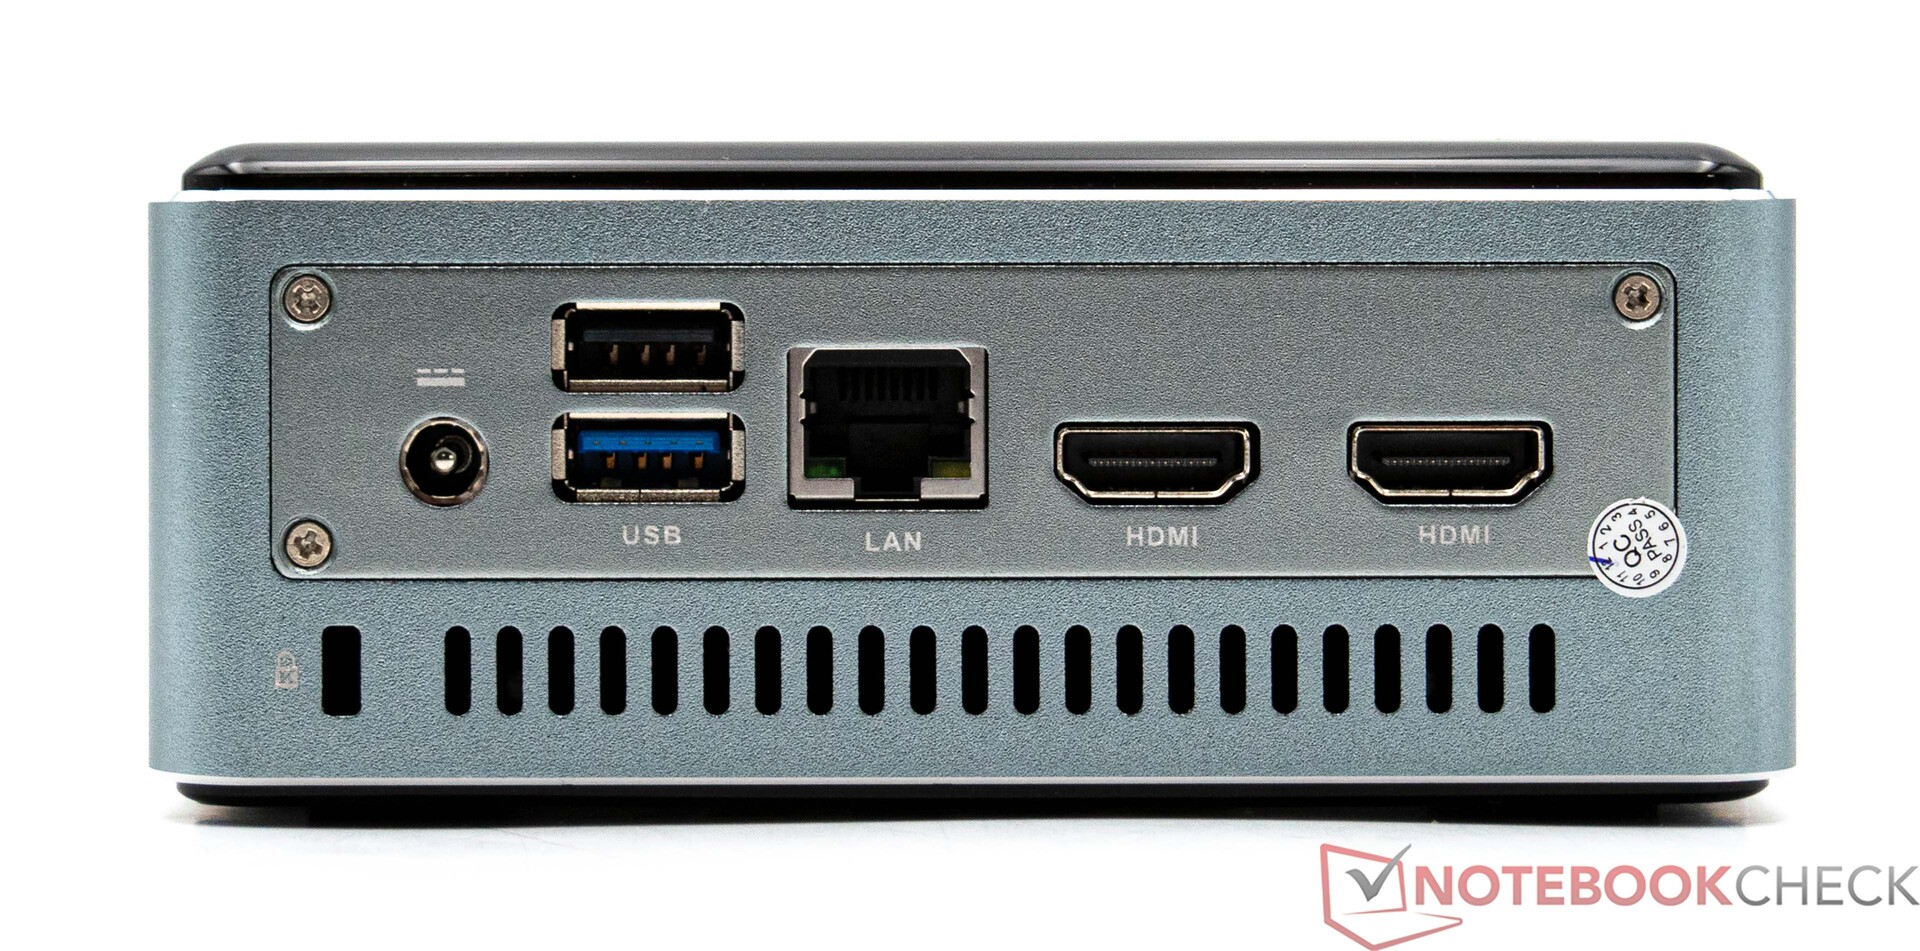
En cuanto a puertos, el Maxtang MTN-FP750 ofrece los básicos. Todos ellos se encuentran en la parte delantera y trasera. Hay un total de cinco puertos USB, uno de los cuales (USB tipo C) puede utilizarse también como conector de pantalla. Junto con las dos salidas HDMI de la parte trasera, esto significa que pueden funcionar simultáneamente un total de tres monitores. Además, la parte trasera del dispositivo también alberga el puerto LAN 2,5G.
Comunicación
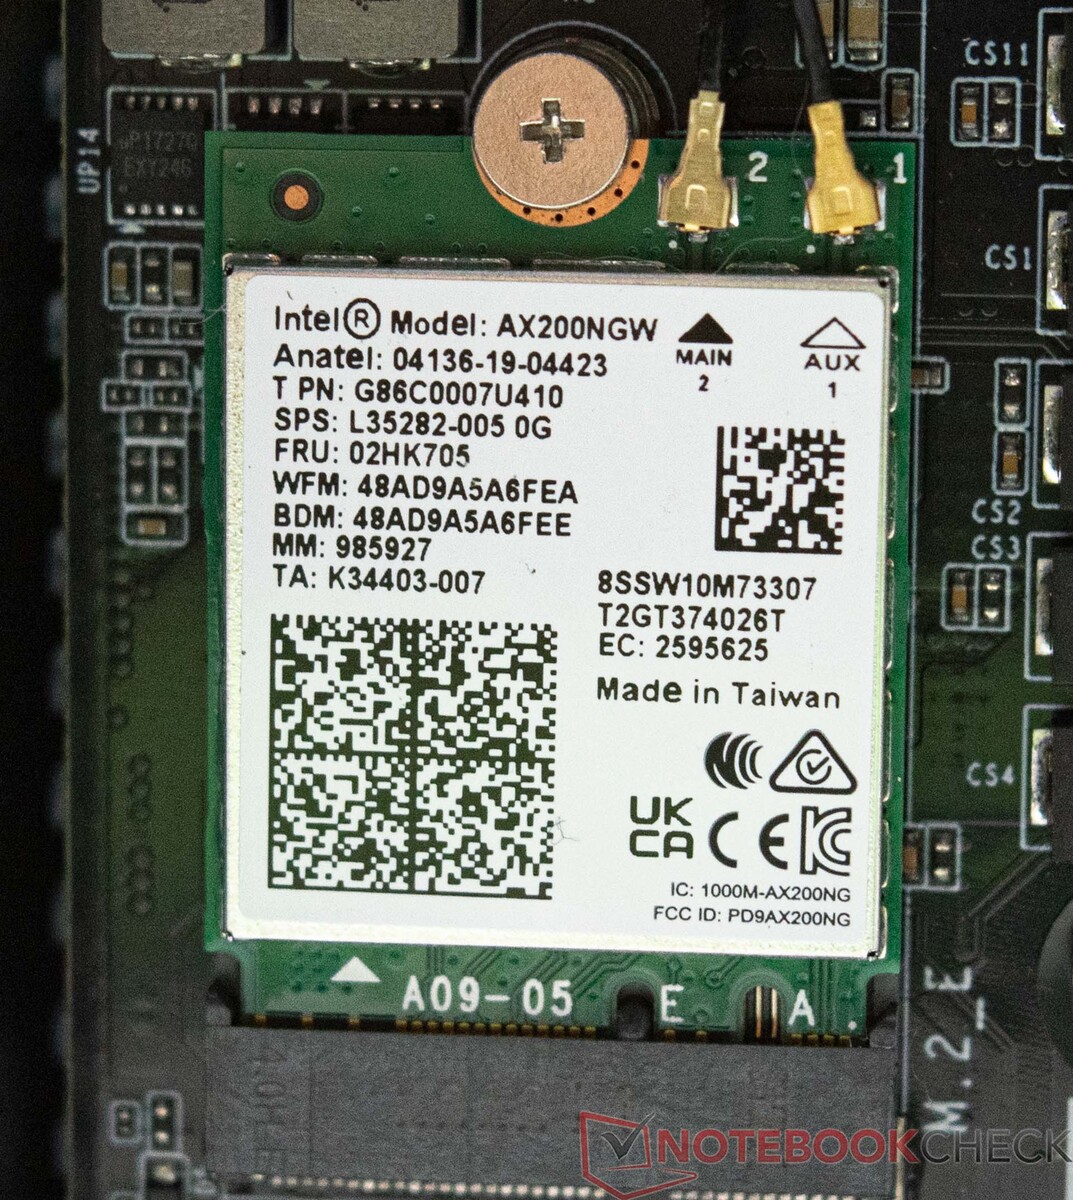
El Maxtang MTN-FP750 alberga un módulo inalámbrico Intel Wi-Fi 6 AX200 que puede manejar frecuencias de 2,4 y 5 GHz. En las pruebas, nuestra muestra de revisión no nos entusiasmó precisamente con unos resultados impresionantes. Para la prueba, utilizamos un Asus ROG Rapture GT-AXE11000. Como alternativa, también puede conectar el mini PC Maxtang a la red a través de un puerto ethernet. Son posibles velocidades de transferencia de hasta 2,5 Gbit/s.
Accesorios
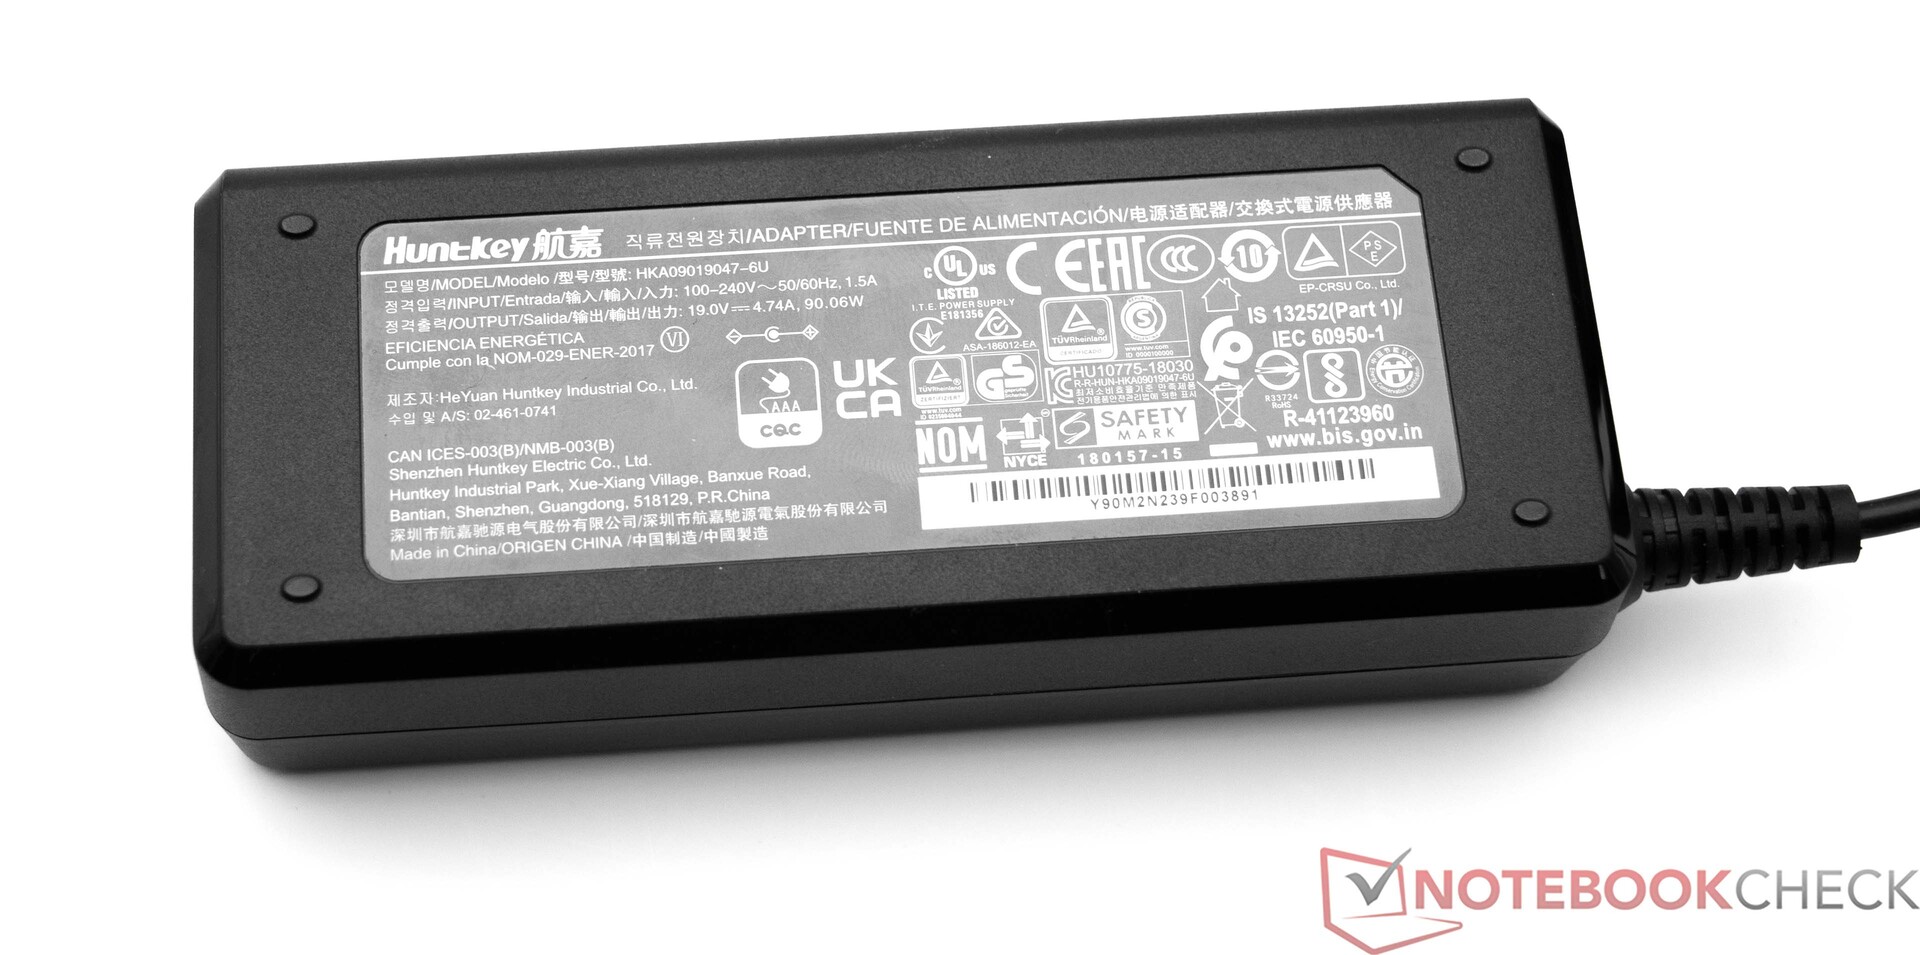
El Maxtang MTN-FP750 viene con todos los componentes más importantes para poner el aparato en funcionamiento. Además de la propia máquina, la caja contiene una fuente de alimentación de 90 vatios (19 V; 4,74 A), así como una placa de montaje para el montaje VESA. Asimismo, un cable HDMI y una guía de configuración rápida también forman parte del paquete.
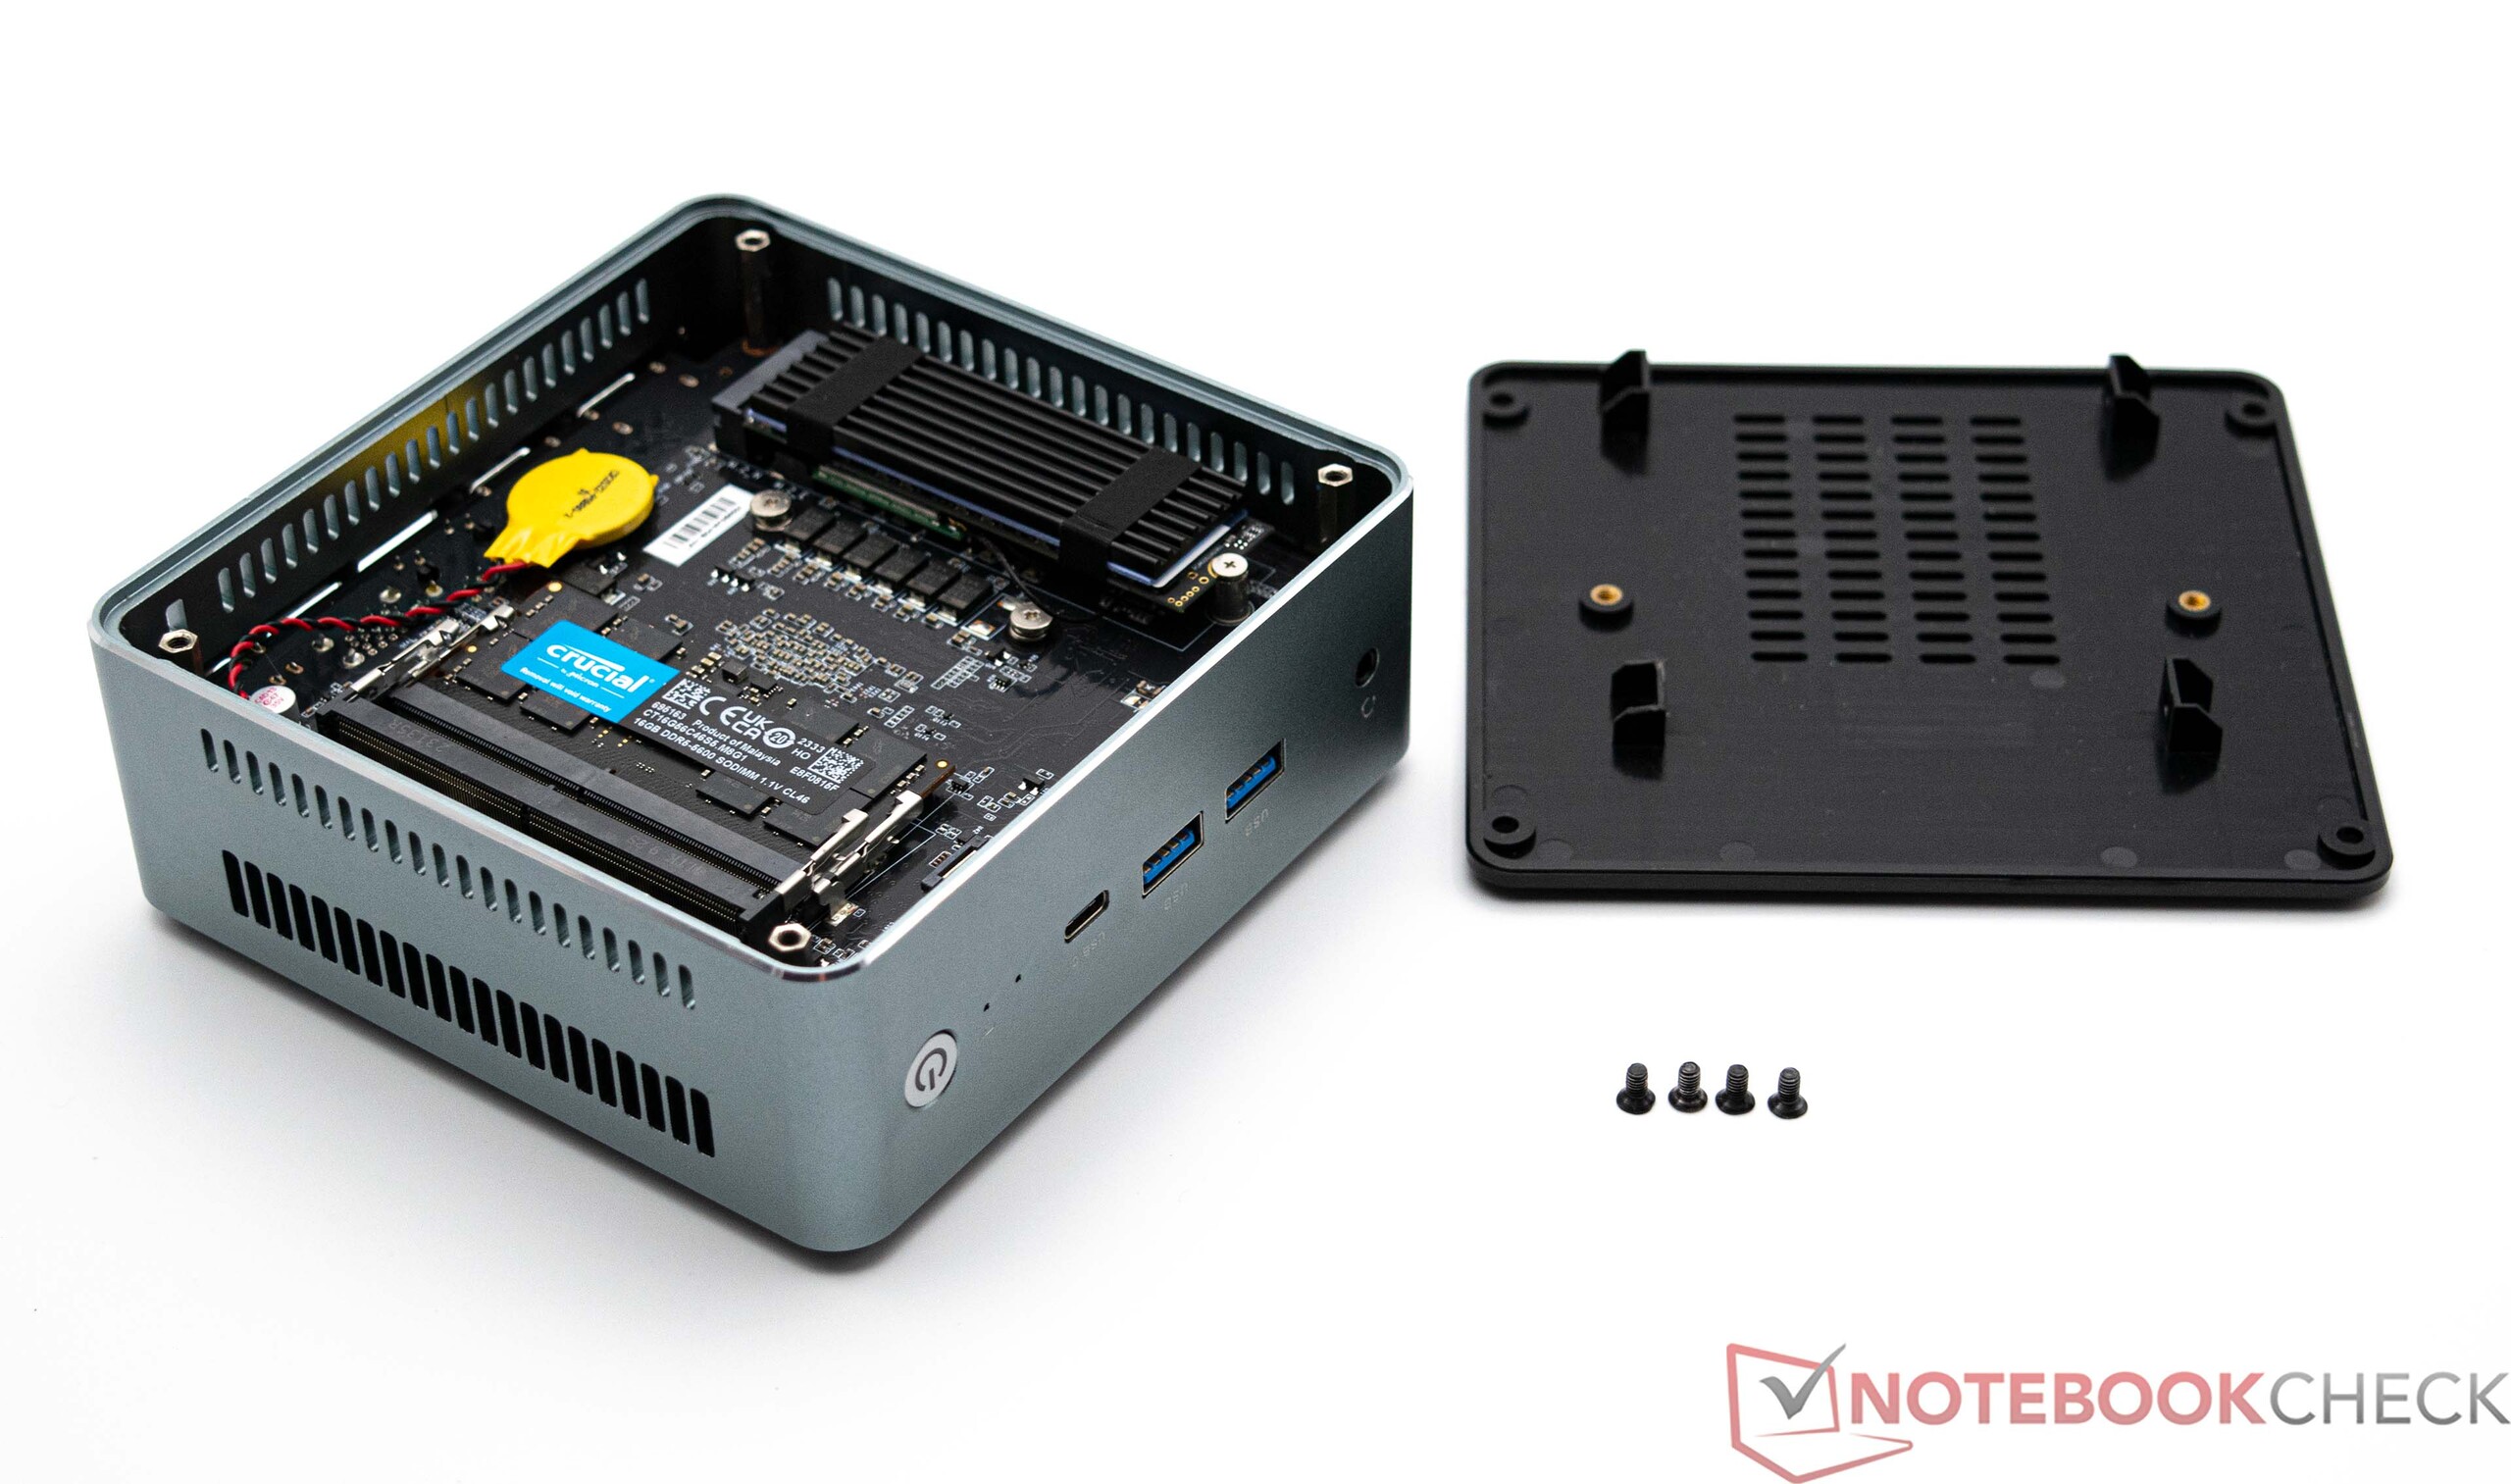
Mantenimiento
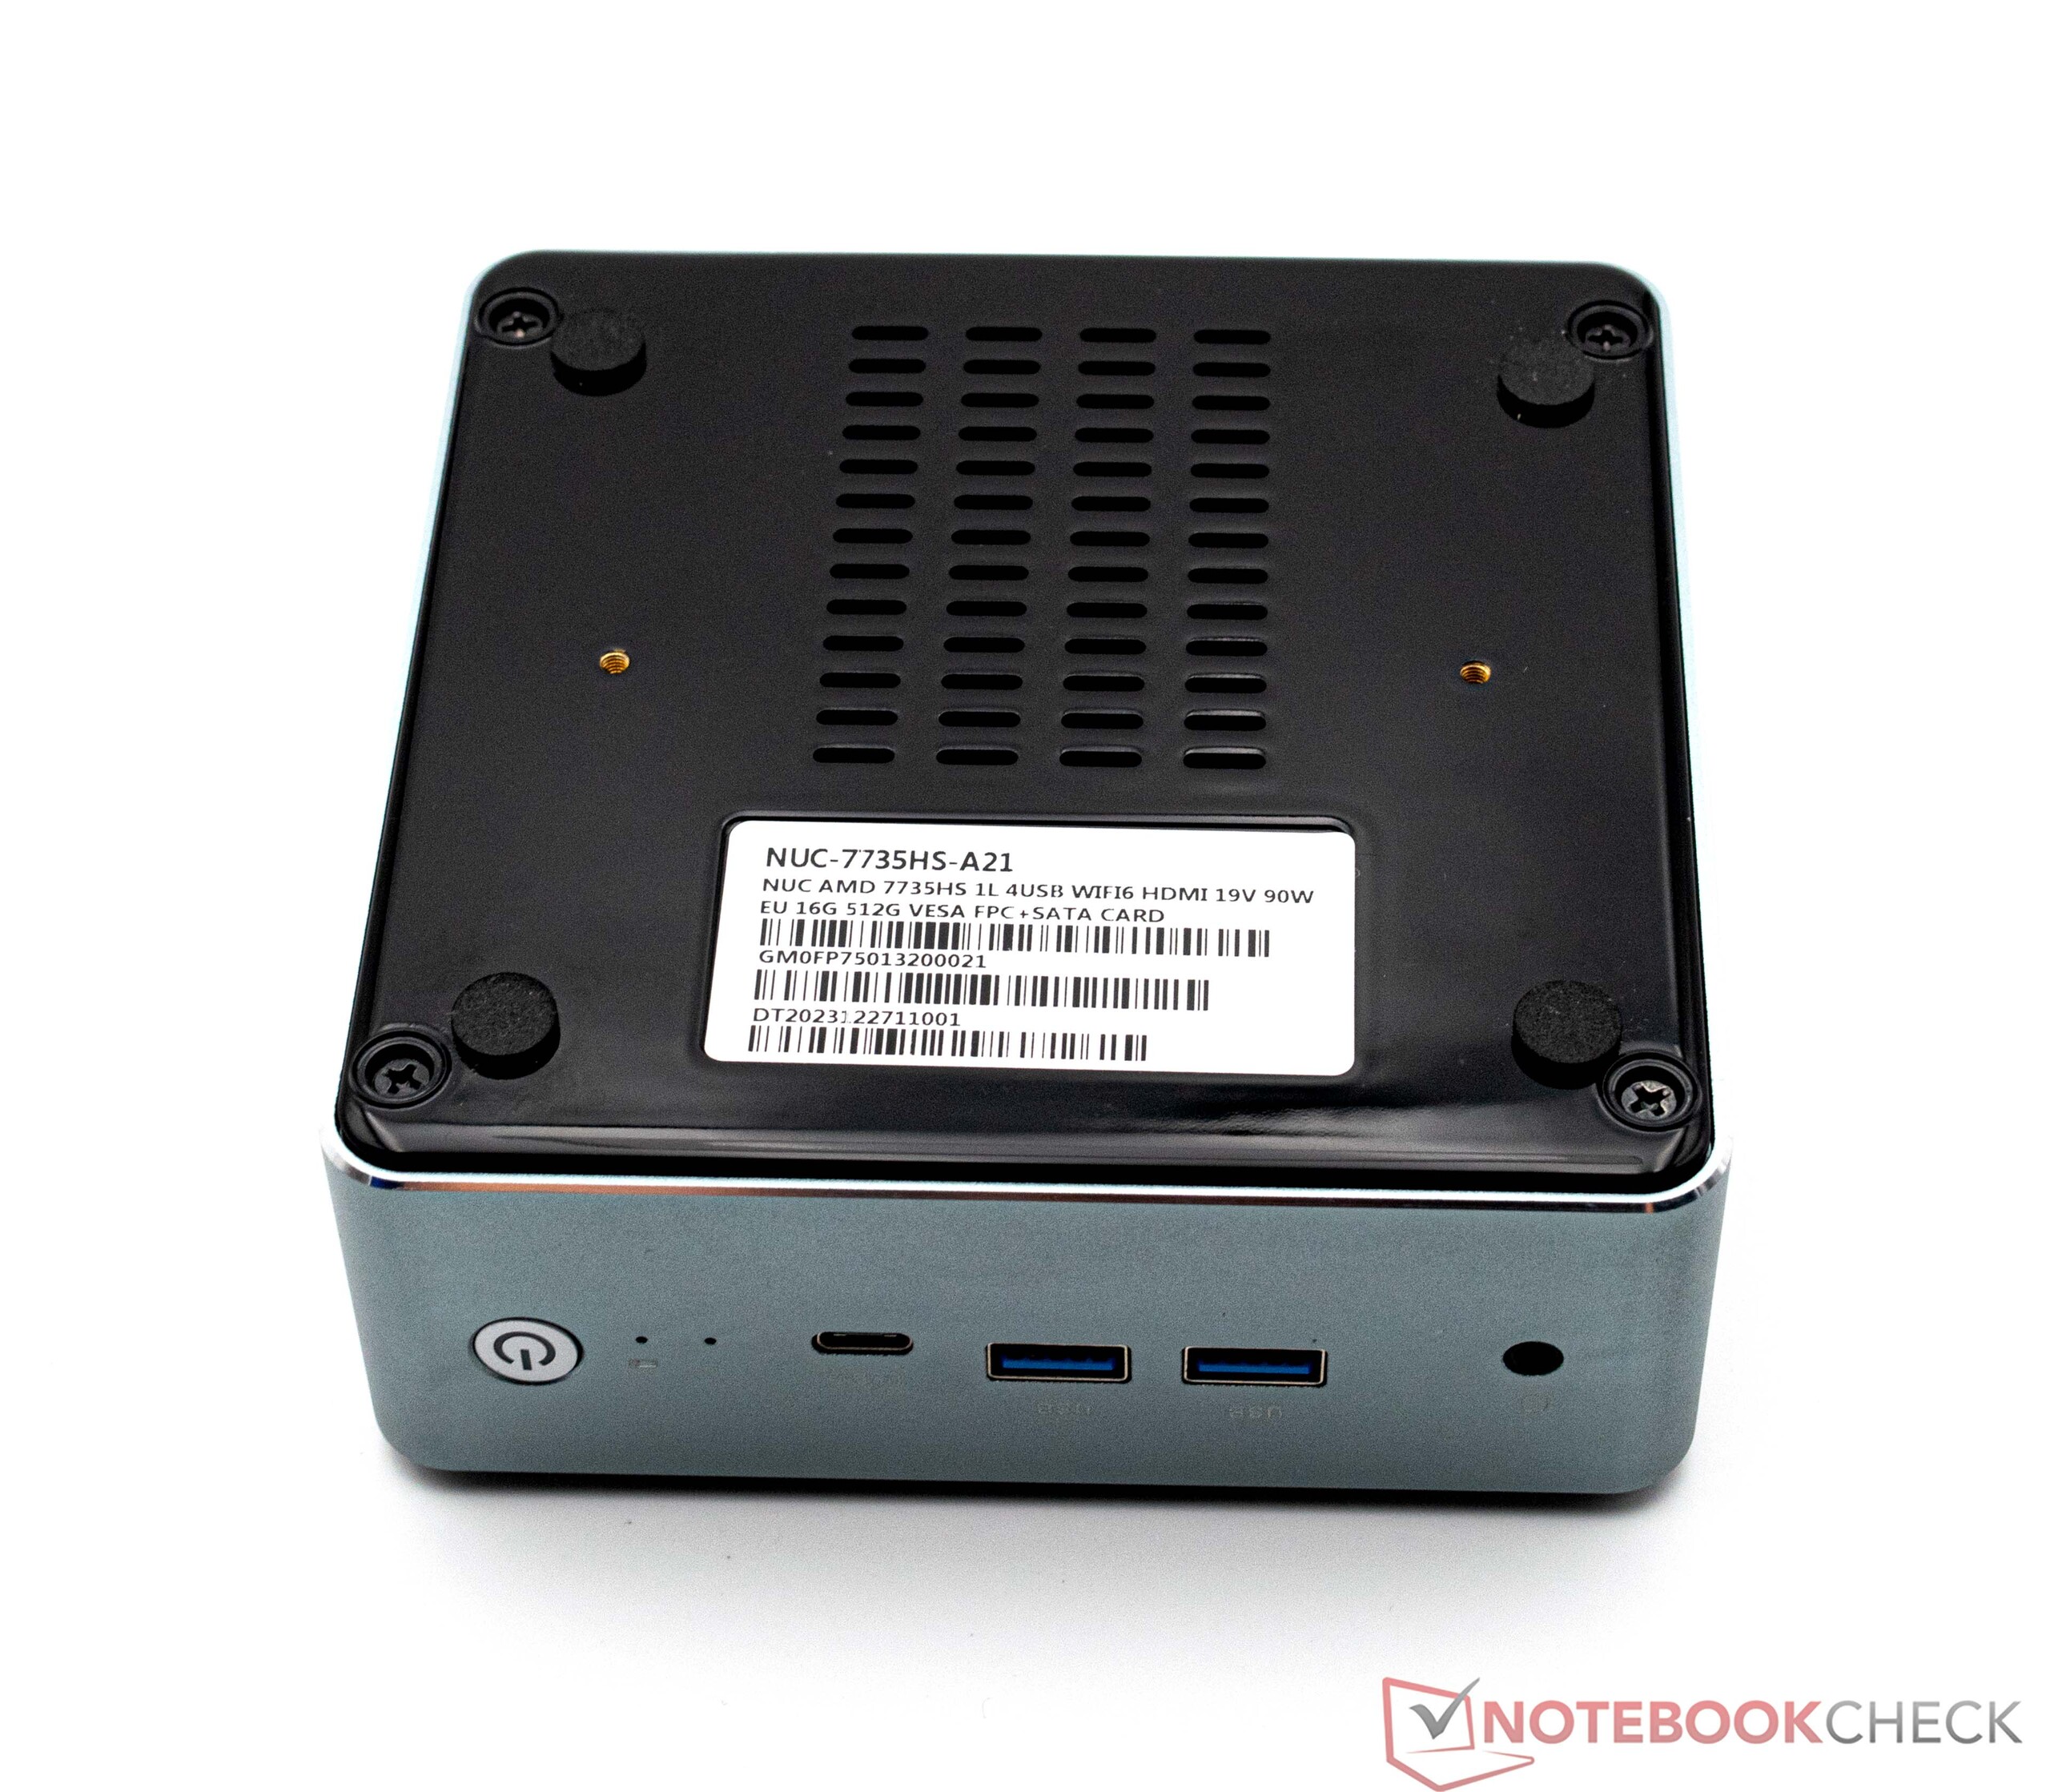
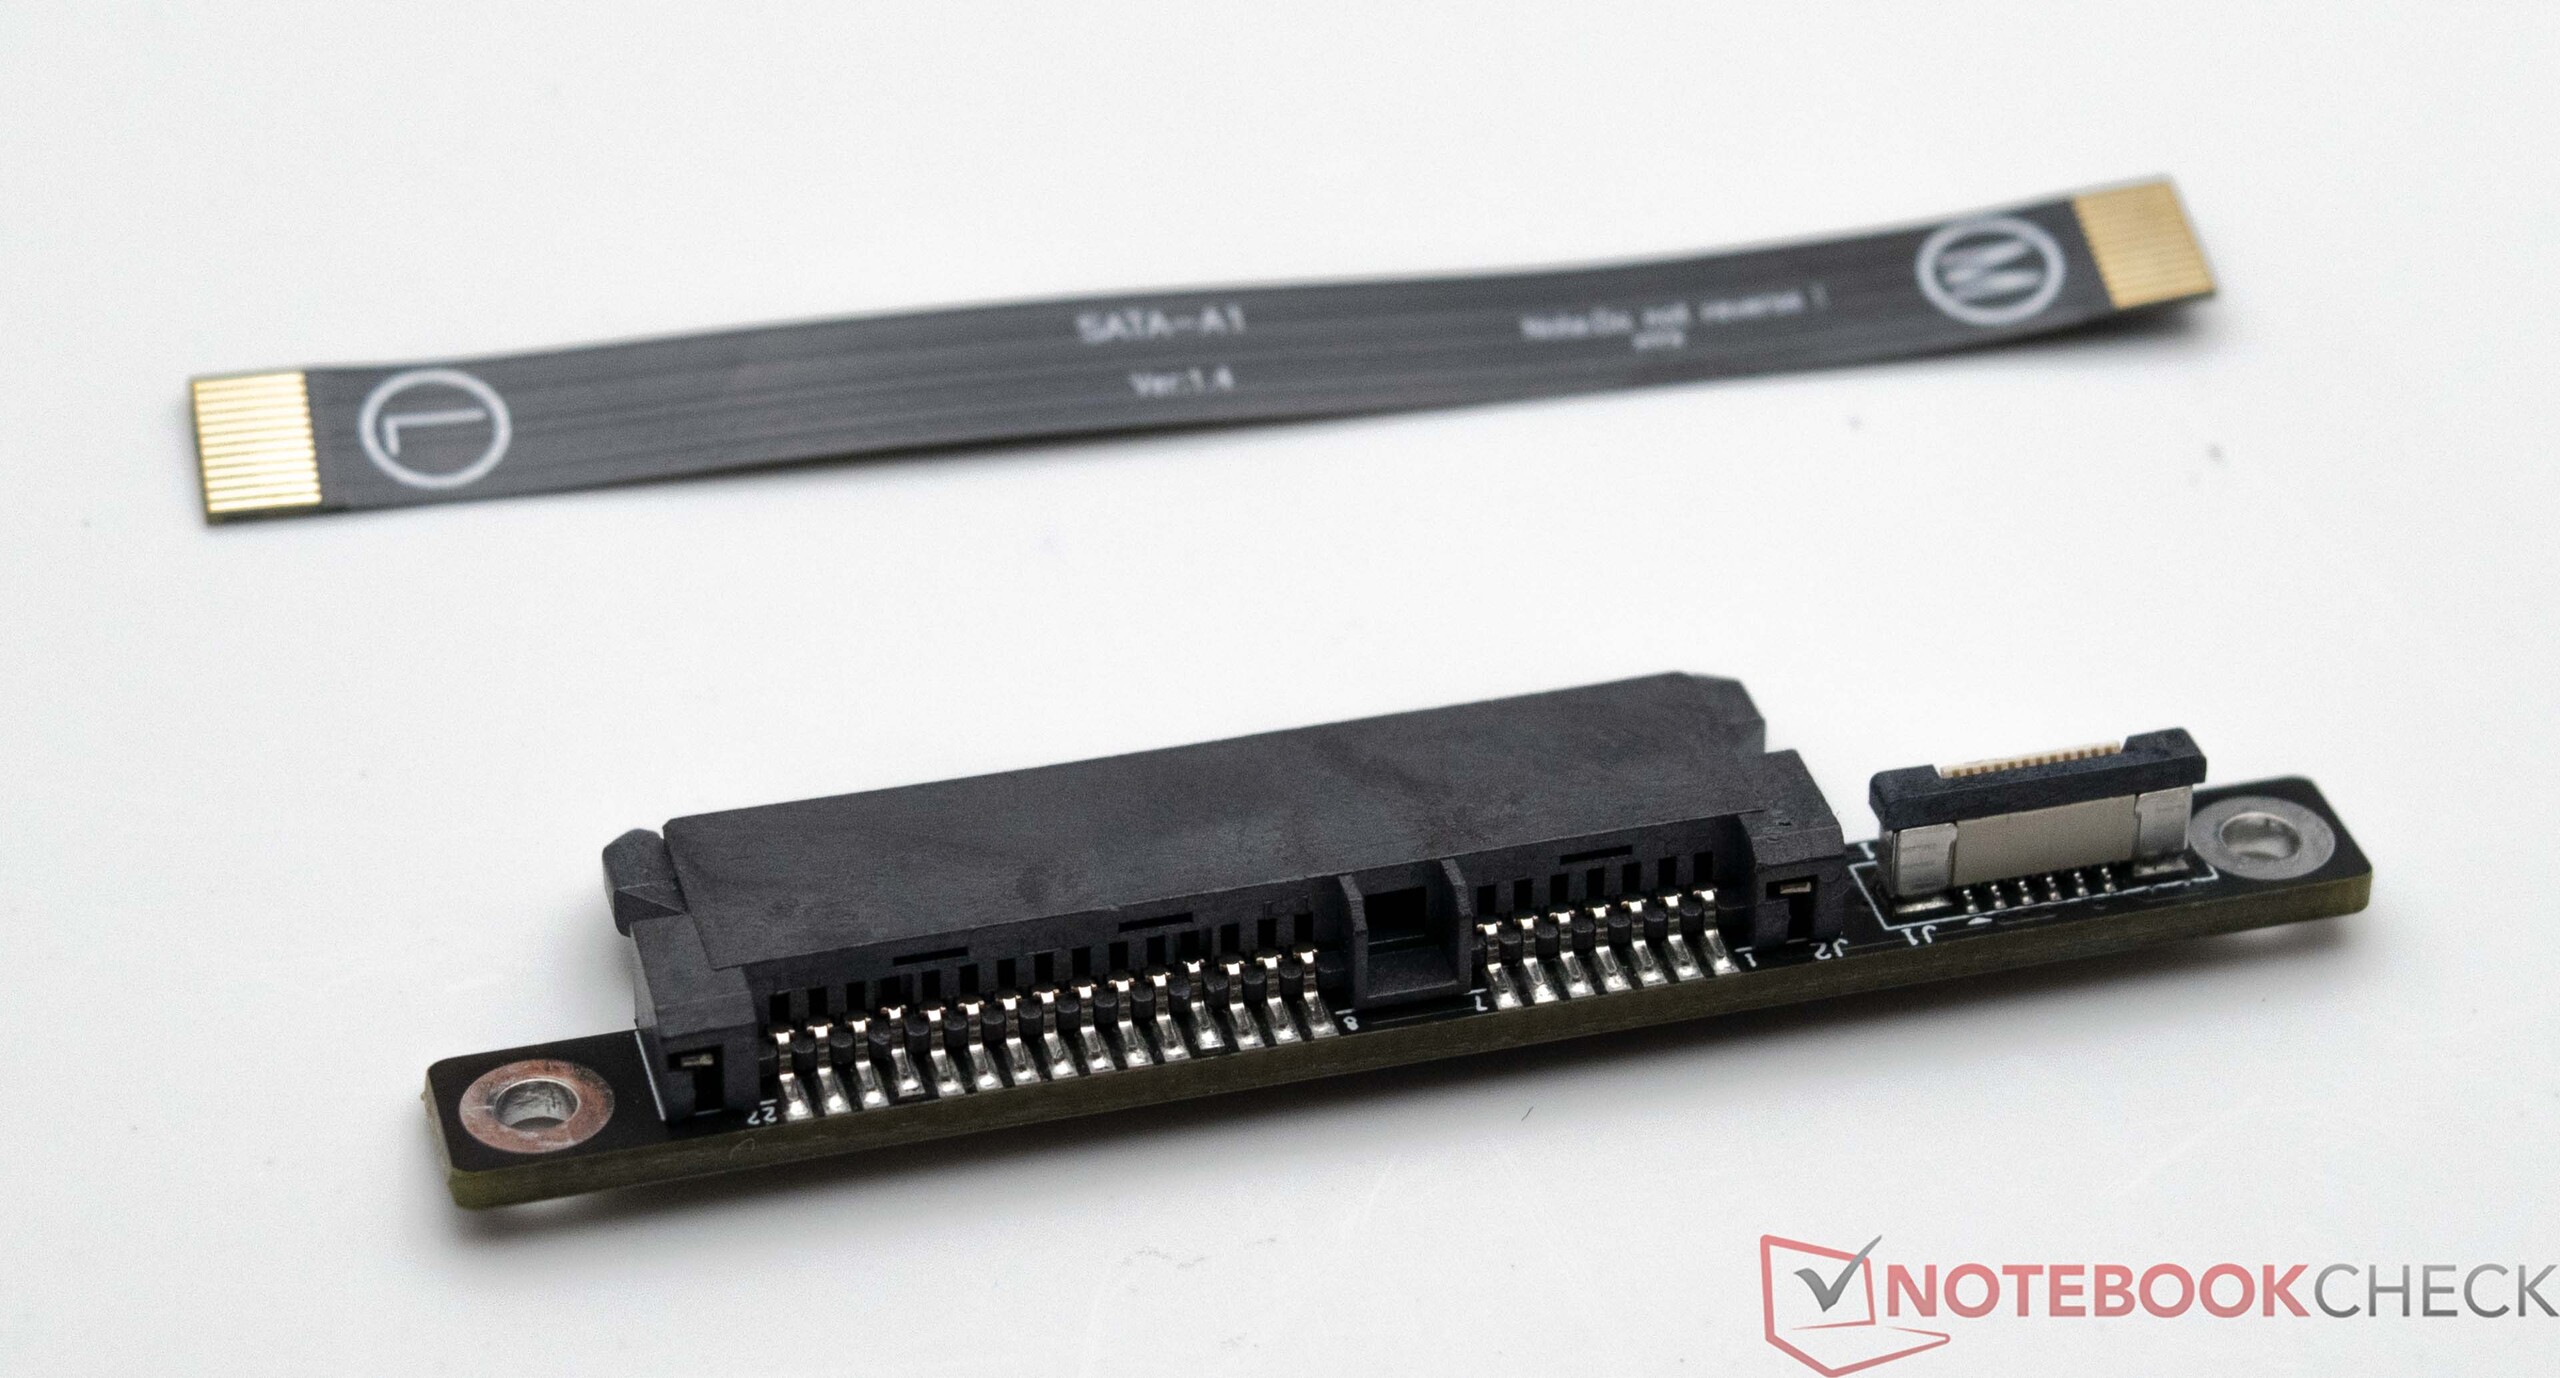
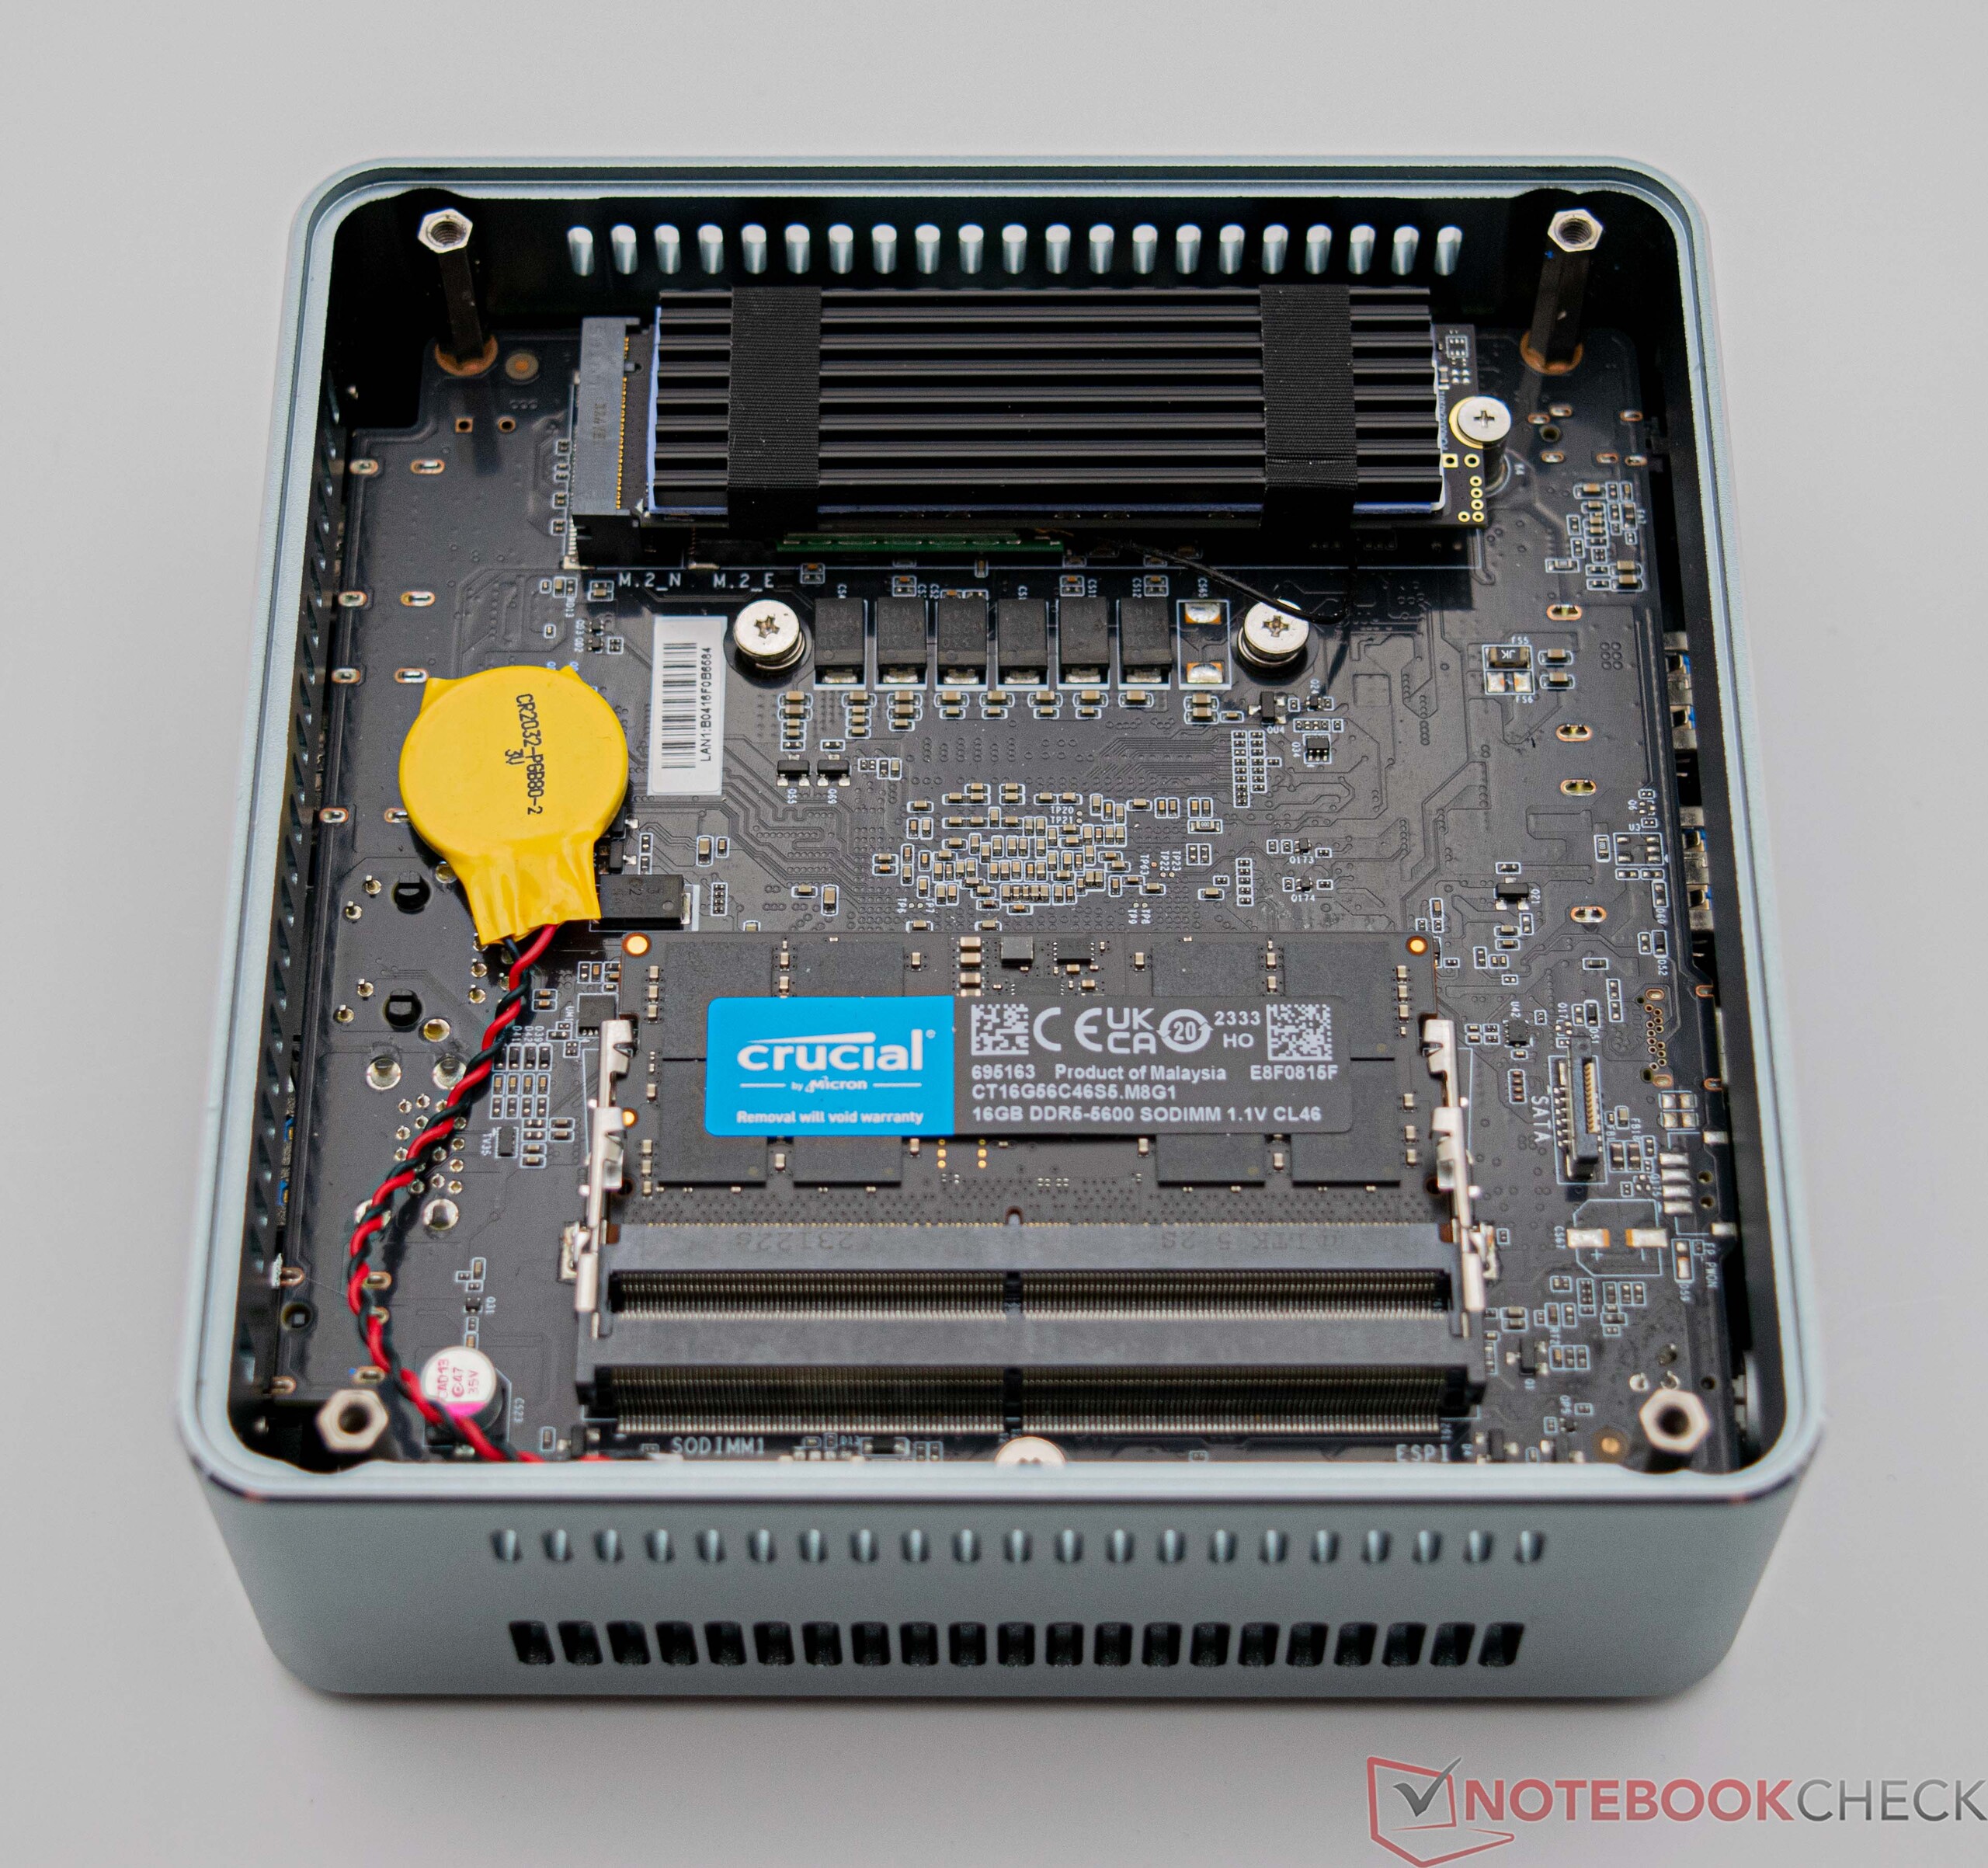
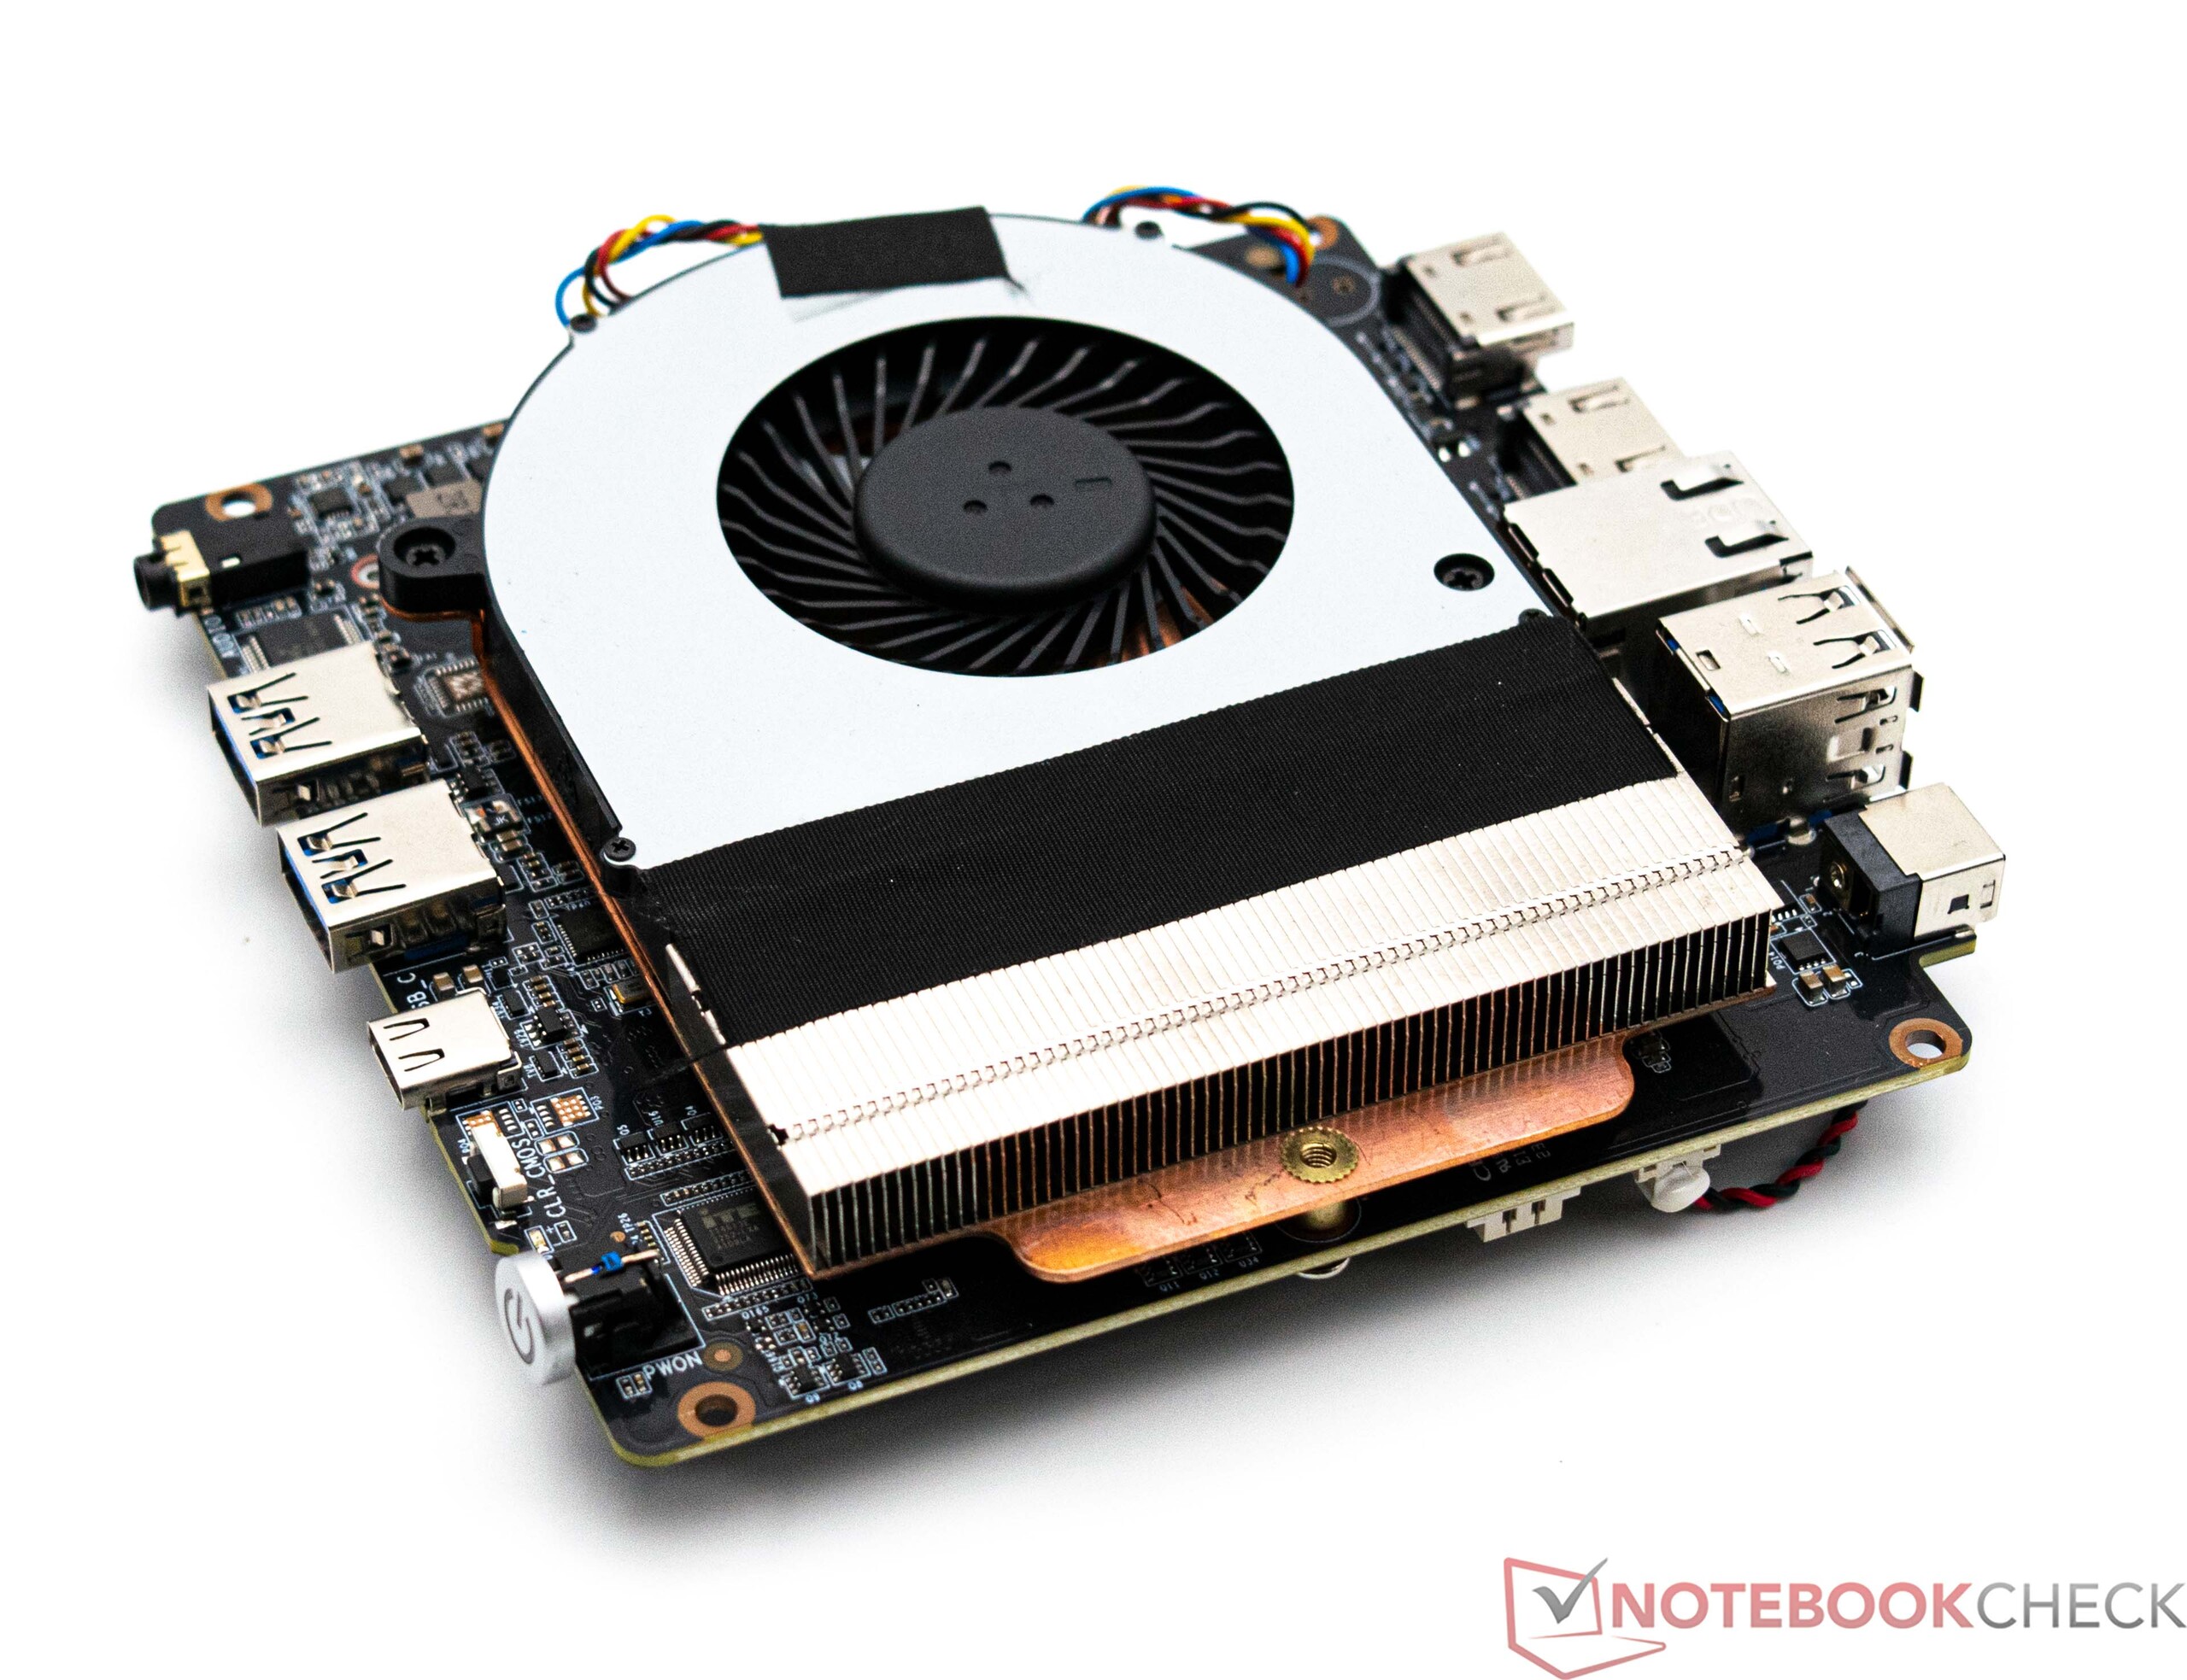
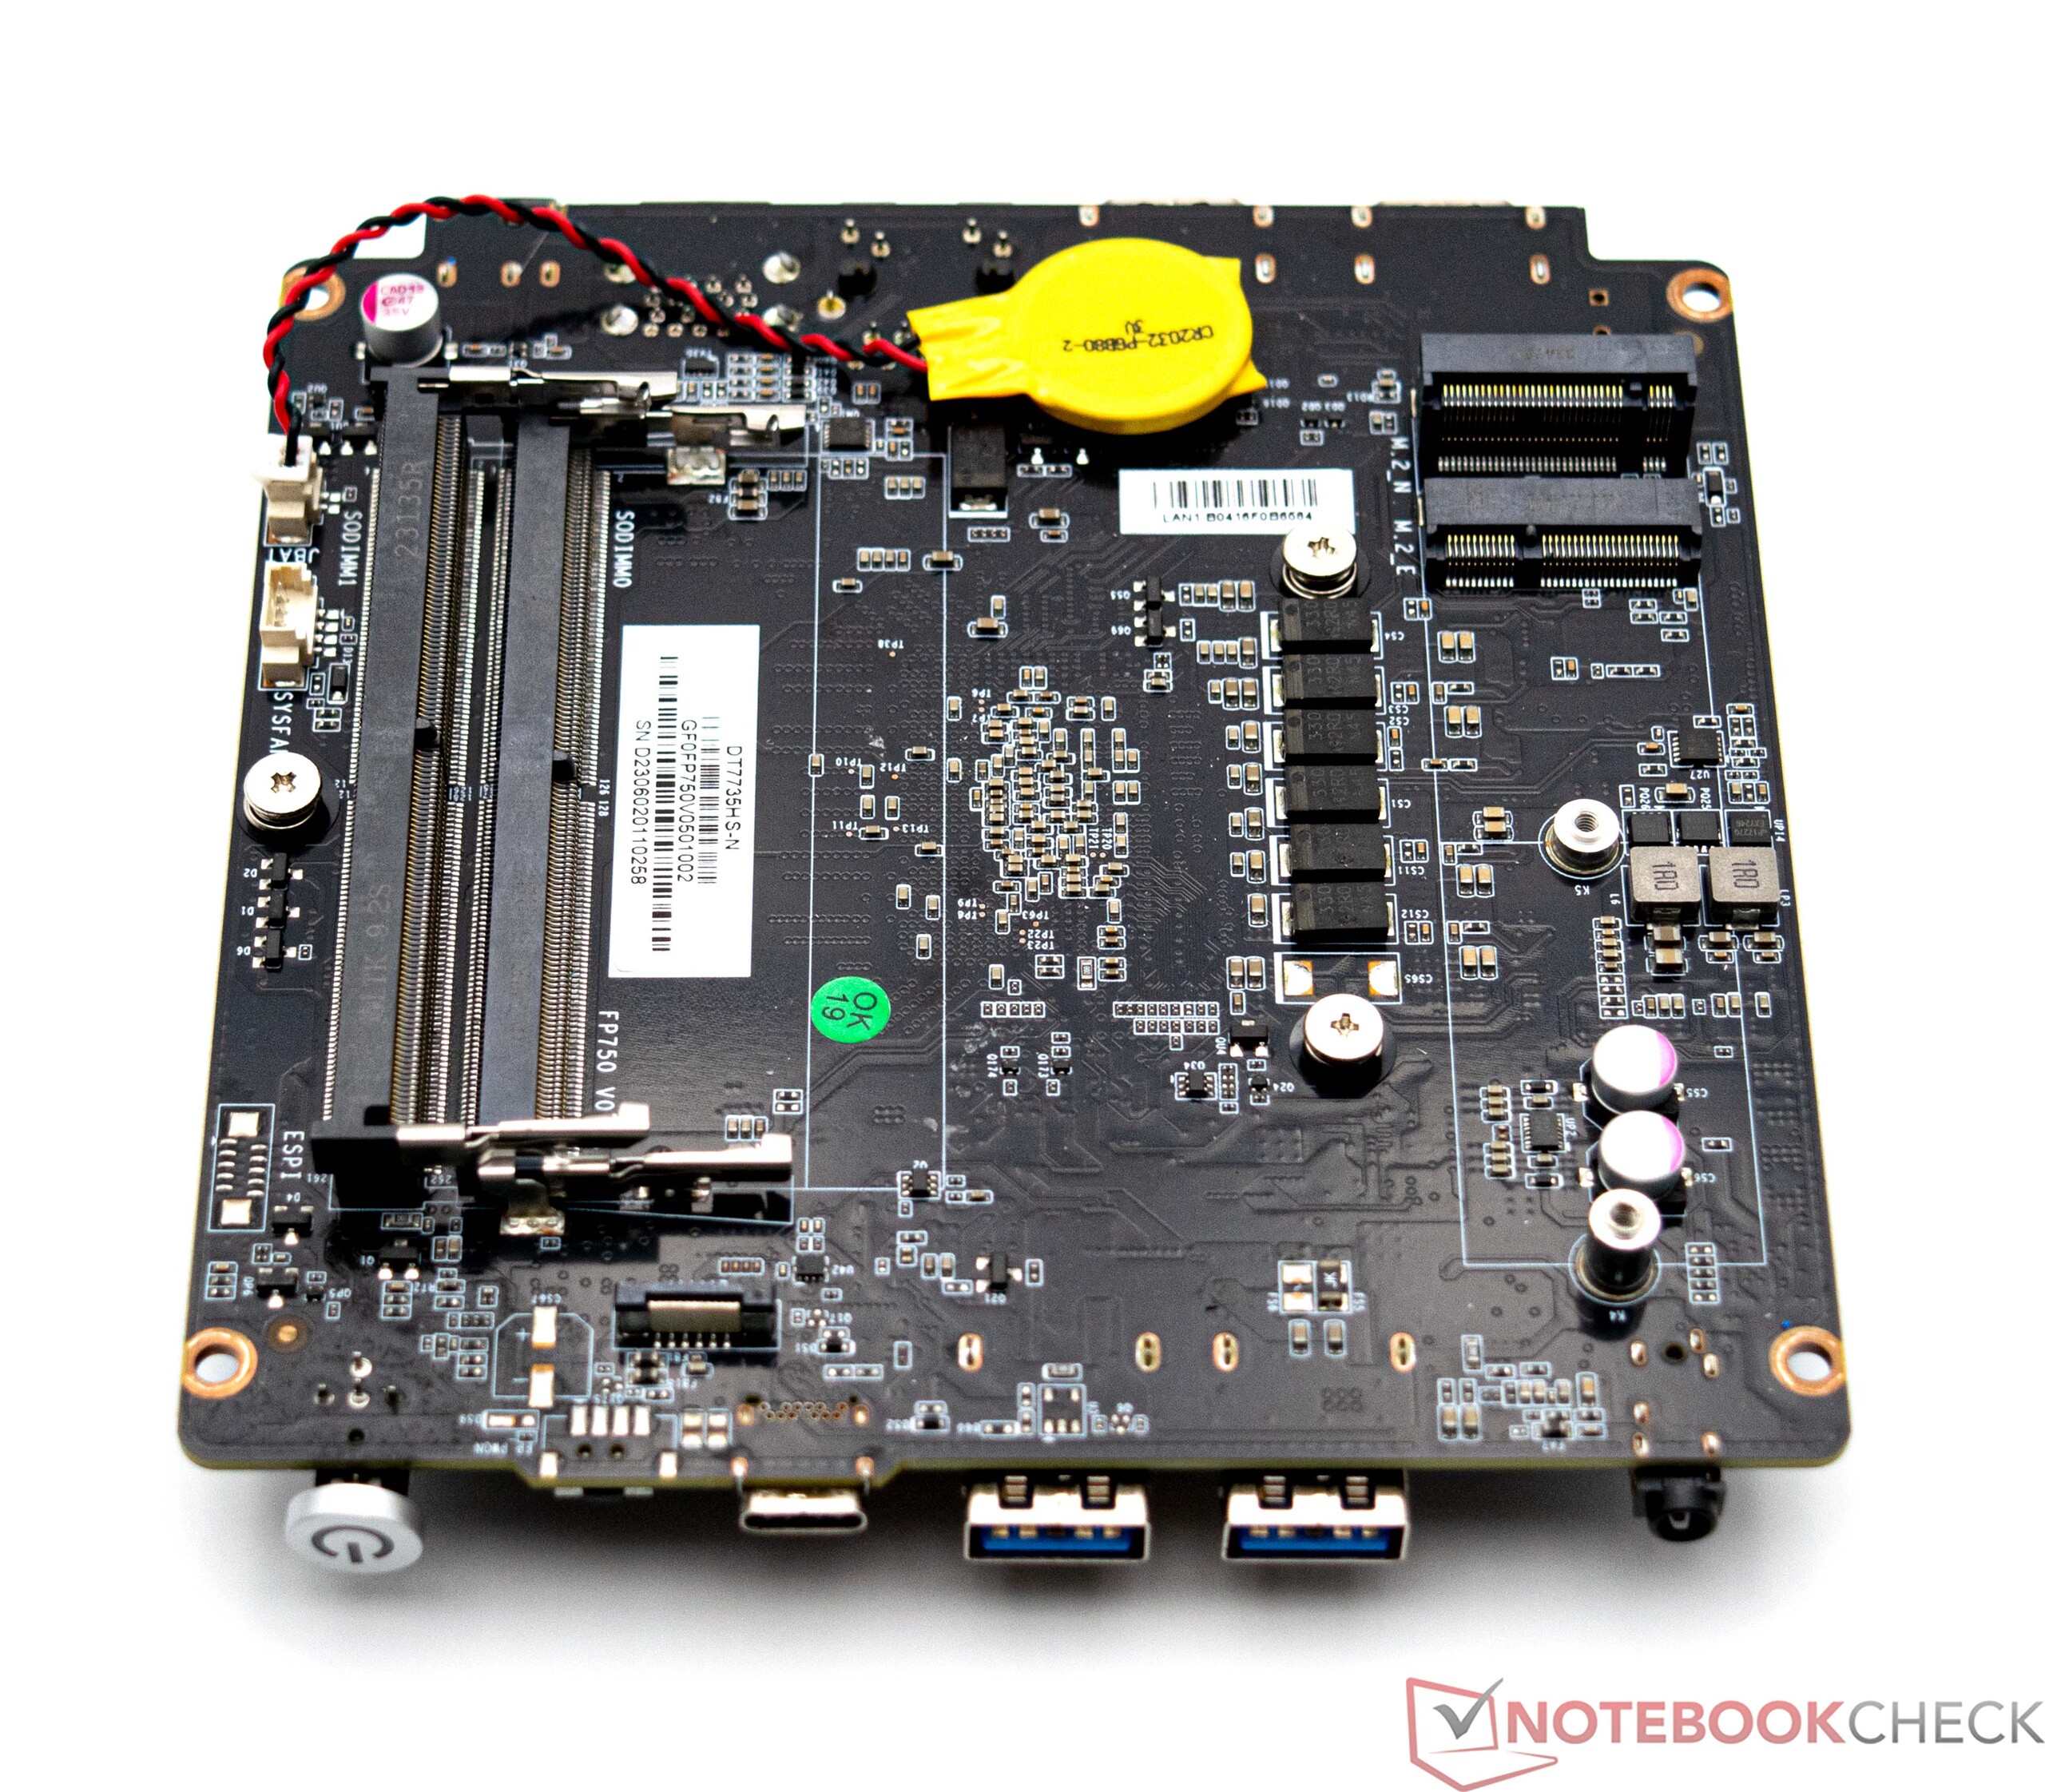
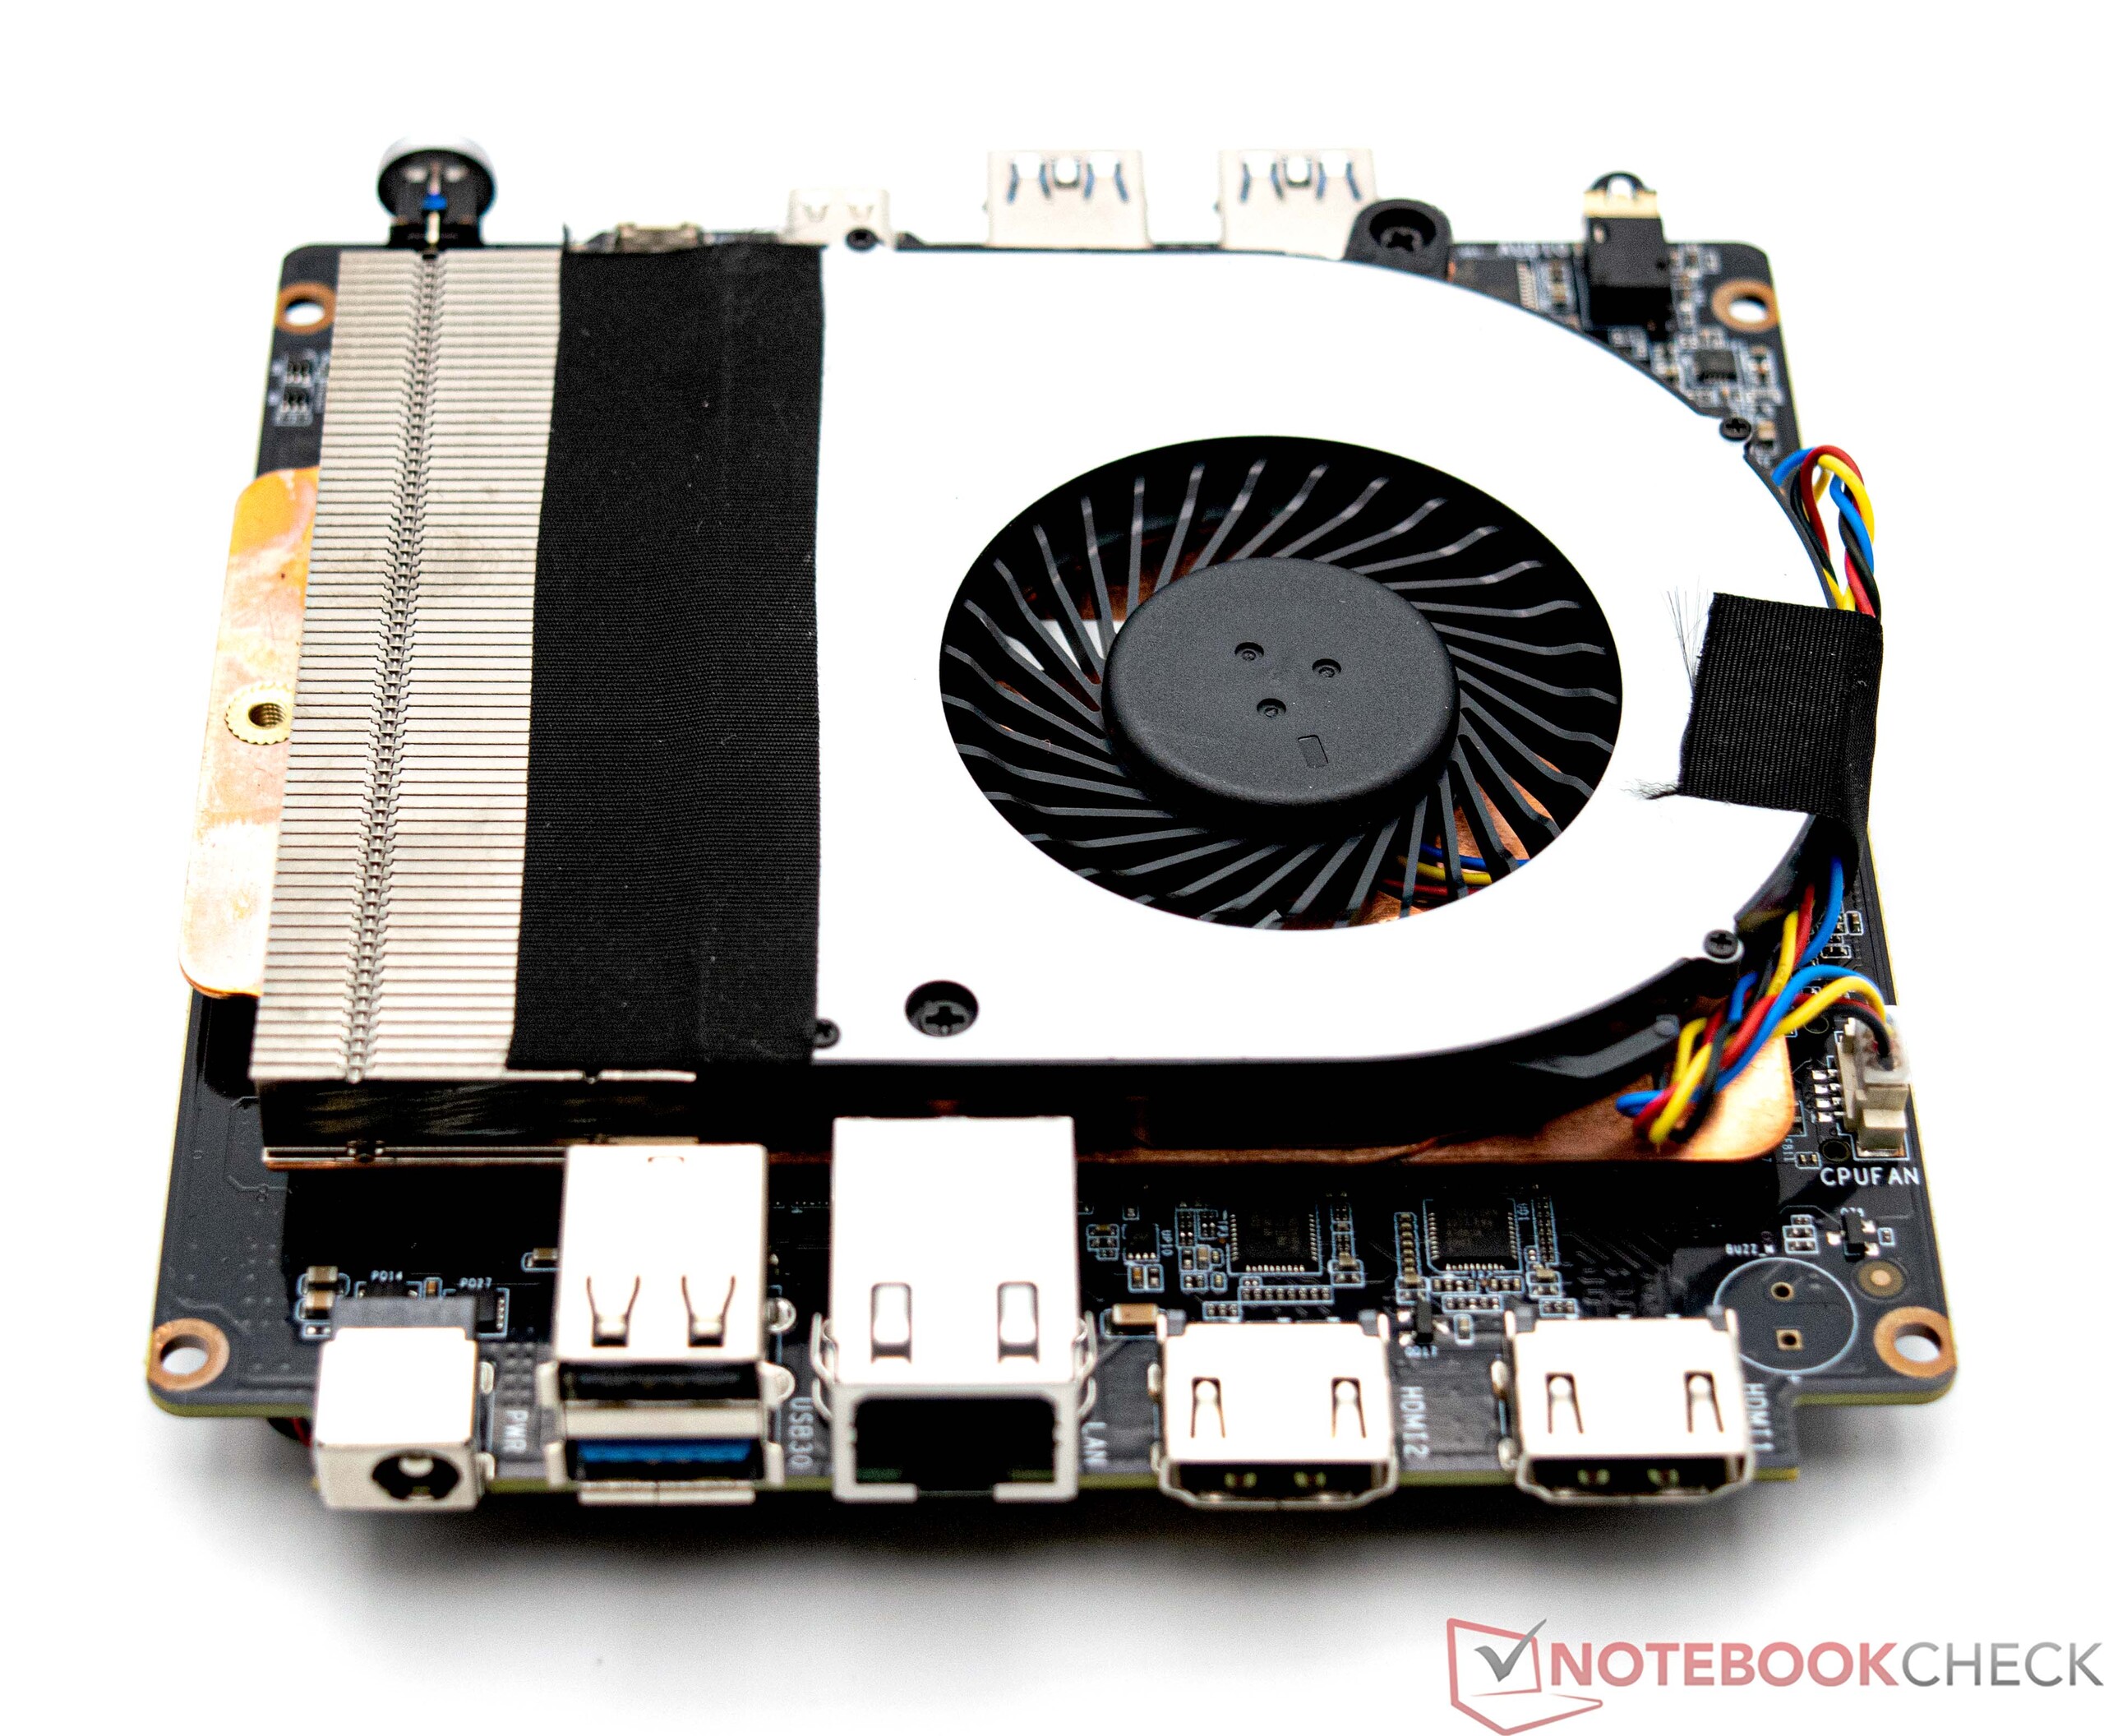
El mini PC Maxtang puede abrirse con relativa facilidad. La base está sujeta por cuatro tornillos que quedan ocultos por unos pies de goma pegados. Debajo de la placa base, es bastante sencillo acceder a la memoria RAM o a la unidad SSD M.2. En nuestro caso, aún queda espacio para instalar un módulo RAM adicional y un segundo dispositivo de almacenamiento masivo (formato de 2,5 pulgadas). Para acceder al ventilador, hay que desmontar aún más el aparato, lo que hace imposible una limpieza rápida.
Rendimiento - Un AMD Ryzen 7 7735HS con 8 núcleos y 16 hilos
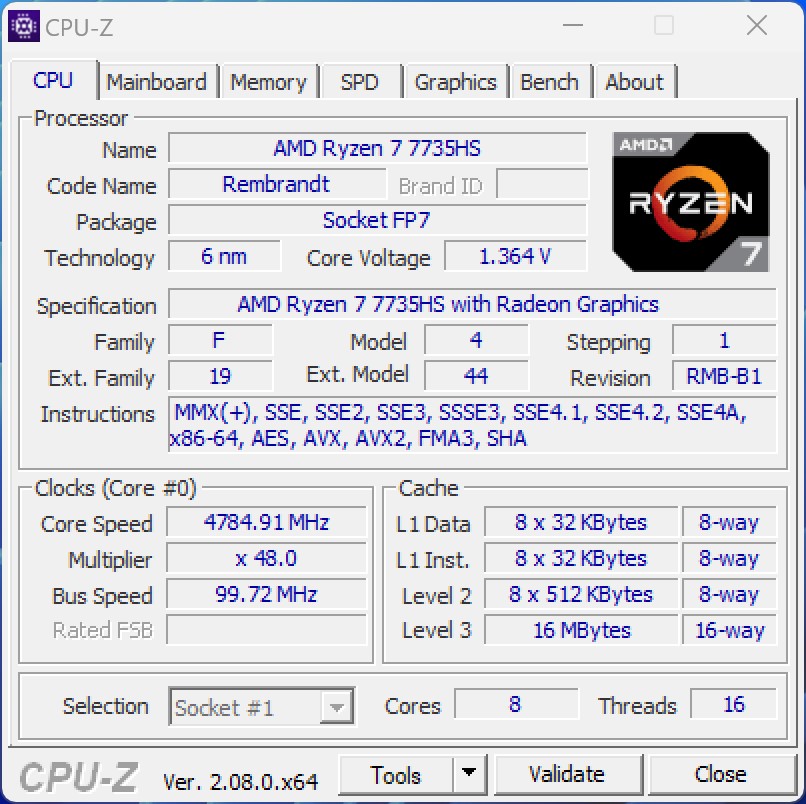
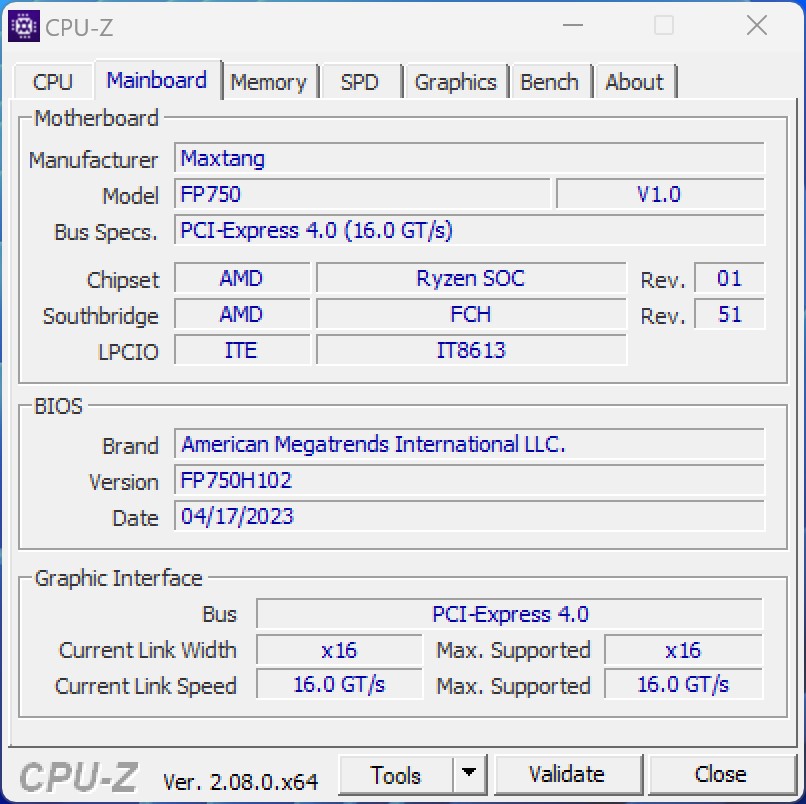
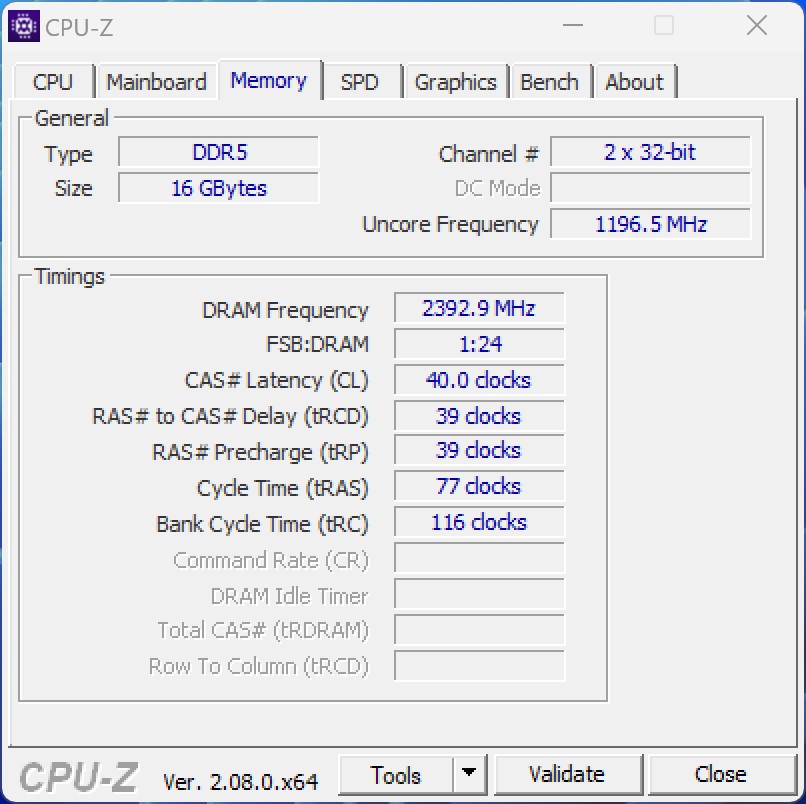
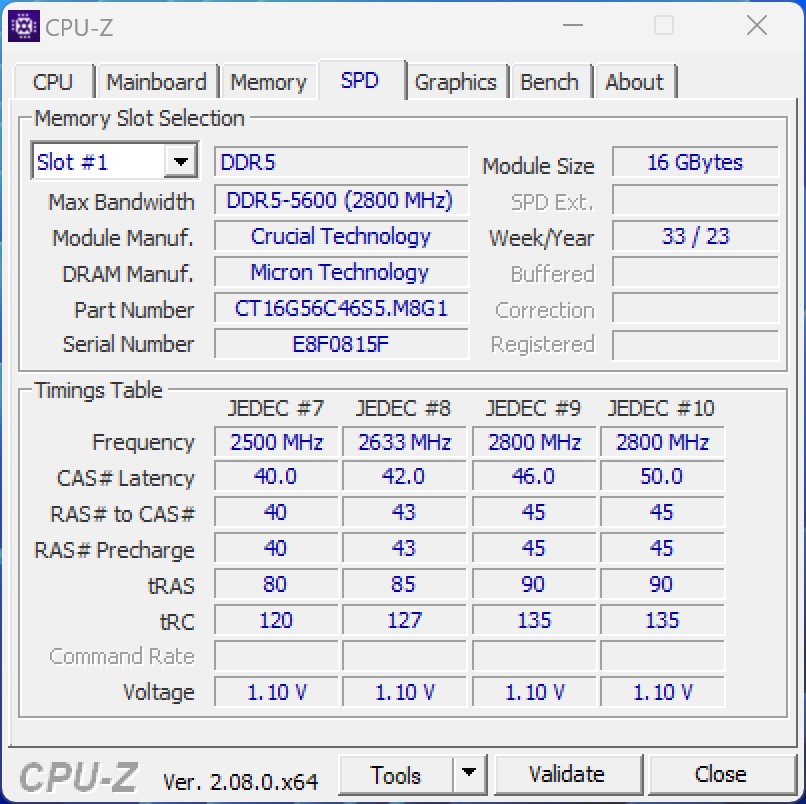
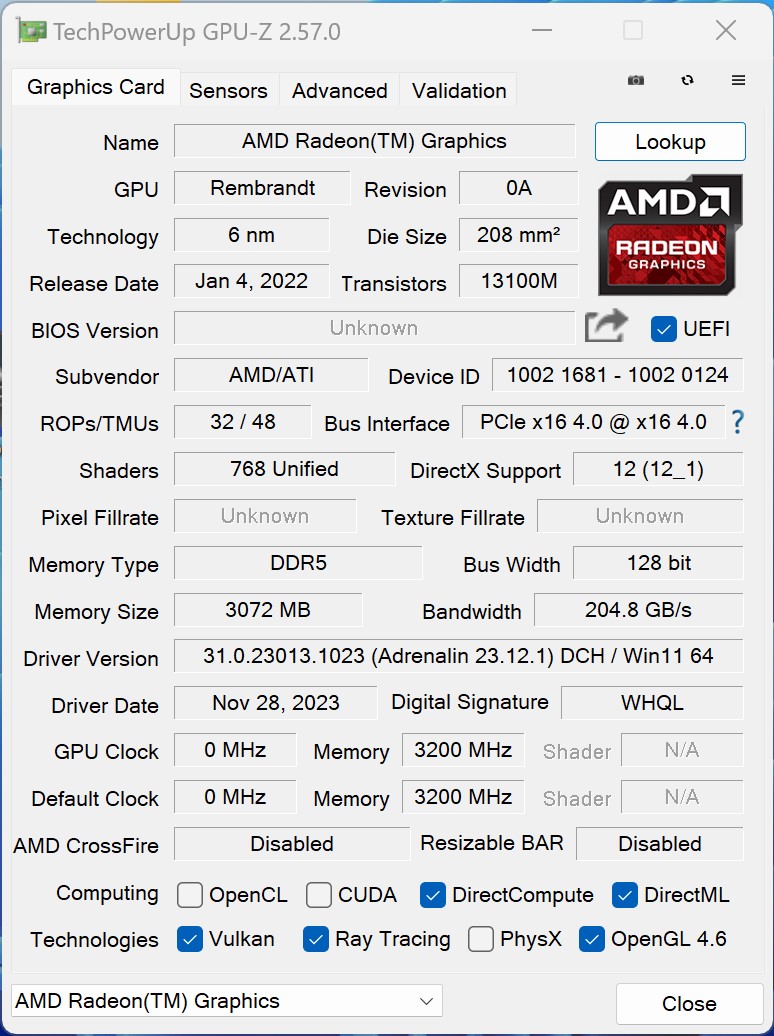
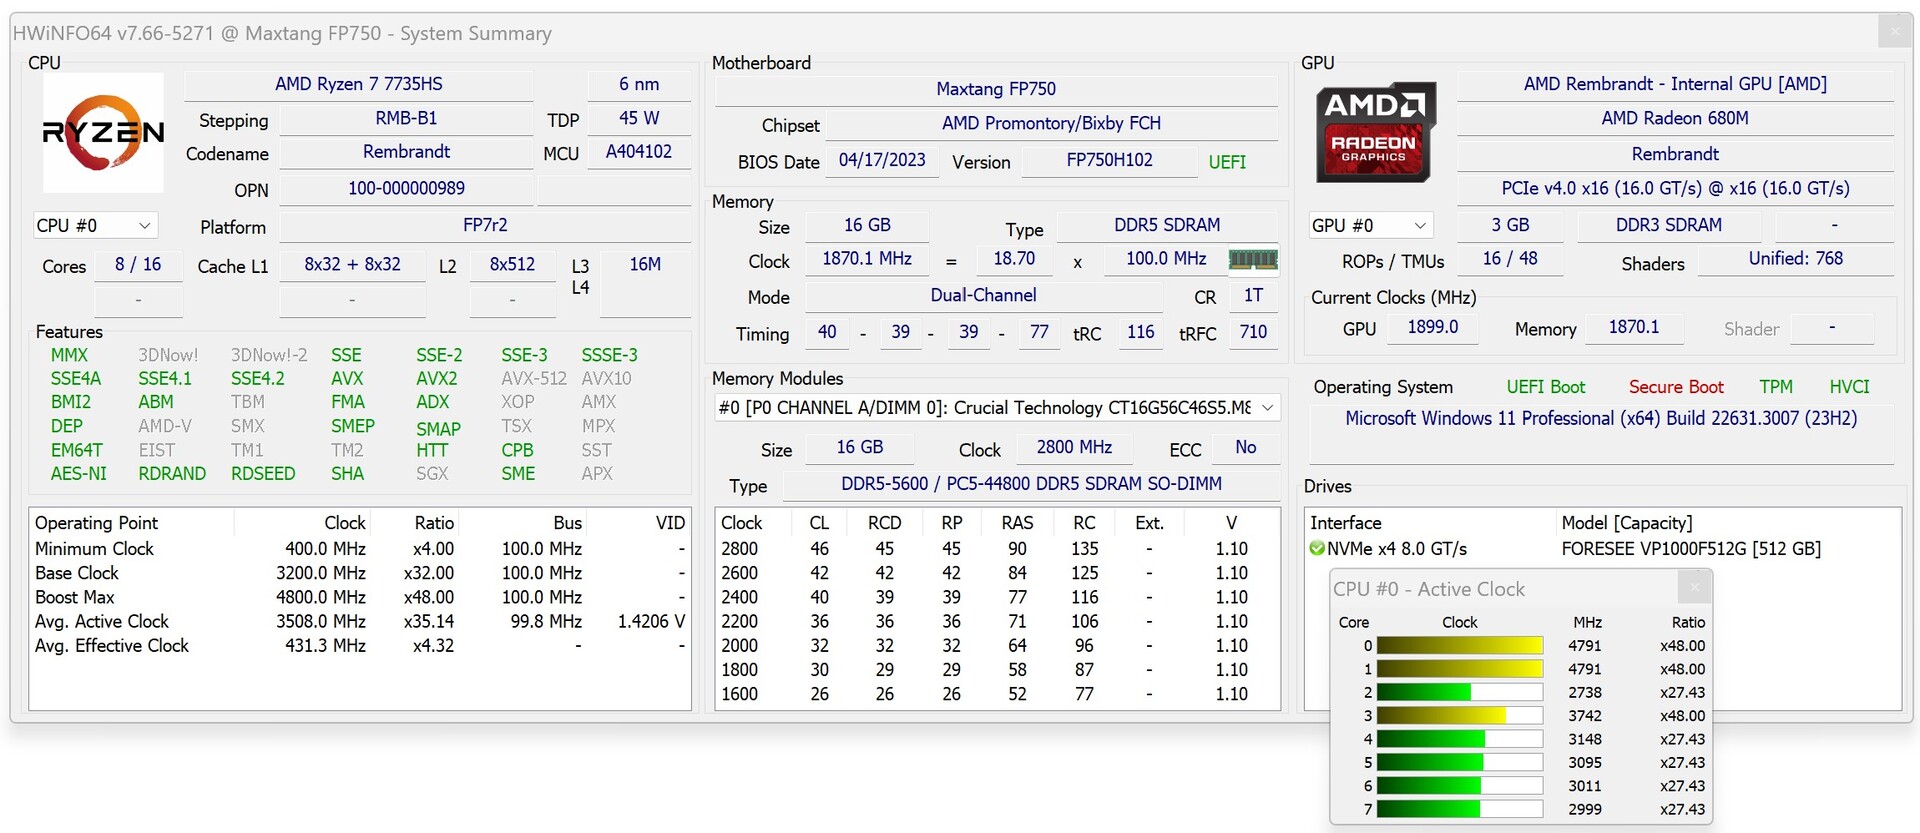
Nuestro dispositivo de revisión Maxtang MTN-FP750 viene con el AMD Ryzen 7 7735HS. En el AMD Radeon 680Mel SoC también dispone de una potente iGPU. Sin embargo, en cuanto a la RAM, el fabricante ha optado por dotar al mini PC de un único módulo de 16 GB, DDR5-5600, aunque, en la práctica, sólo se puede utilizar una DDR5-4800.
Condiciones de la prueba
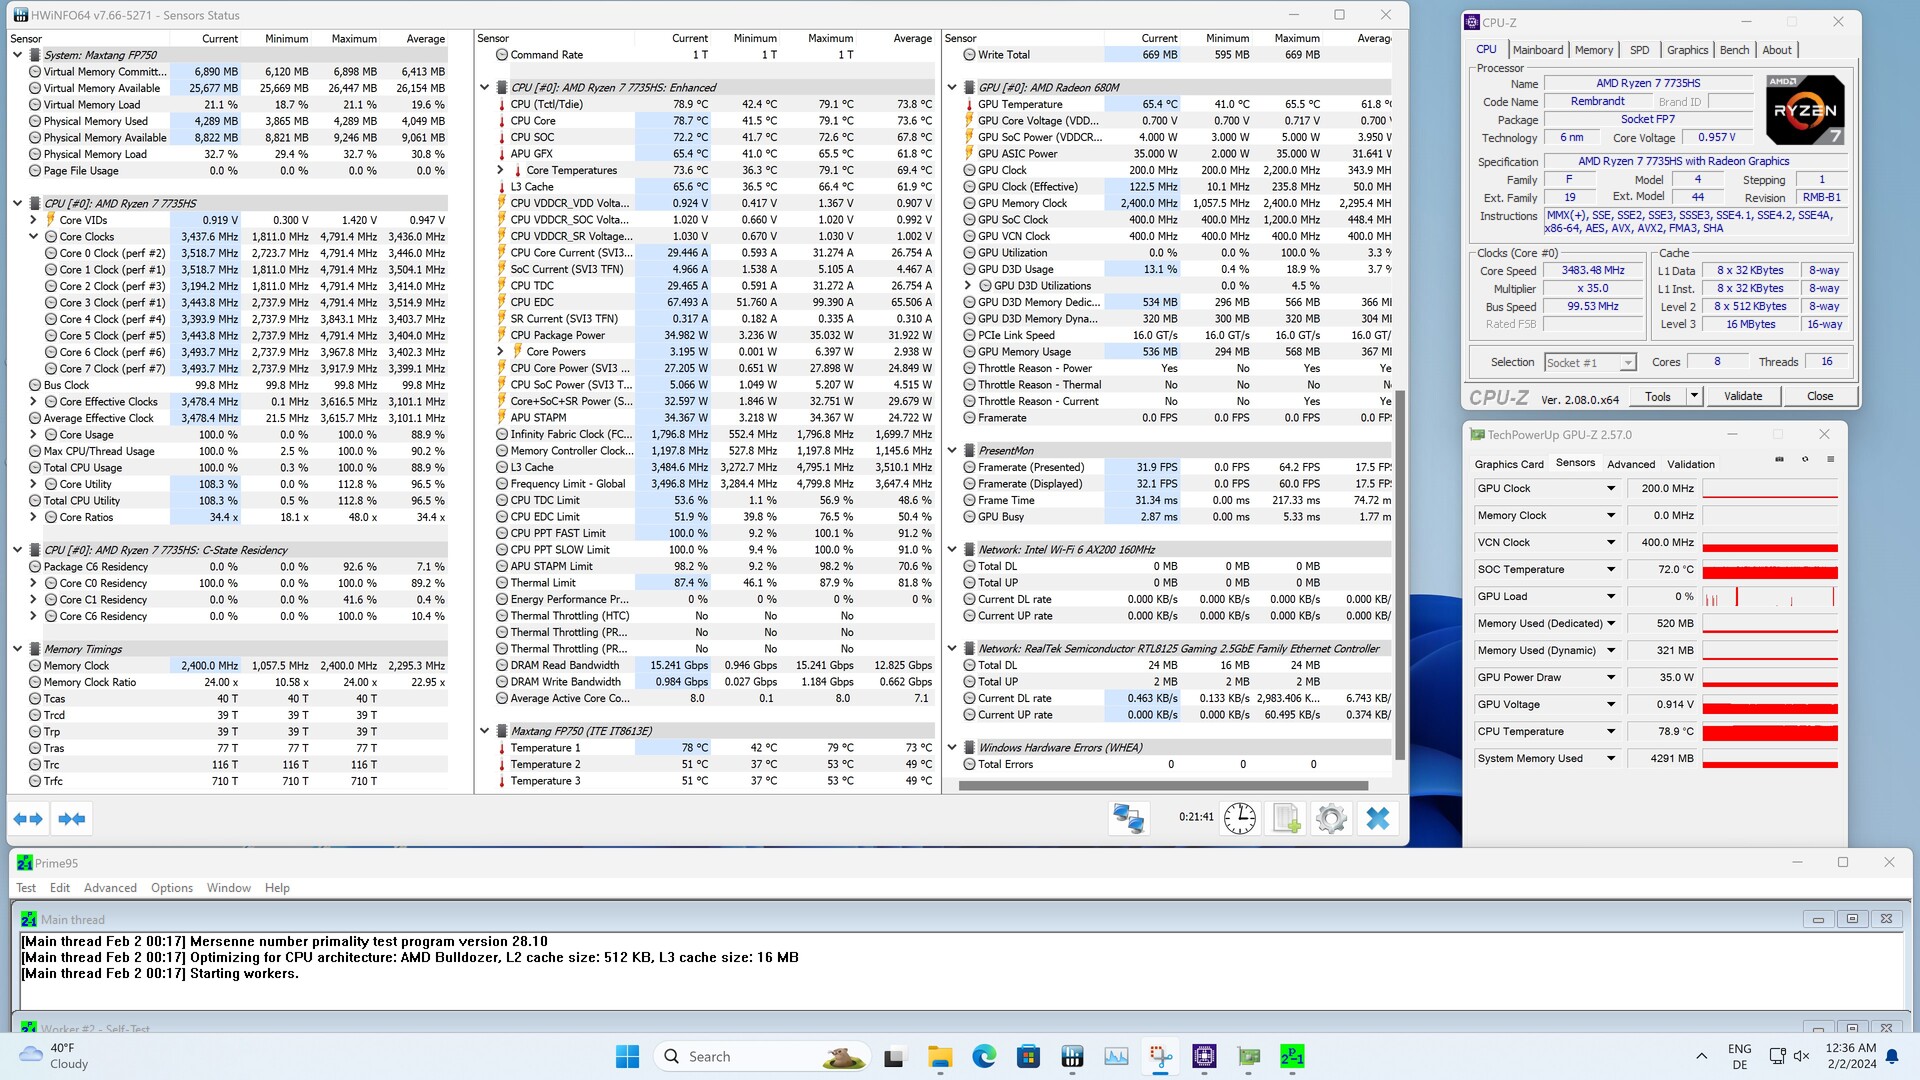
Realizamos todas las pruebas de rendimiento utilizando el perfil de energía de "máximo rendimiento". El rendimiento del SoC no se modificó ni alteró en la BIOS y el dispositivo mantuvo su configuración de fábrica.
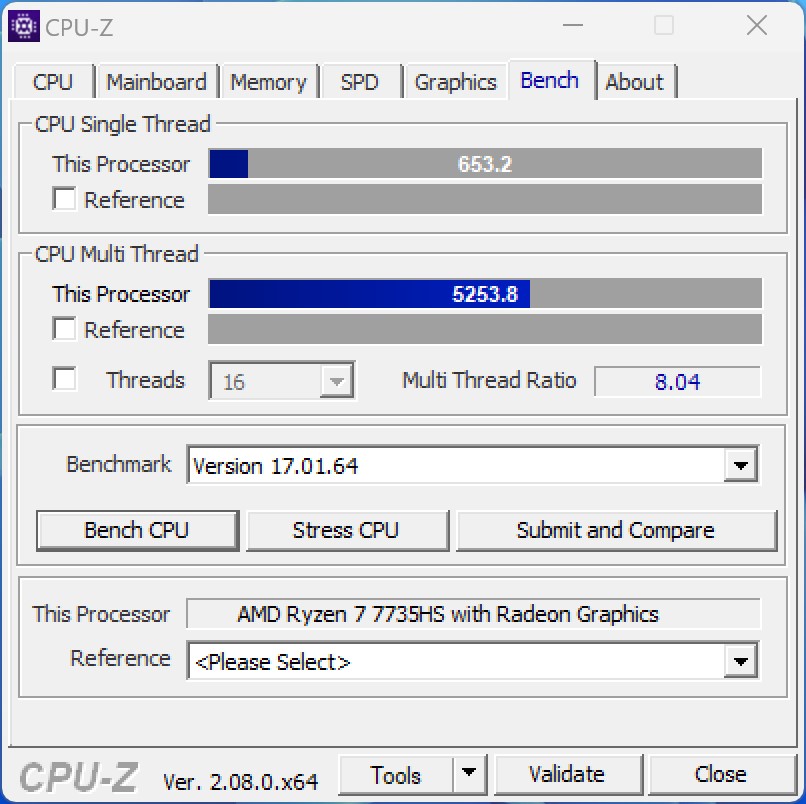
Procesador
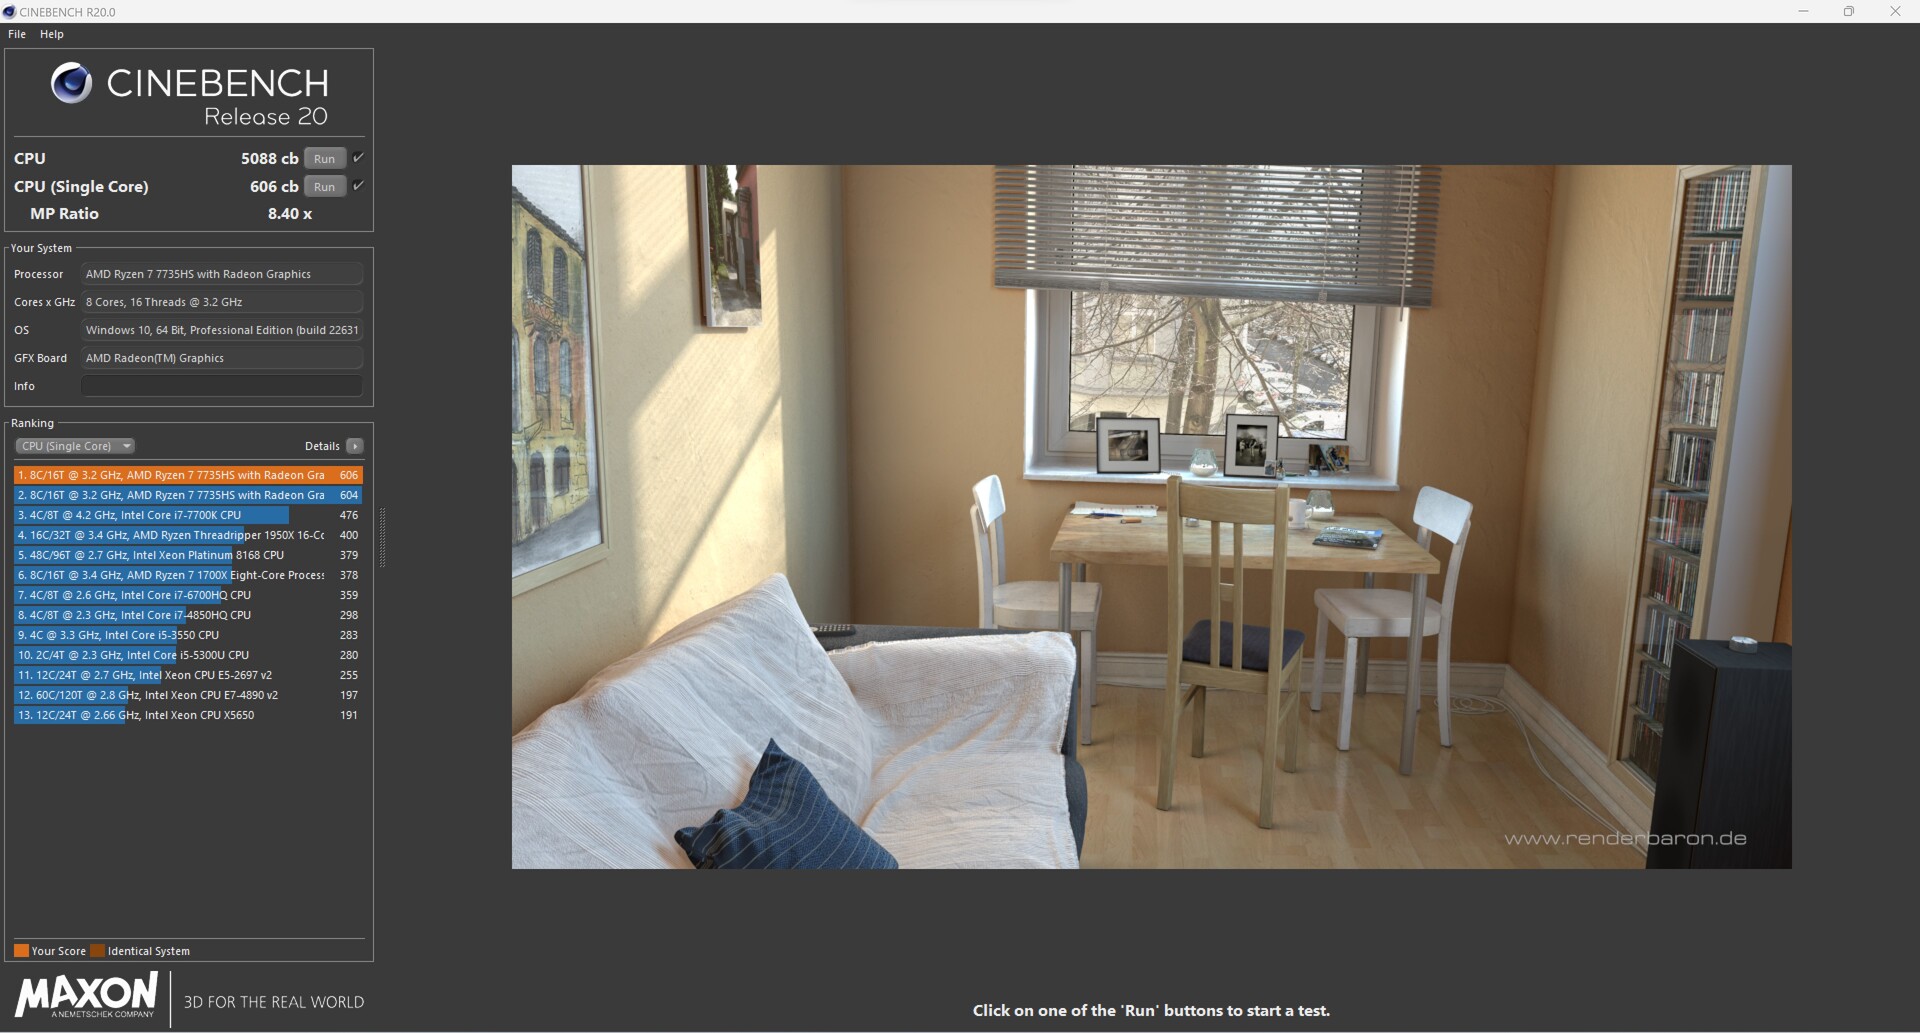
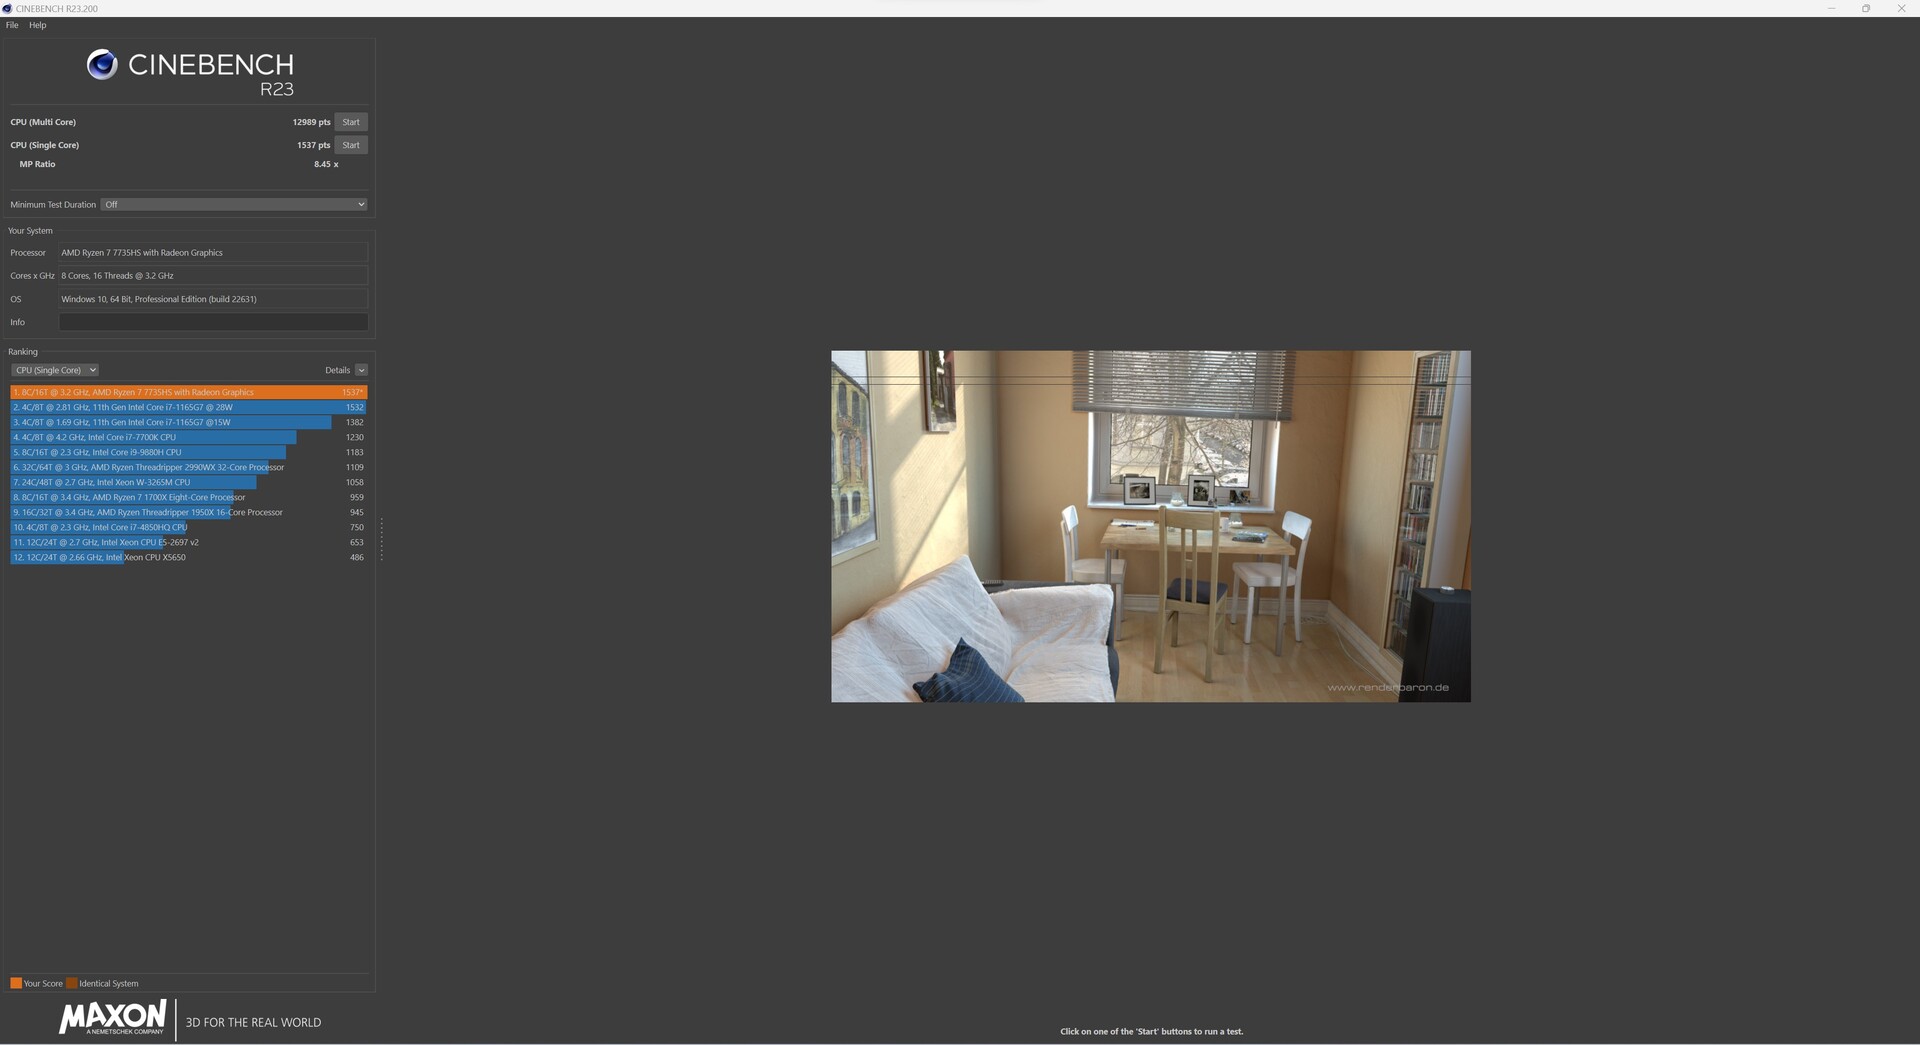
El AMD Ryzen 7 7735HS es un procesador de 8 núcleos relativamente moderno de la serie Rembrandt. Sin embargo, el SoC Zen3 de AMD ya no puede considerarse uno de los nuevos chicos del bloque. A pesar de ello, el procesador puede procesar 16 hilos en paralelo, lo que supone un buen rendimiento multihilo. En la comparación de rendimiento, nuestro Maxtang MTN-FP750 sólo pudo asegurarse el penúltimo puesto. La razón de ello es el límite de potencia de 35 vatios del AMD Ryzen 7 7735HS.
Puede encontrar más pruebas comparativas de procesadores aquí.
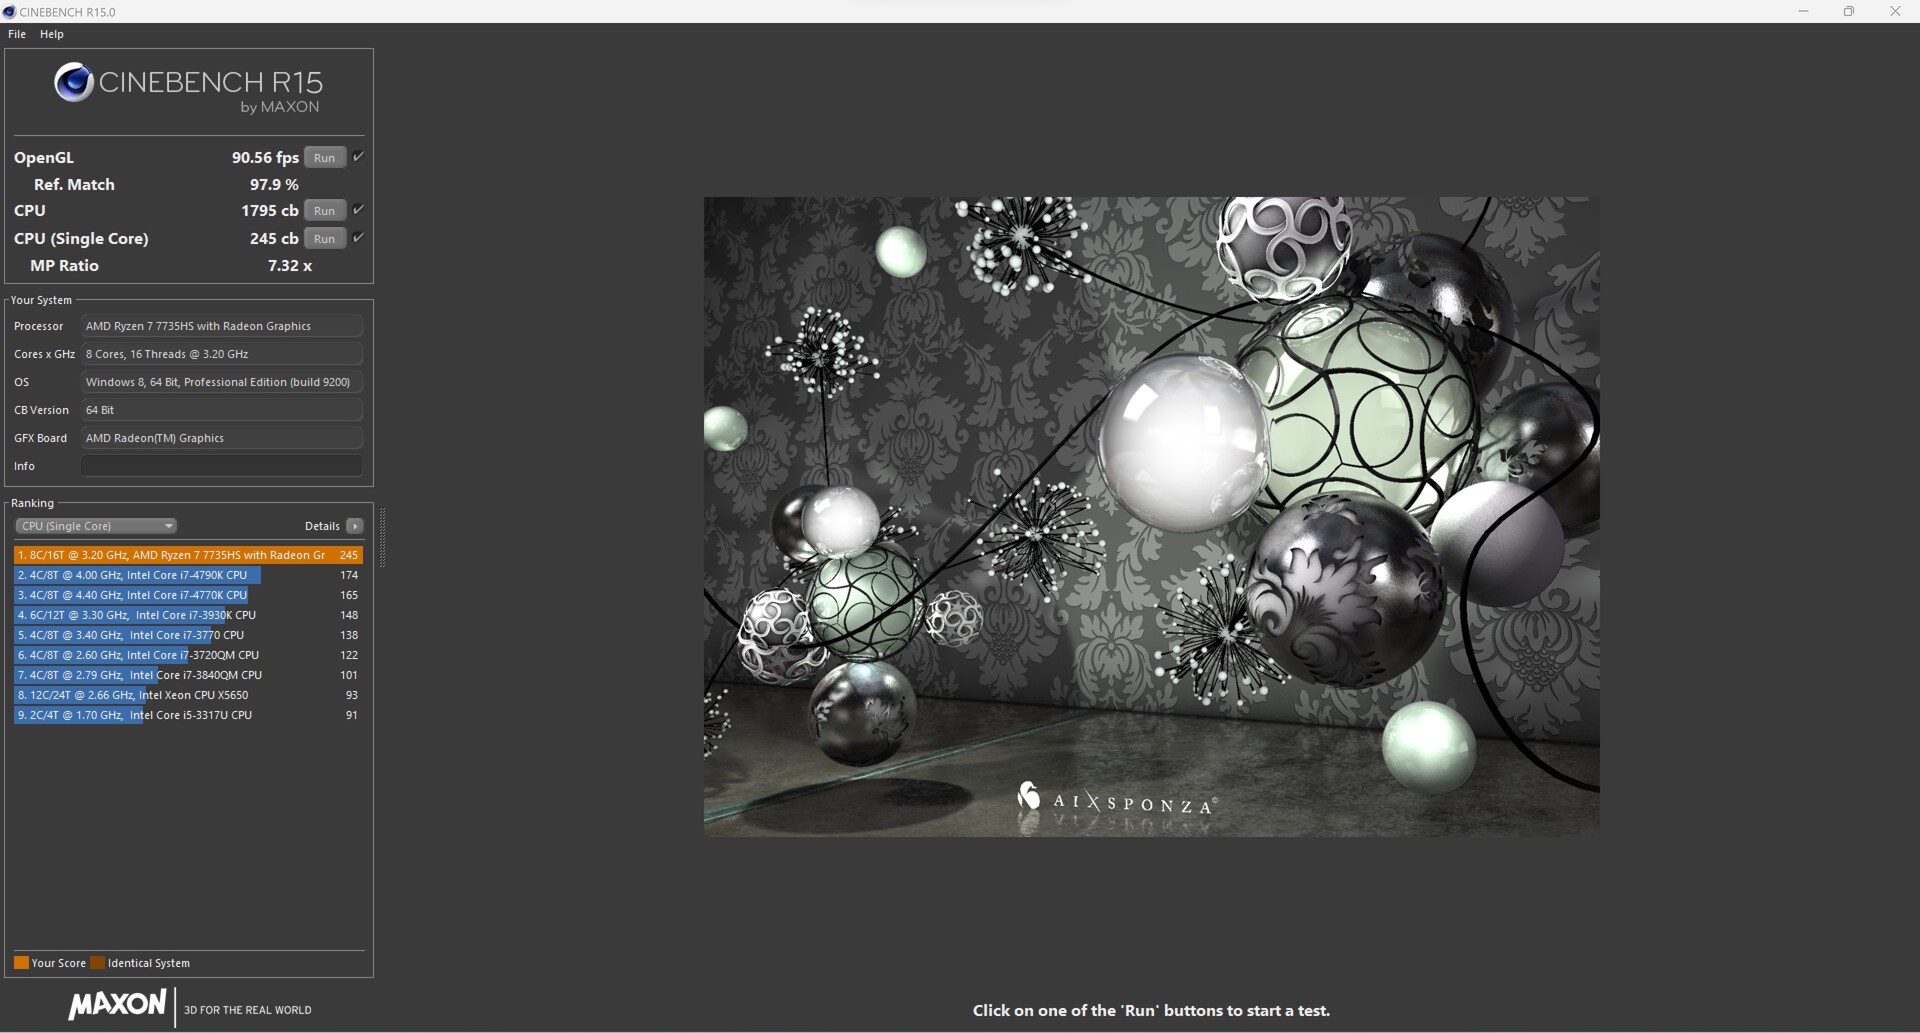
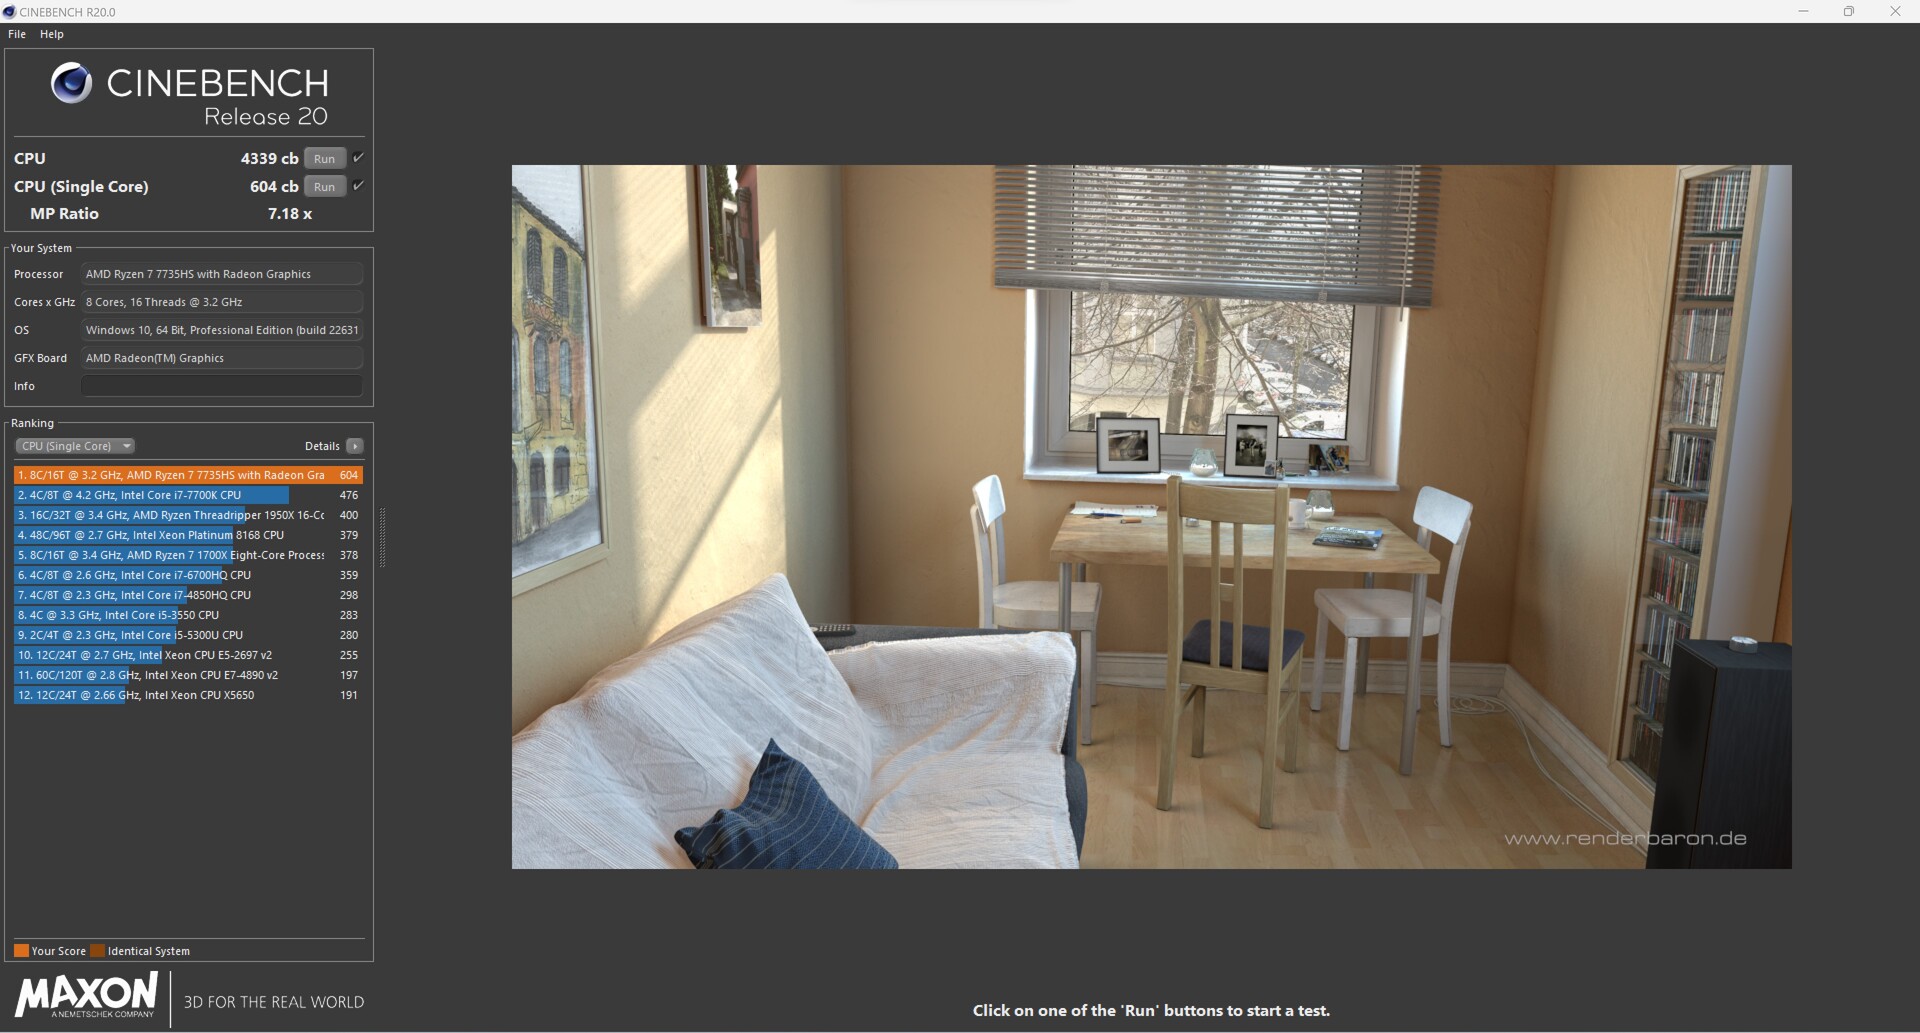
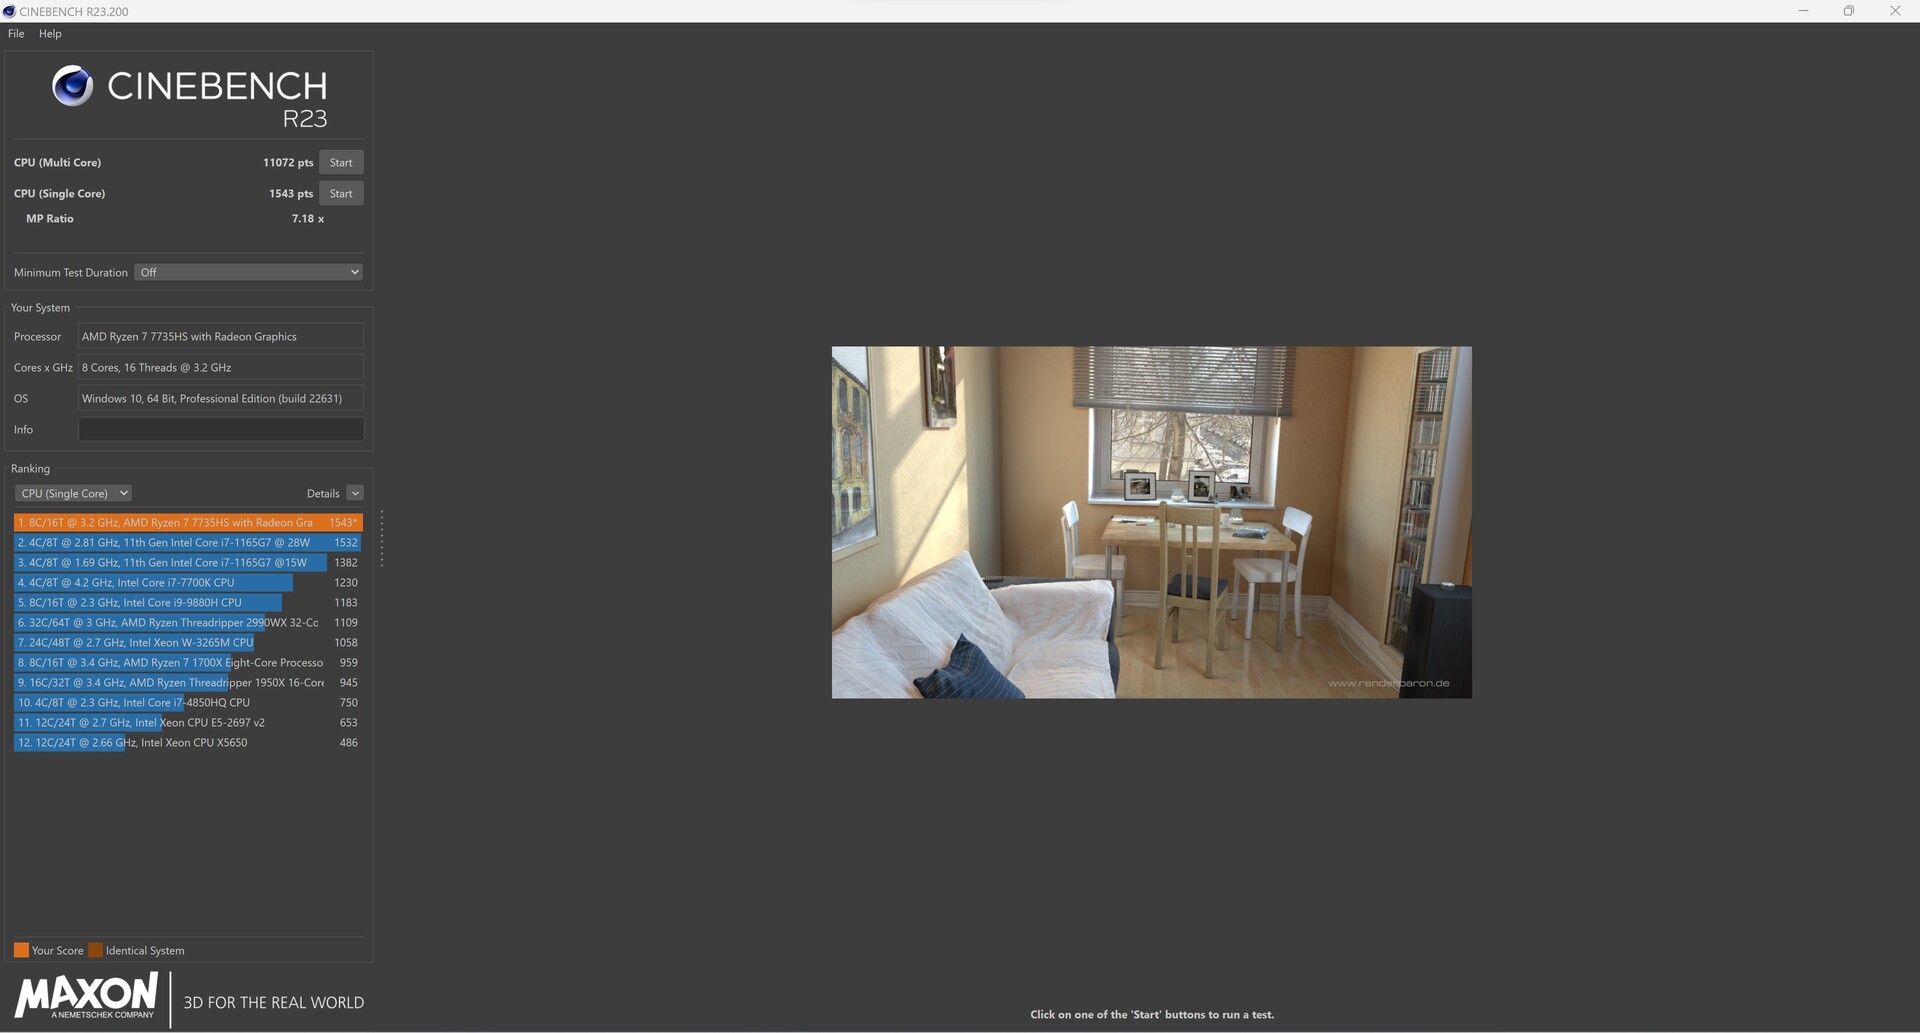
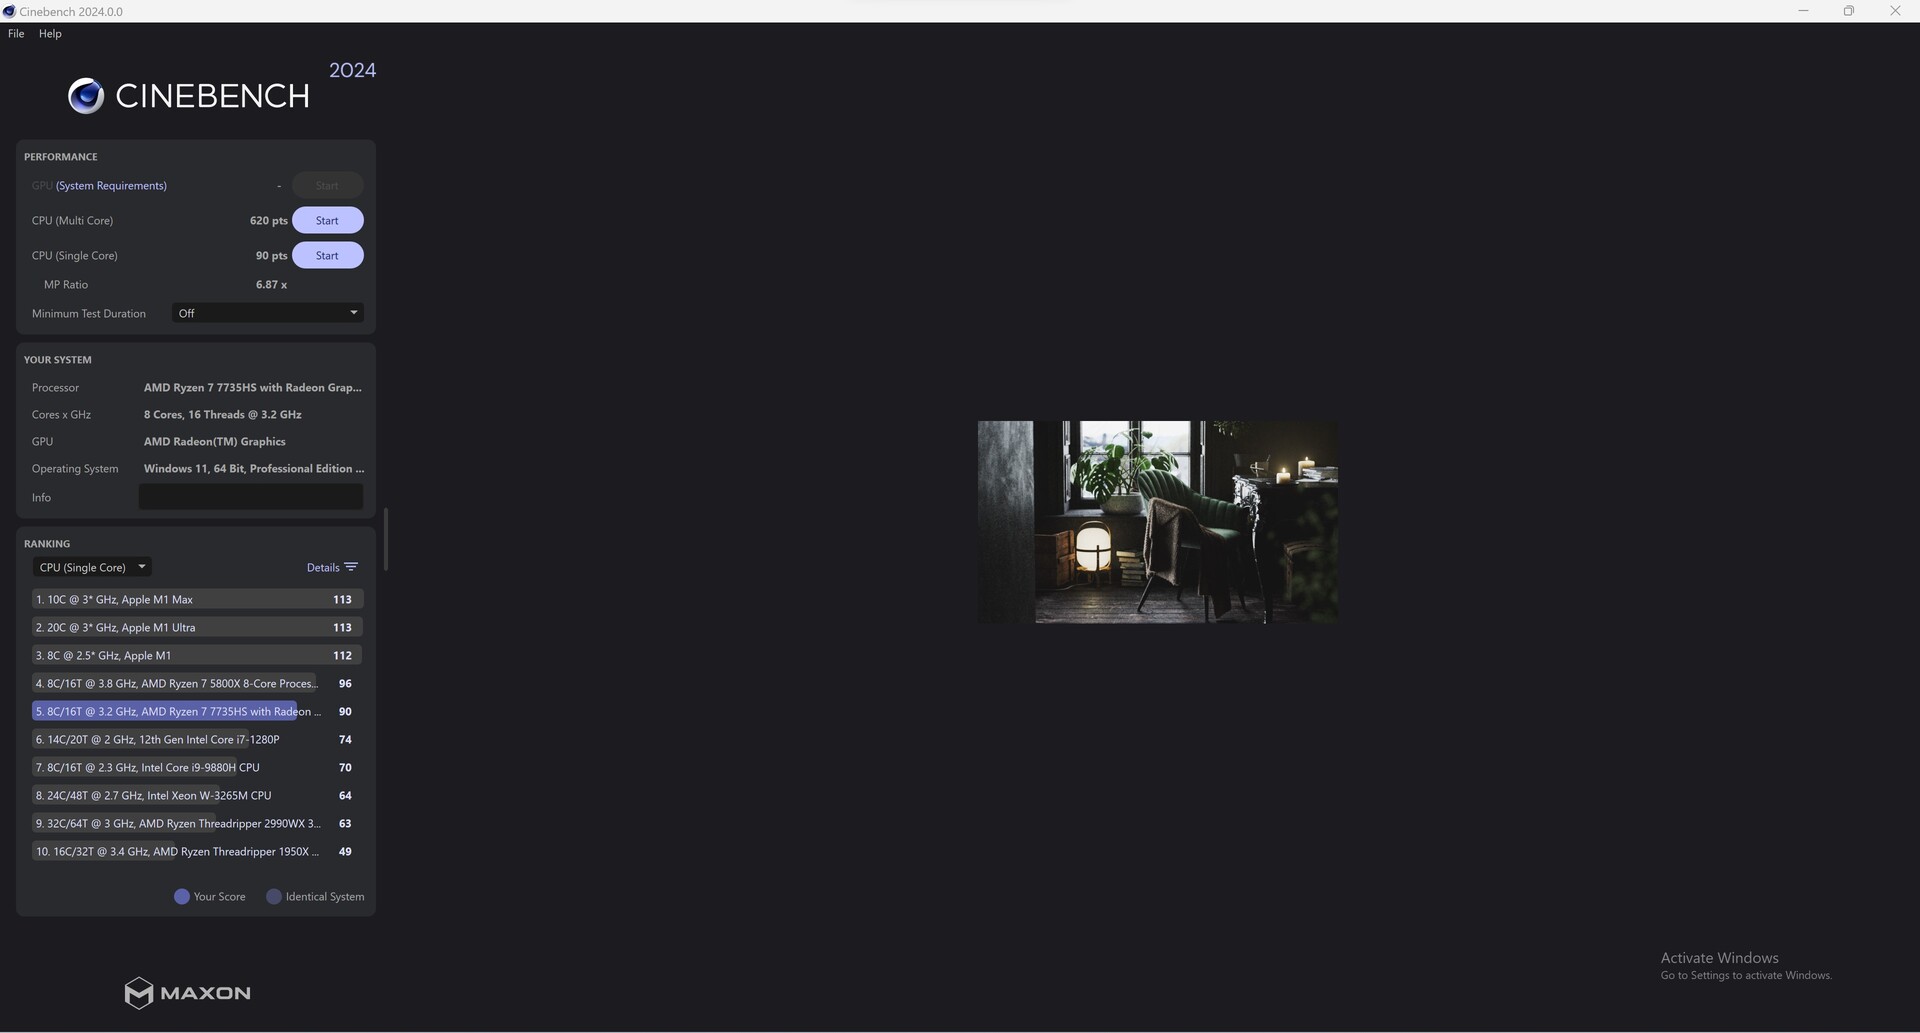
Resultados de Cinebench con los ajustes de fábrica (PL1 y PL2 = 35 vatios)
Resultados de Cinebench con un objetivo de potencia mayor (PL1 = 54 vatios, PL2 = 65 vatios)


| Performance rating - Percent | |
| Minisforum Neptune Series NAD9 | |
| Minisforum Venus Series NAB6 | |
| Geekom AS 6, R9 6900HX | |
| NiPoGi AD08 | |
| Geekom Mini IT12 | |
| Geekom A5 | |
| Maxtang MTN-FP750 | |
| Cinebench R10 | |
| Rendering Single CPUs 64Bit | |
| Minisforum Venus Series NAB6 | |
| Geekom Mini IT12 | |
| NiPoGi AD08 | |
| Minisforum Neptune Series NAD9 | |
| Maxtang MTN-FP750 | |
| Geekom AS 6, R9 6900HX | |
| Geekom A5 | |
| Rendering Multiple CPUs 64Bit | |
| Minisforum Neptune Series NAD9 | |
| Minisforum Venus Series NAB6 | |
| Geekom AS 6, R9 6900HX | |
| Geekom A5 | |
| Maxtang MTN-FP750 | |
| NiPoGi AD08 | |
| Geekom Mini IT12 | |
| Blender - v2.79 BMW27 CPU | |
| NiPoGi AD08 | |
| Geekom A5 | |
| Minisforum Venus Series NAB6 | |
| Geekom Mini IT12 | |
| Maxtang MTN-FP750 | |
| Minisforum Neptune Series NAD9 | |
| Geekom AS 6, R9 6900HX | |
| WinRAR - Result | |
| Minisforum Venus Series NAB6 | |
| Minisforum Neptune Series NAD9 | |
| NiPoGi AD08 | |
| Geekom A5 | |
| Geekom AS 6, R9 6900HX | |
| Geekom Mini IT12 | |
| Maxtang MTN-FP750 | |
| 3DMark 11 - 1280x720 Performance Physics | |
| Minisforum Neptune Series NAD9 | |
| Minisforum Venus Series NAB6 | |
| Geekom AS 6, R9 6900HX | |
| Geekom A5 | |
| NiPoGi AD08 | |
| Maxtang MTN-FP750 | |
| Geekom Mini IT12 | |
| HWBOT x265 Benchmark v2.2 - 4k Preset | |
| Geekom AS 6, R9 6900HX | |
| Minisforum Neptune Series NAD9 | |
| Minisforum Venus Series NAB6 | |
| Geekom A5 | |
| Maxtang MTN-FP750 | |
| NiPoGi AD08 | |
| Geekom Mini IT12 | |
| R Benchmark 2.5 - Overall mean | |
| Geekom A5 | |
| Maxtang MTN-FP750 | |
| Geekom AS 6, R9 6900HX | |
| NiPoGi AD08 | |
| Geekom Mini IT12 | |
| Minisforum Neptune Series NAD9 | |
| Minisforum Venus Series NAB6 | |
| LibreOffice - 20 Documents To PDF | |
| Maxtang MTN-FP750 | |
| Geekom A5 | |
| Geekom Mini IT12 | |
| NiPoGi AD08 | |
| Geekom AS 6, R9 6900HX | |
| Minisforum Venus Series NAB6 | |
| Minisforum Neptune Series NAD9 | |
| WebXPRT 3 - Overall | |
| Minisforum Neptune Series NAD9 | |
| Minisforum Venus Series NAB6 | |
| NiPoGi AD08 | |
| Geekom Mini IT12 | |
| Maxtang MTN-FP750 | |
| Geekom A5 | |
| Geekom AS 6, R9 6900HX | |
| Mozilla Kraken 1.1 - Total | |
| Geekom A5 | |
| Geekom AS 6, R9 6900HX | |
| Maxtang MTN-FP750 | |
| Minisforum Neptune Series NAD9 | |
| Geekom Mini IT12 | |
| NiPoGi AD08 | |
| Minisforum Venus Series NAB6 | |
* ... más pequeño es mejor
AIDA64: FP32 Ray-Trace | FPU Julia | CPU SHA3 | CPU Queen | FPU SinJulia | FPU Mandel | CPU AES | CPU ZLib | FP64 Ray-Trace | CPU PhotoWorxx
| Performance rating | |
| Media de la clase Mini PC | |
| Geekom AS 6, R9 6900HX | |
| Geekom A5 | |
| Maxtang MTN-FP750 | |
| Minisforum Neptune Series NAD9 | |
| Minisforum Venus Series NAB6 | |
| NiPoGi AD08 | |
| Geekom Mini IT12 | |
| AIDA64 / FP32 Ray-Trace | |
| Media de la clase Mini PC (974 - 82725, n=104, últimos 2 años) | |
| Geekom AS 6, R9 6900HX | |
| Maxtang MTN-FP750 | |
| Geekom A5 | |
| Minisforum Neptune Series NAD9 | |
| Minisforum Venus Series NAB6 | |
| NiPoGi AD08 | |
| Geekom Mini IT12 | |
| AIDA64 / FPU Julia | |
| Media de la clase Mini PC (6115 - 363782, n=104, últimos 2 años) | |
| Geekom AS 6, R9 6900HX | |
| Maxtang MTN-FP750 | |
| Geekom A5 | |
| Minisforum Neptune Series NAD9 | |
| Minisforum Venus Series NAB6 | |
| NiPoGi AD08 | |
| Geekom Mini IT12 | |
| AIDA64 / CPU SHA3 | |
| Media de la clase Mini PC (385 - 9475, n=104, últimos 2 años) | |
| Geekom AS 6, R9 6900HX | |
| Maxtang MTN-FP750 | |
| Geekom A5 | |
| Minisforum Neptune Series NAD9 | |
| Minisforum Venus Series NAB6 | |
| NiPoGi AD08 | |
| Geekom Mini IT12 | |
| AIDA64 / CPU Queen | |
| Geekom AS 6, R9 6900HX | |
| Media de la clase Mini PC (20501 - 162855, n=88, últimos 2 años) | |
| Geekom A5 | |
| Maxtang MTN-FP750 | |
| Minisforum Neptune Series NAD9 | |
| Minisforum Venus Series NAB6 | |
| Geekom Mini IT12 | |
| NiPoGi AD08 | |
| AIDA64 / FPU SinJulia | |
| Media de la clase Mini PC (1019 - 31931, n=104, últimos 2 años) | |
| Maxtang MTN-FP750 | |
| Geekom AS 6, R9 6900HX | |
| Geekom A5 | |
| Minisforum Neptune Series NAD9 | |
| Minisforum Venus Series NAB6 | |
| NiPoGi AD08 | |
| Geekom Mini IT12 | |
| AIDA64 / FPU Mandel | |
| Media de la clase Mini PC (3322 - 192994, n=104, últimos 2 años) | |
| Geekom AS 6, R9 6900HX | |
| Maxtang MTN-FP750 | |
| Geekom A5 | |
| Minisforum Neptune Series NAD9 | |
| Minisforum Venus Series NAB6 | |
| NiPoGi AD08 | |
| Geekom Mini IT12 | |
| AIDA64 / CPU AES | |
| Geekom AS 6, R9 6900HX | |
| Geekom A5 | |
| Minisforum Neptune Series NAD9 | |
| Minisforum Venus Series NAB6 | |
| Media de la clase Mini PC (9214 - 204742, n=103, últimos 2 años) | |
| Geekom Mini IT12 | |
| Maxtang MTN-FP750 | |
| NiPoGi AD08 | |
| AIDA64 / CPU ZLib | |
| Media de la clase Mini PC (127.2 - 2431, n=104, últimos 2 años) | |
| Geekom AS 6, R9 6900HX | |
| Minisforum Neptune Series NAD9 | |
| Geekom A5 | |
| NiPoGi AD08 | |
| Minisforum Venus Series NAB6 | |
| Maxtang MTN-FP750 | |
| Geekom Mini IT12 | |
| AIDA64 / FP64 Ray-Trace | |
| Media de la clase Mini PC (537 - 43587, n=104, últimos 2 años) | |
| Geekom AS 6, R9 6900HX | |
| Maxtang MTN-FP750 | |
| Geekom A5 | |
| Minisforum Neptune Series NAD9 | |
| Minisforum Venus Series NAB6 | |
| NiPoGi AD08 | |
| Geekom Mini IT12 | |
| AIDA64 / CPU PhotoWorxx | |
| Media de la clase Mini PC (8069 - 96843, n=104, últimos 2 años) | |
| Geekom AS 6, R9 6900HX | |
| Geekom Mini IT12 | |
| Minisforum Venus Series NAB6 | |
| Geekom A5 | |
| NiPoGi AD08 | |
| Minisforum Neptune Series NAD9 | |
| Maxtang MTN-FP750 | |
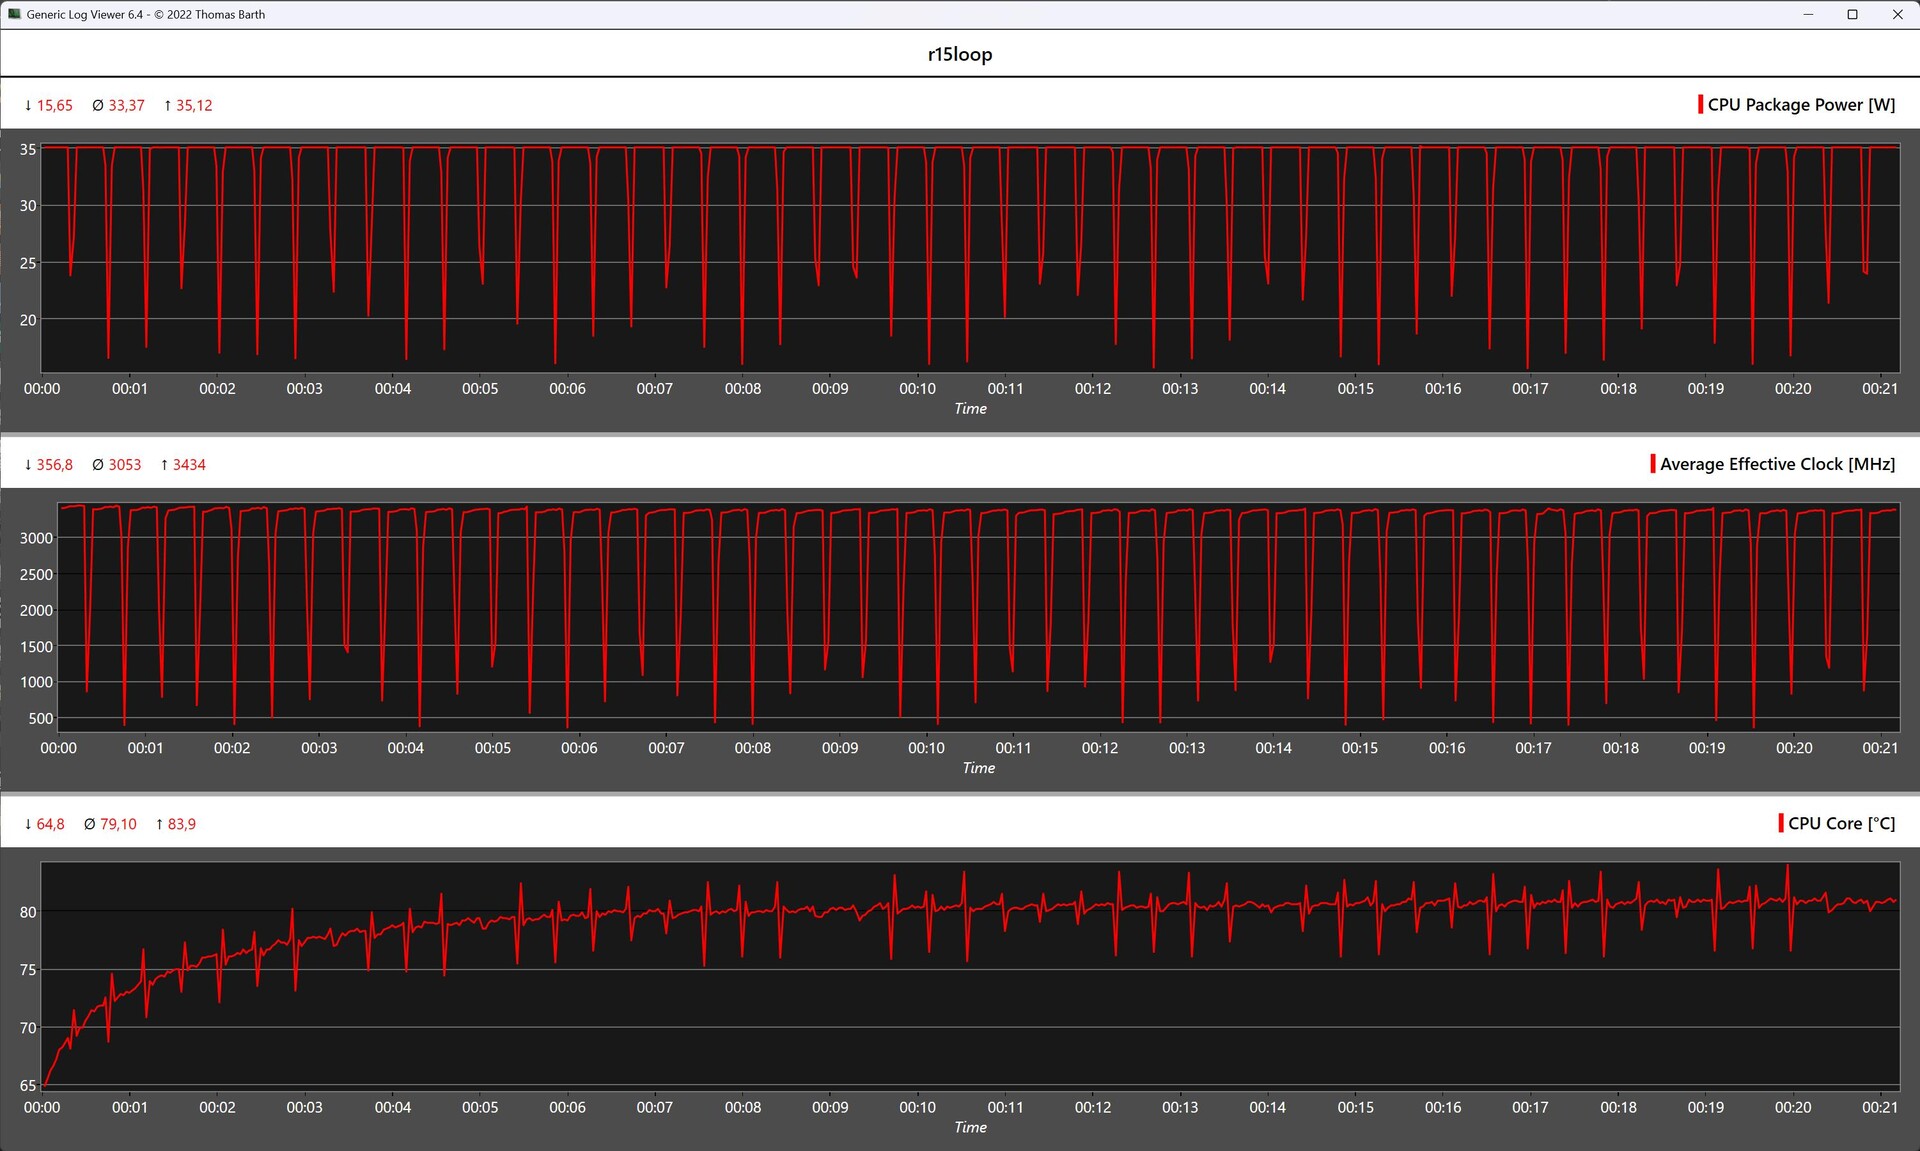
Maxtang MTN-FP750 vs. Cinebench R15 Multi-Loop
El multiloop Cinebench R15 nos mostró lo bien que funciona el sistema de refrigeración bajo carga. La unidad de refrigeración no llega a sus límites debido a un bajo TDP máximo de sólo 35 vatios y por eso el dispositivo fue capaz de lograr un rendimiento de la CPU consistentemente estable. En la comparación, nuestra muestra de revisión incluso consiguió asegurarse el segundo puesto por detrás del Geekom AS 6.
Rendimiento del sistema
Una vez más, en las pruebas sintéticas de rendimiento del sistema, nuestro dispositivo de revisión también se encontró a la cola. En las tareas diarias durante las pruebas y desde un punto de vista subjetivo, el Maxtang MTN-FP750 fue capaz de ofrecer un buen rendimiento del sistema, siempre y cuando éste no se viera desafiado a manejar demasiadas tareas simultáneamente. La RAM parece ser el cuello de botella, ya que una vez restada la memoria gráfica, sólo quedan disponibles 12 de los 16 GB.
| AIDA64 / Memory Copy | |
| Media de la clase Mini PC (15933 - 163031, n=104, últimos 2 años) | |
| Geekom AS 6, R9 6900HX | |
| Minisforum Venus Series NAB6 | |
| Minisforum Neptune Series NAD9 | |
| Geekom Mini IT12 | |
| NiPoGi AD08 | |
| Geekom A5 | |
| Maxtang MTN-FP750 | |
| AIDA64 / Memory Read | |
| Media de la clase Mini PC (14143 - 123769, n=104, últimos 2 años) | |
| Geekom AS 6, R9 6900HX | |
| Minisforum Venus Series NAB6 | |
| Minisforum Neptune Series NAD9 | |
| Geekom Mini IT12 | |
| NiPoGi AD08 | |
| Geekom A5 | |
| Maxtang MTN-FP750 | |
| AIDA64 / Memory Write | |
| Media de la clase Mini PC (10630 - 216693, n=104, últimos 2 años) | |
| Geekom AS 6, R9 6900HX | |
| Minisforum Venus Series NAB6 | |
| Minisforum Neptune Series NAD9 | |
| Geekom Mini IT12 | |
| Geekom A5 | |
| NiPoGi AD08 | |
| Maxtang MTN-FP750 | |
| AIDA64 / Memory Latency | |
| NiPoGi AD08 | |
| Media de la clase Mini PC (88.1 - 184.8, n=105, últimos 2 años) | |
| Minisforum Neptune Series NAD9 | |
| Geekom AS 6, R9 6900HX | |
| Geekom A5 | |
| Geekom Mini IT12 | |
| Maxtang MTN-FP750 | |
| Minisforum Venus Series NAB6 | |
* ... más pequeño es mejor
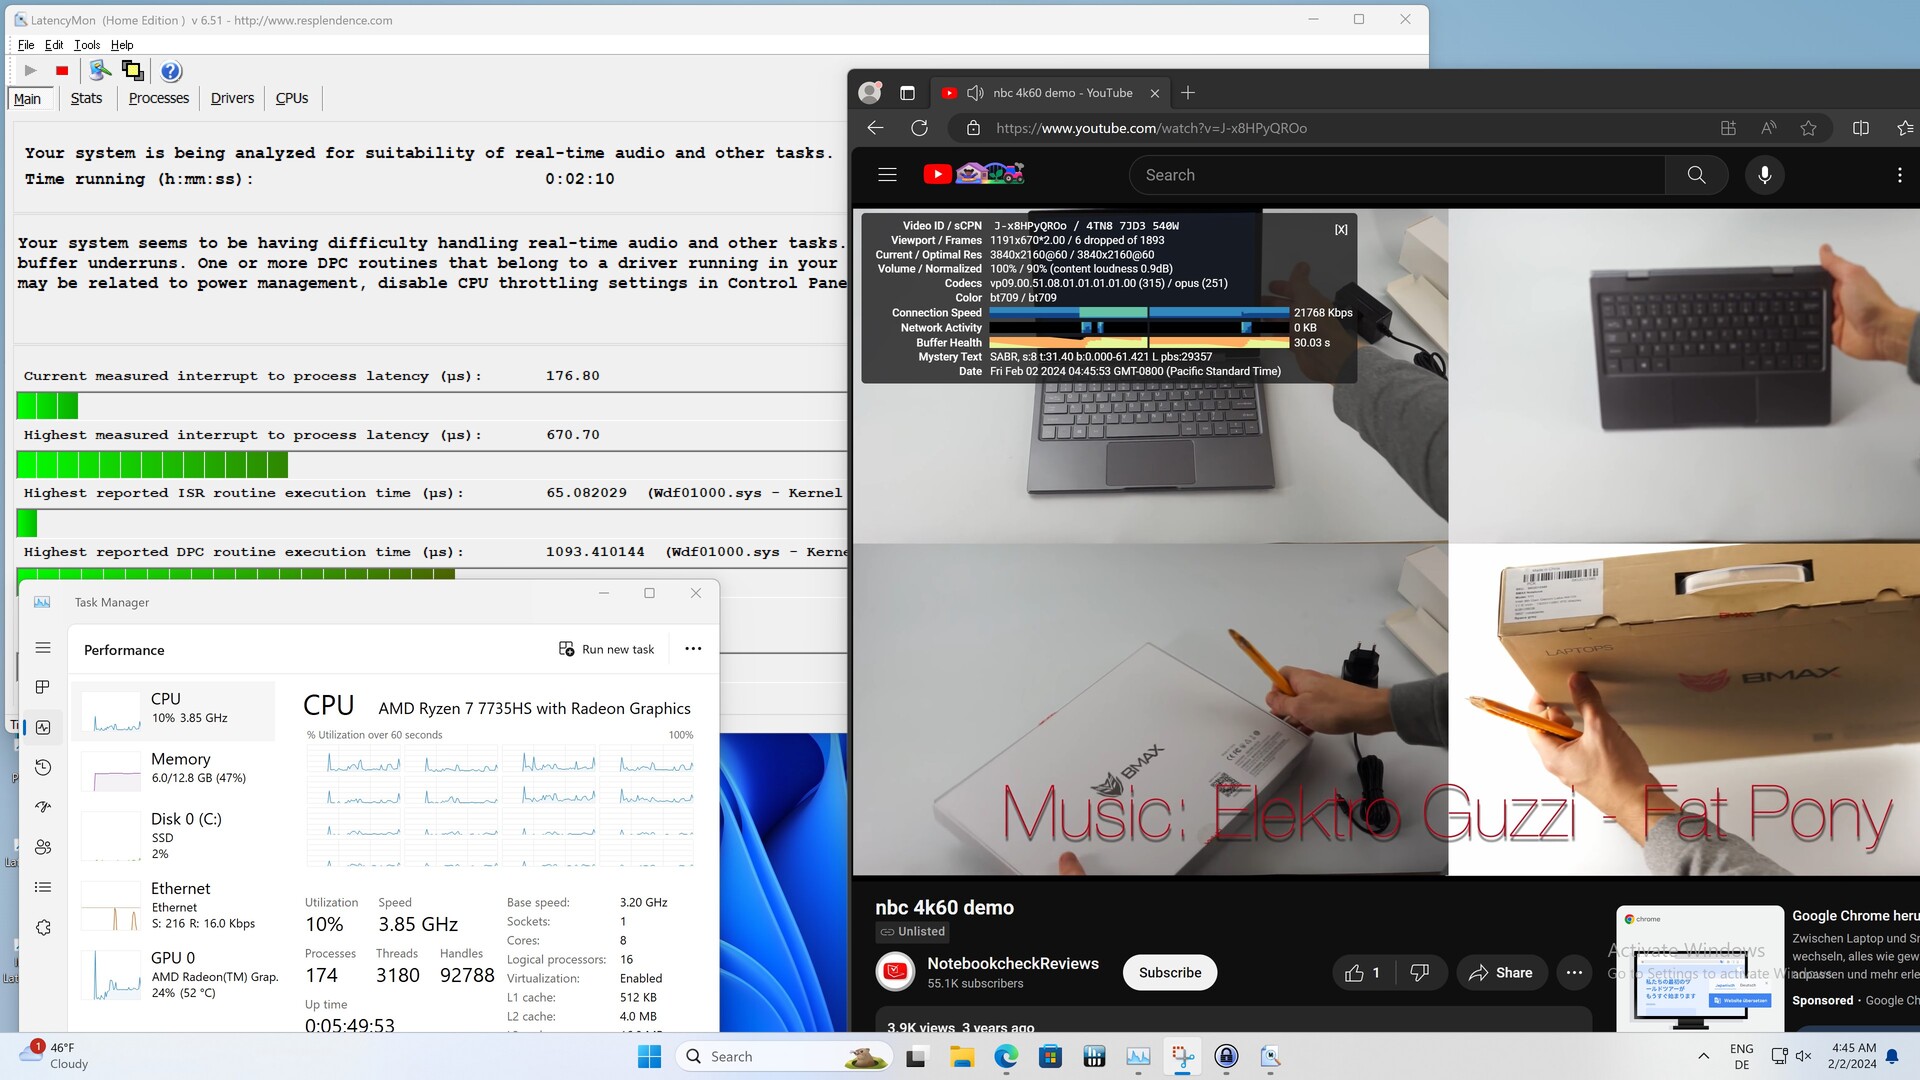
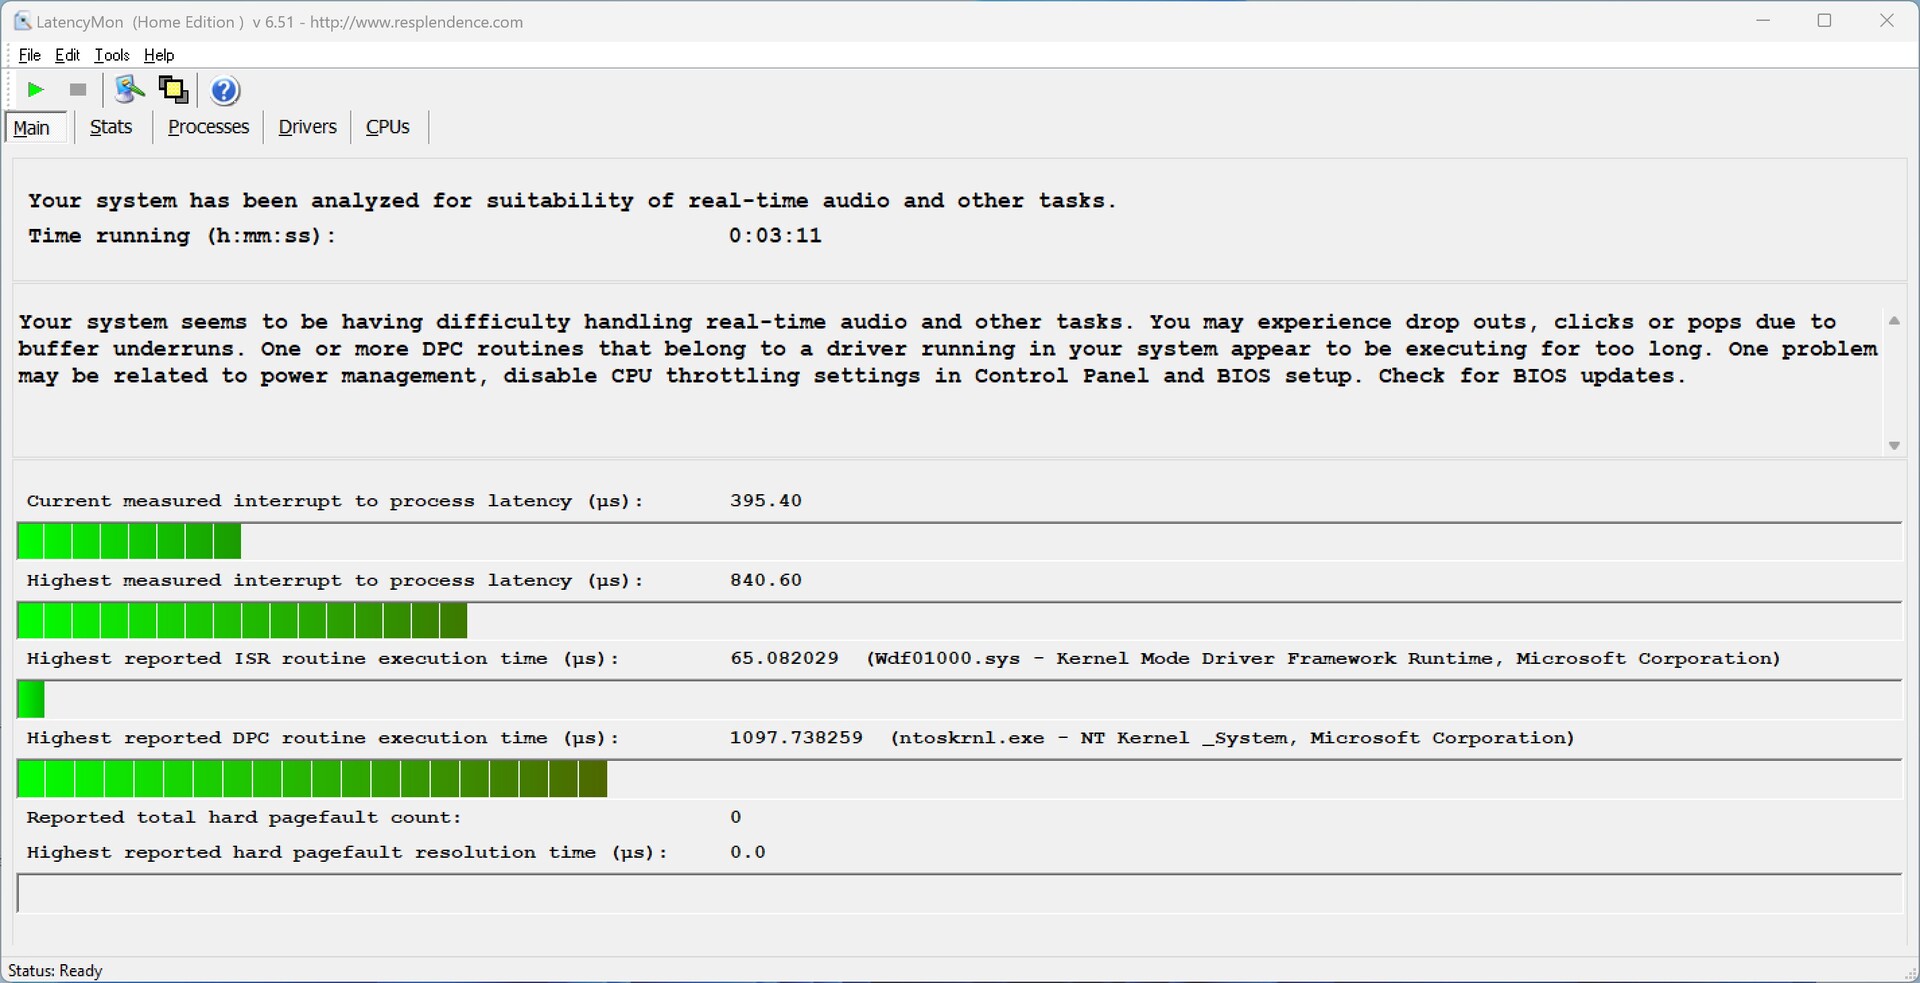
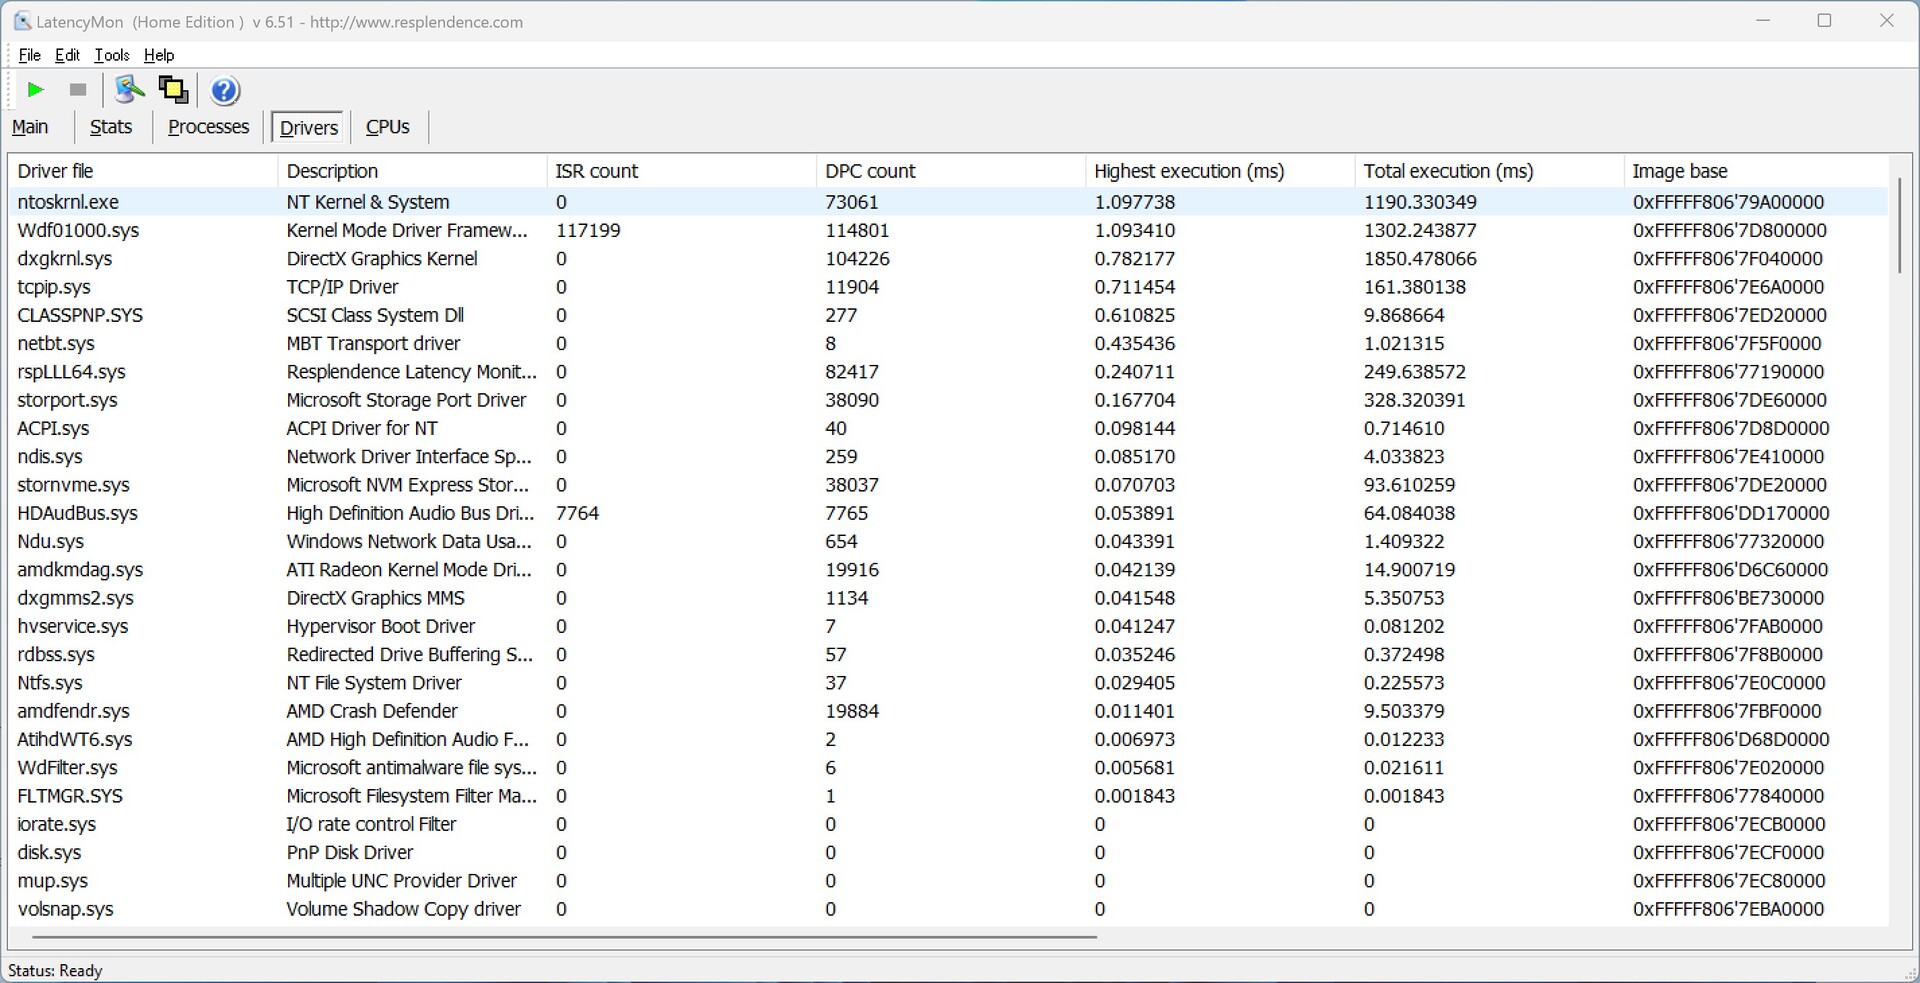
Latencias del CPD
Ya registramos un ligero aumento de las latencias al abrir varias pestañas con el navegador Edge. Sin embargo, no aumentaron a medida que continuaba la prueba. Al reproducir nuestro vídeo de prueba 4K, la iGPU se estresó en torno al 24 por ciento de su capacidad.
| DPC Latencies / LatencyMon - interrupt to process latency (max), Web, Youtube, Prime95 | |
| Geekom AS 6, R9 6900HX | |
| Geekom A5 | |
| Minisforum Neptune Series NAD9 | |
| Maxtang MTN-FP750 | |
| NiPoGi AD08 | |
| Geekom Mini IT12 | |
| Minisforum Venus Series NAB6 | |
* ... más pequeño es mejor
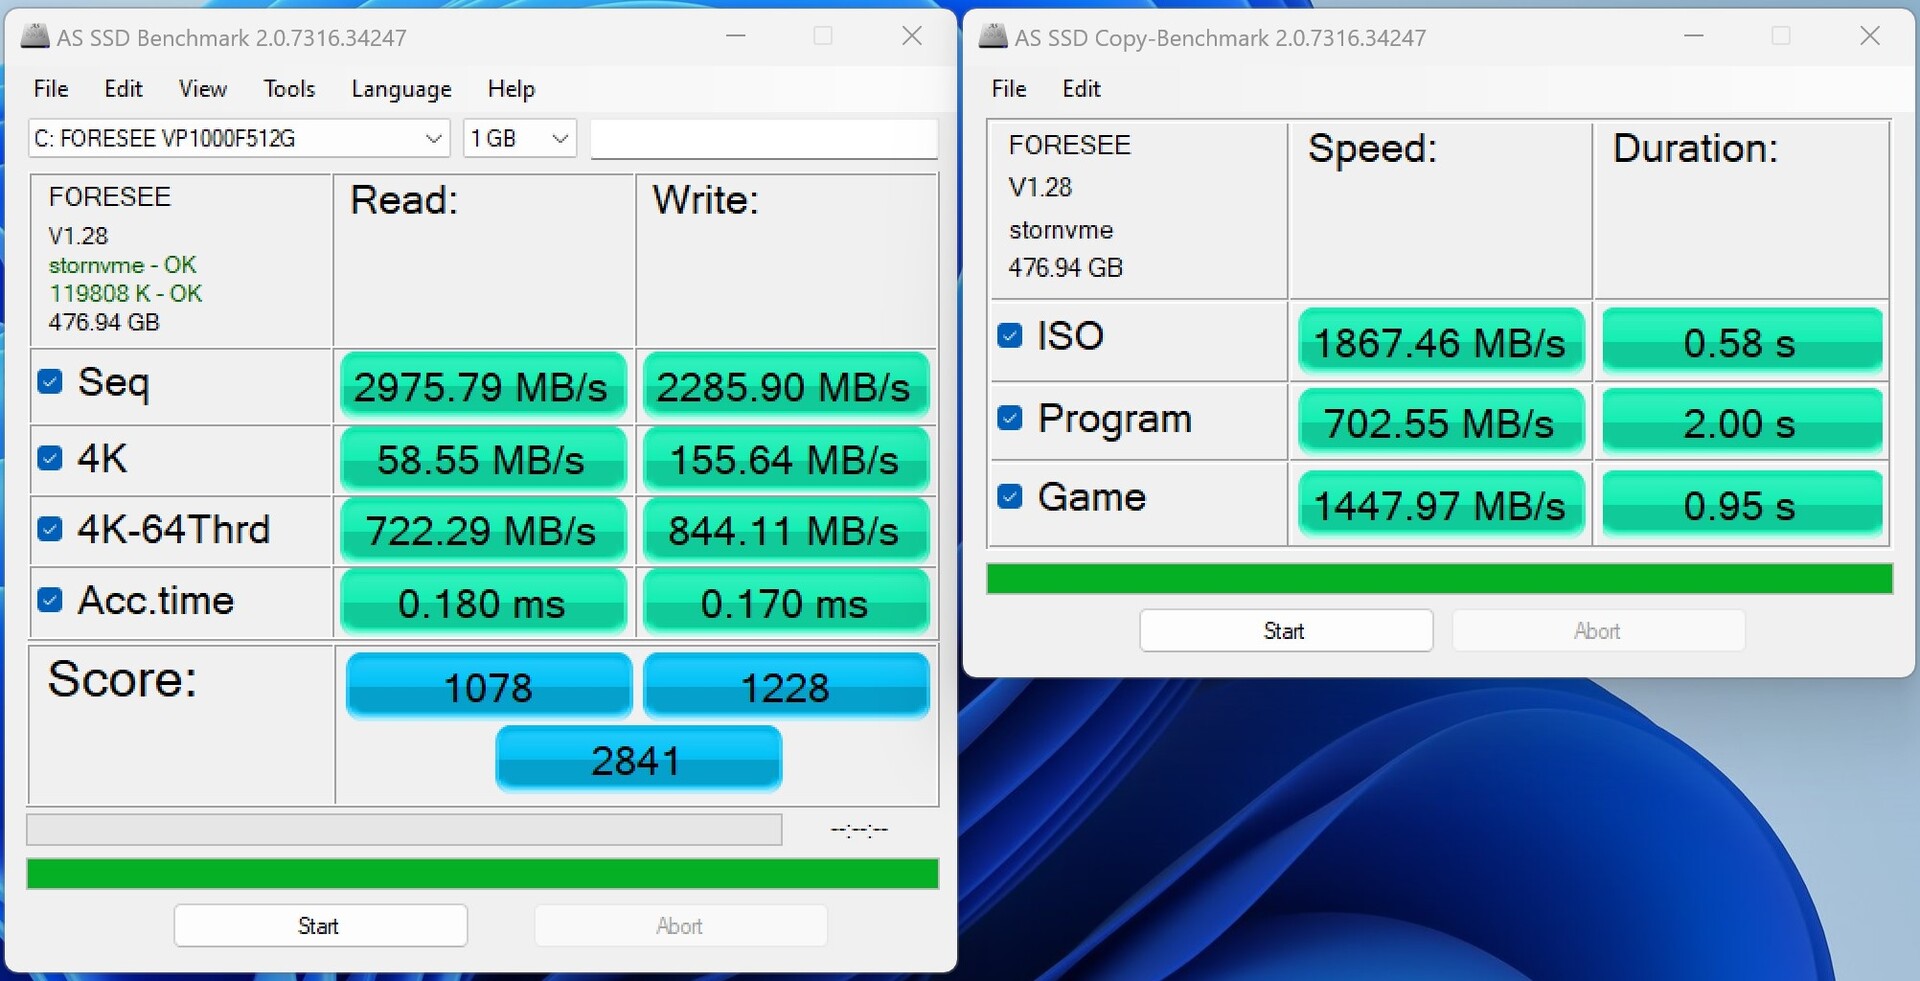
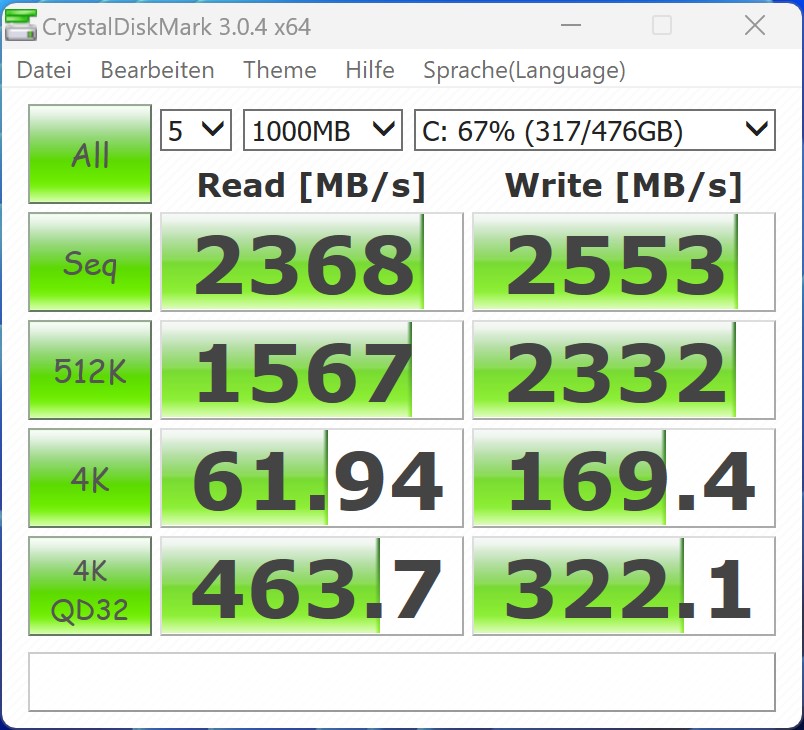
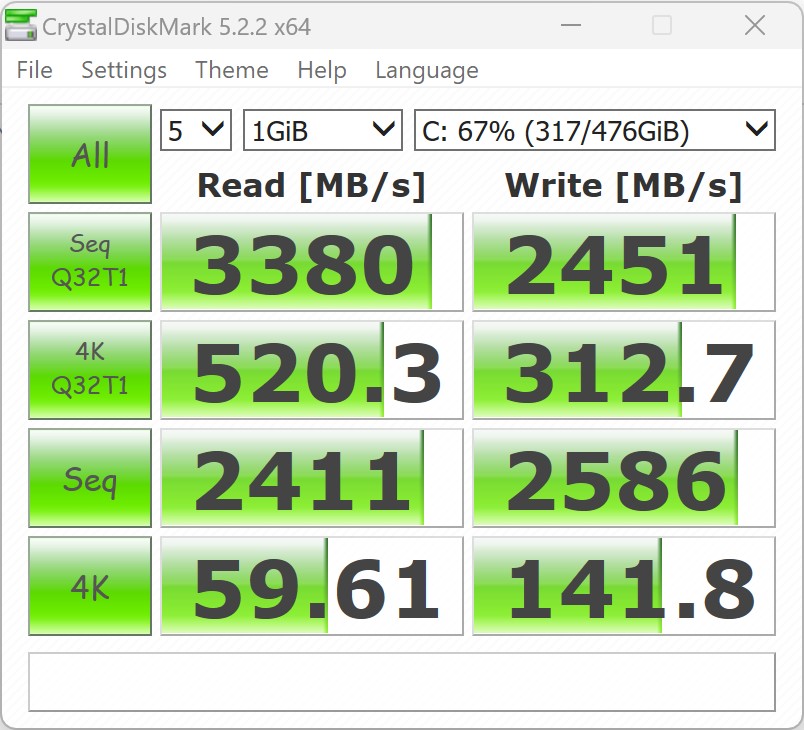
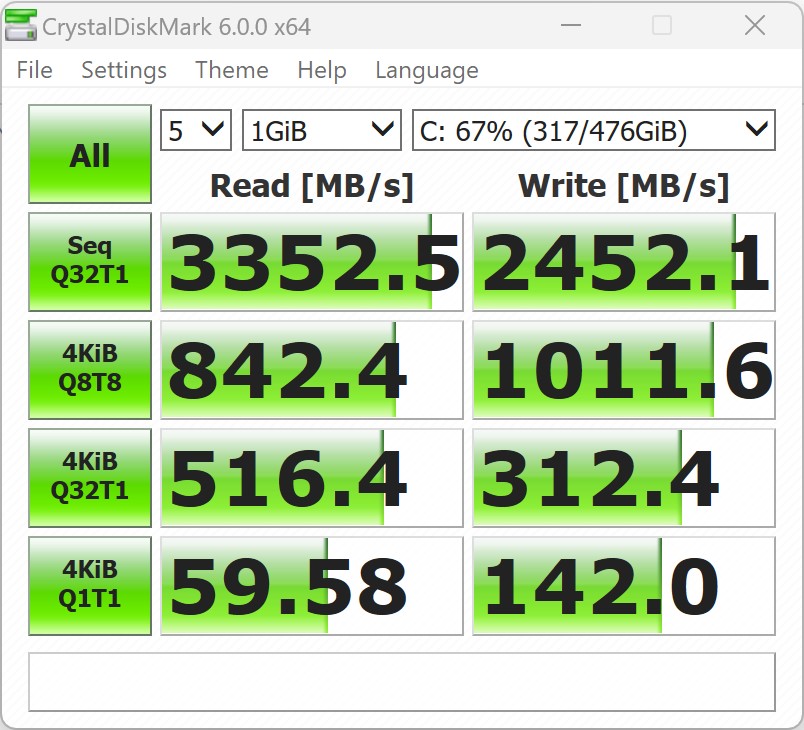
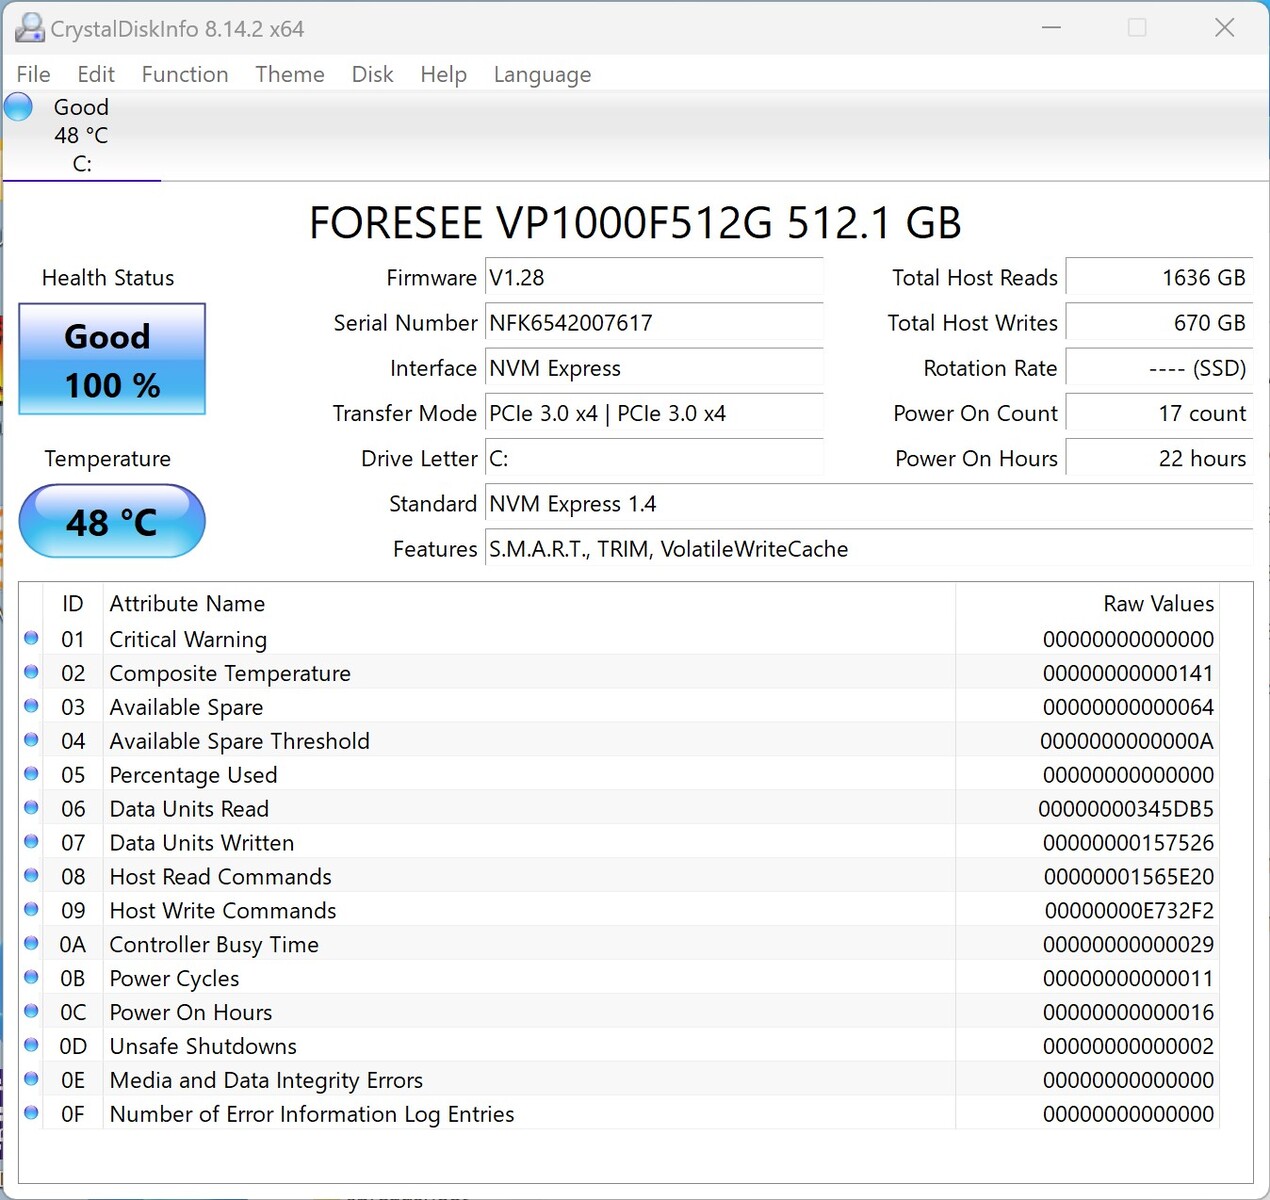
Almacenamiento masivo
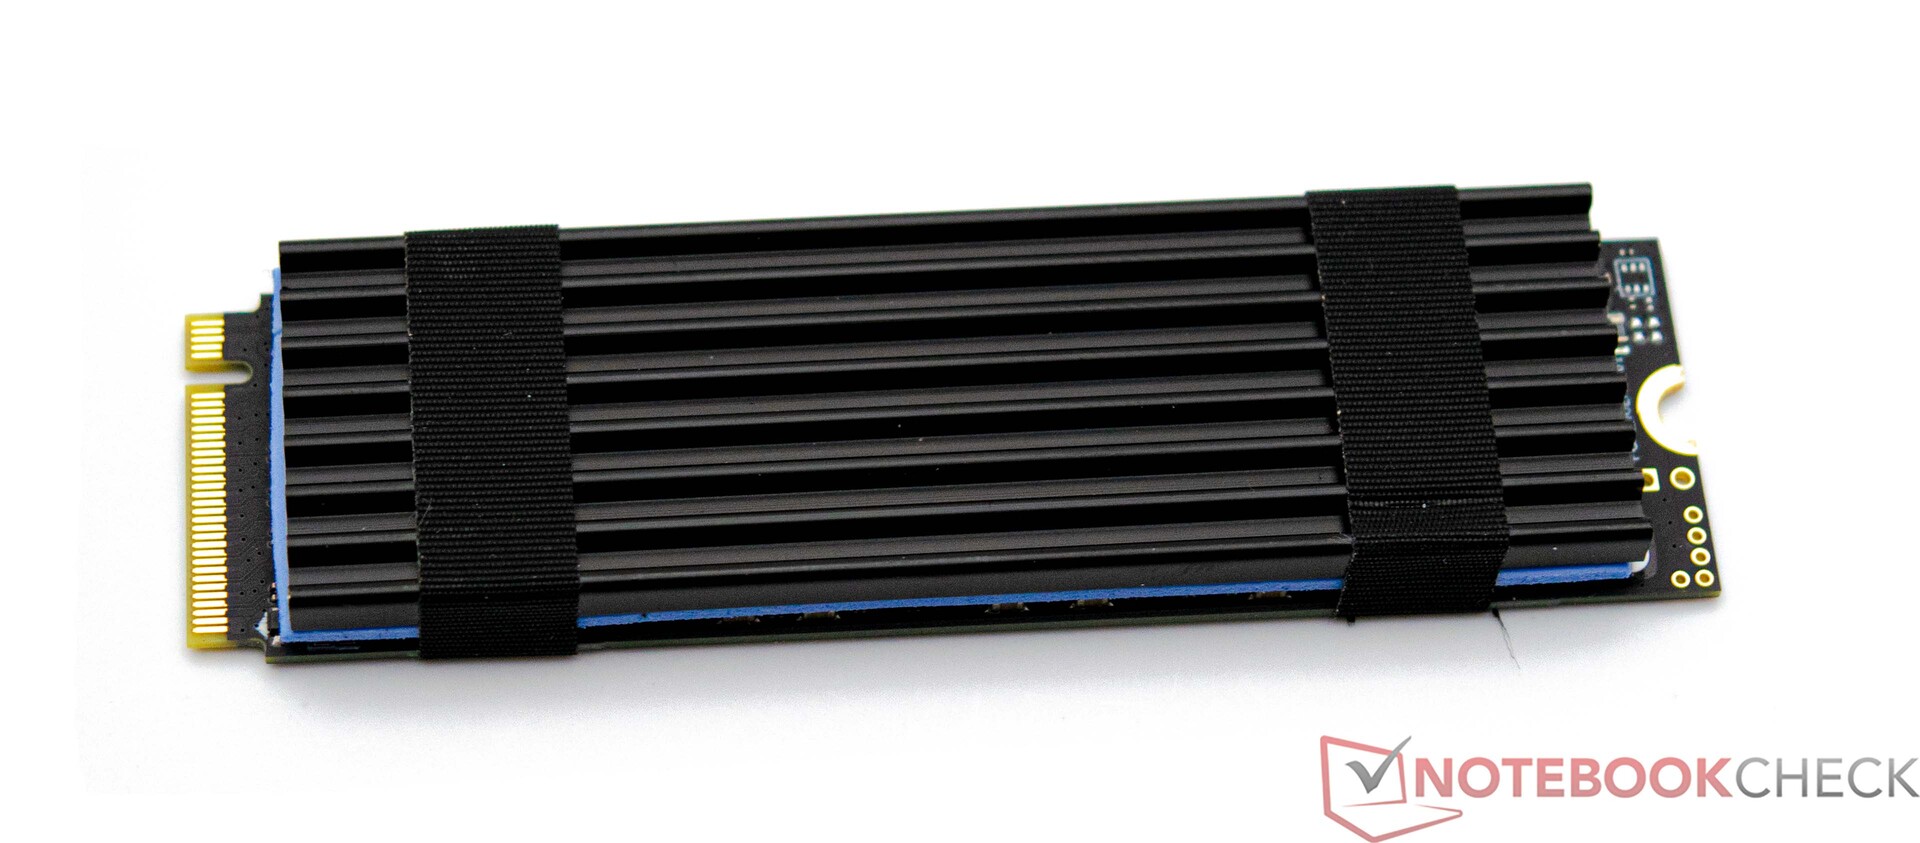
Maxtang equipó nuestra muestra de revisión del MTN-FP750 con una unidad SSD Foresee de 512 GB. La SSD PCIe 3.0 hace uso de la interfaz M.2 con el máximo ancho de banda posible y no se ve frenada artificialmente por una interfaz lenta. A pesar de ello, nuestro dispositivo de análisis sólo pudo ganarse un puesto en la mitad de la tabla. Se puede instalar un dispositivo de almacenamiento adicional de 2,5 pulgadas. Consulte nuestra tabla comparativa para más comparaciones y puntos de referencia.

| Drive Performance rating - Percent | |
| Minisforum Neptune Series NAD9 | |
| Minisforum Venus Series NAB6 | |
| Media de la clase Mini PC | |
| Geekom A5 | |
| NiPoGi AD08 | |
| Geekom Mini IT12 | |
| Maxtang MTN-FP750 | |
| Geekom AS 6, R9 6900HX | |
* ... más pequeño es mejor
Continuous Performance Read: DiskSpd Read Loop, Queue Depth 8
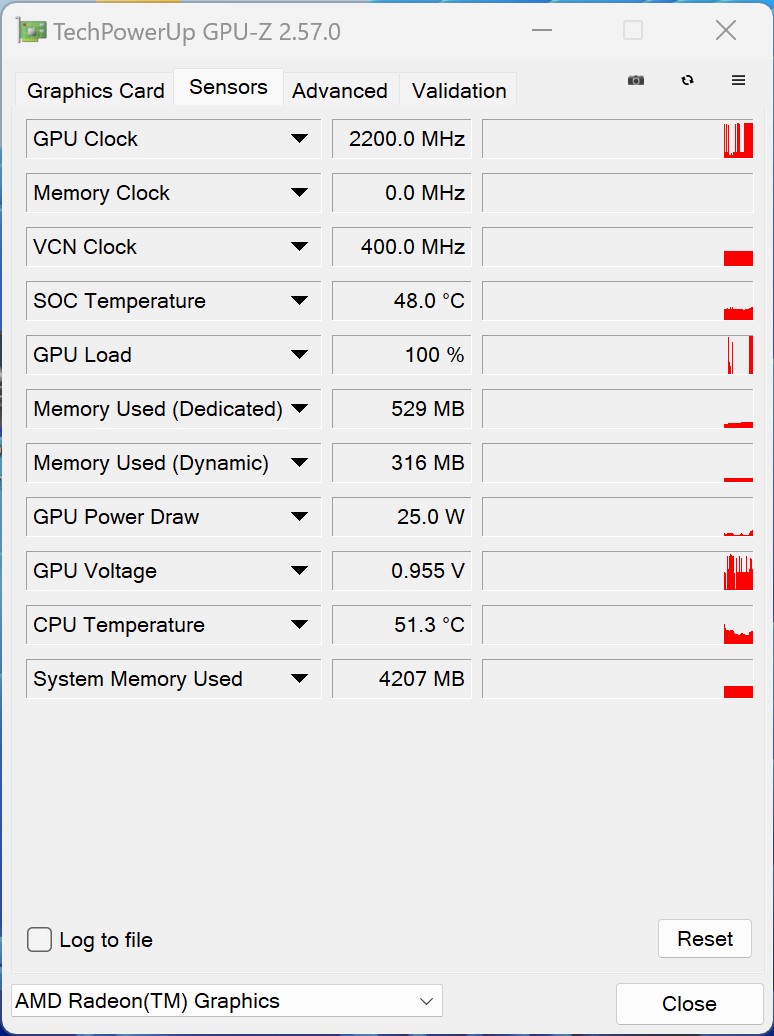
Tarjeta gráfica
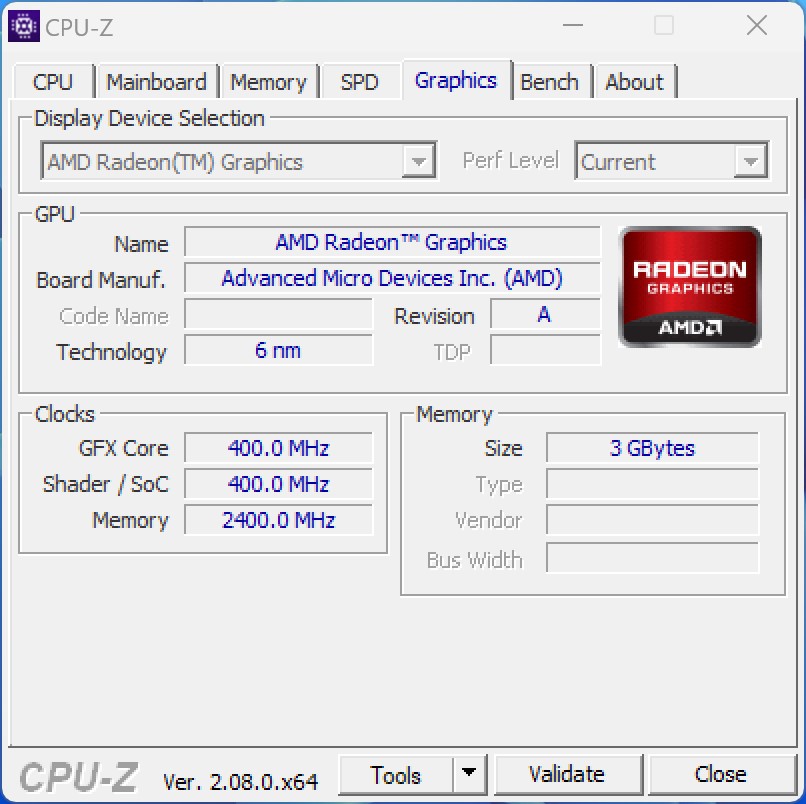
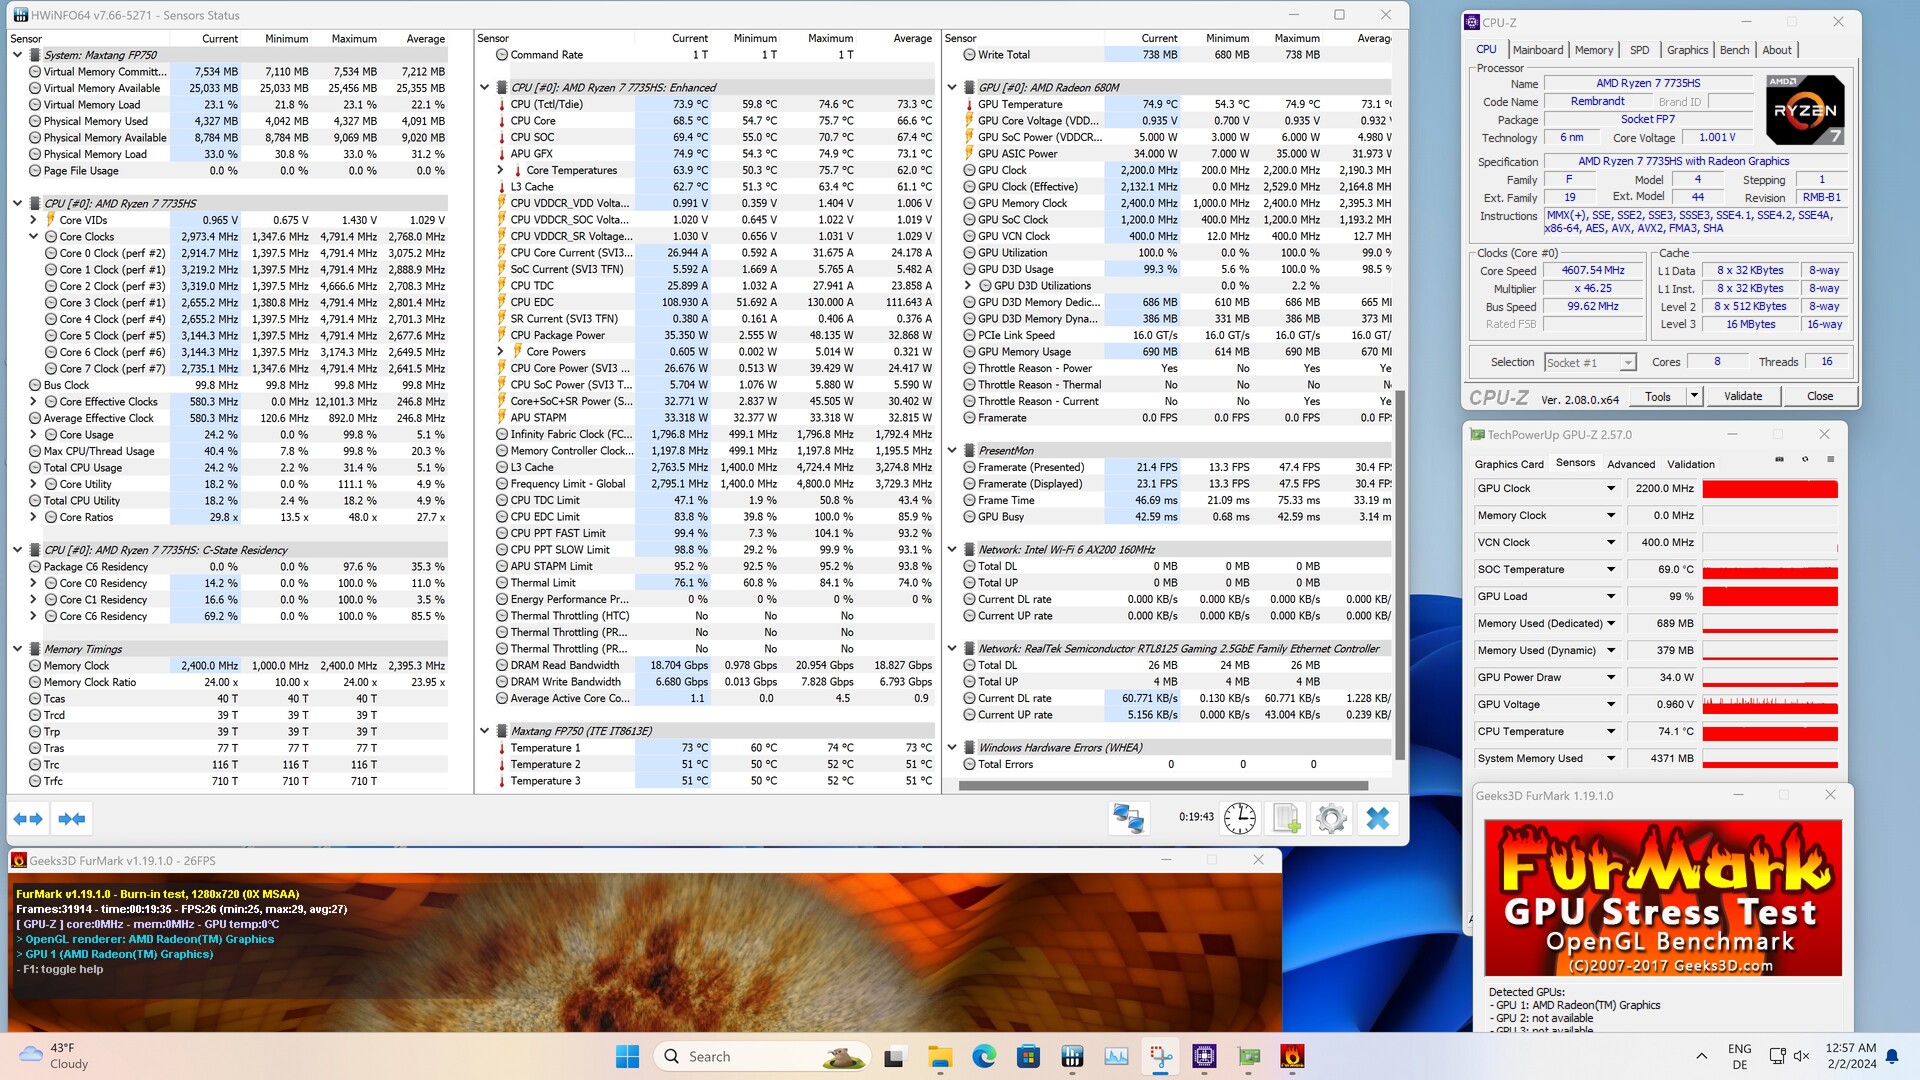
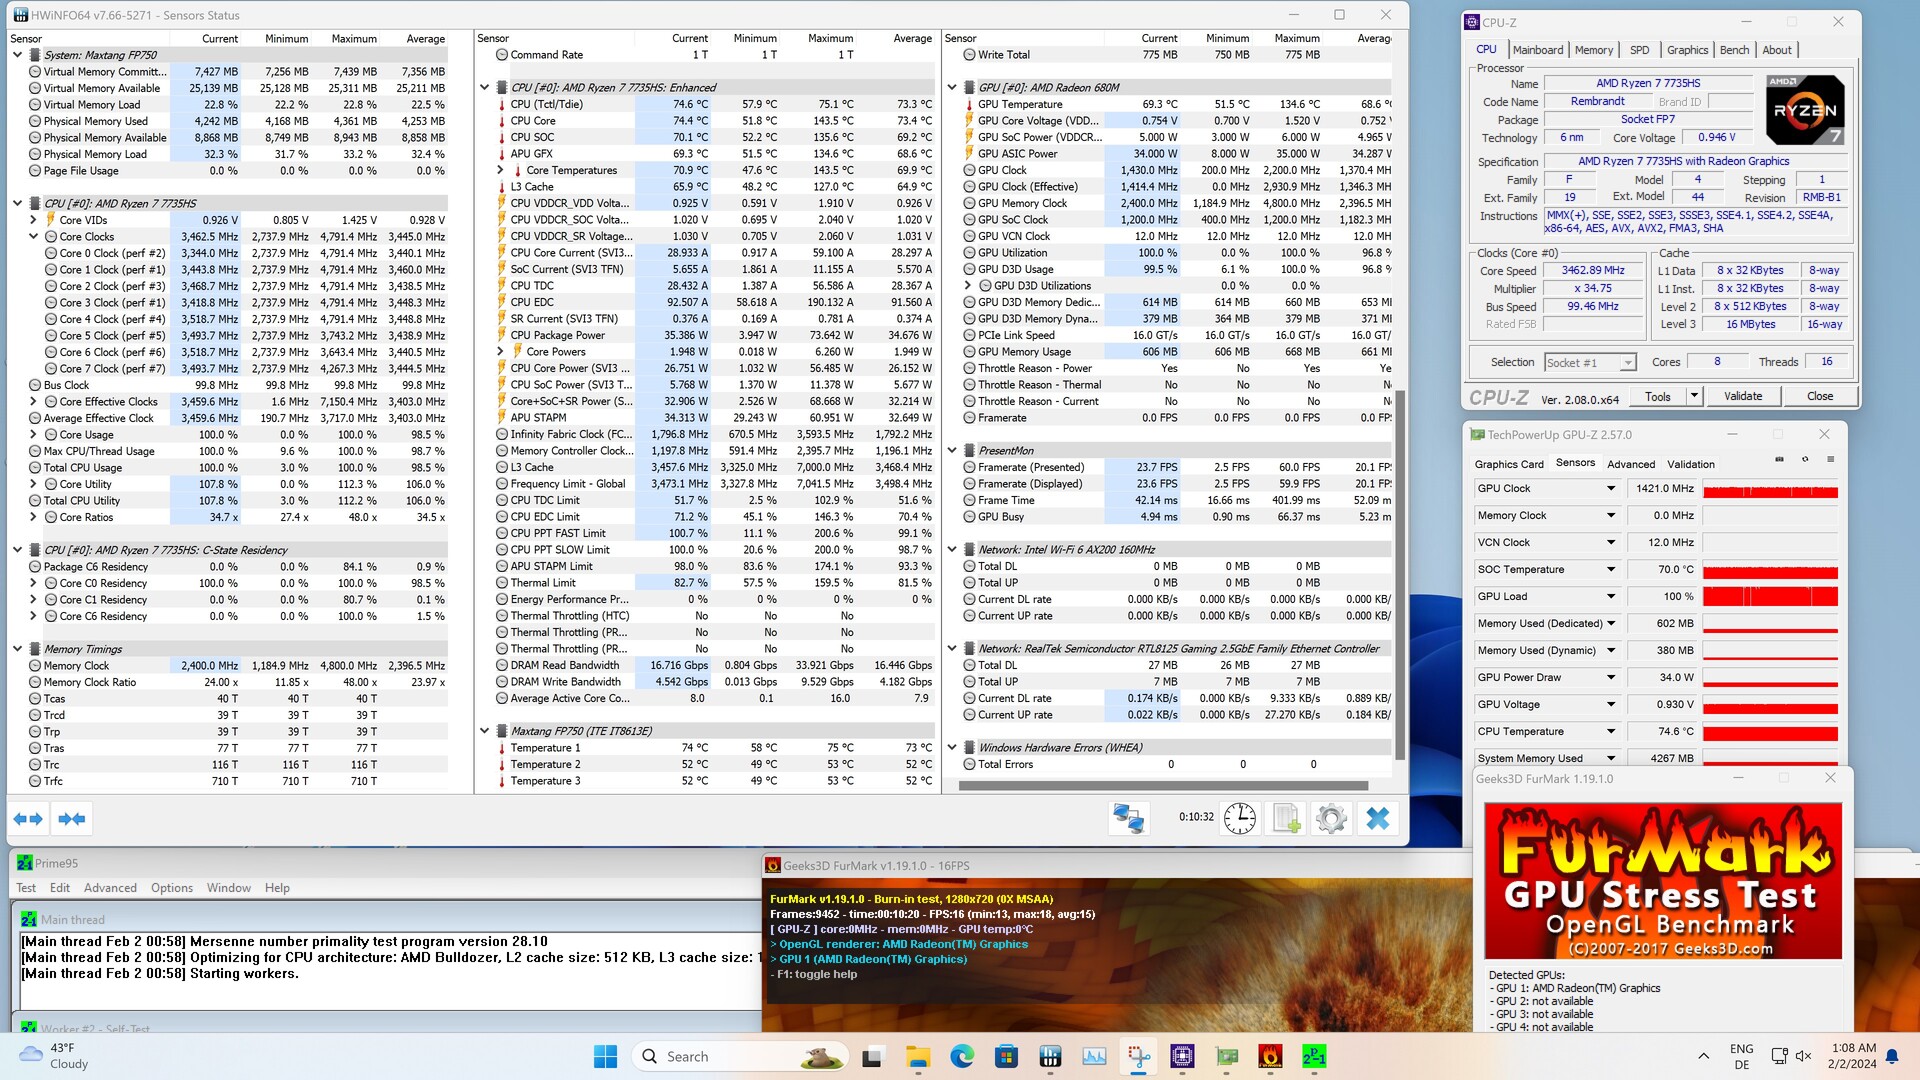
La salida gráfica corre a cargo de la AMD Radeon 680Muna iGPU que ofrece un buen rendimiento en la mayoría de las situaciones. Sin embargo, con el Maxtang MTN-FP750, esto es algo diferente y la razón es la RAM instalada. El fabricante sólo equipó nuestro dispositivo de revisión con un módulo de RAM. En esta configuración, la AMD Radeon 680M apenas es más rápida que la Intel Iris Xe Graphics G7 con 96 UE. Incluso el Geekom A5 tiene la nariz delante de nuestra muestra de revisión con su antigua AMD Radeon RX Vega 8.
Para llegar al fondo del débil rendimiento, tomamos otro módulo de RAM de nuestros suministros y realizamos algunas pruebas comparativas. Esto condujo a resultados más o menos a la par con el Geekom AS 6 con lo que el Maxtang MTN-FP750 no tiene nada que envidiar a sus competidores.
Puede encontrar más pruebas comparativas de la AMD Radeon 680M aquí.
| 3DMark Performance rating - Percent | |
| Medio AMD Radeon 680M | |
| Geekom AS 6, R9 6900HX | |
| Minisforum Neptune Series NAD9 | |
| Geekom A5 | |
| Geekom Mini IT12 | |
| Maxtang MTN-FP750 | |
| Minisforum Venus Series NAB6 | |
| NiPoGi AD08 | |
| Performance rating - Percent | |
| Geekom AS 6, R9 6900HX | |
| Geekom A5 | |
| Maxtang MTN-FP750 | |
| Minisforum Neptune Series NAD9 | |
| Geekom Mini IT12 | |
| Minisforum Venus Series NAB6 | |
| NiPoGi AD08 | |
| Unigine Valley 1.0 | |
| 1920x1080 Extreme HD DirectX AA:x8 | |
| Geekom AS 6, R9 6900HX | |
| Minisforum Neptune Series NAD9 | |
| Geekom A5 | |
| Geekom Mini IT12 | |
| Minisforum Venus Series NAB6 | |
| NiPoGi AD08 | |
| Maxtang MTN-FP750 | |
| 1920x1080 Extreme HD Preset OpenGL AA:x8 | |
| Geekom AS 6, R9 6900HX | |
| Geekom Mini IT12 | |
| Minisforum Neptune Series NAD9 | |
| Minisforum Venus Series NAB6 | |
| Geekom A5 | |
| Maxtang MTN-FP750 | |
| NiPoGi AD08 | |
| Maxtang MTN-FP750, AMD Radeon 680M R7 7735HS | Minisforum Neptune Series NAD9, Intel Iris Xe Graphics G7 96EUs i9-12900H | Geekom AS 6, R9 6900HX, AMD Radeon 680M R9 6900HX | Geekom Mini IT12, Intel Iris Xe Graphics G7 96EUs i7-1260P | Geekom A5, AMD Radeon RX Vega 8 (Ryzen 4000/5000) R7 5800H | Minisforum Venus Series NAB6, Intel UHD Graphics 64EUs (Alder Lake 12th Gen) i7-12650H | NiPoGi AD08, Intel UHD Graphics 64EUs (Alder Lake 12th Gen) i7-12650H | Media de la clase Mini PC | |
|---|---|---|---|---|---|---|---|---|
| SPECviewperf 12 | -26% | 58% | -31% | 2% | -37% | -34% | 217% | |
| 1900x1060 3ds Max (3dsmax-05) (fps) | 46.9 | 40.9 -13% | 75.3 61% | 38.7 -17% | 51.7 10% | 36.2 -23% | 34.4 -27% | 152.2 ? 225% |
| 1900x1060 Catia (catia-04) (fps) | 51.5 | 41.2 -20% | 70.3 37% | 38.5 -25% | 44.2 -14% | 34.5 -33% | 30.3 -41% | 144.2 ? 180% |
| 1900x1060 Creo (creo-01) (fps) | 33.2 | 9.64 -71% | 45.2 36% | 7.52 -77% | 36.3 9% | 6.44 -81% | 21.1 -36% | 71.6 ? 116% |
| 1900x1060 Energy (energy-01) (fps) | 0.41 | 76.1 | 0.41 | 0.35 | 0.77 | 22.7 ? | ||
| 1900x1060 Maya (maya-04) (fps) | 45.2 | 39.9 -12% | 58.3 29% | 36.5 -19% | 40.3 -11% | 33.4 -26% | 32.5 -28% | 130.7 ? 189% |
| 1900x1060 Medical (medical-01) (fps) | 17.9 | 12.3 -31% | 44 146% | 11.2 -37% | 18.2 2% | 9.12 -49% | 8.41 -53% | 80.8 ? 351% |
| 1900x1060 Showcase (showcase-01) (fps) | 17.5 | 17.9 2% | 30.1 72% | 16.7 -5% | 21.7 24% | 15.9 -9% | 15.2 -13% | 84.9 ? 385% |
| 1900x1060 Solidworks (sw-03) (fps) | 72.1 | 47.2 -35% | 88.8 23% | 43.7 -39% | 68.3 -5% | 44.5 -38% | 43.4 -40% | 122.8 ? 70% |
| SPECviewperf 13 | -27% | 51% | -30% | 2% | -37% | -40% | 246% | |
| 3ds Max (3dsmax-06) (fps) | 48.3 | 40.5 -16% | 76.7 59% | 37.9 -22% | 51.6 7% | 36 -25% | 34.1 -29% | 148.3 ? 207% |
| Catia (catia-05) (fps) | 73.9 | 59.4 -20% | 105 42% | 56.3 -24% | 62.1 -16% | 49.6 -33% | 43.2 -42% | 199.1 ? 169% |
| Creo (creo-02) (fps) | 44.9 | 38.8 -14% | 78.4 75% | 36.8 -18% | 50.6 13% | 33 -27% | 33.1 -26% | 167.5 ? 273% |
| Energy (energy-02) (fps) | 11.4 | 4.27 -63% | 13.9 22% | 4.29 -62% | 10.6 -7% | 2.82 -75% | 2.62 -77% | 41 ? 260% |
| Maya (maya-05) (fps) | 58.3 | 44.2 -24% | 99 70% | 42.9 -26% | 56.5 -3% | 38.2 -34% | 41.3 -29% | 207 ? 255% |
| Medical (medical-02) (fps) | 32.8 | 14.5 -56% | 44.9 37% | 14 -57% | 31 -5% | 10.9 -67% | 8.63 -74% | 154.2 ? 370% |
| Showcase (showcase-02) (fps) | 17.4 | 17.9 3% | 30.4 75% | 16.8 -3% | 21.5 24% | 15.7 -10% | 15.1 -13% | 80.5 ? 363% |
| Solidworks (sw-04) (fps) | 72.9 | 55.8 -23% | 95 30% | 54.1 -26% | 72.4 -1% | 53.9 -26% | 51.9 -29% | 124.1 ? 70% |
| SPECviewperf 2020 | -35% | 84% | -24% | 2% | -43% | 300% | ||
| 3840x2160 Medical (medical-03) (fps) | 4.72 | 2.57 -46% | 8.59 82% | 3.37 -29% | 4.82 2% | 2.54 -46% | 23.1 ? 389% | |
| 3840x2160 Energy (energy-03) (fps) | 6.6 | 3.02 -54% | 16.9 156% | 7.39 12% | 5.33 -19% | 1.9 -71% | 34.2 ? 418% | |
| 3840x2160 Creo (creo-03) (fps) | 17.5 | 15.3 -13% | 28.9 65% | 15.1 -14% | 19.1 9% | 12.7 -27% | 50.2 ? 187% | |
| 3840x2160 CATIA (catia-06) (fps) | 13.1 | 8.2 -37% | 20.4 56% | 8.23 -37% | 13.1 0% | 7.63 -42% | 35.1 ? 168% | |
| 3840x2160 3ds Max (3dsmax-07) (fps) | 9.26 | 9.67 4% | 17.5 89% | 9.65 4% | 11.3 22% | 8.65 -7% | 55.4 ? 498% | |
| 3840x2160 Siemens NX (snx-04) (fps) | 33 | 6.69 -80% | 58.5 77% | 6.23 -81% | 38 15% | 6.61 -80% | 52.1 ? 58% | |
| 3840x2160 Maya (maya-06) (fps) | 29.5 | 24 -19% | 47.4 61% | 23.7 -20% | 25.8 -13% | 21.2 -28% | 142.5 ? 383% | |
| Media total (Programa/Opciones) | -29% /
-29% | 64% /
64% | -28% /
-28% | 2% /
2% | -39% /
-39% | -37% /
-37% | 254% /
254% |
| 3DMark 06 Score 1366x768 | 25274 puntos | |
| 3DMark Vantage P Result | 24874 puntos | |
| 3DMark 11 Performance | 6723 puntos | |
| 3DMark Ice Storm Standard Score | 127954 puntos | |
| 3DMark Cloud Gate Standard Score | 21960 puntos | |
| 3DMark Fire Strike Score | 4002 puntos | |
| 3DMark Fire Strike Extreme Score | 2090 puntos | |
| 3DMark Time Spy Score | 1591 puntos | |
ayuda | ||
Rendimiento en juegos
Nuestro Maxtang MTN-FP750 de especificaciones de prueba sólo goza de una idoneidad limitada para los juegos. La relativamente potente AMD Radeon 680M no consigue ofrecer toda su potencia. Por lo tanto, recomendamos la instalación de dos módulos de RAM para alcanzar el máximo rendimiento. Una orientación aproximada sobre el rendimiento en juegos puede encontrarse en el Geekom AS 6.
Para más comparaciones y pruebas comparativas, eche un vistazo a nuestra Lista de juegos GPU.
| The Witcher 3 | |
| 1024x768 Low Graphics & Postprocessing | |
| Geekom AS 6, R9 6900HX | |
| Minisforum Neptune Series NAD9 | |
| Geekom Mini IT12 | |
| Geekom A5 | |
| Minisforum Venus Series NAB6 | |
| NiPoGi AD08 | |
| Maxtang MTN-FP750 | |
| 1920x1080 High Graphics & Postprocessing (Nvidia HairWorks Off) | |
| Geekom AS 6, R9 6900HX | |
| Minisforum Neptune Series NAD9 | |
| NiPoGi AD08 | |
| Geekom Mini IT12 | |
| Minisforum Venus Series NAB6 | |
| Geekom A5 | |
| Maxtang MTN-FP750 | |
| Borderlands 3 | |
| 1280x720 Very Low Overall Quality (DX11) | |
| Geekom A5 | |
| Geekom AS 6, R9 6900HX | |
| Minisforum Neptune Series NAD9 | |
| Maxtang MTN-FP750 | |
| Geekom Mini IT12 | |
| Minisforum Venus Series NAB6 | |
| NiPoGi AD08 | |
| 1920x1080 High Overall Quality (DX11) | |
| Geekom AS 6, R9 6900HX | |
| Geekom A5 | |
| Minisforum Neptune Series NAD9 | |
| Maxtang MTN-FP750 | |
| Geekom Mini IT12 | |
| Minisforum Venus Series NAB6 | |
| NiPoGi AD08 | |
| GTA V | |
| 1024x768 Lowest Settings possible | |
| Geekom A5 | |
| Minisforum Neptune Series NAD9 | |
| Minisforum Venus Series NAB6 | |
| Geekom AS 6, R9 6900HX | |
| Geekom Mini IT12 | |
| NiPoGi AD08 | |
| Maxtang MTN-FP750 | |
| 1920x1080 High/On (Advanced Graphics Off) AA:2xMSAA + FX AF:8x | |
| Geekom AS 6, R9 6900HX | |
| Geekom A5 | |
| Maxtang MTN-FP750 | |
| Minisforum Neptune Series NAD9 | |
| Geekom Mini IT12 | |
| Minisforum Venus Series NAB6 | |
| NiPoGi AD08 | |
| bajo | medio | alto | ultra | |
|---|---|---|---|---|
| GTA V (2015) | 95.5 | 85.7 | 28.2 | 12.7 |
| The Witcher 3 (2015) | 73 | 46.7 | 23.7 | 14.9 |
| Dota 2 Reborn (2015) | 115.8 | 87.4 | 60.5 | 53.1 |
| Final Fantasy XV Benchmark (2018) | 39.2 | 20.5 | 14.6 | |
| X-Plane 11.11 (2018) | 49.8 | 39.8 | 33.8 | |
| Far Cry 5 (2018) | 46 | 25 | 22 | 21 |
| Strange Brigade (2018) | 78.4 | 31.4 | 26.7 | 23.1 |
| Shadow of the Tomb Raider (2018) | 53.3 | 21.8 | 19.8 | 16.4 |
| Far Cry New Dawn (2019) | 40 | 23 | 21 | 20 |
| Metro Exodus (2019) | 43.1 | 17.6 | 13.8 | 11.7 |
| Borderlands 3 (2019) | 58.2 | 24.8 | 15.7 | 12.5 |
| F1 2020 (2020) | 96.9 | 49.8 | 39.1 | 27.5 |
| F1 2021 (2021) | 97 | 49.8 | 36.4 | 16.7 |
| God of War (2022) | 19.5 | 15.9 | 11.7 | |
| GRID Legends (2022) | 58.2 | 45 | 34.2 | 26.6 |
| Tiny Tina's Wonderlands (2022) | 37.7 | 28.2 | 20.2 | 16.2 |
| F1 22 (2022) | 45.6 | 40.6 | 32.1 | 9.25 |
| F1 23 (2023) | 45.3 | 40.1 | 29.1 | |
| Total War Pharaoh (2023) | 43.3 | 33.3 | 21.6 | 16.9 |
| Prince of Persia The Lost Crown (2024) | 89.3 | 58.8 | 58.4 |
Emisiones - Económicas pero no inaudibles
Emisiones sonoras
Sin estar estresada, la Maxtang MTN-FP750 es, en su mayor parte, silenciosa. Sin embargo, bajo carga, alcanzamos rápidamente los 45 dB(A) y sólo pudimos discernir una diferencia mínima entre la carga media y la carga completa. Sin embargo, podemos considerar que esto está dentro de la tolerancia de medición. Es una pena que parezca haber sólo dos niveles de ventilador. Un vistazo a la tabla muestra que tanto el Geekom A5 como el NiPoGi AD08 eran aún más ruidosos en el mismo escenario.
Ruido
| Ocioso |
| 25.3 / 25.3 / 25.4 dB(A) |
| Carga |
| 45.1 / 45.3 dB(A) |
 | ||
30 dB silencioso 40 dB(A) audible 50 dB(A) ruidosamente alto |
||
min: | ||
| Maxtang MTN-FP750 R7 7735HS, Radeon 680M | Minisforum Neptune Series NAD9 i9-12900H, Iris Xe G7 96EUs | Geekom AS 6, R9 6900HX R9 6900HX, Radeon 680M | Geekom Mini IT12 i7-1260P, Iris Xe G7 96EUs | Geekom A5 R7 5800H, Vega 8 | Minisforum Venus Series NAB6 i7-12650H, UHD Graphics 64EUs | NiPoGi AD08 i7-12650H, UHD Graphics 64EUs | |
|---|---|---|---|---|---|---|---|
| Noise | -3% | -14% | -3% | -7% | -4% | -14% | |
| apagado / medio ambiente * (dB) | 25 | 30.2 -21% | 30 -20% | 29.8 -19% | 25 -0% | 29.4 -18% | 25 -0% |
| Idle Minimum * (dB) | 25.3 | 30.5 -21% | 33.2 -31% | 29.9 -18% | 28.2 -11% | 29.4 -16% | 31.1 -23% |
| Idle Average * (dB) | 25.3 | 30.5 -21% | 33.6 -33% | 30.1 -19% | 28.2 -11% | 29.5 -17% | 31.2 -23% |
| Idle Maximum * (dB) | 25.4 | 30.5 -20% | 33.6 -32% | 30.2 -19% | 28.2 -11% | 29.7 -17% | 31.3 -23% |
| Load Average * (dB) | 45.1 | 30.5 32% | 36.8 18% | 32.1 29% | 47.8 -6% | 34.6 23% | 51.7 -15% |
| Load Maximum * (dB) | 45.3 | 30.5 33% | 39.8 12% | 32.5 28% | 47.4 -5% | 36.1 20% | 45.8 -1% |
* ... más pequeño es mejor
Temperatura
La carcasa del Maxtang MTN-FP750 sólo se calienta mínimamente cuando funciona en reposo o bajo carga. Observamos un punto de calentamiento en la parte superior de la unidad, que apenas alcanzó los 40 °C, mientras que la parte inferior del dispositivo ni siquiera llegó a los 35 °C. Sin embargo, el SoC se calienta considerablemente aunque, con casi 80 °C, aún estábamos en la zona verde. Además, el fabricante ha fijado una temperatura máxima de 90 °C en la BIOS. Aún así, no fuimos capaces de alcanzarla con el límite de potencia preestablecido de 35 vatios.
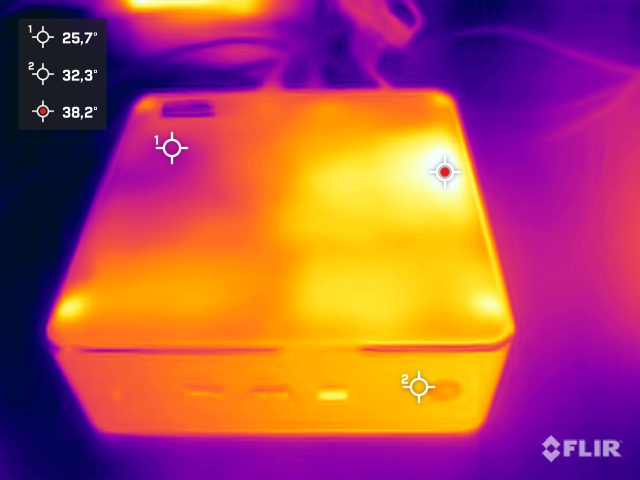
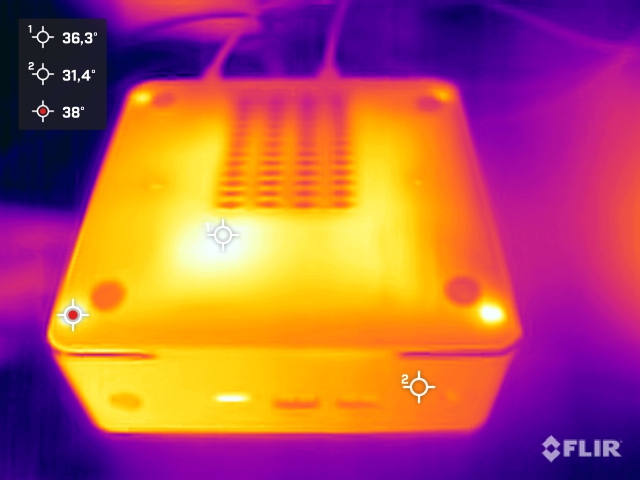
(+) La temperatura máxima en la parte superior es de 39.7 °C / 103 F, frente a la media de 35.4 °C / 96 F, que oscila entre 20.6 y 69.5 °C para la clase Mini PC.
(+) El fondo se calienta hasta un máximo de 34.3 °C / 94 F, frente a la media de 36.1 °C / 97 F
(+) En reposo, la temperatura media de la parte superior es de 29.4 °C / 85# F, frente a la media del dispositivo de 32.1 °C / 90 F.
Consumo de energía
En nuestra comparativa, el Maxtang MTN-FP750 pertenece a los aparatos más económicos. En funcionamiento en reposo, ya registramos un consumo de energía muy bajo, de sólo 7 a 8,4 vatios. Sólo el Geekom A5 y el Geekom Mini IT12 pueden seguirle el ritmo con puntuaciones similarmente bajas. Bajo carga, nuestra muestra de revisión continuó siendo comparativamente económica con nuestro dispositivo de medición registrando un pico de sólo 61,4 vatios. Teniendo en cuenta los restringidos límites de potencia del procesador, no se trata de unos requisitos energéticos especialmente sorprendentes bajo carga.
Esto significa que la fuente de alimentación de 90 vatios nunca tiene problemas para suministrar al mini PC la energía suficiente de forma fiable. La PSU puede incluso manejar sin esfuerzo el ajuste manual del consumo de energía.

| Off / Standby | |
| Ocioso | |
| Carga |
|
Clave:
min: | |
| Maxtang MTN-FP750 R7 7735HS, Radeon 680M | Minisforum Neptune Series NAD9 i9-12900H, Iris Xe G7 96EUs | Geekom AS 6, R9 6900HX R9 6900HX, Radeon 680M | Geekom Mini IT12 i7-1260P, Iris Xe G7 96EUs | Geekom A5 R7 5800H, Vega 8 | Minisforum Venus Series NAB6 i7-12650H, UHD Graphics 64EUs | NiPoGi AD08 i7-12650H, UHD Graphics 64EUs | Medio AMD Radeon 680M | Media de la clase Mini PC | |
|---|---|---|---|---|---|---|---|---|---|
| Power Consumption | -73% | -23% | -2% | -12% | -50% | -107% | -10% | -44% | |
| Idle Minimum * (Watt) | 7 | 12.1 -73% | 6.8 3% | 5 29% | 6.9 1% | 10.4 -49% | 14.2 -103% | 6.93 ? 1% | 8.66 ? -24% |
| Idle Average * (Watt) | 8.1 | 13 -60% | 9.4 -16% | 7 14% | 7.9 2% | 12.3 -52% | 15.1 -86% | 8.98 ? -11% | 10.8 ? -33% |
| Idle Maximum * (Watt) | 8.4 | 18.2 -117% | 13.7 -63% | 10.7 -27% | 8.9 -6% | 12.4 -48% | 28.7 -242% | 10.5 ? -25% | 13.6 ? -62% |
| Load Average * (Watt) | 54.2 | 70.6 -30% | 45.3 16% | 50.3 7% | 60.8 -12% | 72.9 -35% | 76.9 -42% | 53.5 ? 1% | 64.3 ? -19% |
| Load Maximum * (Watt) | 61.4 | 113 -84% | 94.8 -54% | 82 -34% | 89.7 -46% | 101.2 -65% | 100.2 -63% | 70.5 ? -15% | 111.4 ? -81% |
* ... más pequeño es mejor
Power consumption with an external monitor
Pro
Contra
Veredicto - Mejor rendimiento pero sólo tras la optimización
El Maxtang MTN-FP750 es un mini PC relativamente sencillo para uso ofimático en casa o en el lugar de trabajo. El AMD Ryzen 7 7735HS ofrece potencia suficiente para poder manejar la mayoría de las tareas. Sus 8 núcleos y 16 hilos hacen que el mini PC sea adecuado para aplicaciones que requieran un gran rendimiento. La RAM instalada es de 16 GB, lo que no plantea ningún problema por ahora. Sin embargo, a la hora de la verdad, el uso de un único módulo RAM ha dado sus frutos, a pesar de que el Maxtang MTN-FP750 permite la instalación de módulos SO-DIMM. Esto significó que, en las pruebas, el Maxtang MTN-FP750 no ofreció el tipo de rendimiento que habríamos esperado. Las diferencias de rendimiento más notables se encuentran en los benchmarks 3D. Este problema puede evitarse instalando un módulo de RAM adicional y, sin duda, es algo a lo que los clientes deberían prestar atención.
Según la hoja de datos, el Maxtang MTN-FP750 ofrece un rendimiento excelente. Sin embargo, en las pruebas, el mini PC no alcanzó la potencia prometida.
La mayor ventaja del Maxtang MTN-FP750 es su bajo precio en comparación con la competencia presentada en nuestra comparativa. El rendimiento es ligeramente peor a menos que se tome el asunto en sus propias manos y no se puedan ajustar los límites de potencia del SoC. En nuestra opinión, el límite de potencia definido de 35 vatios es un poco demasiado conservador. Con 45 vatios, el fabricante podría haber alcanzado un buen compromiso. Lo mismo ocurre con la memoria RAM, que puede ampliarse con un segundo módulo. Si tiene en cuenta estos dos puntos, desde el punto de vista del rendimiento, se trata de un Maxtang MTN-FP750 completamente diferente del que probamos.
La selección de puertos puede calificarse de sólida. Todos los importantes están a bordo - pero eso es todo. Thunderbolt o USB4 están ausentes lo que limita ligeramente el número de casos de uso. Un efecto secundario positivo de tener una CPU con limitaciones de rendimiento son los requisitos energéticos del Maxtang MTN-FP750. En las pruebas, este dispositivo resultó significativamente más económico que sus competidores. Por desgracia, esto no influyó positivamente en el ruido comparativamente alto del ventilador. Un concepto de refrigeración ligeramente mejor habría dado como resultado mejores puntuaciones en este ámbito.
Precio y disponibilidad
En nuestra configuración de revisión, el Maxtang MTN-FP750 puede adquirirse por $440 dólares estadounidenses directamente del fabricante.
Maxtang MTN-FP750
- 02/27/2024 v7 (old)
Sebastian Bade
Transparencia
Nuestro equipo editorial se encarga de seleccionar los dispositivos que se someten a revisión. La muestra de prueba fue entregada al autor por el fabricante de forma gratuita para los fines de la revisión. No hubo influencia de terceros en esta revisión, ni el fabricante recibió una copia de esta revisión antes de su publicación. No había ninguna obligación de publicar esta reseña. Como empresa de medios independiente, Notebookcheck no está sujeta a la autoridad de fabricantes, minoristas o editores.
Así es como prueba Notebookcheck
Cada año, Notebookcheck revisa de forma independiente cientos de portátiles y smartphones utilizando procedimientos estandarizados para asegurar que todos los resultados son comparables. Hemos desarrollado continuamente nuestros métodos de prueba durante unos 20 años y hemos establecido los estándares de la industria en el proceso. En nuestros laboratorios de pruebas, técnicos y editores experimentados utilizan equipos de medición de alta calidad. Estas pruebas implican un proceso de validación en varias fases. Nuestro complejo sistema de clasificación se basa en cientos de mediciones y puntos de referencia bien fundamentados, lo que mantiene la objetividad.
