Análisis del portátil Lenovo ThinkPad X13 G3 AMD: El ya muy buen ThinkPad aún mejor con Ryzen 6000
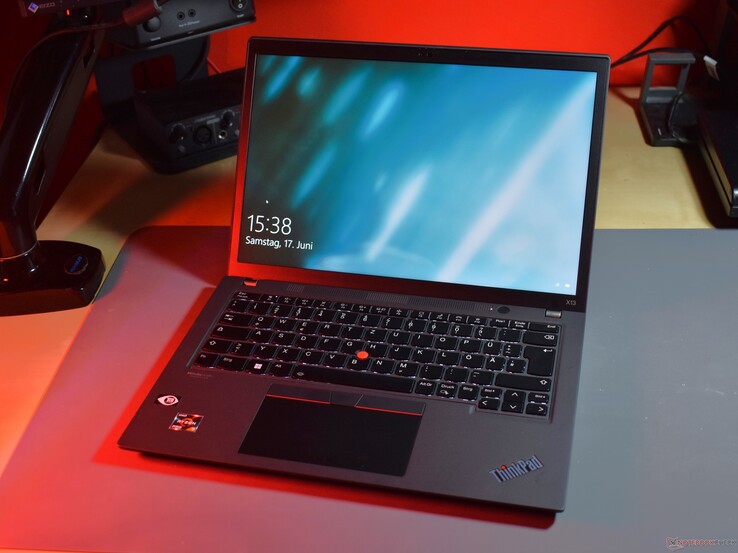
Un análisis de un ThinkPad de 2022 en 2023: parece una contradicción, pero puede tener sentido. El dispositivo de análisis de hoy, el Lenovo ThinkPad X13 Gen 3 AMD puede ser "tecnología de ayer", pero eso no significa que sea malo. El sucesor de este portátil compacto para empresas, el Lenovo ThinkPad X13 Gen 4aún no está disponible en su versión AMD. Razón suficiente para echarle un último vistazo a la variante más antigua - tal vez valga la pena comprarlo en una próxima venta con descuento.
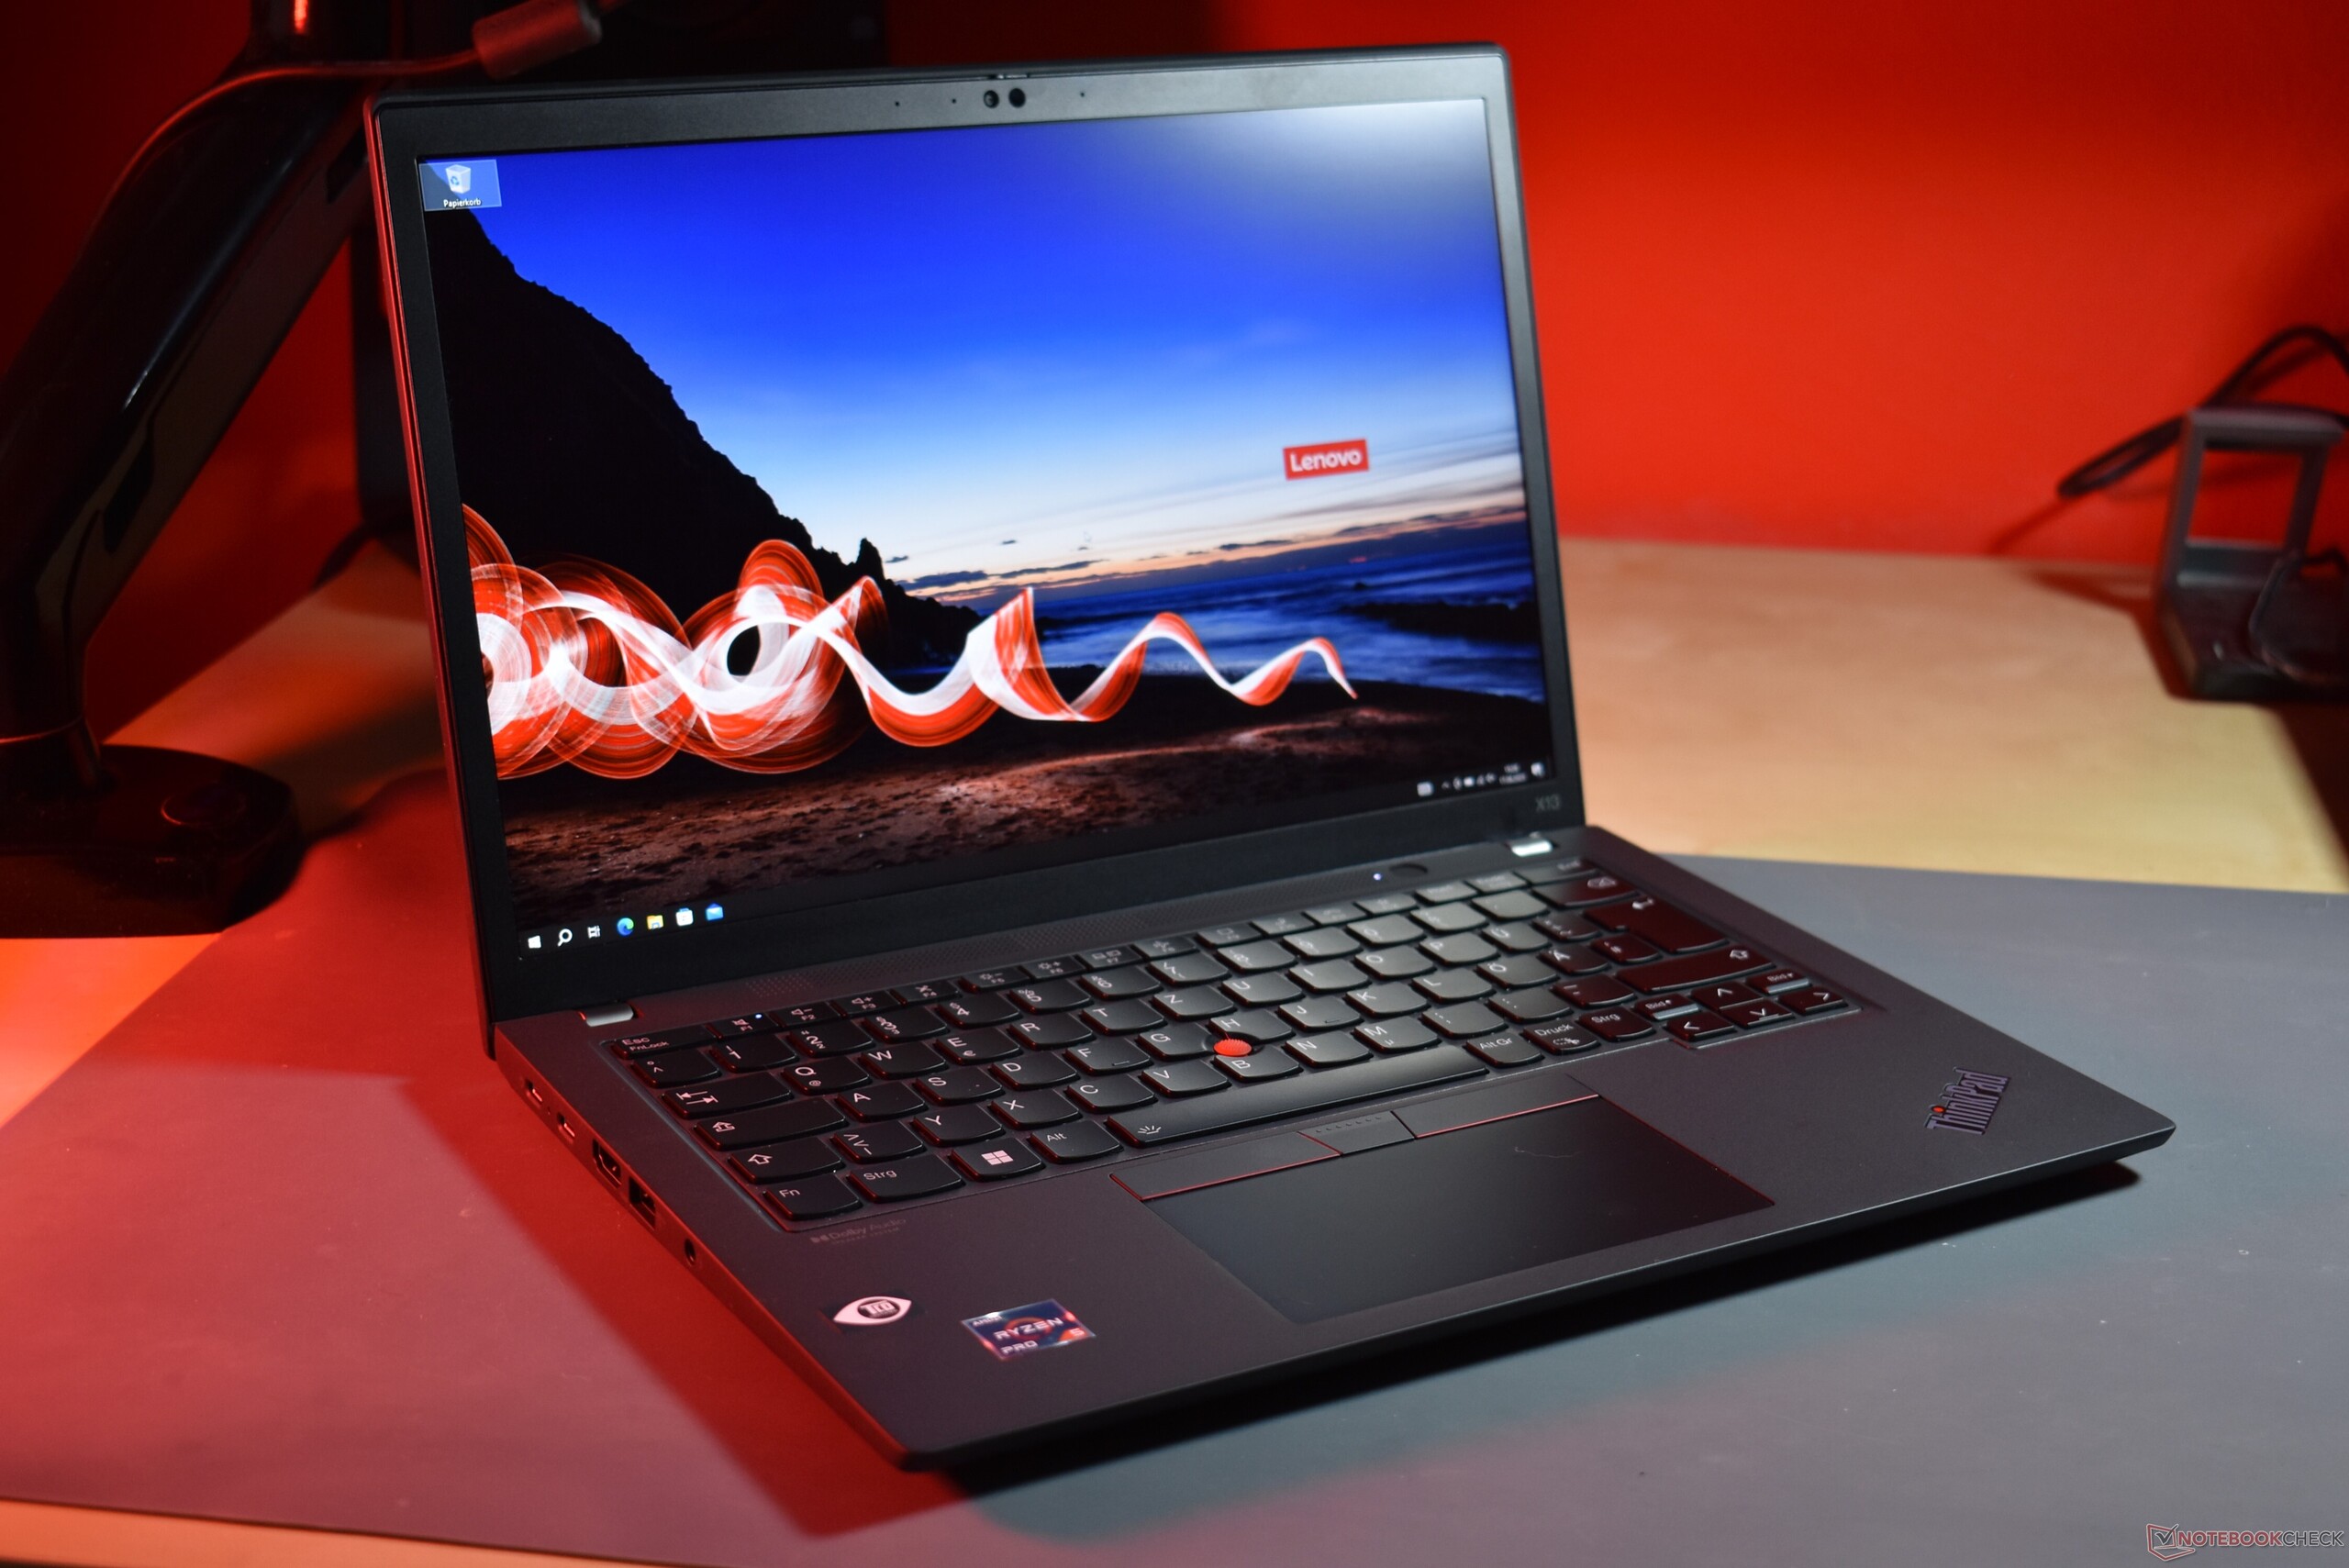
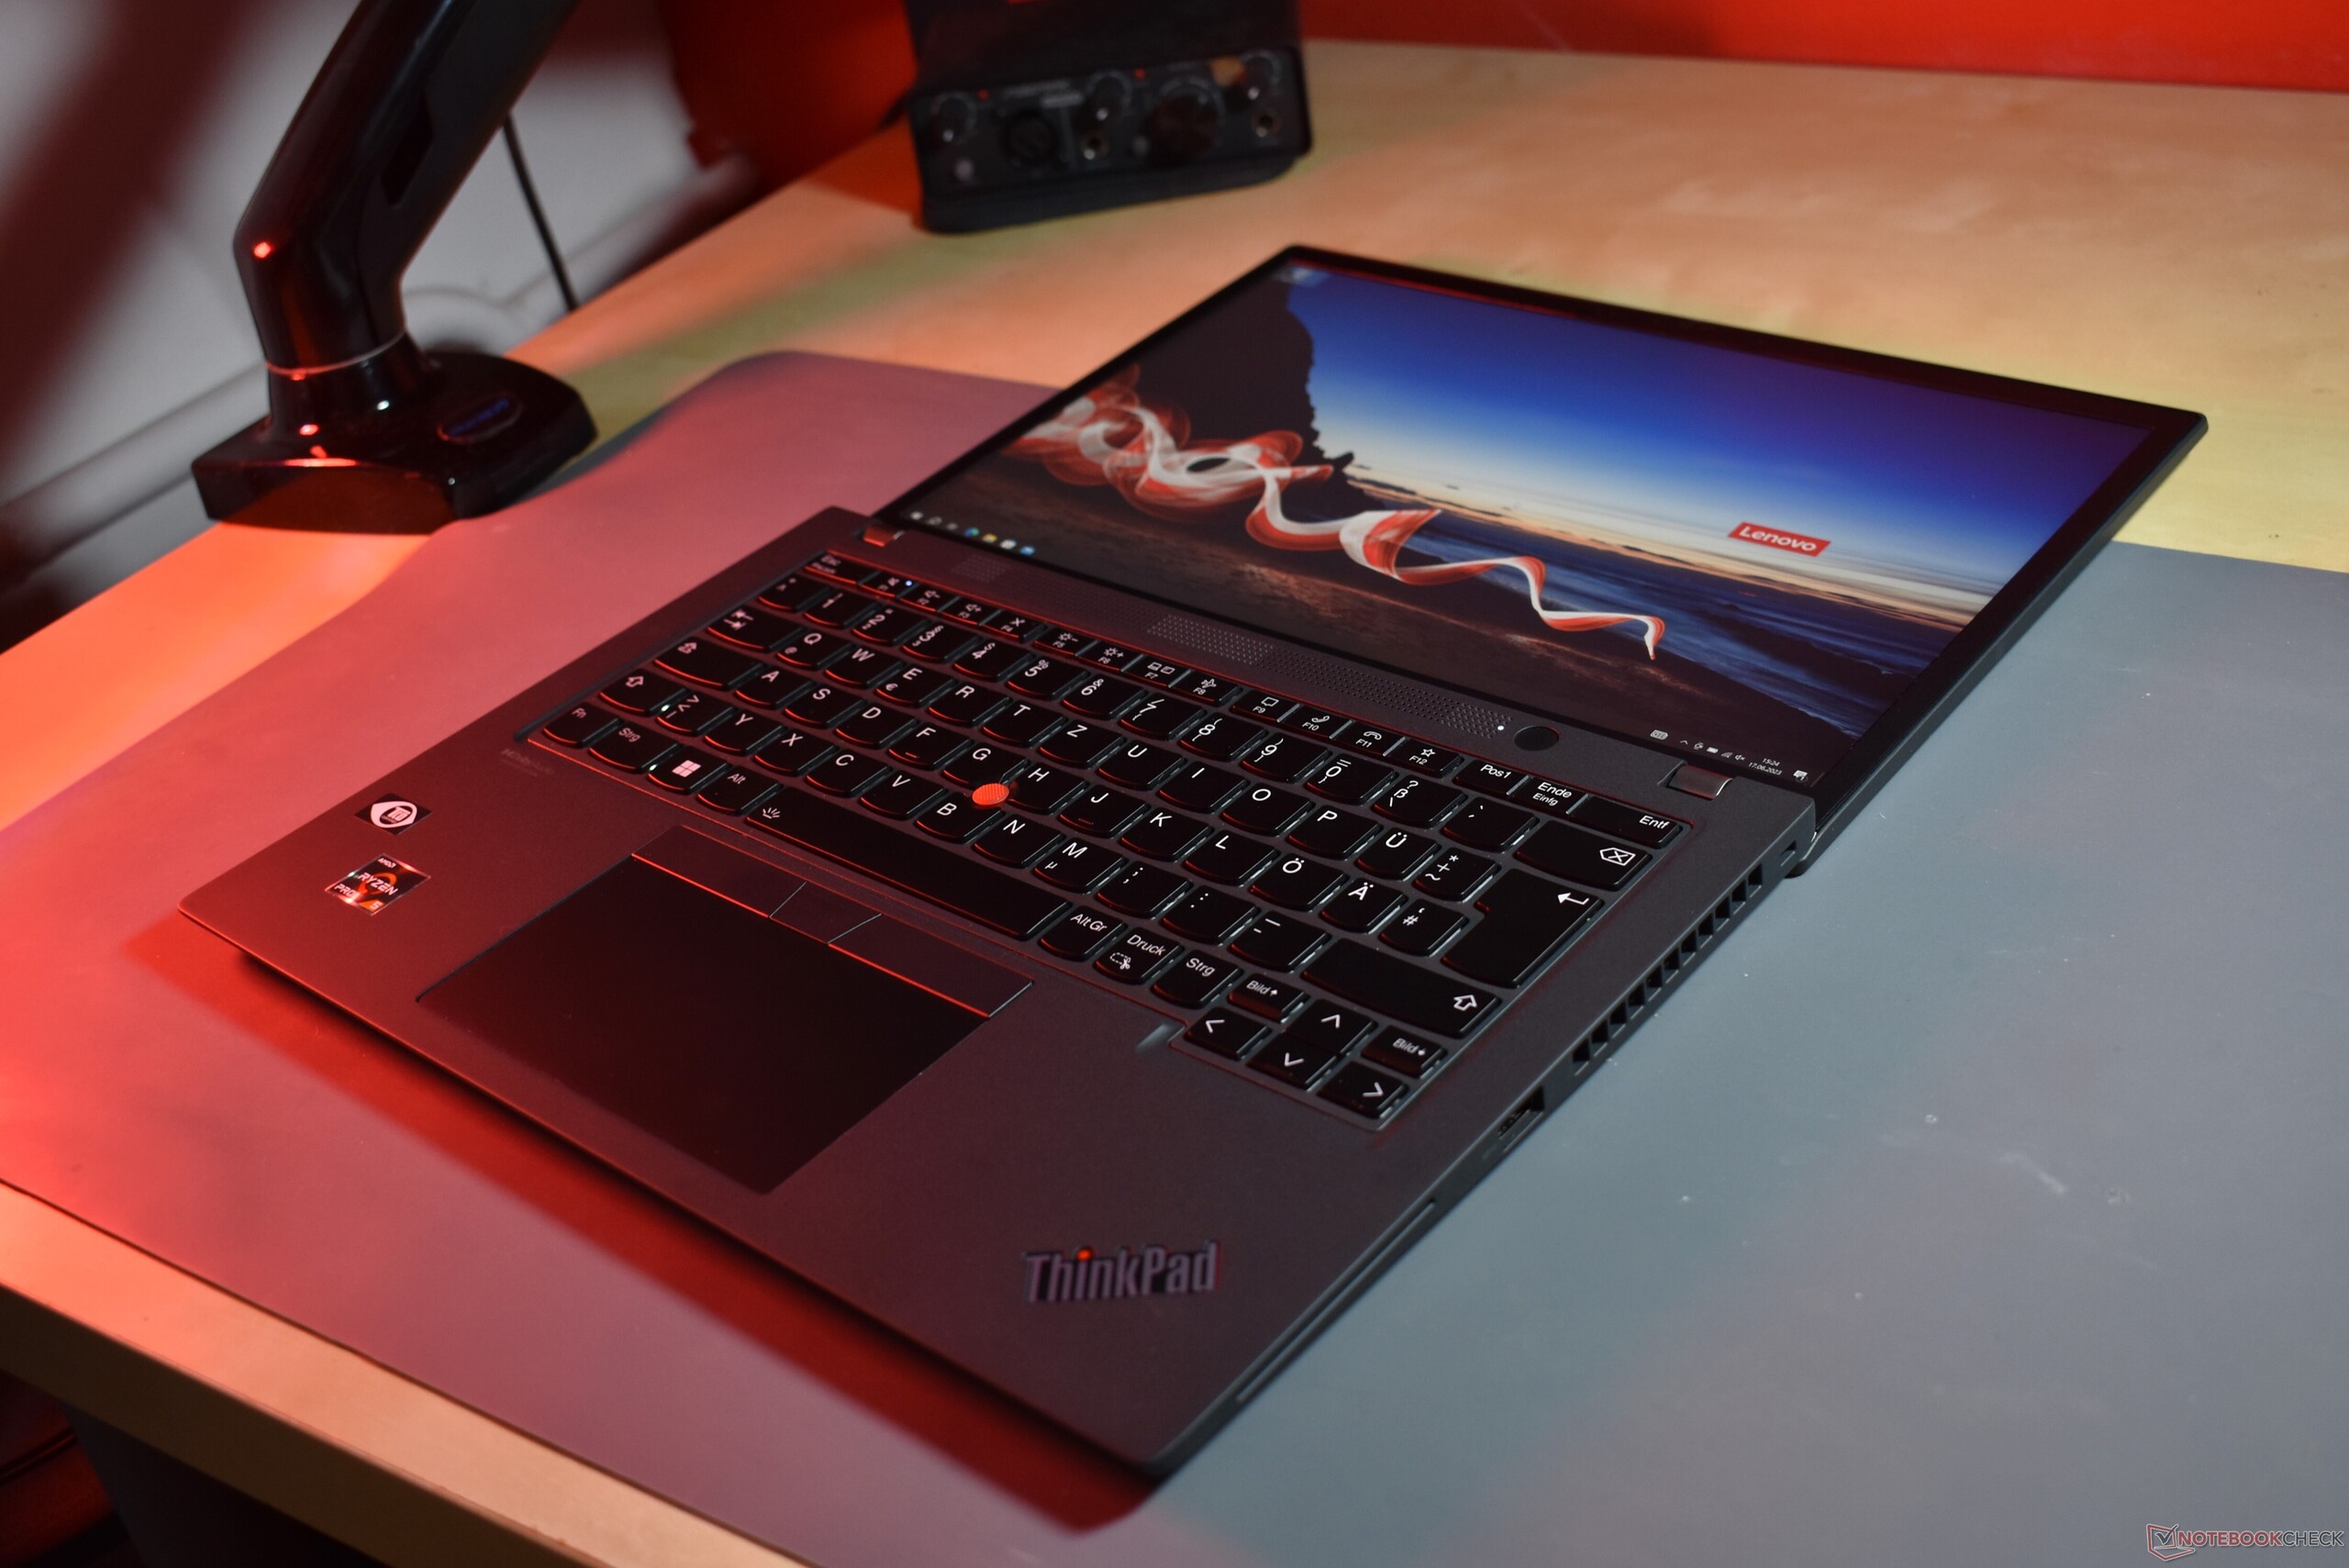
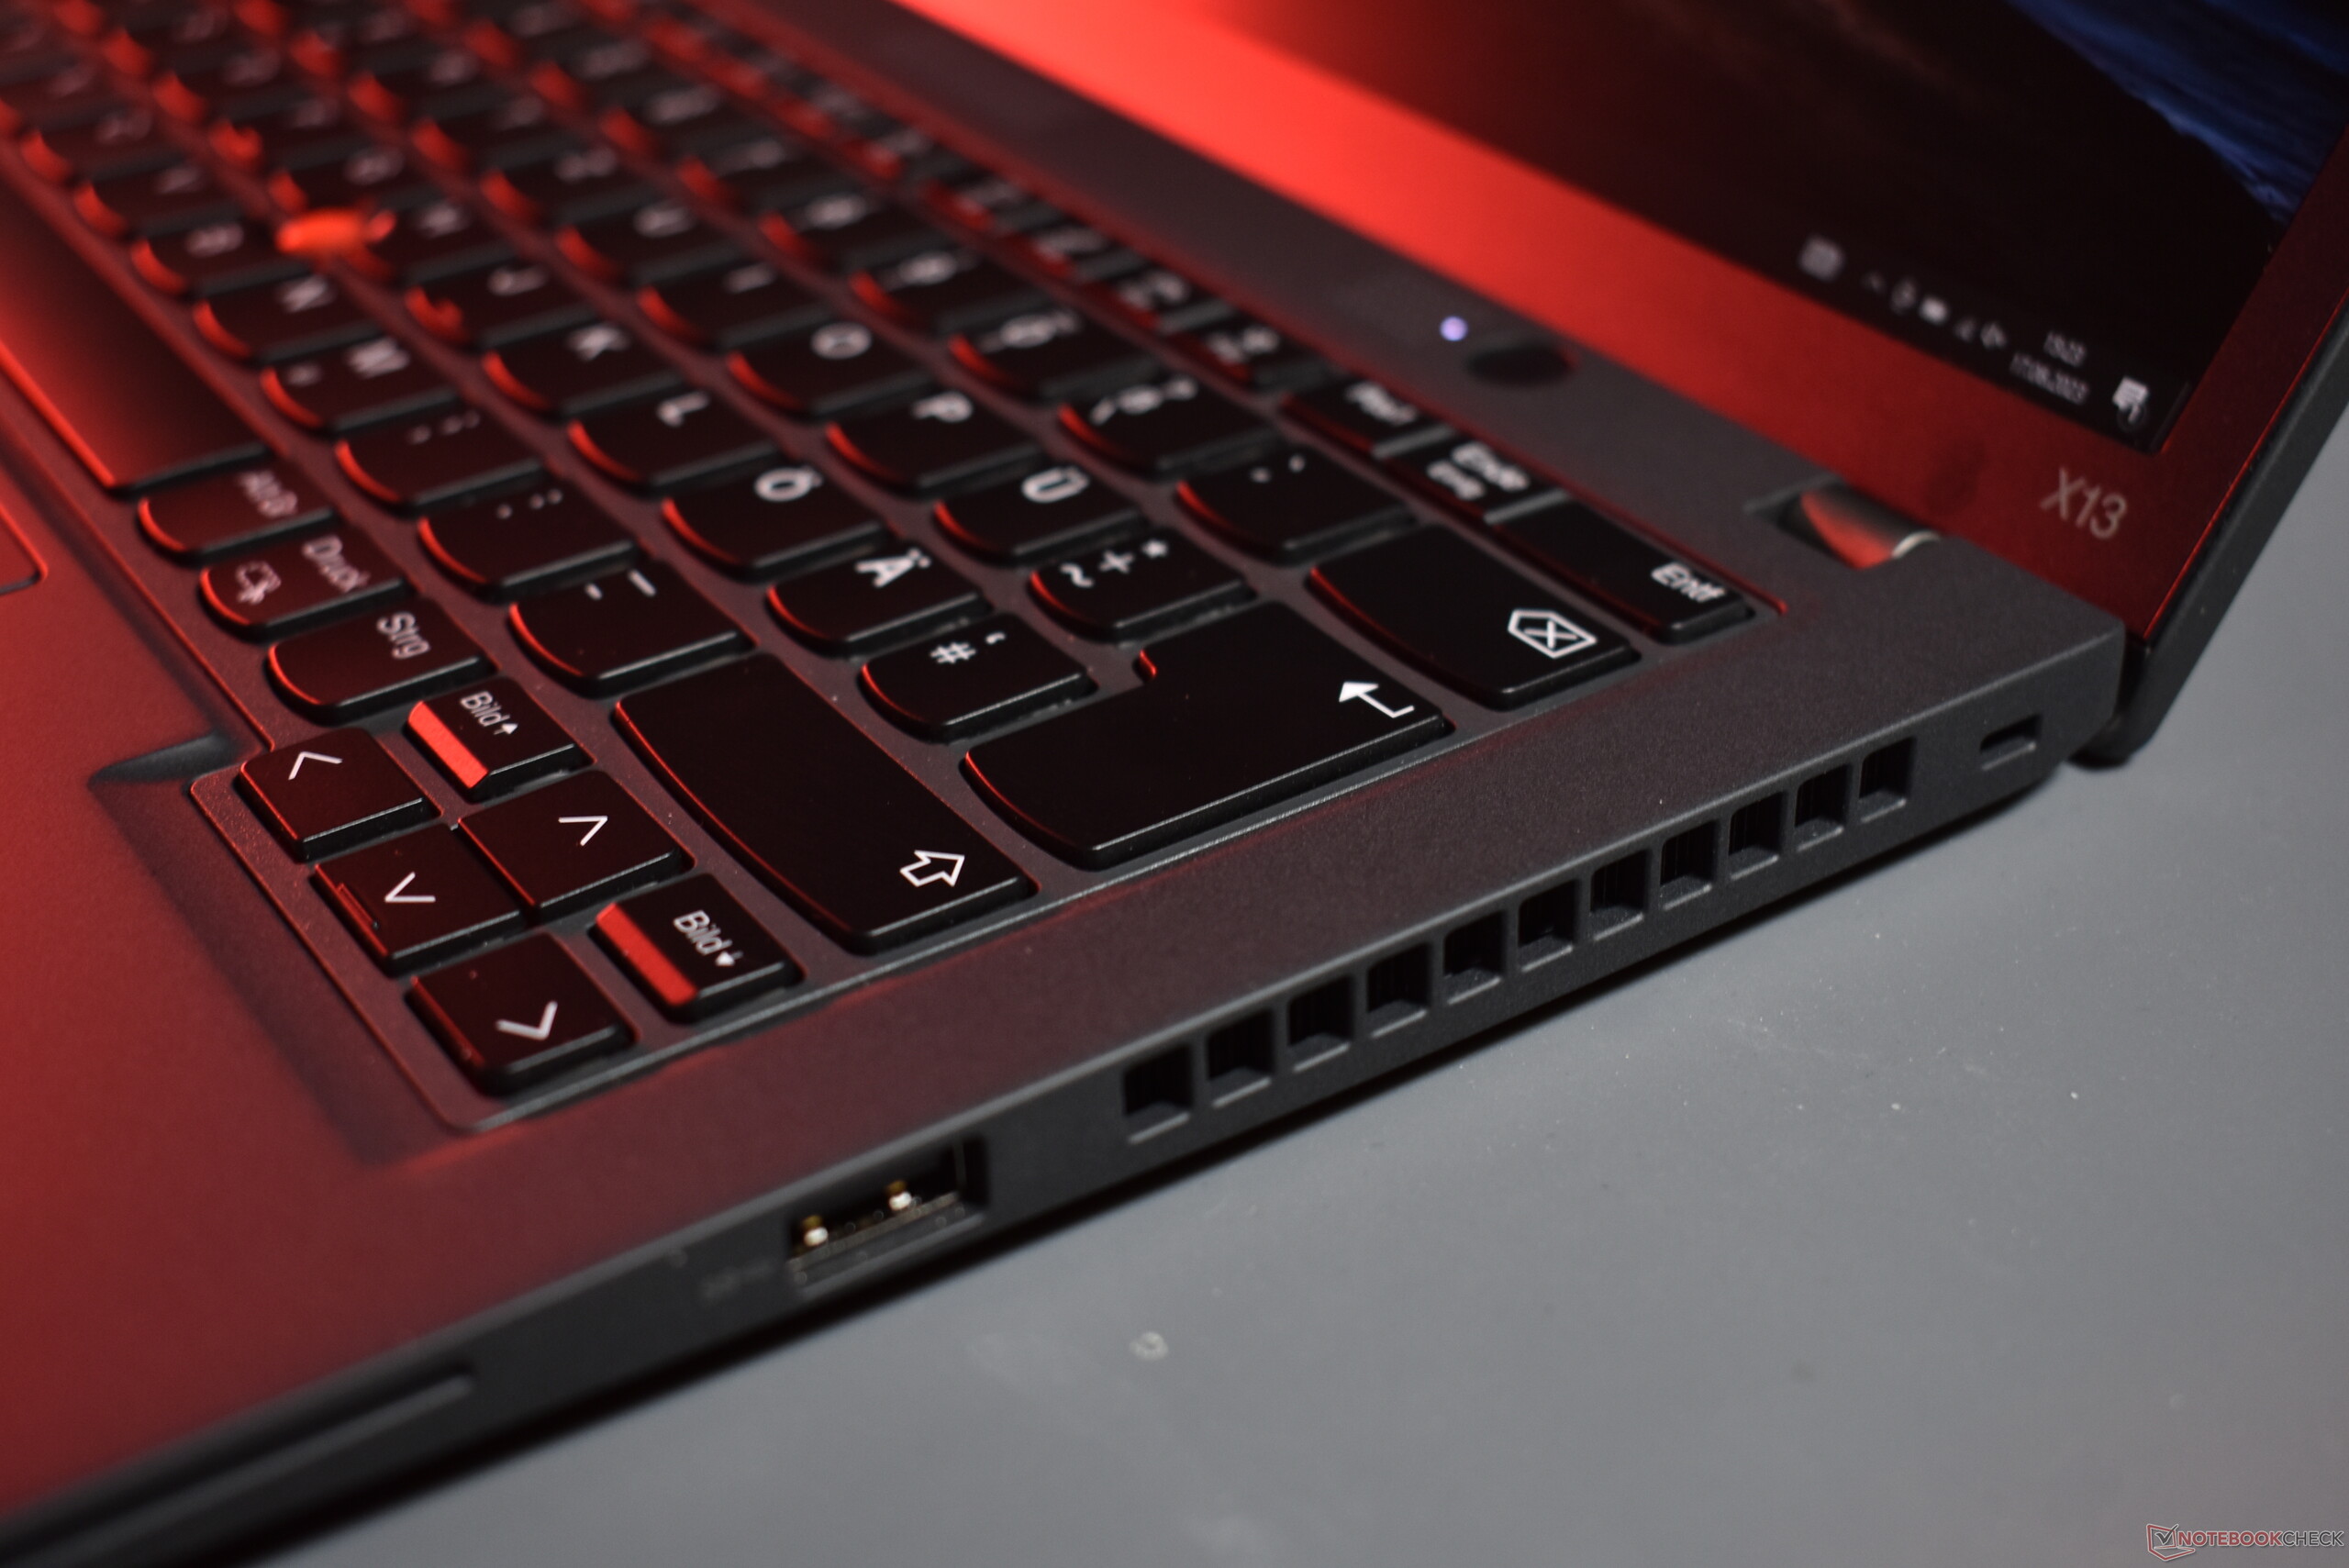
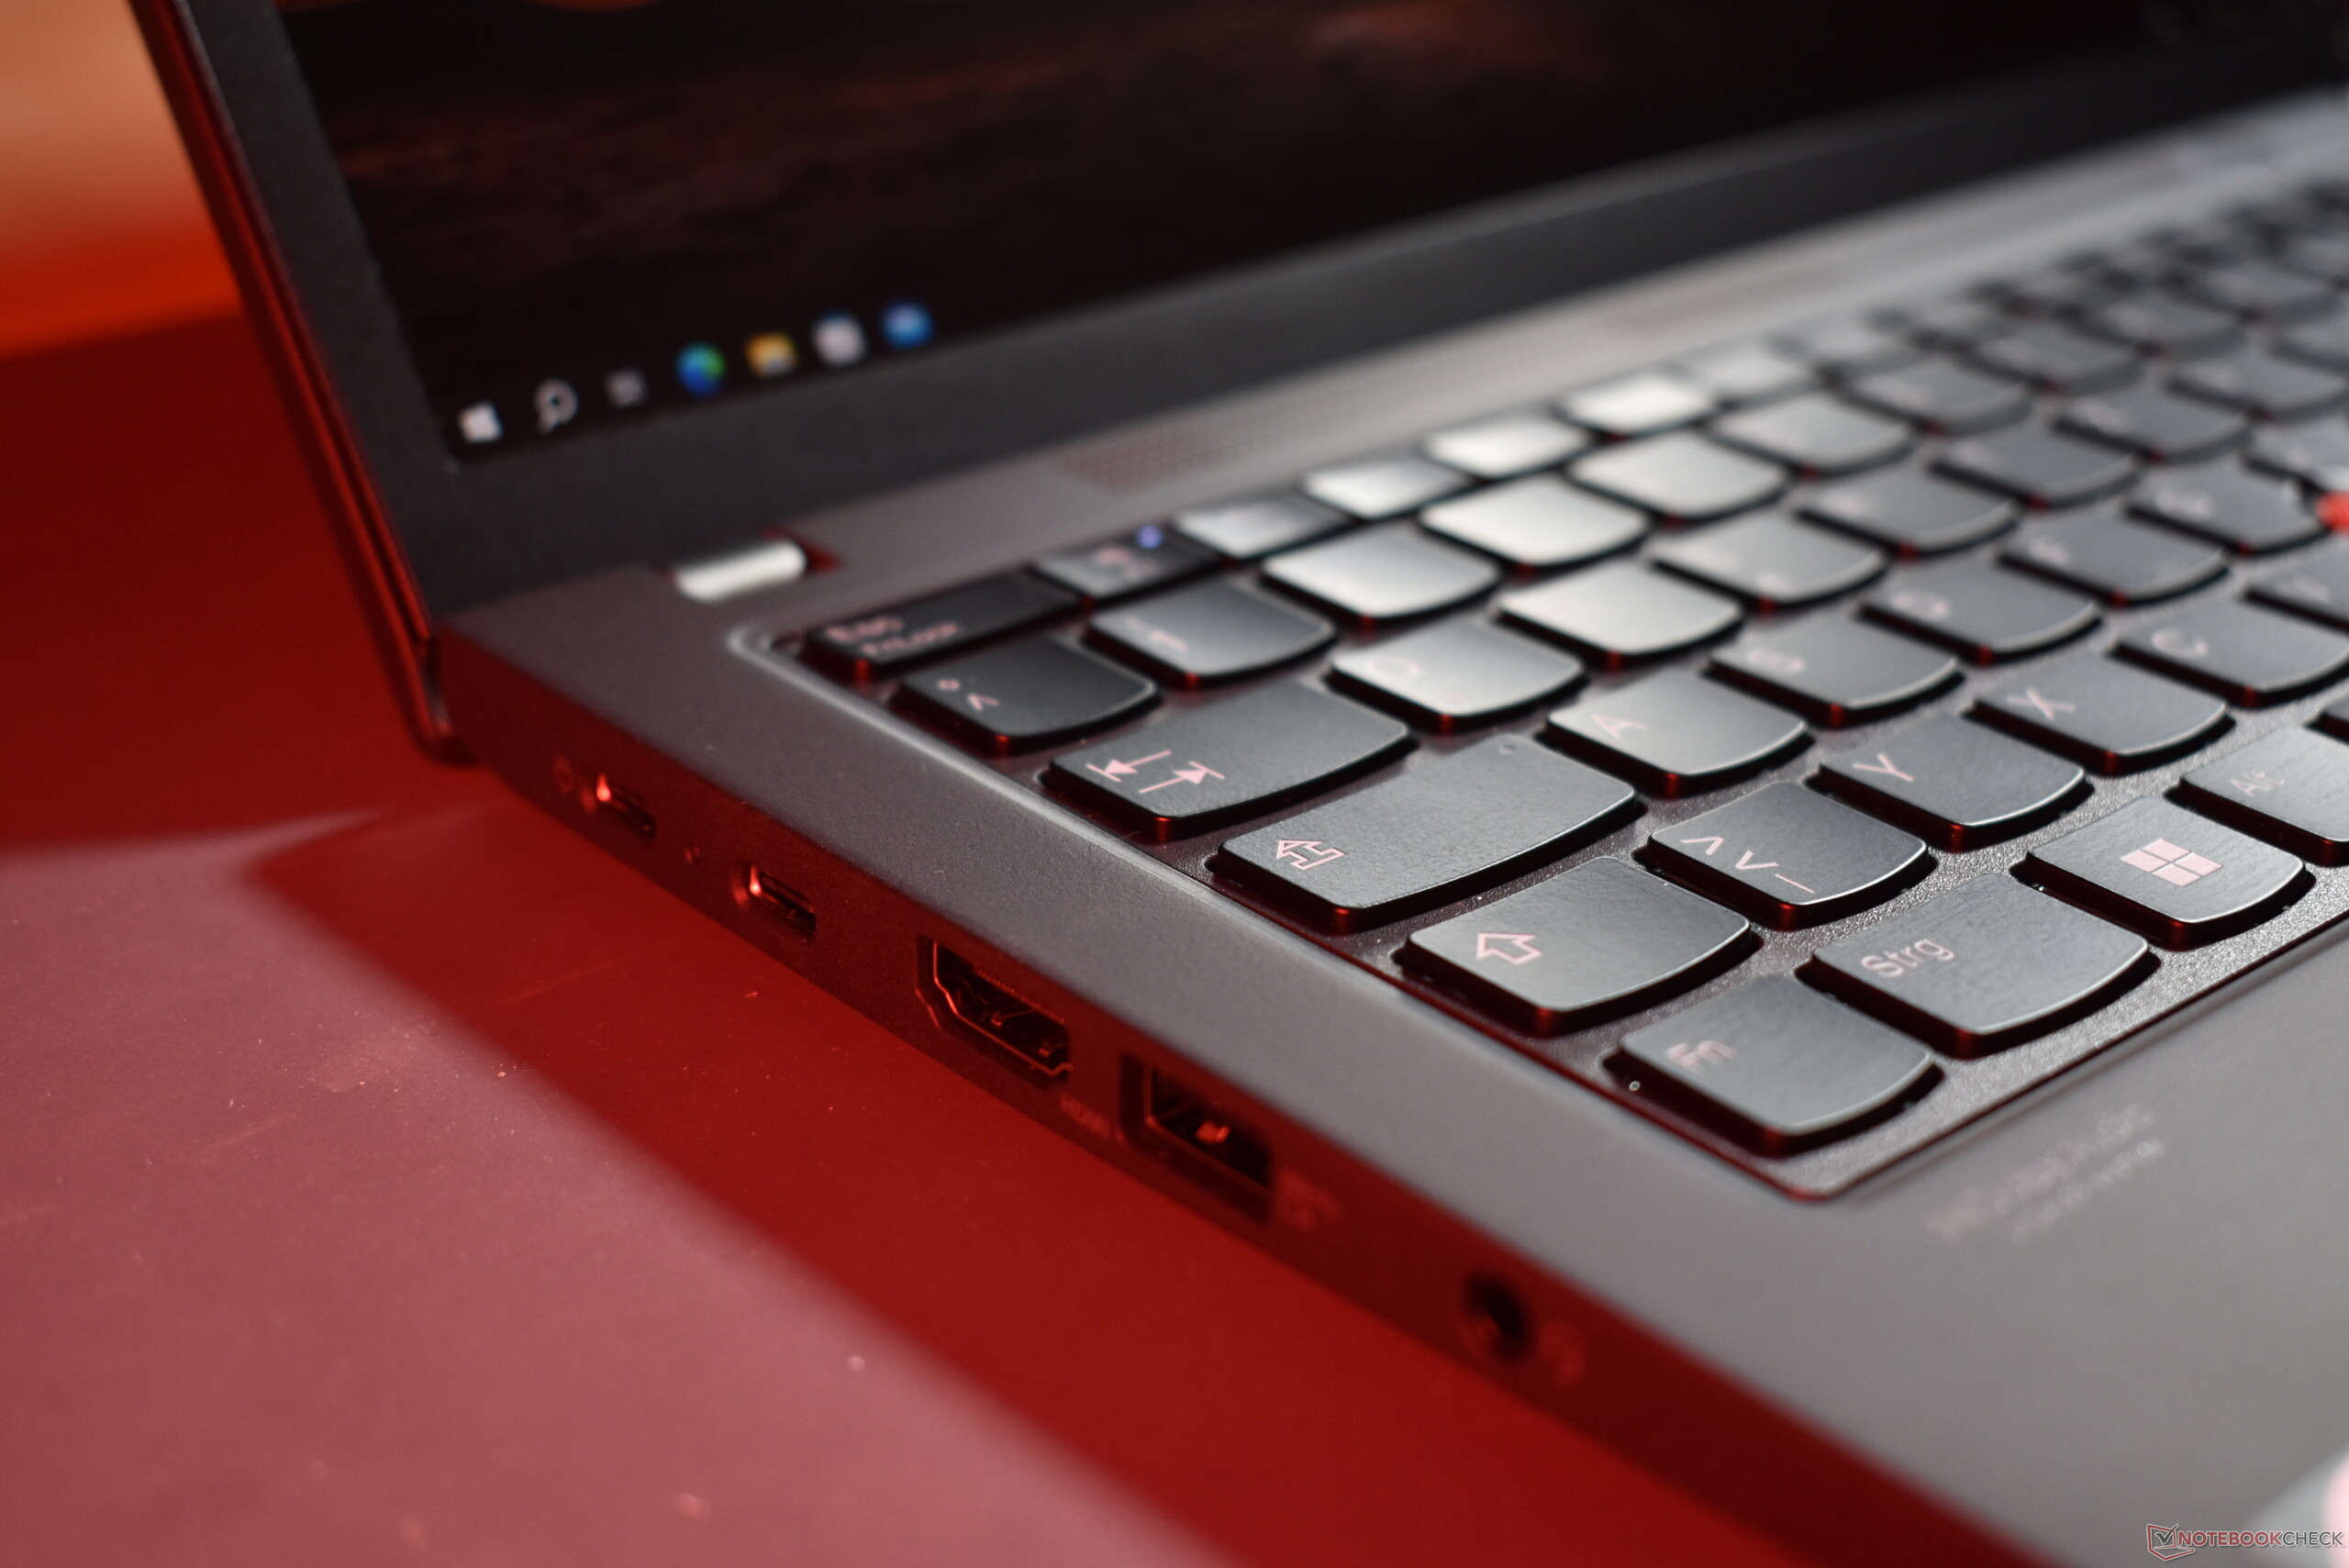
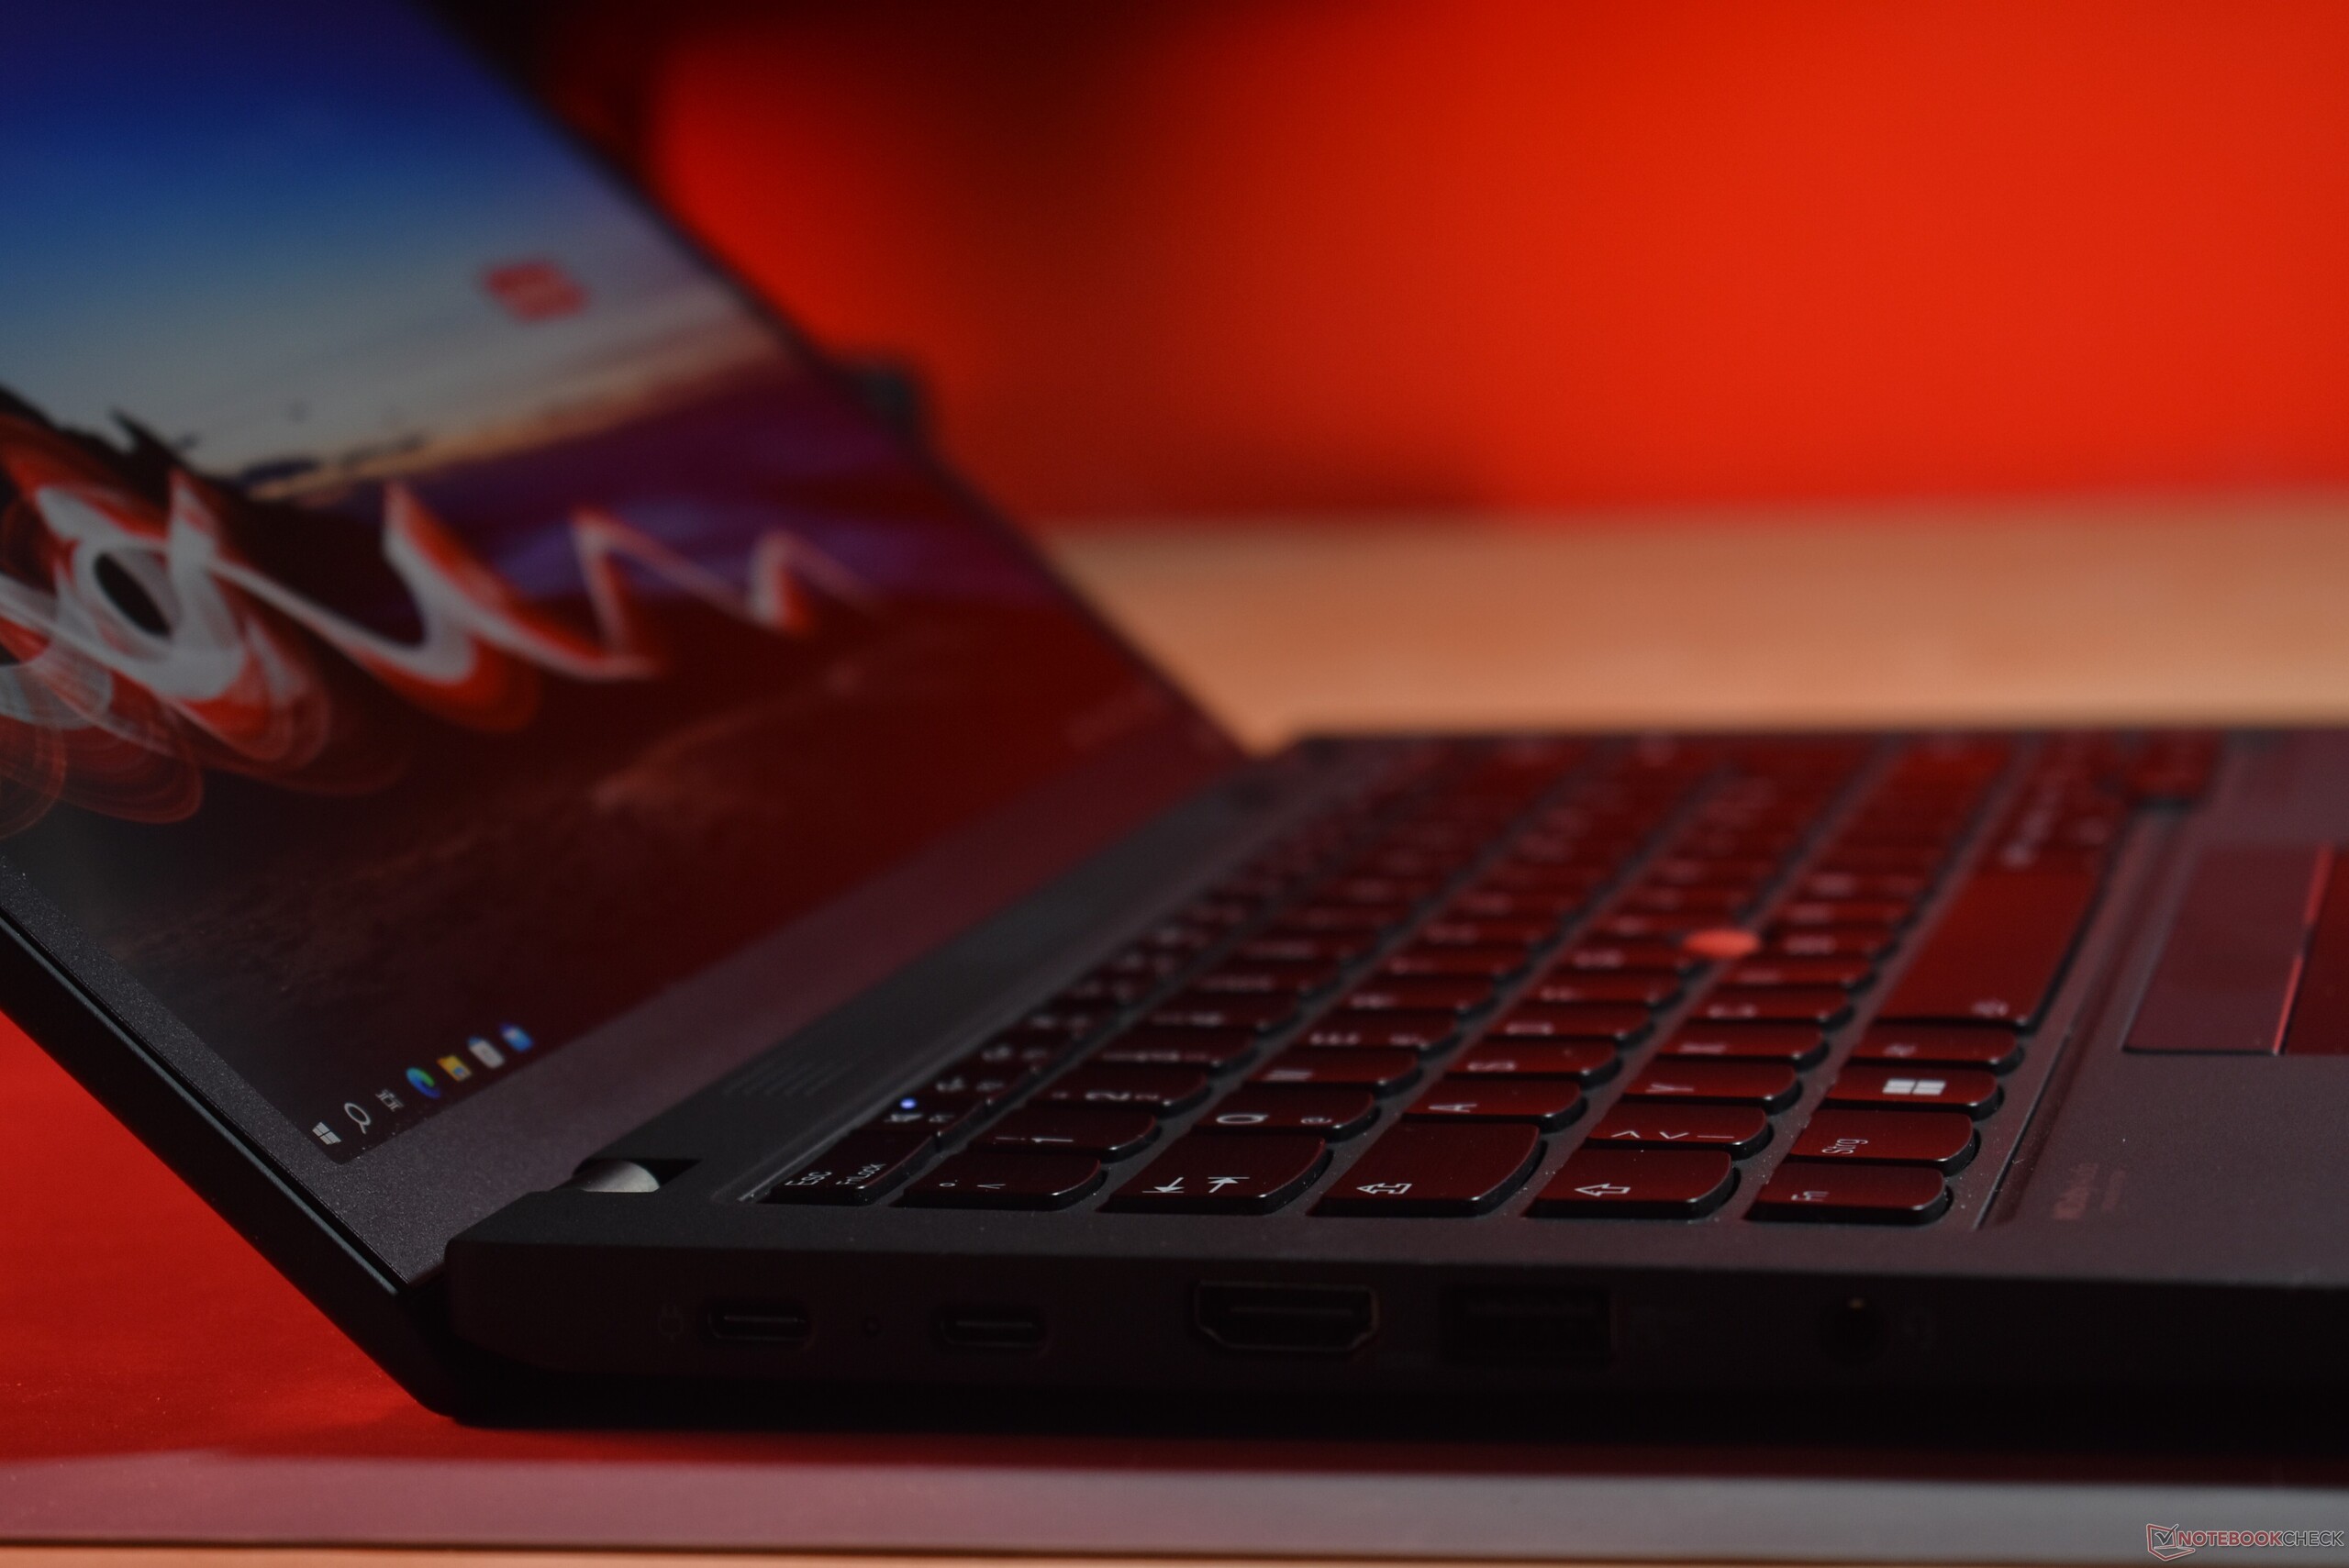
Dado que se trata de una actualización de un diseño ya existente, no perderemos el tiempo en otra descripción del diseño, los dispositivos de entrada y la conectividad. Puede encontrar información detallada sobre estos temas en el análisis del ThinkPad X13 Gen 2.
Posibles contendientes en la comparación
Valoración | Fecha | Modelo | Peso | Altura | Tamaño | Resolución | Precio |
|---|---|---|---|---|---|---|---|
| 90.6 % v7 (old) | 06/2023 | Lenovo ThinkPad X13 G3 21CM002UGE R5 PRO 6650U, Radeon 660M | 1.3 kg | 18.1 mm | 13.30" | 1920x1200 | |
| 90.6 % v7 (old) | 11/2021 | Lenovo ThinkPad X13 G2 AMD 20XH001KGE R5 PRO 5650U, Vega 7 | 1.4 kg | 18.19 mm | 13.30" | 1920x1200 | |
| 89.2 % v7 (old) | 01/2023 | HP EliteBook 835 G9 R7 PRO 6850U, Radeon 680M | 1.3 kg | 19.2 mm | 13.30" | 1920x1200 | |
| 89 % v7 (old) | 07/2022 | Dell Latitude 13 7330 i7-1265U, Iris Xe G7 96EUs | 1 kg | 16.96 mm | 13.30" | 1920x1080 | |
| 89.4 % v7 (old) | 11/2022 | Lenovo ThinkPad X13 G3 21BN0046GE i5-1235U, Iris Xe G7 80EUs | 1.3 kg | 18.9 mm | 13.30" | 1920x1200 |
Comparación de tamaño y peso
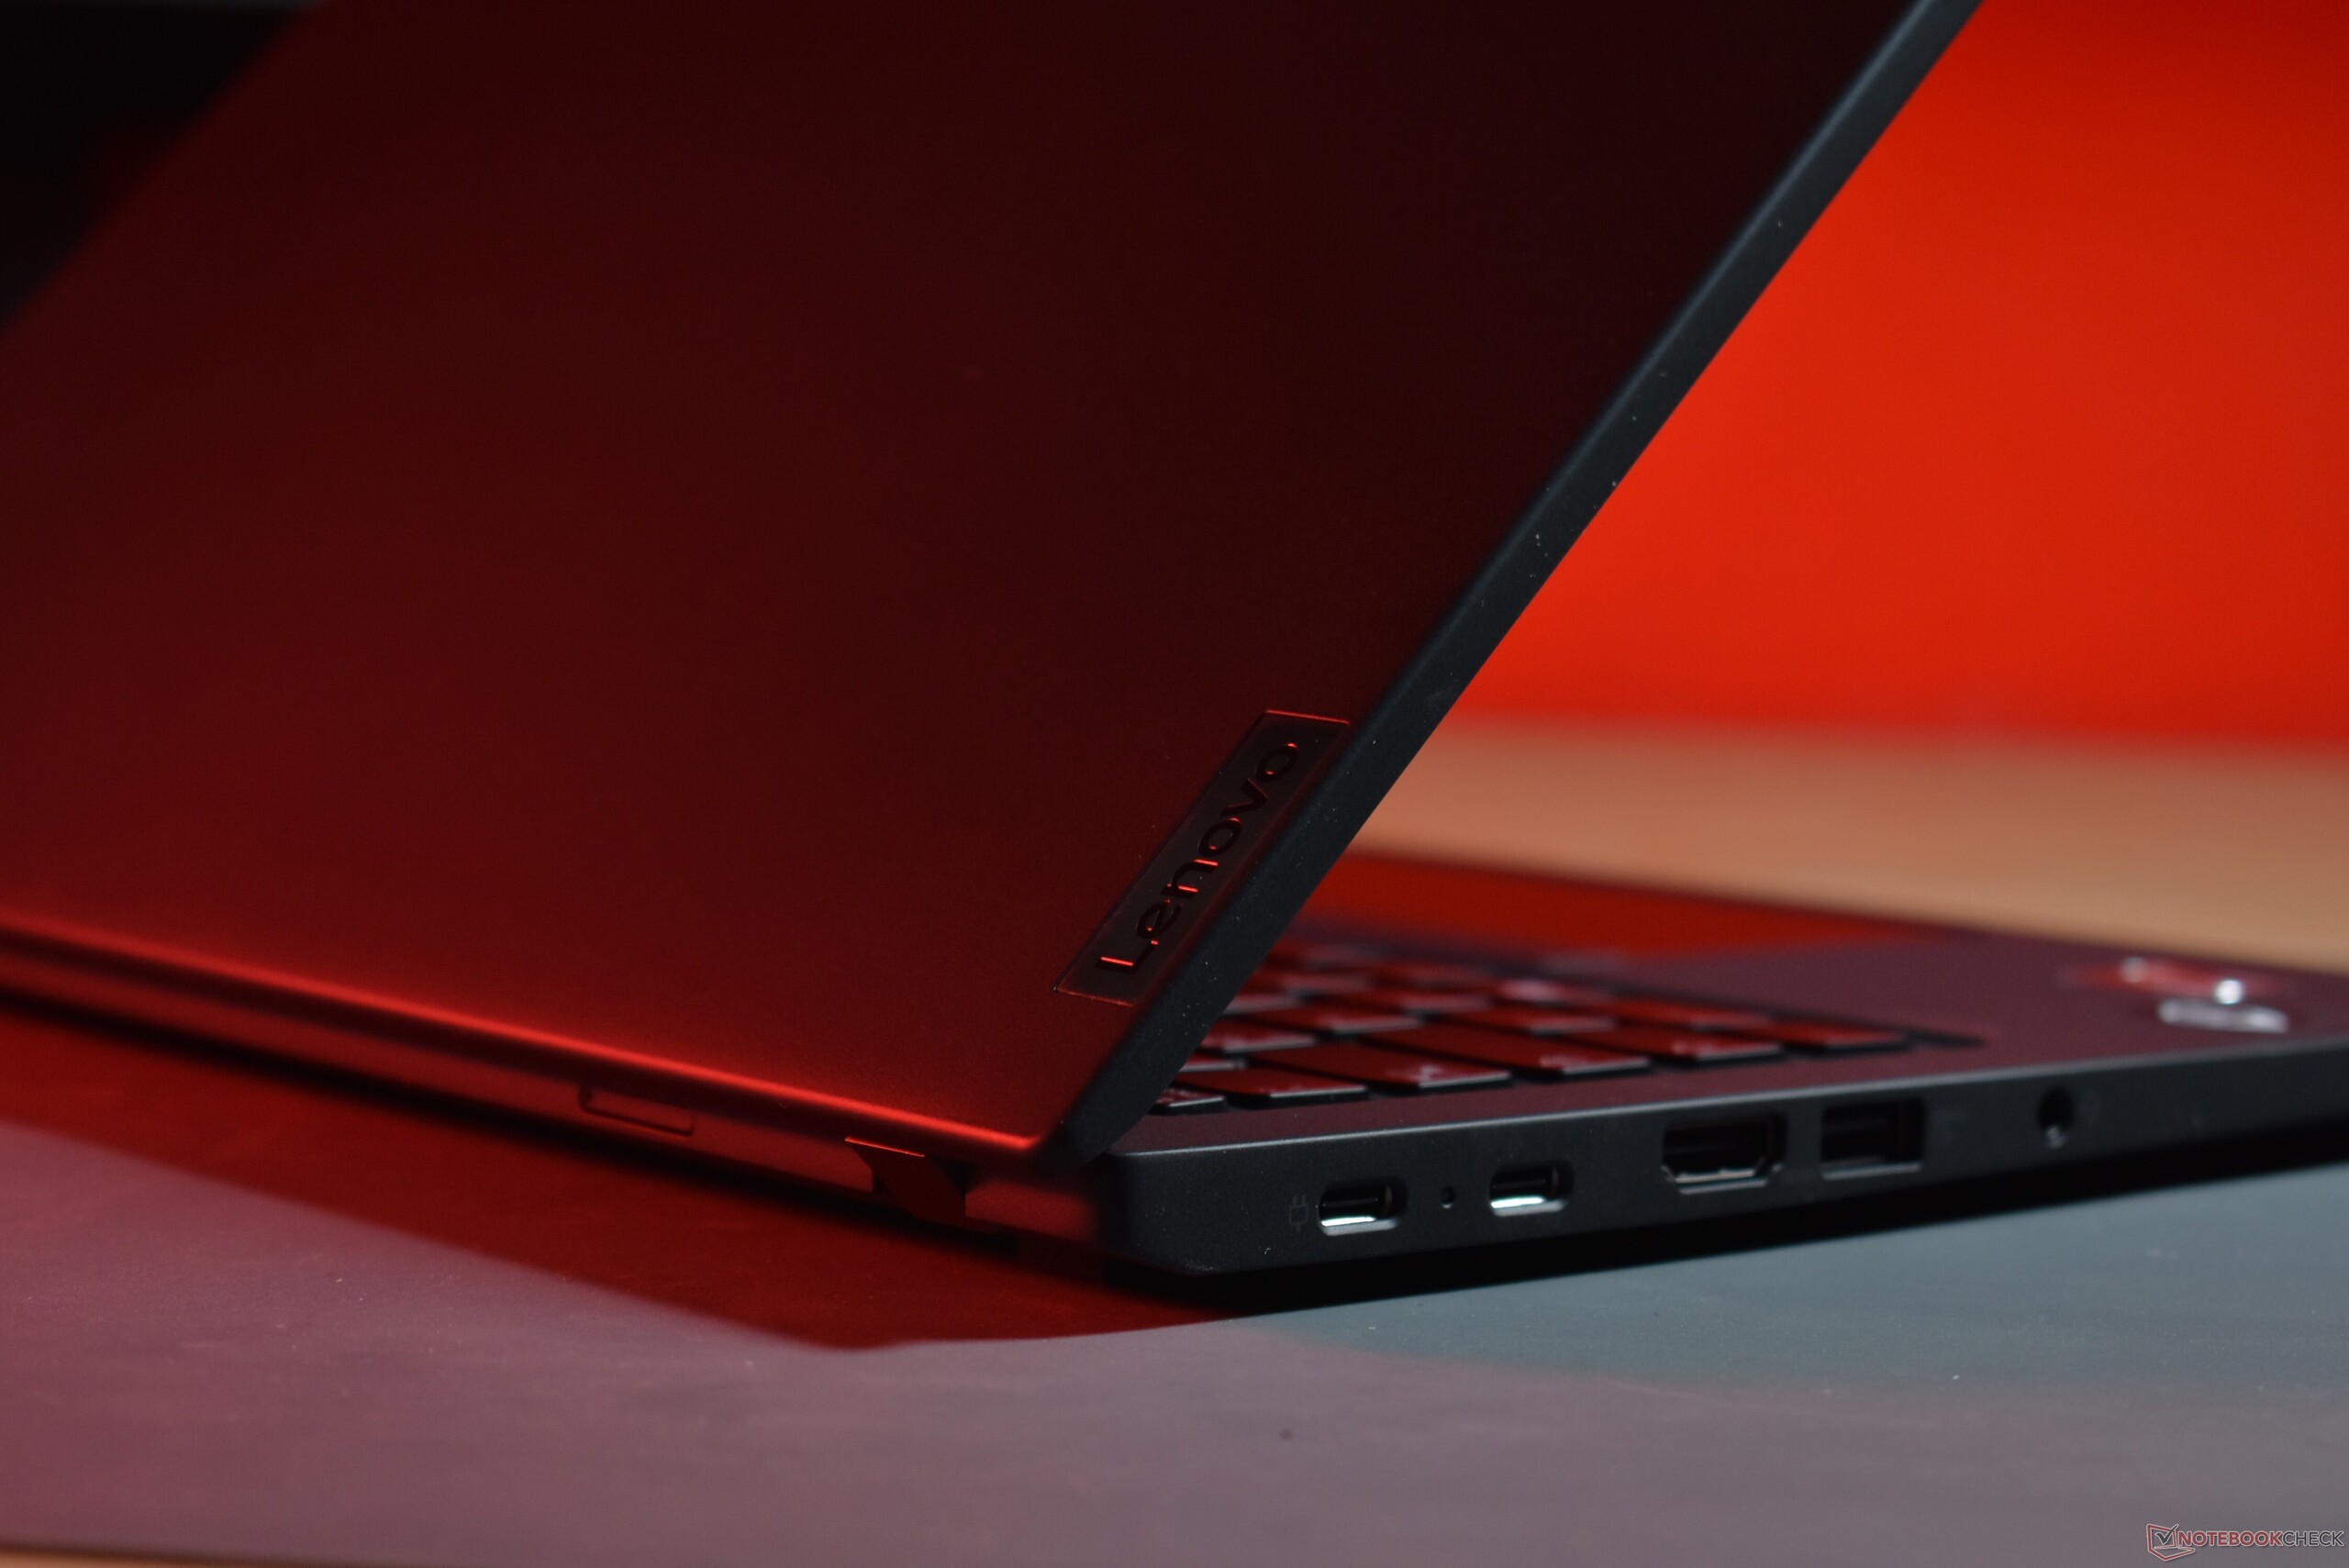
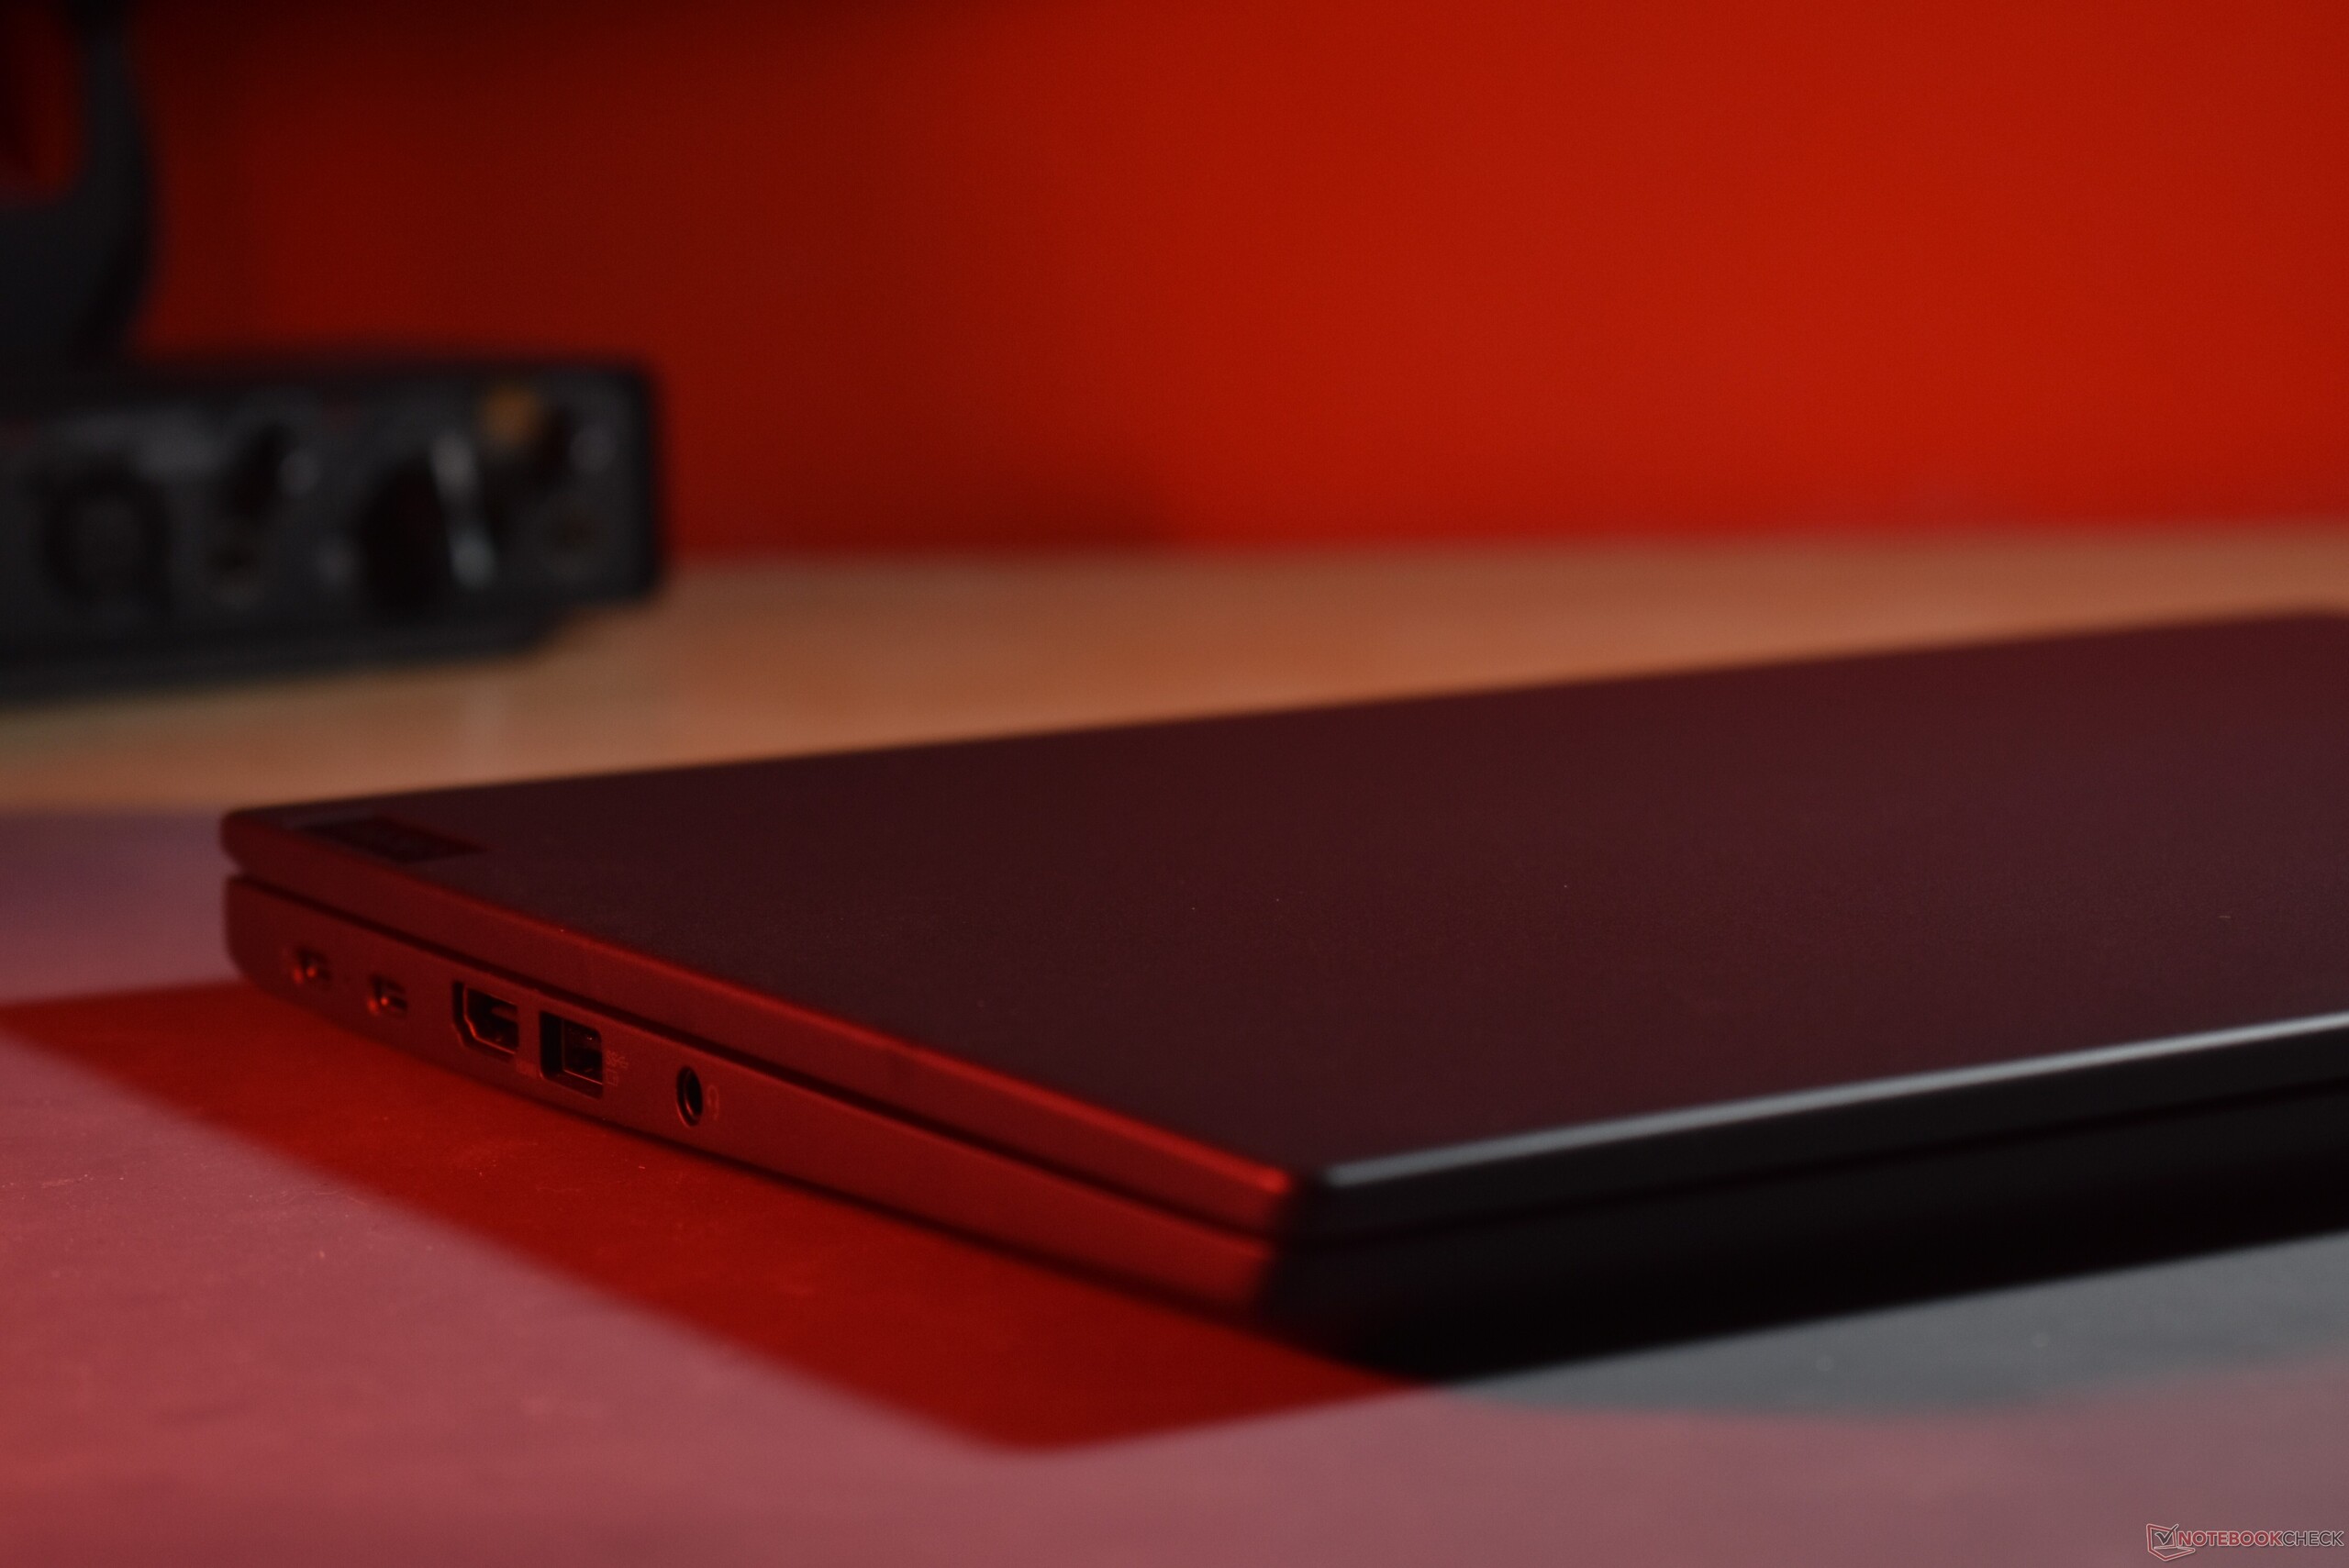
Conectividad
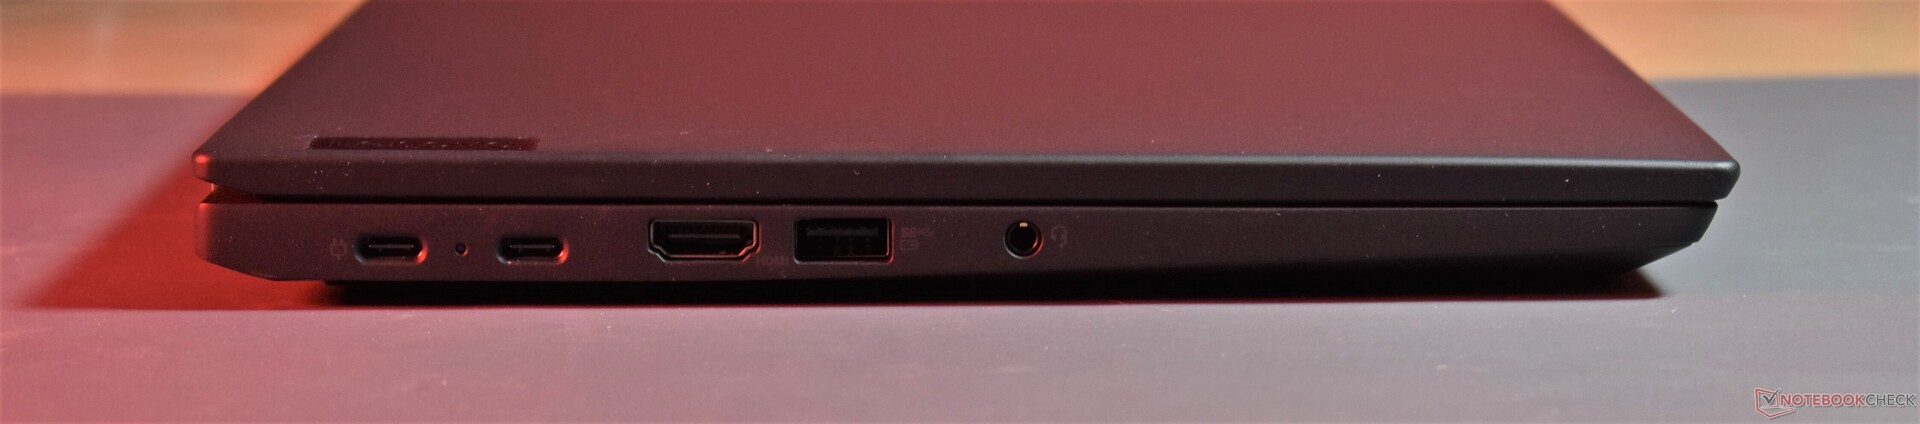
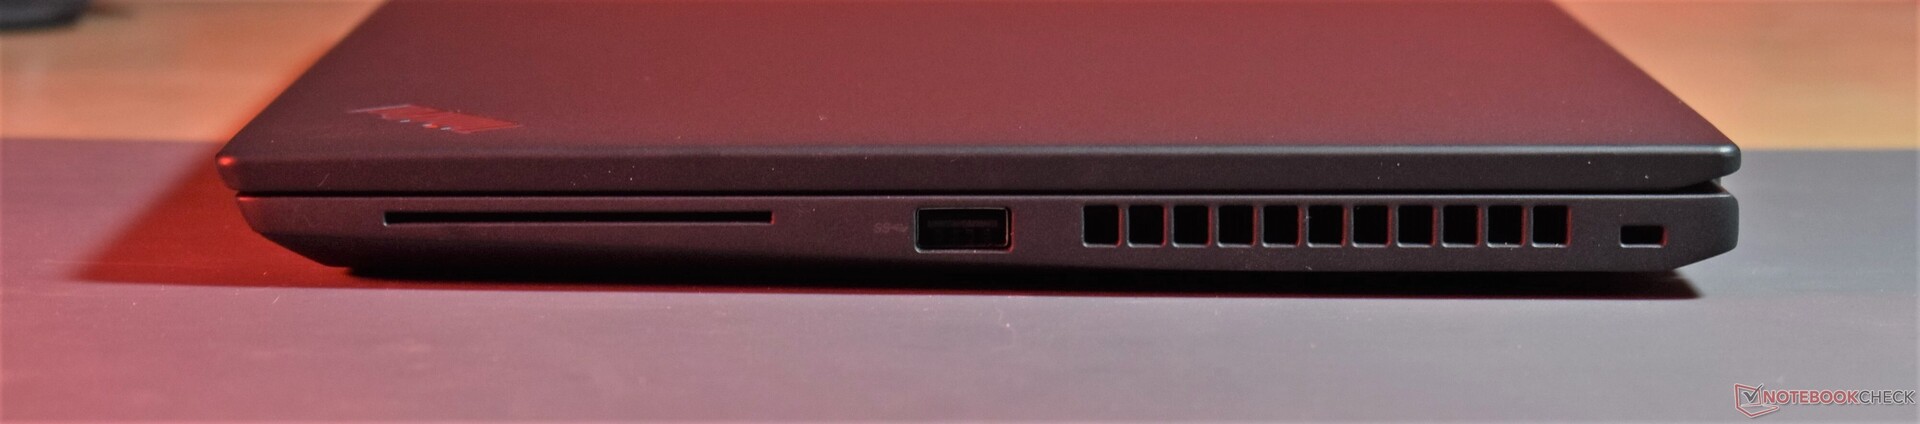
En comparación con elLenovo ThinkPad X13 Gen 2 AMDla selección de puertos es básicamente la misma. Lo nuevo es la adición de USB4, lo que significa compatibilidad Thunderbolt.
Comunicación
Notablemente débiles son las tasas de transferencia de carga del Lenovo ThinkPad X13 G3 AMD o más bien de su solución WiFi Qualcomm. Las tasas de descarga, por otro lado, son perfectamente buenas.
| Networking | |
| Lenovo ThinkPad X13 G3 21CM002UGE | |
| iperf3 transmit AXE11000 | |
| iperf3 receive AXE11000 | |
| iperf3 transmit AXE11000 6GHz | |
| iperf3 receive AXE11000 6GHz | |
| HP EliteBook 835 G9 | |
| iperf3 transmit AXE11000 | |
| iperf3 receive AXE11000 | |
| Dell Latitude 13 7330 | |
| iperf3 transmit AXE11000 6GHz | |
| iperf3 receive AXE11000 6GHz | |
| Lenovo ThinkPad X13 G3 21BN0046GE | |
| iperf3 transmit AXE11000 | |
| iperf3 receive AXE11000 | |
| Medio Qualcomm WCN685x | |
| iperf3 transmit AXE11000 | |
| iperf3 receive AXE11000 | |
| iperf3 transmit AXE11000 6GHz | |
| iperf3 receive AXE11000 6GHz | |
Cámara web
En comparación con el Lenovo ThinkPad X13 Gen 2no hay cambios en la calidad de la webcam 1080p.


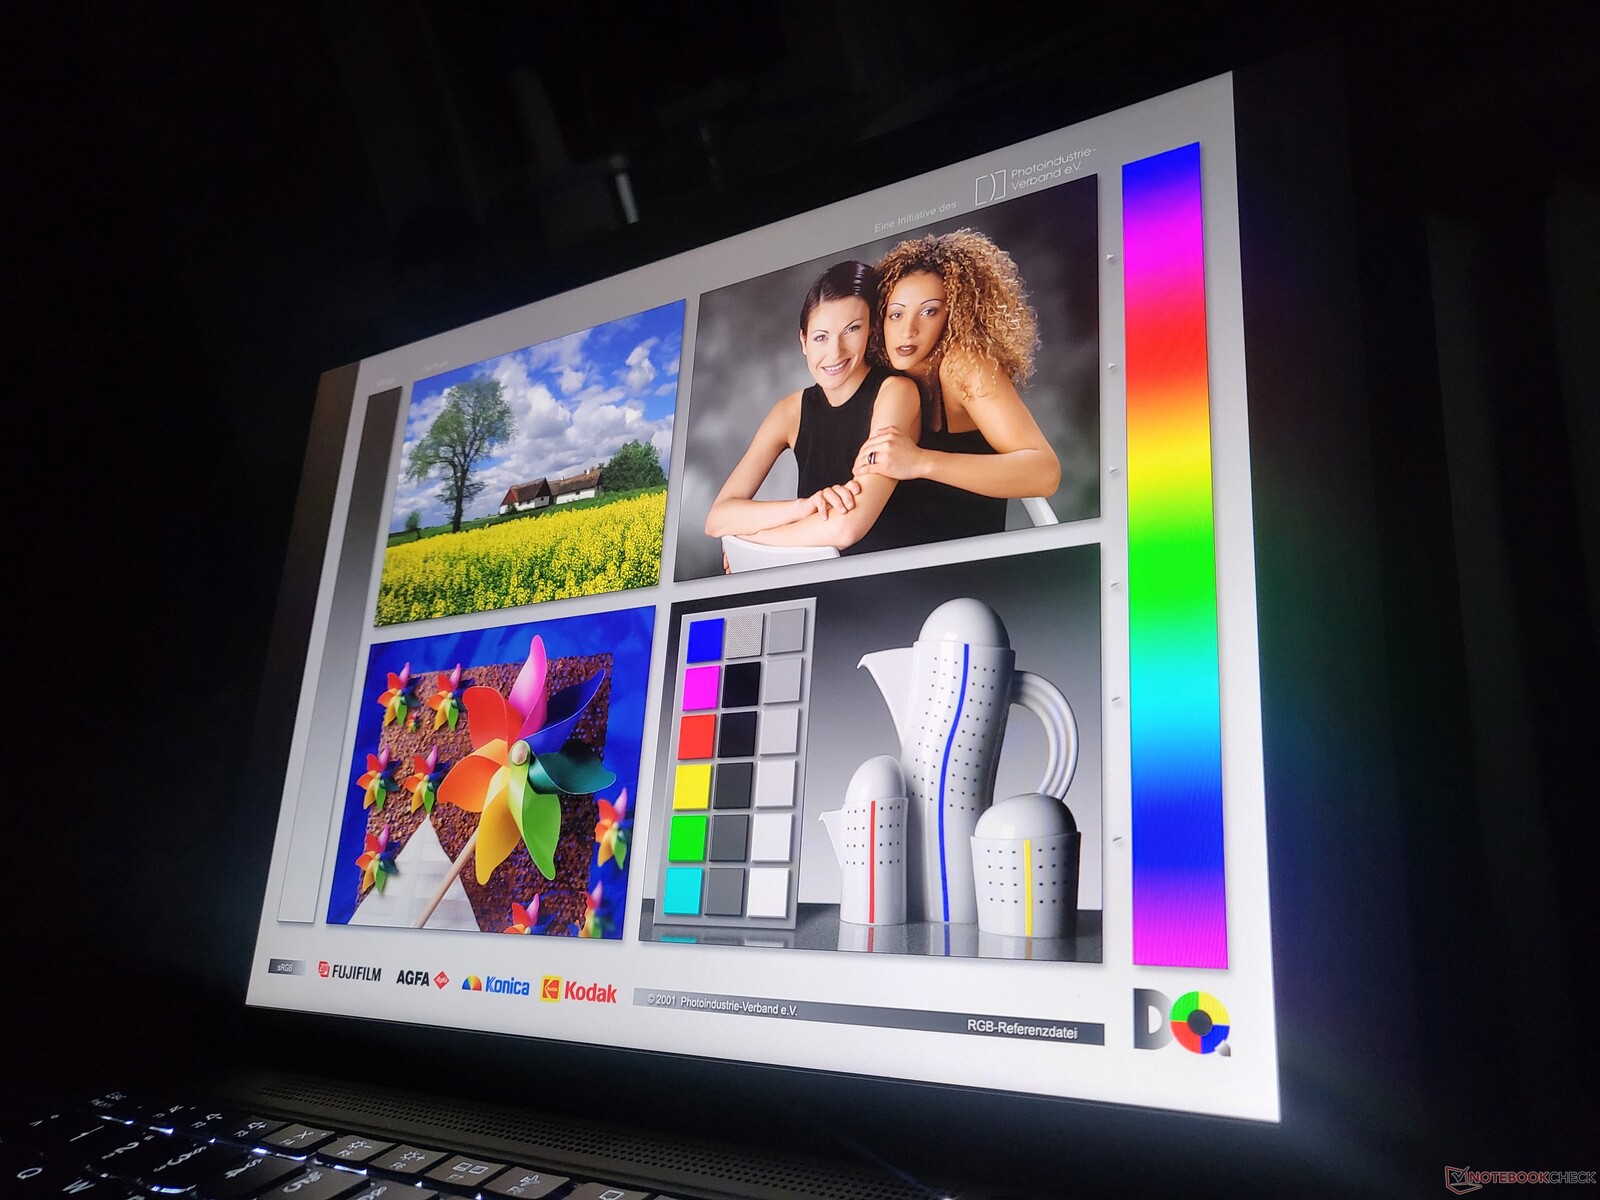
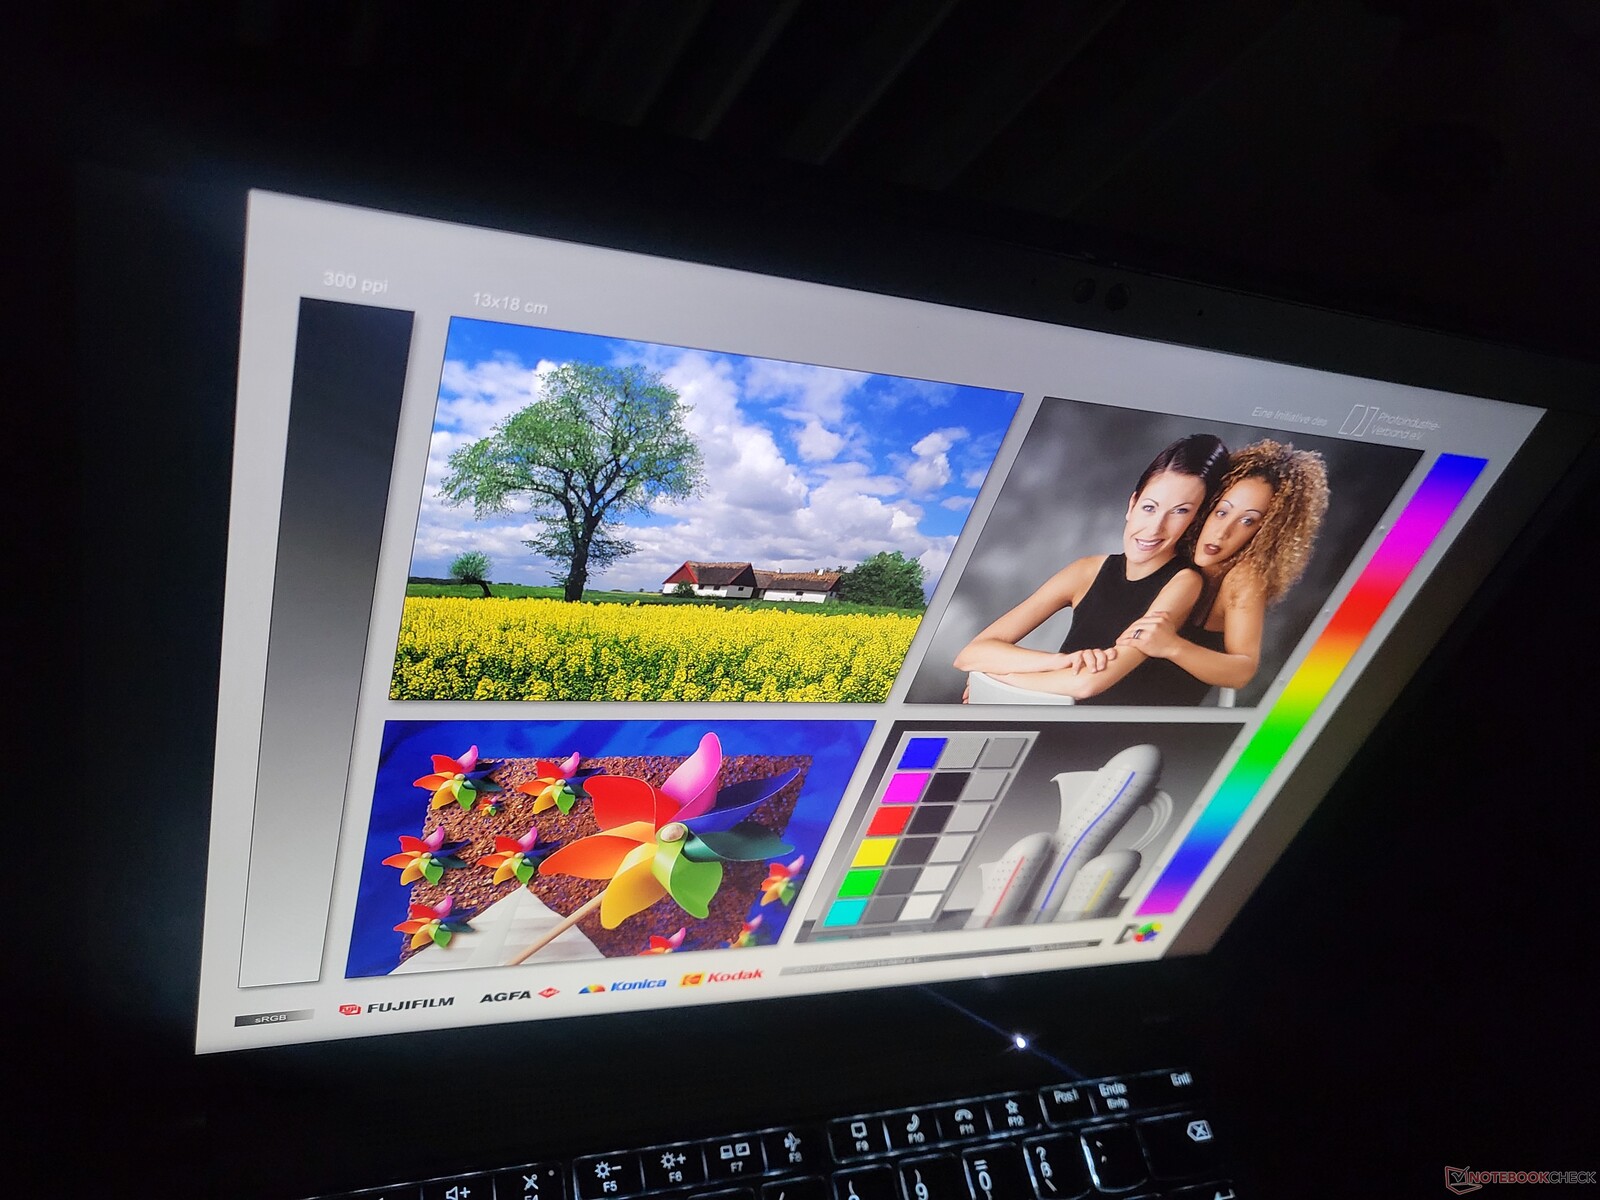
Pantalla: el brillo de la pantalla del portátil Lenovo podría ser mejor

La selección de pantallas de 13,3 pulgadas se mantiene sin cambios con respecto al modelo de 2022. Todas las pantallas disponibles tienen una superficie mate, la relación de aspecto 16:10 y una frecuencia de actualización de 60 Hz:
- 1.920 x 1.200 (WUXGA), 300 cd/m², 72 % NTSC
- 1.920 x 1.200 (WUXGA), 300 cd/m², 72 % NTSC, On-Cell Touch
- 1.920 x 1.200 (WUXGA), 500 cd/m², 72 % NTSC, PrivacyGuard
- 2.560 x 1.600 (WQXGA), 400 cd/m², 100 % sRGB, bajo consumo, Dolby Vision
El brillo medio medido de 321 cd/m² está ligeramente por encima del umbral anunciado de 300 cd/m². Notable: La competencia en forma de Dell y HP ofrece pantallas mucho más brillantes. Una media de 830 cd/m² como el HP EliteBook 835 G9 no es realmente necesario en el panel base, pero estaría bien que Lenovo concediera al X13 pantallas más brillantes - sin forzar al usuario a actualizarse a los paneles WQXGA o PrivacyGuard. 400 cd/m² más X como elDell Latitude 7330sería razonable.
| |||||||||||||||||||||||||
iluminación: 85 %
Brillo con batería: 348 cd/m²
Contraste: 1024:1 (Negro: 0.34 cd/m²)
ΔE ColorChecker Calman: 1.3 | ∀{0.5-29.43 Ø4.71}
calibrated: 1
ΔE Greyscale Calman: 0.9 | ∀{0.09-98 Ø4.96}
70.3% AdobeRGB 1998 (Argyll 3D)
98.4% sRGB (Argyll 3D)
69% Display P3 (Argyll 3D)
Gamma: 2.16
CCT: 6431 K
| Lenovo ThinkPad X13 G3 21CM002UGE M133NW4J R3, IPS LED, 1920x1200, 13.3" | Lenovo ThinkPad X13 G2 AMD 20XH001KGE NV133WUM-N61, IPS LED, 1920x1200, 13.3" | HP EliteBook 835 G9 InfoVision X133NV4M R0, IPS, 1920x1200, 13.3" | Dell Latitude 13 7330 LG Philips 133WF9, IPS, 1920x1080, 13.3" | Lenovo ThinkPad X13 G3 21BN0046GE NV133WUM-N61, IPS Grade, 1920x1200, 13.3" | |
|---|---|---|---|---|---|
| Display | 1% | 2% | -4% | 1% | |
| Display P3 Coverage (%) | 69 | 70.1 2% | 70.7 2% | 66.1 -4% | 70.4 2% |
| sRGB Coverage (%) | 98.4 | 99.4 1% | 100 2% | 93.5 -5% | 99.8 1% |
| AdobeRGB 1998 Coverage (%) | 70.3 | 71.3 1% | 72.1 3% | 68.2 -3% | 71 1% |
| Response Times | 23% | 17% | -8% | 48% | |
| Response Time Grey 50% / Grey 80% * (ms) | 44.2 ? | 34 ? 23% | 37.7 ? 15% | 48.4 ? -10% | 22.9 ? 48% |
| Response Time Black / White * (ms) | 28.1 ? | 22 ? 22% | 22.7 ? 19% | 29.6 ? -5% | 14.8 ? 47% |
| PWM Frequency (Hz) | |||||
| Screen | -14% | 21% | -16% | -25% | |
| Brightness middle (cd/m²) | 348 | 309 -11% | 928 167% | 460.1 32% | 290 -17% |
| Brightness (cd/m²) | 321 | 297 -7% | 828 158% | 445 39% | 288 -10% |
| Brightness Distribution (%) | 85 | 81 -5% | 65 -24% | 89 5% | 88 4% |
| Black Level * (cd/m²) | 0.34 | 0.26 24% | 0.35 -3% | 0.31 9% | 0.21 38% |
| Contrast (:1) | 1024 | 1188 16% | 2651 159% | 1484 45% | 1381 35% |
| Colorchecker dE 2000 * | 1.3 | 1.6 -23% | 1.76 -35% | 2.42 -86% | 1.9 -46% |
| Colorchecker dE 2000 max. * | 2.5 | 3 -20% | 3.94 -58% | 3.97 -59% | 4 -60% |
| Colorchecker dE 2000 calibrated * | 1 | 0.8 20% | 1.09 -9% | 0.77 23% | 0.8 20% |
| Greyscale dE 2000 * | 0.9 | 2 -122% | 2.4 -167% | 2.3 -156% | 2.6 -189% |
| Gamma | 2.16 102% | 2.24 98% | 2.324 95% | 2.23 99% | 2.23 99% |
| CCT | 6431 101% | 6315 103% | 6689 97% | 6262 104% | 6195 105% |
| Media total (Programa/Opciones) | 3% /
-6% | 13% /
16% | -9% /
-13% | 8% /
-9% |
* ... más pequeño es mejor
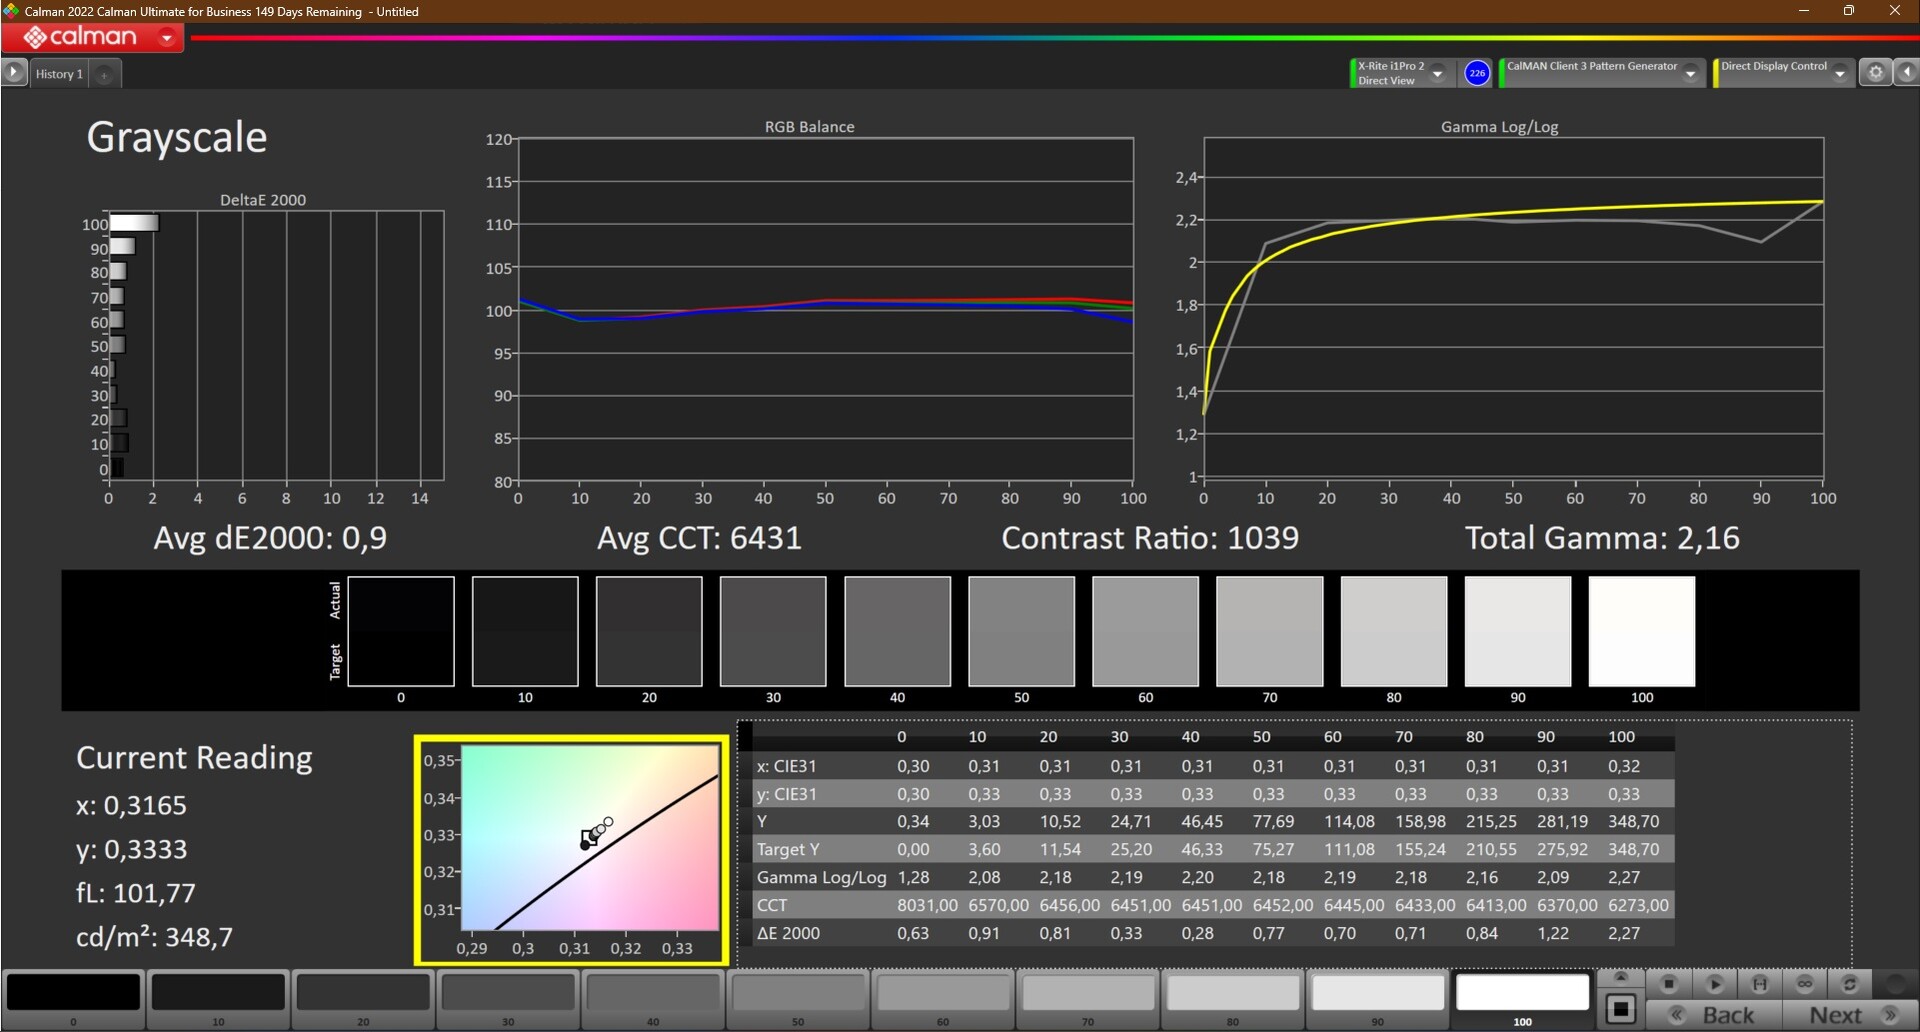

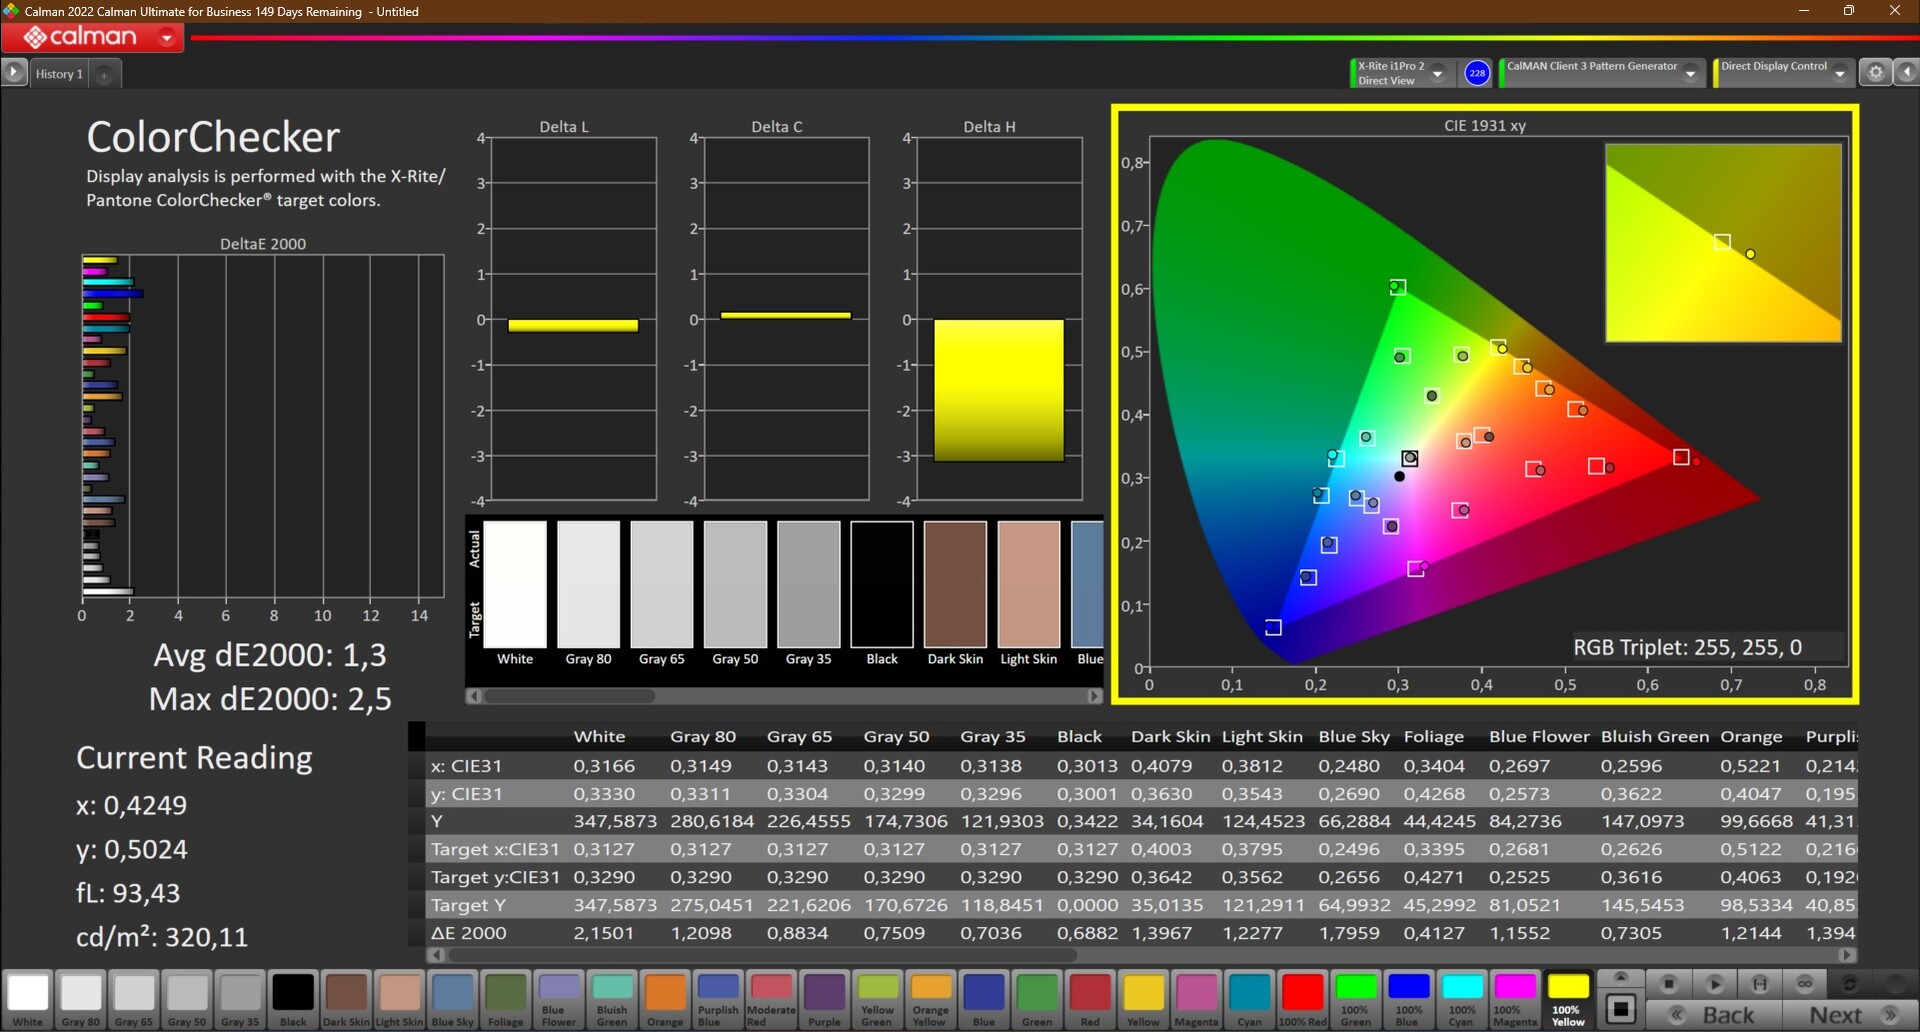
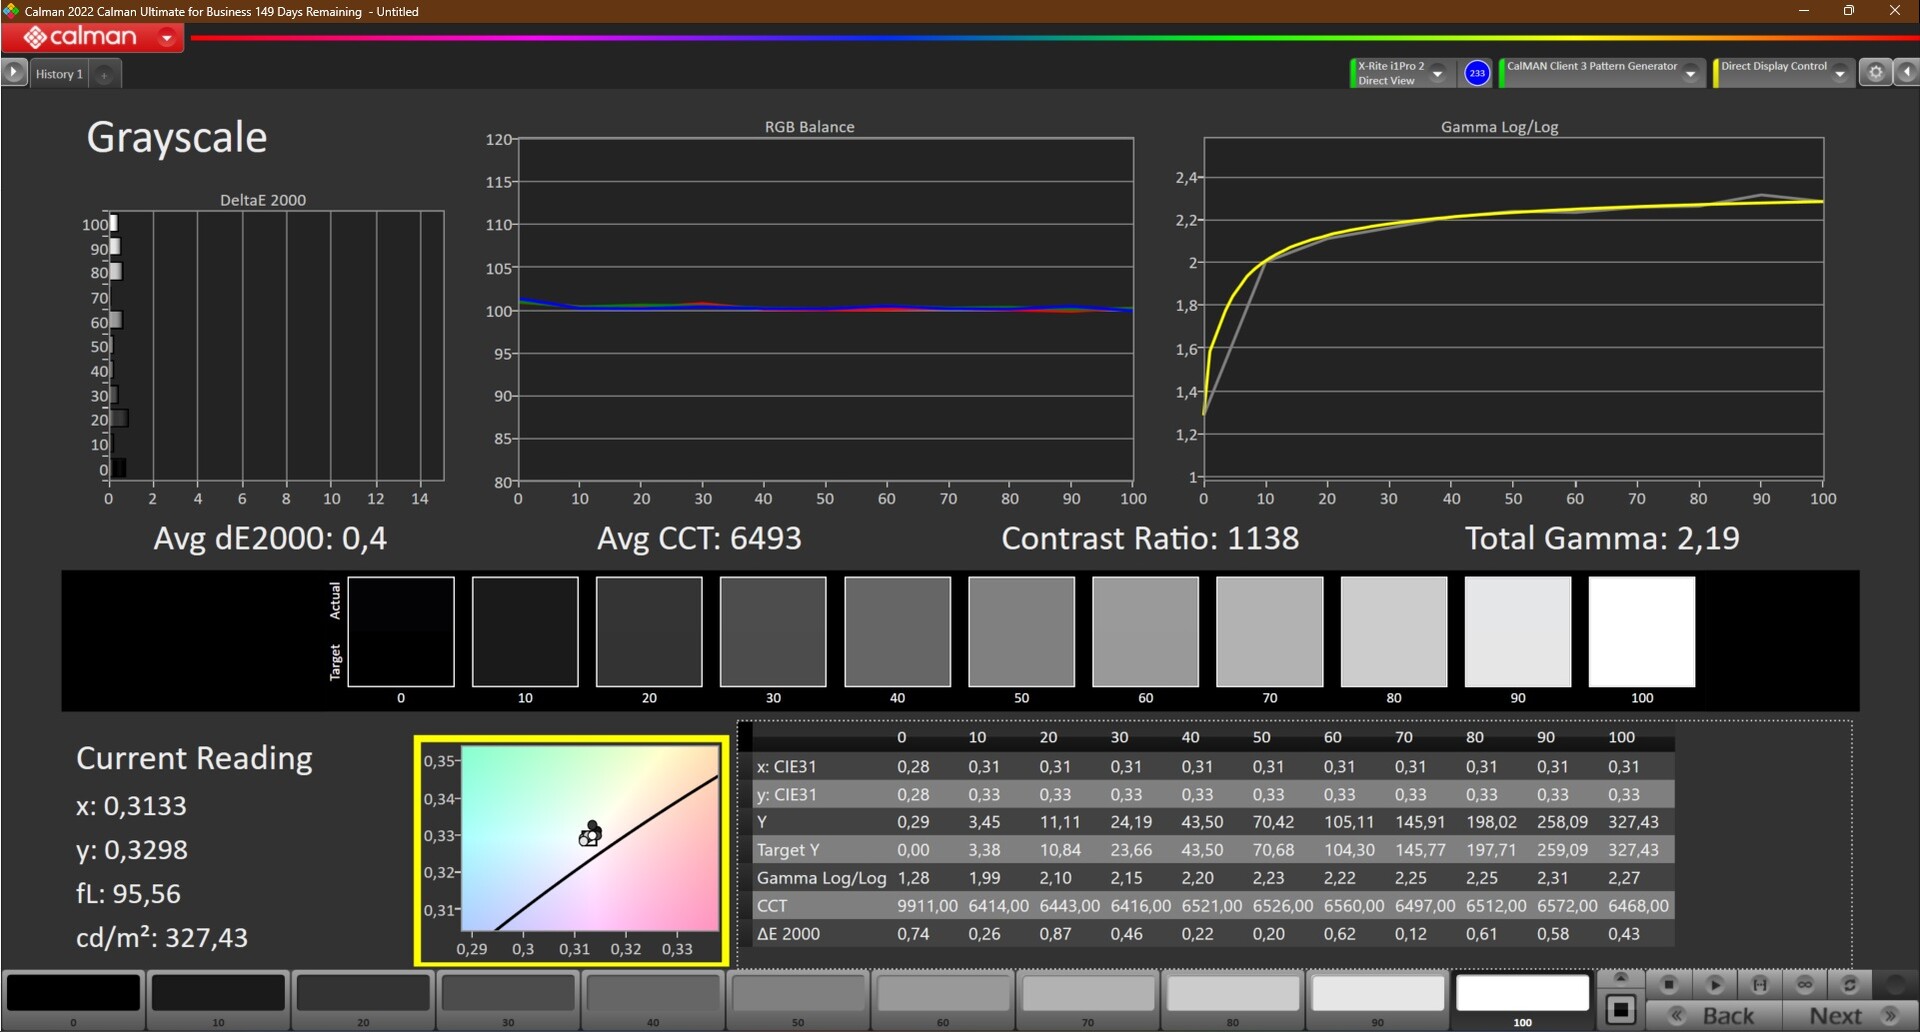
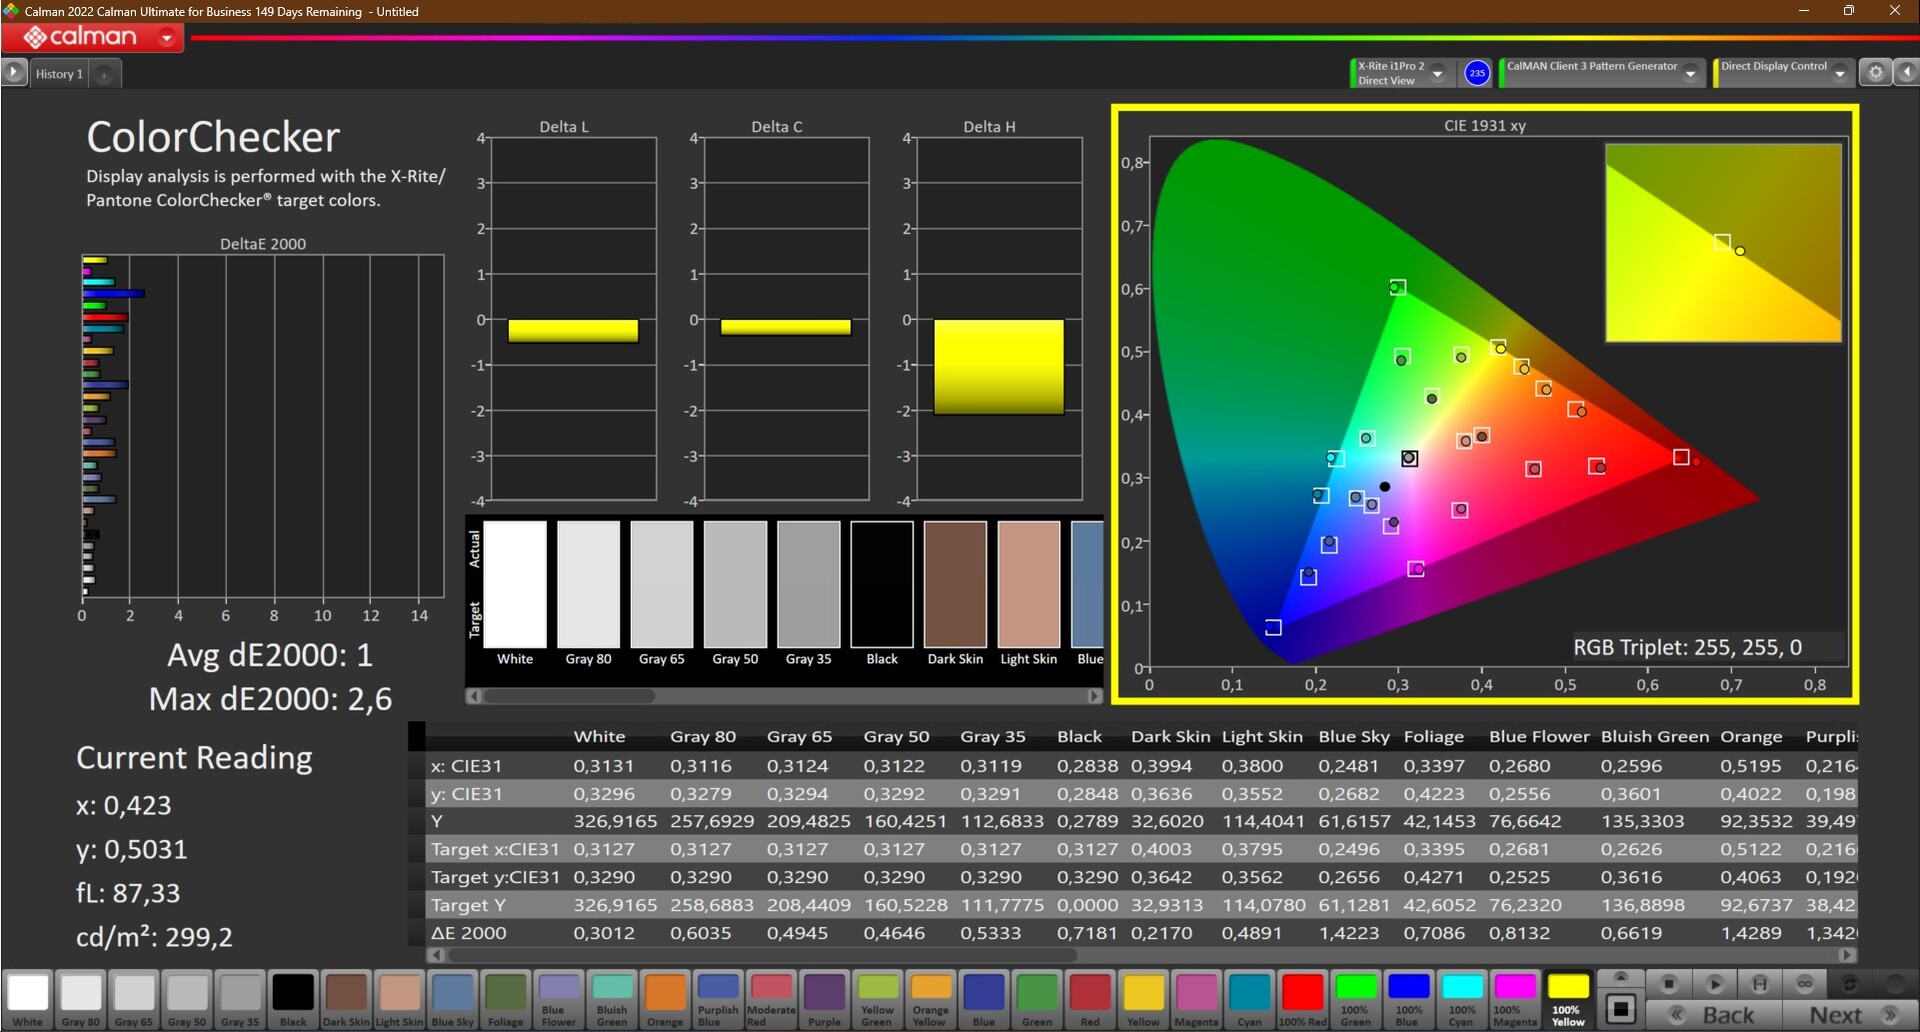
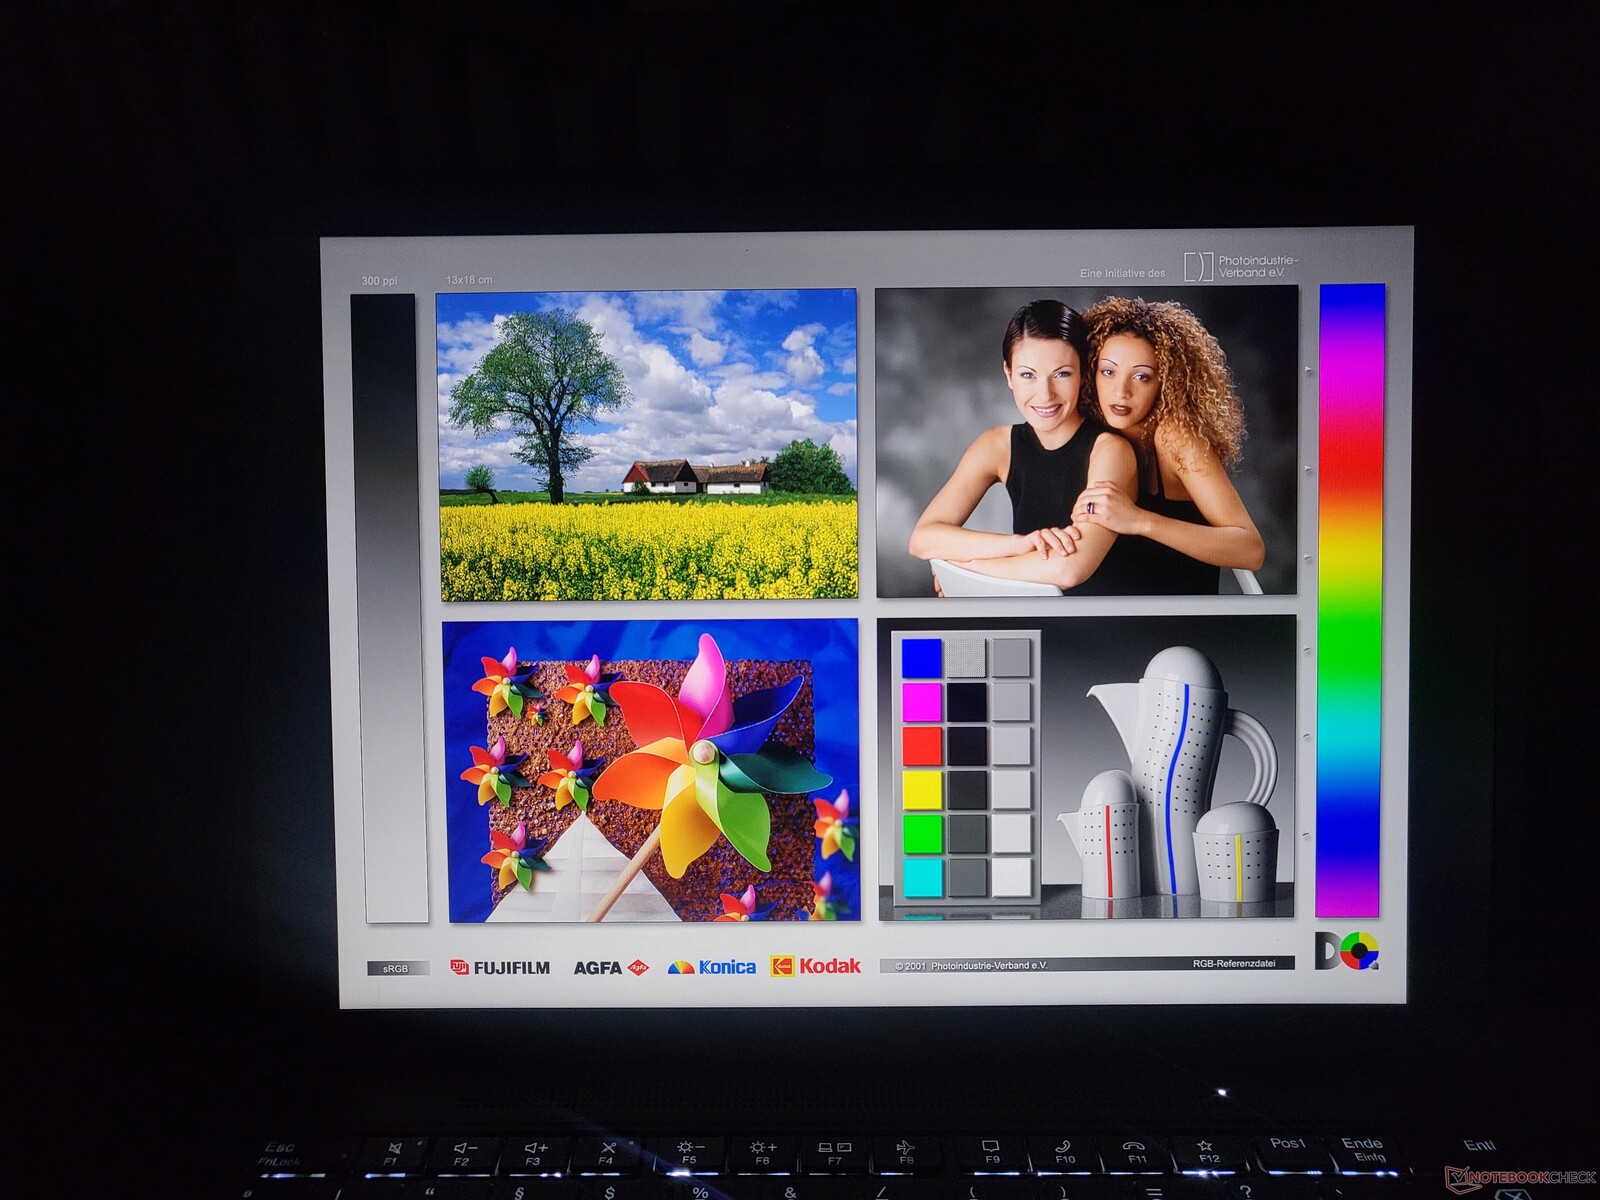
El panel ya viene bastante bien ajustado de fábrica en cuanto a colores. El bajo deltaE medio de sólo 1,3, medido con CalMan y el colorímetro X-Rite i1Pro 2, es prueba de ello. Tras una calibración con el i1Profiler de X-Rite, la pantalla se vuelve ligeramente más precisa en cuanto al color (1,0 en lugar de 1,3). El perfil de color que creamos para este fin se puede descargar gratuitamente, como siempre.
En términos de cobertura de la gama de color, el panel del Lenovo ThinkPad X13 G3 AMD cubre casi por completo la gama de color sRGB. Es utilizable para tareas básicas de edición fotográfica.
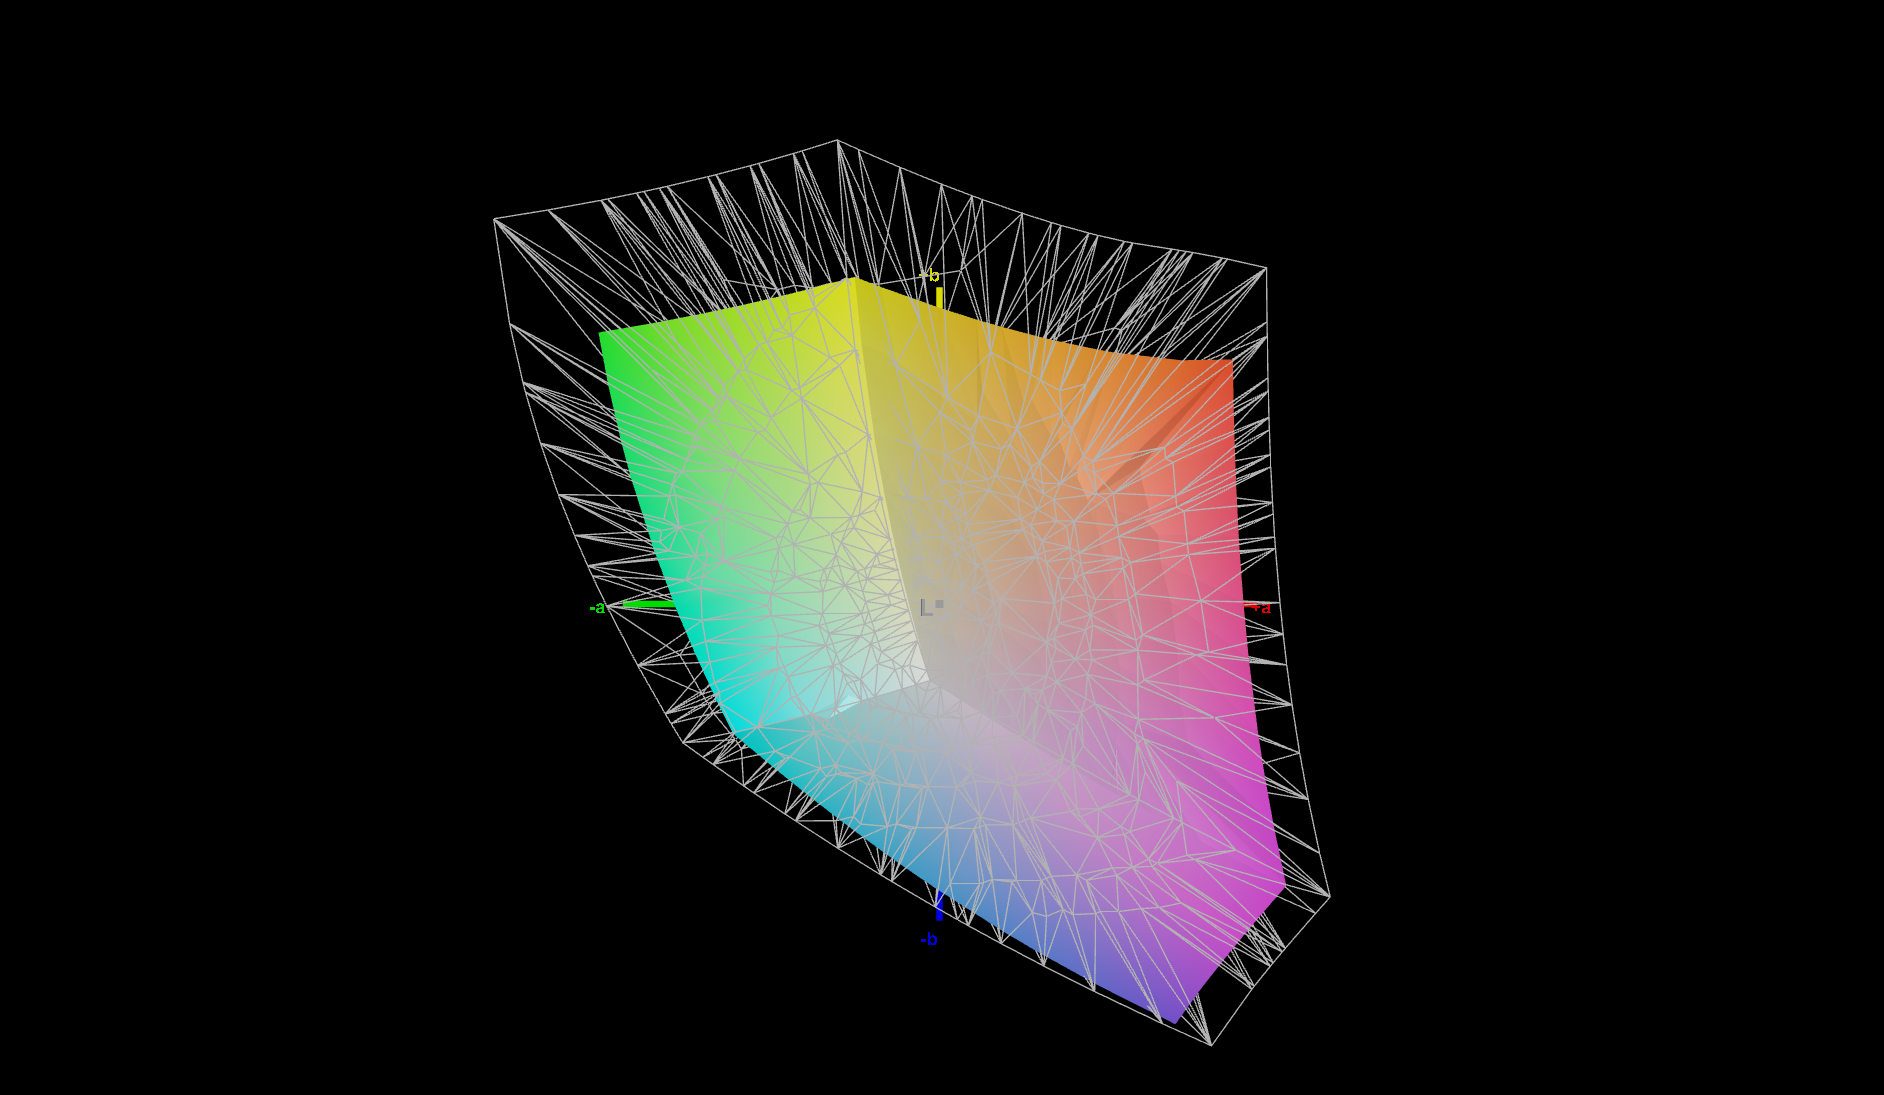
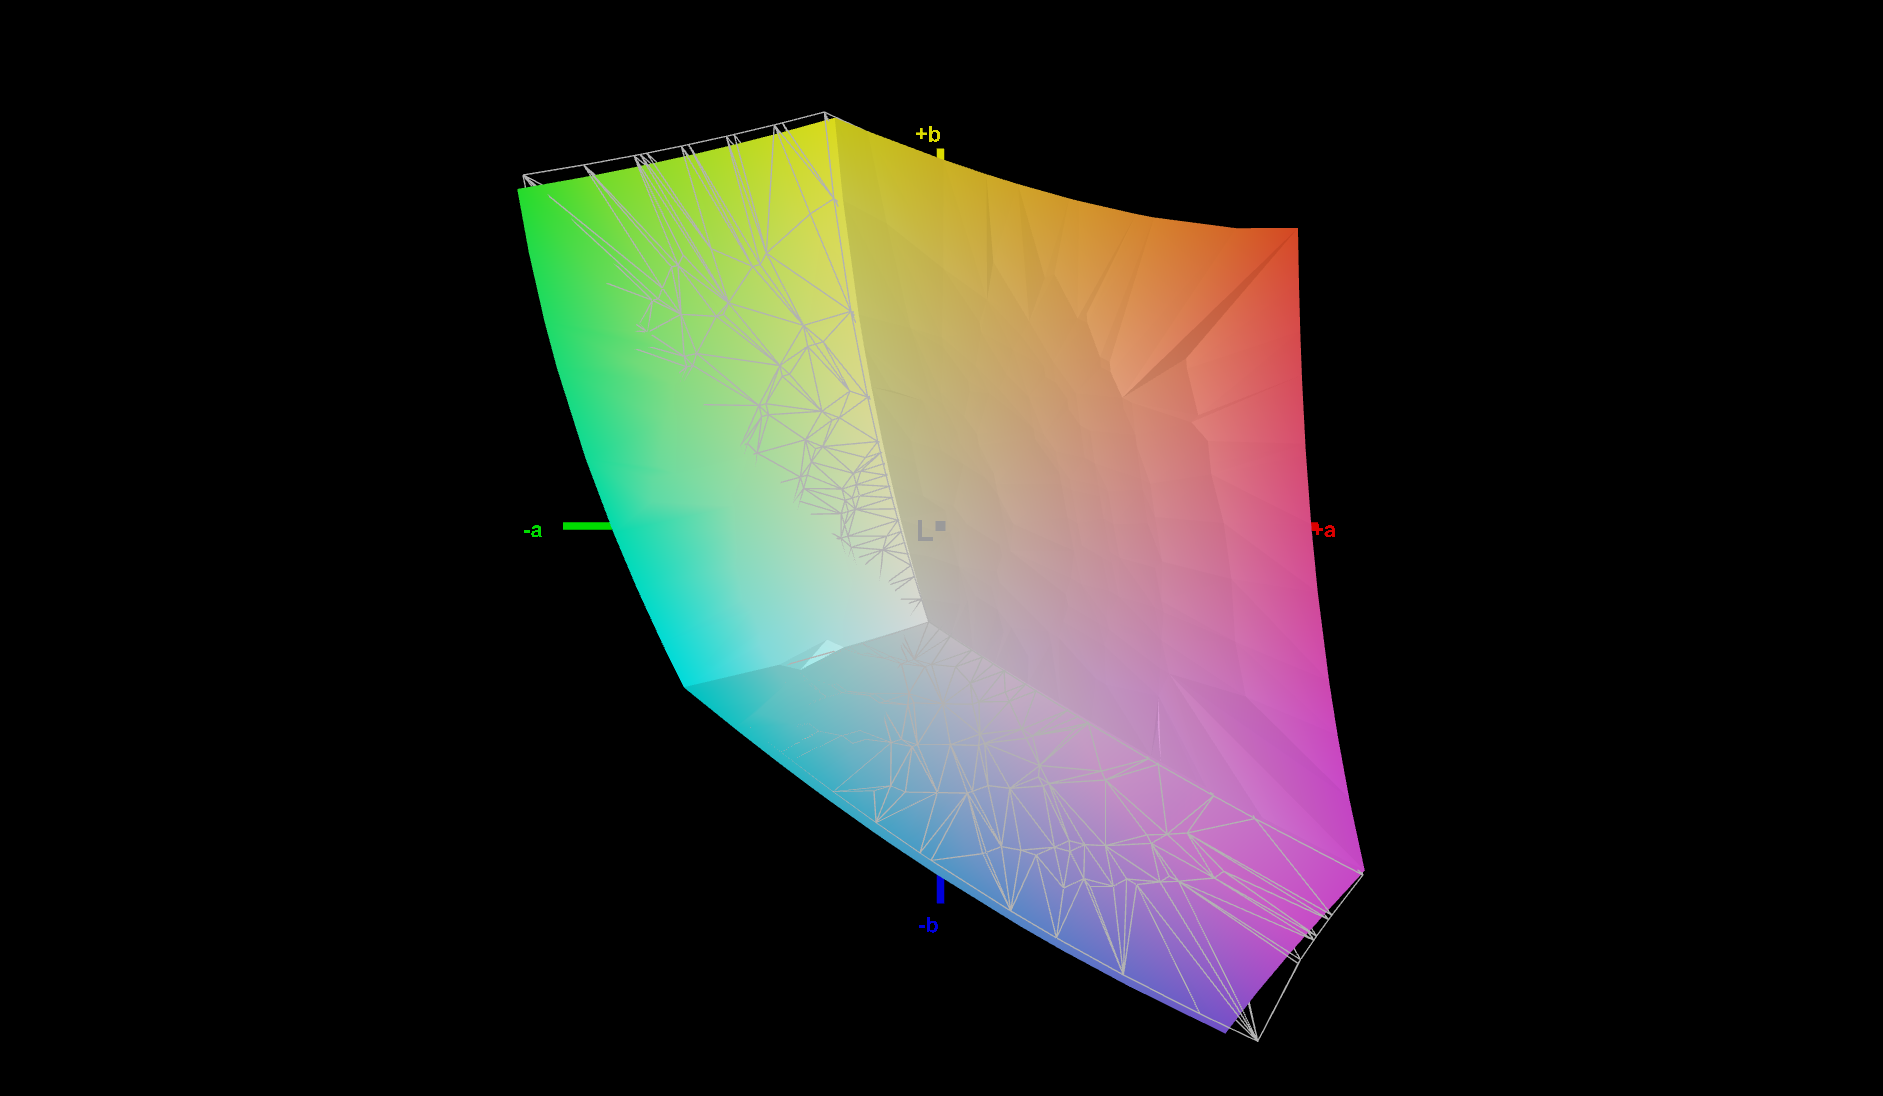
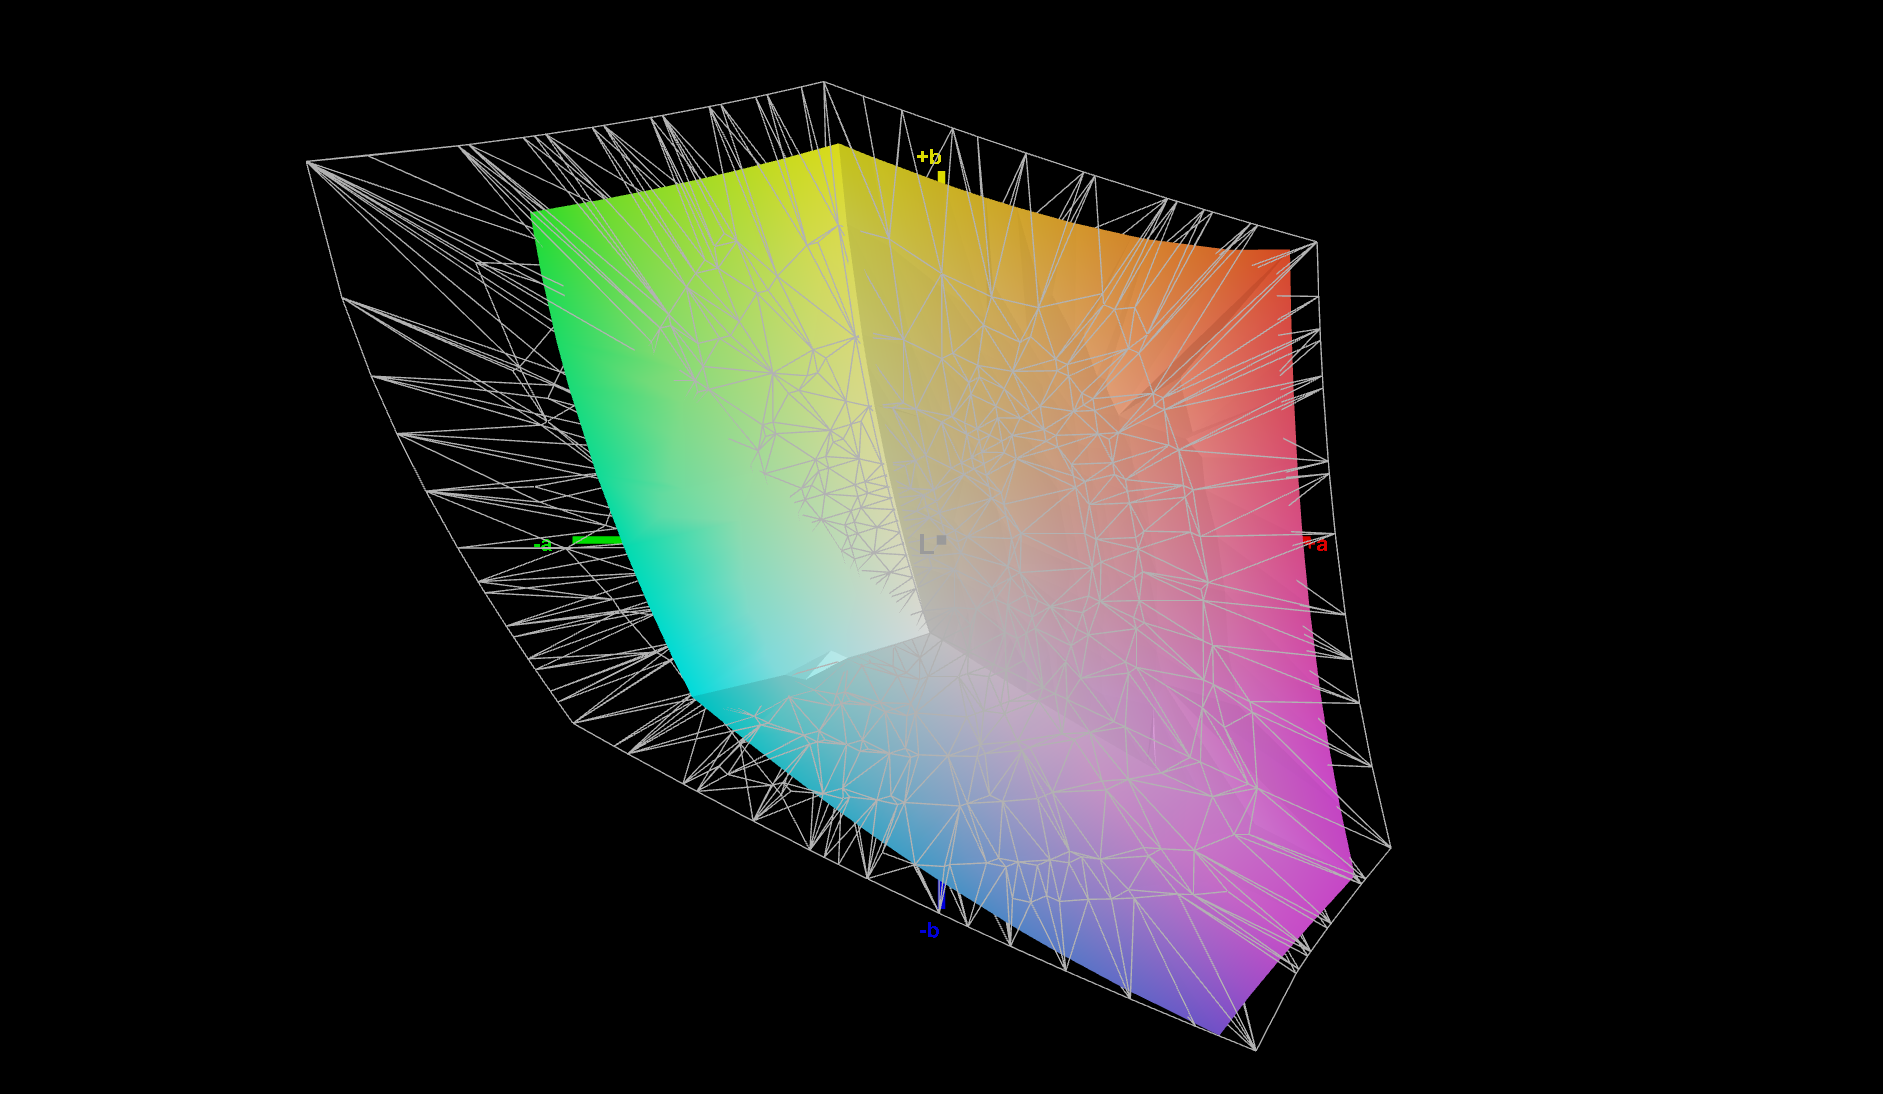
En exteriores, el ThinkPad X13 Gen 3 es usable, gracias a la superficie mate de la pantalla. Como antes: agradeceríamos una pantalla más brillante, especialmente para un portátil de esta clase de dispositivo móvil.
Tiempos de respuesta del display
| ↔ Tiempo de respuesta de Negro a Blanco | ||
|---|---|---|
| 28.1 ms ... subida ↗ y bajada ↘ combinada | ↗ 14.2 ms subida | 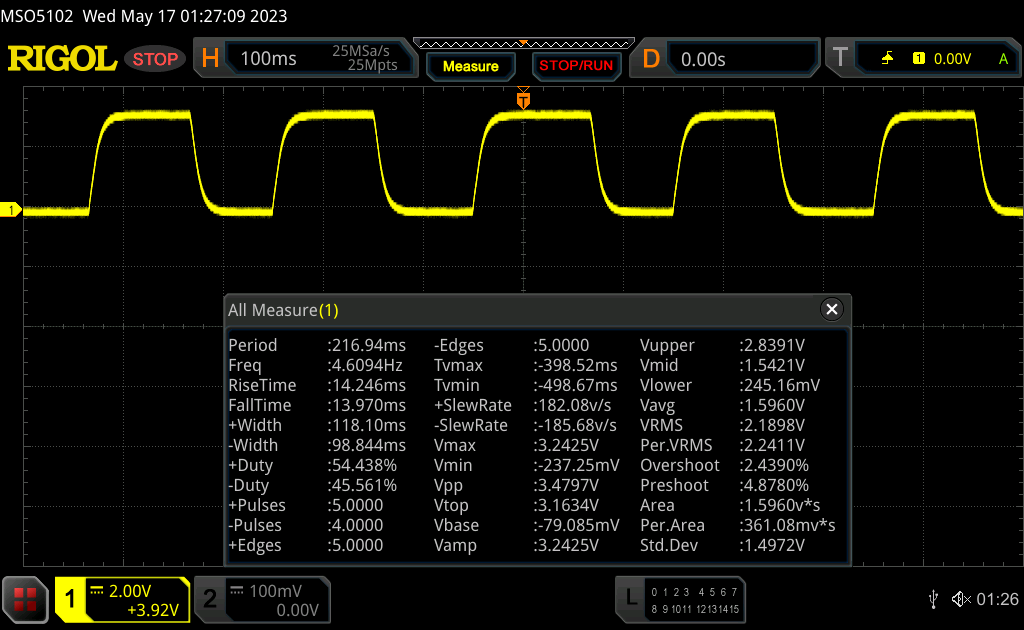 |
| ↘ 13.9 ms bajada | ||
| La pantalla mostró tiempos de respuesta relativamente lentos en nuestros tests pero podría ser demasiado lenta para los jugones. En comparación, todos los dispositivos de prueba van de ##min### (mínimo) a 240 (máximo) ms. » 75 % de todos los dispositivos son mejores. Eso quiere decir que el tiempo de respuesta es peor que la media (19.8 ms) de todos los dispositivos testados. | ||
| ↔ Tiempo de respuesta 50% Gris a 80% Gris | ||
| 44.2 ms ... subida ↗ y bajada ↘ combinada | ↗ 20.7 ms subida | 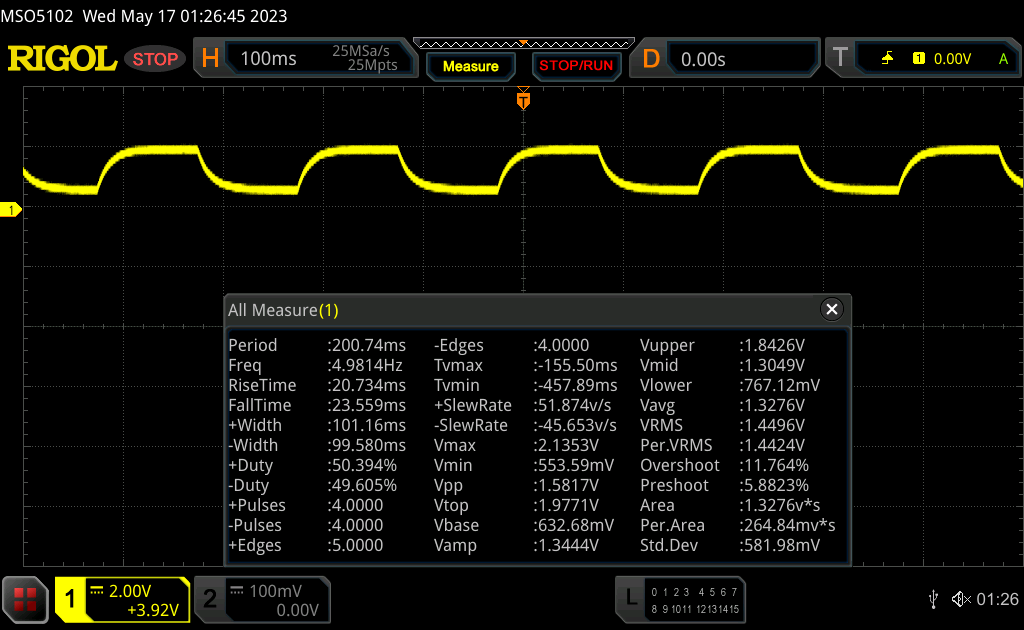 |
| ↘ 23.5 ms bajada | ||
| La pantalla mostró tiempos de respuesta lentos en nuestros tests y podría ser demasiado lenta para los jugones. En comparación, todos los dispositivos de prueba van de ##min### (mínimo) a 636 (máximo) ms. » 76 % de todos los dispositivos son mejores. Eso quiere decir que el tiempo de respuesta es peor que la media (31 ms) de todos los dispositivos testados. | ||
Parpadeo de Pantalla / PWM (Pulse-Width Modulation)
| Parpadeo de Pantalla / PWM no detectado |  | ||
Comparación: 52 % de todos los dispositivos testados no usaron PWM para atenuar el display. Si se usó, medimos una media de 7754 (mínimo: 5 - máxmo: 343500) Hz. | |||

Rendimiento: AMD Ryzen 5 ofrece un buen rendimiento
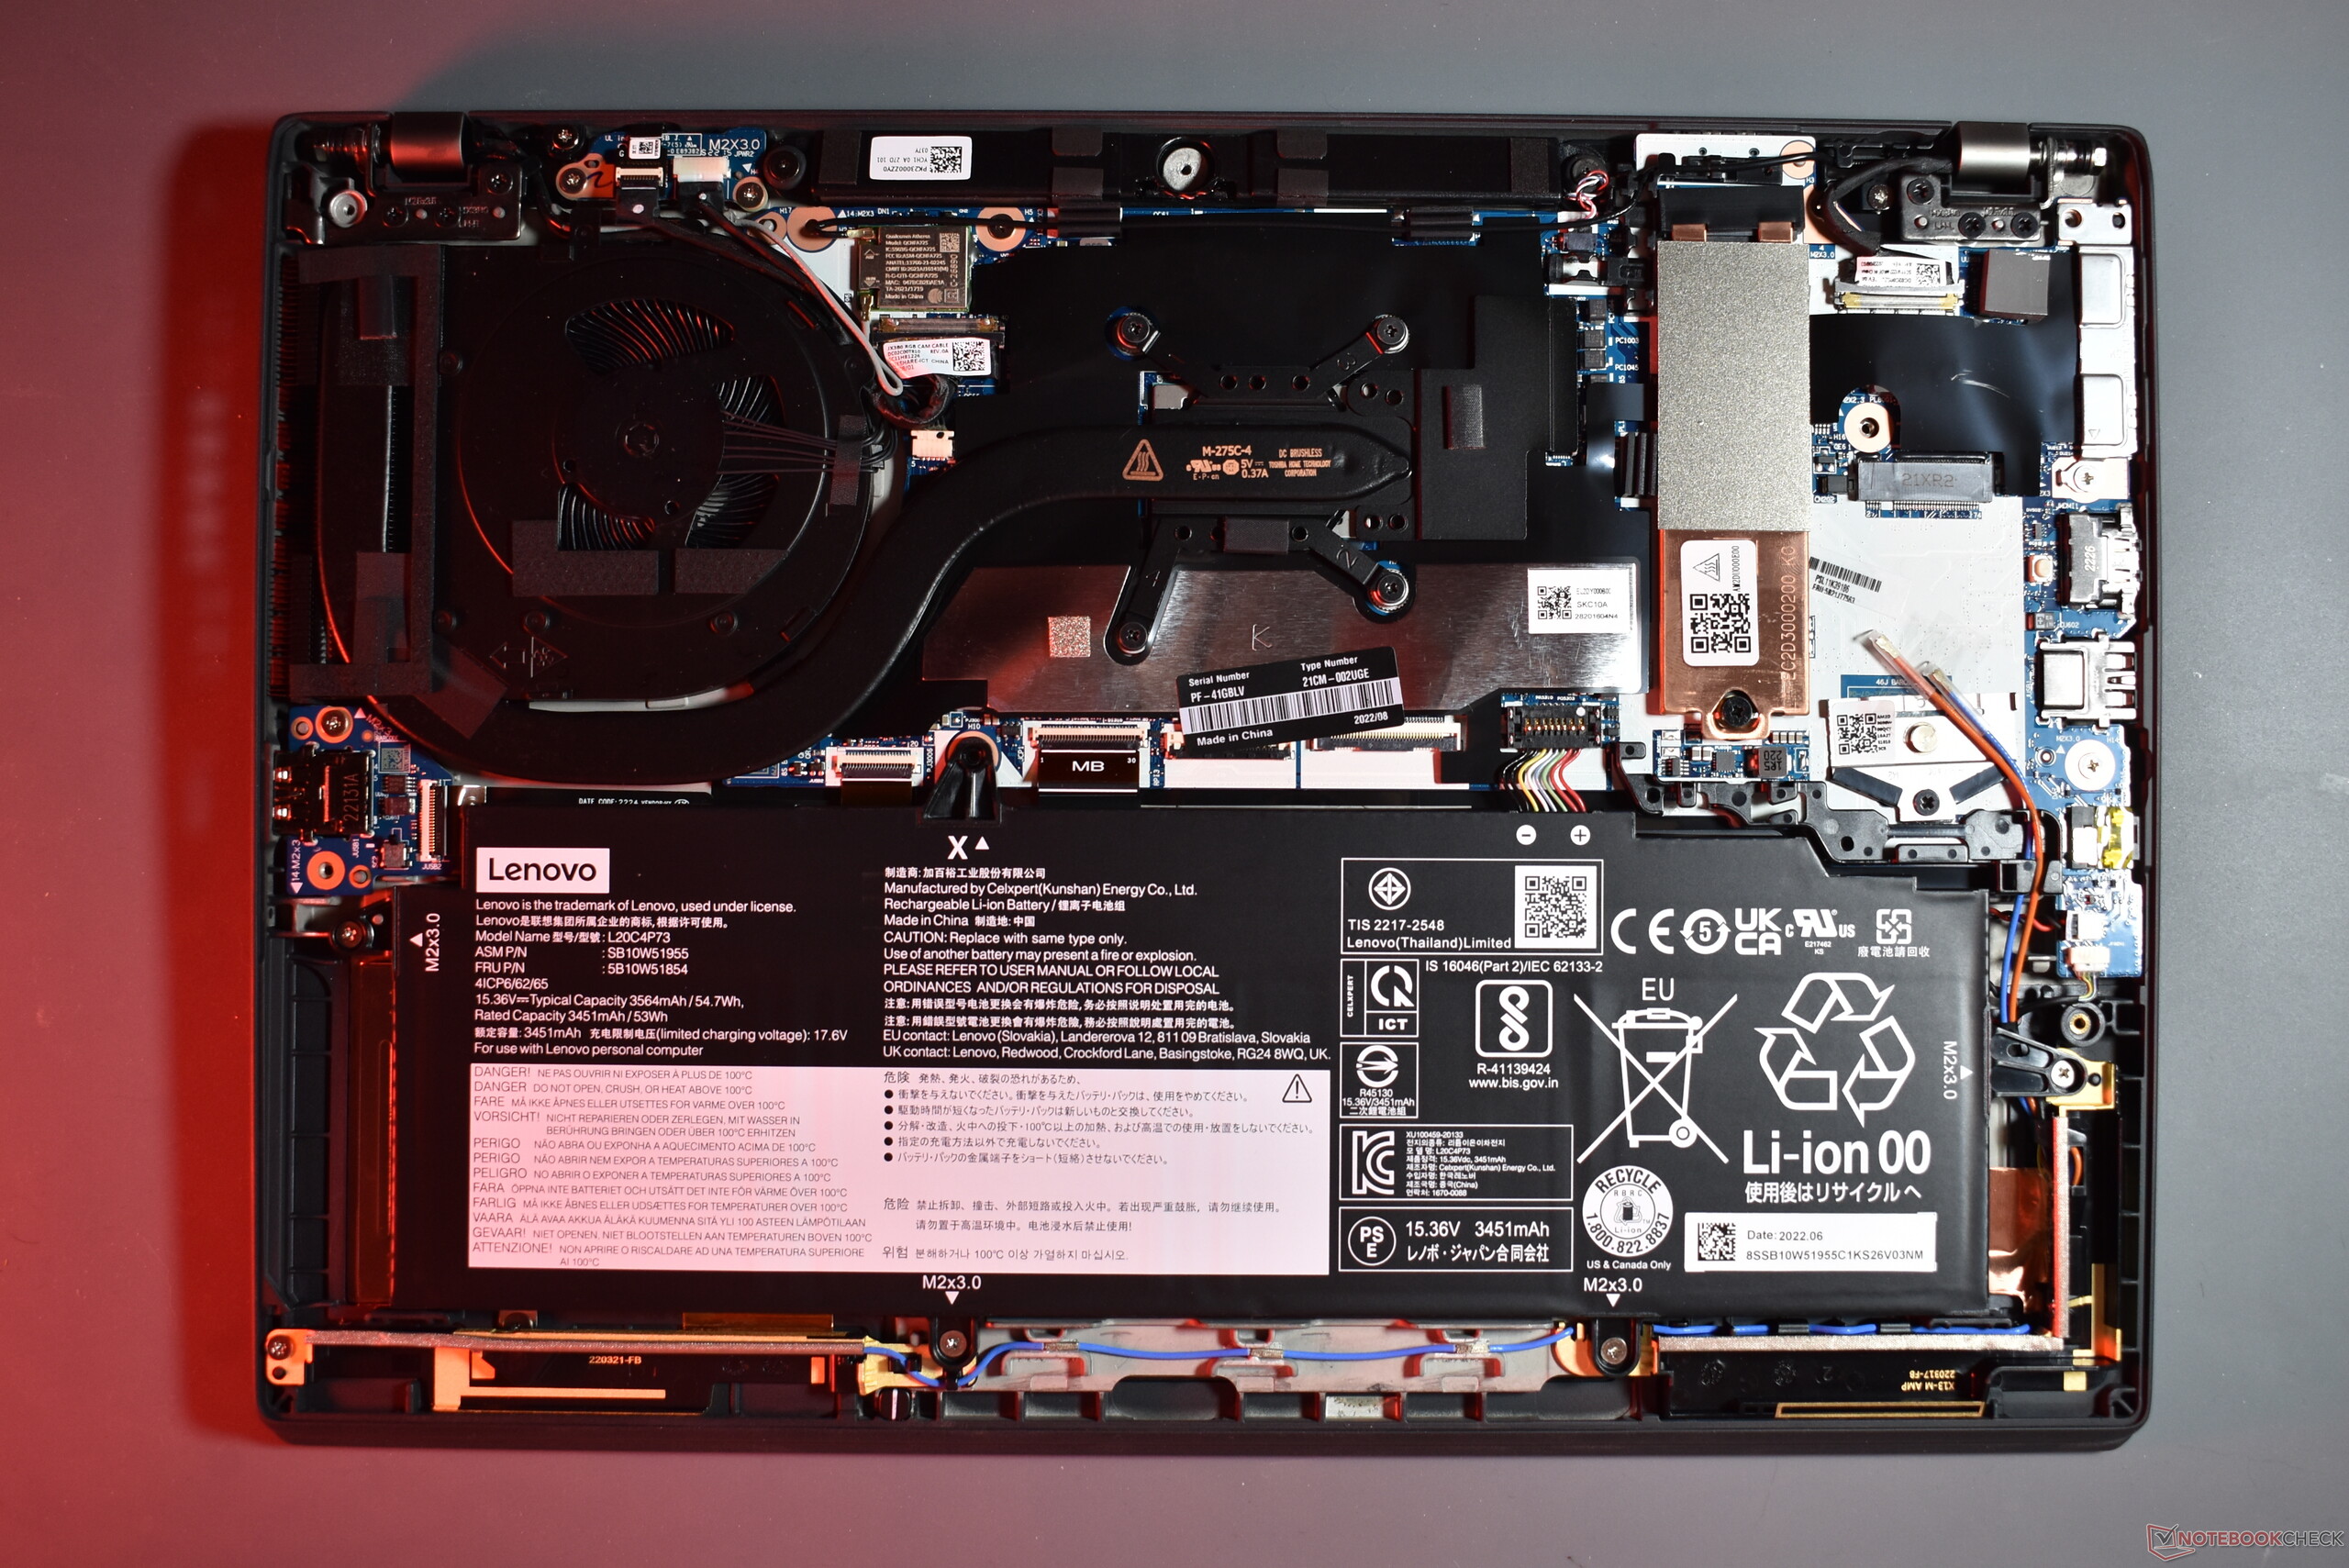
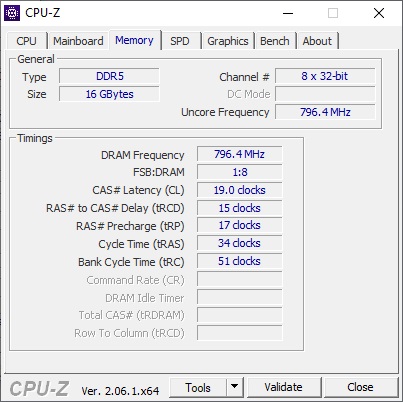
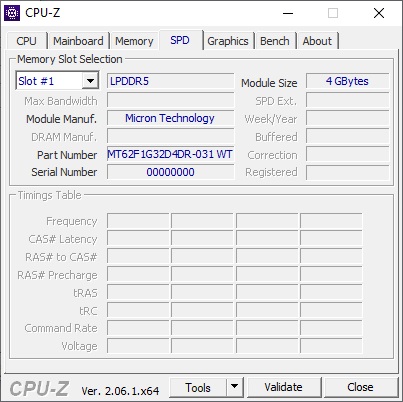
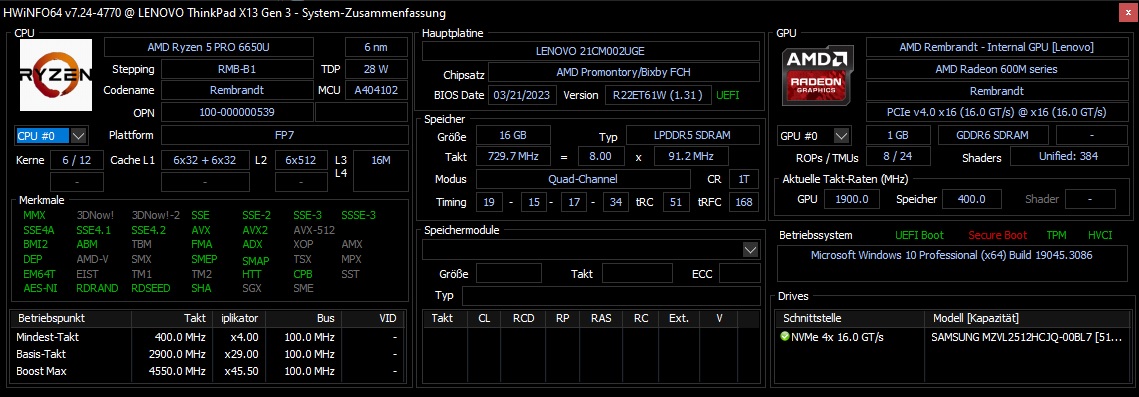
Lenovo vende el ThinkPad X13 Gen 3 AMD con dos CPU AMD diferentes, siendo las opciones disponibles el AMD Ryzen 5 Pro 6650Uy el Ryzen 7 Pro 6850U. Dependiendo de la CPU elegida, la Radeon 660Mo la Radeon 680Msirven como solución GPU. La RAM siempre va soldada, hay variantes con 8, 16 o 32 GB de memoria LPDDR5-6400. El SSD M.2 2280 no está soldado, Lenovo ofrece un máximo de 2 TB de almacenamiento SSD.
Condiciones de la prueba
Como es habitual en los ThinkPads de Lenovo, no hay software propietario OEM para gestionar los perfiles de energía. En su lugar, se utilizan los perfiles de energía de Windows para gestionar los límites de energía (PL1 = rendimiento bajo carga sostenida, PL2 = rendimiento de refuerzo a corto plazo).
- Más eficiencia de la batería: PL1 12 W / PL2 12 W
- Mejor rendimiento: PL1 17 W / PL2 25 W
- Mejor rendimiento: PL1 22,5 W / PL2 30 W
Procesador
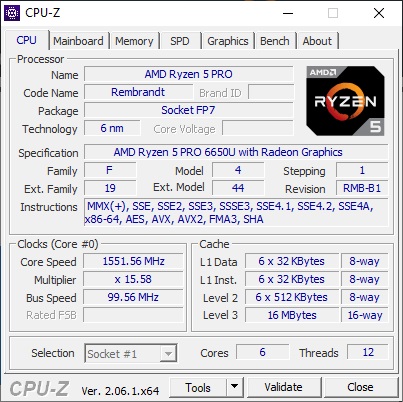
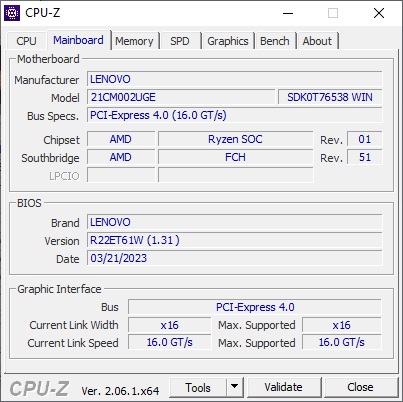
EnAMD Ryzen 5 Pro 6650U es un procesador U de la generación Rembrandt, pensado para portátiles de empresa compactos. Como CPU "Pro", este chip compite directamente con los procesadores vPro de Intel. El TDP típico es de 15 W, la CPU tiene seis núcleos y doce hilos. Es posible realizar comparaciones exhaustivas con otras CPU gracias a nuestra Herramienta de comparación de CPU.
El rendimiento del ThinkPad X13 Gen 3 AMD es ligeramente mejor que el de su predecesor. Los modelos basados en Intel ThinkPad X13 G3 Intel yDell Latitude 7330ofrecen un mejor rendimiento mononúcleo y parcialmente un mejor rendimiento boost, pero palidecen cuando se trata de pruebas multinúcleo sostenidas. Por su parte, el HP EliteBook 835 G9 ofrece un enorme salto en potencia, pero este modelo está equipado con el chip octacore AMD Ryzen 7 Pro 6850U, que también está disponible para el AMD X13 Gen 3.
El rendimiento de la CPU no se estrangula en modo batería.
Cinebench R15 Multi sustained load
Cinebench R23: Multi Core | Single Core
Cinebench R20: CPU (Multi Core) | CPU (Single Core)
Cinebench R15: CPU Multi 64Bit | CPU Single 64Bit
Blender: v2.79 BMW27 CPU
7-Zip 18.03: 7z b 4 | 7z b 4 -mmt1
Geekbench 5.5: Multi-Core | Single-Core
HWBOT x265 Benchmark v2.2: 4k Preset
LibreOffice : 20 Documents To PDF
R Benchmark 2.5: Overall mean
| CPU Performance rating | |
| Media de la clase Subnotebook | |
| HP EliteBook 835 G9 | |
| Dell Latitude 13 7330 | |
| Medio AMD Ryzen 5 PRO 6650U | |
| Lenovo ThinkPad X13 G3 21BN0046GE | |
| Lenovo ThinkPad X13 G3 21CM002UGE | |
| Lenovo ThinkPad X13 G2 AMD 20XH001KGE | |
| Cinebench R23 / Multi Core | |
| Media de la clase Subnotebook (1555 - 21812, n=60, últimos 2 años) | |
| HP EliteBook 835 G9 | |
| Medio AMD Ryzen 5 PRO 6650U (7805 - 9534, n=4) | |
| Dell Latitude 13 7330 | |
| Lenovo ThinkPad X13 G3 21CM002UGE | |
| Lenovo ThinkPad X13 G2 AMD 20XH001KGE | |
| Lenovo ThinkPad X13 G3 21BN0046GE | |
| Cinebench R23 / Single Core | |
| Media de la clase Subnotebook (358 - 2213, n=61, últimos 2 años) | |
| Dell Latitude 13 7330 | |
| Lenovo ThinkPad X13 G3 21BN0046GE | |
| HP EliteBook 835 G9 | |
| Medio AMD Ryzen 5 PRO 6650U (1439 - 1476, n=4) | |
| Lenovo ThinkPad X13 G3 21CM002UGE | |
| Lenovo ThinkPad X13 G2 AMD 20XH001KGE | |
| Cinebench R20 / CPU (Multi Core) | |
| Media de la clase Subnotebook (579 - 8541, n=57, últimos 2 años) | |
| HP EliteBook 835 G9 | |
| Lenovo ThinkPad X13 G3 21BN0046GE | |
| Medio AMD Ryzen 5 PRO 6650U (3057 - 3684, n=4) | |
| Dell Latitude 13 7330 | |
| Lenovo ThinkPad X13 G3 21CM002UGE | |
| Lenovo ThinkPad X13 G2 AMD 20XH001KGE | |
| Cinebench R20 / CPU (Single Core) | |
| Media de la clase Subnotebook (128 - 832, n=57, últimos 2 años) | |
| Dell Latitude 13 7330 | |
| Lenovo ThinkPad X13 G3 21BN0046GE | |
| HP EliteBook 835 G9 | |
| Medio AMD Ryzen 5 PRO 6650U (548 - 578, n=4) | |
| Lenovo ThinkPad X13 G3 21CM002UGE | |
| Lenovo ThinkPad X13 G2 AMD 20XH001KGE | |
| Cinebench R15 / CPU Multi 64Bit | |
| Media de la clase Subnotebook (327 - 3345, n=57, últimos 2 años) | |
| HP EliteBook 835 G9 | |
| Medio AMD Ryzen 5 PRO 6650U (1299 - 1555, n=4) | |
| Dell Latitude 13 7330 | |
| Lenovo ThinkPad X13 G3 21CM002UGE | |
| Lenovo ThinkPad X13 G2 AMD 20XH001KGE | |
| Lenovo ThinkPad X13 G3 21BN0046GE | |
| Cinebench R15 / CPU Single 64Bit | |
| Media de la clase Subnotebook (72.4 - 322, n=57, últimos 2 años) | |
| Dell Latitude 13 7330 | |
| Medio AMD Ryzen 5 PRO 6650U (230 - 234, n=4) | |
| Lenovo ThinkPad X13 G3 21CM002UGE | |
| HP EliteBook 835 G9 | |
| Lenovo ThinkPad X13 G2 AMD 20XH001KGE | |
| Lenovo ThinkPad X13 G3 21BN0046GE | |
| Blender / v2.79 BMW27 CPU | |
| Lenovo ThinkPad X13 G3 21CM002UGE | |
| Lenovo ThinkPad X13 G3 21CM002UGE | |
| Lenovo ThinkPad X13 G3 21BN0046GE | |
| Lenovo ThinkPad X13 G2 AMD 20XH001KGE | |
| Medio AMD Ryzen 5 PRO 6650U (328 - 548, n=5) | |
| Dell Latitude 13 7330 | |
| Media de la clase Subnotebook (159 - 2271, n=58, últimos 2 años) | |
| HP EliteBook 835 G9 | |
| 7-Zip 18.03 / 7z b 4 | |
| HP EliteBook 835 G9 | |
| Media de la clase Subnotebook (11668 - 77867, n=57, últimos 2 años) | |
| Lenovo ThinkPad X13 G3 21BN0046GE | |
| Lenovo ThinkPad X13 G3 21CM002UGE | |
| Medio AMD Ryzen 5 PRO 6650U (32613 - 41530, n=4) | |
| Lenovo ThinkPad X13 G2 AMD 20XH001KGE | |
| Dell Latitude 13 7330 | |
| 7-Zip 18.03 / 7z b 4 -mmt1 | |
| Dell Latitude 13 7330 | |
| Media de la clase Subnotebook (2643 - 6699, n=59, últimos 2 años) | |
| HP EliteBook 835 G9 | |
| Medio AMD Ryzen 5 PRO 6650U (5175 - 5427, n=4) | |
| Lenovo ThinkPad X13 G3 21BN0046GE | |
| Lenovo ThinkPad X13 G3 21CM002UGE | |
| Lenovo ThinkPad X13 G2 AMD 20XH001KGE | |
| Geekbench 5.5 / Multi-Core | |
| Media de la clase Subnotebook (2557 - 17218, n=49, últimos 2 años) | |
| Lenovo ThinkPad X13 G3 21BN0046GE | |
| HP EliteBook 835 G9 | |
| Dell Latitude 13 7330 | |
| Medio AMD Ryzen 5 PRO 6650U (6171 - 7227, n=4) | |
| Lenovo ThinkPad X13 G3 21CM002UGE | |
| Lenovo ThinkPad X13 G2 AMD 20XH001KGE | |
| Geekbench 5.5 / Single-Core | |
| Media de la clase Subnotebook (726 - 2224, n=49, últimos 2 años) | |
| Dell Latitude 13 7330 | |
| HP EliteBook 835 G9 | |
| Lenovo ThinkPad X13 G3 21BN0046GE | |
| Medio AMD Ryzen 5 PRO 6650U (1433 - 1487, n=4) | |
| Lenovo ThinkPad X13 G3 21CM002UGE | |
| Lenovo ThinkPad X13 G2 AMD 20XH001KGE | |
| HWBOT x265 Benchmark v2.2 / 4k Preset | |
| Media de la clase Subnotebook (0.97 - 25.1, n=57, últimos 2 años) | |
| HP EliteBook 835 G9 | |
| Medio AMD Ryzen 5 PRO 6650U (8.71 - 11.8, n=4) | |
| Lenovo ThinkPad X13 G3 21CM002UGE | |
| Dell Latitude 13 7330 | |
| Lenovo ThinkPad X13 G2 AMD 20XH001KGE | |
| Lenovo ThinkPad X13 G3 21BN0046GE | |
| LibreOffice / 20 Documents To PDF | |
| Lenovo ThinkPad X13 G3 21CM002UGE | |
| Medio AMD Ryzen 5 PRO 6650U (50.3 - 63.2, n=4) | |
| HP EliteBook 835 G9 | |
| Media de la clase Subnotebook (39.9 - 220, n=56, últimos 2 años) | |
| Lenovo ThinkPad X13 G2 AMD 20XH001KGE | |
| Dell Latitude 13 7330 | |
| Lenovo ThinkPad X13 G3 21BN0046GE | |
| R Benchmark 2.5 / Overall mean | |
| Lenovo ThinkPad X13 G3 21CM002UGE | |
| Lenovo ThinkPad X13 G2 AMD 20XH001KGE | |
| Medio AMD Ryzen 5 PRO 6650U (0.521 - 0.59, n=4) | |
| Media de la clase Subnotebook (0.4024 - 1.456, n=58, últimos 2 años) | |
| Lenovo ThinkPad X13 G3 21BN0046GE | |
| HP EliteBook 835 G9 | |
| Dell Latitude 13 7330 | |
* ... más pequeño es mejor
AIDA64: FP32 Ray-Trace | FPU Julia | CPU SHA3 | CPU Queen | FPU SinJulia | FPU Mandel | CPU AES | CPU ZLib | FP64 Ray-Trace | CPU PhotoWorxx
| Performance rating | |
| Media de la clase Subnotebook | |
| HP EliteBook 835 G9 | |
| Medio AMD Ryzen 5 PRO 6650U | |
| Lenovo ThinkPad X13 G2 AMD 20XH001KGE | |
| Lenovo ThinkPad X13 G3 21CM002UGE | |
| Lenovo ThinkPad X13 G3 21BN0046GE | |
| Dell Latitude 13 7330 | |
| AIDA64 / FP32 Ray-Trace | |
| Media de la clase Subnotebook (1135 - 32888, n=58, últimos 2 años) | |
| HP EliteBook 835 G9 | |
| Medio AMD Ryzen 5 PRO 6650U (8854 - 10630, n=4) | |
| Lenovo ThinkPad X13 G3 21CM002UGE | |
| Lenovo ThinkPad X13 G2 AMD 20XH001KGE | |
| Lenovo ThinkPad X13 G3 21BN0046GE | |
| Dell Latitude 13 7330 | |
| AIDA64 / FPU Julia | |
| HP EliteBook 835 G9 | |
| Media de la clase Subnotebook (5218 - 123315, n=58, últimos 2 años) | |
| Medio AMD Ryzen 5 PRO 6650U (56214 - 68106, n=4) | |
| Lenovo ThinkPad X13 G3 21CM002UGE | |
| Lenovo ThinkPad X13 G2 AMD 20XH001KGE | |
| Lenovo ThinkPad X13 G3 21BN0046GE | |
| Dell Latitude 13 7330 | |
| AIDA64 / CPU SHA3 | |
| Media de la clase Subnotebook (444 - 5287, n=58, últimos 2 años) | |
| HP EliteBook 835 G9 | |
| Medio AMD Ryzen 5 PRO 6650U (1881 - 2326, n=4) | |
| Lenovo ThinkPad X13 G3 21BN0046GE | |
| Dell Latitude 13 7330 | |
| Lenovo ThinkPad X13 G3 21CM002UGE | |
| Lenovo ThinkPad X13 G2 AMD 20XH001KGE | |
| AIDA64 / CPU Queen | |
| HP EliteBook 835 G9 | |
| Medio AMD Ryzen 5 PRO 6650U (69023 - 78797, n=4) | |
| Lenovo ThinkPad X13 G3 21CM002UGE | |
| Lenovo ThinkPad X13 G2 AMD 20XH001KGE | |
| Dell Latitude 13 7330 | |
| Lenovo ThinkPad X13 G3 21BN0046GE | |
| Media de la clase Subnotebook (10579 - 95002, n=48, últimos 2 años) | |
| AIDA64 / FPU SinJulia | |
| HP EliteBook 835 G9 | |
| Medio AMD Ryzen 5 PRO 6650U (8320 - 9488, n=4) | |
| Lenovo ThinkPad X13 G3 21CM002UGE | |
| Lenovo ThinkPad X13 G2 AMD 20XH001KGE | |
| Media de la clase Subnotebook (744 - 18418, n=58, últimos 2 años) | |
| Lenovo ThinkPad X13 G3 21BN0046GE | |
| Dell Latitude 13 7330 | |
| AIDA64 / FPU Mandel | |
| HP EliteBook 835 G9 | |
| Medio AMD Ryzen 5 PRO 6650U (30969 - 37461, n=4) | |
| Media de la clase Subnotebook (3341 - 65433, n=58, últimos 2 años) | |
| Lenovo ThinkPad X13 G3 21CM002UGE | |
| Lenovo ThinkPad X13 G2 AMD 20XH001KGE | |
| Lenovo ThinkPad X13 G3 21BN0046GE | |
| Dell Latitude 13 7330 | |
| AIDA64 / CPU AES | |
| Lenovo ThinkPad X13 G2 AMD 20XH001KGE | |
| Medio AMD Ryzen 5 PRO 6650U (37259 - 93914, n=4) | |
| Media de la clase Subnotebook (638 - 96917, n=58, últimos 2 años) | |
| HP EliteBook 835 G9 | |
| Lenovo ThinkPad X13 G3 21BN0046GE | |
| Dell Latitude 13 7330 | |
| Lenovo ThinkPad X13 G3 21CM002UGE | |
| AIDA64 / CPU ZLib | |
| Media de la clase Subnotebook (164.9 - 1379, n=58, últimos 2 años) | |
| HP EliteBook 835 G9 | |
| Lenovo ThinkPad X13 G3 21BN0046GE | |
| Dell Latitude 13 7330 | |
| Medio AMD Ryzen 5 PRO 6650U (504 - 602, n=4) | |
| Lenovo ThinkPad X13 G3 21CM002UGE | |
| Lenovo ThinkPad X13 G2 AMD 20XH001KGE | |
| AIDA64 / FP64 Ray-Trace | |
| Media de la clase Subnotebook (610 - 17495, n=58, últimos 2 años) | |
| HP EliteBook 835 G9 | |
| Medio AMD Ryzen 5 PRO 6650U (4620 - 5468, n=4) | |
| Lenovo ThinkPad X13 G3 21CM002UGE | |
| Lenovo ThinkPad X13 G2 AMD 20XH001KGE | |
| Lenovo ThinkPad X13 G3 21BN0046GE | |
| Dell Latitude 13 7330 | |
| AIDA64 / CPU PhotoWorxx | |
| Media de la clase Subnotebook (6569 - 85600, n=58, últimos 2 años) | |
| Lenovo ThinkPad X13 G3 21BN0046GE | |
| HP EliteBook 835 G9 | |
| Lenovo ThinkPad X13 G3 21CM002UGE | |
| Medio AMD Ryzen 5 PRO 6650U (19643 - 26137, n=4) | |
| Dell Latitude 13 7330 | |
| Lenovo ThinkPad X13 G2 AMD 20XH001KGE | |
Rendimiento del sistema
En cuanto al rendimiento del sistema, el modelo AMD es mejor que su variante Intel. En el uso diario, el rendimiento es perfectamente bueno.
CrossMark: Overall | Productivity | Creativity | Responsiveness
| PCMark 10 / Score | |
| Media de la clase Subnotebook (4920 - 9939, n=46, últimos 2 años) | |
| HP EliteBook 835 G9 | |
| Lenovo ThinkPad X13 G2 AMD 20XH001KGE | |
| Medio AMD Ryzen 5 PRO 6650U, AMD Radeon 660M (5513 - 5958, n=4) | |
| Lenovo ThinkPad X13 G3 21CM002UGE | |
| Dell Latitude 13 7330 | |
| Lenovo ThinkPad X13 G3 21BN0046GE | |
| PCMark 10 / Essentials | |
| Dell Latitude 13 7330 | |
| Media de la clase Subnotebook (8552 - 11646, n=46, últimos 2 años) | |
| Lenovo ThinkPad X13 G2 AMD 20XH001KGE | |
| HP EliteBook 835 G9 | |
| Lenovo ThinkPad X13 G3 21CM002UGE | |
| Medio AMD Ryzen 5 PRO 6650U, AMD Radeon 660M (9578 - 9982, n=4) | |
| Lenovo ThinkPad X13 G3 21BN0046GE | |
| PCMark 10 / Productivity | |
| Media de la clase Subnotebook (5435 - 16606, n=46, últimos 2 años) | |
| Lenovo ThinkPad X13 G2 AMD 20XH001KGE | |
| HP EliteBook 835 G9 | |
| Medio AMD Ryzen 5 PRO 6650U, AMD Radeon 660M (7848 - 9094, n=4) | |
| Lenovo ThinkPad X13 G3 21CM002UGE | |
| Dell Latitude 13 7330 | |
| Lenovo ThinkPad X13 G3 21BN0046GE | |
| PCMark 10 / Digital Content Creation | |
| Media de la clase Subnotebook (5722 - 13779, n=46, últimos 2 años) | |
| HP EliteBook 835 G9 | |
| Medio AMD Ryzen 5 PRO 6650U, AMD Radeon 660M (5837 - 6447, n=4) | |
| Lenovo ThinkPad X13 G3 21CM002UGE | |
| Lenovo ThinkPad X13 G2 AMD 20XH001KGE | |
| Dell Latitude 13 7330 | |
| Lenovo ThinkPad X13 G3 21BN0046GE | |
| CrossMark / Overall | |
| Media de la clase Subnotebook (365 - 2356, n=60, últimos 2 años) | |
| Dell Latitude 13 7330 | |
| HP EliteBook 835 G9 | |
| Medio AMD Ryzen 5 PRO 6650U, AMD Radeon 660M (1338 - 1432, n=3) | |
| Lenovo ThinkPad X13 G3 21BN0046GE | |
| Lenovo ThinkPad X13 G3 21CM002UGE | |
| CrossMark / Productivity | |
| Media de la clase Subnotebook (364 - 2277, n=60, últimos 2 años) | |
| Dell Latitude 13 7330 | |
| HP EliteBook 835 G9 | |
| Medio AMD Ryzen 5 PRO 6650U, AMD Radeon 660M (1366 - 1440, n=3) | |
| Lenovo ThinkPad X13 G3 21CM002UGE | |
| Lenovo ThinkPad X13 G3 21BN0046GE | |
| CrossMark / Creativity | |
| Media de la clase Subnotebook (372 - 2743, n=60, últimos 2 años) | |
| Dell Latitude 13 7330 | |
| Lenovo ThinkPad X13 G3 21BN0046GE | |
| Medio AMD Ryzen 5 PRO 6650U, AMD Radeon 660M (1397 - 1517, n=3) | |
| HP EliteBook 835 G9 | |
| Lenovo ThinkPad X13 G3 21CM002UGE | |
| CrossMark / Responsiveness | |
| Media de la clase Subnotebook (312 - 1854, n=60, últimos 2 años) | |
| Lenovo ThinkPad X13 G3 21BN0046GE | |
| Dell Latitude 13 7330 | |
| HP EliteBook 835 G9 | |
| Medio AMD Ryzen 5 PRO 6650U, AMD Radeon 660M (1106 - 1229, n=3) | |
| Lenovo ThinkPad X13 G3 21CM002UGE | |
| PCMark 10 Score | 5685 puntos | |
ayuda | ||
| AIDA64 / Memory Copy | |
| Media de la clase Subnotebook (14554 - 131023, n=58, últimos 2 años) | |
| Lenovo ThinkPad X13 G3 21BN0046GE | |
| Lenovo ThinkPad X13 G3 21CM002UGE | |
| HP EliteBook 835 G9 | |
| Medio AMD Ryzen 5 PRO 6650U (31014 - 48558, n=4) | |
| Dell Latitude 13 7330 | |
| Lenovo ThinkPad X13 G2 AMD 20XH001KGE | |
| AIDA64 / Memory Read | |
| Media de la clase Subnotebook (15948 - 127174, n=58, últimos 2 años) | |
| Lenovo ThinkPad X13 G3 21BN0046GE | |
| HP EliteBook 835 G9 | |
| Dell Latitude 13 7330 | |
| Lenovo ThinkPad X13 G3 21CM002UGE | |
| Medio AMD Ryzen 5 PRO 6650U (34690 - 39833, n=4) | |
| Lenovo ThinkPad X13 G2 AMD 20XH001KGE | |
| AIDA64 / Memory Write | |
| Media de la clase Subnotebook (15709 - 135141, n=58, últimos 2 años) | |
| Lenovo ThinkPad X13 G3 21BN0046GE | |
| Lenovo ThinkPad X13 G3 21CM002UGE | |
| HP EliteBook 835 G9 | |
| Medio AMD Ryzen 5 PRO 6650U (34563 - 51117, n=4) | |
| Dell Latitude 13 7330 | |
| Lenovo ThinkPad X13 G2 AMD 20XH001KGE | |
| AIDA64 / Memory Latency | |
| Lenovo ThinkPad X13 G3 21CM002UGE | |
| Medio AMD Ryzen 5 PRO 6650U (91.6 - 126.5, n=4) | |
| Lenovo ThinkPad X13 G2 AMD 20XH001KGE | |
| Media de la clase Subnotebook (6.1 - 159.9, n=56, últimos 2 años) | |
| HP EliteBook 835 G9 | |
| Lenovo ThinkPad X13 G3 21BN0046GE | |
| Dell Latitude 13 7330 | |
* ... más pequeño es mejor
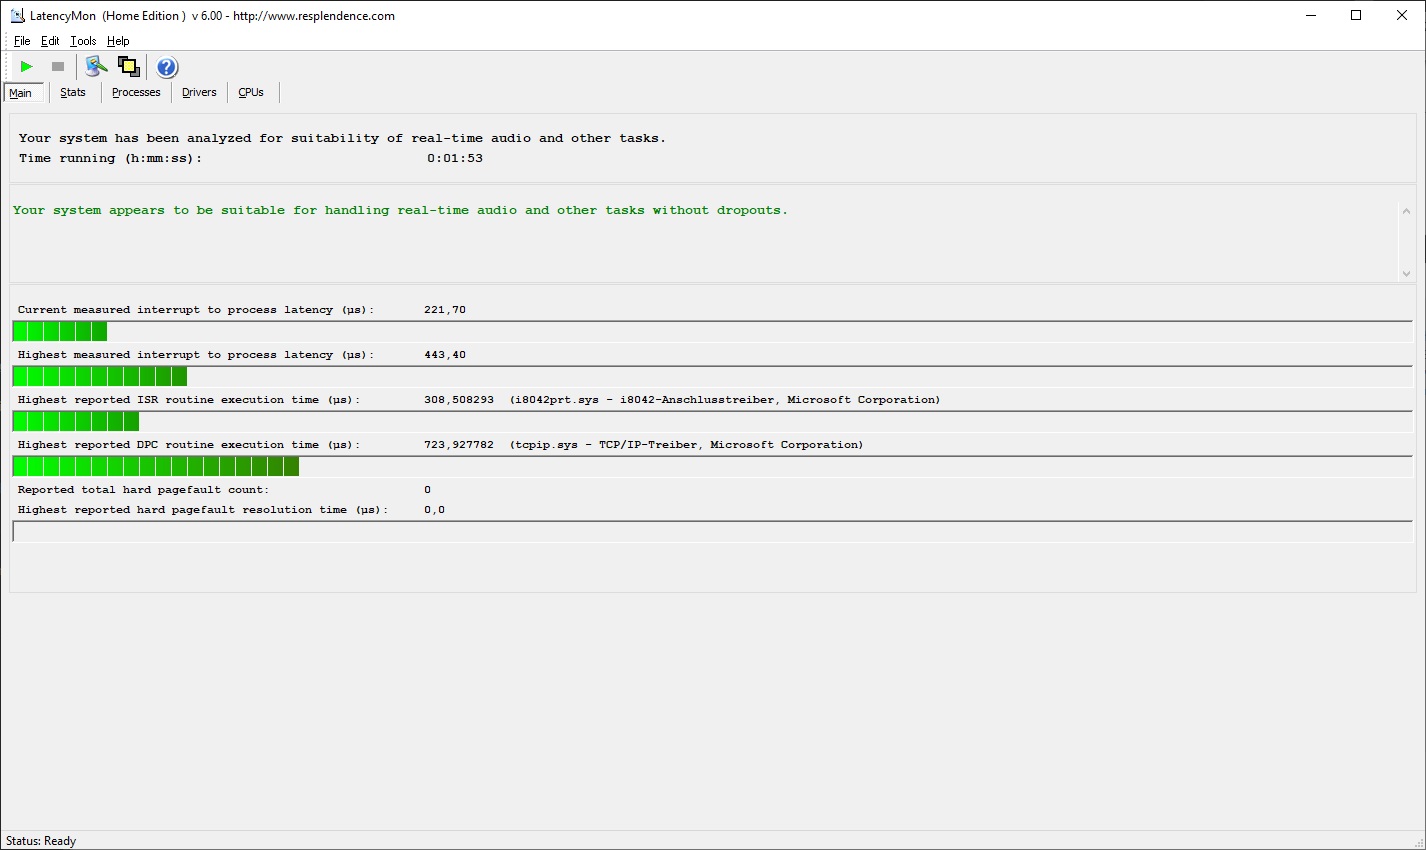
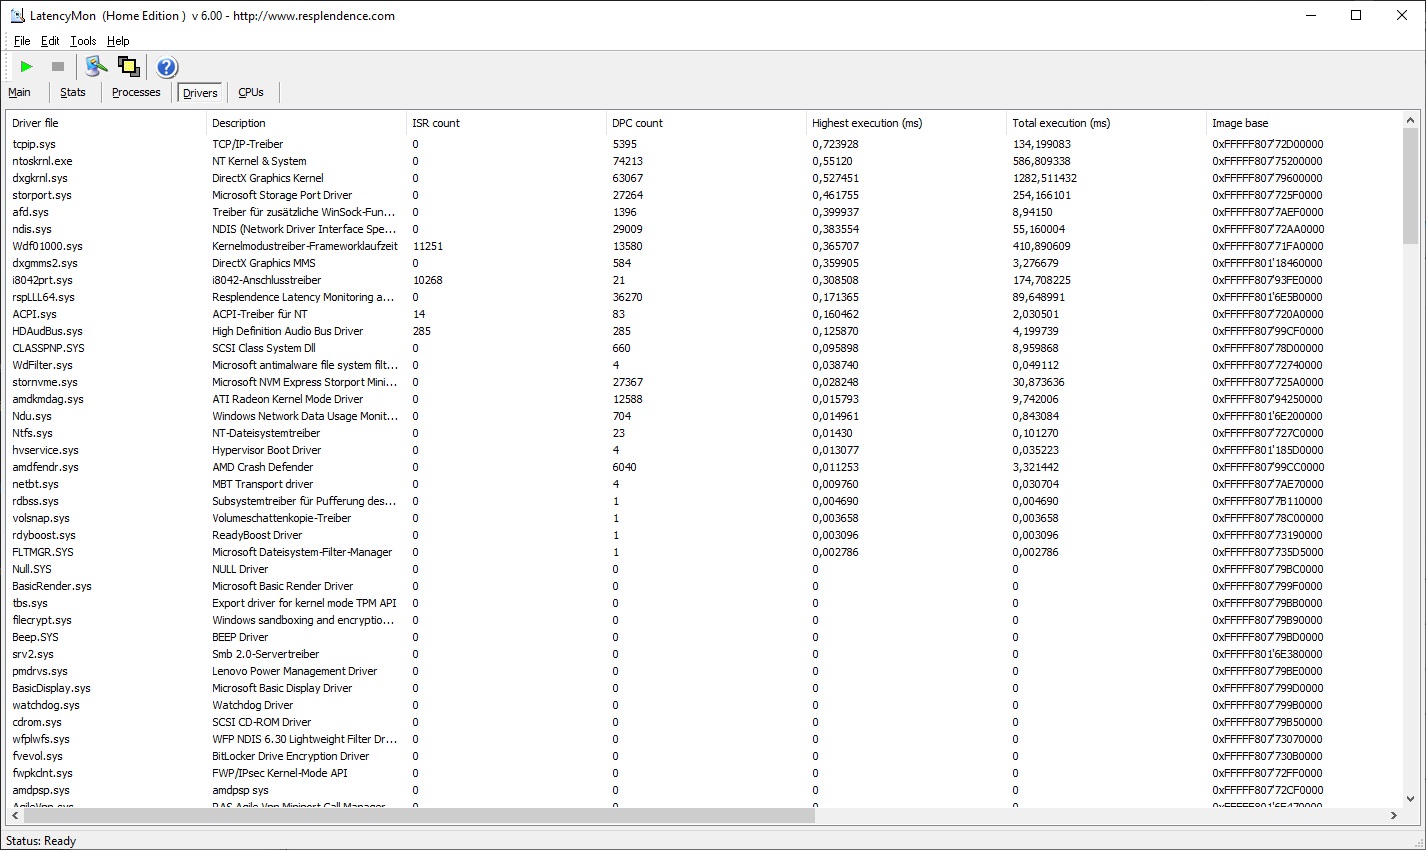
Latencia del CPD
En la configuración probada, el Lenovo ThinkPad X13 Gen 3 AMD no tuvo problemas de latencia del CPD.
| DPC Latencies / LatencyMon - interrupt to process latency (max), Web, Youtube, Prime95 | |
| Lenovo ThinkPad X13 G2 AMD 20XH001KGE | |
| Lenovo ThinkPad X13 G3 21BN0046GE | |
| HP EliteBook 835 G9 | |
| Dell Latitude 13 7330 | |
| Lenovo ThinkPad X13 G3 21CM002UGE | |
* ... más pequeño es mejor
Almacenamiento
El SSD M.2 2280 del Lenovo ThinkPad X13 G3 AMD viene de Samsung. El PM9A1 tiene una capacidad de 512 GB y está conectado a través del estándar NVMe PCIe 4.0. Este SSD podría ser aún más rápido, pero sigue funcionando más rápido en el X13 G3 comparado con los SSDs de los dispositivos de la comparación.

* ... más pequeño es mejor
Sustained load read: DiskSpd Read Loop, Queue Depth 8
Tarjeta gráfica
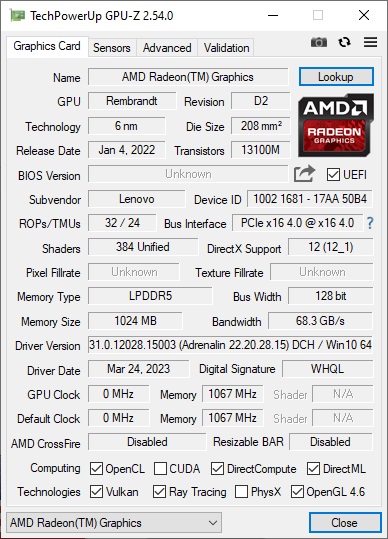
EnAMD Radeon 660M es la solución gráfica estándar de la clase Ryzen 5. Como GPU integrada, la Radeon 660M no tiene memoria propia, tiene que depender de la memoria principal del sistema. La conclusión lógica: el rendimiento de la GPU depende de la velocidad de la RAM y de si la RAM funciona en modo canal simple o dual.
En el ThinkPad X13 G3 AMD, la iGPU puede depender de la rápida memoria LPDDR5-6400, que funciona en modo de doble canal. Esas son más o menos las condiciones ideales, y el ThinkPad X13 Gen 3 está muy por delante de los modelos Intel con i5 y su propio predecesor. De nuevo, el HP EliteBook 835 G9con la potente Radeon 680M queda por delante del ThinkPad.
Este portátil de empresa no está hecho para jugar, aunque los juegos recientes siguen siendo jugables - a bajo rendimiento.
Como la CPU, la GPU ofrece el 100% de su rendimiento en modo batería.
| 3DMark 11 Performance | 7067 puntos | |
| 3DMark Cloud Gate Standard Score | 21798 puntos | |
| 3DMark Fire Strike Score | 4472 puntos | |
| 3DMark Time Spy Score | 1729 puntos | |
ayuda | ||
* ... más pequeño es mejor
| The Witcher 3 - 1920x1080 Ultra Graphics & Postprocessing (HBAO+) | |
| Media de la clase Subnotebook (13.9 - 34.6, n=12, últimos 2 años) | |
| HP EliteBook 835 G9 | |
| Lenovo ThinkPad X13 G3 21CM002UGE | |
| Dell Latitude 13 7330 | |
| Lenovo ThinkPad X13 G3 21BN0046GE | |
| Final Fantasy XV Benchmark - 1920x1080 High Quality | |
| Media de la clase Subnotebook (11.6 - 54.5, n=54, últimos 2 años) | |
| HP EliteBook 835 G9 | |
| Lenovo ThinkPad X13 G3 21BN0046GE | |
| Lenovo ThinkPad X13 G3 21CM002UGE | |
| Dell Latitude 13 7330 | |
| Strange Brigade - 1920x1080 ultra AA:ultra AF:16 | |
| Media de la clase Subnotebook (19 - 101.3, n=50, últimos 2 años) | |
| HP EliteBook 835 G9 | |
| Lenovo ThinkPad X13 G3 21CM002UGE | |
| Lenovo ThinkPad X13 G2 AMD 20XH001KGE | |
| Dell Latitude 13 7330 | |
| Lenovo ThinkPad X13 G3 21BN0046GE | |
| Dota 2 Reborn - 1920x1080 ultra (3/3) best looking | |
| Media de la clase Subnotebook (13 - 97, n=61, últimos 2 años) | |
| HP EliteBook 835 G9 | |
| Lenovo ThinkPad X13 G2 AMD 20XH001KGE | |
| Dell Latitude 13 7330 | |
| Lenovo ThinkPad X13 G3 21BN0046GE | |
| Lenovo ThinkPad X13 G3 21CM002UGE | |
Witcher 3 FPS graph
| bajo | medio | alto | ultra | |
|---|---|---|---|---|
| GTA V (2015) | 118.8 | 103.2 | 36.4 | 14.2 |
| The Witcher 3 (2015) | 86.7 | 27.6 | 17.9 | |
| Dota 2 Reborn (2015) | 93.7 | 72.2 | 37.4 | 32.8 |
| Final Fantasy XV Benchmark (2018) | 45.5 | 21.9 | 16 | |
| X-Plane 11.11 (2018) | 36 | 24.2 | 22.1 | |
| Strange Brigade (2018) | 99.5 | 40 | 31.5 | 26.7 |
| F1 22 (2022) | 42.4 | 37 | 26.2 | 5.13 |
Emisiones: El ThinkPad X13 es fresco y silencioso
Ruido
El Lenovo ThinkPad X13 G3 AMD es un portátil bastante silencioso. En casi todos los casos, es menos ruidoso que la competencia. Sin embargo, hay que tener en cuenta que el predecesor directo X13 Gen 2 AMDera incluso menos ruidoso.
Detectamos un leve silbido al usar el ThinkPad, pero sólo se notaba al poner la oreja directamente sobre el teclado. No obstante, los oídos sensibles podrían molestarse.
Ruido
| Ocioso |
| 23.1 / 23.1 / 23.1 dB(A) |
| Carga |
| 27 / 35.5 dB(A) |
 | ||
30 dB silencioso 40 dB(A) audible 50 dB(A) ruidosamente alto |
||
min: | ||
| Lenovo ThinkPad X13 G3 21CM002UGE Radeon 660M, R5 PRO 6650U, Samsung PM9A1 MZVL2512HCJQ | Lenovo ThinkPad X13 G2 AMD 20XH001KGE Vega 7, R5 PRO 5650U, Samsung SSD PM981a MZVLB512HBJQ | HP EliteBook 835 G9 Radeon 680M, R7 PRO 6850U, Kioxia BG5 KBG50ZNV512G | Dell Latitude 13 7330 Iris Xe G7 96EUs, i7-1265U, Toshiba KBG40ZNS512G NVMe | Lenovo ThinkPad X13 G3 21BN0046GE Iris Xe G7 80EUs, i5-1235U, SK Hynix HFS512 GDE9X081N | |
|---|---|---|---|---|---|
| Noise | -3% | -13% | -9% | -4% | |
| apagado / medio ambiente * (dB) | 23.1 | 24.17 -5% | 26 -13% | 23.4 -1% | 24.6 -6% |
| Idle Minimum * (dB) | 23.1 | 24.17 -5% | 26 -13% | 23.4 -1% | 24.6 -6% |
| Idle Average * (dB) | 23.1 | 24.17 -5% | 27 -17% | 23.4 -1% | 24.6 -6% |
| Idle Maximum * (dB) | 23.1 | 24.17 -5% | 28 -21% | 23.4 -1% | 25.9 -12% |
| Load Average * (dB) | 27 | 29.92 -11% | 35 -30% | 37.8 -40% | 30.7 -14% |
| Witcher 3 ultra * (dB) | 38.7 | 37 4% | 39.2 -1% | 34.6 11% | |
| Load Maximum * (dB) | 35.5 | 31.52 11% | 37 -4% | 43 -21% | 34.6 3% |
* ... más pequeño es mejor
Calor
El Lenovo ThinkPad X13 Gen 3 no se calienta mucho. Incluso a plena carga, las temperaturas del chasis apenas superan los 40º Celsius.
Durante el test de estrés, el procesador puede aguantar un consumo de energía de 20 W. No pudimos detectar ralentización.
(+) La temperatura máxima en la parte superior es de 38.1 °C / 101 F, frente a la media de 35.9 °C / 97 F, que oscila entre 21.4 y 59 °C para la clase Subnotebook.
(±) El fondo se calienta hasta un máximo de 40.1 °C / 104 F, frente a la media de 39.2 °C / 103 F
(+) En reposo, la temperatura media de la parte superior es de 30.9 °C / 88# F, frente a la media del dispositivo de 30.8 °C / 87 F.
(±) Jugando a The Witcher 3, la temperatura media de la parte superior es de 34.3 °C / 94 F, frente a la media del dispositivo de 30.8 °C / 87 F.
(+) El reposamanos y el panel táctil están a una temperatura inferior a la de la piel, con un máximo de 31.6 °C / 88.9 F y, por tanto, son fríos al tacto.
(-) La temperatura media de la zona del reposamanos de dispositivos similares fue de 28.2 °C / 82.8 F (-3.4 °C / -6.1 F).
| Lenovo ThinkPad X13 G3 21CM002UGE AMD Ryzen 5 PRO 6650U, AMD Radeon 660M | Lenovo ThinkPad X13 G2 AMD 20XH001KGE AMD Ryzen 5 PRO 5650U, AMD Radeon RX Vega 7 | HP EliteBook 835 G9 AMD Ryzen 7 PRO 6850U, AMD Radeon 680M | Dell Latitude 13 7330 Intel Core i7-1265U, Intel Iris Xe Graphics G7 96EUs | Lenovo ThinkPad X13 G3 21BN0046GE Intel Core i5-1235U, Intel Iris Xe Graphics G7 80EUs | |
|---|---|---|---|---|---|
| Heat | 9% | 4% | 12% | -4% | |
| Maximum Upper Side * (°C) | 38.1 | 43.7 -15% | 46 -21% | 38.6 -1% | 45.3 -19% |
| Maximum Bottom * (°C) | 40.1 | 38 5% | 49 -22% | 42 -5% | 41.8 -4% |
| Idle Upper Side * (°C) | 33.6 | 25.8 23% | 24 29% | 23.8 29% | 31.6 6% |
| Idle Bottom * (°C) | 33.4 | 26.2 22% | 24 28% | 24.6 26% | 32.6 2% |
* ... más pequeño es mejor
Altavoces
Los altavoces orientados hacia el usuario emiten un sonido de calidad media, sin base: sólo en la parte alta del espectro de ondas sonoras, el sonido es equilibrado. Los altavoces delHP EliteBook 835 G9no son mucho mejores, pero al menos ligeramente más fuertes.
Lenovo ThinkPad X13 G3 21CM002UGE análisis de audio
(±) | la sonoridad del altavoz es media pero buena (76.1 dB)
Graves 100 - 315 Hz
(-) | casi sin bajos - de media 24% inferior a la mediana
(±) | la linealidad de los graves es media (14.2% delta a frecuencia anterior)
Medios 400 - 2000 Hz
(+) | medios equilibrados - a sólo 2.9% de la mediana
(+) | los medios son lineales (2.8% delta a la frecuencia anterior)
Altos 2 - 16 kHz
(+) | máximos equilibrados - a sólo 2.7% de la mediana
(+) | los máximos son lineales (3.9% delta a la frecuencia anterior)
Total 100 - 16.000 Hz
(±) | la linealidad del sonido global es media (19.3% de diferencia con la mediana)
En comparación con la misma clase
» 60% de todos los dispositivos probados de esta clase eran mejores, 7% similares, 34% peores
» El mejor tuvo un delta de 5%, la media fue 18%, el peor fue ###max##%
En comparación con todos los dispositivos probados
» 47% de todos los dispositivos probados eran mejores, 8% similares, 46% peores
» El mejor tuvo un delta de 4%, la media fue 23%, el peor fue ###max##%
HP EliteBook 835 G9 análisis de audio
(±) | la sonoridad del altavoz es media pero buena (79 dB)
Graves 100 - 315 Hz
(-) | casi sin bajos - de media 17.8% inferior a la mediana
(±) | la linealidad de los graves es media (11.2% delta a frecuencia anterior)
Medios 400 - 2000 Hz
(+) | medios equilibrados - a sólo 1.7% de la mediana
(+) | los medios son lineales (3.2% delta a la frecuencia anterior)
Altos 2 - 16 kHz
(+) | máximos equilibrados - a sólo 3.2% de la mediana
(±) | la linealidad de los máximos es media (8% delta a frecuencia anterior)
Total 100 - 16.000 Hz
(+) | el sonido global es lineal (14.7% de diferencia con la mediana)
En comparación con la misma clase
» 31% de todos los dispositivos probados de esta clase eran mejores, 5% similares, 64% peores
» El mejor tuvo un delta de 5%, la media fue 18%, el peor fue ###max##%
En comparación con todos los dispositivos probados
» 19% de todos los dispositivos probados eran mejores, 4% similares, 77% peores
» El mejor tuvo un delta de 4%, la media fue 23%, el peor fue ###max##%
Gestión de la energía: Lenovo ThinkPad eficiente
Consumo de energía
El portátil Lenovo puede presumir de un consumo de energía bastante bajo, todos los dispositivos de análisis funcionan con menos eficiencia de media. Especialmente en ralentí, la diferencia es importante. En esta área, elHP EliteBook 835 G9es notablemente peor.
El consumo máximo de 49.1 W está bien dentro de la capacidad del cargador de 65 W.
| Off / Standby | |
| Ocioso | |
| Carga |
|
Clave:
min: | |
| Lenovo ThinkPad X13 G3 21CM002UGE R5 PRO 6650U, Radeon 660M, Samsung PM9A1 MZVL2512HCJQ, IPS LED, 1920x1200, 13.3" | Lenovo ThinkPad X13 G2 AMD 20XH001KGE R5 PRO 5650U, Vega 7, Samsung SSD PM981a MZVLB512HBJQ, IPS LED, 1920x1200, 13.3" | HP EliteBook 835 G9 R7 PRO 6850U, Radeon 680M, Kioxia BG5 KBG50ZNV512G, IPS, 1920x1200, 13.3" | Dell Latitude 13 7330 i7-1265U, Iris Xe G7 96EUs, Toshiba KBG40ZNS512G NVMe, IPS, 1920x1080, 13.3" | Lenovo ThinkPad X13 G3 21BN0046GE i5-1235U, Iris Xe G7 80EUs, SK Hynix HFS512 GDE9X081N, IPS Grade, 1920x1200, 13.3" | Medio AMD Radeon 660M | Media de la clase Subnotebook | |
|---|---|---|---|---|---|---|---|
| Power Consumption | -7% | -33% | -10% | -7% | -38% | -26% | |
| Idle Minimum * (Watt) | 3.2 | 3.82 -19% | 5 -56% | 2.8 13% | 2.7 16% | 4.68 ? -46% | 3.71 ? -16% |
| Idle Average * (Watt) | 5.2 | 5.74 -10% | 6 -15% | 4.8 8% | 5.2 -0% | 7.08 ? -36% | 6.54 ? -26% |
| Idle Maximum * (Watt) | 6.1 | 7.65 -25% | 11 -80% | 7.3 -20% | 6.2 -2% | 9.12 ? -50% | 7.89 ? -29% |
| Load Average * (Watt) | 33.6 | 35.79 -7% | 45 -34% | 48.1 -43% | 38.4 -14% | 44.2 ? -32% | 42.1 ? -25% |
| Witcher 3 ultra * (Watt) | 39.3 | 35.6 9% | 45.2 -15% | 35.4 10% | 41.9 -7% | ||
| Load Maximum * (Watt) | 49.1 | 45.04 8% | 48 2% | 63.6 -30% | 66.7 -36% | 62.4 ? -27% | 65.1 ? -33% |
* ... más pequeño es mejor
Power consumption Witcher 3 / stress test
Energieaufnahme mit externem Monitor
Duración de la batería
La batería interna sigue teniendo una capacidad de 54,7 Wh, aunque también hay una variante con 41 Wh. El modelo que probamos logró grandes duraciones de batería: Las 12 horas y 30 minutos en el test WiFi (brillo de pantalla de 150 cd/m²) ya son formidables, pero las 10 horas y 40 minutos en el mismo test con brillo de pantalla máximo son incluso mejores en términos relativos. El ThinkPad X13 G3 AMD es un dispositivo capaz de durar toda la jornada laboral.
| Lenovo ThinkPad X13 G3 21CM002UGE R5 PRO 6650U, Radeon 660M, 54.7 Wh | Lenovo ThinkPad X13 G2 AMD 20XH001KGE R5 PRO 5650U, Vega 7, 54.7 Wh | HP EliteBook 835 G9 R7 PRO 6850U, Radeon 680M, 51 Wh | Dell Latitude 13 7330 i7-1265U, Iris Xe G7 96EUs, 41 Wh | Lenovo ThinkPad X13 G3 21BN0046GE i5-1235U, Iris Xe G7 80EUs, 54.7 Wh | Media de la clase Subnotebook | |
|---|---|---|---|---|---|---|
| Duración de Batería | -17% | -27% | -21% | 8% | 23% | |
| WiFi v1.3 (h) | 12.5 | 9.3 -26% | 9.1 -27% | 8.3 -34% | 10.2 -18% | 14.1 ? 13% |
| Load (h) | 1.5 | 1.4 -7% | 1.1 -27% | 1.4 -7% | 2 33% | 1.998 ? 33% |
Pro
Contra
Veredicto: El ThinkPad X13 AMD sigue siendo un subportátil muy bueno

Con el Lenovo ThinkPad X13 Gen 3 AMD, el fabricante mejora un portátil que ya era muy bueno, elLenovo ThinkPad X13 Gen 2. El nuevo modelo tiene todos los aspectos que hicieron bueno al anterior, pero añade USB4 y Rembrandt. Lógicamente, no es de extrañar que el nuevo modelo también alcance una muy buena puntuación.
Además de los puntos fuertes existentes, como el chasis robusto y ligero, los agradables dispositivos de entrada y las buenas opciones de conectividad, el nuevo modelo tiene una duración de batería mejorada. El ThinkPad X13 Gen 3 alcanza un buen rendimiento y sigue funcionando de forma fresca y silenciosa, lo que no es un hecho cuando se compara con la competencia Intel.
Por supuesto, aún hay espacio para mejoras. El brillo de la pantalla podría ser mejor, especialmente teniendo en cuenta a la competencia. También nos gustaría ver una webcam de mayor resolución, así como RAM actualizable. Además, las tasas de carga WiFi fueron bastante bajas.
Compacto, potente, batería de larga duración, fresco y silencioso: el Lenovo ThinkPad X13 Gen 3 AMD combina muchos atributos positivos.
Esto es sobre todo una crítica de alto nivel. Si estás buscando un dispositivo de trabajo rápido, ultra-móvil, que dure todo el día, el ThinkPad X13 G3 AMD debería ser definitivamente un contendiente. Lo mismo puede decirse del HP EliteBook 835 G9 - los compradores delDell Latitude 7330tienen que vérselas con las CPU Intel, que ofrecen un mejor rendimiento en un solo núcleo, pero son menos eficientes por lo demás. ElLenovo ThinkPad X13 Gen 4con AMD Phoenix ya está en el horizonte, pero aún no está disponible - comprar el predecesor definitivamente no es una mala elección.
Precios y disponibilidad
Amazon ofrece el Lenovo ThinkPad X13 G3 AMD por 1.200 dólares.
Lenovo ThinkPad X13 G3 21CM002UGE
- 06/27/2023 v7 (old)
Benjamin Herzig
Transparencia
La selección de los dispositivos que se van a reseñar corre a cargo de nuestro equipo editorial. La muestra de prueba fue proporcionada al autor en calidad de préstamo por el fabricante o el minorista a los efectos de esta reseña. El prestamista no tuvo ninguna influencia en esta reseña, ni el fabricante recibió una copia de la misma antes de su publicación. No había ninguna obligación de publicar esta reseña. Como empresa de medios independiente, Notebookcheck no está sujeta a la autoridad de fabricantes, minoristas o editores.
Así es como prueba Notebookcheck
Cada año, Notebookcheck revisa de forma independiente cientos de portátiles y smartphones utilizando procedimientos estandarizados para asegurar que todos los resultados son comparables. Hemos desarrollado continuamente nuestros métodos de prueba durante unos 20 años y hemos establecido los estándares de la industria en el proceso. En nuestros laboratorios de pruebas, técnicos y editores experimentados utilizan equipos de medición de alta calidad. Estas pruebas implican un proceso de validación en varias fases. Nuestro complejo sistema de clasificación se basa en cientos de mediciones y puntos de referencia bien fundamentados, lo que mantiene la objetividad.Price comparison

