Estreno del Intel Core i7-1265U: Análisis del portátil Dell Latitude 13 7330 de 1 kg
No confundir con el Dell Latitude 7330 Ruggedel Latitude 7330 es un portátil más tradicional para oficinas y empresas. Viene en las opciones clamshell y convertible 2-en-1, cada una con opciones similares de CPU Intel Core-U de 12ª generación, puertos y diseño general del chasis, pero con diferentes opciones de pantalla y material del chasis para elegir. Recomendamos consultar la página del producto o el PDF técnico disponible públicamente en https://www.delltechnologies.com/asset/en-us/products/laptops-and-2-in-1s/technical-support/latitude-7x30-spec-sheet.pdf para el Latitude 7330 ya que ofrece más opciones configurables que la mayoría de los otros portátiles que van desde diferentes cámaras web, tamaños de batería, WAN, e incluso lectores MicroSD
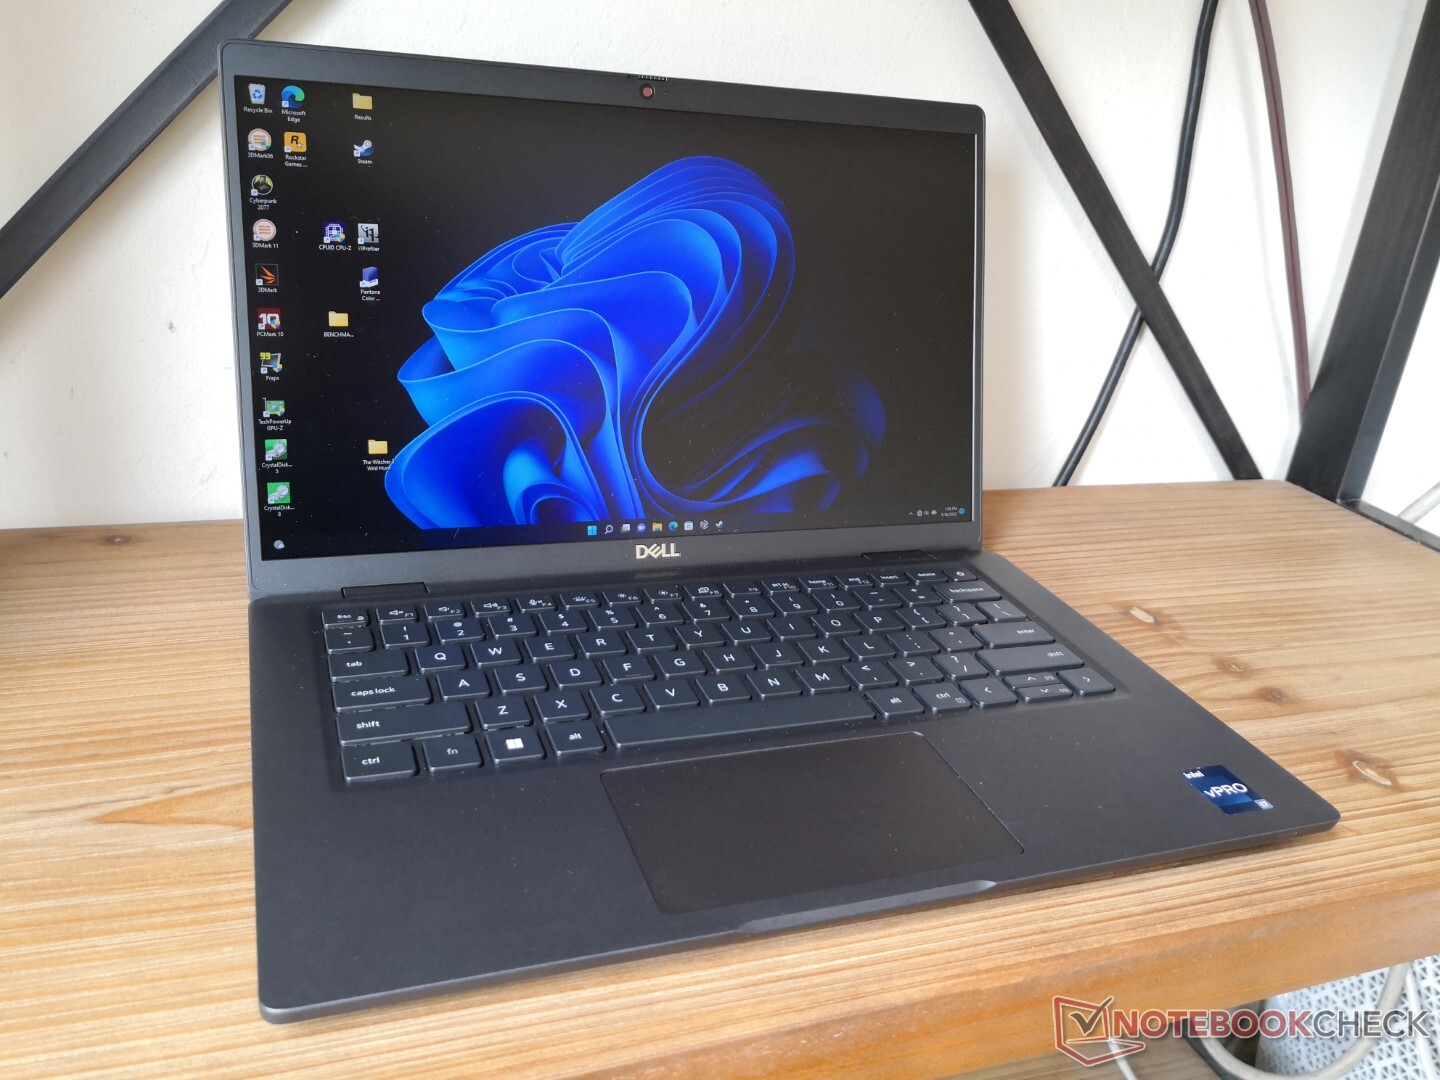
Nuestra unidad de revisión específica es el Latitude 7330 clamshell de aleación de magnesio que tiene como objetivo un peso de sólo 1 kg para ser uno de los portátiles de negocios de 13,3 pulgadas más ligeros del mercado. Algunos otros portátiles también han prometido diseños superligeros similares en el pasado, como la Serie LG Gram, La serie Samsung Galaxy Book Pro, HP Elite Dragonflyo la serie Toshiba Portege serie Z todos los cuales sirven como alternativas al Latitude 7330. Nuestra configuración revisada tiene un precio de venta al público de aproximadamente $2000 USD.
Más opiniones de Dell
Posibles contendientes en la comparación
Valoración | Fecha | Modelo | Peso | Altura | Tamaño | Resolución | Precio |
|---|---|---|---|---|---|---|---|
| 89 % v7 (old) | 07/2022 | Dell Latitude 13 7330 i7-1265U, Iris Xe G7 96EUs | 1 kg | 16.96 mm | 13.30" | 1920x1080 | |
| 87.9 % v7 (old) | 10/2020 | Lenovo ThinkPad X13 Yoga 20SX0004GE i7-10510U, UHD Graphics 620 | 1.3 kg | 15.95 mm | 13.30" | 1920x1080 | |
| 85.1 % v7 (old) | 07/2022 | Framework Laptop 13.5 12th Gen Intel i7-1260P, Iris Xe G7 96EUs | 1.3 kg | 15.85 mm | 13.50" | 2256x1504 | |
| 86.6 % v7 (old) | 12/2020 | Razer Book 13 FHD i7-1165G7, Iris Xe G7 96EUs | 1.4 kg | 15.15 mm | 13.40" | 1920x1200 | |
| 89.4 % v7 (old) | 07/2020 | Dell Latitude 7310 i7-10610U, UHD Graphics 620 | 1.2 kg | 18.3 mm | 13.30" | 1920x1080 | |
| 85.2 % v7 (old) | 05/2021 | Microsoft Surface Laptop 4 13 Ryzen 5 R5 4680U, Vega 7 | 1.3 kg | 14 mm | 13.50" | 2256x1504 |
Caso - Tres opciones diferentes
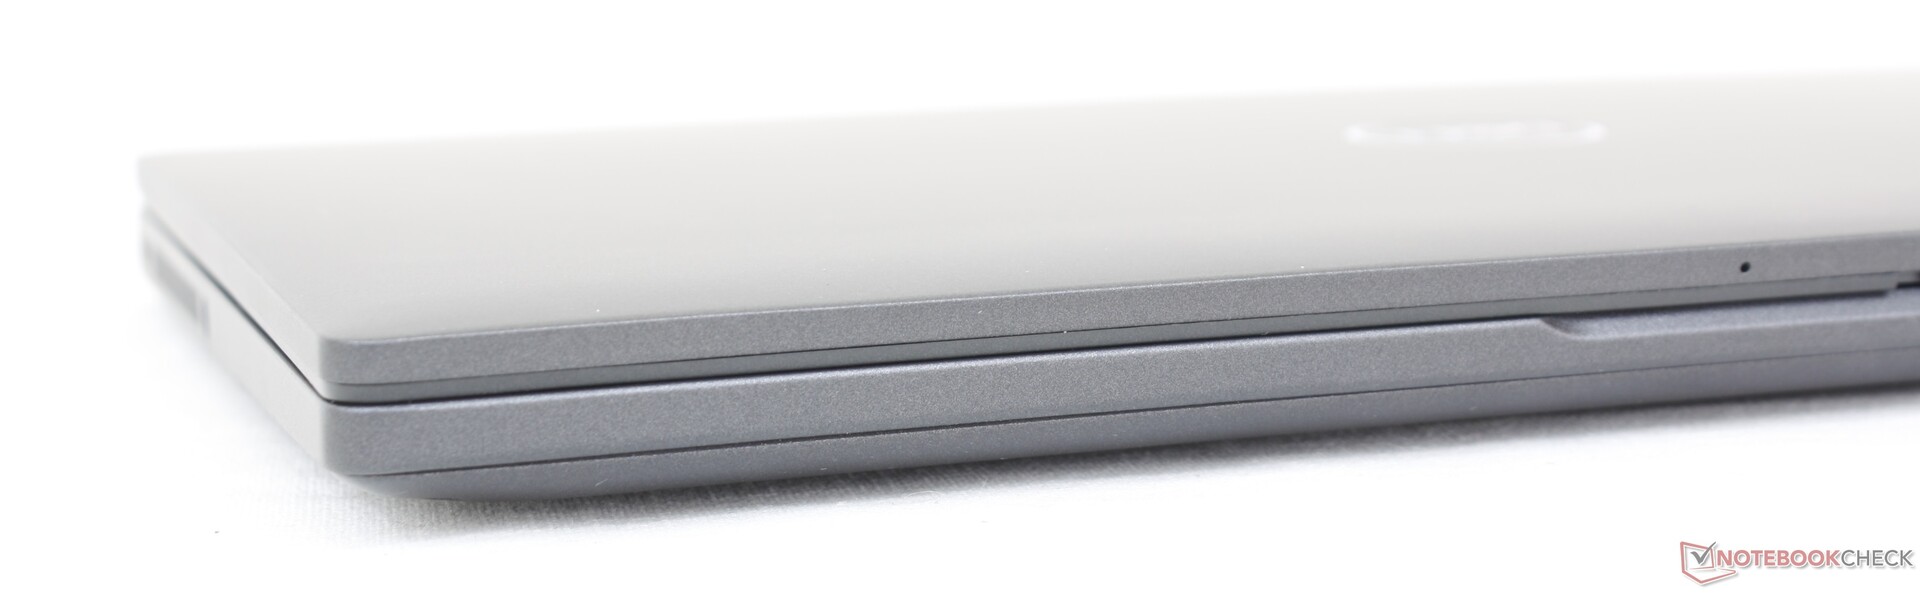
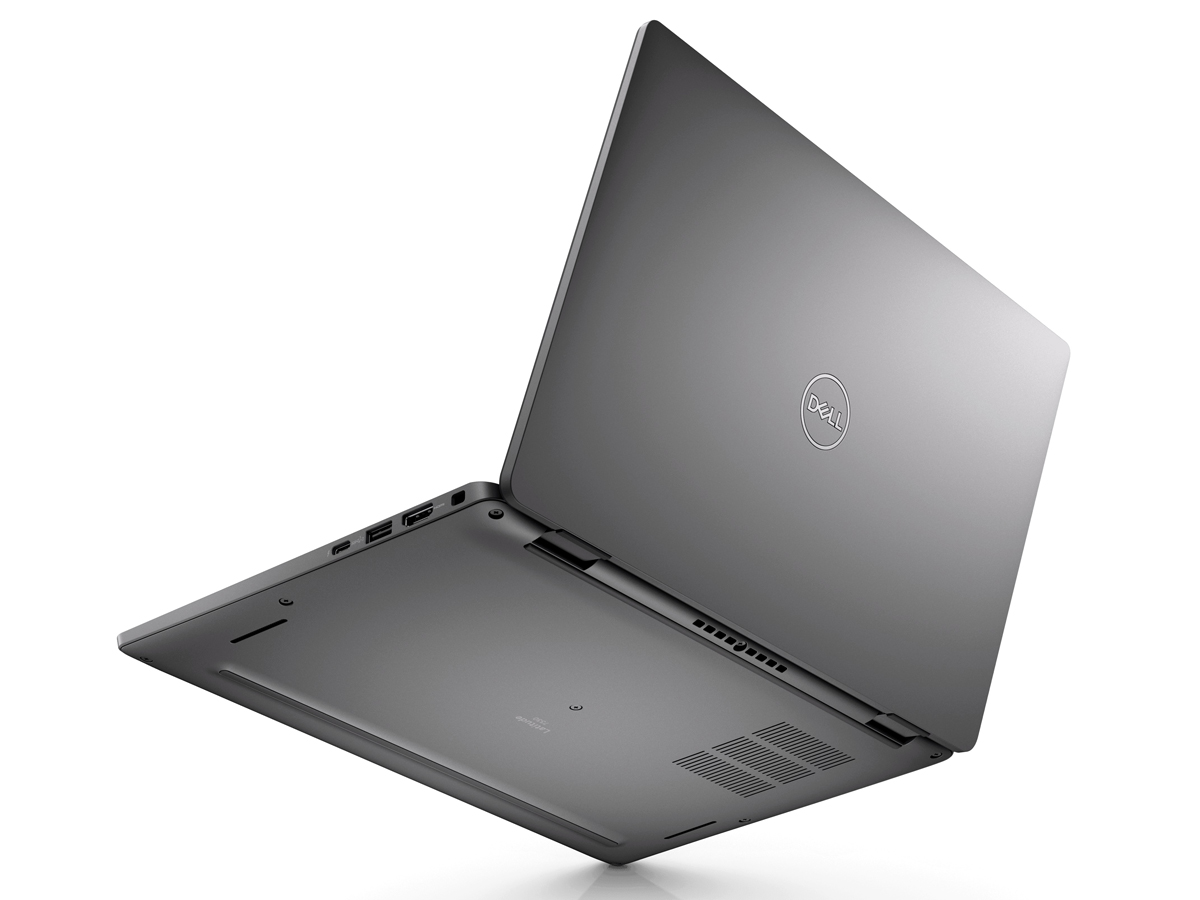
ya existen portátiles de 13 pulgadas que prometen pesar 1 kg o incluso menos, pero casi siempre vienen con algunas advertencias. La más notable es que estos modelos suelen ser mucho más flexibles, lo que da una impresión general de menor durabilidad. Dedica un minuto al LG Gram 13 en comparación con el más pesado Dell XPS 13 9310 y las diferencias de delgadez en sus esqueletos se hacen notar inmediatamente. El Latitude 7330 ha evitado de alguna manera la tendencia al ser más rígido de lo esperado para una construcción de 1 kg. La base, por ejemplo, no se tuerce o dobla tanto como en el mencionado LG. La rigidez general se sitúa en algún punto entre el Gram 13 y el XPS 13, lo que consideramos una compensación justa si se valora el peso superligero.
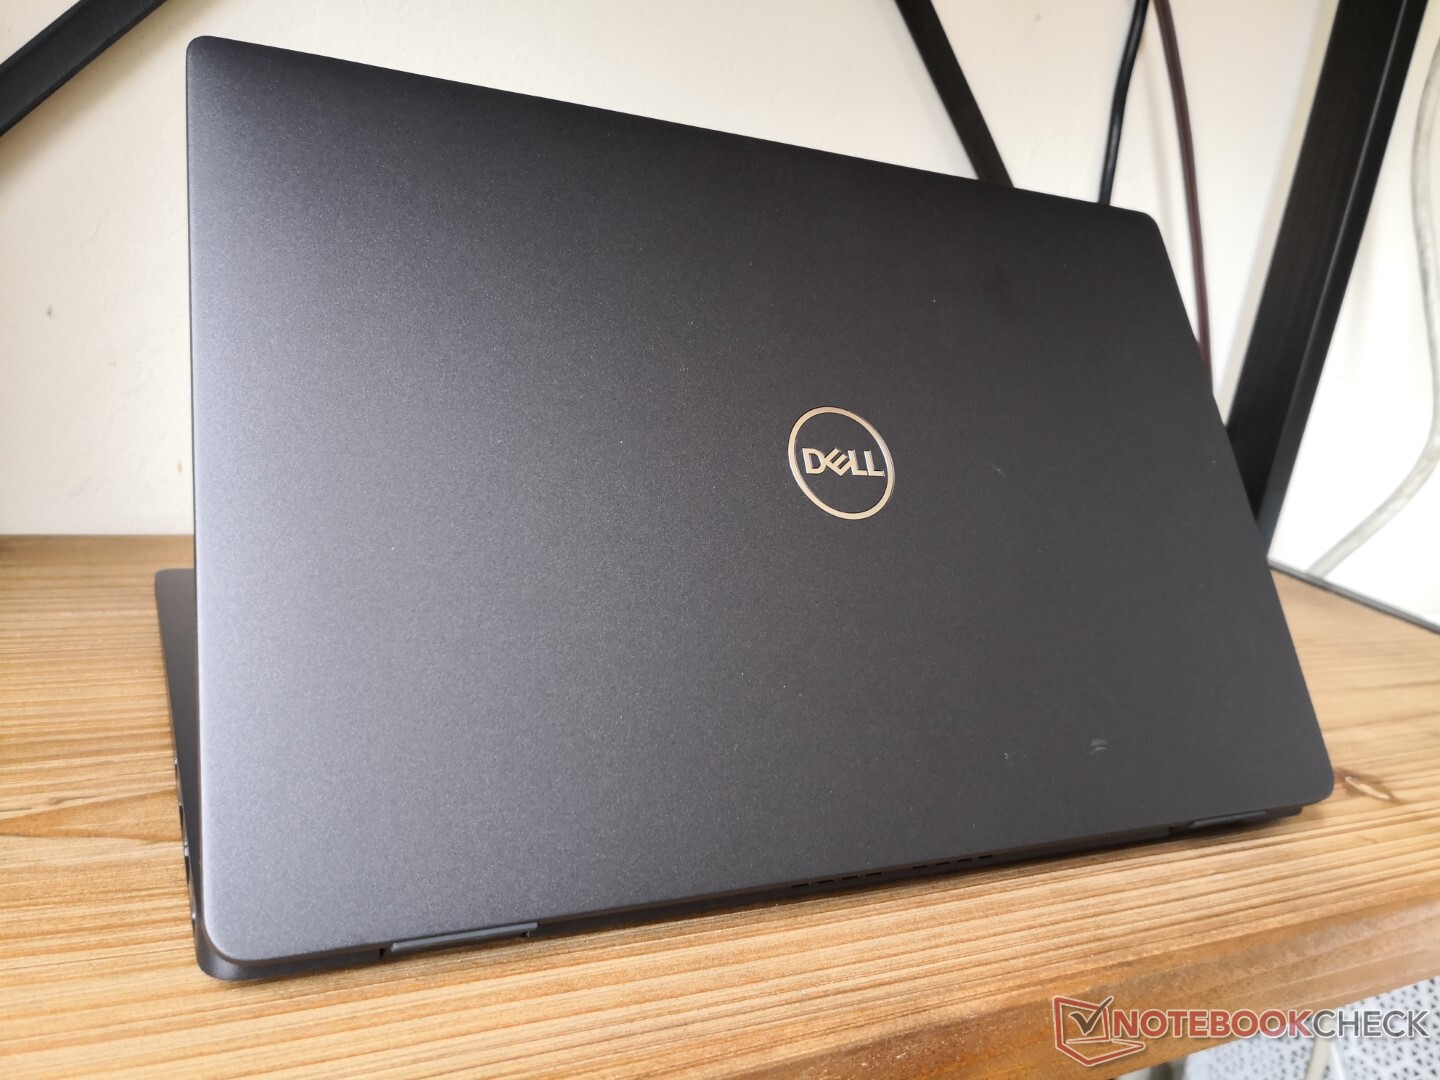
El bajísimo peso de sólo 1 kg es el principal punto de venta de la opción de aleación de magnesio. La mayoría de los subportátiles de esta categoría de tamaño suelen pesar unos cientos de gramos más, lo que se nota mucho cuando se viaja o se trabaja sobre la marcha. Las dimensiones totales son sólo ligeramente inferiores a las del Latitude 7310 que ya era bastante pequeño
Optar por las opciones de fibra de carbono o aluminio en su lugar supondrá un aumento de peso de unos 160 g y 240 g, respectivamente, sobre nuestra opción de magnesio.
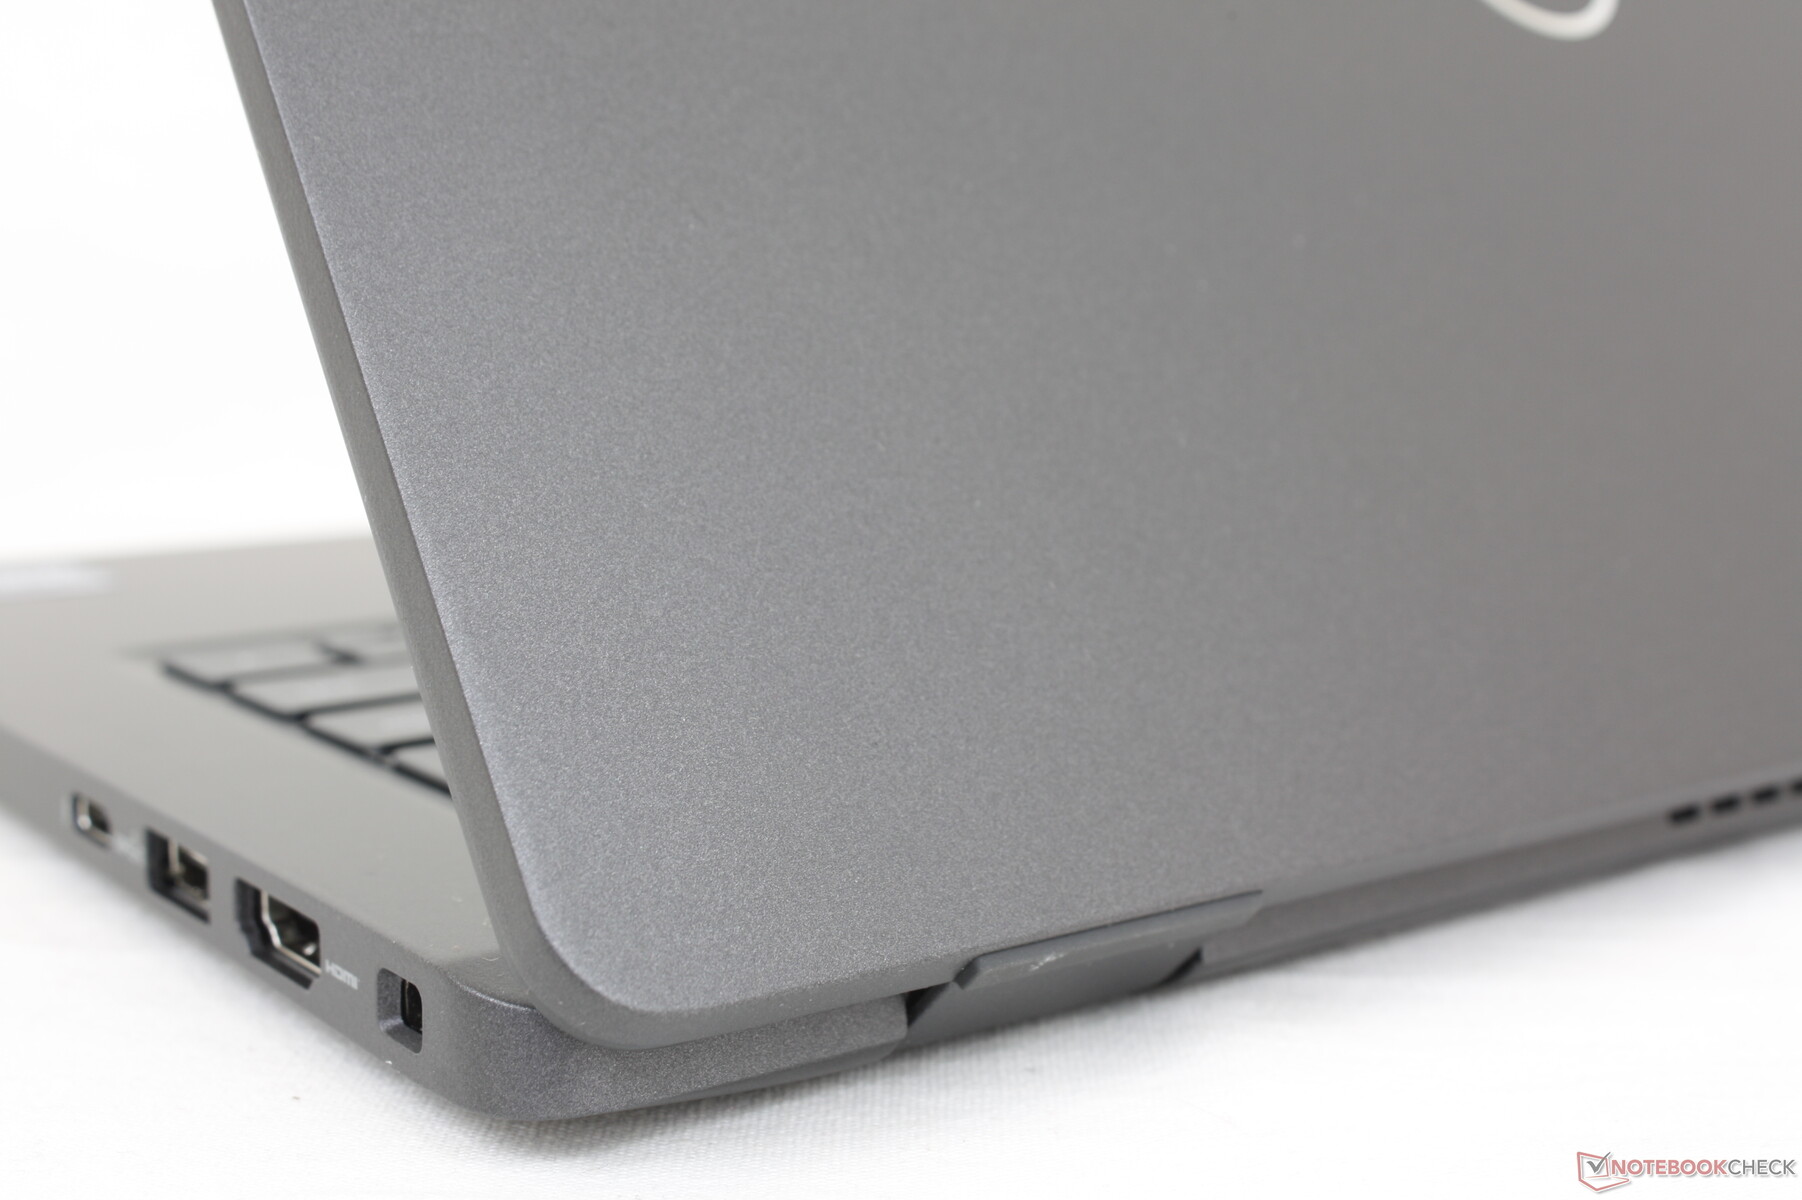
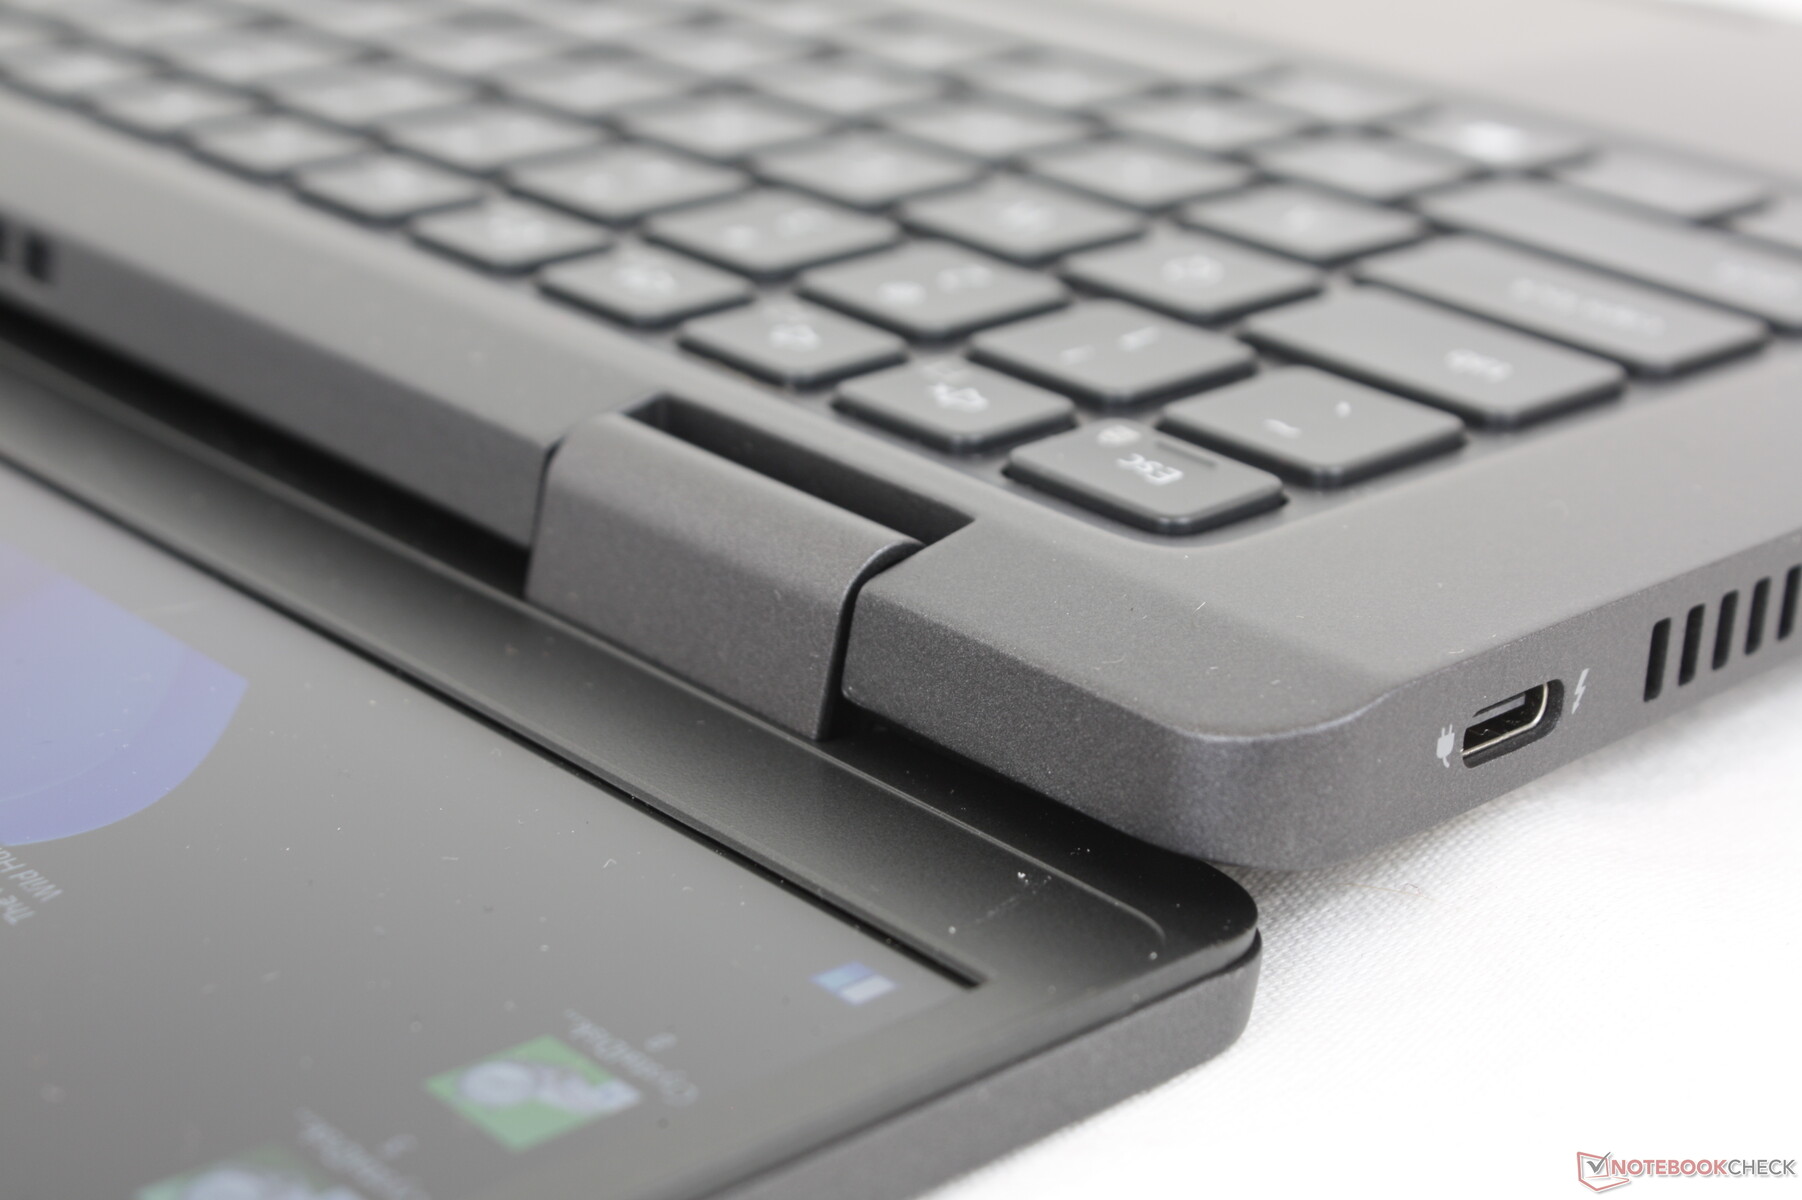
Conectividad - Soporte de Thunderbolt 4
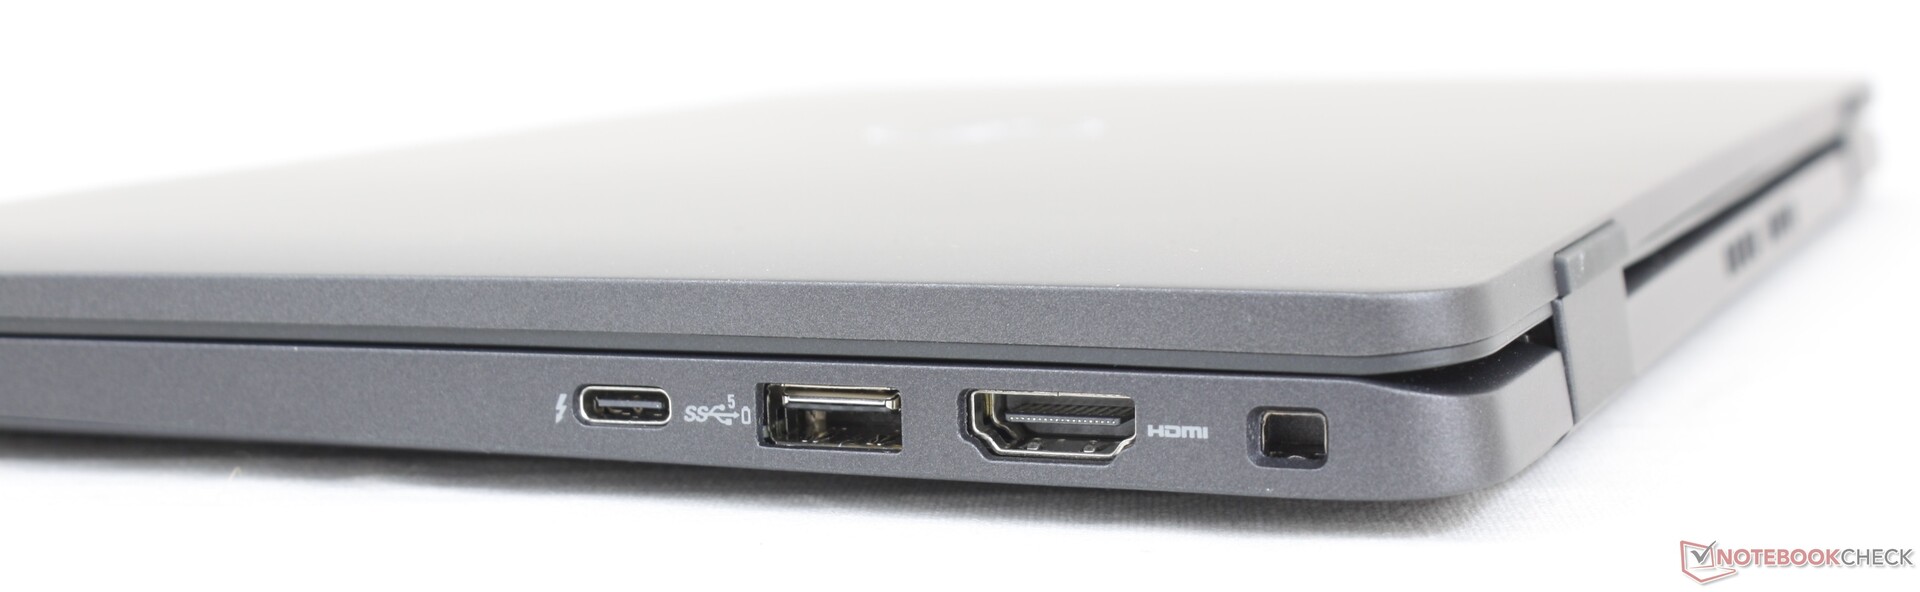
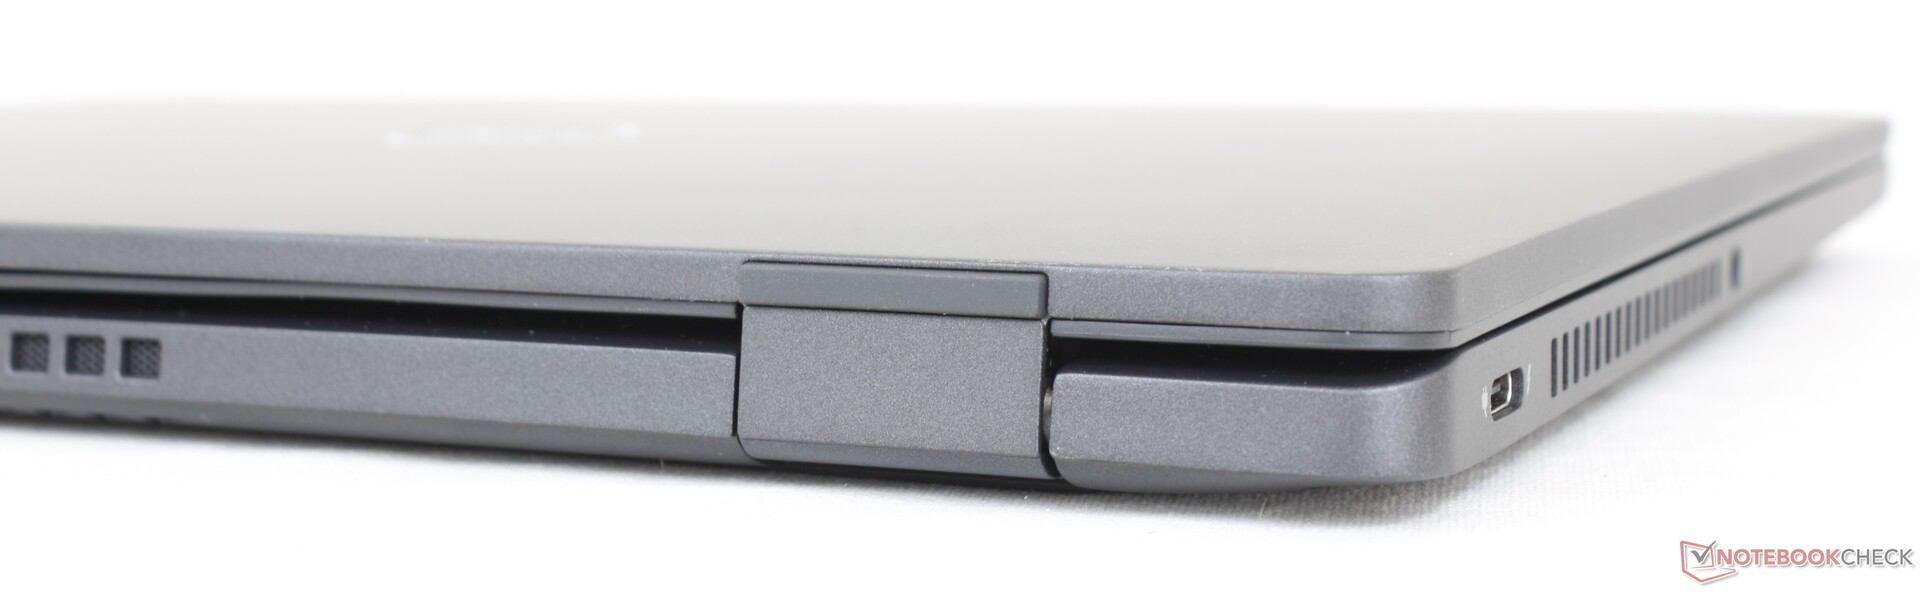
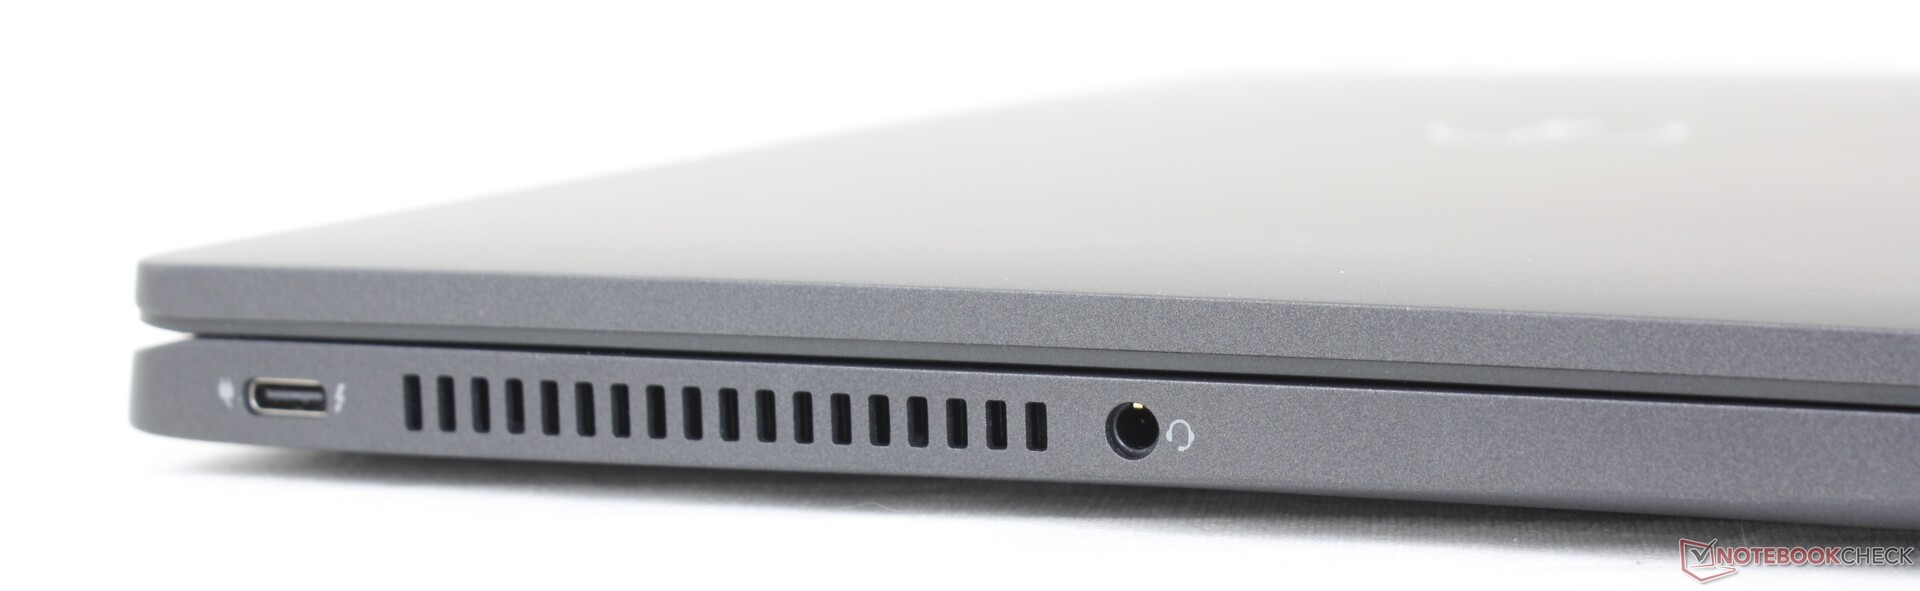
Las opciones de puertos son las mismas que en el Latitude 7310, pero se han reorganizado para mejorar la comodidad. Los dos puertos USB-C, por ejemplo, están ahora en los bordes izquierdo y derecho del chasis, respectivamente, en comparación con el borde izquierdo del modelo anterior. Este cambio permite a los usuarios cargar el portátil desde cualquier lado.
Comunicación - LTE opcional
El Intel AX211 viene de serie con conectividad Wi-Fi 6E y Bluetooth 5.2. No experimentamos ningún problema importante de conectividad cuando lo emparejamos con nuestra red de 6 GHz. Las diferencias de rendimiento entre Wi-Fi 6 y Wi-Fi 6E serán mínimas para la mayoría de los usuarios.
Aunque nuestra unidad no viene configurada con WAN, los usuarios tienen la opción de configurarla con un módulo Qualcomm Snapdragon X20 LTE-A CAT 9 o CAT 16 habilitado para eSIM.
| Networking | |
| iperf3 transmit AX12 | |
| Microsoft Surface Laptop 4 13 Ryzen 5 | |
| Dell Latitude 7310 | |
| Razer Book 13 FHD | |
| Lenovo ThinkPad X13 Yoga 20SX0004GE | |
| iperf3 receive AX12 | |
| Razer Book 13 FHD | |
| Microsoft Surface Laptop 4 13 Ryzen 5 | |
| Dell Latitude 7310 | |
| Lenovo ThinkPad X13 Yoga 20SX0004GE | |
| iperf3 receive AXE11000 6GHz | |
| Framework Laptop 13.5 12th Gen Intel | |
| Dell Latitude 13 7330 | |
| iperf3 transmit AXE11000 6GHz | |
| Dell Latitude 13 7330 | |
| Framework Laptop 13.5 12th Gen Intel | |
Cámara web
Los usuarios pueden configurar entre una webcam HD (720p) o FHD (1080p) con IR opcional para soporte de Windows Hello. Recomendamos actualizar a 1080p ya que la calidad de imagen de nuestra configuración 720p es borrosa y brutalmente anticuada.
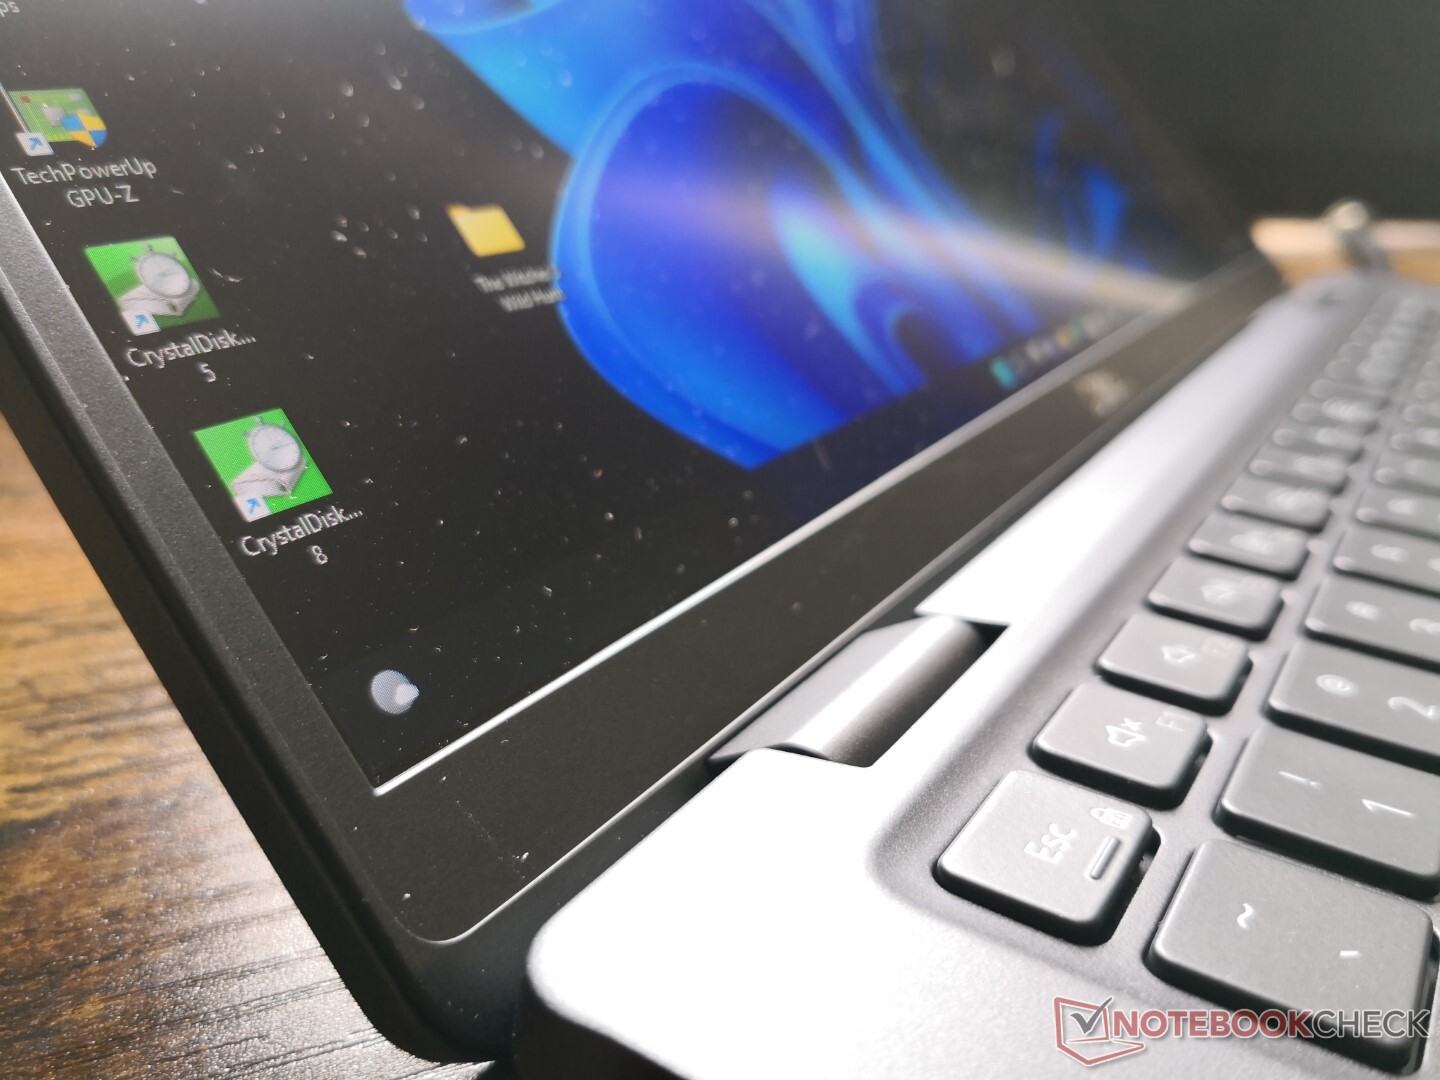
Se instala un deslizador de obturador manual para la privacidad.


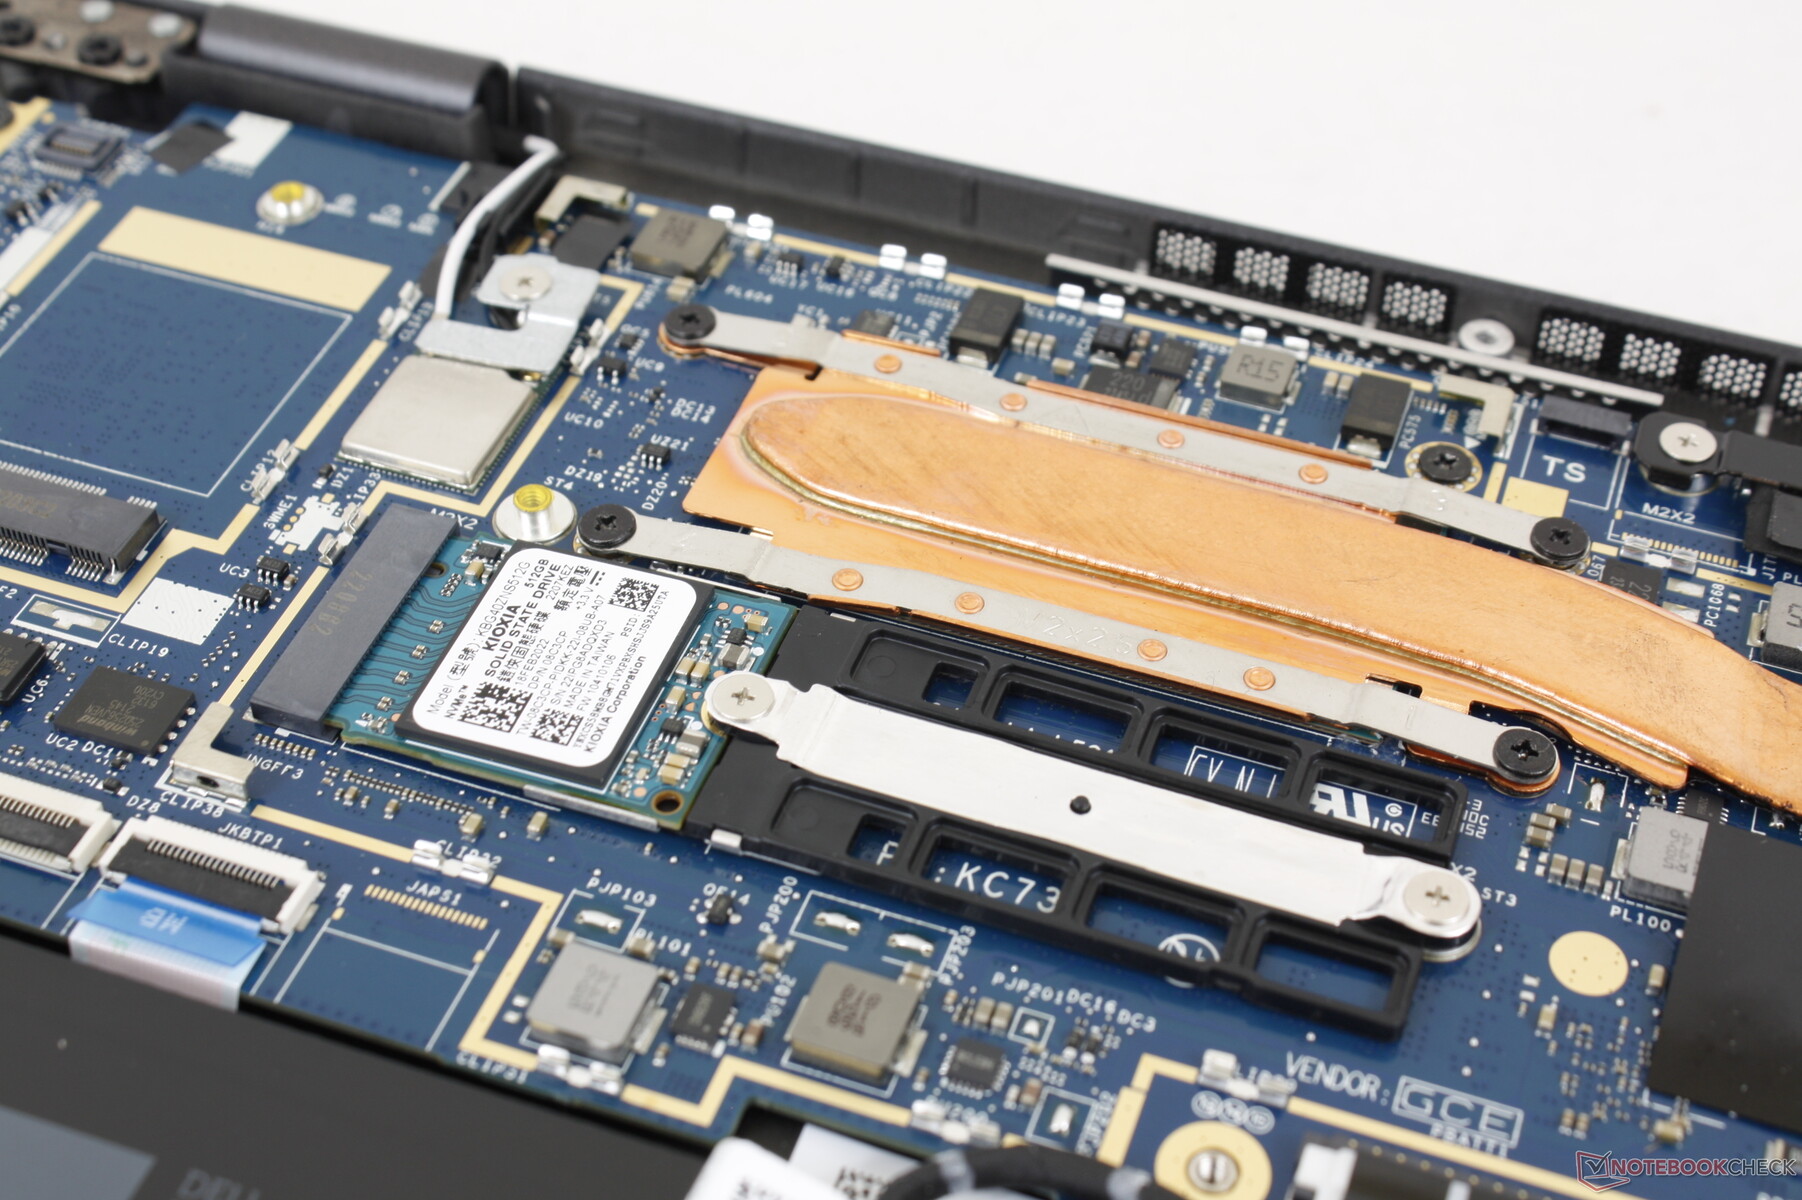
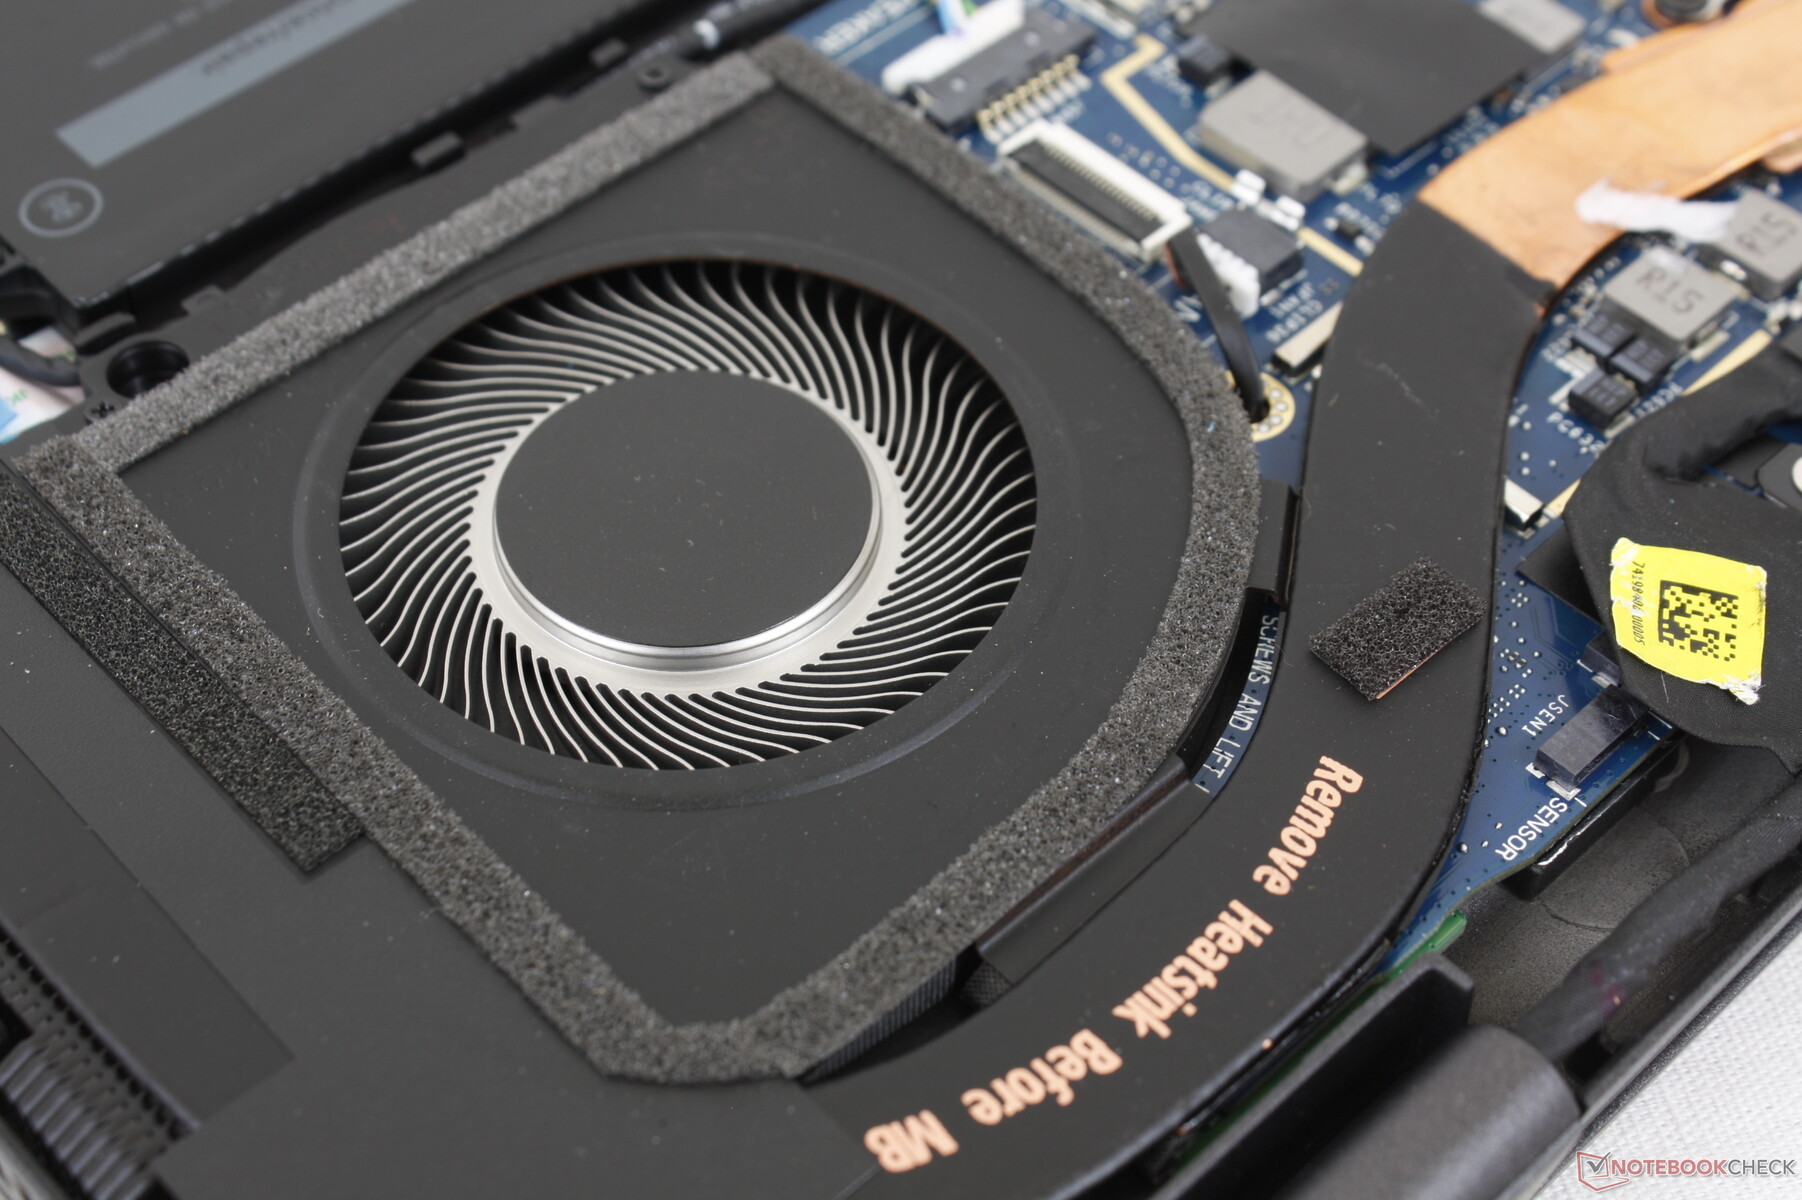
Mantenimiento
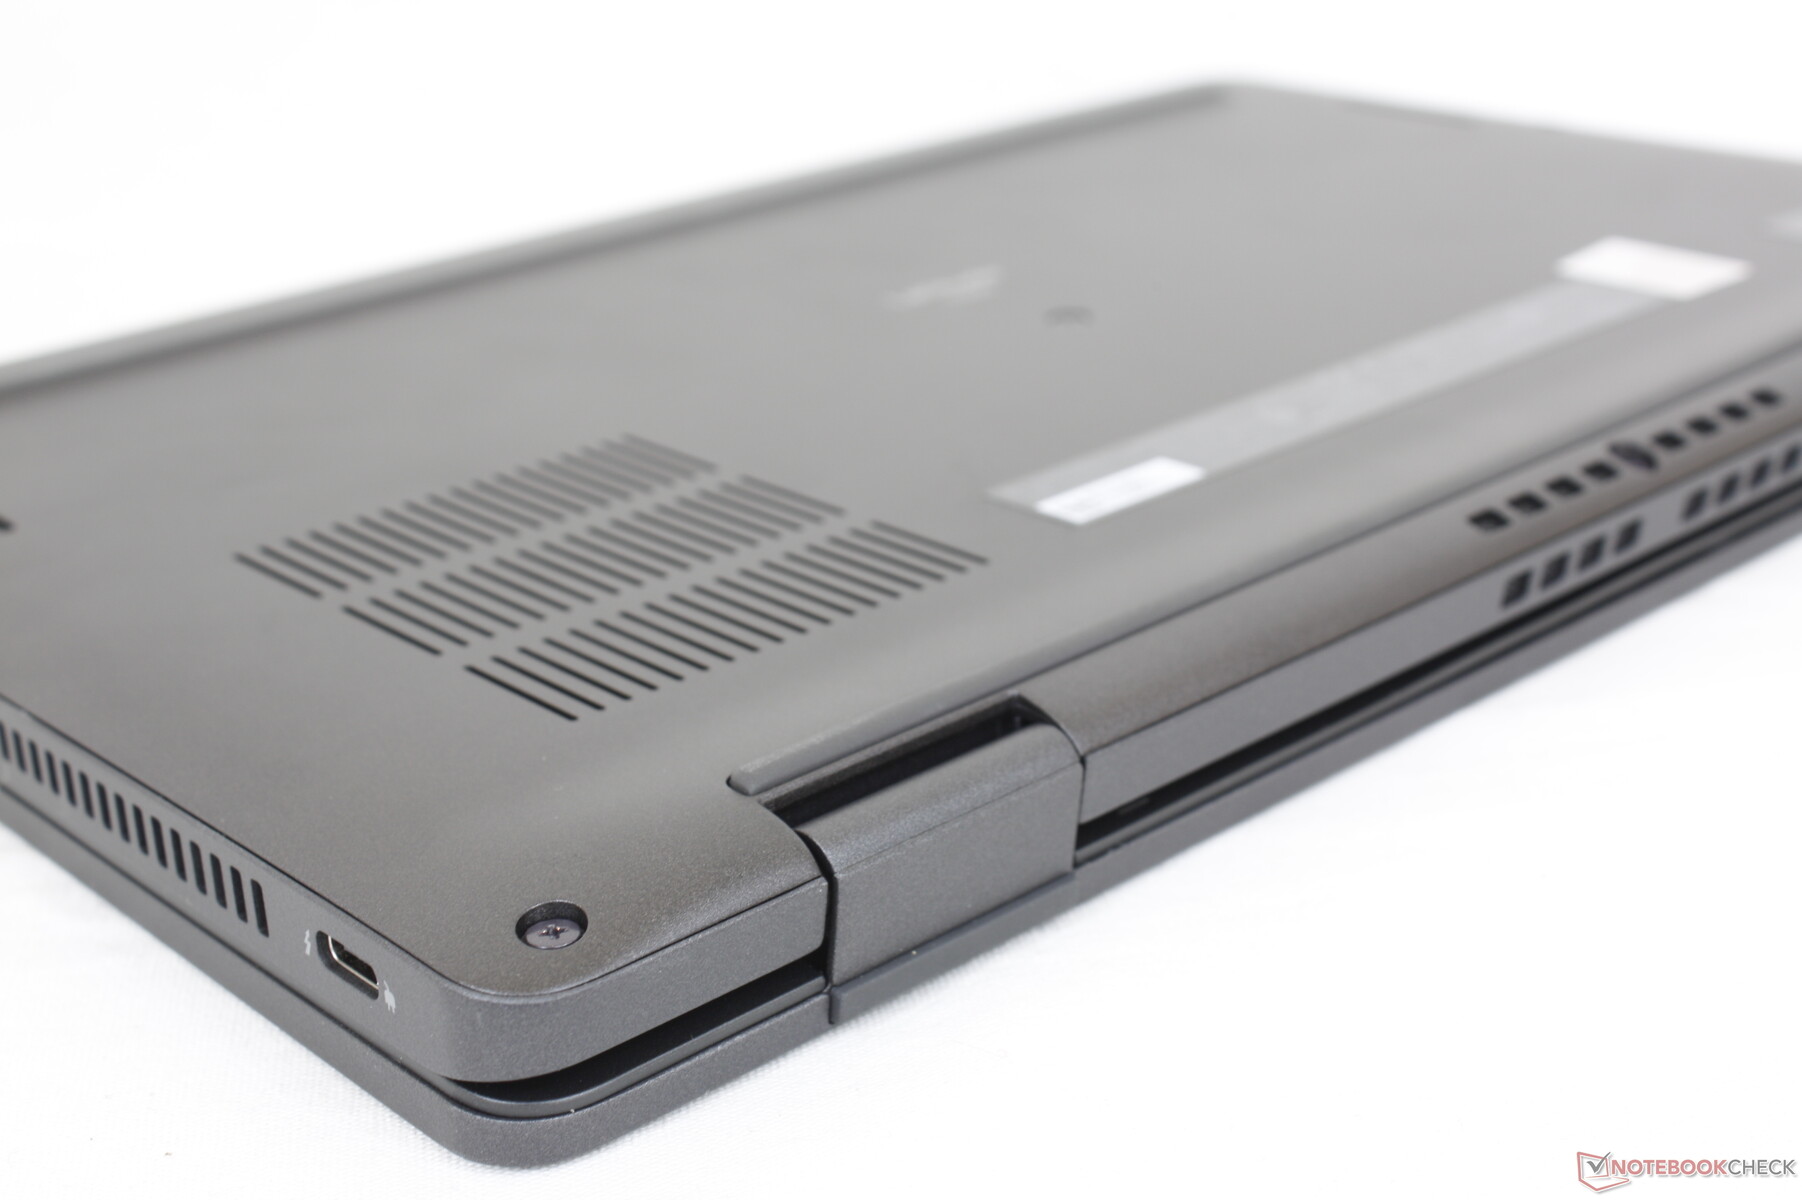
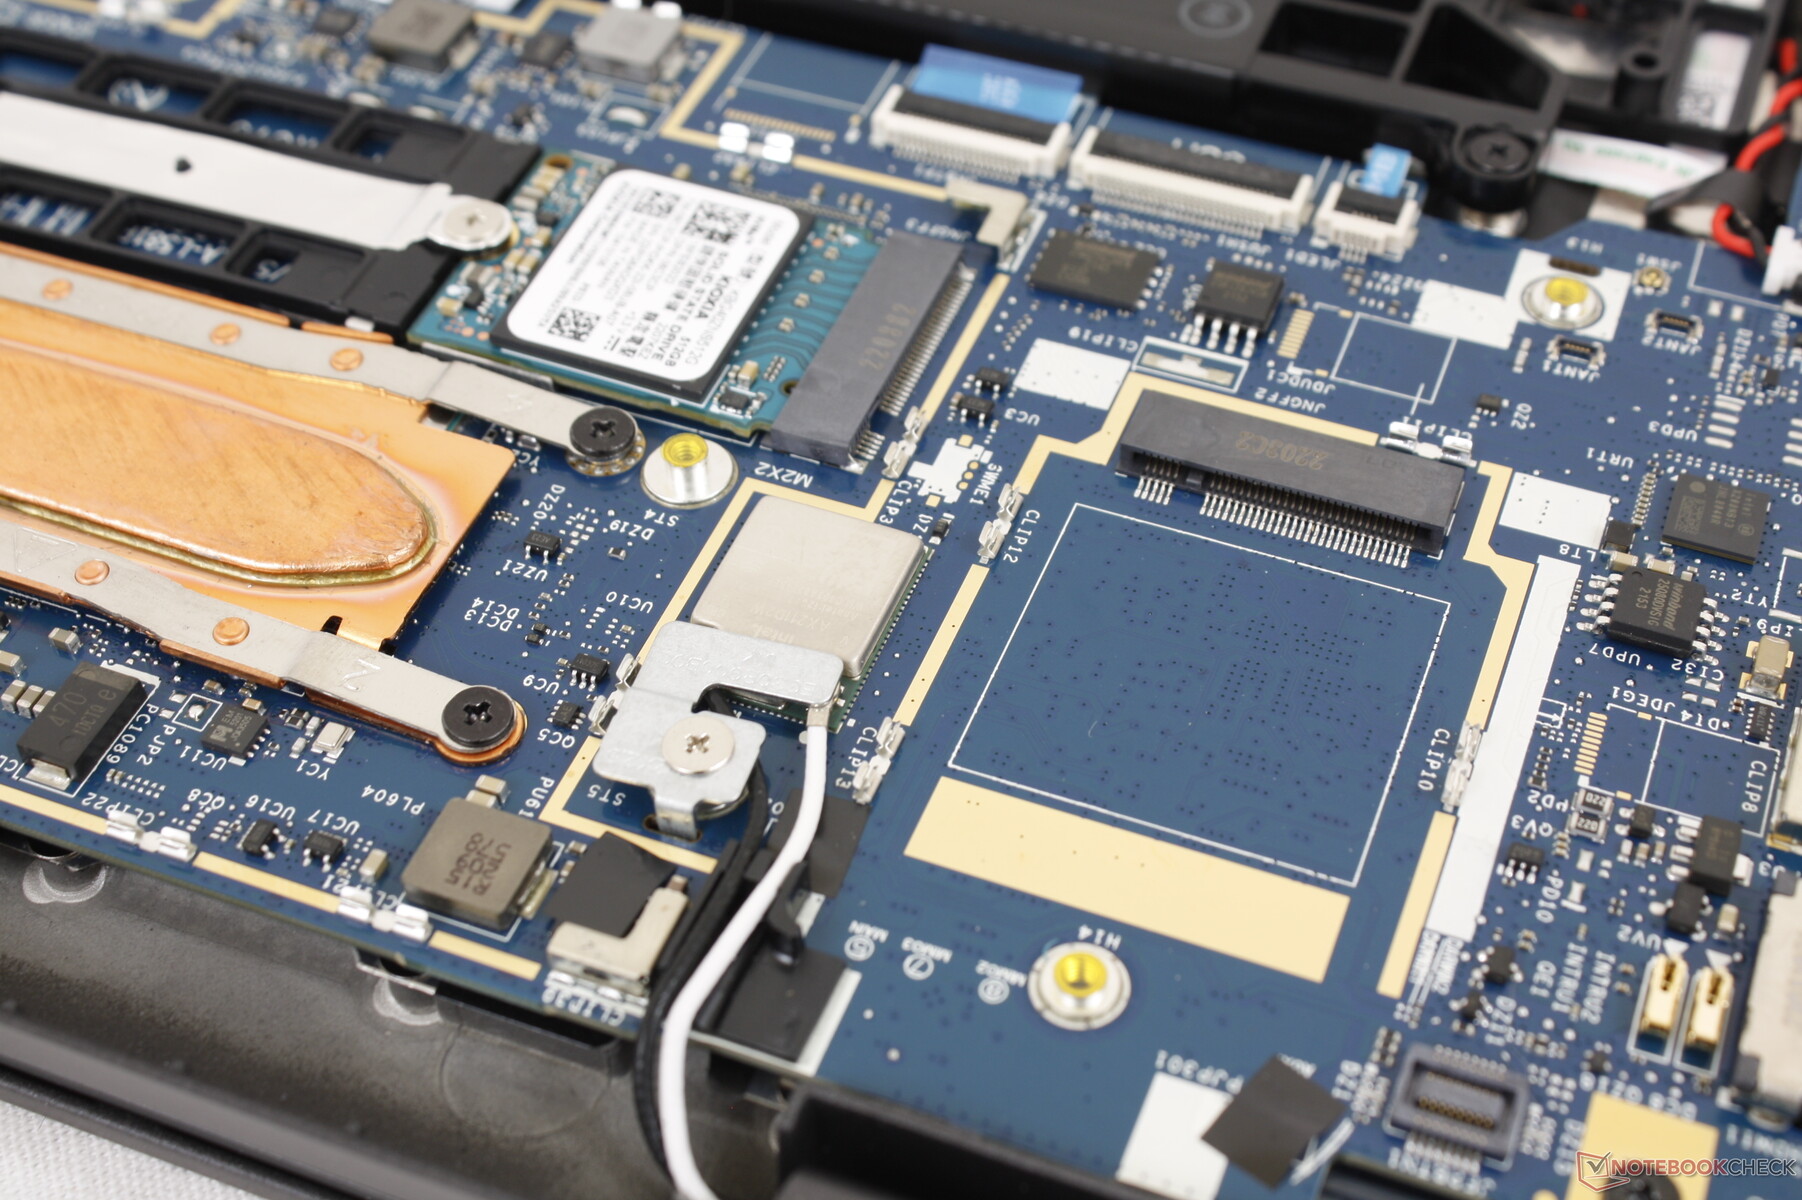
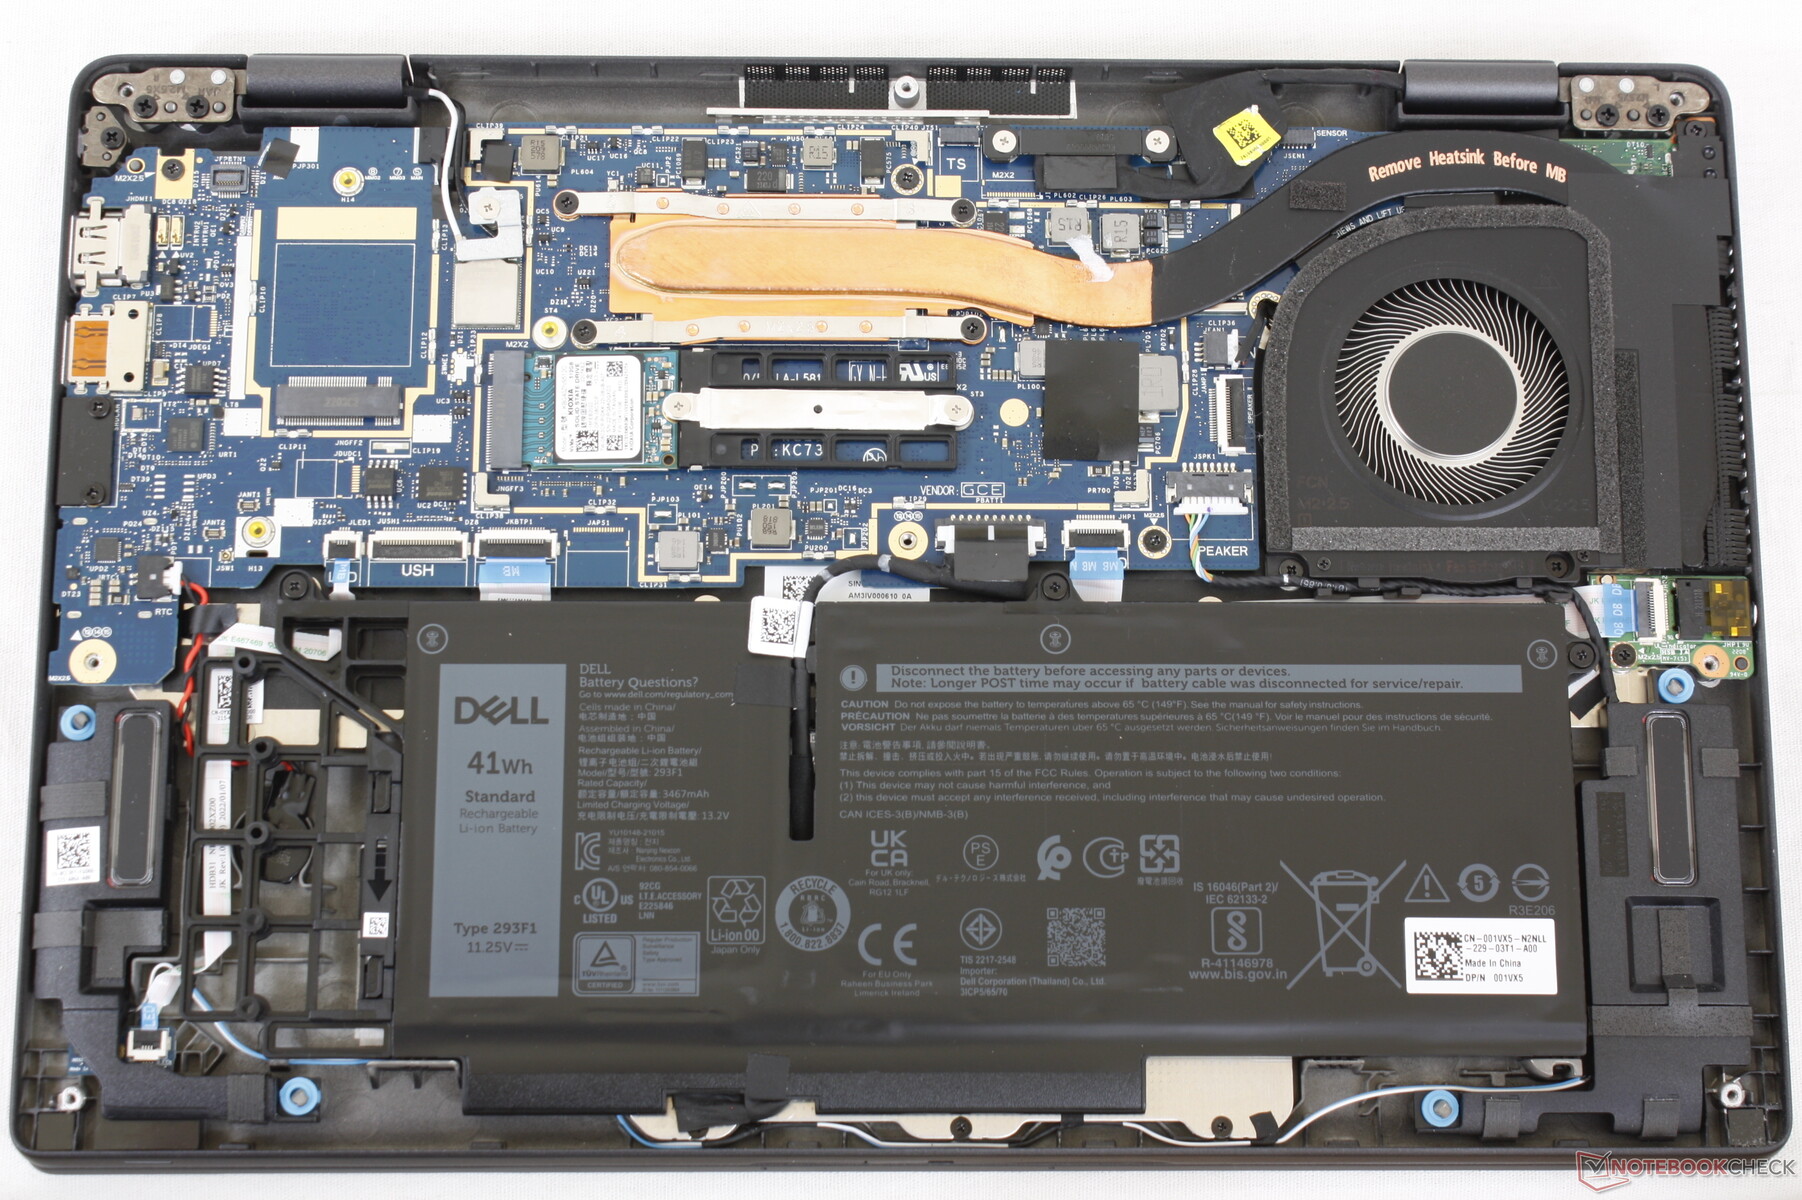
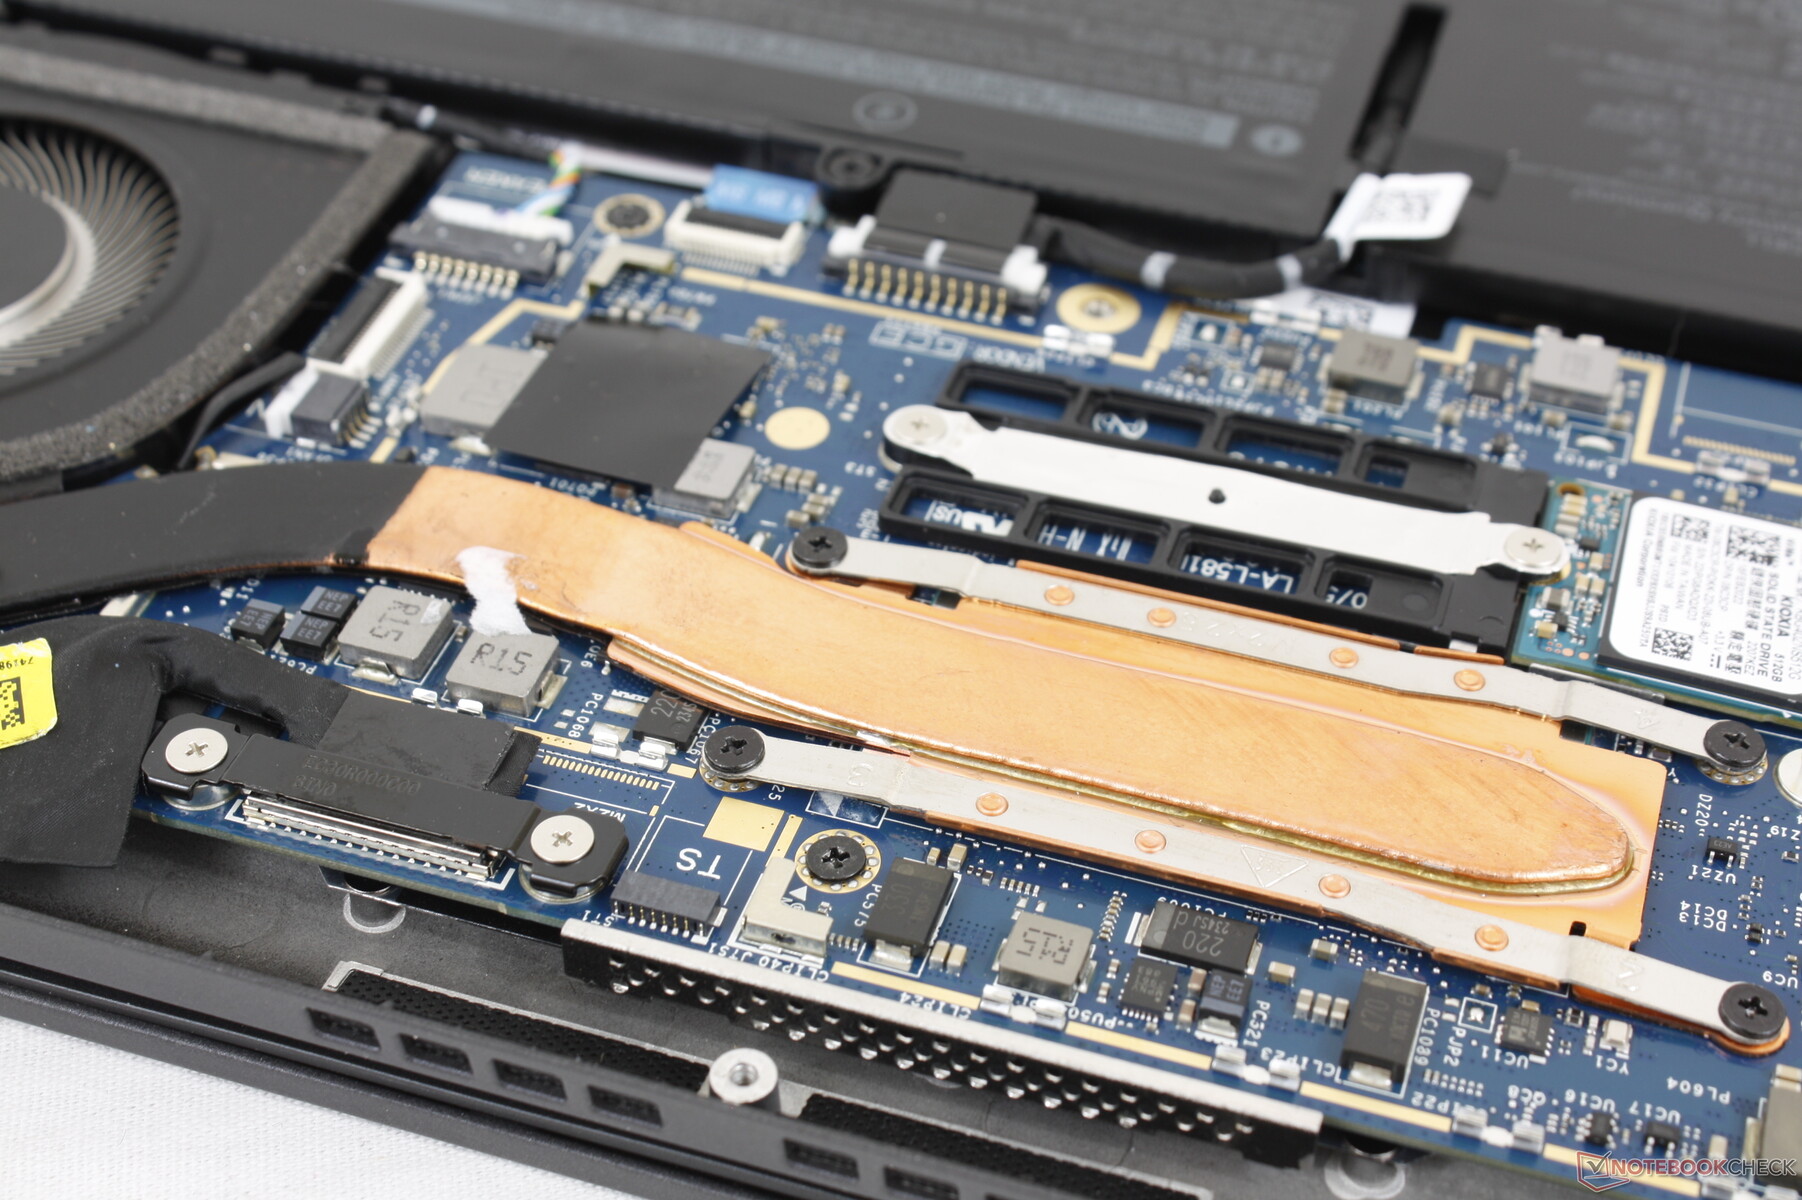
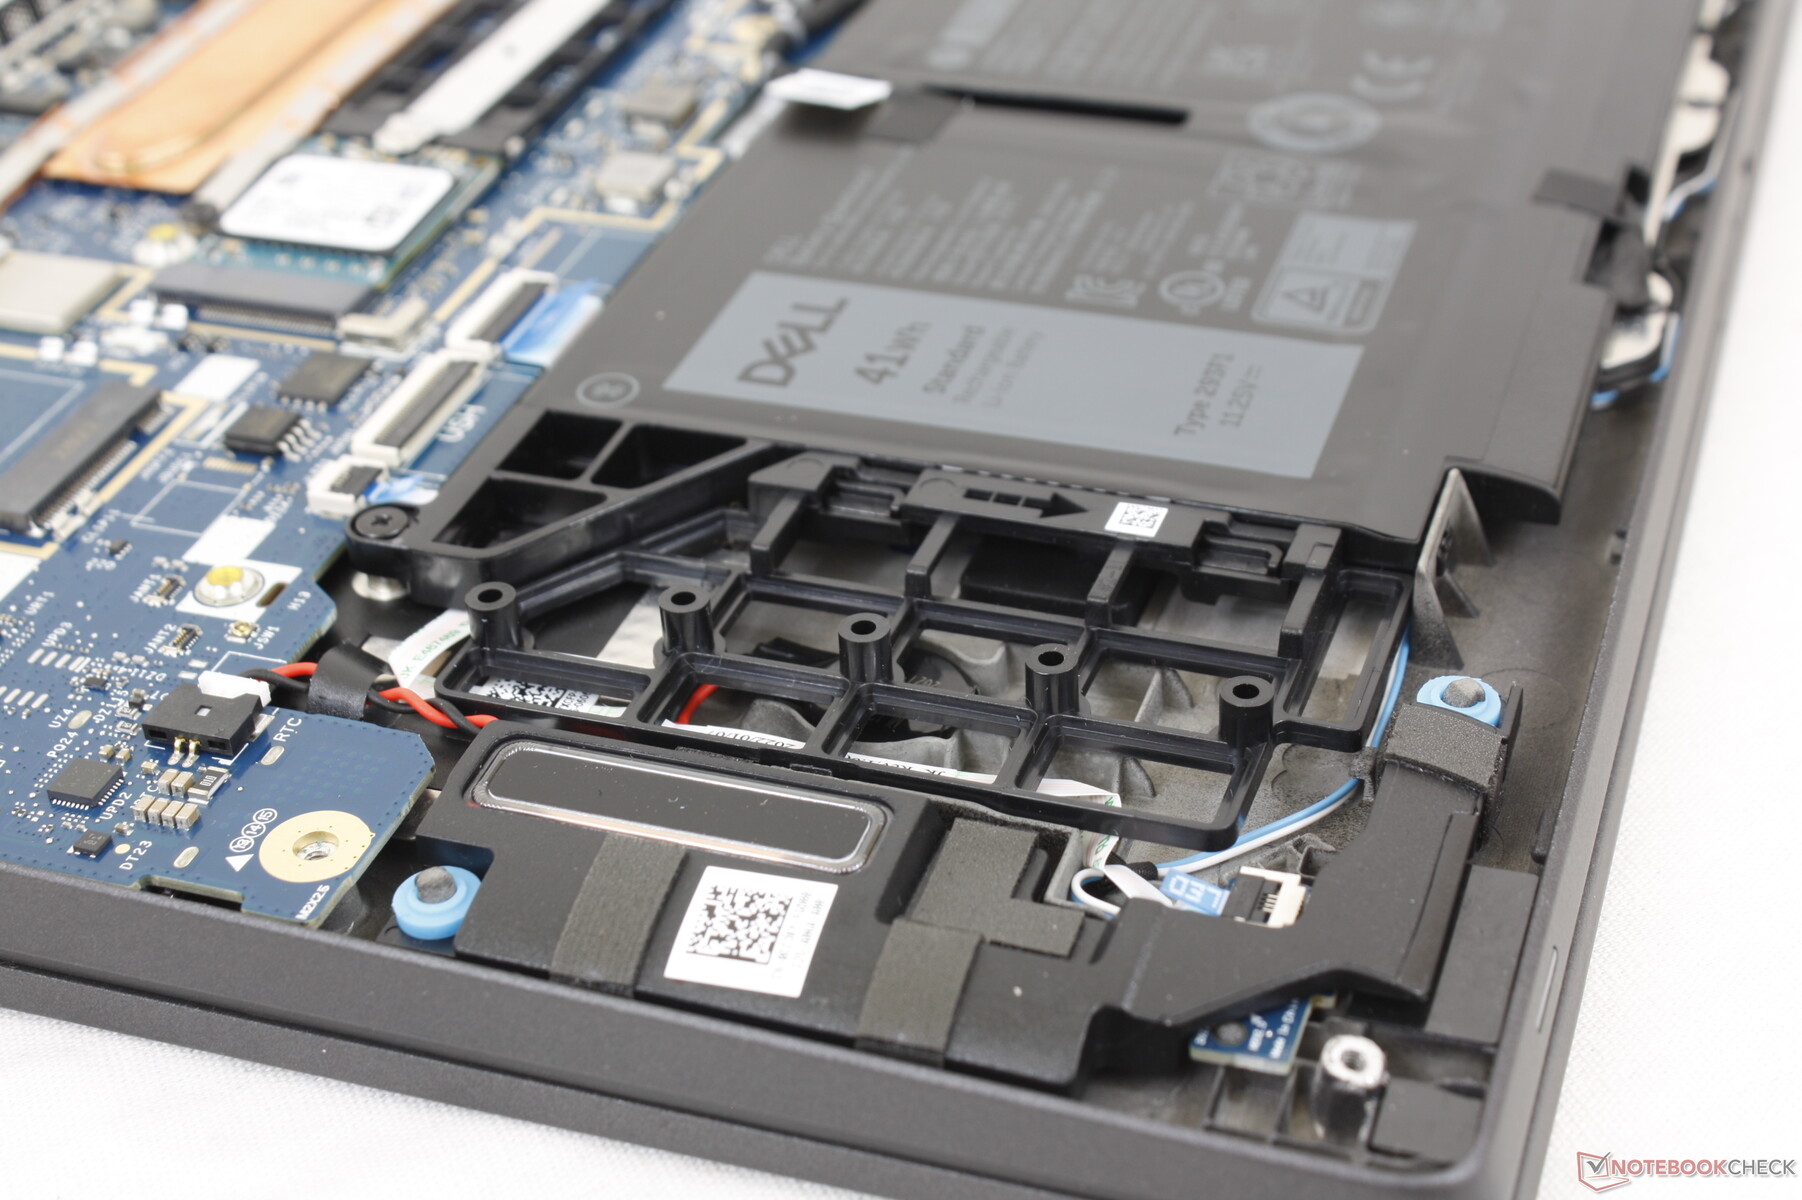
El panel inferior es fácilmente desmontable con un destornillador Philips. No hay mucho que reparar más allá del SSD M.2 y la batería ya que los módulos WLAN y RAM están soldados.
Obsérvese que no se incluye ninguna antena si se configura sin WAN para desanimar a los propietarios a instalar su propio módulo WAN. Además, observe el espacio vacío a la izquierda de la batería de 41 Wh para reducir el peso; este espacio queda ocupado si se configura con la opción mayor de 58 Wh.
Accesorios y garantía
En la caja no hay más extras que el adaptador de CA y la documentación. La garantía de tres años viene de serie, como es habitual en la mayoría de los modelos de Latitude.
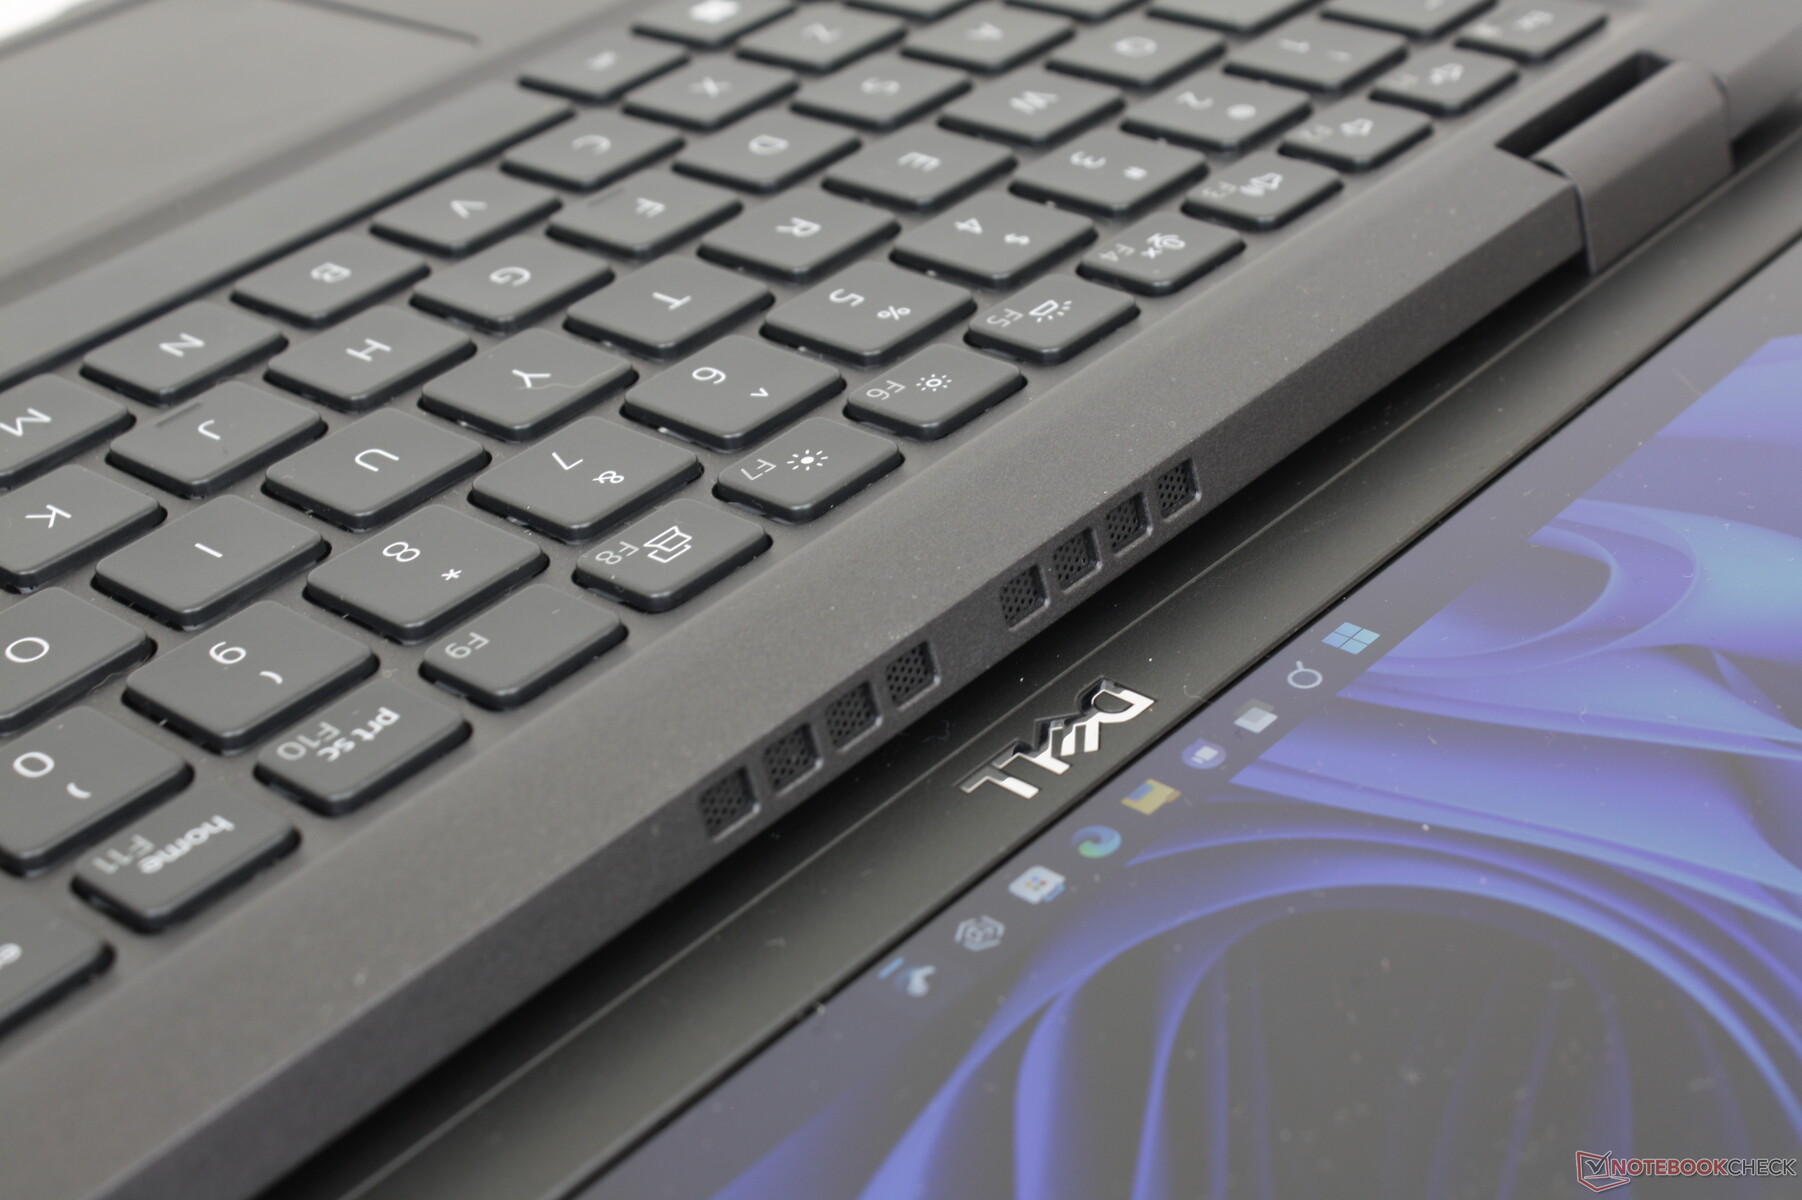
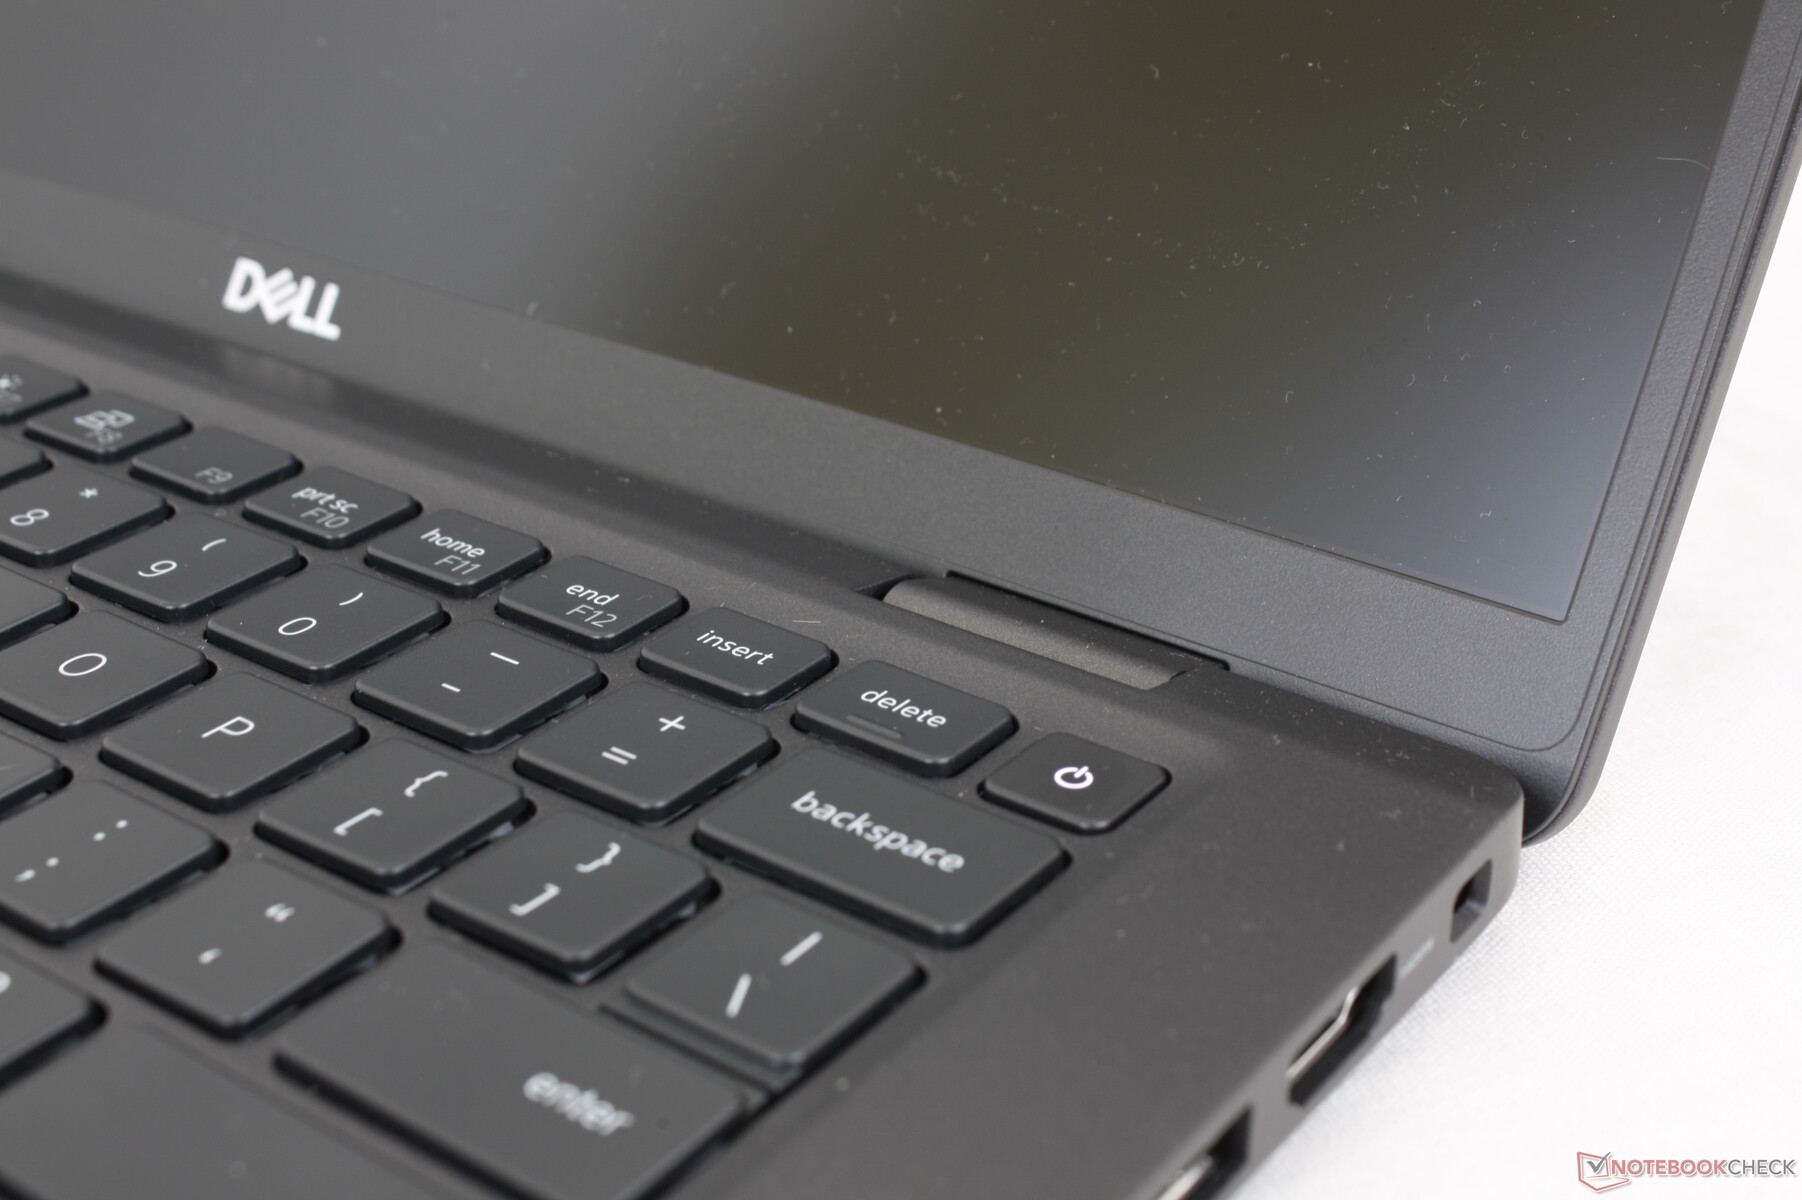
Dispositivos de entrada - Igual que antes
Teclado
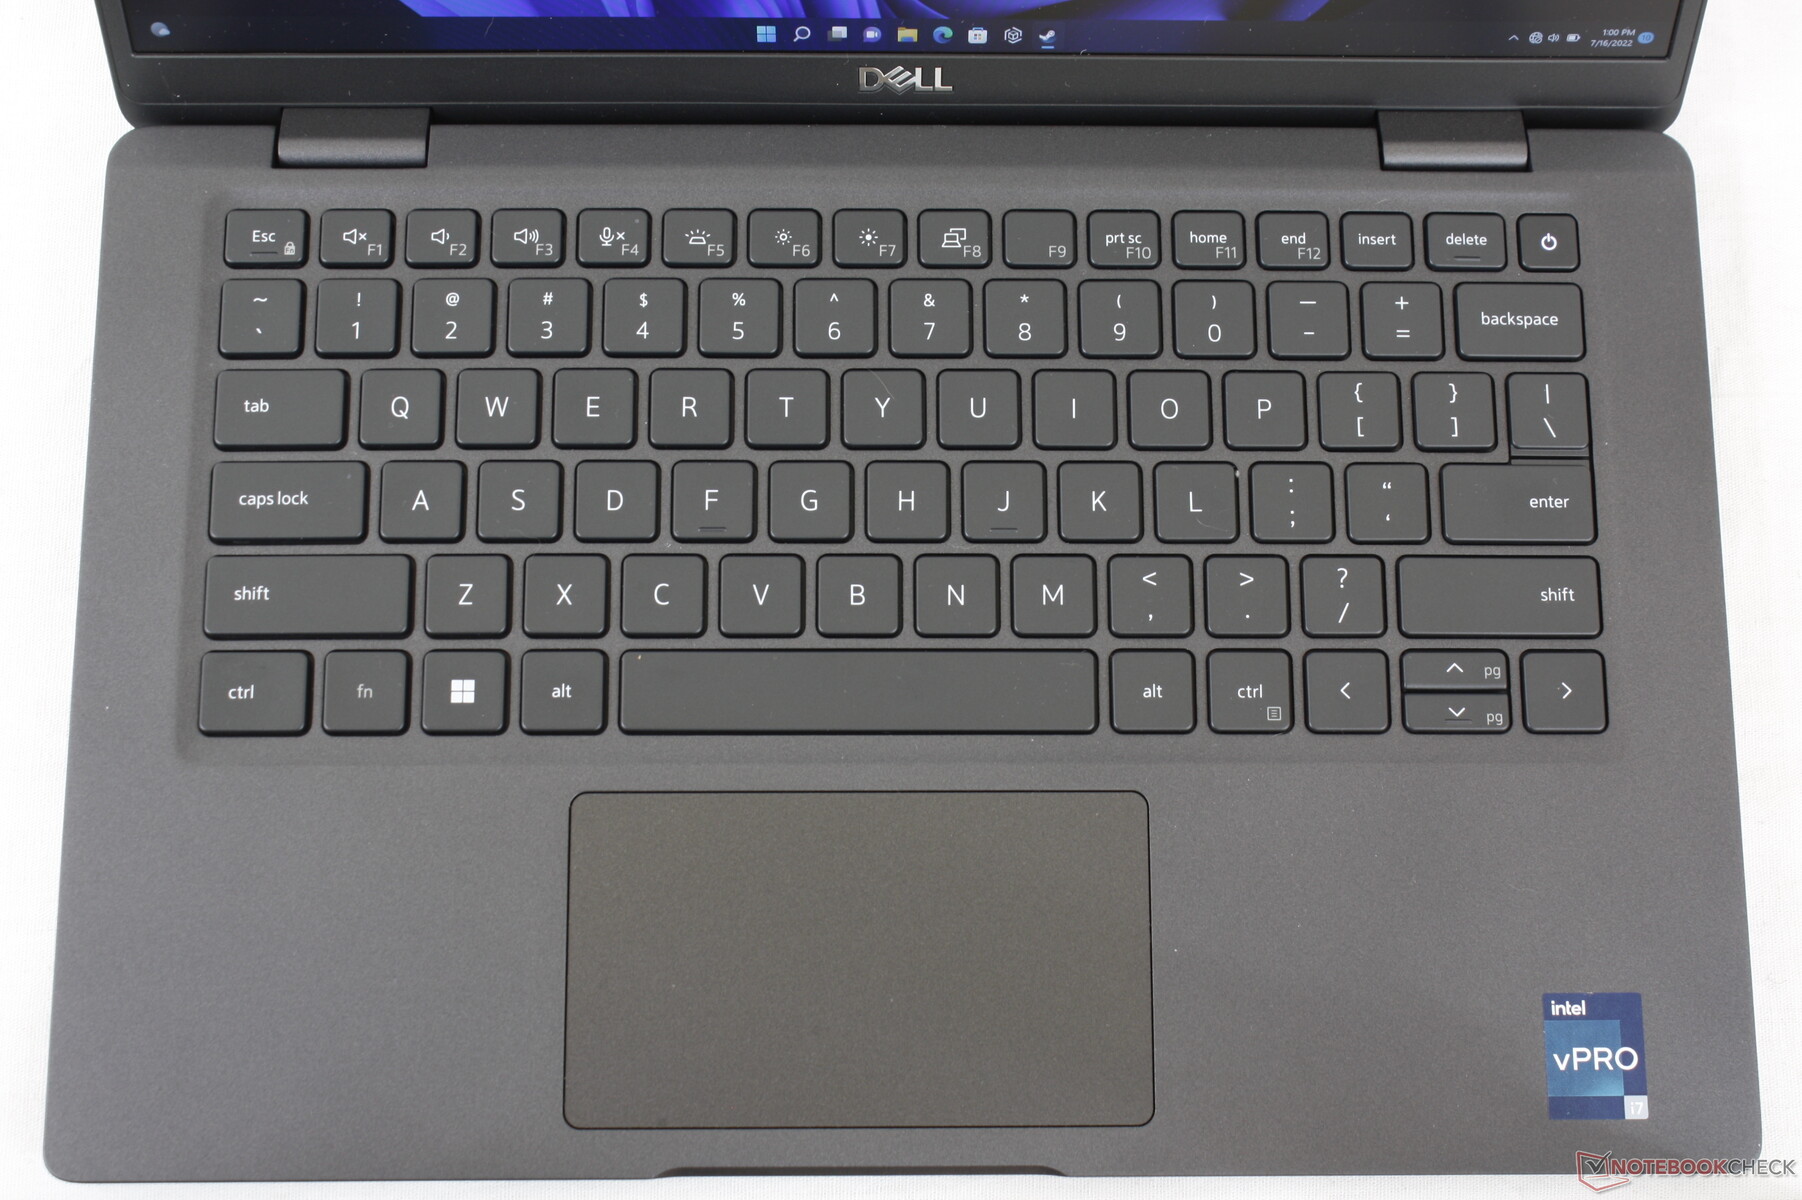
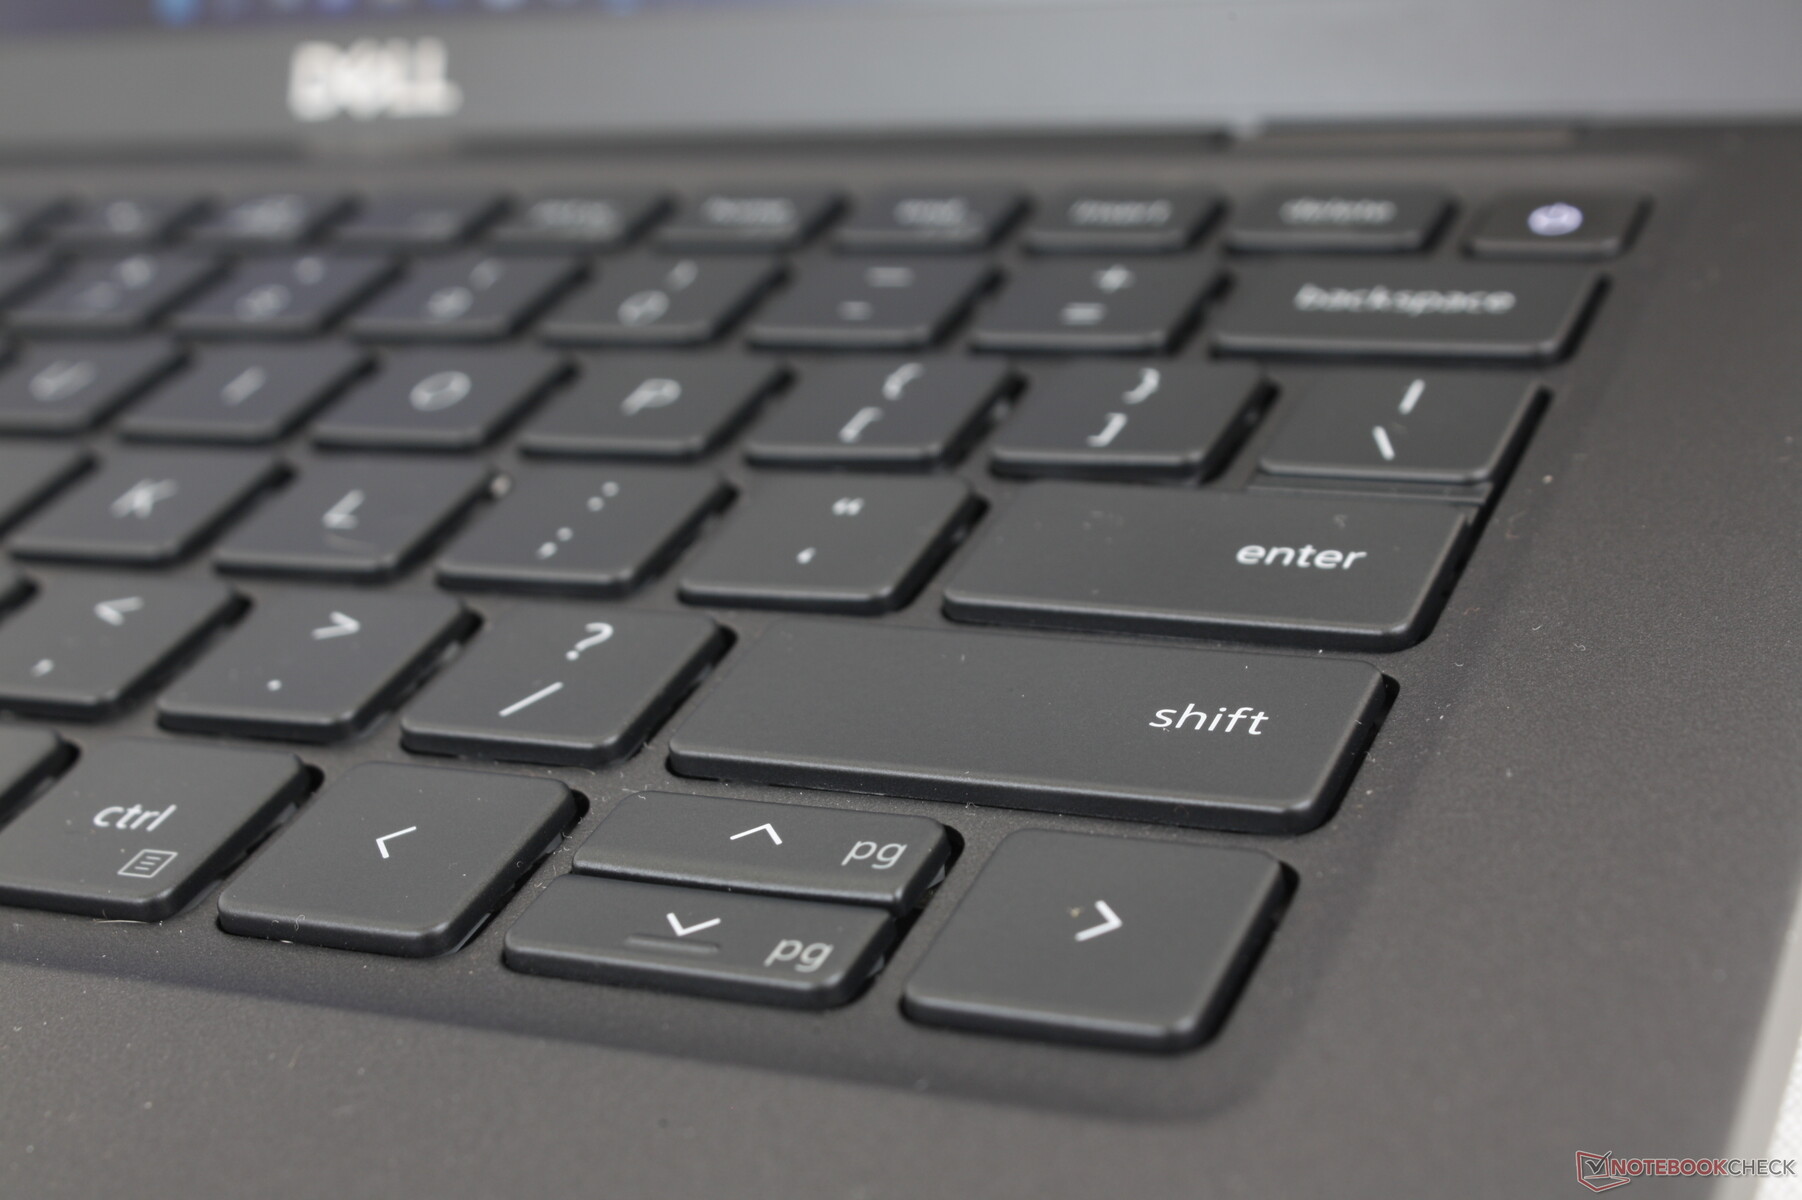
Dell no ha realizado ningún cambio en el teclado entre el Latitude 7310 y el Latitude 7330. De hecho, muchos de los modelos más recientes de Latitude comparten el mismo diseño y disposición del teclado, incluyendo los Latitude 7400 7410, 7310 y 7330. Encontramos que las teclas más firmes del Latitude son más cómodas para escribir que las más ligeras del XPS 13. Las teclas del LG Gram 14 o del Serie HP EliteBook tienen una respuesta más nítida y clara.
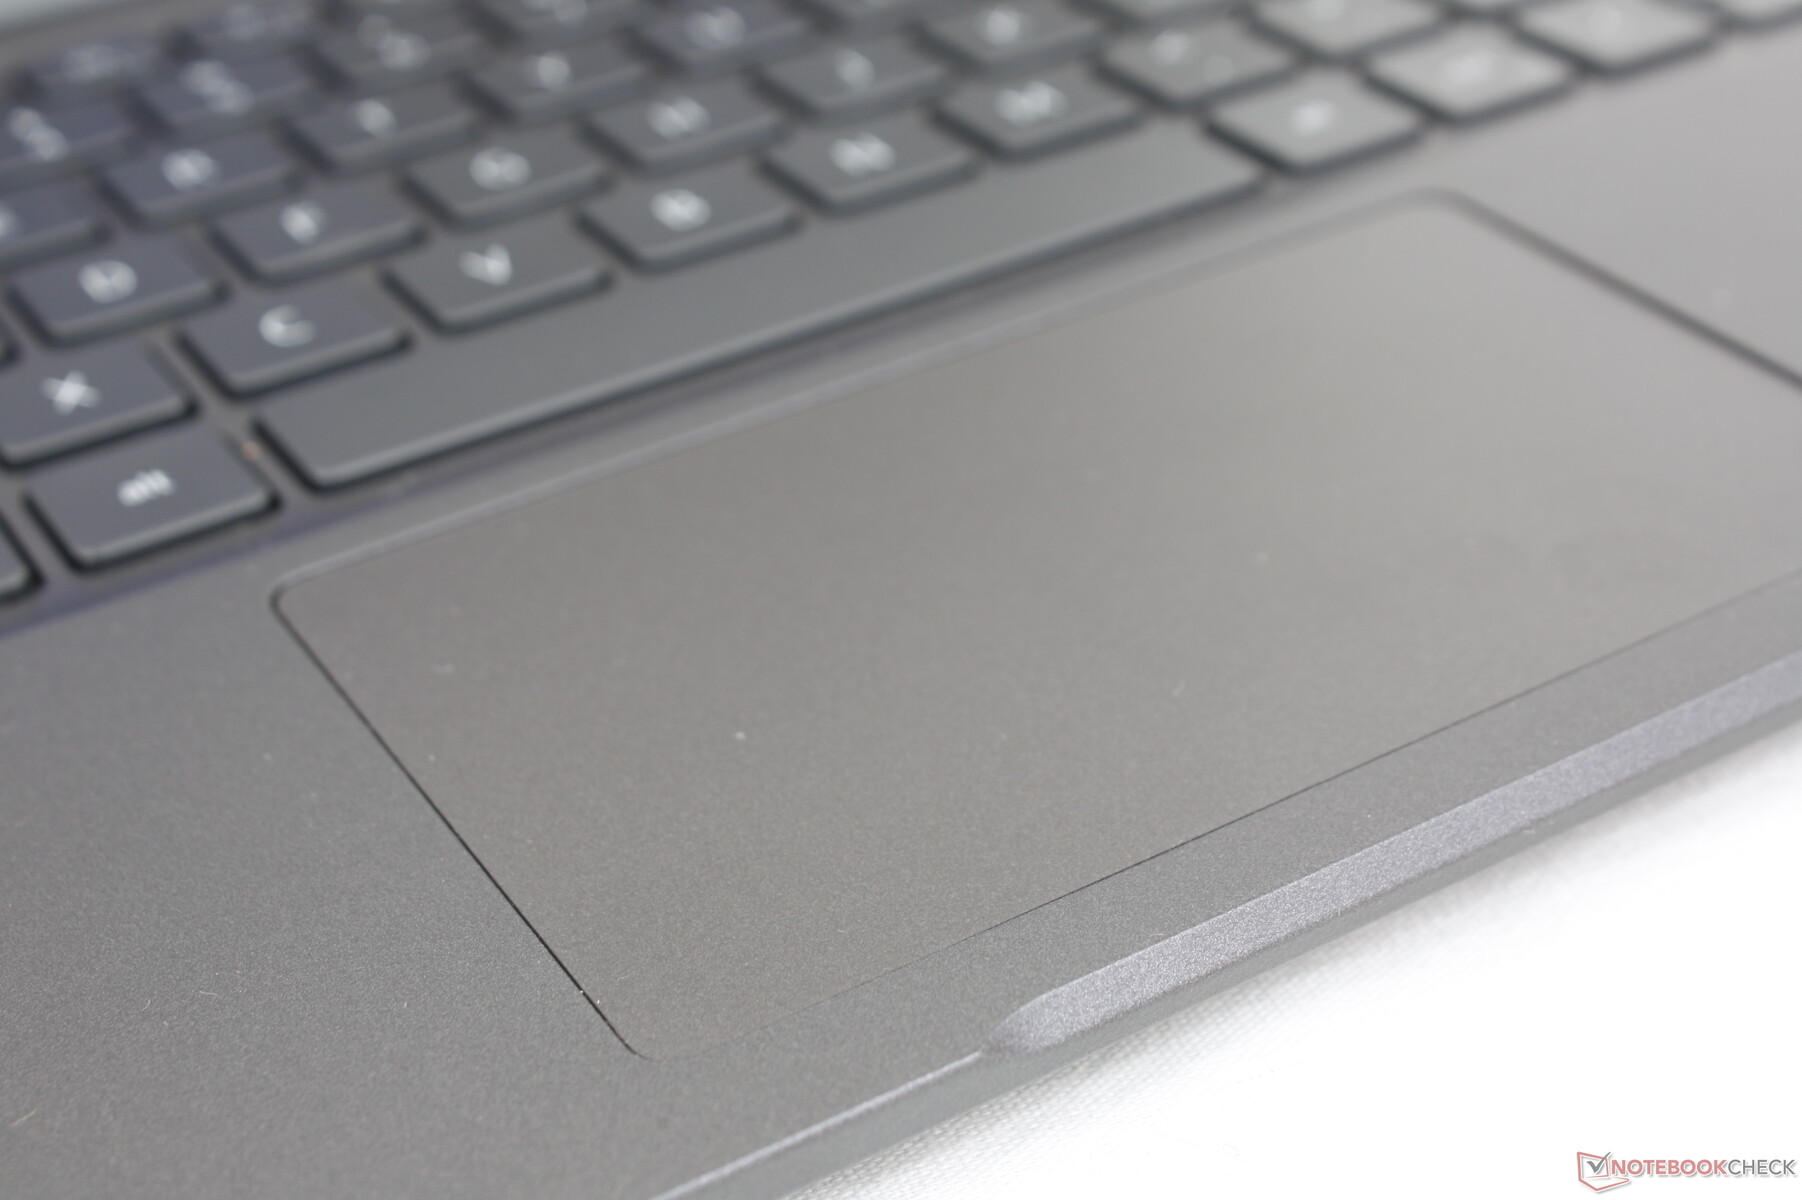
Teclado táctil
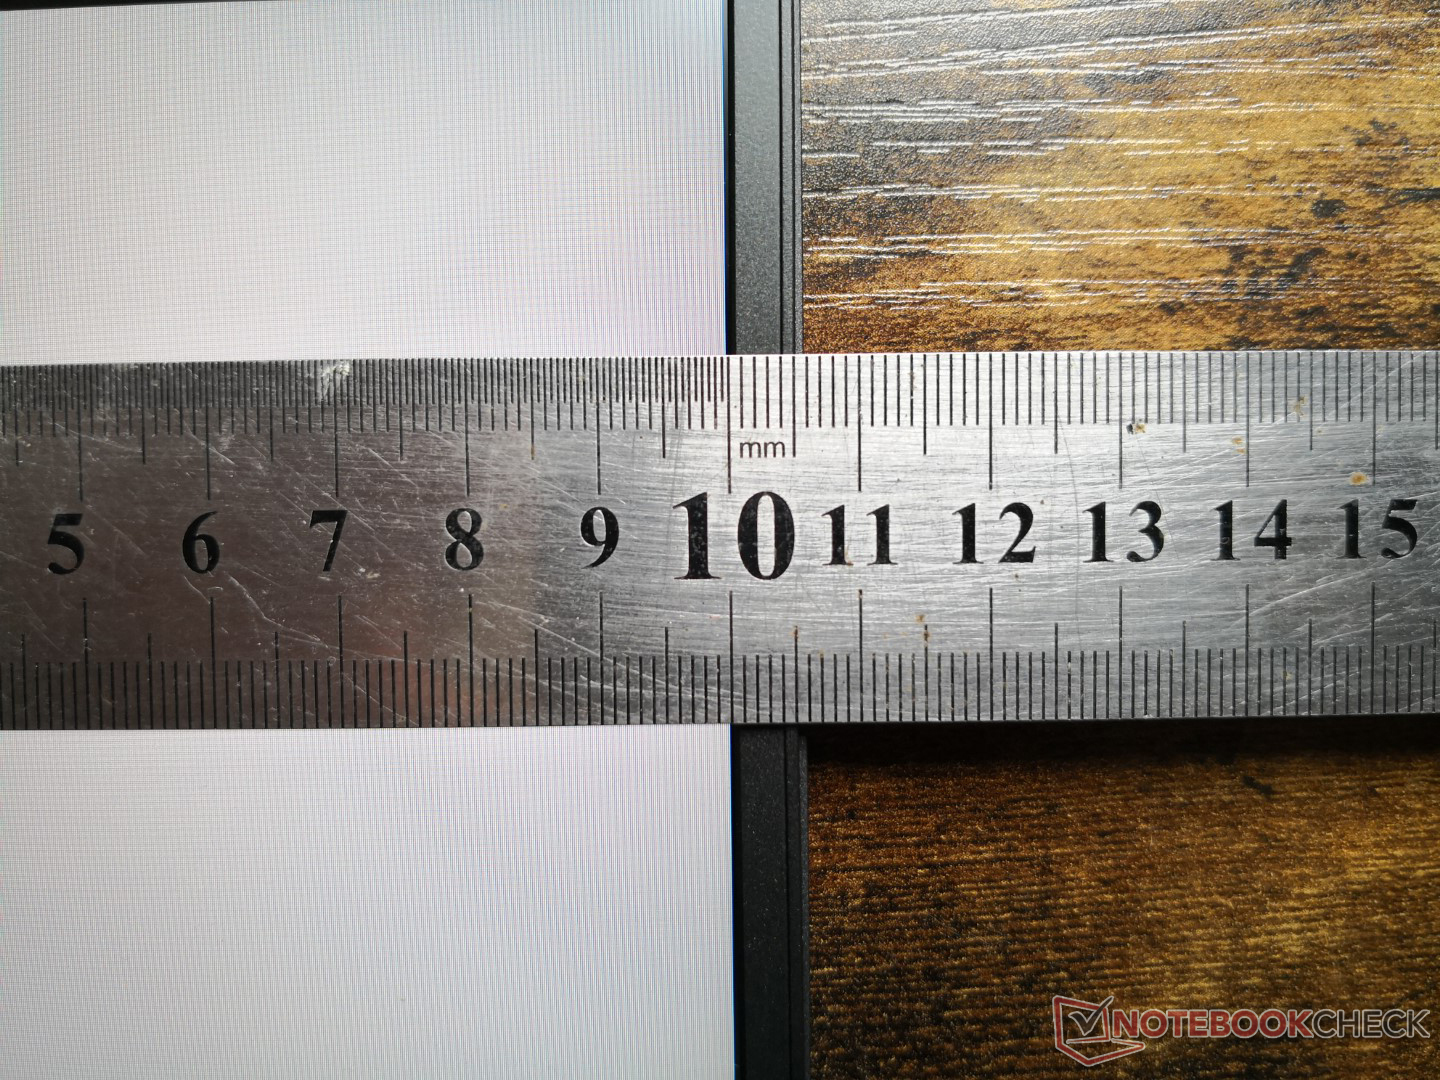
El tamaño del clickpad no ha cambiado respecto al anterior Latitude 7310, con unos 10 x 6,1 cm. Sin embargo, nos gustaría que fuera más alto, ya que el movimiento vertical del cursor y el desplazamiento multitáctil pueden resultar un poco estrechos. Las teclas integradas del ratón también son más suaves de lo que nos gustaría y se vuelven cansadas de pulsar después de un rato.

Pantalla - Sin OLED ni frecuencia de actualización rápida
Hay cuatro opciones de pantalla disponibles, de la peor a la mejor
- No táctil, 250-nits, ~60% sRGB
- Táctil, 300 nits, ~60% sRGB
- No táctil, 400 nits, 100% sRGB, baja luz azul, bajo consumo
- No táctil, 400 nits, 100% sRGB, baja luz azul, bajo consumo, ultraligero
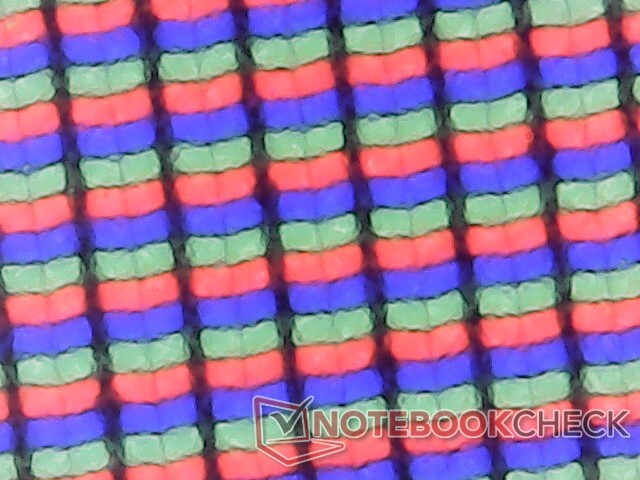
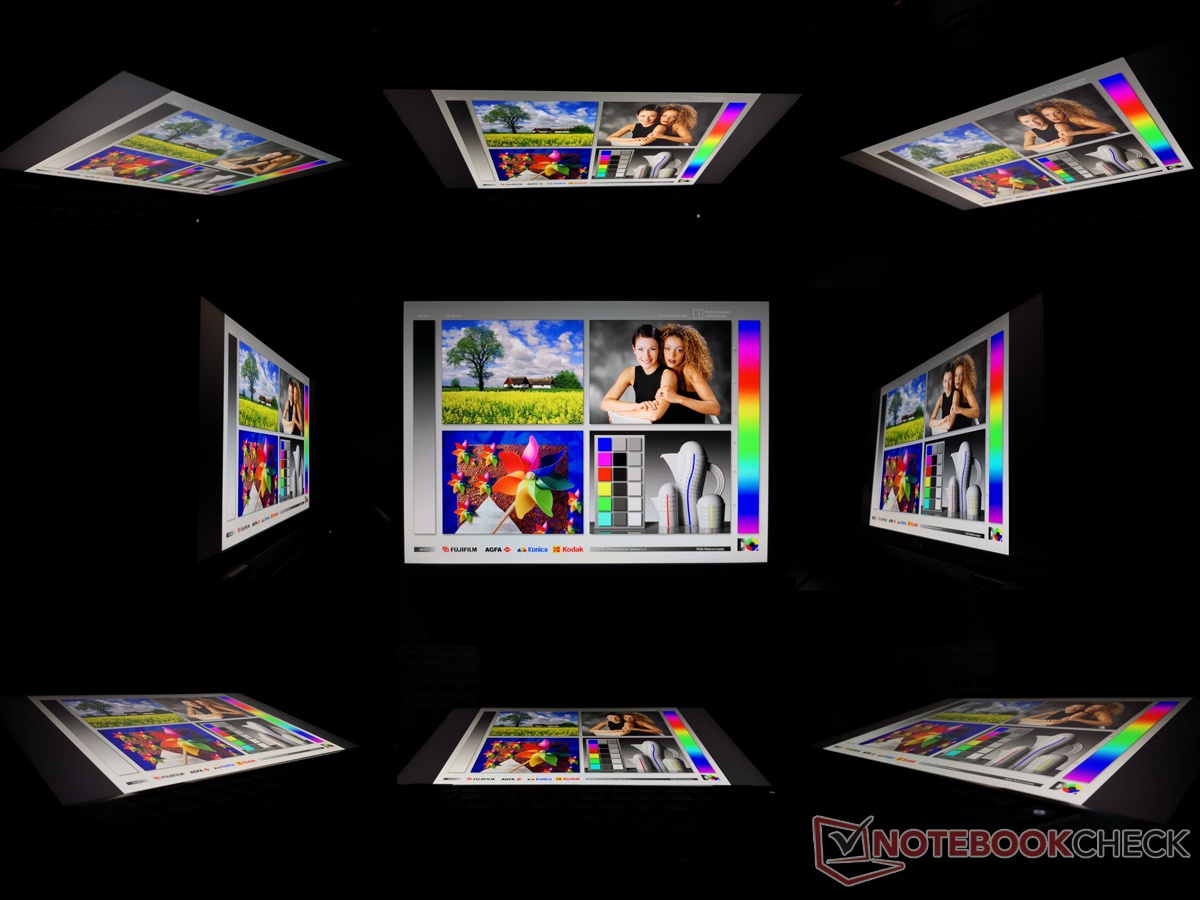
Todas las opciones son FHD, WVA/IPS, y sólo mate, lo que significa que no hay alternativas 2K, 4K, OLED o brillantes. Recomendamos evitar el primer panel debido a su tenue retroiluminación y su estrecho rango de colores. Nuestra unidad de prueba específica viene equipada con la cuarta opción anterior.
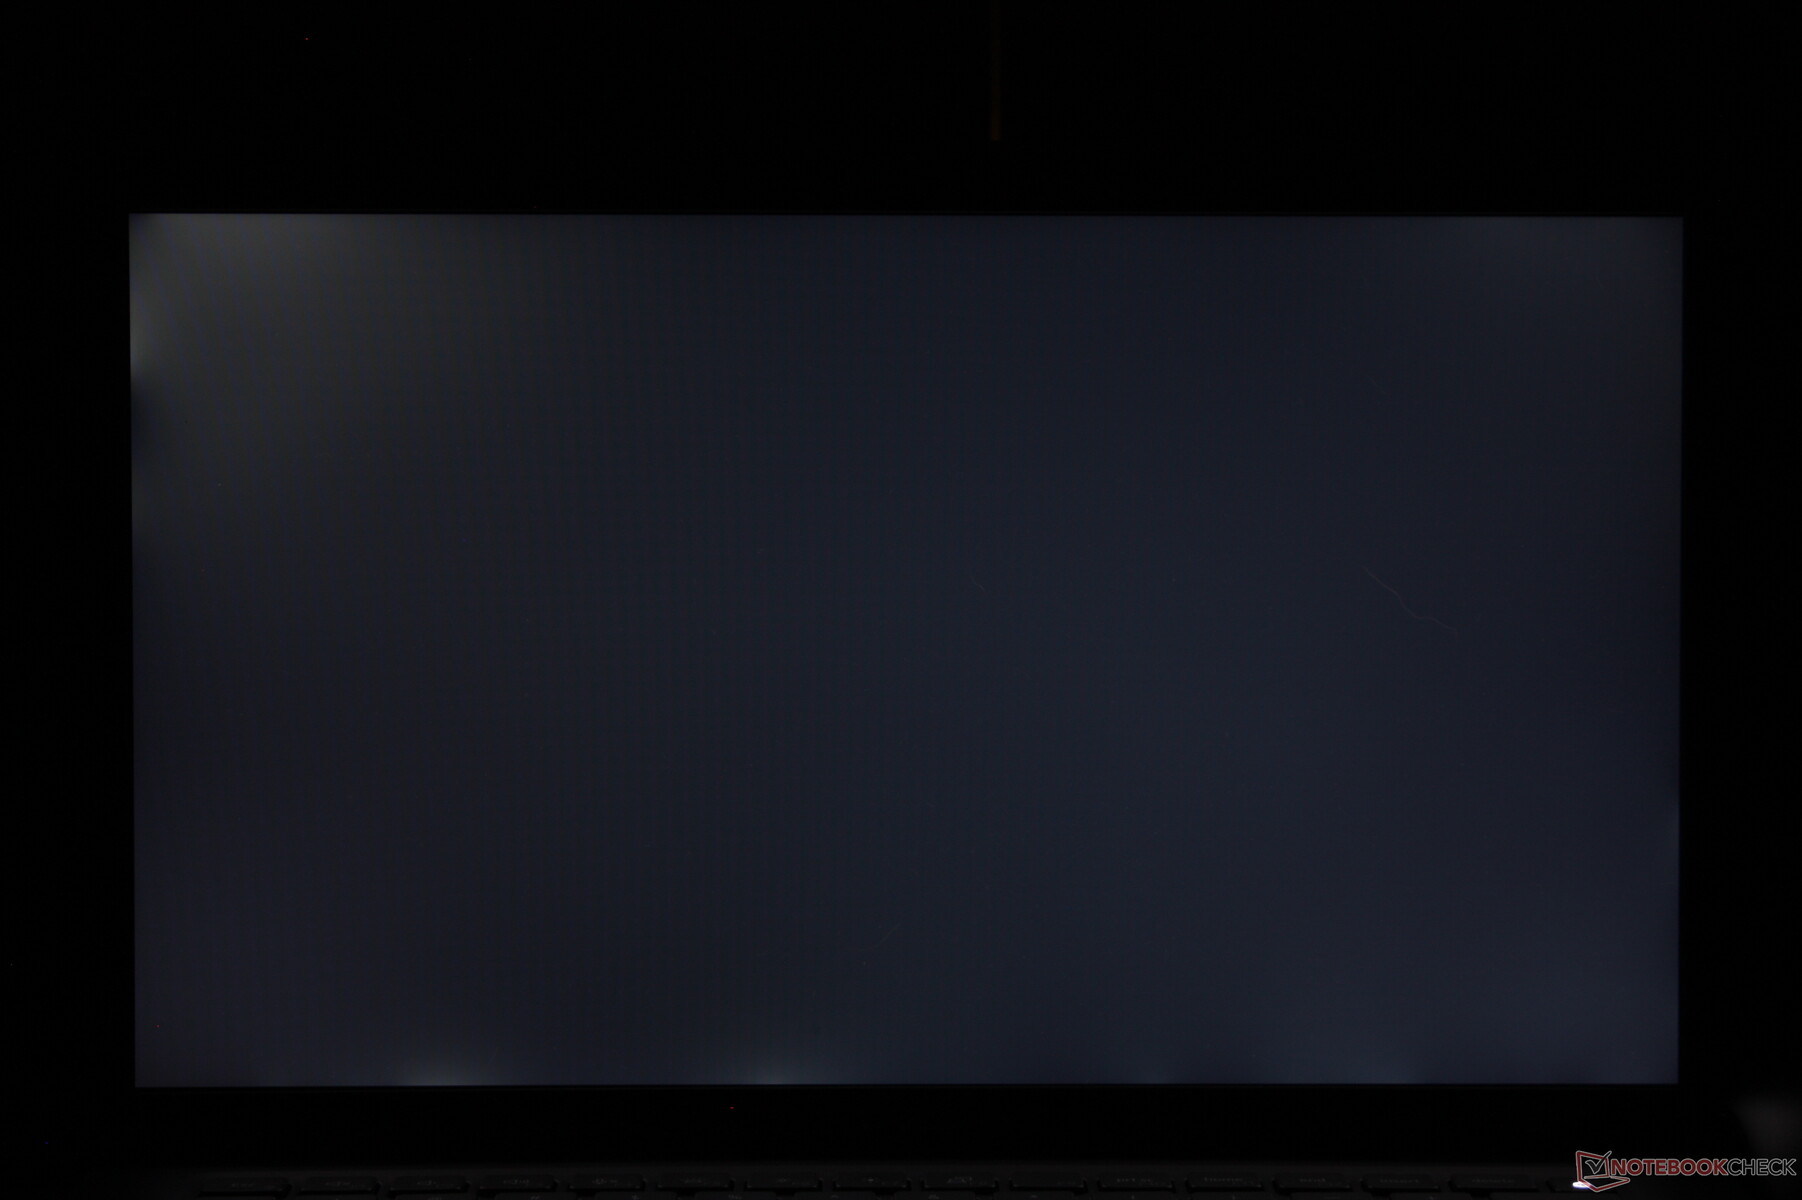
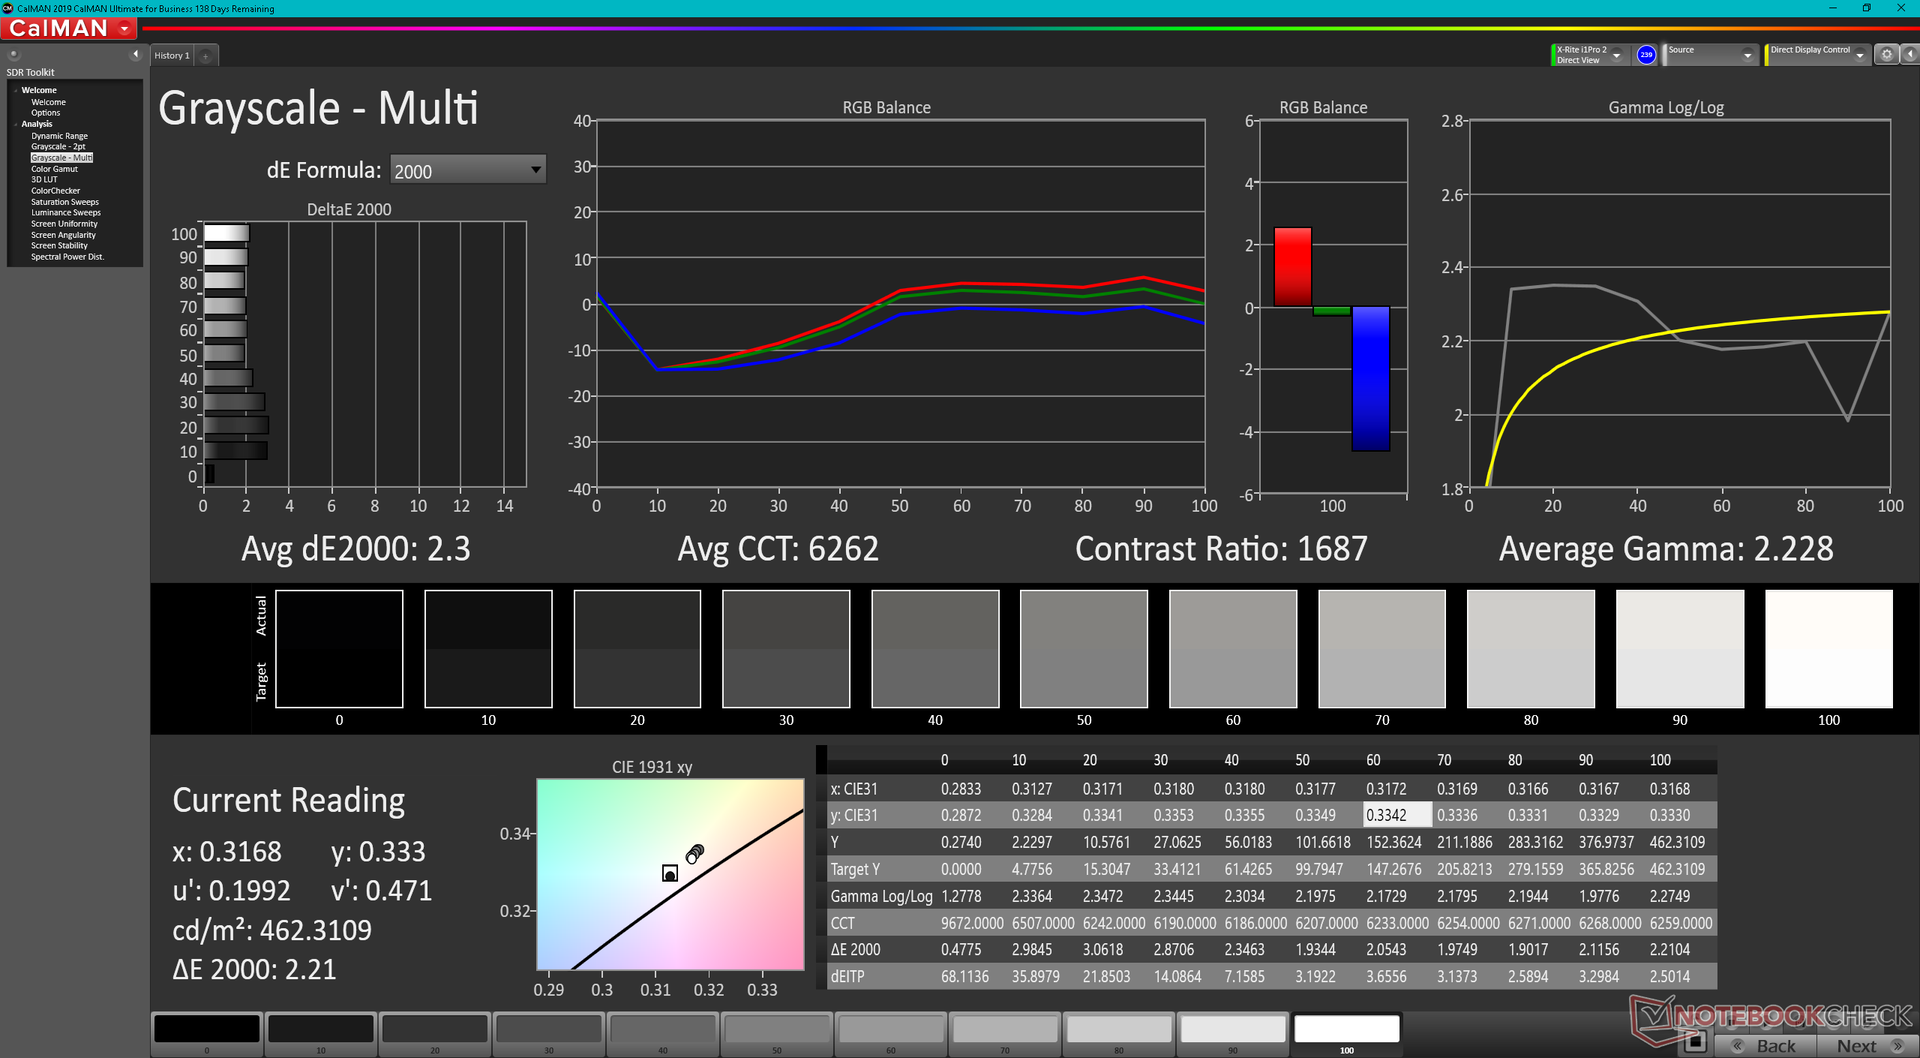
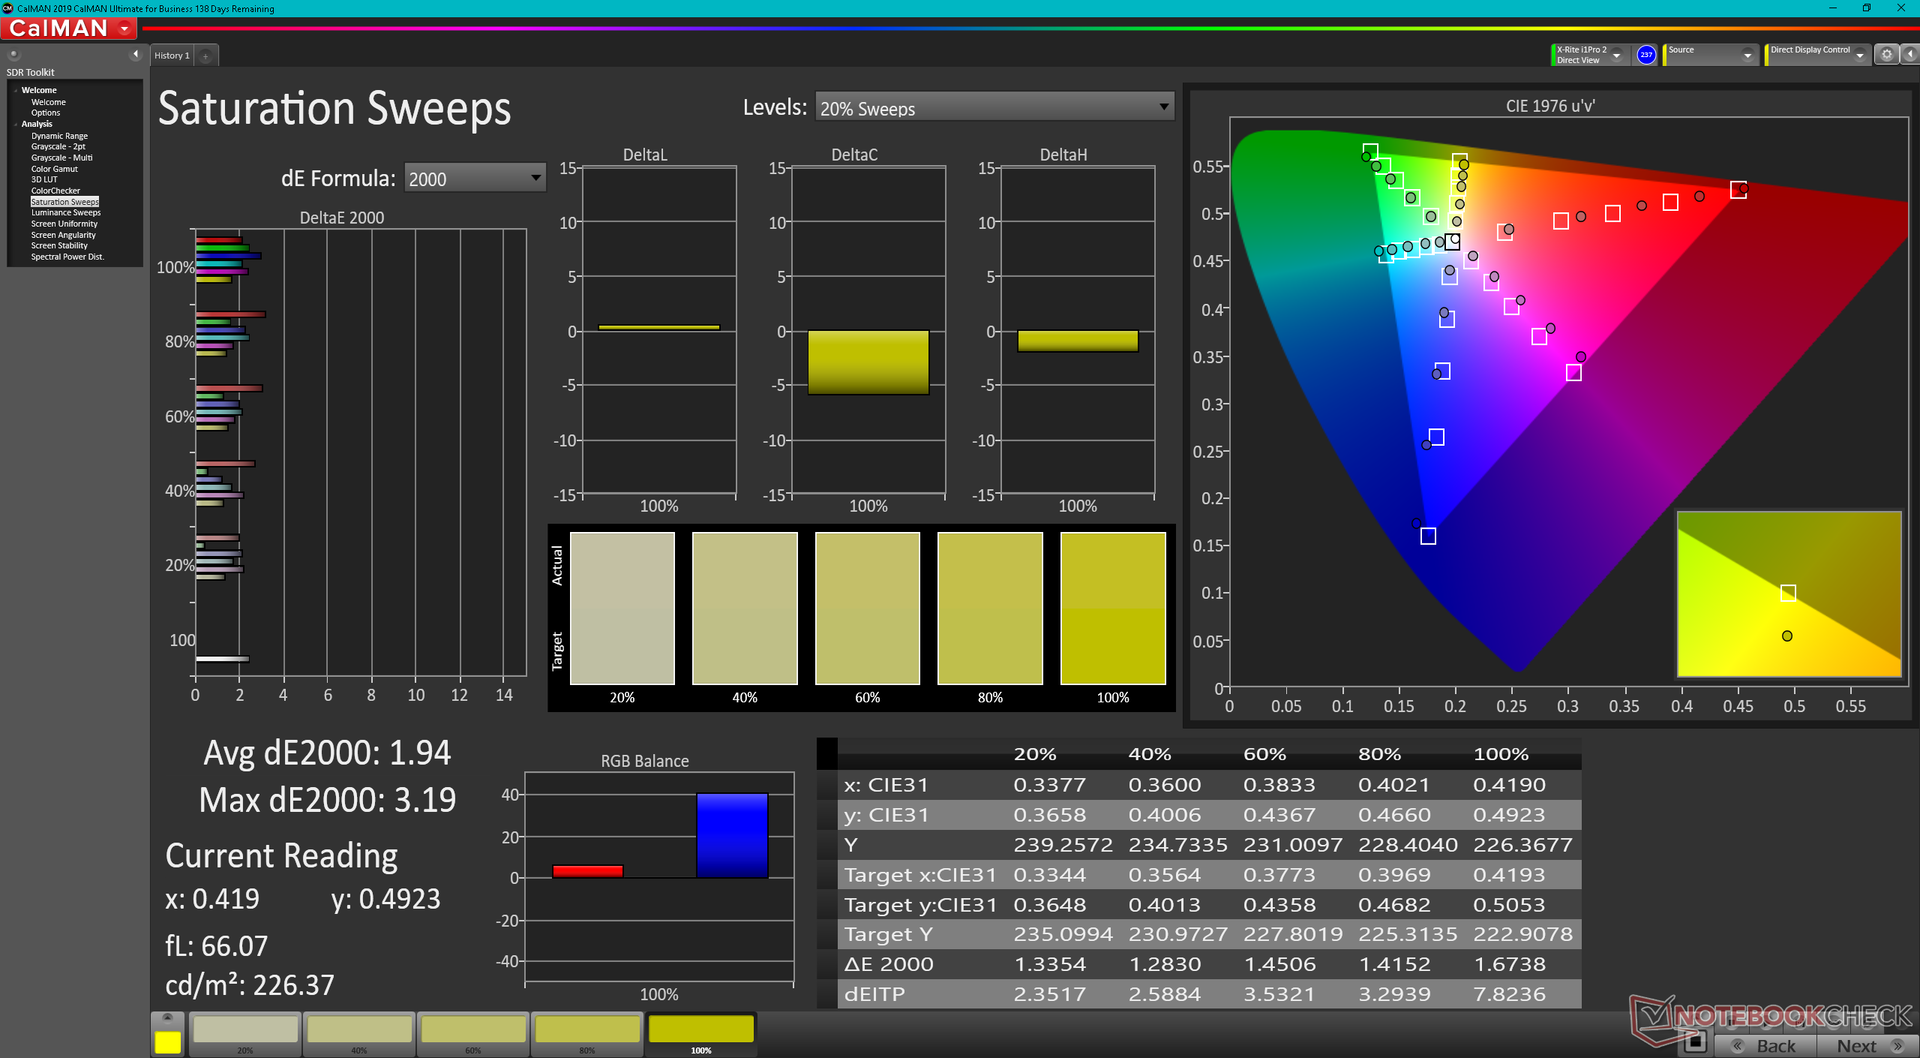
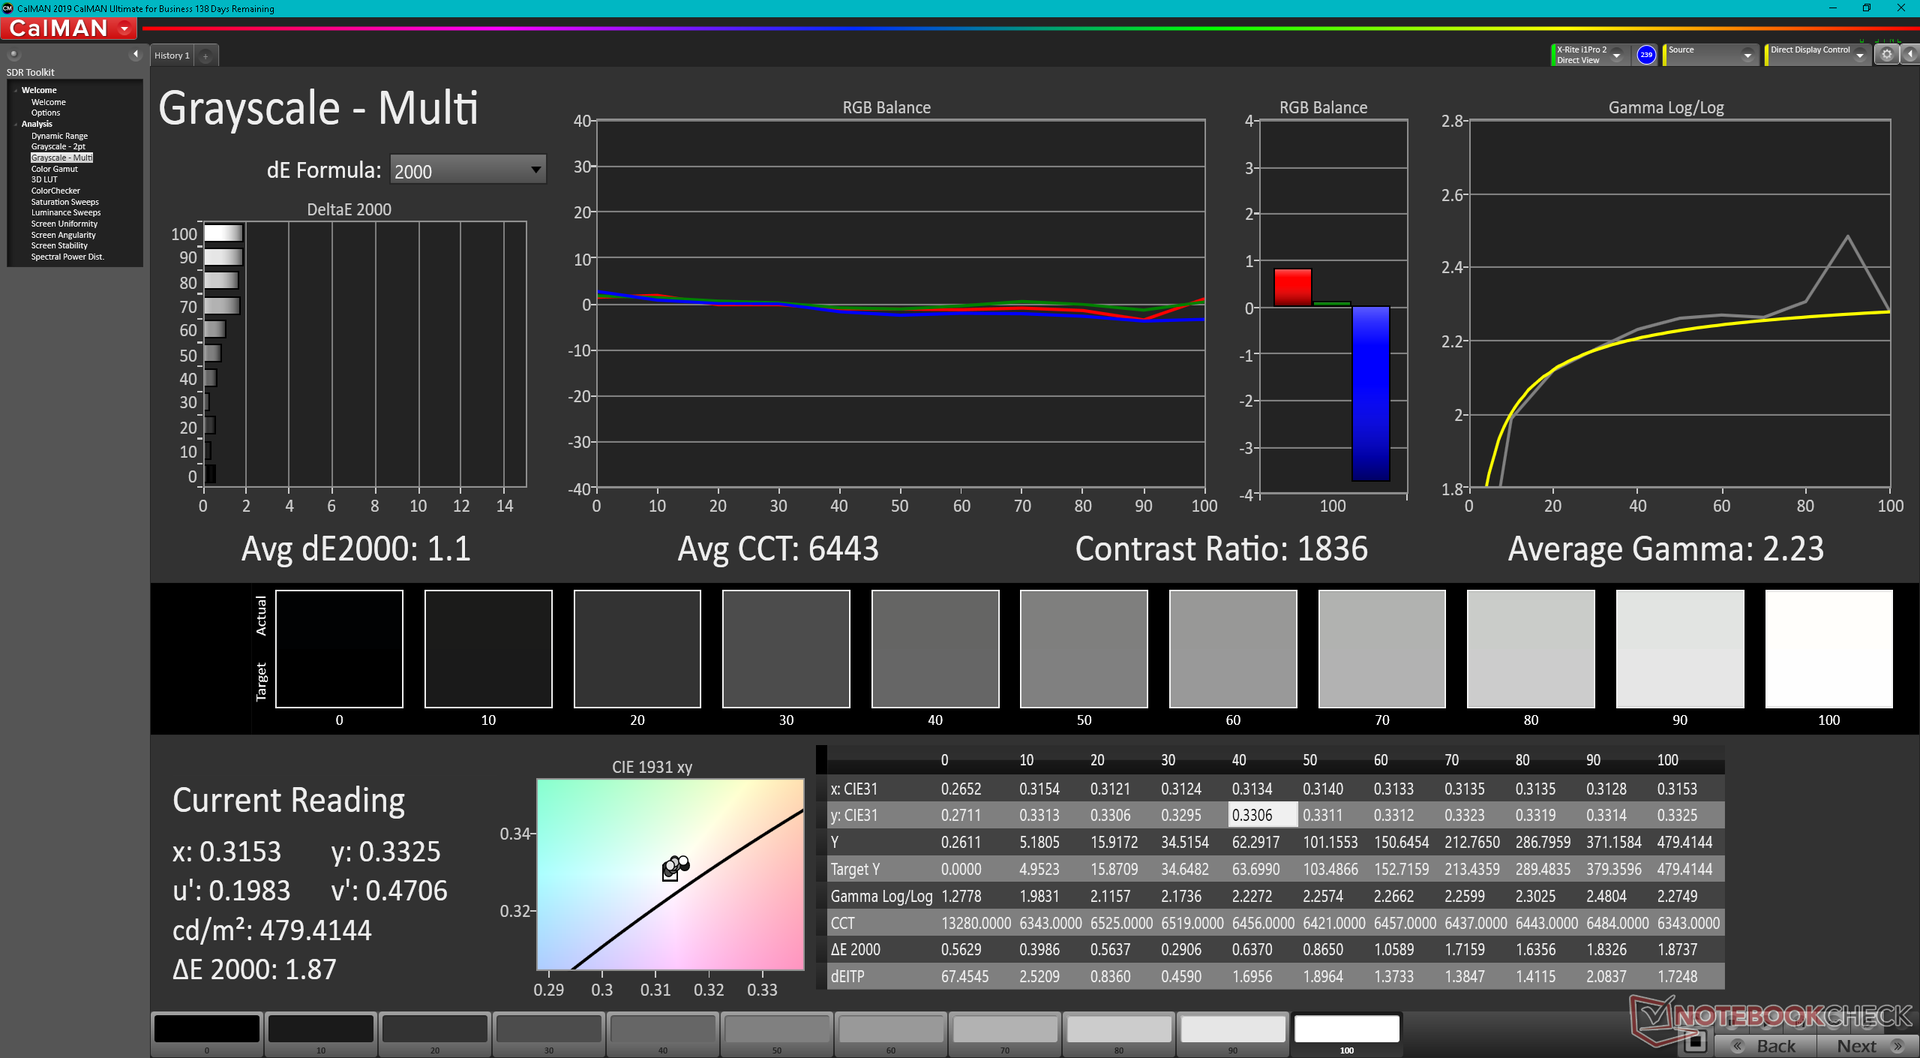
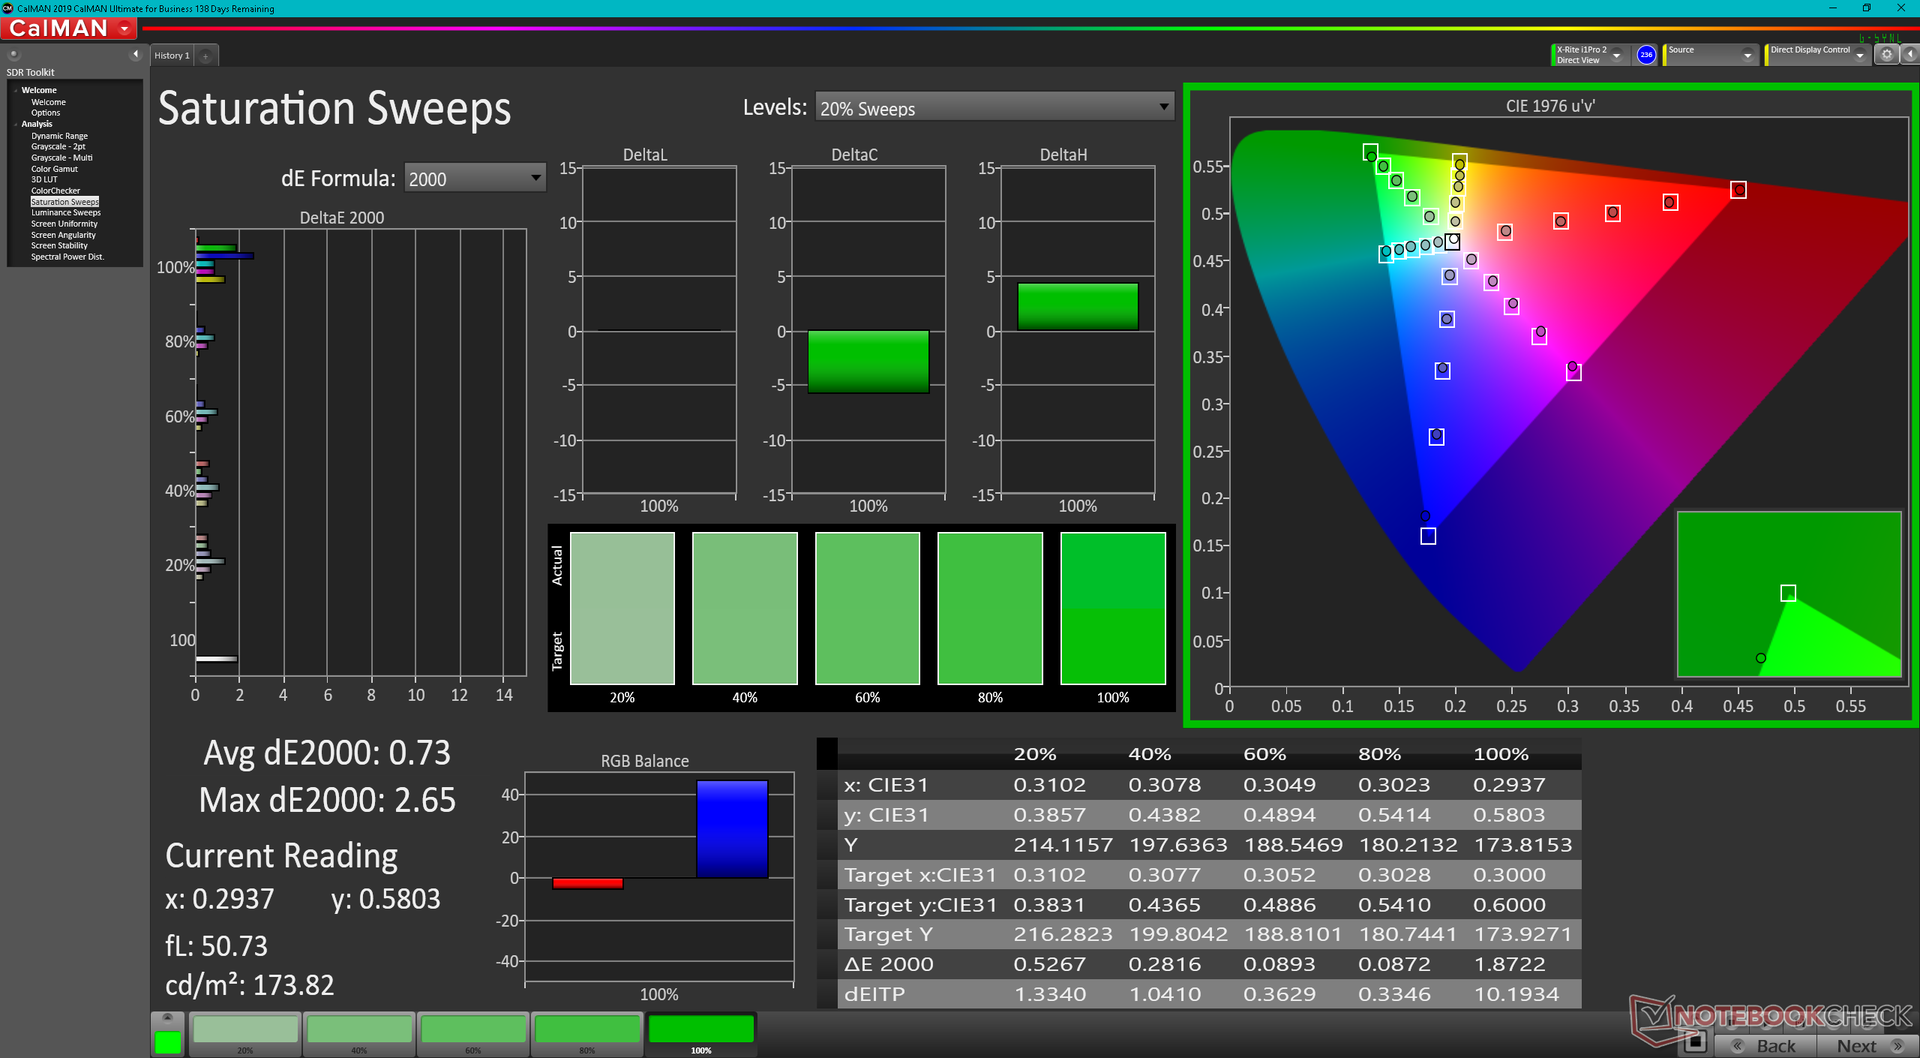
Nuestras mediciones independientes muestran una cobertura sRGB ligeramente menor del 93 por ciento pero un brillo máximo medio ligeramente más brillante de 445 nits. Sigue siendo una pantalla de calidad teniendo en cuenta su alto ratio de contraste de más de 1000:1, pero esperamos que las futuras unidades incluyan OLED para conseguir tiempos de respuesta más rápidos en blanco y gris o al menos paneles con mayor frecuencia de refresco para una interfaz de usuario más fluida.
| |||||||||||||||||||||||||
iluminación: 89 %
Brillo con batería: 460.1 cd/m²
Contraste: 1484:1 (Negro: 0.31 cd/m²)
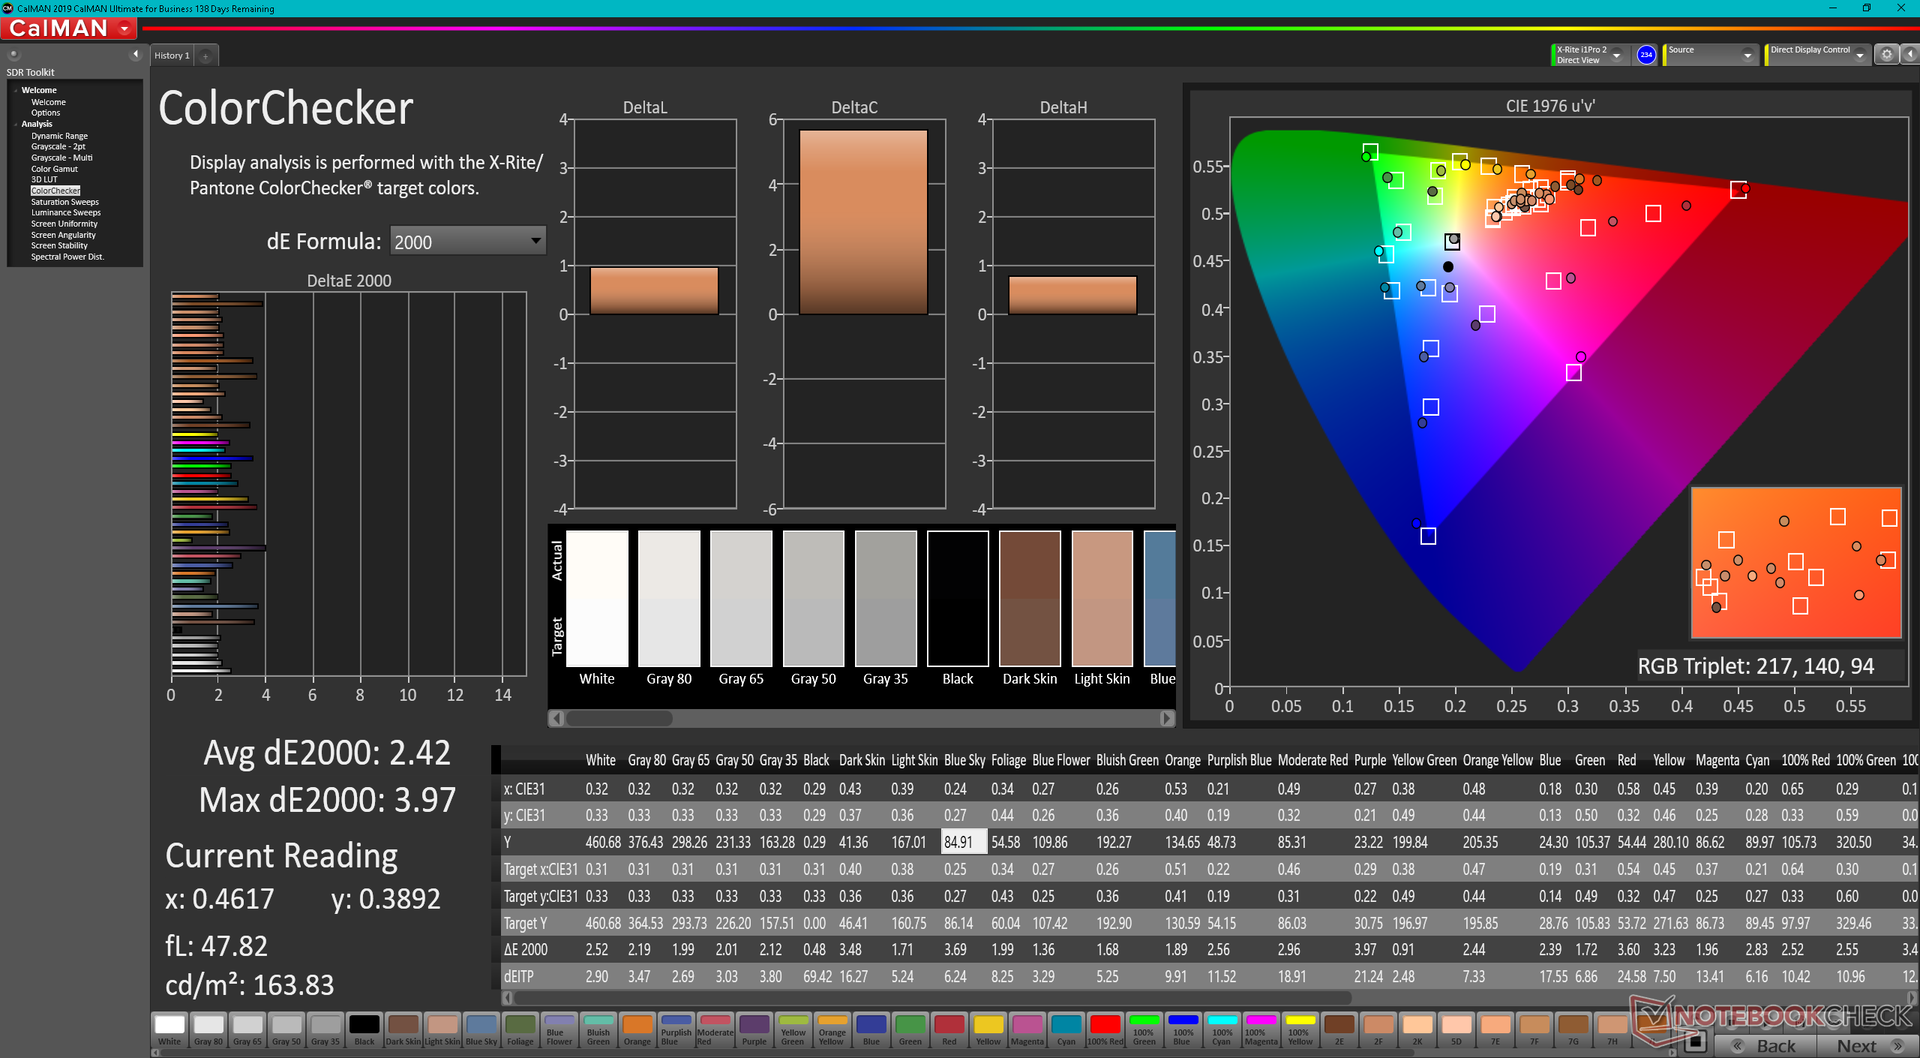
ΔE ColorChecker Calman: 2.42 | ∀{0.5-29.43 Ø4.71}
calibrated: 0.77
ΔE Greyscale Calman: 2.3 | ∀{0.09-98 Ø4.96}
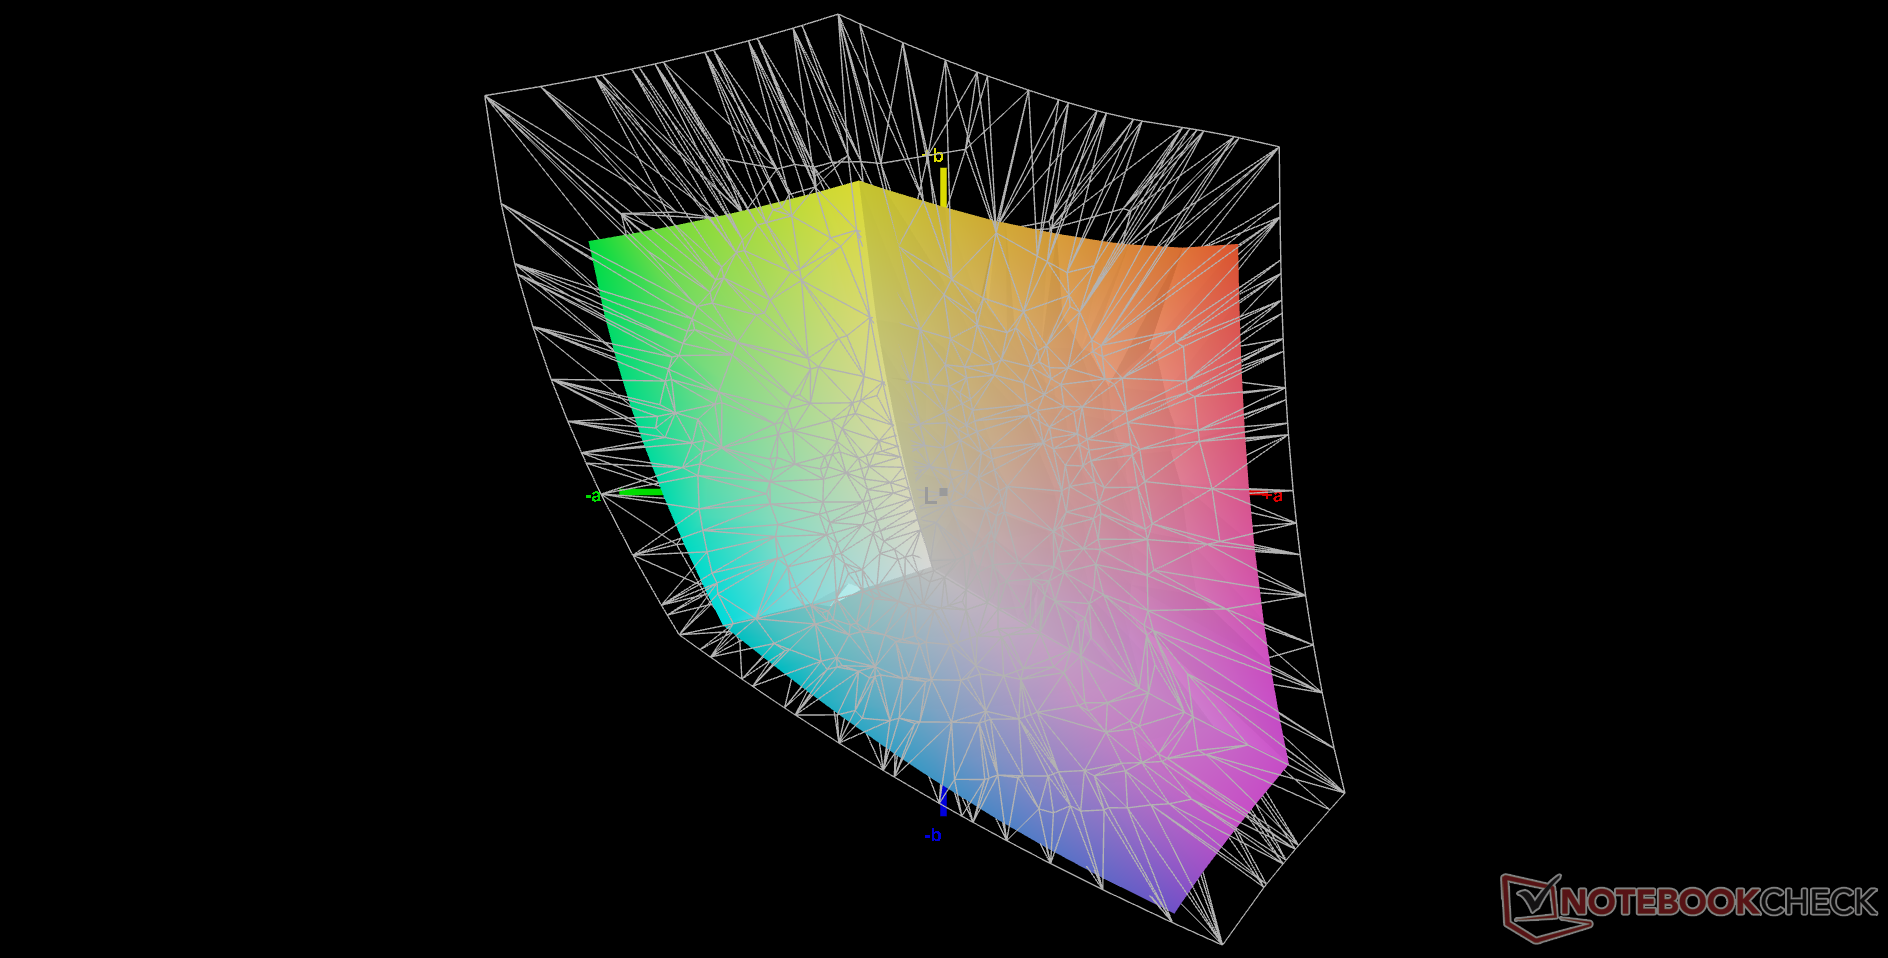
68.2% AdobeRGB 1998 (Argyll 3D)
93.5% sRGB (Argyll 3D)
66.1% Display P3 (Argyll 3D)
Gamma: 2.23
CCT: 6262 K
| Dell Latitude 13 7330 LG Philips 133WF9, IPS, 1920x1080, 13.3" | Lenovo ThinkPad X13 Yoga 20SX0004GE N133HCG-GR3, IPS, 1920x1080, 13.3" | Framework Laptop 13.5 12th Gen Intel BOE CQ NE135FBM-N41, IPS, 2256x1504, 13.5" | Razer Book 13 FHD Sharp LQ134N1JW48, IPS, 1920x1200, 13.4" | Dell Latitude 7310 AU Optronics B133HAN, IPS, 1920x1080, 13.3" | Microsoft Surface Laptop 4 13 i7 LQ135P1JX51, IPS, 2256x1504, 13.5" | |
|---|---|---|---|---|---|---|
| Display | 3% | 5% | 6% | 7% | 0% | |
| Display P3 Coverage (%) | 66.1 | 67.2 2% | 69.9 6% | 70.1 6% | 71.8 9% | 64.7 -2% |
| sRGB Coverage (%) | 93.5 | 98.1 5% | 99.4 6% | 99.3 6% | 99.3 6% | 97.2 4% |
| AdobeRGB 1998 Coverage (%) | 68.2 | 69 1% | 71.1 4% | 71.6 5% | 72.4 6% | 66.9 -2% |
| Response Times | -6% | 18% | -24% | 10% | -32% | |
| Response Time Grey 50% / Grey 80% * (ms) | 48.4 ? | 56 ? -16% | 34.7 ? 28% | 56.8 ? -17% | 40.8 ? 16% | 62.8 ? -30% |
| Response Time Black / White * (ms) | 29.6 ? | 28 ? 5% | 27.5 ? 7% | 38.8 ? -31% | 28.8 ? 3% | 39.8 ? -34% |
| PWM Frequency (Hz) | 2475 ? | 21930 ? | ||||
| Screen | 2% | -25% | -9% | -9% | -11% | |
| Brightness middle (cd/m²) | 460.1 | 401 -13% | 449.6 -2% | 545.3 19% | 332.7 -28% | 413 -10% |
| Brightness (cd/m²) | 445 | 383 -14% | 431 -3% | 507 14% | 329 -26% | 400 -10% |
| Brightness Distribution (%) | 89 | 91 2% | 90 1% | 88 -1% | 89 0% | 94 6% |
| Black Level * (cd/m²) | 0.31 | 0.16 48% | 0.31 -0% | 0.31 -0% | 0.25 19% | 0.29 6% |
| Contrast (:1) | 1484 | 2506 69% | 1450 -2% | 1759 19% | 1331 -10% | 1424 -4% |
| Colorchecker dE 2000 * | 2.42 | 2.6 -7% | 2.76 -14% | 1.39 43% | 2.15 11% | 2.8 -16% |
| Colorchecker dE 2000 max. * | 3.97 | 4.2 -6% | 7.96 -101% | 2.61 34% | 3.89 2% | 7.2 -81% |
| Colorchecker dE 2000 calibrated * | 0.77 | 0.9 -17% | 0.58 25% | 2.72 -253% | 1.09 -42% | 0.8 -4% |
| Greyscale dE 2000 * | 2.3 | 3.3 -43% | 5.2 -126% | 1.3 43% | 2.5 -9% | 1.9 17% |
| Gamma | 2.23 99% | 2.01 109% | 2.23 99% | 2.2 100% | 2.3 96% | 2.12 104% |
| CCT | 6262 104% | 6076 107% | 6475 100% | 6476 100% | 6347 102% | 6510 100% |
| Color Space (Percent of AdobeRGB 1998) (%) | 62.7 | 65.9 | 64.1 | 61.6 | ||
| Color Space (Percent of sRGB) (%) | 98.1 | 99.6 | 99.4 | 97.2 | ||
| Media total (Programa/Opciones) | -0% /
1% | -1% /
-12% | -9% /
-8% | 3% /
-3% | -14% /
-11% |
* ... más pequeño es mejor
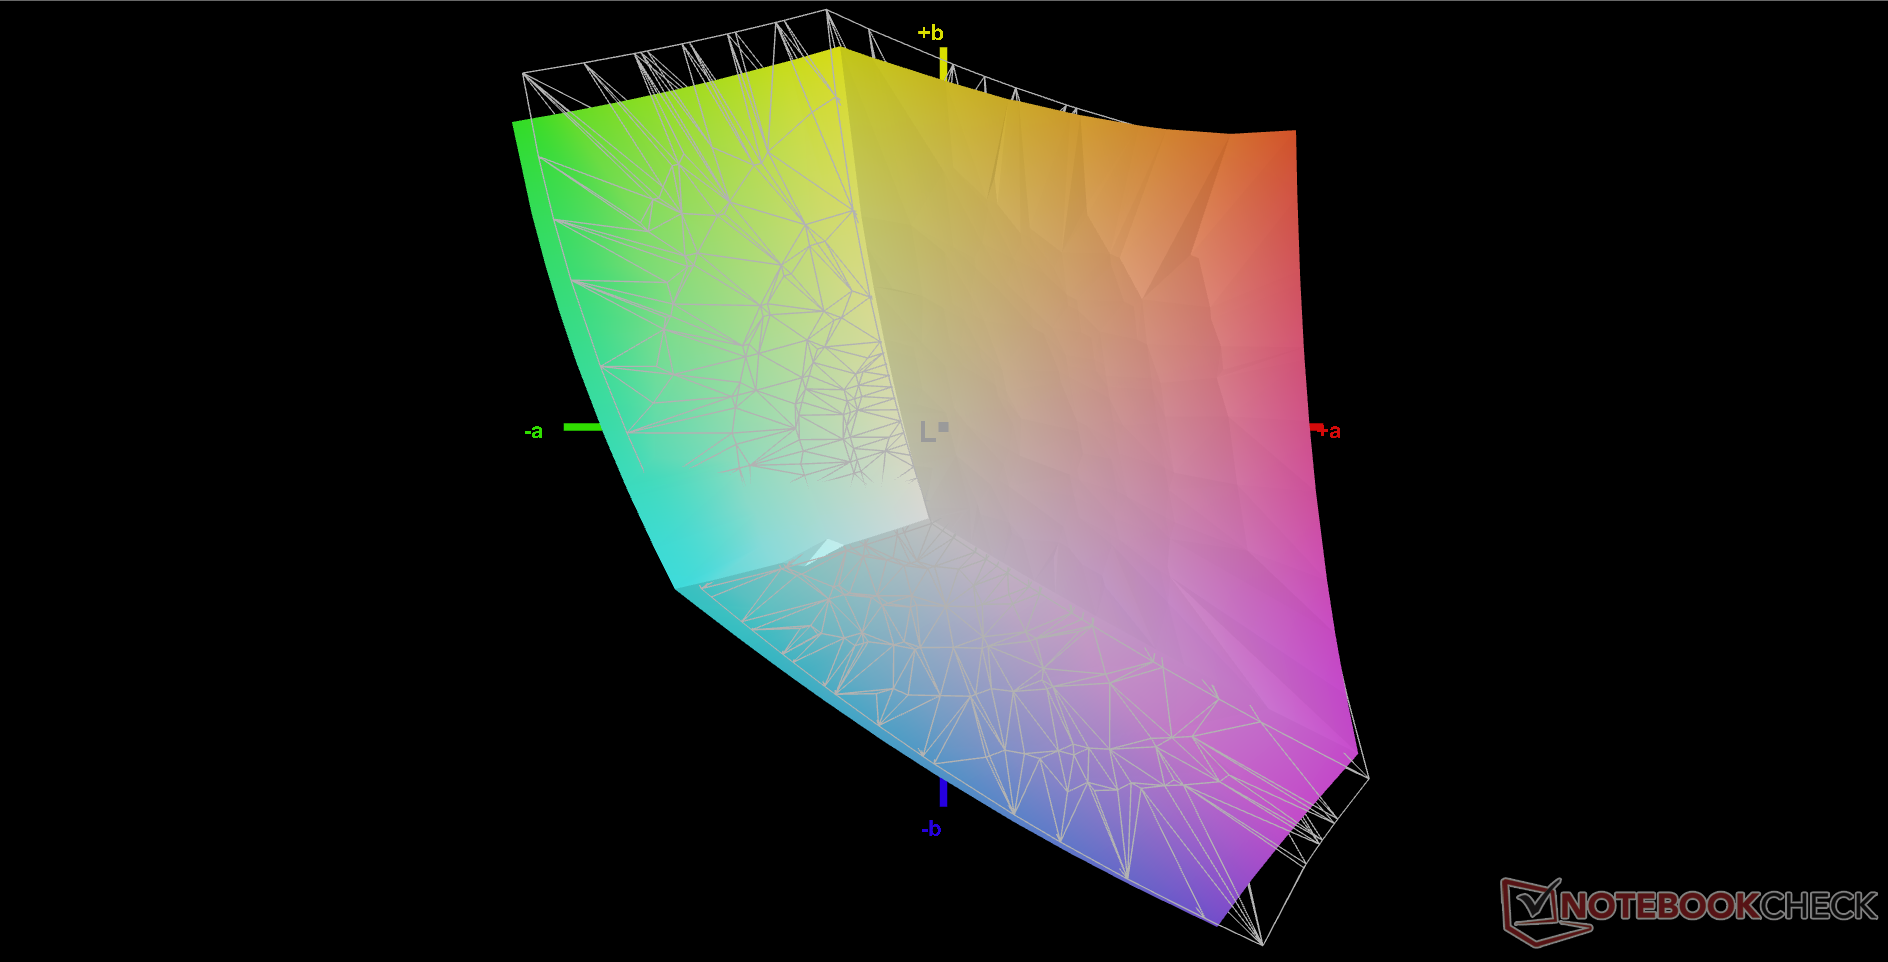
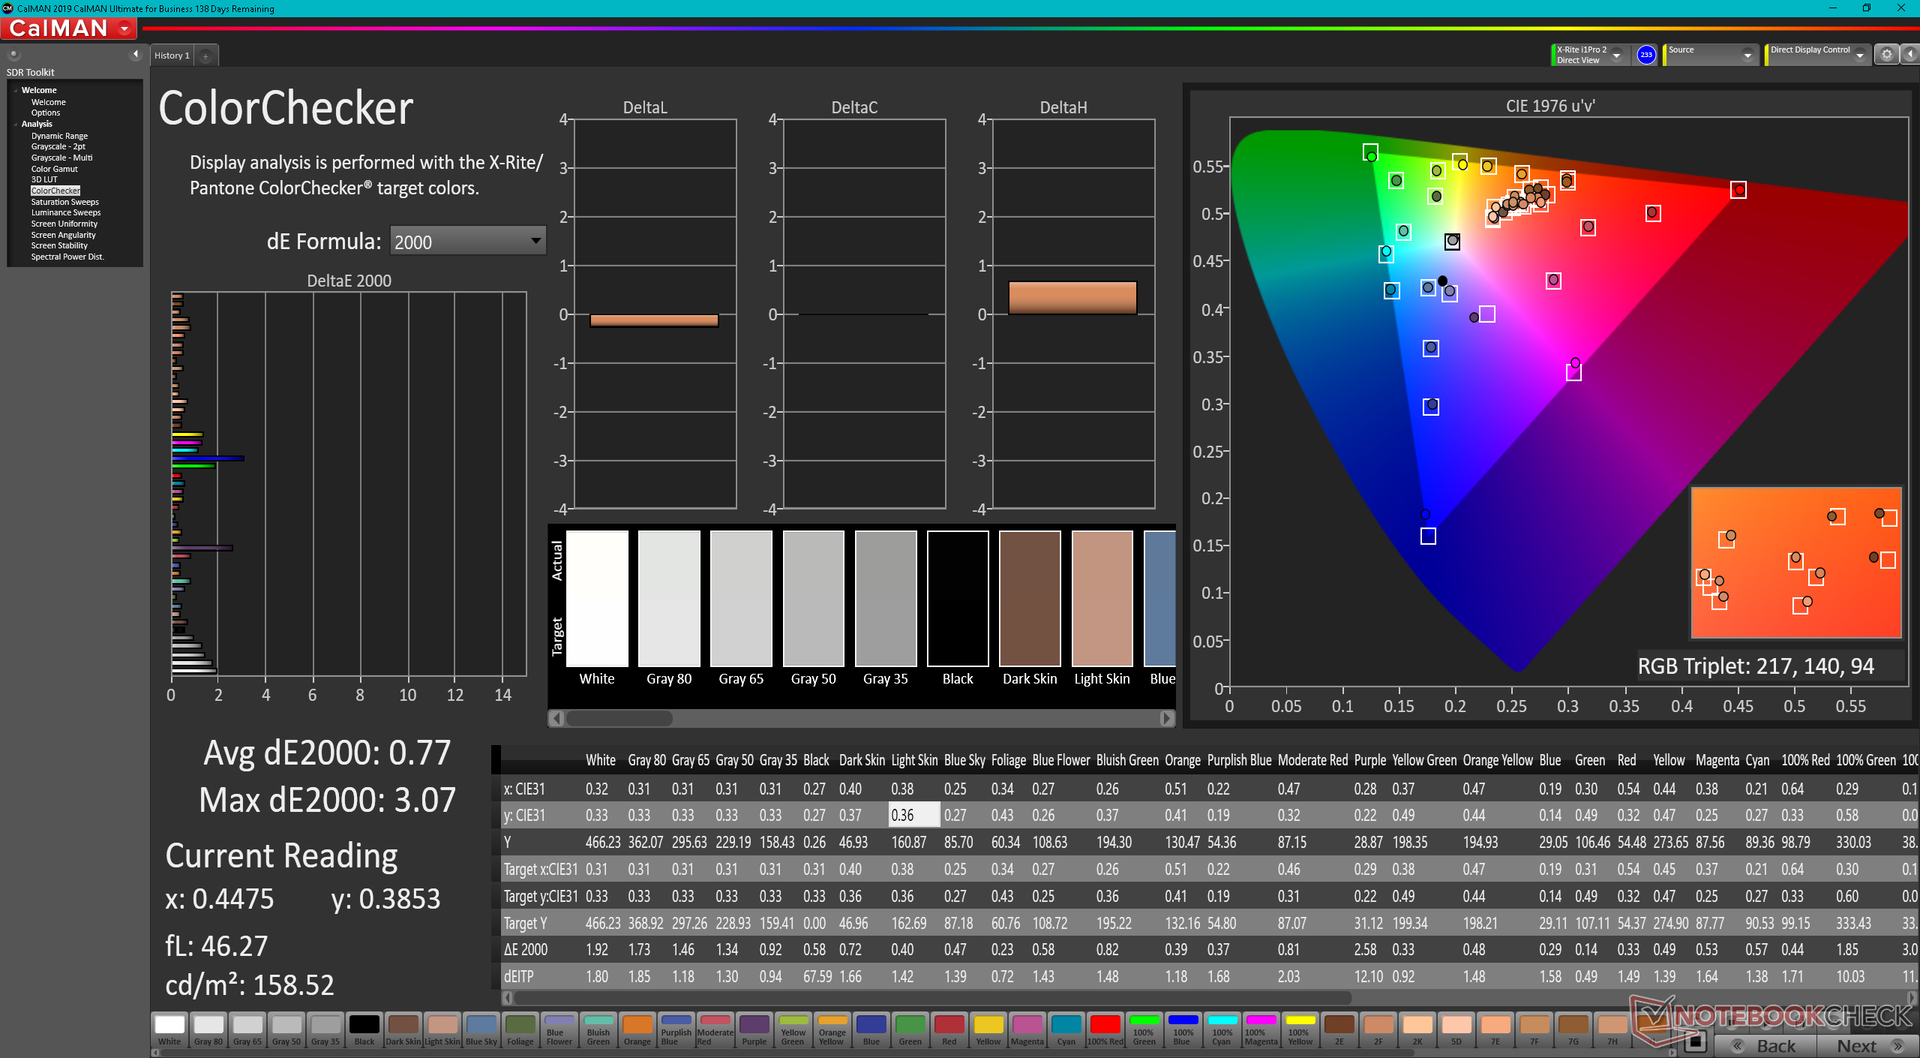
La pantalla está bien calibrada al sacarla de la caja, con unos valores medios de escala de grises y deltaE de sólo 2,3 y 2,42, respectivamente, como muestran nuestros resultados CalMAN más abajo. Si lo calibramos aún más con un colorímetro X-Rite, los valores medios de DeltaE mejorarían a menos de 1.
Tiempos de respuesta del display
| ↔ Tiempo de respuesta de Negro a Blanco | ||
|---|---|---|
| 29.6 ms ... subida ↗ y bajada ↘ combinada | ↗ 14.8 ms subida | 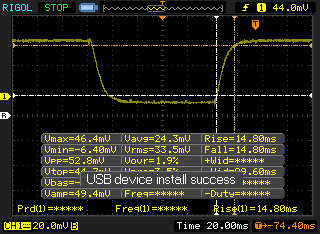 |
| ↘ 14.8 ms bajada | ||
| La pantalla mostró tiempos de respuesta relativamente lentos en nuestros tests pero podría ser demasiado lenta para los jugones. En comparación, todos los dispositivos de prueba van de ##min### (mínimo) a 240 (máximo) ms. » 79 % de todos los dispositivos son mejores. Eso quiere decir que el tiempo de respuesta es peor que la media (19.8 ms) de todos los dispositivos testados. | ||
| ↔ Tiempo de respuesta 50% Gris a 80% Gris | ||
| 48.4 ms ... subida ↗ y bajada ↘ combinada | ↗ 23.6 ms subida | 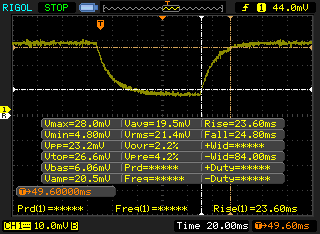 |
| ↘ 24.8 ms bajada | ||
| La pantalla mostró tiempos de respuesta lentos en nuestros tests y podría ser demasiado lenta para los jugones. En comparación, todos los dispositivos de prueba van de ##min### (mínimo) a 636 (máximo) ms. » 84 % de todos los dispositivos son mejores. Eso quiere decir que el tiempo de respuesta es peor que la media (31 ms) de todos los dispositivos testados. | ||
Parpadeo de Pantalla / PWM (Pulse-Width Modulation)
| Parpadeo de Pantalla / PWM no detectado | 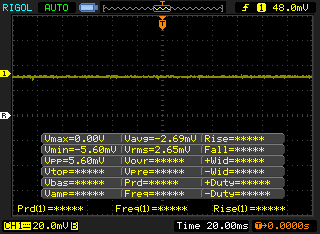 | ||
Comparación: 52 % de todos los dispositivos testados no usaron PWM para atenuar el display. Si se usó, medimos una media de 7751 (mínimo: 5 - máxmo: 343500) Hz. | |||
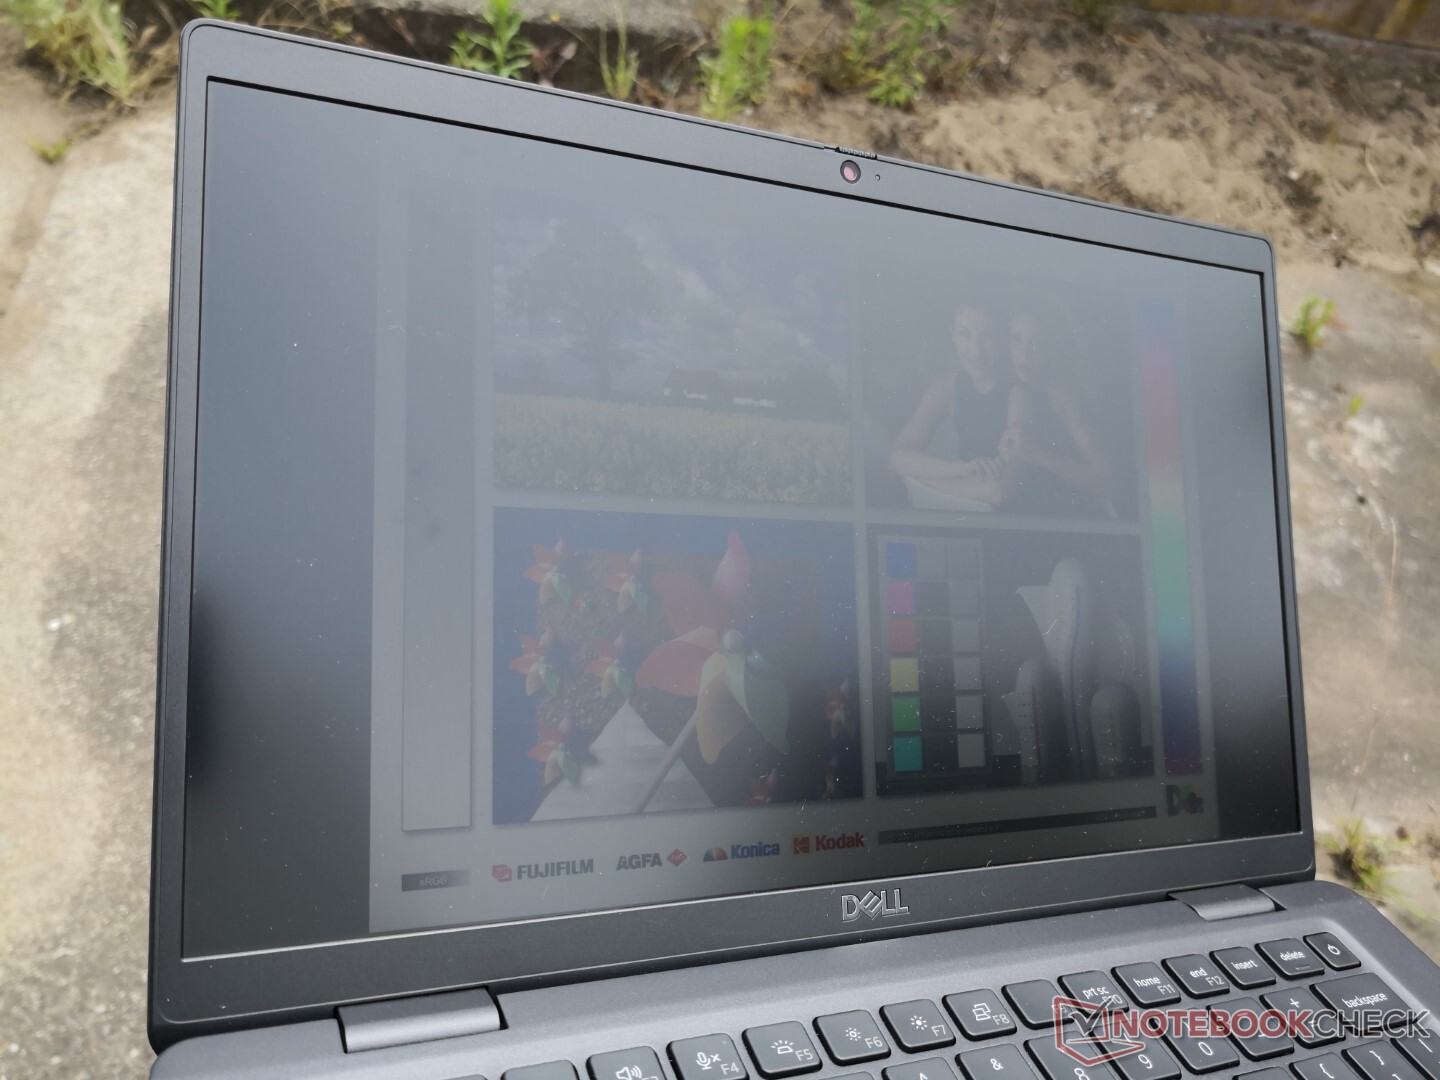
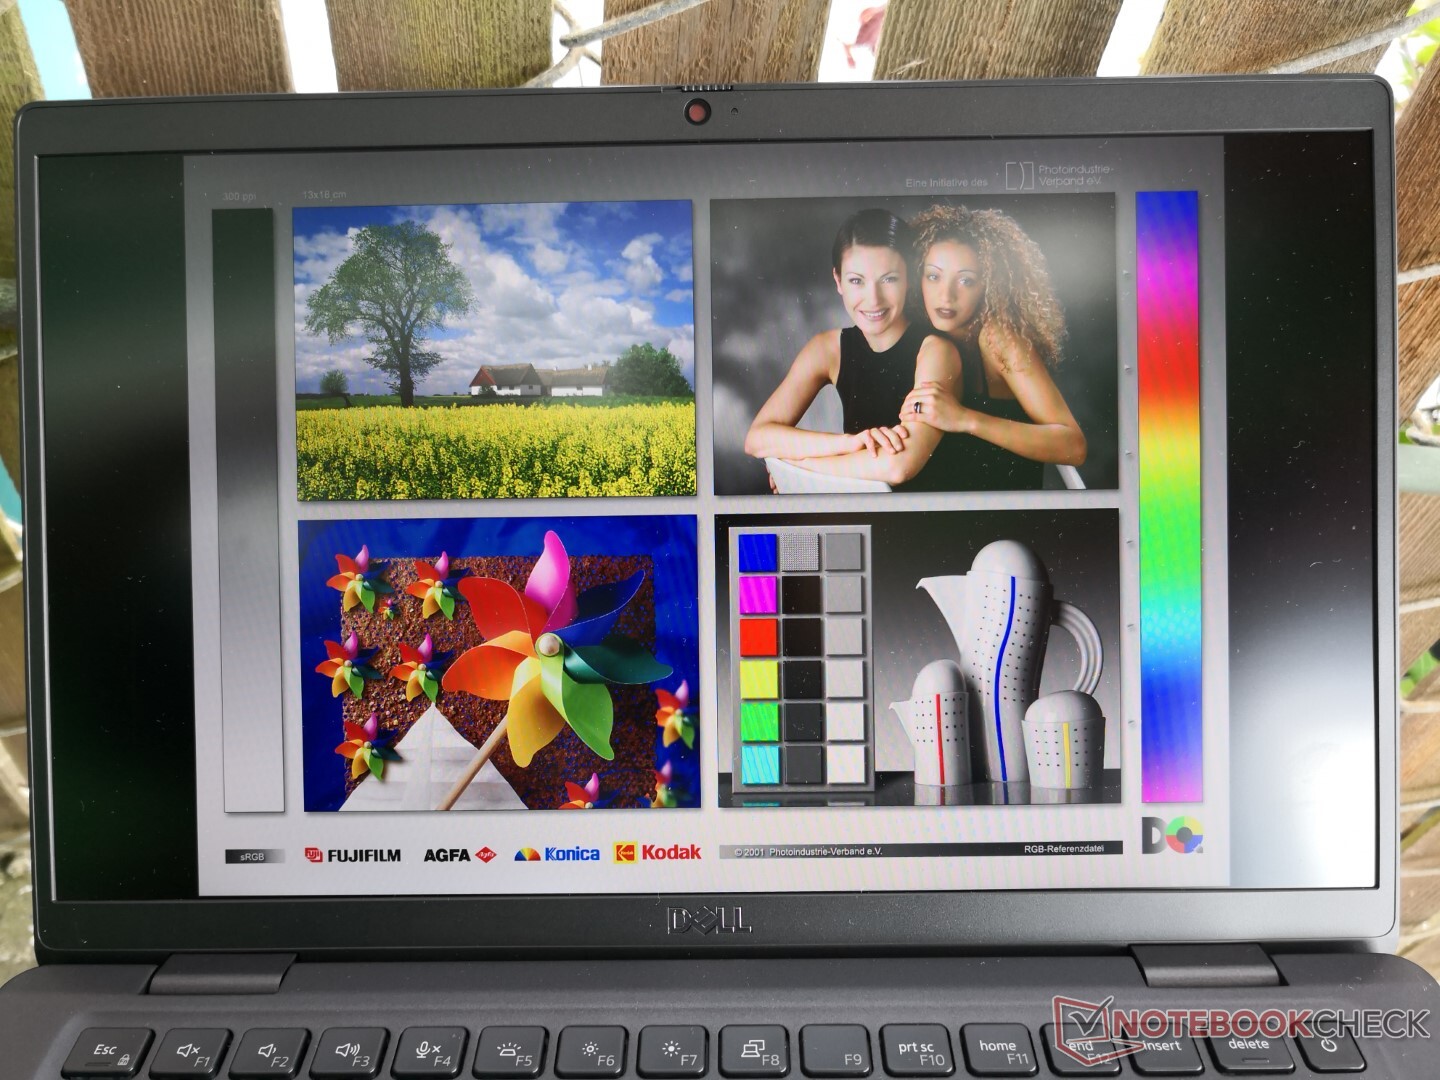
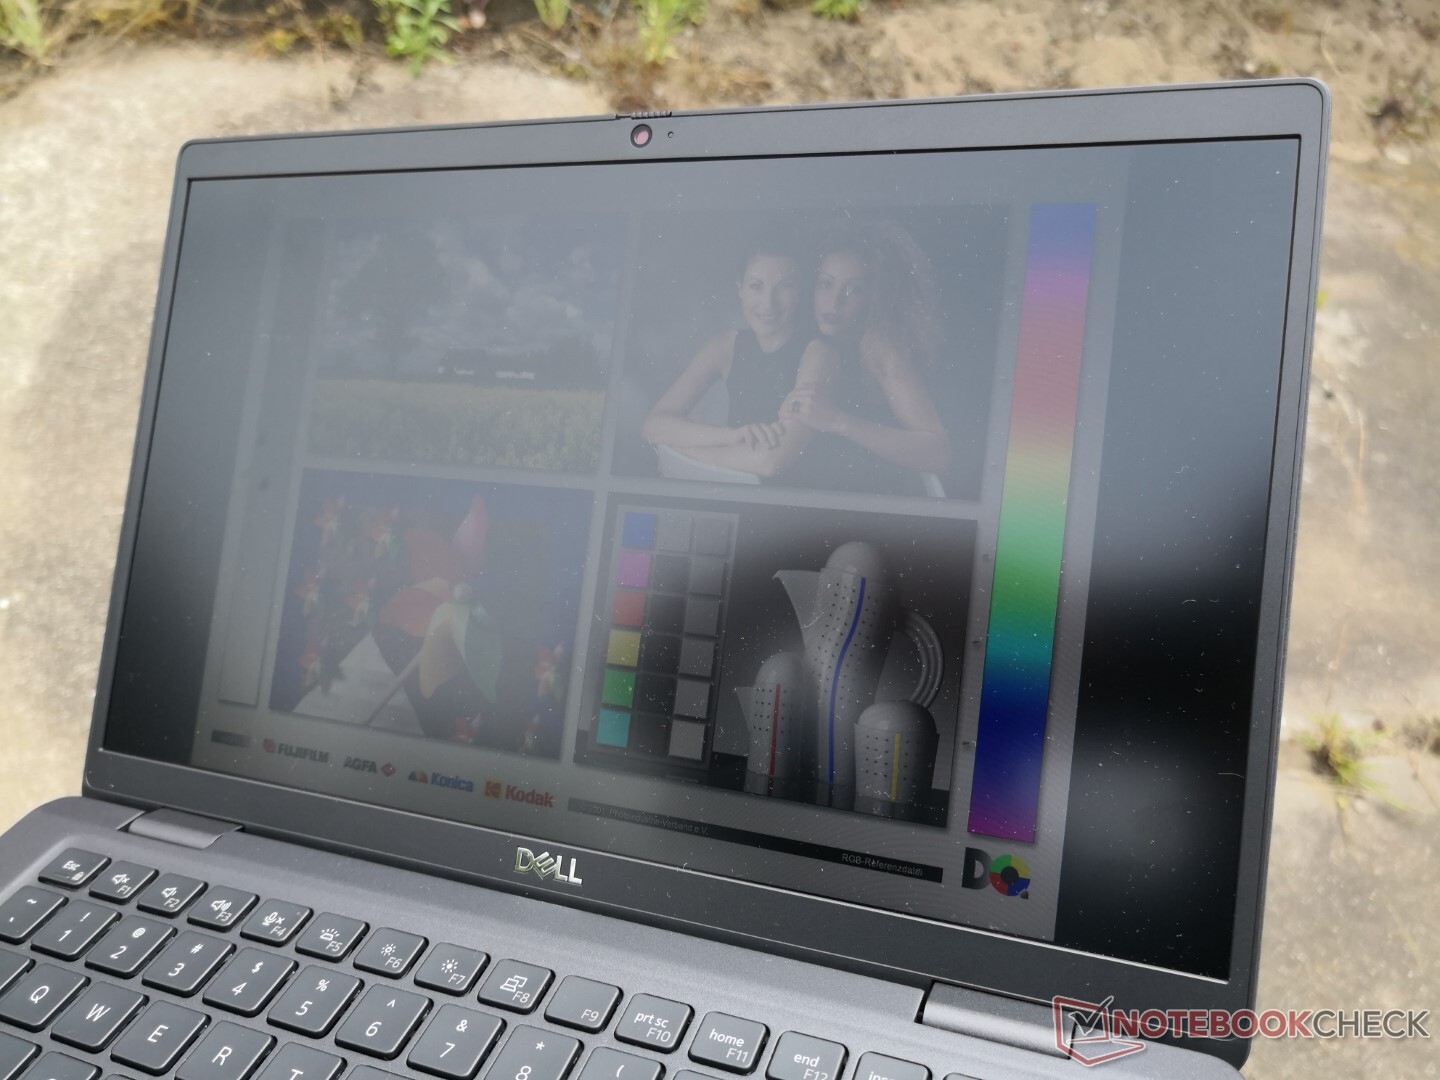
La visibilidad en exteriores es bastante buena si se trabaja a la sombra debido a la pantalla relativamente brillante de ~450 nits y a la superposición mate para reducir los reflejos. Sin embargo, no es lo suficientemente brillante para una visión cómoda en días soleados o brillantes y nublados.
Rendimiento - El Core i7-1265U impresiona
Condiciones de la prueba
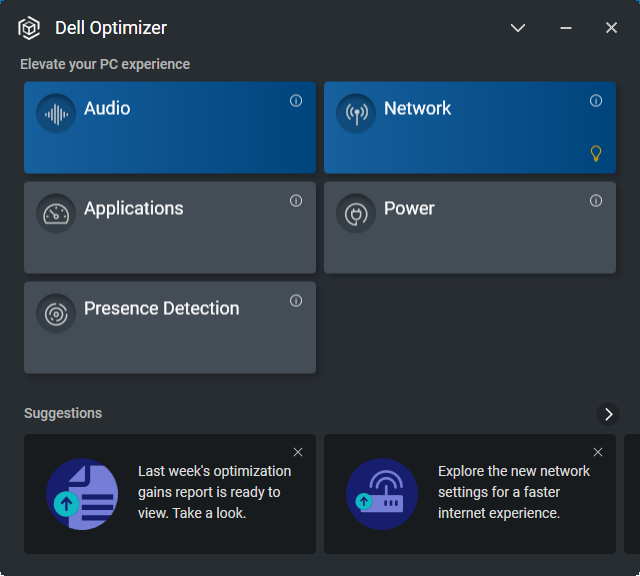
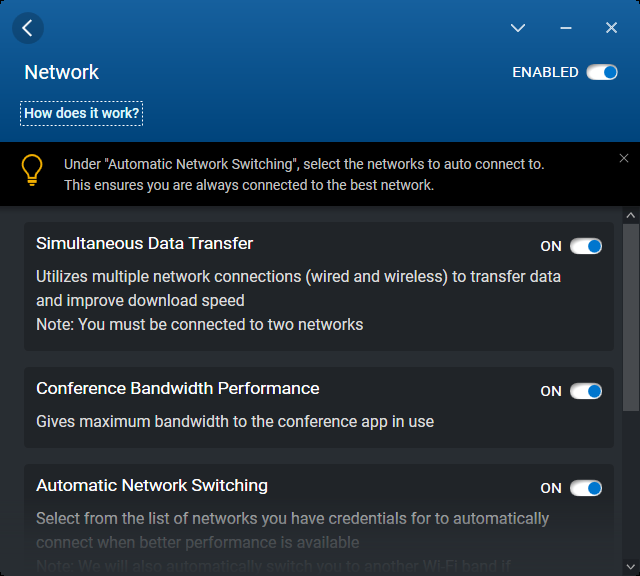
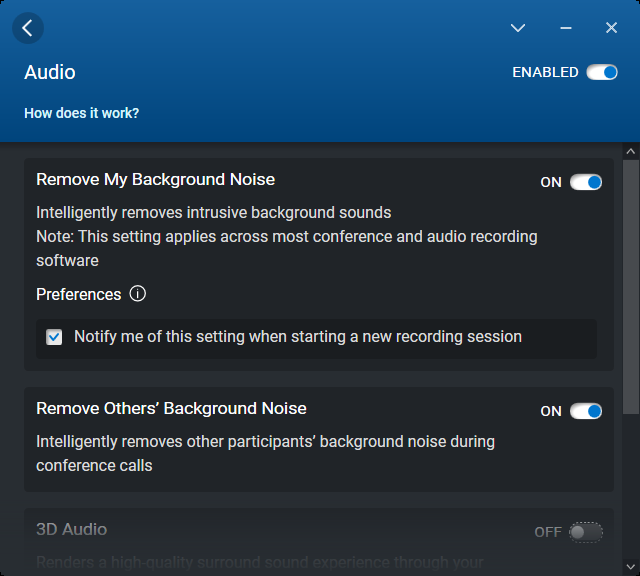
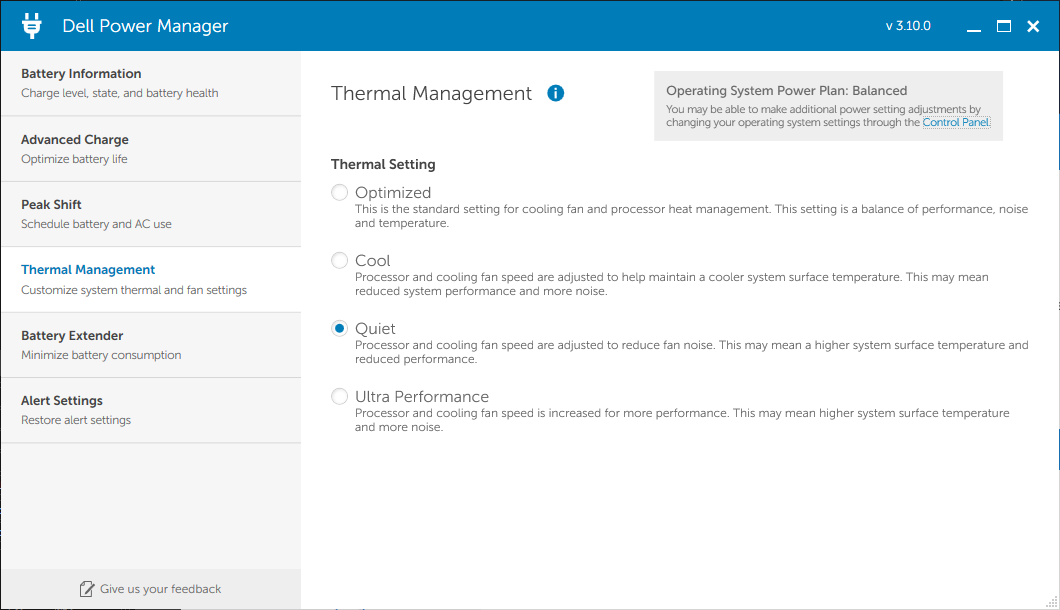
Pusimos nuestra unidad en el modo de rendimiento y en el modo de ultra rendimiento en Windows y en el software Dell Power Manager, respectivamente, antes de ejecutar cualquier prueba de rendimiento. Se recomienda que los propietarios se familiaricen con las aplicaciones preinstaladas Dell Power Manager, Optimizer y Command, ya que sirven como centros para alternar las actualizaciones y características específicas del modelo.
Procesador
Después de ser decepcionado con el Core i5-1235Unuestras esperanzas no eran muy altas para el Core i7-1265U. Afortunadamente, el i7-1265U está demostrando ser todo un demonio de la velocidad a pesar de pertenecer a la familia de la serie U. El rendimiento bruto de un solo hilo y de varios hilos es un 20 y un 60 por ciento superior al del portátil medio de nuestra base de datos equipado con la última generación Core i7-1165G7. De hecho, la CPU está sólo entre un 10 y un 25 por ciento por detrás del más exigente Core i7-1260P. Algunas CPUs de gama alta de AMD, como el Ryzen 7 5700U o5800U pueden igualar o superar al Core i7-1265U en las cargas de trabajo multihilo, pero siguen quedando atrás en las operaciones de un solo hilo
La sostenibilidad del rendimiento es buena, pero definitivamente podría ser mejor. La ejecución de CineBench R15 xT en bucle muestra una puntuación inicial de 1.379 puntos antes de caer constantemente y estabilizarse en torno a los 1.000 puntos, lo que representa una caída de rendimiento de alrededor del 27 por ciento. El limitado potencial de refrigeración de la pequeña solución de refrigeración probablemente impide que la CPU funcione a velocidades de reloj más altas durante periodos más largos.
Cinebench R15 Multi Loop
Cinebench R23: Multi Core | Single Core
Cinebench R15: CPU Multi 64Bit | CPU Single 64Bit
Blender: v2.79 BMW27 CPU
7-Zip 18.03: 7z b 4 | 7z b 4 -mmt1
Geekbench 5.5: Multi-Core | Single-Core
HWBOT x265 Benchmark v2.2: 4k Preset
LibreOffice : 20 Documents To PDF
R Benchmark 2.5: Overall mean
| Cinebench R23 / Multi Core | |
| Framework Laptop 13.5 12th Gen Intel | |
| MSI Summit E14 Flip Evo A12MT | |
| Dell Latitude 13 7330 | |
| HP Pavilion Aero 13 be0097nr | |
| Asus ZenBook 13 OLED UM325UA | |
| Medio Intel Core i7-1265U (4332 - 9219, n=10) | |
| Microsoft Surface Laptop 4 13 Ryzen 5 | |
| Razer Book 13 FHD | |
| Samsung Galaxy Book2 Pro 13 NP930XED-KA1DE | |
| Medio Intel Core i7-1165G7 (2525 - 6862, n=64) | |
| Gateway Ultra Slim 14.1 GWTC51427 | |
| Dell Latitude 5320-TM4V2 | |
| Cinebench R23 / Single Core | |
| MSI Summit E14 Flip Evo A12MT | |
| Dell Latitude 13 7330 | |
| Framework Laptop 13.5 12th Gen Intel | |
| Medio Intel Core i7-1265U (1144 - 1820, n=10) | |
| Gateway Ultra Slim 14.1 GWTC51427 | |
| Medio Intel Core i7-1165G7 (1110 - 1539, n=59) | |
| HP Pavilion Aero 13 be0097nr | |
| Dell Latitude 5320-TM4V2 | |
| Asus ZenBook 13 OLED UM325UA | |
| Microsoft Surface Laptop 4 13 Ryzen 5 | |
| Samsung Galaxy Book2 Pro 13 NP930XED-KA1DE | |
Cinebench R23: Multi Core | Single Core
Cinebench R15: CPU Multi 64Bit | CPU Single 64Bit
Blender: v2.79 BMW27 CPU
7-Zip 18.03: 7z b 4 | 7z b 4 -mmt1
Geekbench 5.5: Multi-Core | Single-Core
HWBOT x265 Benchmark v2.2: 4k Preset
LibreOffice : 20 Documents To PDF
R Benchmark 2.5: Overall mean
* ... más pequeño es mejor
AIDA64: FP32 Ray-Trace | FPU Julia | CPU SHA3 | CPU Queen | FPU SinJulia | FPU Mandel | CPU AES | CPU ZLib | FP64 Ray-Trace | CPU PhotoWorxx
| Performance rating | |
| Microsoft Surface Laptop 4 13 Ryzen 5 | |
| Framework Laptop 13.5 12th Gen Intel | |
| Dell Latitude 13 7330 | |
| Dell Latitude 7310 | |
| Lenovo ThinkPad X13 Yoga 20SX0004GE | |
| AIDA64 / FP32 Ray-Trace | |
| Microsoft Surface Laptop 4 13 Ryzen 5 | |
| Dell Latitude 13 7330 | |
| Framework Laptop 13.5 12th Gen Intel | |
| Dell Latitude 7310 | |
| Lenovo ThinkPad X13 Yoga 20SX0004GE | |
| AIDA64 / FPU Julia | |
| Microsoft Surface Laptop 4 13 Ryzen 5 | |
| Dell Latitude 13 7330 | |
| Framework Laptop 13.5 12th Gen Intel | |
| Dell Latitude 7310 | |
| Lenovo ThinkPad X13 Yoga 20SX0004GE | |
| AIDA64 / CPU SHA3 | |
| Dell Latitude 13 7330 | |
| Framework Laptop 13.5 12th Gen Intel | |
| Microsoft Surface Laptop 4 13 Ryzen 5 | |
| Lenovo ThinkPad X13 Yoga 20SX0004GE | |
| Dell Latitude 7310 | |
| AIDA64 / CPU Queen | |
| Framework Laptop 13.5 12th Gen Intel | |
| Microsoft Surface Laptop 4 13 Ryzen 5 | |
| Dell Latitude 13 7330 | |
| Dell Latitude 7310 | |
| Lenovo ThinkPad X13 Yoga 20SX0004GE | |
| AIDA64 / FPU SinJulia | |
| Microsoft Surface Laptop 4 13 Ryzen 5 | |
| Framework Laptop 13.5 12th Gen Intel | |
| Dell Latitude 13 7330 | |
| Dell Latitude 7310 | |
| Lenovo ThinkPad X13 Yoga 20SX0004GE | |
| AIDA64 / FPU Mandel | |
| Microsoft Surface Laptop 4 13 Ryzen 5 | |
| Dell Latitude 13 7330 | |
| Framework Laptop 13.5 12th Gen Intel | |
| Dell Latitude 7310 | |
| Lenovo ThinkPad X13 Yoga 20SX0004GE | |
| AIDA64 / CPU AES | |
| Framework Laptop 13.5 12th Gen Intel | |
| Dell Latitude 13 7330 | |
| Microsoft Surface Laptop 4 13 Ryzen 5 | |
| Lenovo ThinkPad X13 Yoga 20SX0004GE | |
| Dell Latitude 7310 | |
| AIDA64 / CPU ZLib | |
| Framework Laptop 13.5 12th Gen Intel | |
| Microsoft Surface Laptop 4 13 Ryzen 5 | |
| Dell Latitude 13 7330 | |
| Lenovo ThinkPad X13 Yoga 20SX0004GE | |
| Dell Latitude 7310 | |
| AIDA64 / FP64 Ray-Trace | |
| Microsoft Surface Laptop 4 13 Ryzen 5 | |
| Dell Latitude 13 7330 | |
| Framework Laptop 13.5 12th Gen Intel | |
| Dell Latitude 7310 | |
| Lenovo ThinkPad X13 Yoga 20SX0004GE | |
| AIDA64 / CPU PhotoWorxx | |
| Framework Laptop 13.5 12th Gen Intel | |
| Dell Latitude 13 7330 | |
| Dell Latitude 7310 | |
| Microsoft Surface Laptop 4 13 Ryzen 5 | |
| Lenovo ThinkPad X13 Yoga 20SX0004GE | |
Rendimiento del sistema
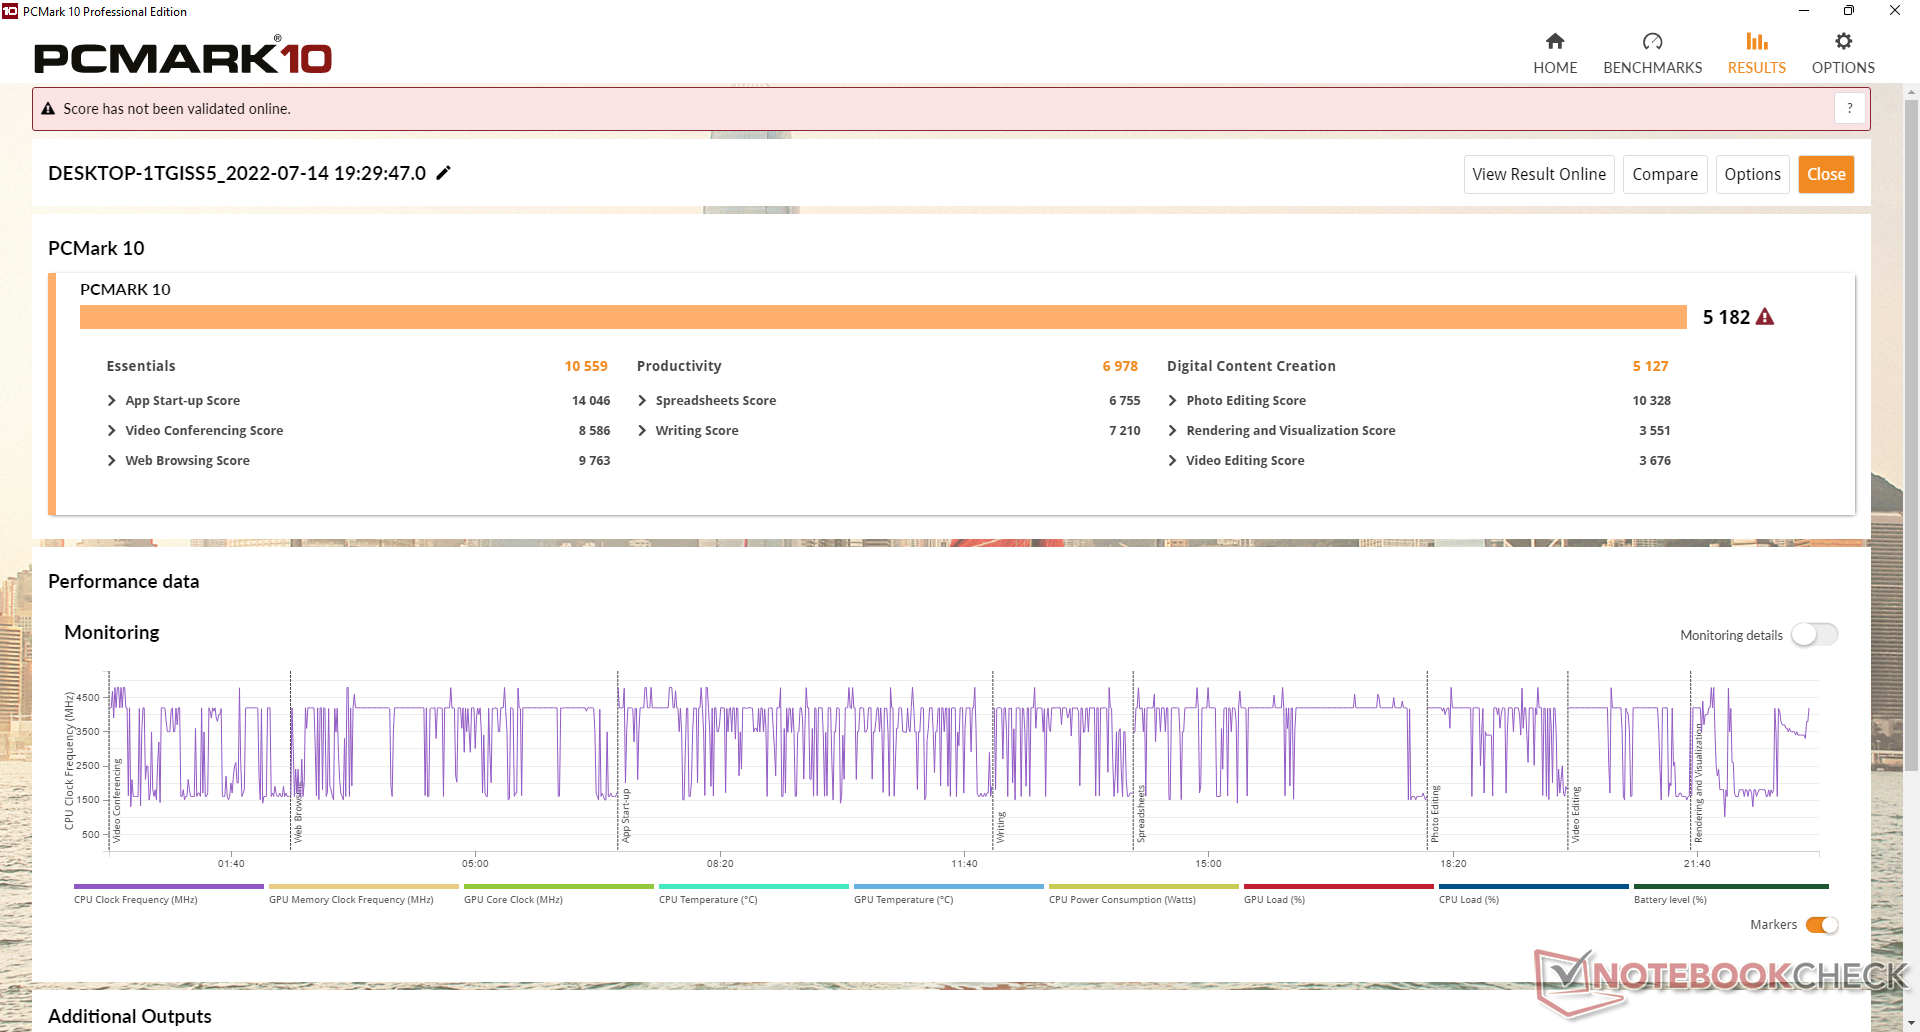
Las puntuaciones de PCMark son más altas que las de muchos otros portátiles empresariales que funcionan con CPUs de última generación o más antiguas, como elMicrosoft Surface Laptop 4 o especialmente el Latitude 7310. ElRazer Book 13 se acerca mucho debido a su mayor rendimiento de SSD y gráficos integrados.
CrossMark: Overall | Productivity | Creativity | Responsiveness
| PCMark 10 / Score | |
| Framework Laptop 13.5 12th Gen Intel | |
| Medio Intel Core i7-1265U, Intel Iris Xe Graphics G7 96EUs (4753 - 5766, n=7) | |
| Dell Latitude 13 7330 | |
| Razer Book 13 FHD | |
| Microsoft Surface Laptop 4 13 Ryzen 5 | |
| Dell Latitude 7310 | |
| Lenovo ThinkPad X13 Yoga 20SX0004GE | |
| PCMark 10 / Essentials | |
| Framework Laptop 13.5 12th Gen Intel | |
| Dell Latitude 13 7330 | |
| Medio Intel Core i7-1265U, Intel Iris Xe Graphics G7 96EUs (9278 - 11418, n=7) | |
| Razer Book 13 FHD | |
| Lenovo ThinkPad X13 Yoga 20SX0004GE | |
| Dell Latitude 7310 | |
| Microsoft Surface Laptop 4 13 Ryzen 5 | |
| PCMark 10 / Productivity | |
| Dell Latitude 7310 | |
| Framework Laptop 13.5 12th Gen Intel | |
| Dell Latitude 13 7330 | |
| Lenovo ThinkPad X13 Yoga 20SX0004GE | |
| Razer Book 13 FHD | |
| Medio Intel Core i7-1265U, Intel Iris Xe Graphics G7 96EUs (5828 - 7311, n=7) | |
| Microsoft Surface Laptop 4 13 Ryzen 5 | |
| PCMark 10 / Digital Content Creation | |
| Framework Laptop 13.5 12th Gen Intel | |
| Medio Intel Core i7-1265U, Intel Iris Xe Graphics G7 96EUs (5127 - 6330, n=7) | |
| Razer Book 13 FHD | |
| Dell Latitude 13 7330 | |
| Microsoft Surface Laptop 4 13 Ryzen 5 | |
| Dell Latitude 7310 | |
| Lenovo ThinkPad X13 Yoga 20SX0004GE | |
| CrossMark / Overall | |
| Framework Laptop 13.5 12th Gen Intel | |
| Medio Intel Core i7-1265U, Intel Iris Xe Graphics G7 96EUs (1301 - 1615, n=7) | |
| Dell Latitude 13 7330 | |
| CrossMark / Productivity | |
| Framework Laptop 13.5 12th Gen Intel | |
| Dell Latitude 13 7330 | |
| Medio Intel Core i7-1265U, Intel Iris Xe Graphics G7 96EUs (1230 - 1586, n=7) | |
| CrossMark / Creativity | |
| Framework Laptop 13.5 12th Gen Intel | |
| Medio Intel Core i7-1265U, Intel Iris Xe Graphics G7 96EUs (1413 - 1706, n=7) | |
| Dell Latitude 13 7330 | |
| CrossMark / Responsiveness | |
| Framework Laptop 13.5 12th Gen Intel | |
| Medio Intel Core i7-1265U, Intel Iris Xe Graphics G7 96EUs (1193 - 1521, n=7) | |
| Dell Latitude 13 7330 | |
| PCMark 10 Score | 5182 puntos | |
ayuda | ||
| AIDA64 / Memory Copy | |
| Medio Intel Core i7-1265U (40212 - 72204, n=10) | |
| Framework Laptop 13.5 12th Gen Intel | |
| Dell Latitude 13 7330 | |
| Microsoft Surface Laptop 4 13 Ryzen 5 | |
| Dell Latitude 7310 | |
| Lenovo ThinkPad X13 Yoga 20SX0004GE | |
| AIDA64 / Memory Read | |
| Medio Intel Core i7-1265U (41808 - 69493, n=10) | |
| Framework Laptop 13.5 12th Gen Intel | |
| Microsoft Surface Laptop 4 13 Ryzen 5 | |
| Dell Latitude 13 7330 | |
| Dell Latitude 7310 | |
| Lenovo ThinkPad X13 Yoga 20SX0004GE | |
| AIDA64 / Memory Write | |
| Medio Intel Core i7-1265U (41382 - 76027, n=10) | |
| Framework Laptop 13.5 12th Gen Intel | |
| Dell Latitude 13 7330 | |
| Microsoft Surface Laptop 4 13 Ryzen 5 | |
| Dell Latitude 7310 | |
| Lenovo ThinkPad X13 Yoga 20SX0004GE | |
| AIDA64 / Memory Latency | |
| Microsoft Surface Laptop 4 13 Ryzen 5 | |
| Medio Intel Core i7-1265U (74.6 - 112.4, n=10) | |
| Lenovo ThinkPad X13 Yoga 20SX0004GE | |
| Dell Latitude 7310 | |
| Framework Laptop 13.5 12th Gen Intel | |
| Dell Latitude 13 7330 | |
* ... más pequeño es mejor
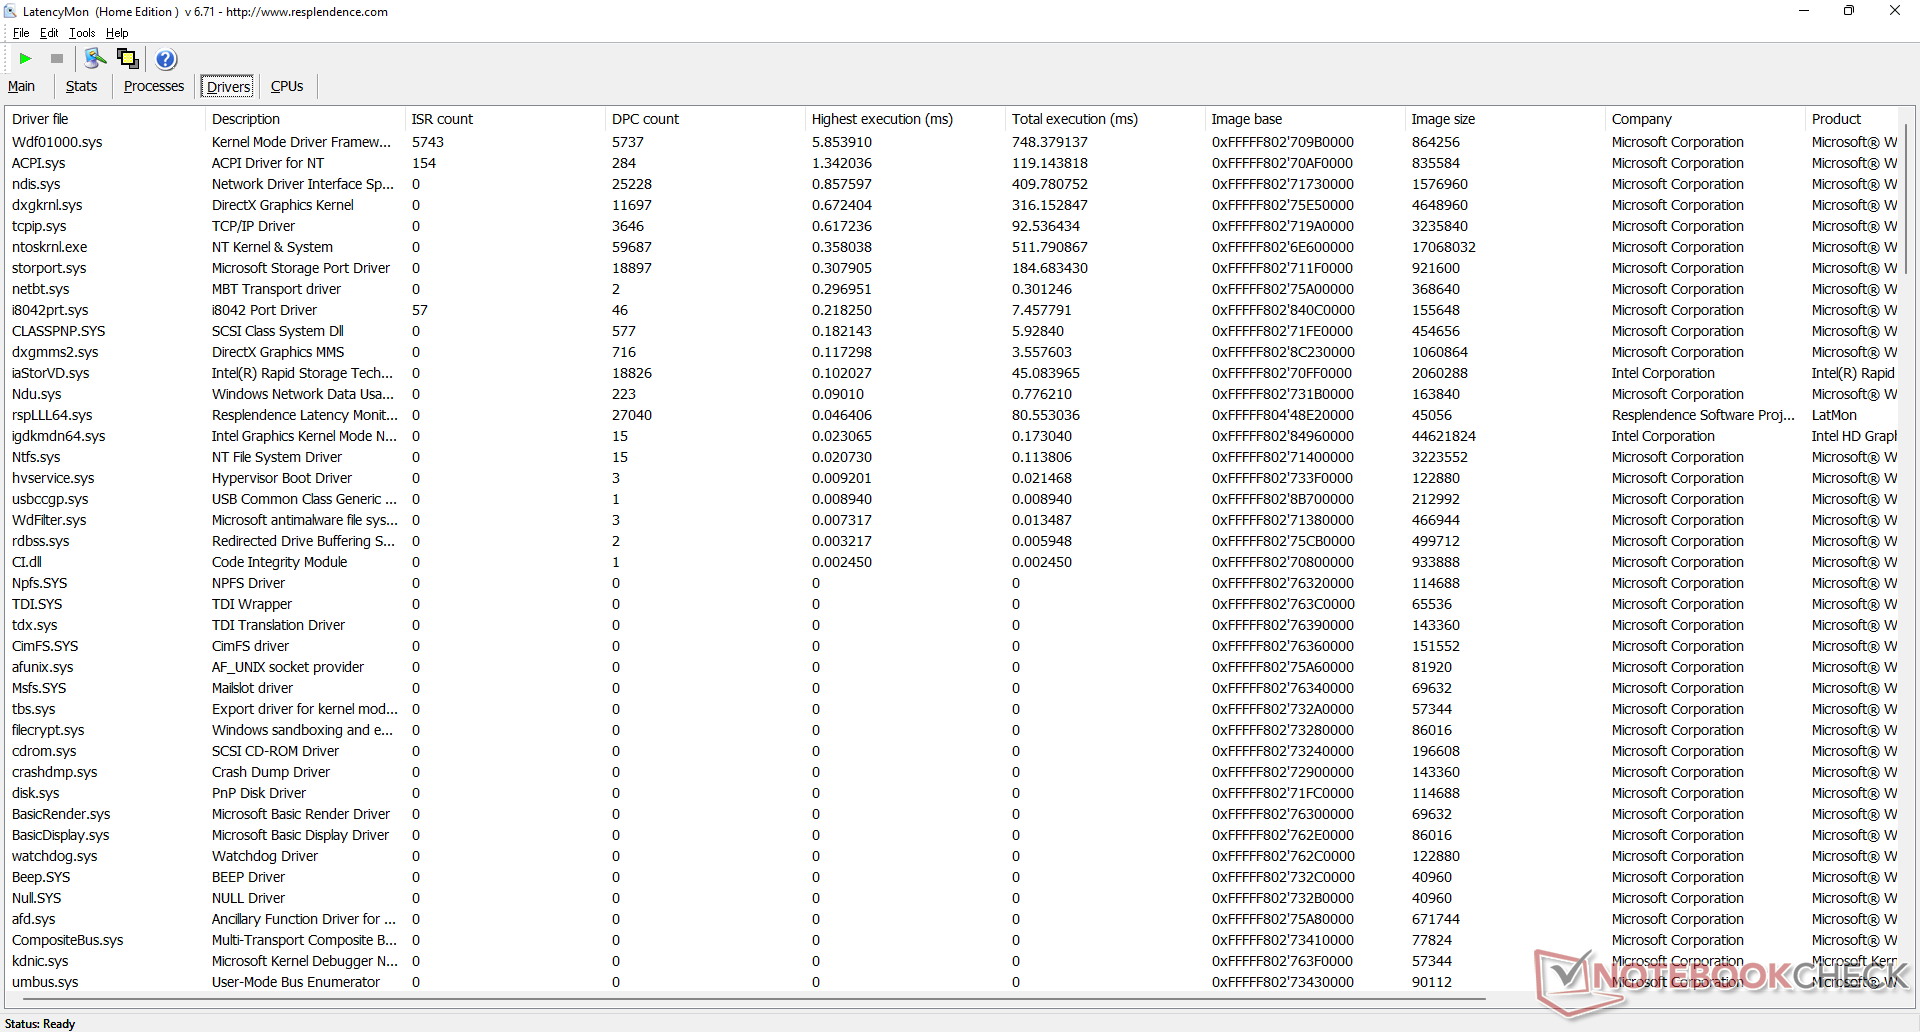
Latencia del CPD
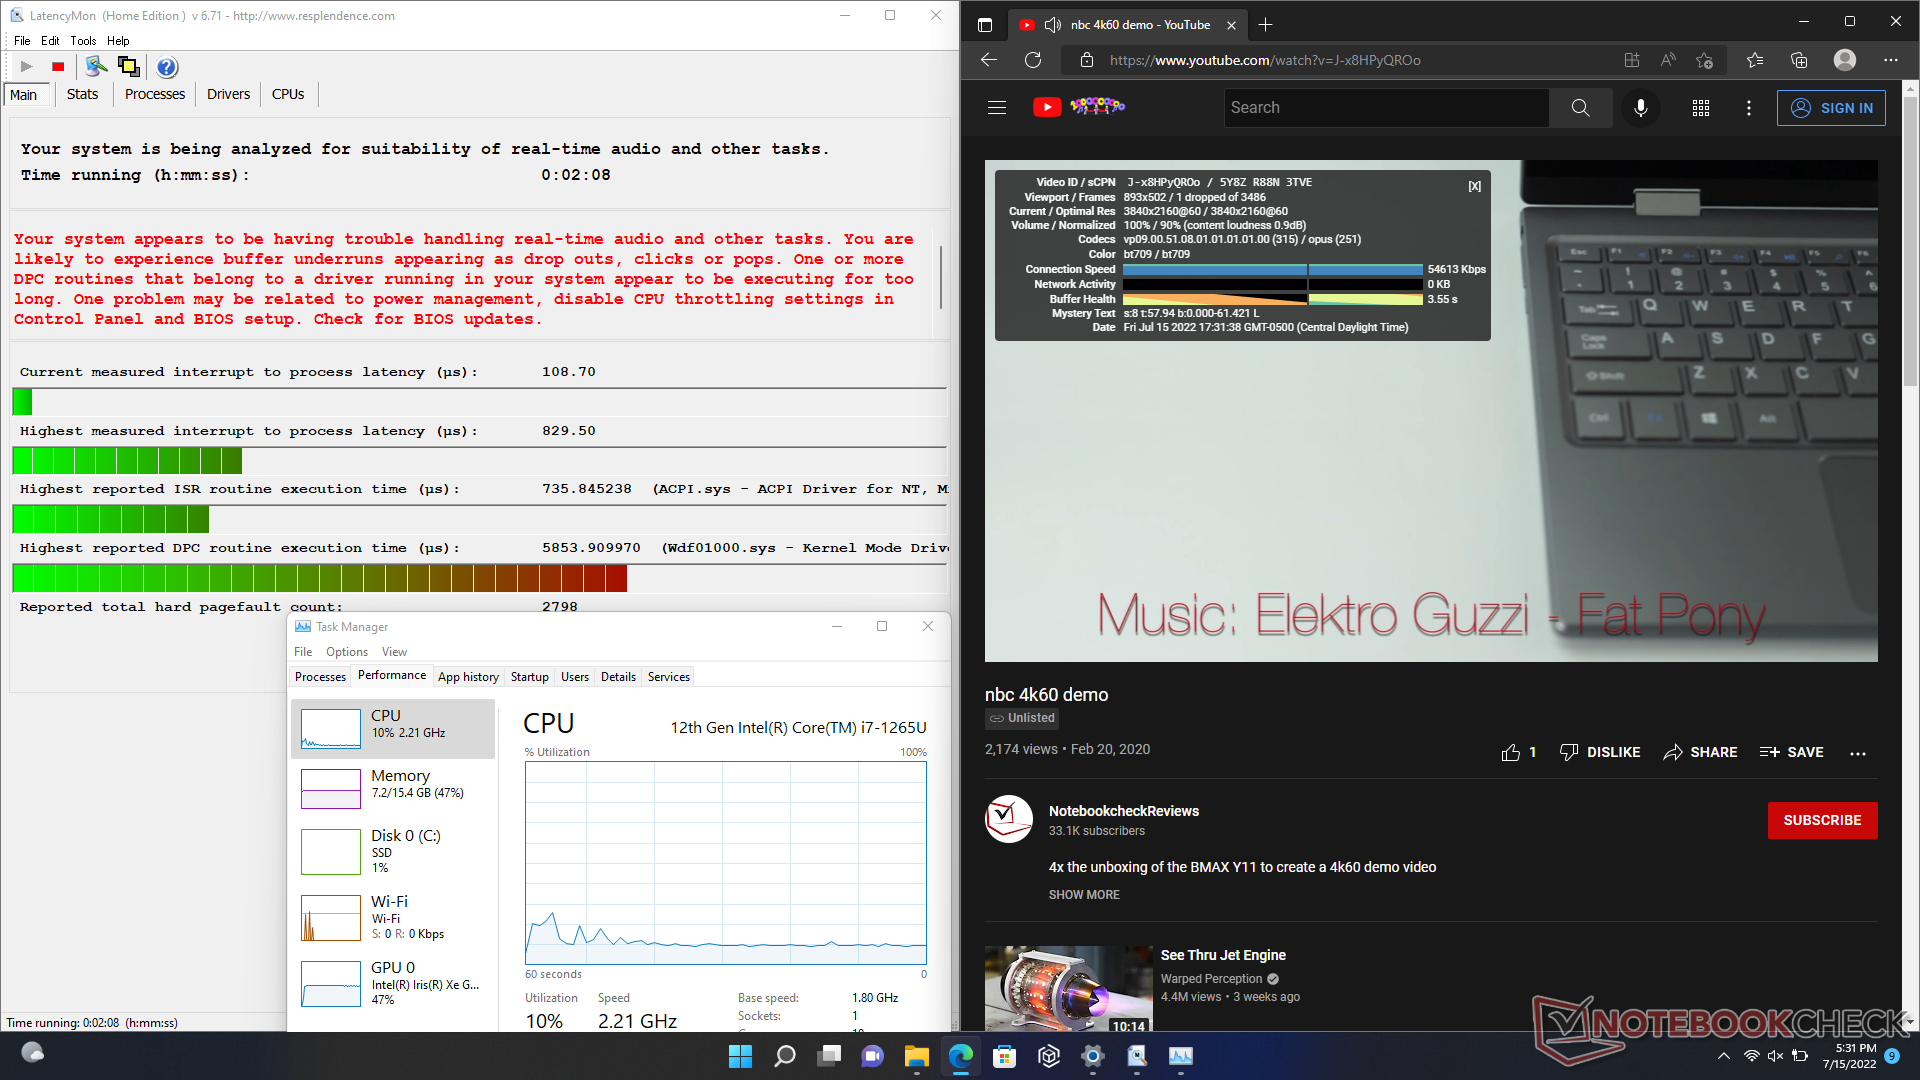
LatencyMon revela problemas de CPD al abrir varias pestañas del navegador en nuestra página de inicio. por lo demás, la reproducción de vídeo 4K a 60 FPS es perfecta, con un solo fotograma perdido durante nuestro vídeo de prueba de 60 segundos.
| DPC Latencies / LatencyMon - interrupt to process latency (max), Web, Youtube, Prime95 | |
| Razer Book 13 FHD | |
| Framework Laptop 13.5 12th Gen Intel | |
| Lenovo ThinkPad X13 Yoga 20SX0004GE | |
| Microsoft Surface Laptop 4 13 Ryzen 5 | |
| Dell Latitude 13 7330 | |
| Dell Latitude 7310 | |
* ... más pequeño es mejor
Dispositivos de almacenamiento - Sólo una unidad interna
A Dell le gusta enviar muchos de sus subportátiles con unidades SSD M.2 2230 más cortas en comparación con las unidades 2280 más largas de la mayoría de los demás portátiles. El 512 GB Kioxia PCIe3 x4 de 512 GB de nuestra unidad de prueba alcanza un máximo de 2400 MB/s durante un breve periodo de tiempo antes de que la ralentización reduzca la velocidad de transferencia a sólo 1200 MB/s, tal y como muestran los resultados de nuestra prueba de bucle DiskSpd. Es probable que la unidad se encuentre con limitaciones de temperatura cuando se estresa. En comparación, elHP EliteBook 845 G9 es capaz de mantener tasas de transferencia significativamente más rápidas durante períodos más largos con su unidad PCIe4 x4 incluida cuando se somete a las mismas condiciones de prueba.

| Drive Performance rating - Percent | |
| Lenovo ThinkPad X13 Yoga 20SX0004GE | |
| Framework Laptop 13.5 12th Gen Intel | |
| Dell Latitude 7310 | |
| Razer Book 13 FHD | |
| Dell Latitude 13 7330 | |
| Microsoft Surface Laptop 4 13 Ryzen 5 | |
* ... más pequeño es mejor
Disk Throttling: DiskSpd Read Loop, Queue Depth 8
Rendimiento de la GPU: el Iris Xe avanza con paso firme
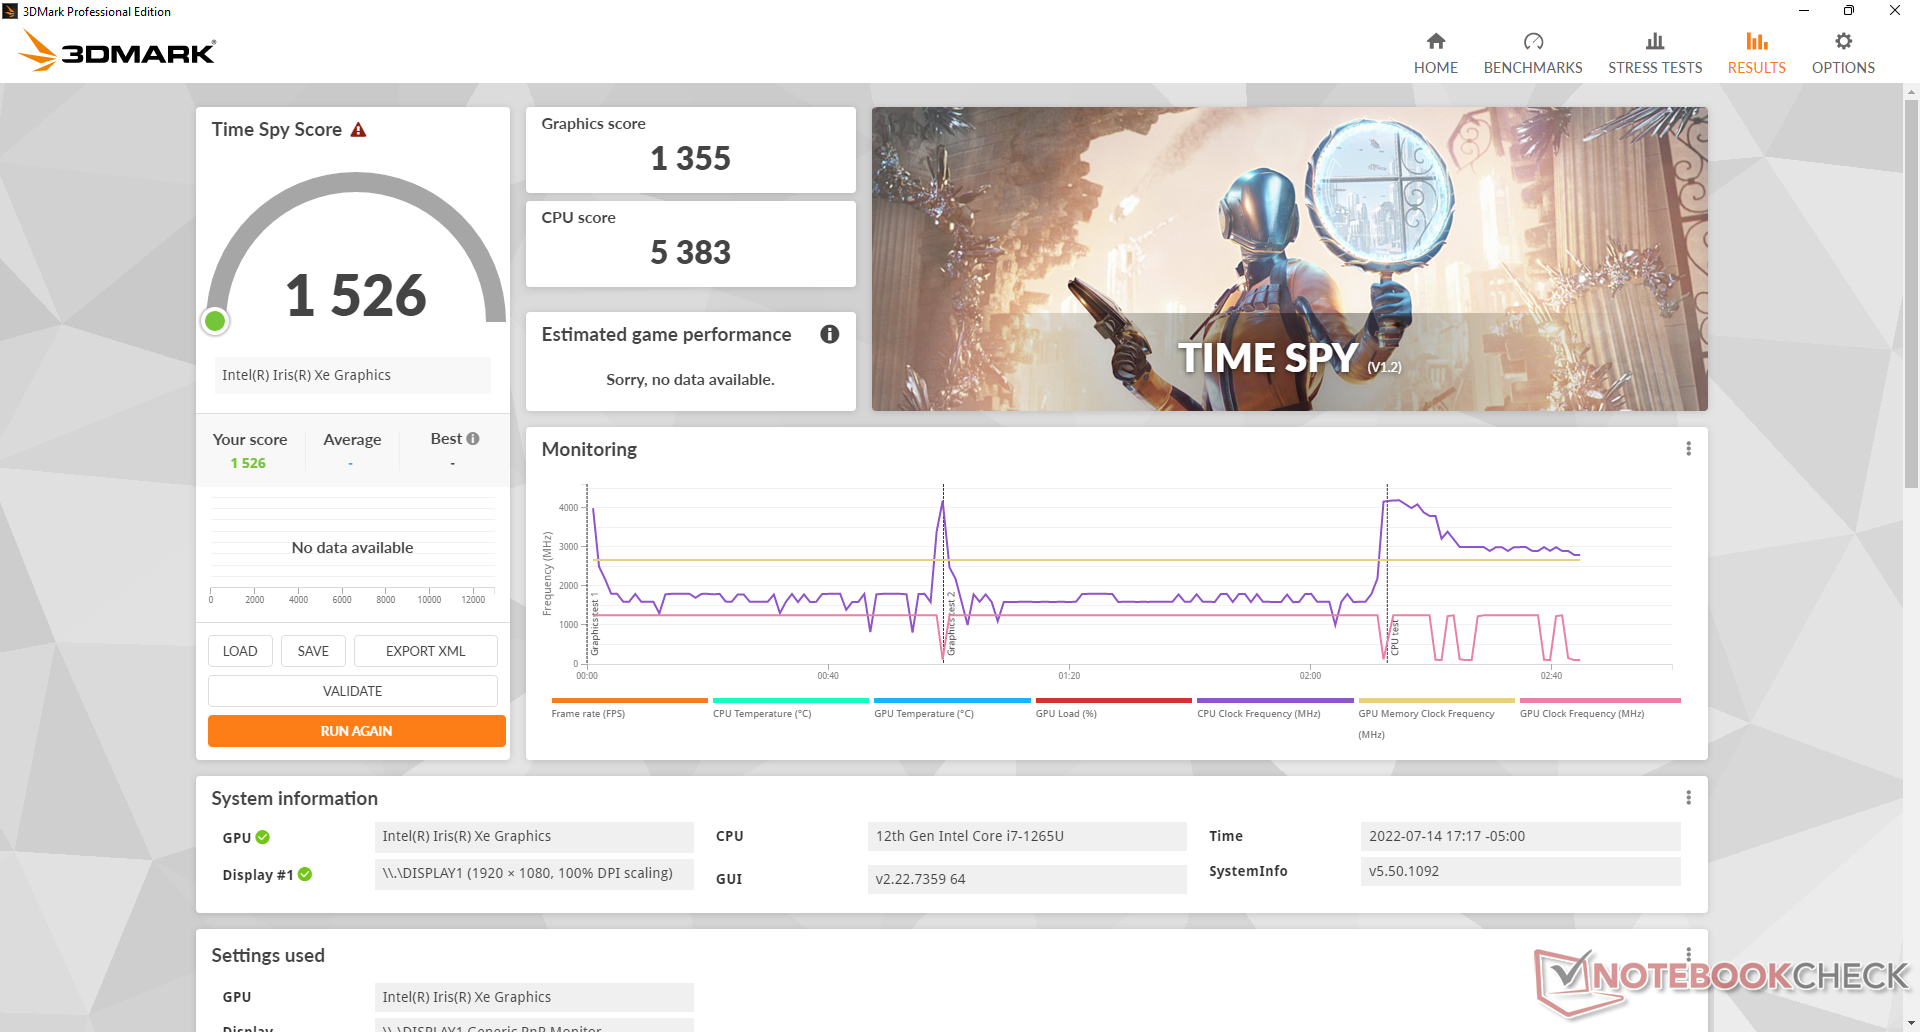
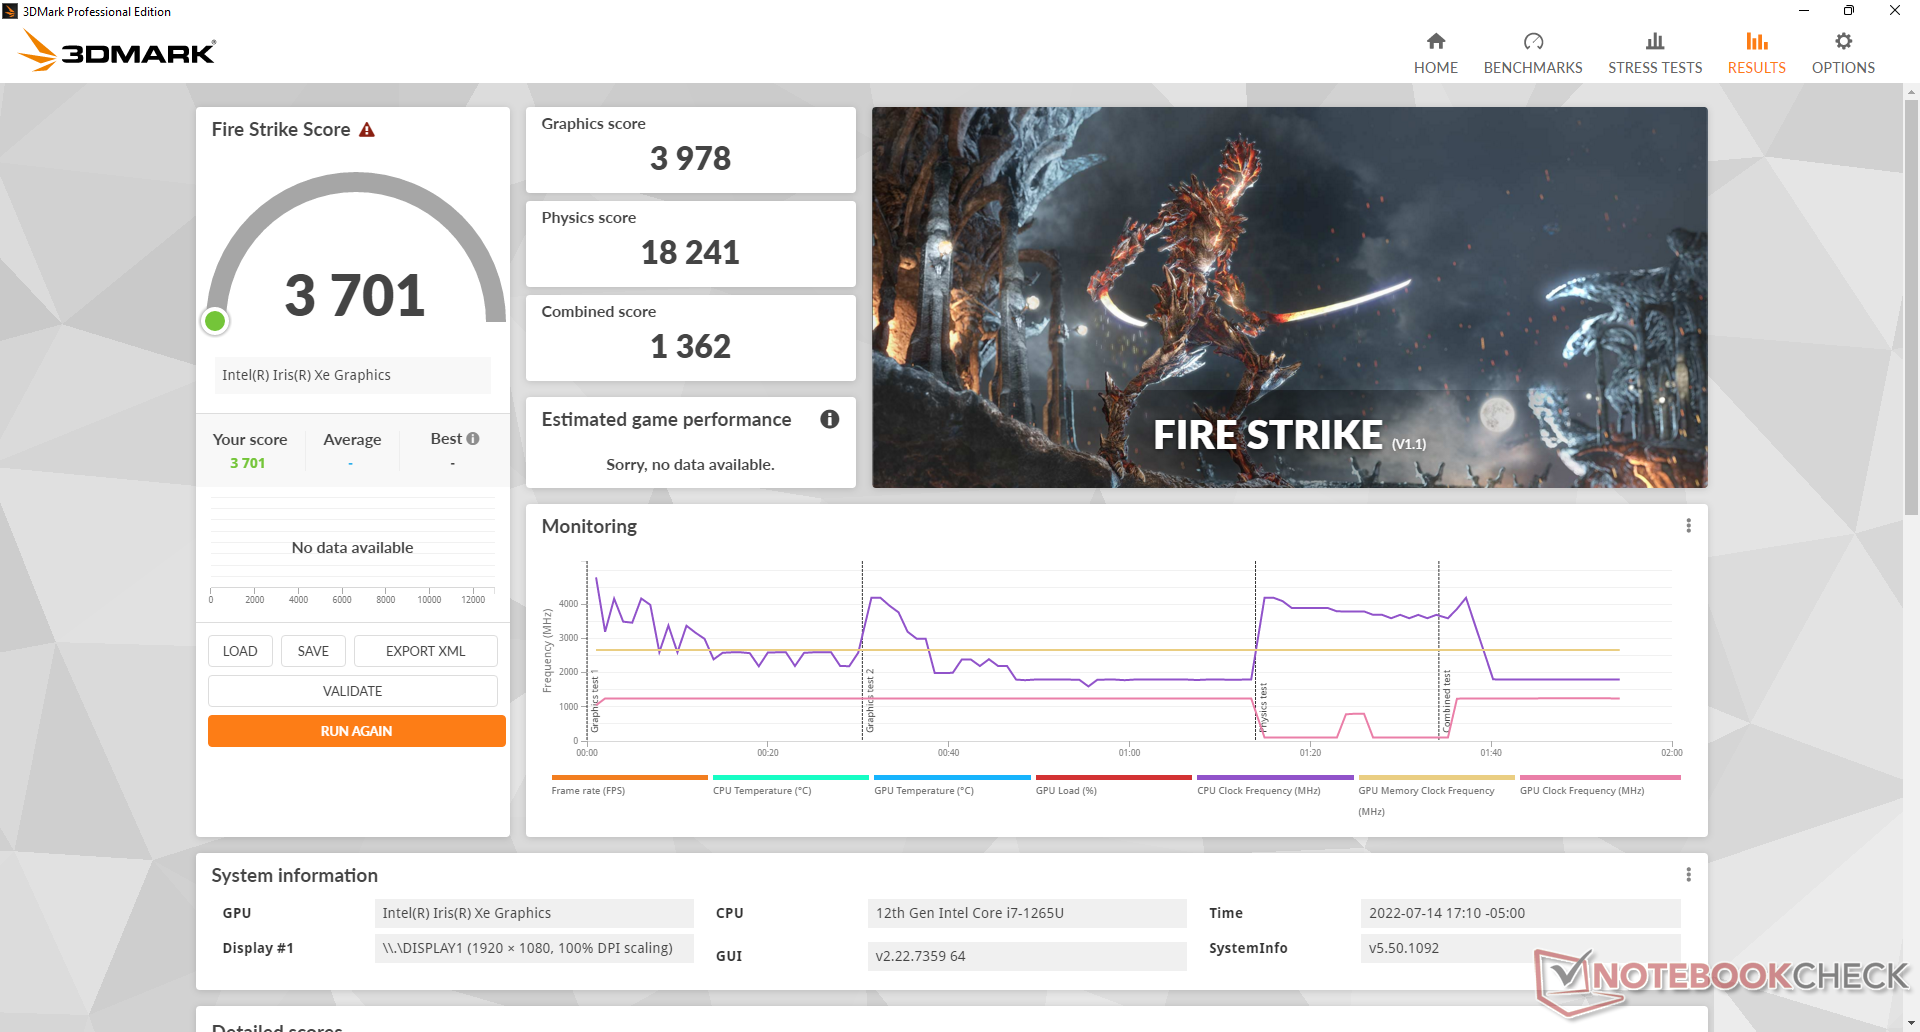
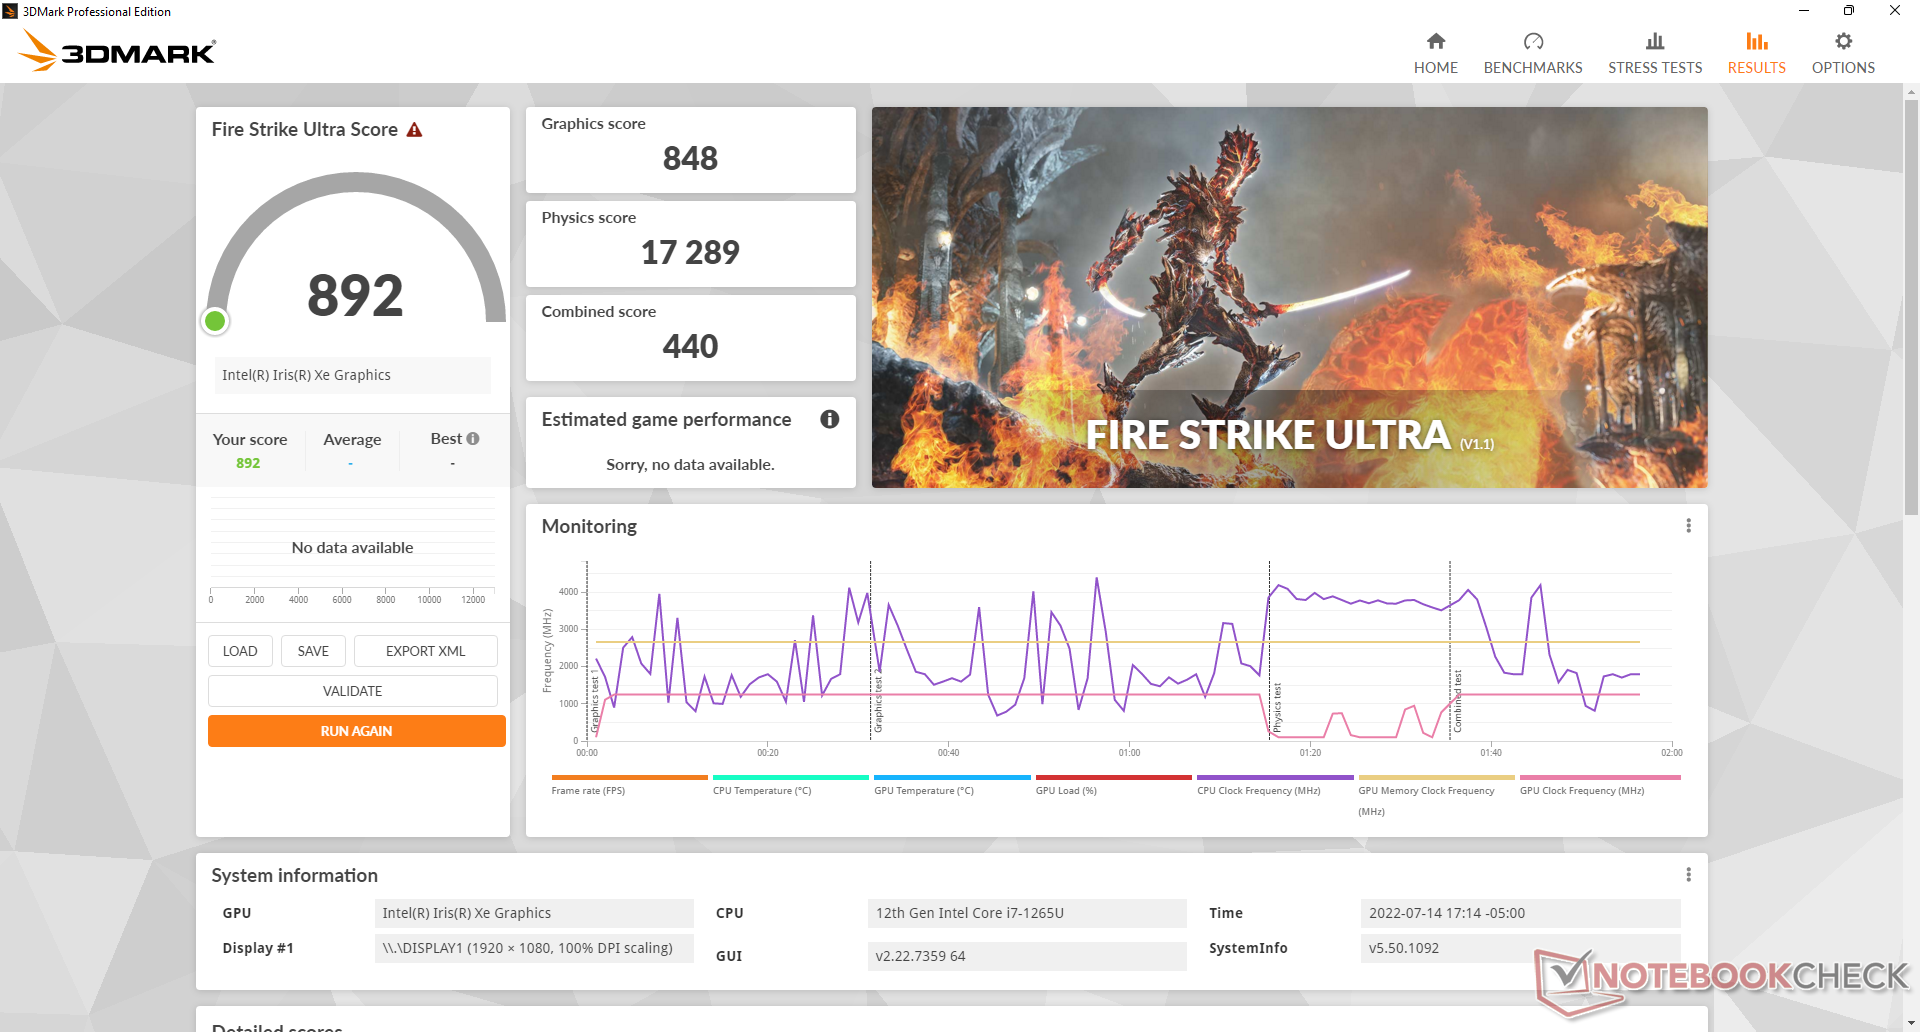
El rendimiento de los gráficos es aproximadamente entre un 5 y un 20 por ciento más lento que el de la media de portátiles de nuestra base de datos equipados con el mismo Iris Xe 96 EUs GPU. Sigue siendo rápido para un chip gráfico integrado, pero sin duda hay opciones más rápidas disponibles, como el Razer Book 13 o el Asus Zenbook S 13 con tecnología AMD si maximizar el rendimiento de la GPU es una prioridad.
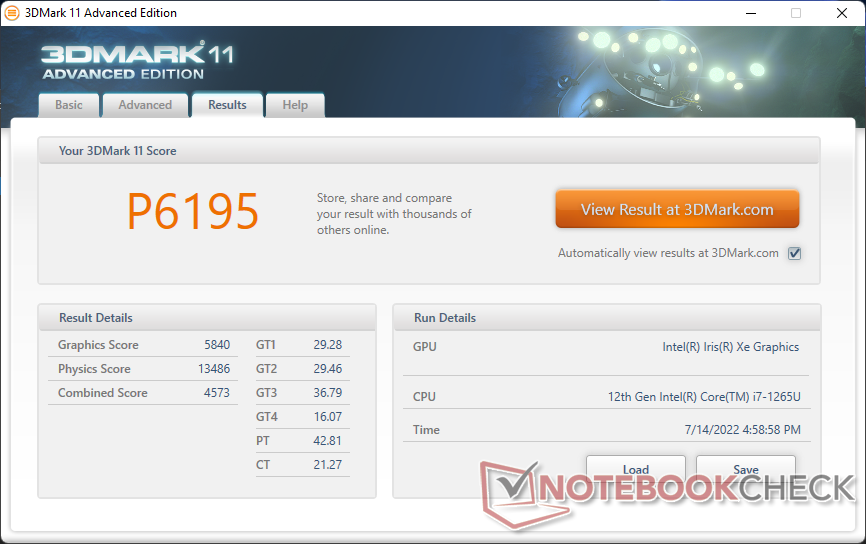
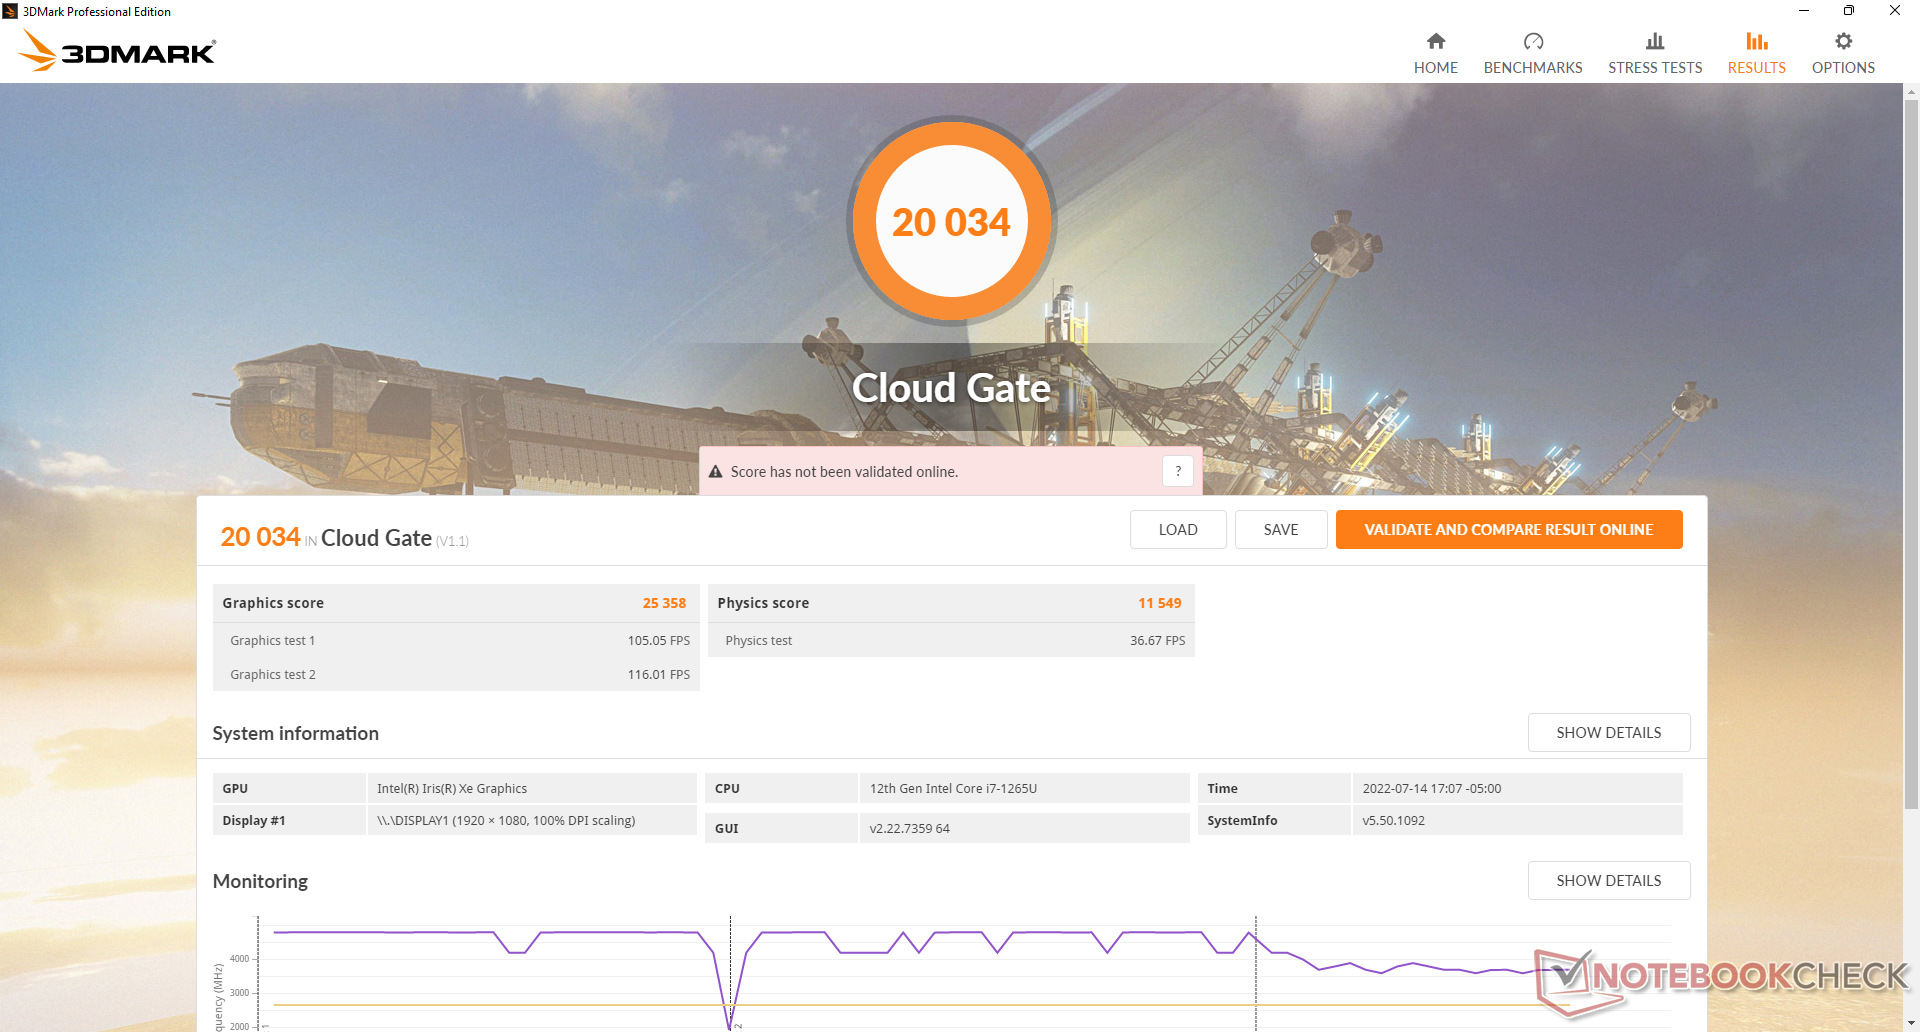
| 3DMark 11 Performance | 6195 puntos | |
| 3DMark Cloud Gate Standard Score | 20034 puntos | |
| 3DMark Fire Strike Score | 3701 puntos | |
| 3DMark Time Spy Score | 1526 puntos | |
ayuda | ||
| Cyberpunk 2077 1.6 | |
| 1920x1080 Low Preset | |
| Framework Laptop 13.5 12th Gen Intel | |
| Medio Intel Iris Xe Graphics G7 96EUs (13 - 25.9, n=42) | |
| Dell Latitude 13 7330 | |
| 1920x1080 Medium Preset | |
| Framework Laptop 13.5 12th Gen Intel | |
| Medio Intel Iris Xe Graphics G7 96EUs (10.8 - 21.7, n=37) | |
| Dell Latitude 13 7330 | |
| 1920x1080 High Preset | |
| Framework Laptop 13.5 12th Gen Intel | |
| Medio Intel Iris Xe Graphics G7 96EUs (9.8 - 16.9, n=34) | |
| Dell Latitude 13 7330 | |
Witcher 3 FPS Chart
| bajo | medio | alto | ultra | |
|---|---|---|---|---|
| GTA V (2015) | 84.5 | 64.7 | 13.9 | 6.15 |
| The Witcher 3 (2015) | 71.6 | 47.3 | 23.6 | 11.9 |
| Dota 2 Reborn (2015) | 109.7 | 79.6 | 50.6 | 44.9 |
| Final Fantasy XV Benchmark (2018) | 32.9 | 17.5 | 12.9 | |
| X-Plane 11.11 (2018) | 47.3 | 33.8 | 30.3 | |
| Strange Brigade (2018) | 75.8 | 29.8 | 24.9 | 20 |
| Cyberpunk 2077 1.6 (2022) | 18.7 | 15.4 | 11.2 |
Emisiones
Ruido del sistema - Mayormente silencioso
El ruido del ventilador tiende a rondar entre un fondo silencioso de 23,4 dB(A) y 25,3 dB(A) cuando se navega por la web o se procesa texto para ser casi inaudible en la mayoría de entornos. Sin embargo, empieza a aumentar rápidamente cuando se ejecutan cargas más exigentes como 3DMark 06, donde el ruido del ventilador puede alcanzar los 38 dB(A) para ser más ruidoso que lo que registramos en el ThinkPad X13 Yogarazer Book 13, o el antiguo Latitude 7310. El ruido del ventilador oscilaba entre 37 y 39 dB(A) cuando estaba en marcha Witcher 3 en vez de permanecer estable, lo que habría sido preferible.
Cuando se ejecuta el Prime95, el ruido del ventilador alcanza los 43 dB(A) durante un breve periodo de tiempo antes de volver a caer rápidamente al rango de los 39 dB(A).
Ruido
| Ocioso |
| 23.4 / 23.4 / 23.4 dB(A) |
| Carga |
| 37.8 / 43 dB(A) |
 | ||
30 dB silencioso 40 dB(A) audible 50 dB(A) ruidosamente alto |
||
min: | ||
| Dell Latitude 13 7330 Iris Xe G7 96EUs, i7-1265U, Toshiba KBG40ZNS512G NVMe | Lenovo ThinkPad X13 Yoga 20SX0004GE UHD Graphics 620, i7-10510U, Samsung SSD PM981a MZVLB512HBJQ | Framework Laptop 13.5 12th Gen Intel Iris Xe G7 96EUs, i7-1260P, WDC PC SN730 SDBPNTY-512G | Razer Book 13 FHD Iris Xe G7 96EUs, i7-1165G7, Samsung SSD PM981a MZVLB256HBHQ | Dell Latitude 7310 UHD Graphics 620, i7-10610U, Samsung SSD PM981a MZVLB512HBJQ | Microsoft Surface Laptop 4 13 Ryzen 5 Vega 7, R5 4680U, Samsung PM991 MZ9LQ256HBJQ | |
|---|---|---|---|---|---|---|
| Noise | -13% | -8% | -4% | -12% | -3% | |
| apagado / medio ambiente * (dB) | 23.4 | 29.3 -25% | 22.8 3% | 27 -15% | 29 -24% | 24.6 -5% |
| Idle Minimum * (dB) | 23.4 | 29.3 -25% | 23 2% | 27 -15% | 29 -24% | 24.6 -5% |
| Idle Average * (dB) | 23.4 | 29.3 -25% | 23 2% | 27 -15% | 29 -24% | 24.6 -5% |
| Idle Maximum * (dB) | 23.4 | 31.4 -34% | 23 2% | 27.1 -16% | 29 -24% | 24.6 -5% |
| Load Average * (dB) | 37.8 | 33 13% | 47.3 -25% | 29 23% | 30.1 20% | 39.5 -4% |
| Witcher 3 ultra * (dB) | 39.2 | 47.3 -21% | 33.3 15% | |||
| Load Maximum * (dB) | 43 | 34.9 19% | 49.8 -16% | 44.8 -4% | 41.3 4% | 39.5 8% |
* ... más pequeño es mejor
Temperatura
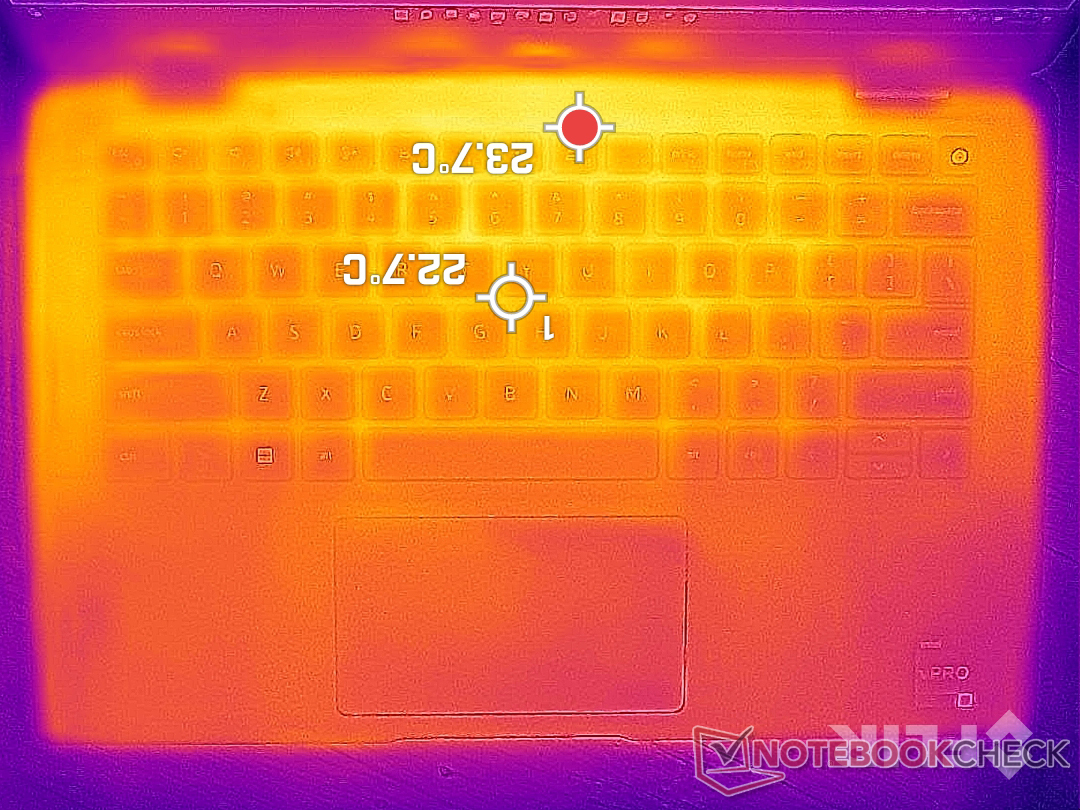
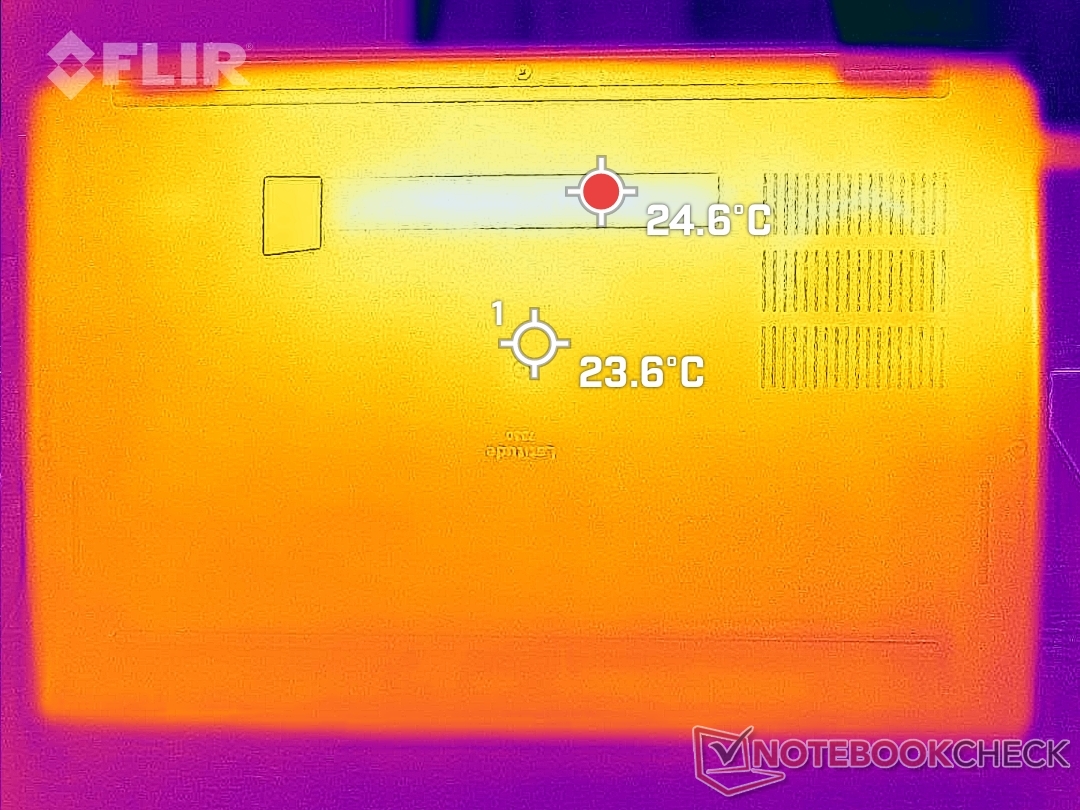
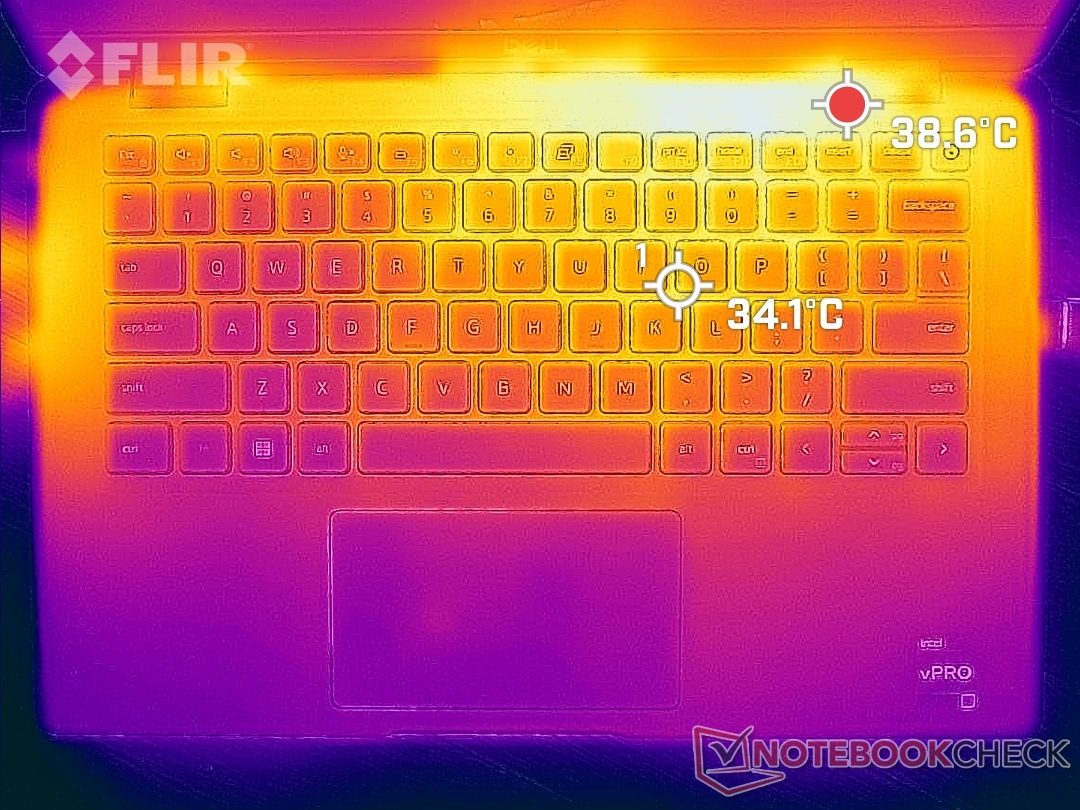
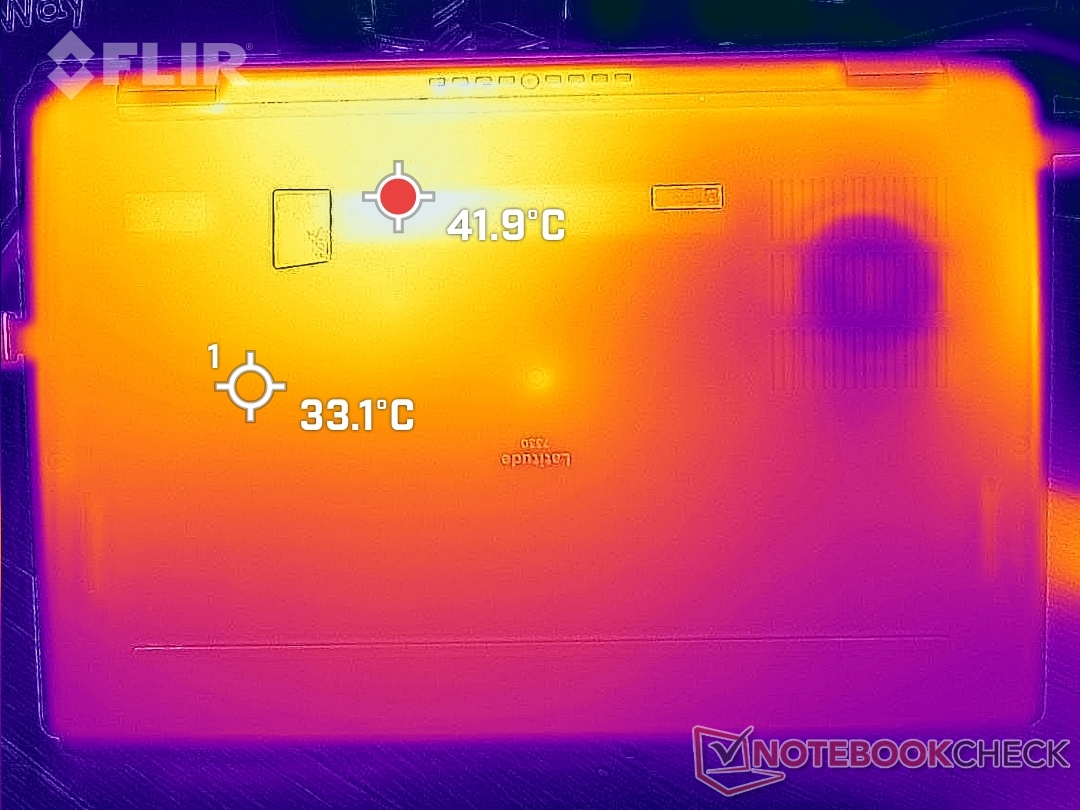
Las temperaturas de la superficie no son un problema en el Latitude 7330. En el peor de los casos, somos capaces de registrar puntos calientes de 39 C y 42 C en las superficies superior e inferior, respectivamente, para ser más frescos que los 46 C y 53 C que registramos en el antiguo Latitude 7310. Estos puntos calientes también están hacia la parte trasera del chasis, lejos de las teclas del teclado y los reposamanos.
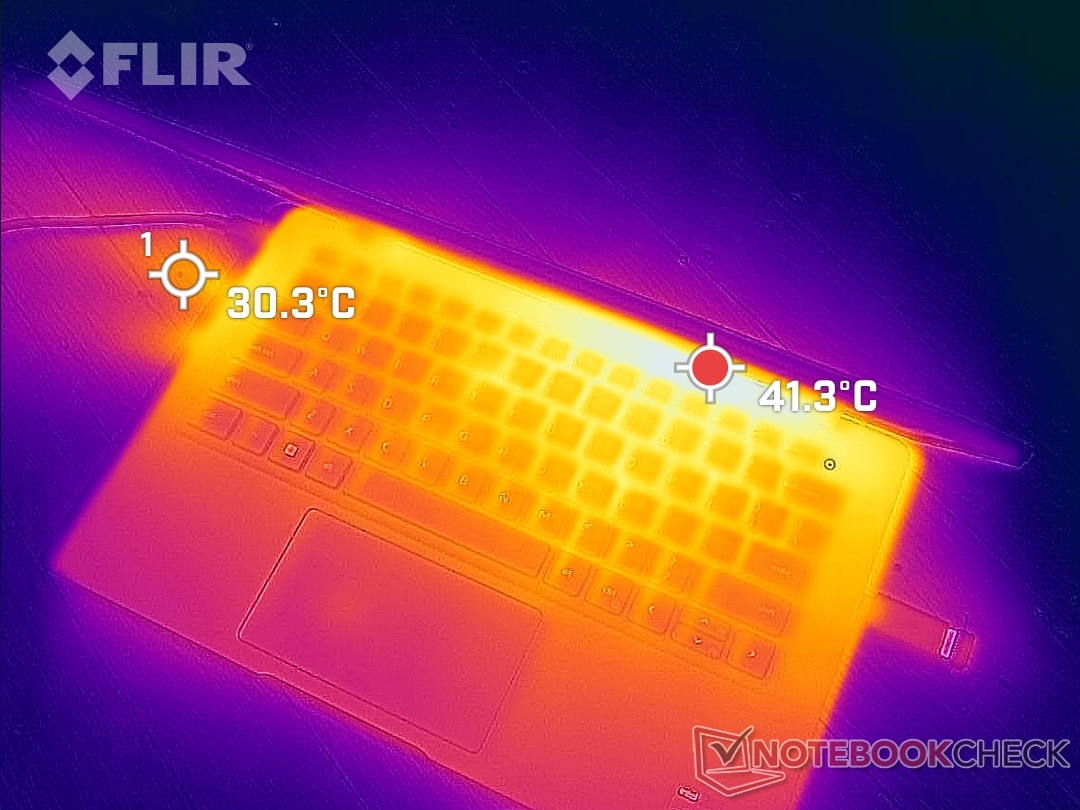
(+) La temperatura máxima en la parte superior es de 38.6 °C / 101 F, frente a la media de 34.3 °C / 94 F, que oscila entre 21.2 y 62.5 °C para la clase Office.
(±) El fondo se calienta hasta un máximo de 42 °C / 108 F, frente a la media de 36.8 °C / 98 F
(+) En reposo, la temperatura media de la parte superior es de 22.2 °C / 72# F, frente a la media del dispositivo de 29.5 °C / 85 F.
(+) El reposamanos y el panel táctil están a una temperatura inferior a la de la piel, con un máximo de 23.2 °C / 73.8 F y, por tanto, son fríos al tacto.
(+) La temperatura media de la zona del reposamanos de dispositivos similares fue de 27.5 °C / 81.5 F (+4.3 °C / 7.7 F).
| Dell Latitude 13 7330 Intel Core i7-1265U, Intel Iris Xe Graphics G7 96EUs | Lenovo ThinkPad X13 Yoga 20SX0004GE Intel Core i7-10510U, Intel UHD Graphics 620 | Framework Laptop 13.5 12th Gen Intel Intel Core i7-1260P, Intel Iris Xe Graphics G7 96EUs | Razer Book 13 FHD Intel Core i7-1165G7, Intel Iris Xe Graphics G7 96EUs | Dell Latitude 7310 Intel Core i7-10610U, Intel UHD Graphics 620 | Microsoft Surface Laptop 4 13 Ryzen 5 AMD Ryzen 5 4680U, AMD Radeon RX Vega 7 | |
|---|---|---|---|---|---|---|
| Heat | -31% | -4% | -3% | -22% | -9% | |
| Maximum Upper Side * (°C) | 38.6 | 43.8 -13% | 36.8 5% | 39.2 -2% | 45.2 -17% | 45.8 -19% |
| Maximum Bottom * (°C) | 42 | 65 -55% | 42.4 -1% | 44 -5% | 52.8 -26% | 45.5 -8% |
| Idle Upper Side * (°C) | 23.8 | 29.2 -23% | 24.2 -2% | 23 3% | 28.2 -18% | 24.9 -5% |
| Idle Bottom * (°C) | 24.6 | 32.7 -33% | 29 -18% | 26.8 -9% | 31.6 -28% | 25.7 -4% |
* ... más pequeño es mejor
Prueba de esfuerzo
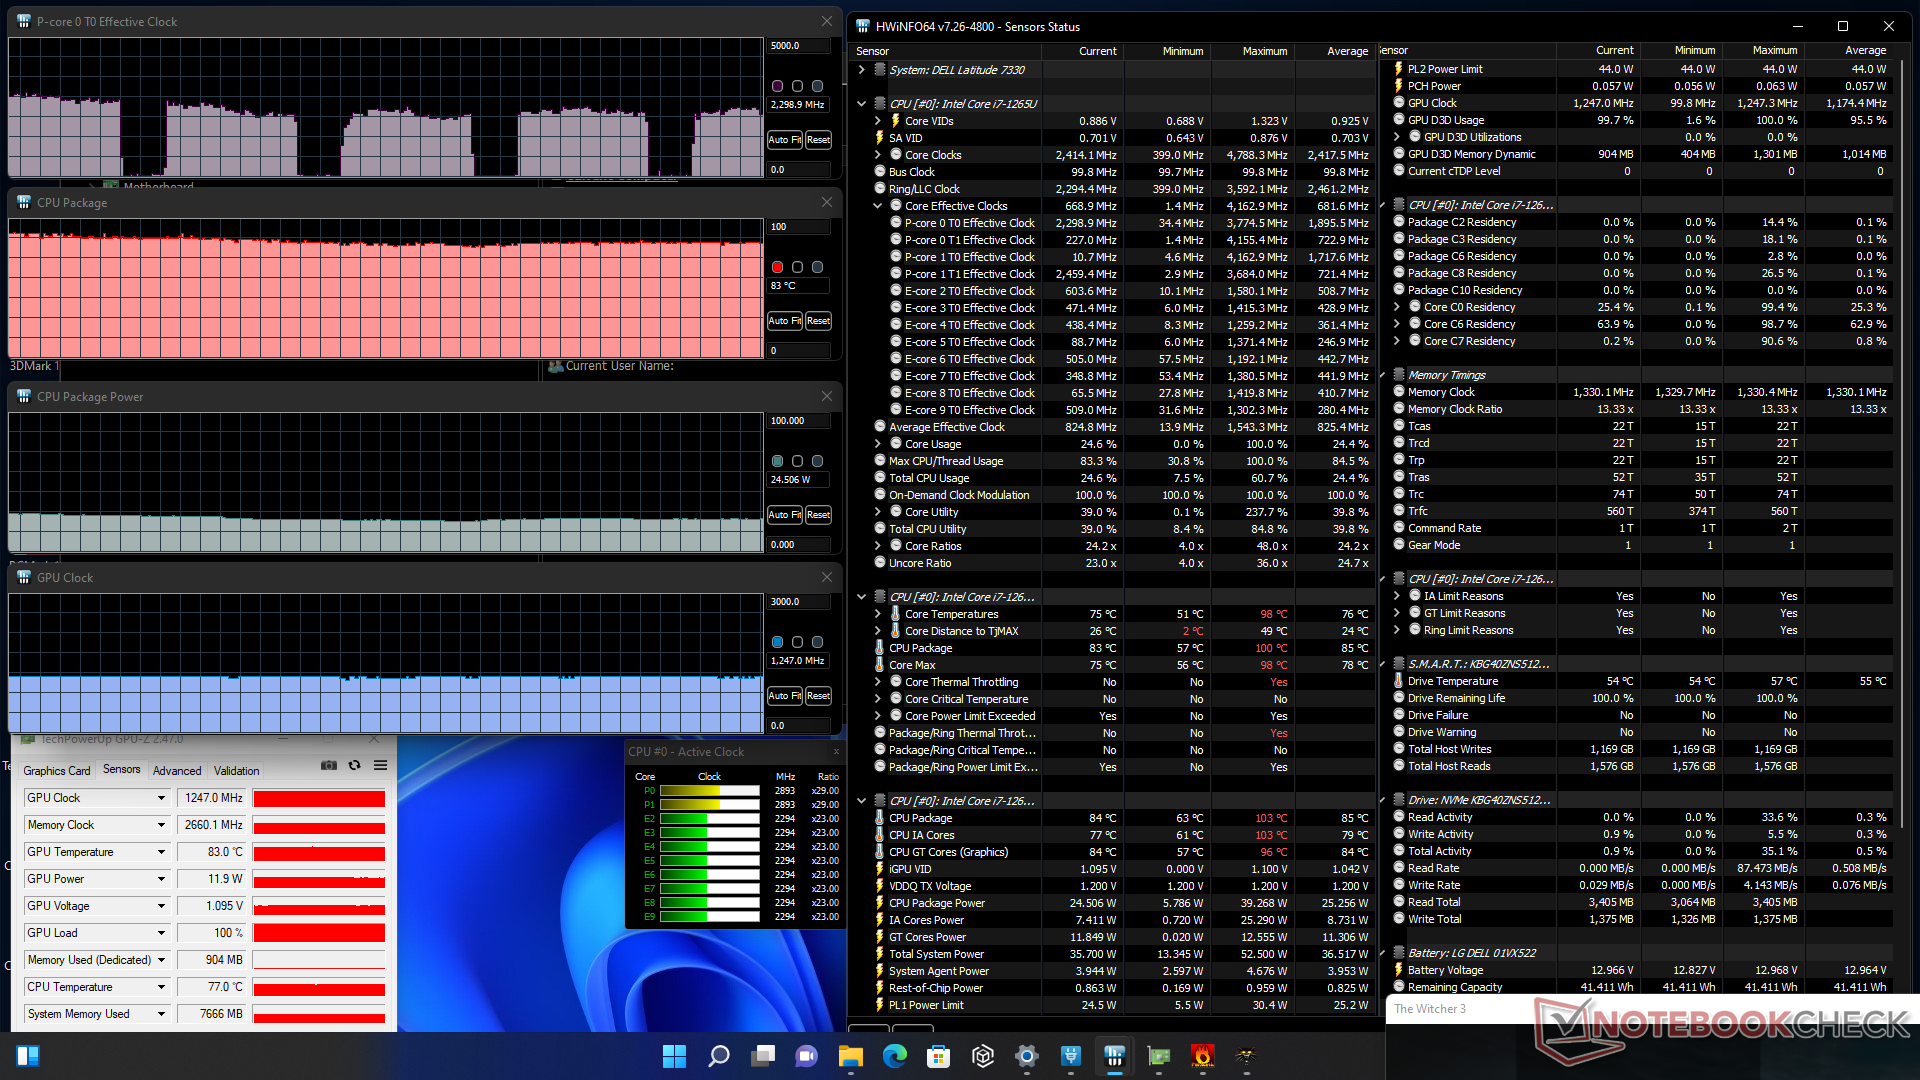
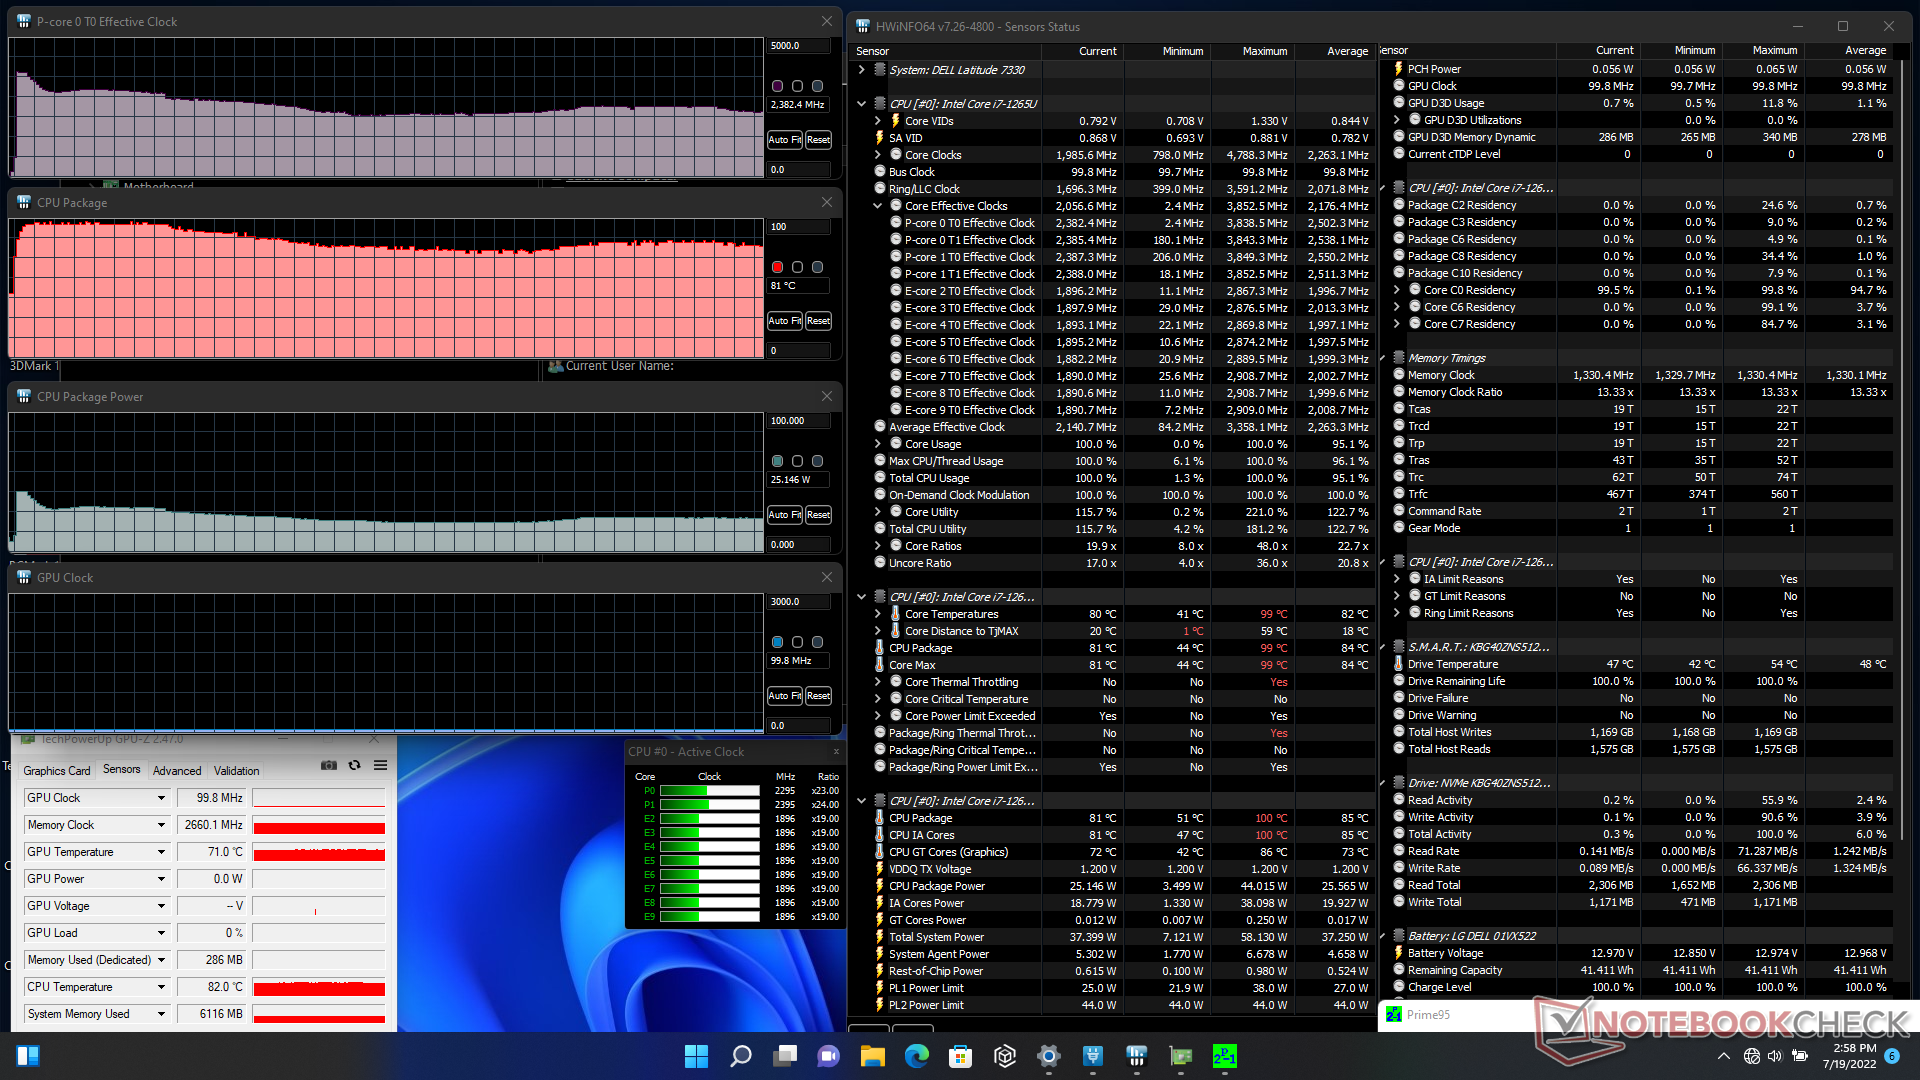
Cuando se ejecuta Prime95, la velocidad de reloj de la CPU aumenta hasta los 3,8 GHz durante los primeros segundos, con un consumo de energía de la placa y una temperatura del núcleo de 44 W y 97 C, respectivamente. Sin embargo, al cabo de unos segundos, la velocidad de reloj empezaba a caer de forma constante antes de estabilizarse en el rango de 2,1 a 2,5 GHz y de 72 a 85 C. El consumo de energía de la placa también caería al rango de 23 a 25 W, ya que las altas velocidades de reloj de Turbo Boost son insostenibles. Estos resultados se correlacionan con nuestras observaciones del bucle CineBench R15 anteriores. Repitiendo esta prueba en el Razer Book 13 resultaría en una temperatura del núcleo mucho más fría, de 60 C.
Si se ejecuta Witcher 3 para representar cargas altas daría como resultado una velocidad de reloj de la GPU estable y una temperatura de 1247 MHz y 83 C, respectivamente, en comparación con los 1300 MHz y sólo 59 C del Razer mencionado anteriormente. El procesador del Latitude tiene que funcionar a mayor temperatura para compensar la menor solución de refrigeración.
Funcionar con batería limita el rendimiento. Una prueba 3DMark 11 con baterías arrojaría unas puntuaciones de Física y Gráficos de 8511 y 4764 puntos, respectivamente, en comparación con los 13486 y 5840 puntos cuando está conectado a la red eléctrica.
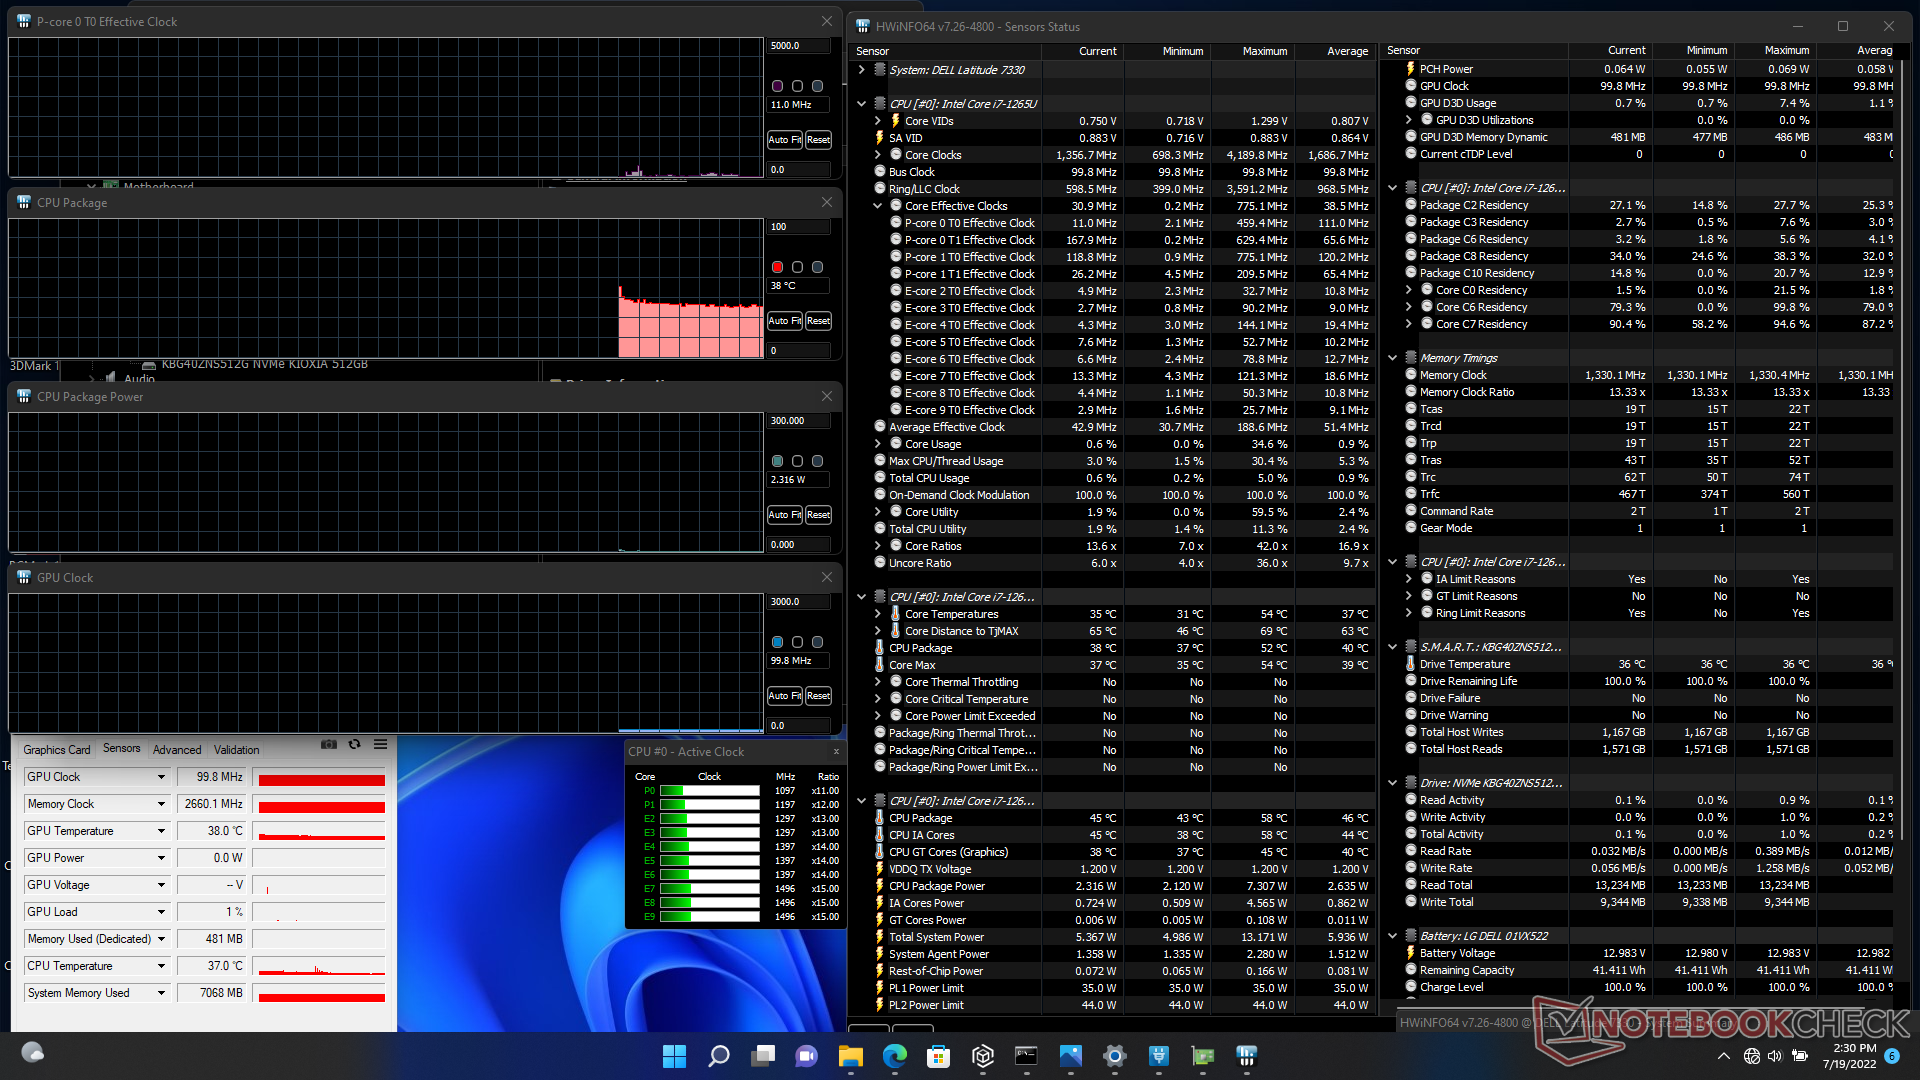

| Reloj dela CPU (GHz) | Reloj de la GPU (MHz) | Temperatura media de la CPU (°C) | |
| Sistema en reposo | -- | -- | 38 |
| Prime95 Stress | 2,1 - 2,5 | -- | 72 - 85 |
| Prime95+ FurMark Stress | ~1,4 | 848 | 75 |
| Witcher 3 Stress | ~2.3 | 1247 | 83 |
Altavoces
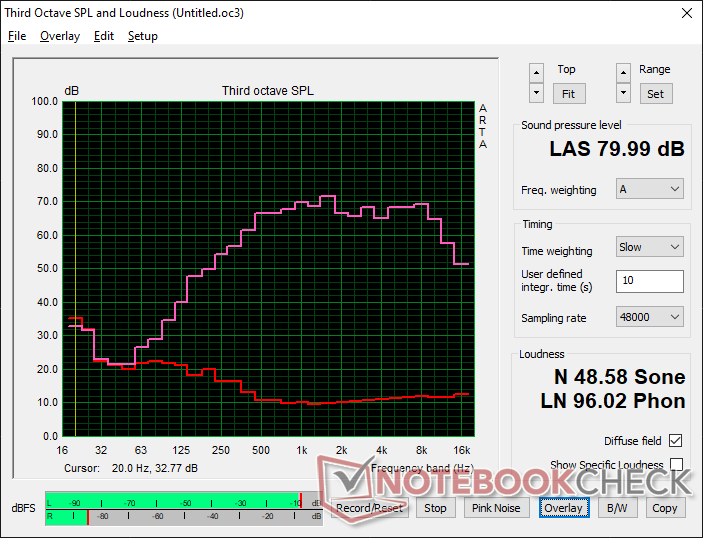
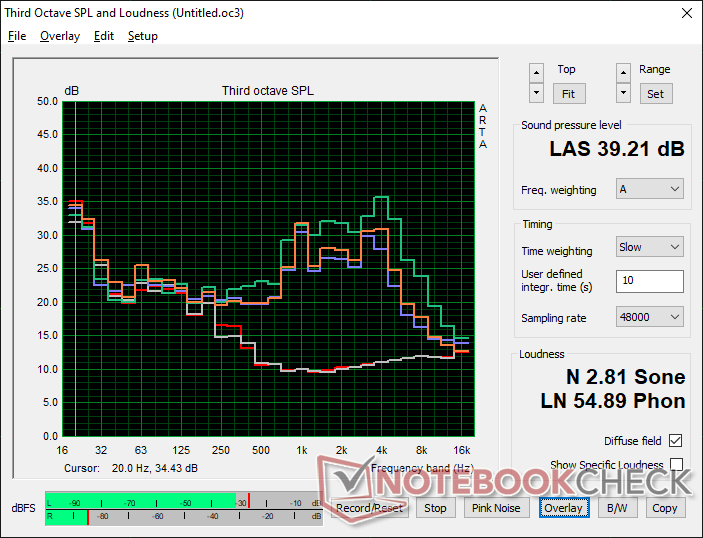
Dell Latitude 13 7330 análisis de audio
(±) | la sonoridad del altavoz es media pero buena (80 dB)
Graves 100 - 315 Hz
(-) | casi sin bajos - de media 18.6% inferior a la mediana
(±) | la linealidad de los graves es media (8.6% delta a frecuencia anterior)
Medios 400 - 2000 Hz
(+) | medios equilibrados - a sólo 2.7% de la mediana
(+) | los medios son lineales (5.1% delta a la frecuencia anterior)
Altos 2 - 16 kHz
(+) | máximos equilibrados - a sólo 1.9% de la mediana
(+) | los máximos son lineales (4.1% delta a la frecuencia anterior)
Total 100 - 16.000 Hz
(+) | el sonido global es lineal (14.8% de diferencia con la mediana)
En comparación con la misma clase
» 13% de todos los dispositivos probados de esta clase eran mejores, 4% similares, 83% peores
» El mejor tuvo un delta de 7%, la media fue 21%, el peor fue ###max##%
En comparación con todos los dispositivos probados
» 20% de todos los dispositivos probados eran mejores, 4% similares, 76% peores
» El mejor tuvo un delta de 4%, la media fue 23%, el peor fue ###max##%
Apple MacBook Pro 16 2021 M1 Pro análisis de audio
(+) | los altavoces pueden reproducir a un volumen relativamente alto (#84.7 dB)
Graves 100 - 315 Hz
(+) | buen bajo - sólo 3.8% lejos de la mediana
(+) | el bajo es lineal (5.2% delta a la frecuencia anterior)
Medios 400 - 2000 Hz
(+) | medios equilibrados - a sólo 1.3% de la mediana
(+) | los medios son lineales (2.1% delta a la frecuencia anterior)
Altos 2 - 16 kHz
(+) | máximos equilibrados - a sólo 1.9% de la mediana
(+) | los máximos son lineales (2.7% delta a la frecuencia anterior)
Total 100 - 16.000 Hz
(+) | el sonido global es lineal (4.6% de diferencia con la mediana)
En comparación con la misma clase
» 0% de todos los dispositivos probados de esta clase eran mejores, 0% similares, 100% peores
» El mejor tuvo un delta de 5%, la media fue 17%, el peor fue ###max##%
En comparación con todos los dispositivos probados
» 0% de todos los dispositivos probados eran mejores, 0% similares, 100% peores
» El mejor tuvo un delta de 4%, la media fue 23%, el peor fue ###max##%
Gestión de la energía
Consumo de energía - Más exigente
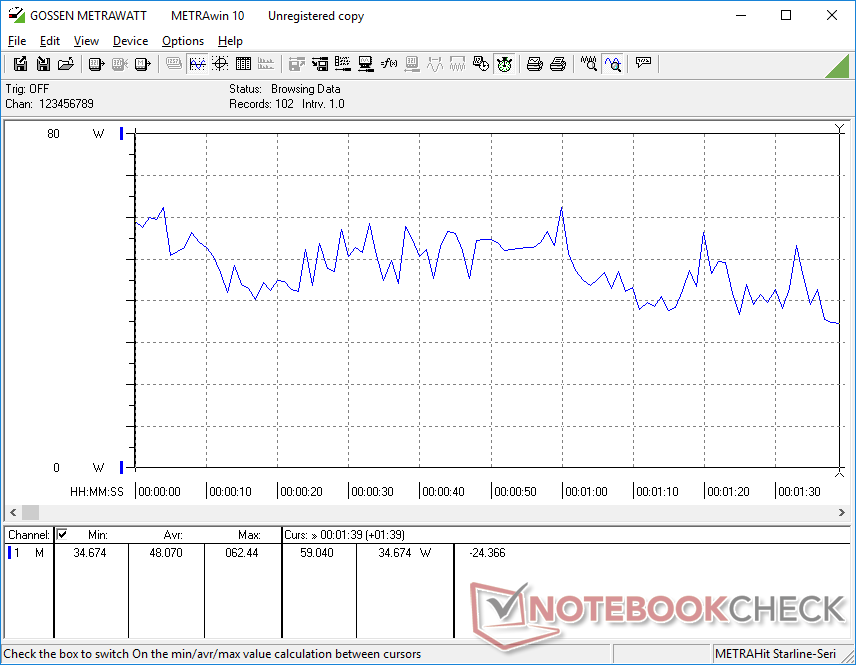
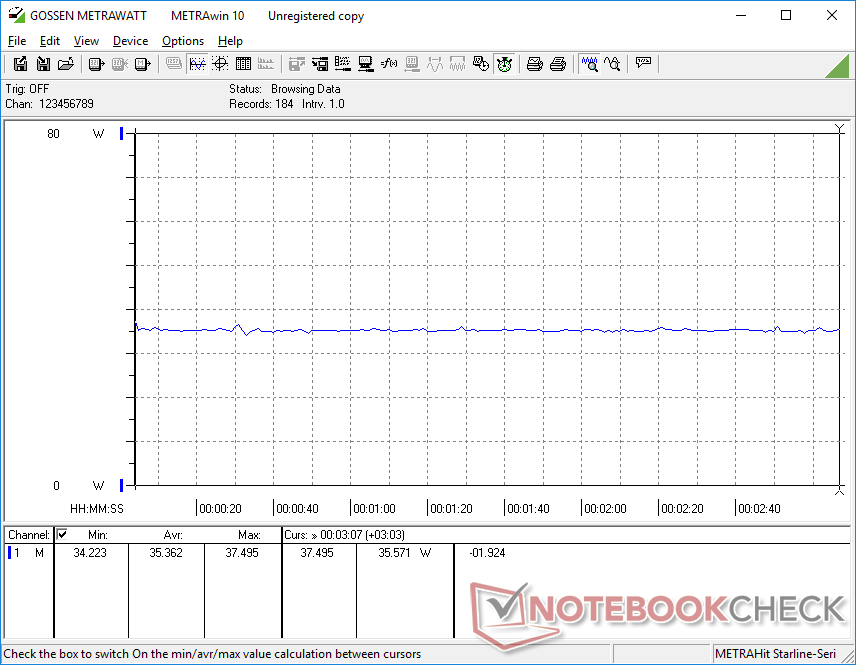
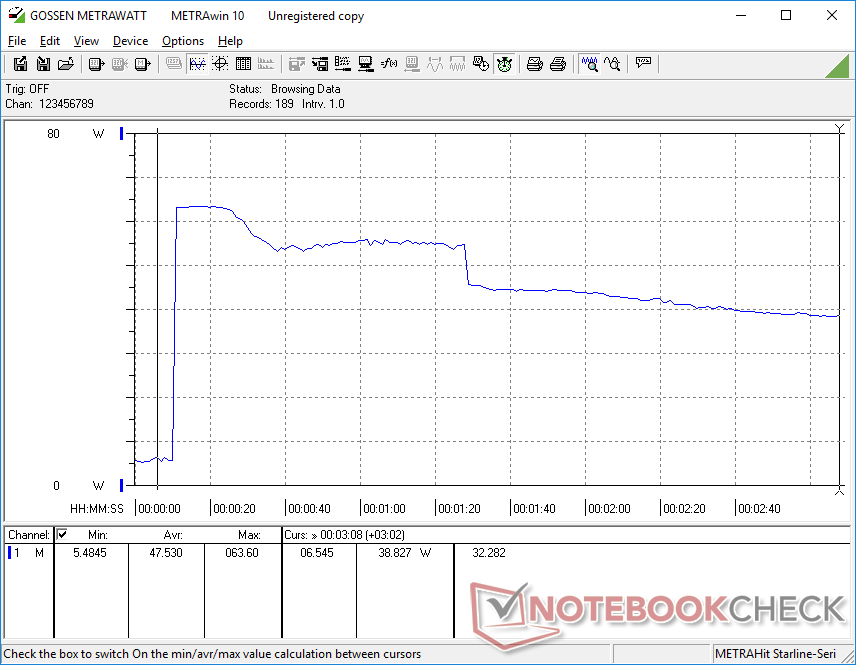
El consumo de energía es generalmente más alto que en los portátiles que funcionan con hardware de la generación anterior, lo que coincide con nuestras observaciones sobre la plataforma Alder Lake en su conjunto. Ejecutar 3DMark06 y Prime95, por ejemplo, consumiría un 30 y un 21 por ciento más de energía, respectivamente, que en el Razer Book 13 con Core i7-1165G7. El rendimiento puede ser mayor, pero el rendimiento por vatio no es tan alto como esperábamos.
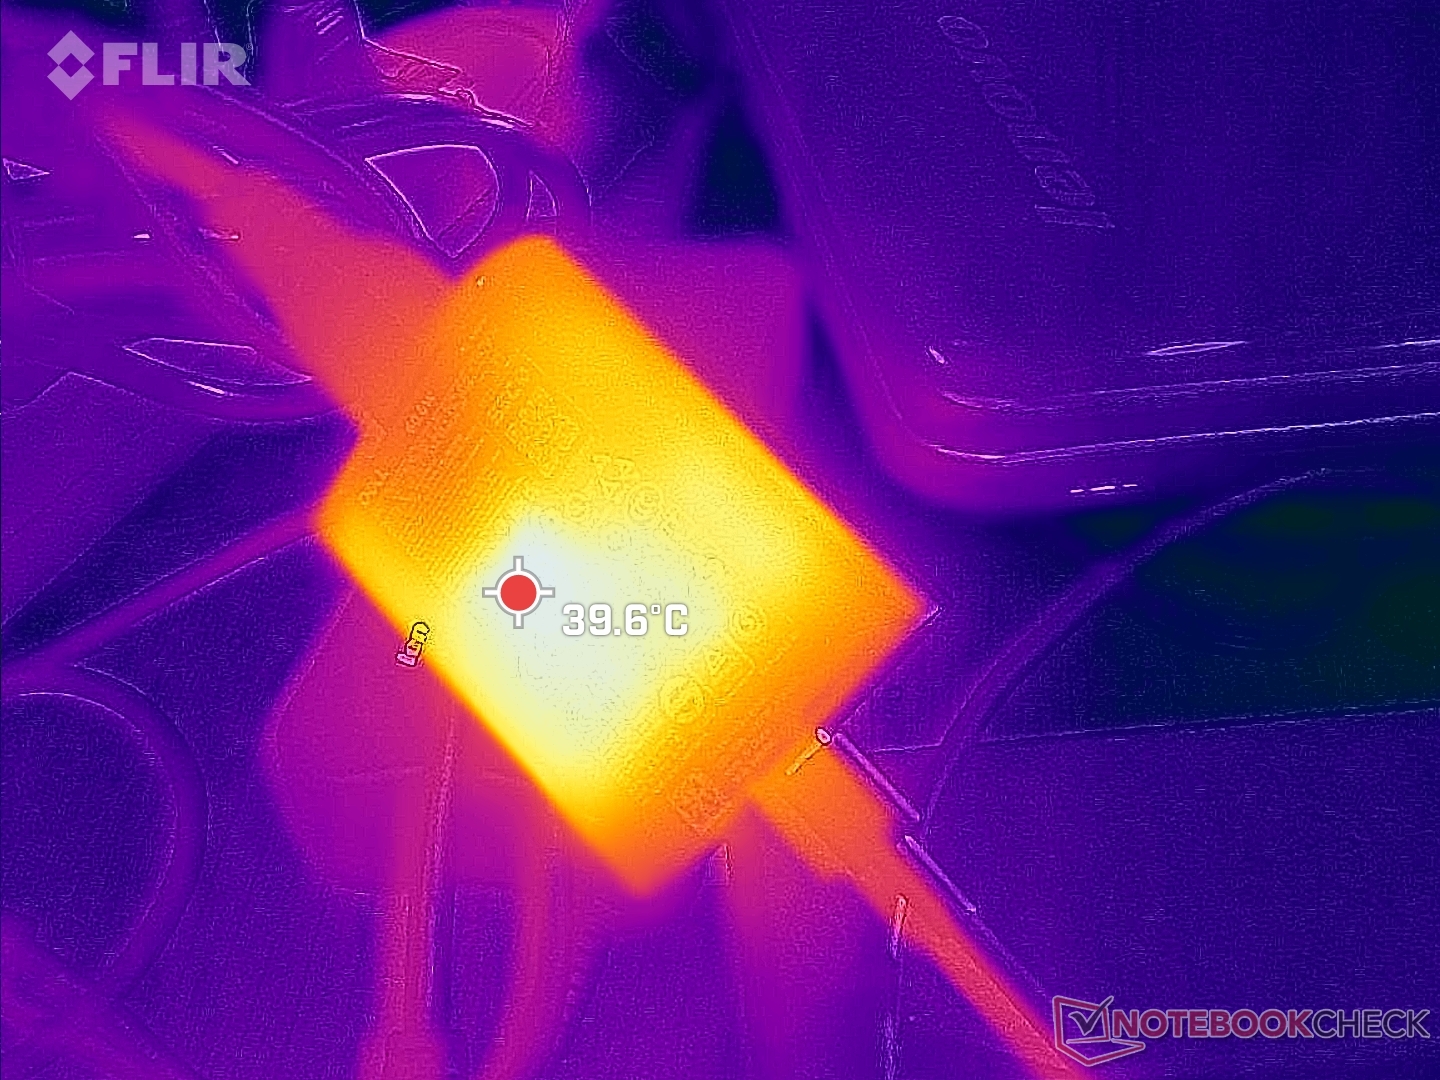
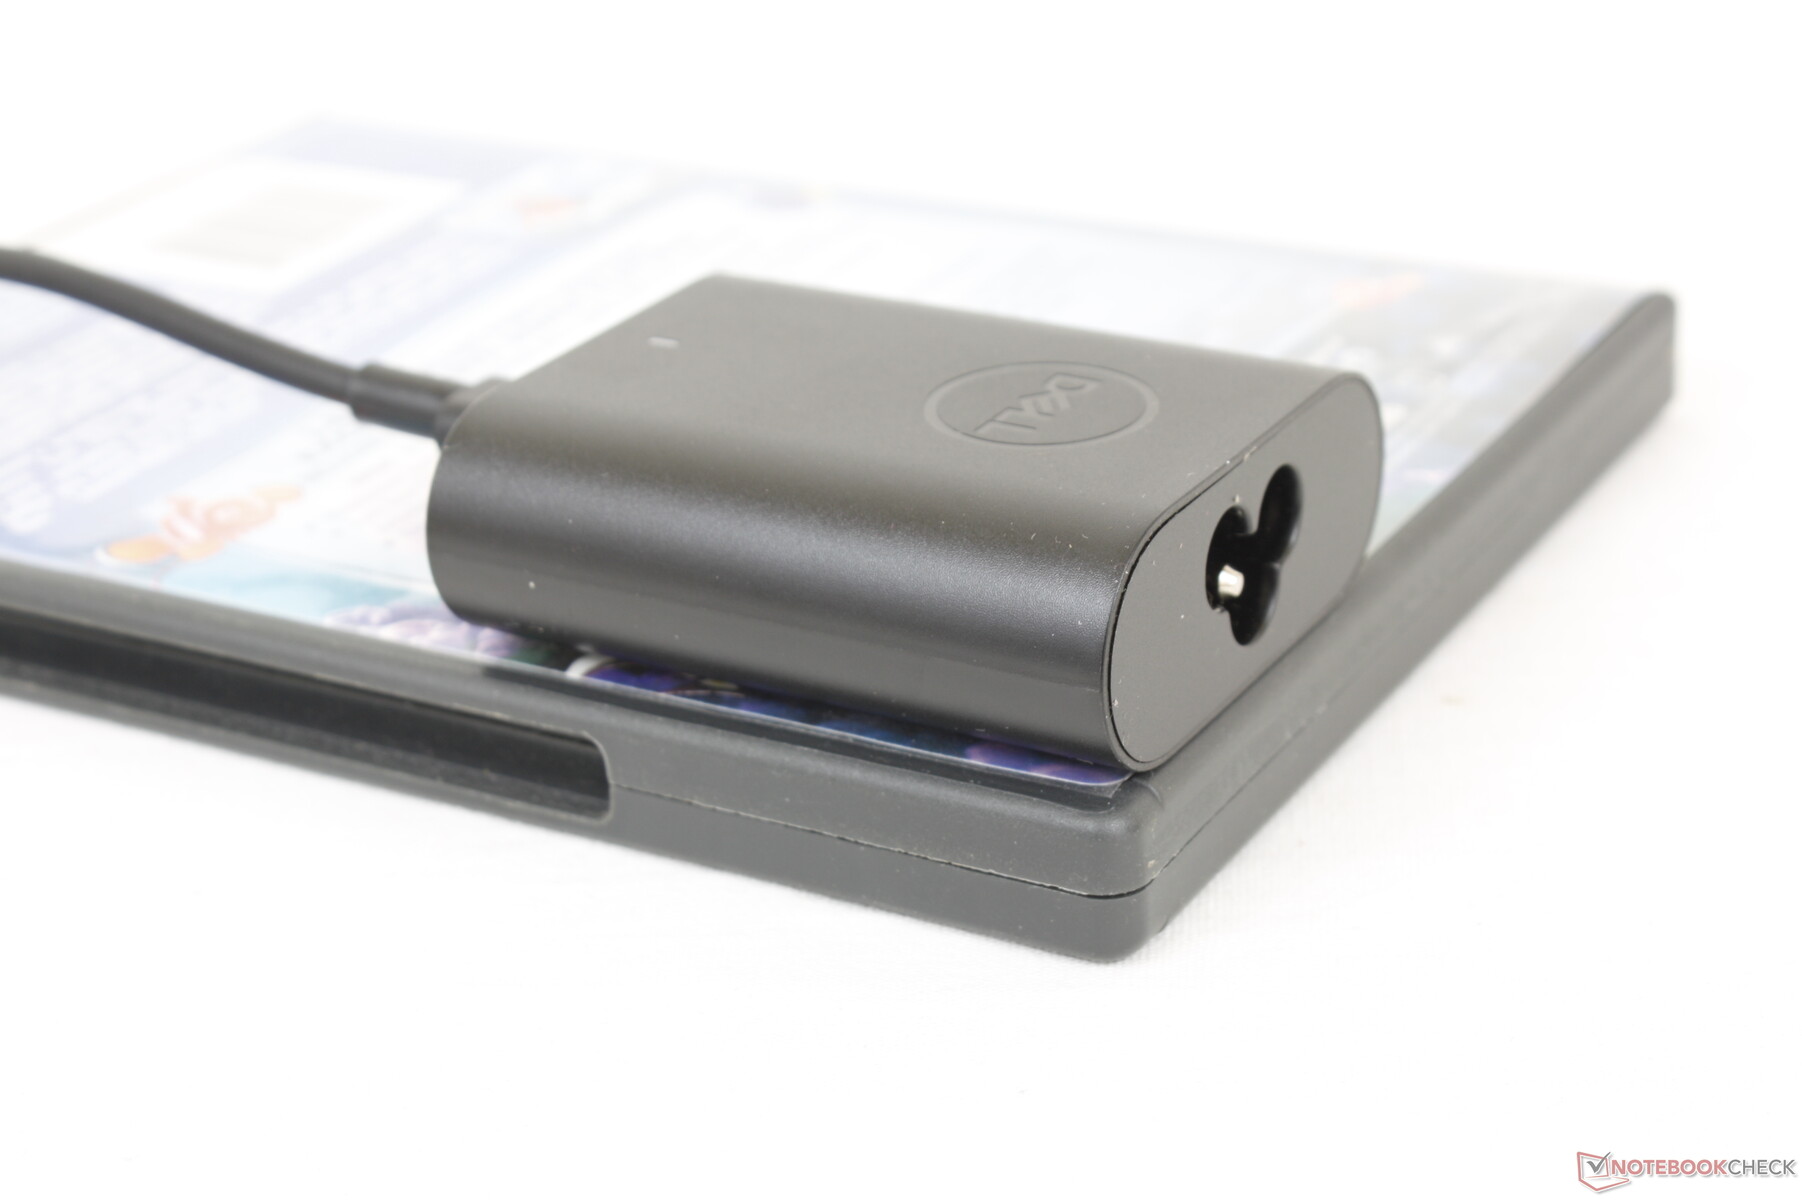
Pudimos registrar un consumo máximo de 63.6 W desde el pequeñísimo (~6.6 x 5.5 x 2.2 cm) adaptador USB-C AC de 60 W. Esta tasa es sólo temporal, como muestra la captura de pantalla de abajo, debido a las limitaciones térmicas de la solución de refrigeración de la CPU. El sistema seguirá recargando a una tasa decente cuando esté bajo un fuerte estrés de procesamiento.
Los adaptadores de CA más grandes de 65 W o 90 W también son opciones dependiendo de la configuración.

| Off / Standby | |
| Ocioso | |
| Carga |
|
Clave:
min: | |
| Dell Latitude 13 7330 i7-1265U, Iris Xe G7 96EUs, Toshiba KBG40ZNS512G NVMe, IPS, 1920x1080, 13.3" | Lenovo ThinkPad X13 Yoga 20SX0004GE i7-10510U, UHD Graphics 620, Samsung SSD PM981a MZVLB512HBJQ, IPS, 1920x1080, 13.3" | Framework Laptop 13.5 12th Gen Intel i7-1260P, Iris Xe G7 96EUs, WDC PC SN730 SDBPNTY-512G, IPS, 2256x1504, 13.5" | Razer Book 13 FHD i7-1165G7, Iris Xe G7 96EUs, Samsung SSD PM981a MZVLB256HBHQ, IPS, 1920x1200, 13.4" | Dell Latitude 7310 i7-10610U, UHD Graphics 620, Samsung SSD PM981a MZVLB512HBJQ, IPS, 1920x1080, 13.3" | Microsoft Surface Laptop 4 13 Ryzen 5 R5 4680U, Vega 7, Samsung PM991 MZ9LQ256HBJQ, IPS, 2256x1504, 13.5" | |
|---|---|---|---|---|---|---|
| Power Consumption | -3% | -44% | -2% | 13% | -8% | |
| Idle Minimum * (Watt) | 2.8 | 3.4 -21% | 5.3 -89% | 3.3 -18% | 2.7 4% | 3.4 -21% |
| Idle Average * (Watt) | 4.8 | 4.98 -4% | 8.4 -75% | 6.4 -33% | 4.4 8% | 6.3 -31% |
| Idle Maximum * (Watt) | 7.3 | 8.1 -11% | 11.2 -53% | 7 4% | 4.8 34% | 8.1 -11% |
| Load Average * (Watt) | 48.1 | 37.2 23% | 57.4 -19% | 37.3 22% | 33.4 31% | 36.2 25% |
| Witcher 3 ultra * (Watt) | 35.4 | 46.7 -32% | 36.4 -3% | |||
| Load Maximum * (Watt) | 63.6 | 63.3 -0% | 61.2 4% | 53.7 16% | 69.7 -10% | 64.1 -1% |
* ... más pequeño es mejor
Power Consumption Witcher 3 / Stresstest
Power Consumption external Monitor
Duración de la batería
Los usuarios tienen la opción de configurarlo con una batería más ligera de 41 Wh o con una más pesada pero más duradera de 58 Wh. Hemos podido exprimir algo más de 8 horas de uso real de la WLAN de nuestra unidad de prueba de 41 Wh, lo que debería ser más que suficiente para la mayoría de usuarios.
La carga desde el vacío hasta la capacidad total con el adaptador USB-C AC incluido tarda entre 2 y 2,5 horas.
| Dell Latitude 13 7330 i7-1265U, Iris Xe G7 96EUs, 41 Wh | Lenovo ThinkPad X13 Yoga 20SX0004GE i7-10510U, UHD Graphics 620, 50 Wh | Framework Laptop 13.5 12th Gen Intel i7-1260P, Iris Xe G7 96EUs, 55 Wh | Razer Book 13 FHD i7-1165G7, Iris Xe G7 96EUs, 55 Wh | Dell Latitude 7310 i7-10610U, UHD Graphics 620, 52 Wh | Microsoft Surface Laptop 4 13 Ryzen 5 R5 4680U, Vega 7, 47.4 Wh | |
|---|---|---|---|---|---|---|
| Duración de Batería | 53% | -10% | 65% | 51% | 31% | |
| Reader / Idle (h) | 21.9 | 36.8 68% | 37.4 71% | |||
| WiFi v1.3 (h) | 8.3 | 8.2 -1% | 7.5 -10% | 14.8 78% | 12.6 52% | 10.9 31% |
| Load (h) | 1.4 | 2.9 107% | 2.1 50% | 1.8 29% |
Pro
Contra
Veredicto - Opciones, opciones, opciones
El alto nivel de configuraciones ayuda a diferenciar el Latitude 7330 de otros subportátiles empresariales. Características como el lector MicroSD, la conectividad 4G LTE, la cámara web de 1080p, el factor de forma 2 en 1, la fibra de carbono, el tamaño de la batería e incluso el adaptador de CA son opcionales en función de las necesidades del comprador. Si sus cargas de trabajo diarias no requieren ciertas características, entonces simplemente se pueden omitir al momento de la compra para obtener un peso total más ligero. Otros portátiles ultraligeros como el LG Gram 13 o la serie Toshiba X30 tienen muchas menos opciones configurables como debido a su menor escala de producción en relación con la serie Dell Latitude.
La serie Latitude 7330 es grande en opciones configurables y personalizaciones para adaptarse mejor a las necesidades específicas del usuario. Sin embargo, su relación de aspecto 16:9 está empezando a mostrar su edad.
Las alternativas más cercanas al Latitude 7330 son el HP EliteBook 830 G8 y G9, que ofrecen características como una relación de aspecto 16:10 más grande, una cámara web de 5 MP más nítida, módulos de RAM extraíbles y opciones de pantalla de 1000 nits significativamente más brillantes, todo lo cual no está disponible en el Latitude 7330. Sin embargo, son ligeramente más pesados que nuestro Dell, pero sus atributos más potentes pueden merecer el aumento de peso para algunos usuarios.
Precio y disponibilidad
El Latitude 7330 todavía no está disponible en Amazon o Best Buy. Se recomienda comprar directamente en Dell donde los precios actualmente rondan los $2000 USD.
Dell Latitude 13 7330
- 07/22/2022 v7 (old)
Allen Ngo
Price comparison

