Breve análisis del Dell Latitude 11 5175 Tablet
| |||||||||||||||||||||||||
iluminación: 86 %
Brillo con batería: 461 cd/m²
Contraste: 1027:1 (Negro: 0.45 cd/m²)
ΔE ColorChecker Calman: 4.4 | ∀{0.5-29.43 Ø4.72}
ΔE Greyscale Calman: 3.49 | ∀{0.09-98 Ø4.97}
80.76% sRGB (Argyll 1.6.3 3D)
53.21% AdobeRGB 1998 (Argyll 1.6.3 3D)
59.3% AdobeRGB 1998 (Argyll 3D)
81.1% sRGB (Argyll 3D)
63.4% Display P3 (Argyll 3D)
Gamma: 2.55
CCT: 6256 K
| Dell Latitude 11 5175 HD Graphics 515, 6Y57, Samsung PM871 MZYLN256HCHP | Microsoft Surface Pro 4, Core m3 HD Graphics 515, 6Y30, Samsung MZFLV128 NVMe | HP Elite x2 1011 G1 HD Graphics 5300, 5Y51, Samsung SSD PM851 256 GB MZNTE256HMHP | HP Elite x2 1012 G1 HD Graphics 515, 6Y54, Liteon L8H-256V2G | Lenovo ThinkPad Helix 2 HD Graphics 5300, 5Y71, Toshiba THNSFJ256GDNU 256 GB | HP Spectre x2 12-a003ng K3D42EA HD Graphics 515, 6Y75, Sandisk X300 SD7SN6S-256G-1006 | |
|---|---|---|---|---|---|---|
| Display | 14% | -24% | -11% | -13% | ||
| Display P3 Coverage (%) | 63.4 | 67.5 6% | 44.4 -30% | 53.8 -15% | 52.9 -17% | |
| sRGB Coverage (%) | 81.1 | 96.6 19% | 66.4 -18% | 73.7 -9% | 71.8 -11% | |
| AdobeRGB 1998 Coverage (%) | 59.3 | 69 16% | 45.91 -23% | 53.8 -9% | 52.6 -11% | |
| Response Times | -10% | 20% | -1% | |||
| Response Time Grey 50% / Grey 80% * (ms) | 46 ? | 46 ? -0% | 33.2 ? 28% | 47 ? -2% | ||
| Response Time Black / White * (ms) | 26 ? | 31 ? -19% | 22.8 ? 12% | 26 ? -0% | ||
| PWM Frequency (Hz) | 200 | 50 ? | ||||
| Screen | 12% | -31% | -21% | 2% | -23% | |
| Brightness middle (cd/m²) | 462 | 389.2 -16% | 364 -21% | 322 -30% | 365 -21% | 353 -24% |
| Brightness (cd/m²) | 449 | 392 -13% | 331 -26% | 319 -29% | 342 -24% | 347 -23% |
| Brightness Distribution (%) | 86 | 92 7% | 84 -2% | 97 13% | 86 0% | 91 6% |
| Black Level * (cd/m²) | 0.45 | 0.27 40% | 0.44 2% | 0.42 7% | 0.329 27% | 0.44 2% |
| Contrast (:1) | 1027 | 1441 40% | 827 -19% | 767 -25% | 1109 8% | 802 -22% |
| Colorchecker dE 2000 * | 4.4 | 3.61 18% | 7.32 -66% | 6.02 -37% | 4.37 1% | 6.09 -38% |
| Colorchecker dE 2000 max. * | 9.21 | 10.06 -9% | ||||
| Greyscale dE 2000 * | 3.49 | 3.8 -9% | 7.37 -111% | 6.29 -80% | 2.8 20% | 6.24 -79% |
| Gamma | 2.55 86% | 2.16 102% | 2.03 108% | 2.4 92% | 2.3 96% | 2.41 91% |
| CCT | 6256 104% | 5969 109% | 6479 100% | 7712 84% | 6595 99% | 7238 90% |
| Color Space (Percent of AdobeRGB 1998) (%) | 53.21 | 63 18% | 42.2 -21% | 47.8 -10% | 46 -14% | |
| Color Space (Percent of sRGB) (%) | 80.76 | 97 20% | 66.1 -18% | 73.2 -9% | 71 -12% | |
| Media total (Programa/Opciones) | 5% /
9% | -28% /
-29% | -4% /
-13% | 2% /
2% | -12% /
-18% |
* ... más pequeño es mejor
Tiempos de respuesta del display
| ↔ Tiempo de respuesta de Negro a Blanco | ||
|---|---|---|
| 26 ms ... subida ↗ y bajada ↘ combinada | ↗ 7.2 ms subida | 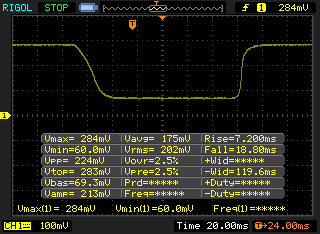 |
| ↘ 18.8 ms bajada | ||
| La pantalla mostró tiempos de respuesta relativamente lentos en nuestros tests pero podría ser demasiado lenta para los jugones. En comparación, todos los dispositivos de prueba van de ##min### (mínimo) a 240 (máximo) ms. » 63 % de todos los dispositivos son mejores. Eso quiere decir que el tiempo de respuesta es peor que la media (19.8 ms) de todos los dispositivos testados. | ||
| ↔ Tiempo de respuesta 50% Gris a 80% Gris | ||
| 46 ms ... subida ↗ y bajada ↘ combinada | ↗ 19 ms subida | 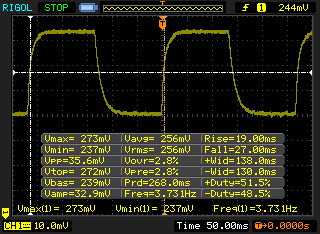 |
| ↘ 27 ms bajada | ||
| La pantalla mostró tiempos de respuesta lentos en nuestros tests y podría ser demasiado lenta para los jugones. En comparación, todos los dispositivos de prueba van de ##min### (mínimo) a 636 (máximo) ms. » 79 % de todos los dispositivos son mejores. Eso quiere decir que el tiempo de respuesta es peor que la media (31 ms) de todos los dispositivos testados. | ||
Parpadeo de Pantalla / PWM (Pulse-Width Modulation)
| Parpadeo de Pantalla / PWM detectado | 200 Hz | 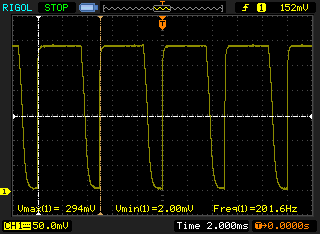 | |
La retroiluminación del display parpadea a 200 Hz (seguramente usa PWM - Pulse-Width Modulation) . La frecuencia de 200 Hz es relativamente baja, por lo que la gente sensible debería ver parpadeos y padecer fatiga visual por la pantalla (usado al brillo indicado a continuación). Comparación: 52 % de todos los dispositivos testados no usaron PWM para atenuar el display. Si se usó, medimos una media de 7750 (mínimo: 5 - máxmo: 343500) Hz. | |||
| Cinebench R10 | |
| Rendering Multiple CPUs 64Bit (ordenar por valor) | |
| Dell Latitude 11 5175 | |
| Microsoft Surface Pro 4, Core m3 | |
| Lenovo ThinkPad Helix 2 | |
| HP Spectre x2 12-a003ng K3D42EA | |
| Rendering Single CPUs 64Bit (ordenar por valor) | |
| Dell Latitude 11 5175 | |
| Microsoft Surface Pro 4, Core m3 | |
| Lenovo ThinkPad Helix 2 | |
| HP Spectre x2 12-a003ng K3D42EA | |
| PCMark 7 Score | 4289 puntos | |
| PCMark 8 Home Score Accelerated v2 | 2641 puntos | |
| PCMark 8 Creative Score Accelerated v2 | 2905 puntos | |
| PCMark 8 Work Score Accelerated v2 | 3720 puntos | |
ayuda | ||

| 3DMark 11 Performance | 951 puntos | |
| 3DMark Ice Storm Standard Score | 35822 puntos | |
| 3DMark Cloud Gate Standard Score | 3748 puntos | |
| 3DMark Fire Strike Score | 545 puntos | |
| 3DMark Fire Strike Extreme Score | 274 puntos | |
ayuda | ||
| bajo | medio | alto | ultra | |
|---|---|---|---|---|
| BioShock Infinite (2013) | 32.99 | 17.76 | 15.32 | 4.39 |
| Battlefield 4 (2013) | 22.56 | 15.23 | 9.69 | 5.64 |
| Rise of the Tomb Raider (2016) | 7.96 | 5.18 |
(±) La temperatura máxima en la parte superior es de 44.1 °C / 111 F, frente a la media de 33.7 °C / 93 F, que oscila entre 20.7 y 53.2 °C para la clase Tablet.
(±) El fondo se calienta hasta un máximo de 43.3 °C / 110 F, frente a la media de 33.2 °C / 92 F
(+) En reposo, la temperatura media de la parte superior es de 29.3 °C / 85# F, frente a la media del dispositivo de 30 °C / 86 F.
| Dell Latitude 11 5175 HD Graphics 515, 6Y57, Samsung PM871 MZYLN256HCHP | HP Elite x2 1011 G1 HD Graphics 5300, 5Y51, Samsung SSD PM851 256 GB MZNTE256HMHP | HP Elite x2 1012 G1 HD Graphics 515, 6Y54, Liteon L8H-256V2G | Lenovo ThinkPad Helix 2 HD Graphics 5300, 5Y71, Toshiba THNSFJ256GDNU 256 GB | HP Spectre x2 12-a003ng K3D42EA HD Graphics 515, 6Y75, Sandisk X300 SD7SN6S-256G-1006 | |
|---|---|---|---|---|---|
| Power Consumption | 21% | -46% | -15% | -37% | |
| Idle Minimum * (Watt) | 2.7 | 1.5 44% | 3.7 -37% | 2 26% | 4.5 -67% |
| Idle Average * (Watt) | 5.8 | 4 31% | 6.8 -17% | 6 -3% | 7.7 -33% |
| Idle Maximum * (Watt) | 6.6 | 5 24% | 7.6 -15% | 6.6 -0% | 8.3 -26% |
| Load Average * (Watt) | 15.2 | 13.9 9% | 22.5 -48% | 17.6 -16% | 19.8 -30% |
| Load Maximum * (Watt) | 16.1 | 16.9 -5% | 34.5 -114% | 29.7 -84% | 20.6 -28% |
* ... más pequeño es mejor
| Off / Standby | |
| Ocioso | |
| Carga |
|
Clave:
min: | |
| Dell Latitude 11 5175 35 Wh | Microsoft Surface Pro 4, Core m3 38 Wh | HP Elite x2 1011 G1 54 Wh | HP Elite x2 1012 G1 37 Wh | Lenovo ThinkPad Helix 2 35 Wh | HP Spectre x2 12-a003ng K3D42EA 42 Wh | |
|---|---|---|---|---|---|---|
| Duración de Batería | -2% | 55% | -6% | 8% | 1% | |
| Reader / Idle (h) | 13.2 | 13.2 0% | 17.7 34% | 12.2 -8% | 16.1 22% | 15.9 20% |
| H.264 (h) | 6.9 | 11 59% | 7.2 4% | 6 -13% | ||
| WiFi v1.3 (h) | 7.1 | 8.1 14% | 11.3 59% | 7.4 4% | 6 -15% | |
| Load (h) | 2.9 | 2.3 -21% | 4.8 66% | 2.2 -24% | 3.3 14% | 2.8 -3% |
| WiFi (h) | 6.6 |
Pro
Contra
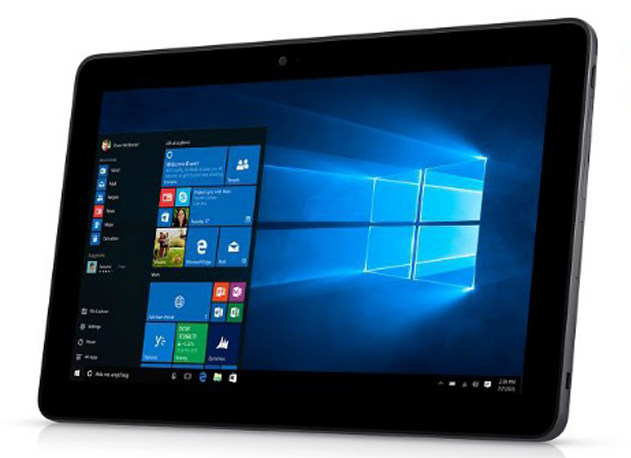
El Dell Latitude 11 5175 es un tablet business decente con una carcasa de diseño sencillo. El procesador Intel Core m5-6Y57 tiene suficiente potencia para poder vérselas con la rutina de la oficina. El bajo TDP del procesador permite ventilación pasiva. Con 256 GB, el SSD tiene capacidad de almacenamiento suficiente y puede asegurar un sistema fluido con buenos valores de lectura y escritura. La pantalla táctil funciona con precisión y responde rápidamente a las entradas, que se implementan sin mucha pérdida de tiempo. Lo que es más, el panel IPS convence con su buenísima estabilidad de ángulo de visión. Otro punto a favor es el buen rendimiento de la batería que también permite el uso móvil prolongado.
El tablet es una buena entrada en el sector empresarial. Sin embargo, no hay alternativa a los accesorios propietarios para trabajar más productivamente con el Dell 11 5175. El teclado anclable al menos debería estar en la lista de la compra.
El Dell Latitude 11 5175 tiene que aceptar ciertas críticas. El rendimiento del procesador no alcanza su máximo potencial. Por ello hay que aceptar claras pérdidas de rendimiento. El Microsoft Surface Pro 4 con un Core m3 es más rápido en comparación. La pantalla no es recomendable para el uso profesional ya que la cobertura de espacio de color es mediocre.
Los compradores potenciales conocen ahora las capacidades del Dell Latitude 11 5175 y sus defectos. Los compradores que puedan pasar con 1080p y una cobertura del espacio de color limitada deberían poner este tablet en su lista de finalistas. El rendimiento de la CPU es suficiente para un flujo de trabajo fluido a pesar de las restricciones. Difícilmente existen tablets que puedan sacarle todo el jugo permanentemente a un procesador Core m.
Ésta es una versión acortada del análisis original. Puedes leer el análisis completo en inglés aquí.
Dell Latitude 11 5175
- 04/19/2016 v5.1 (old)
Sebastian Bade