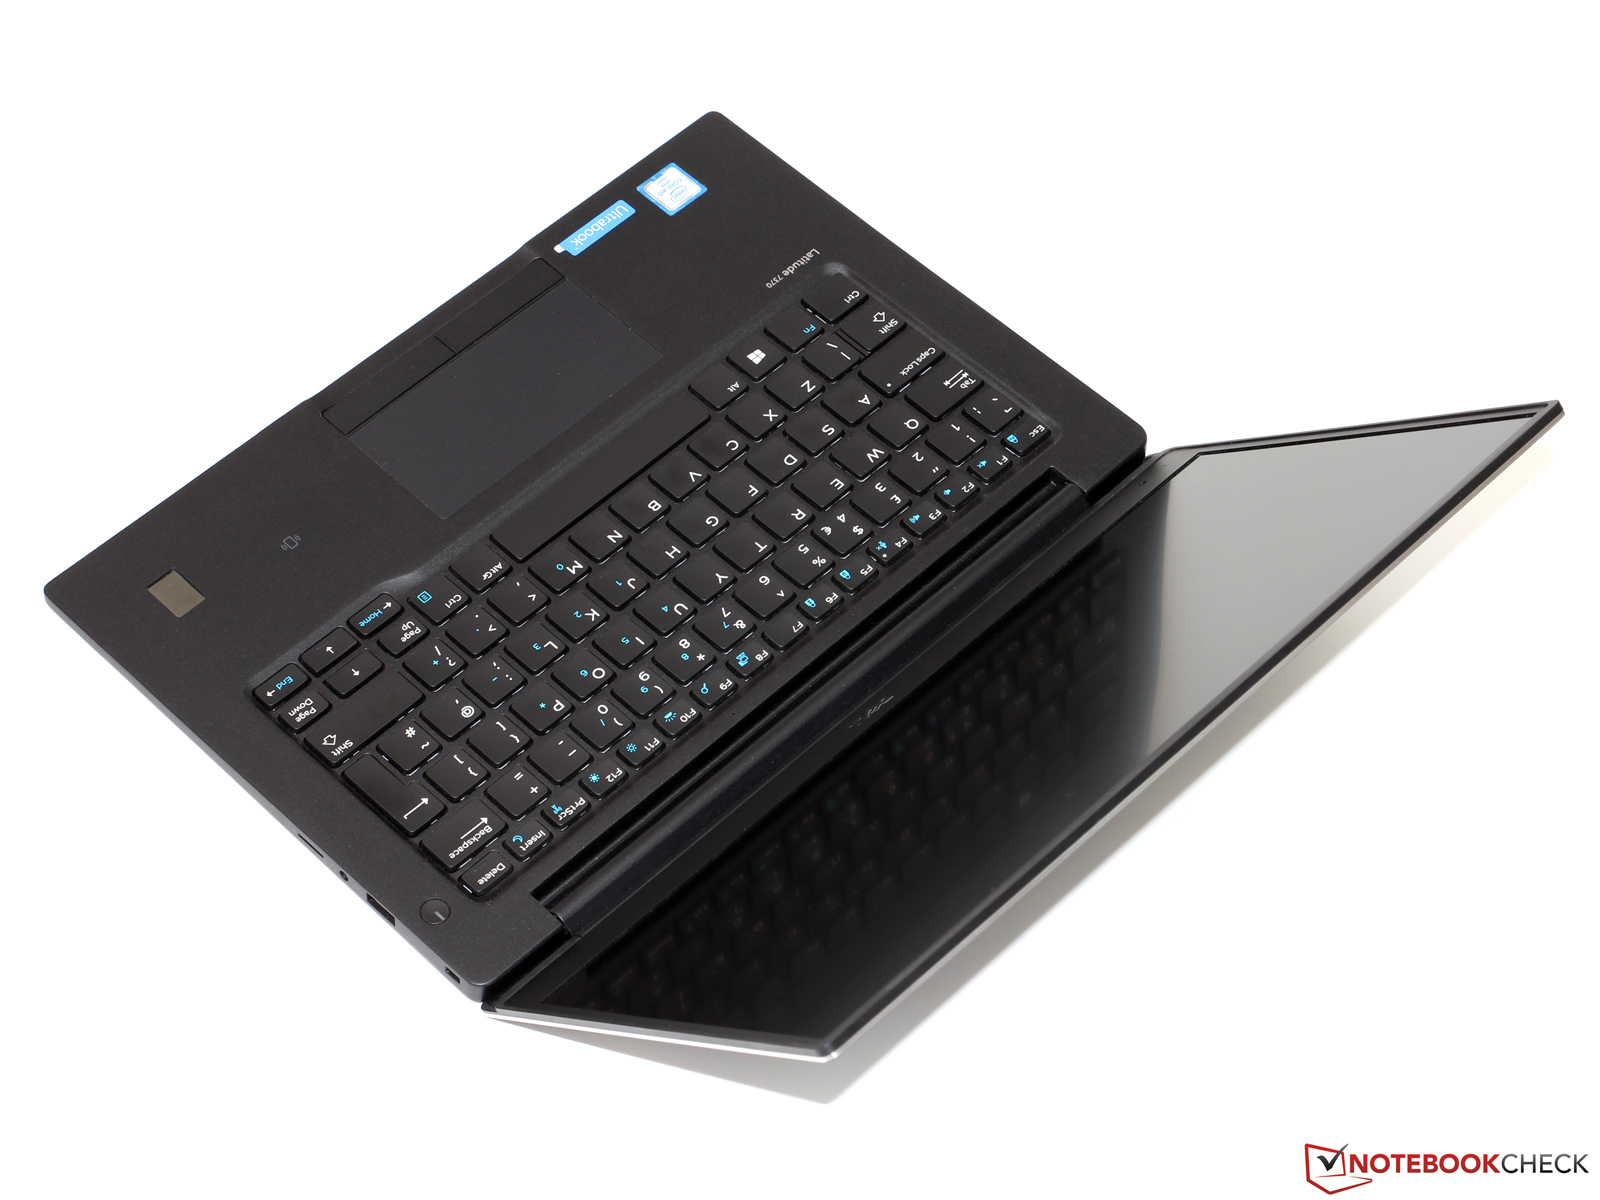
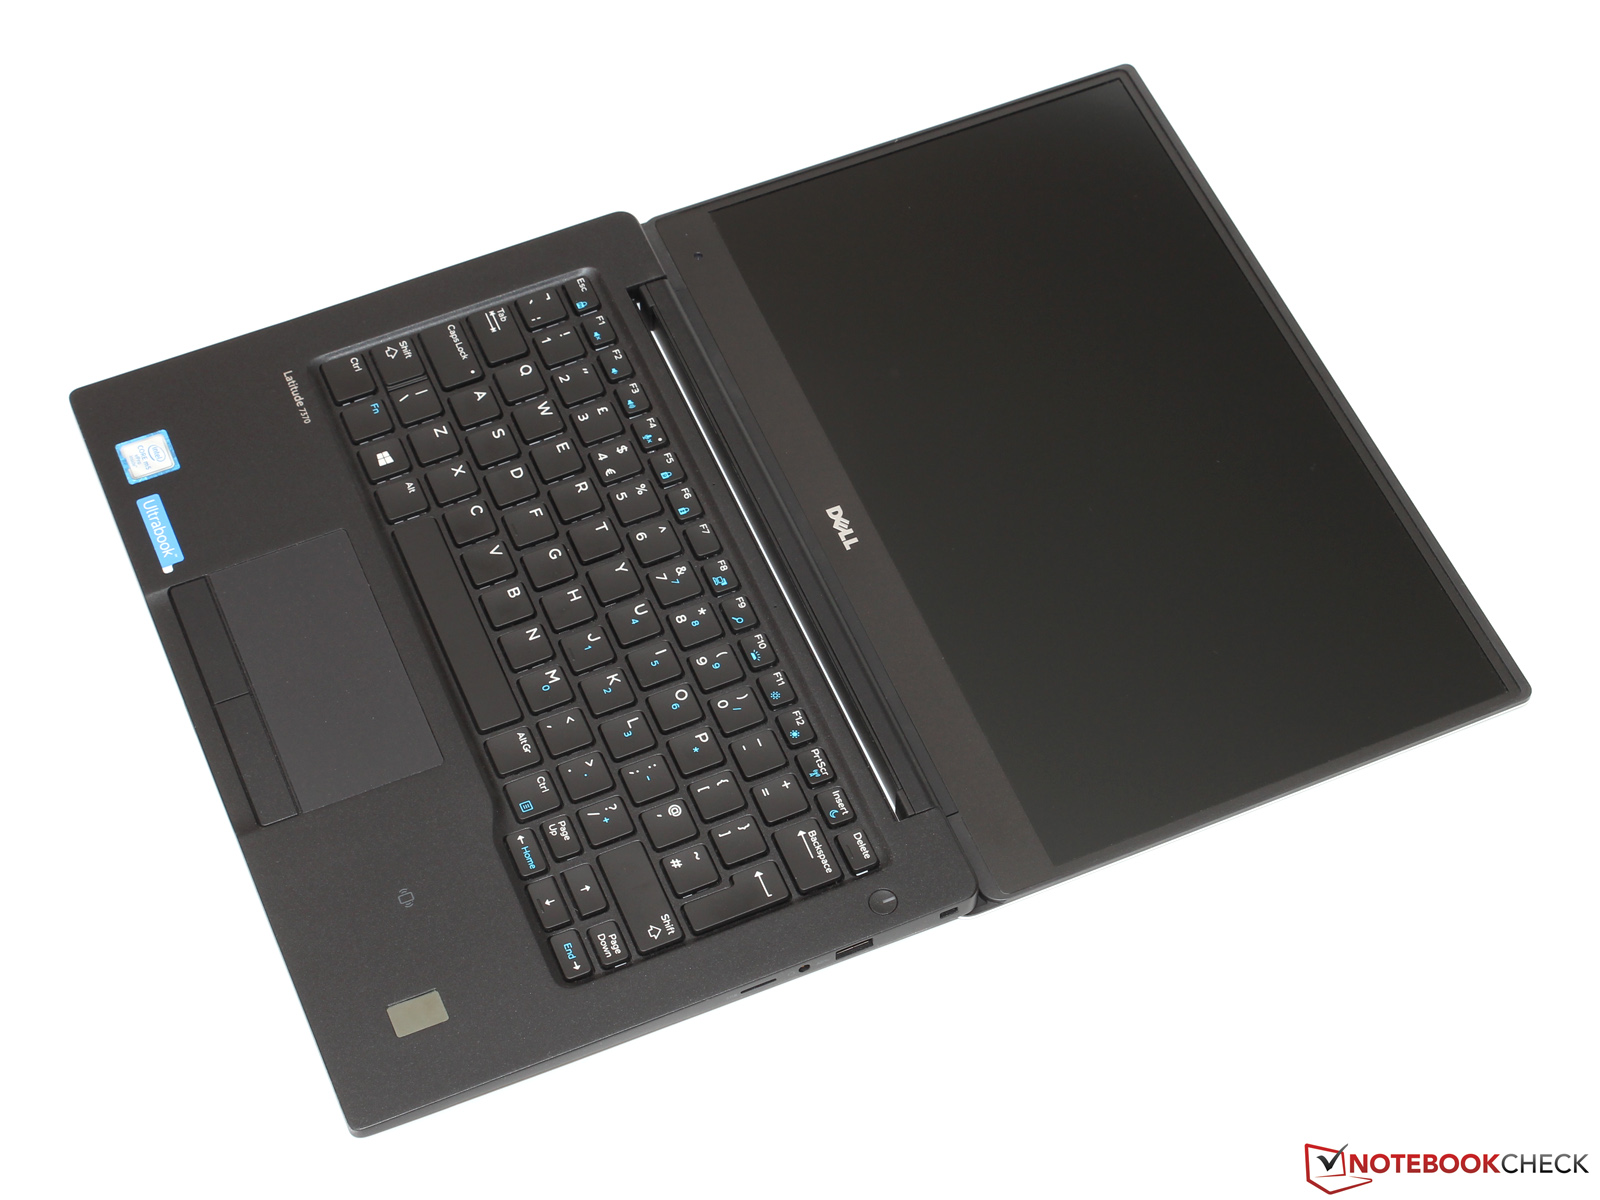
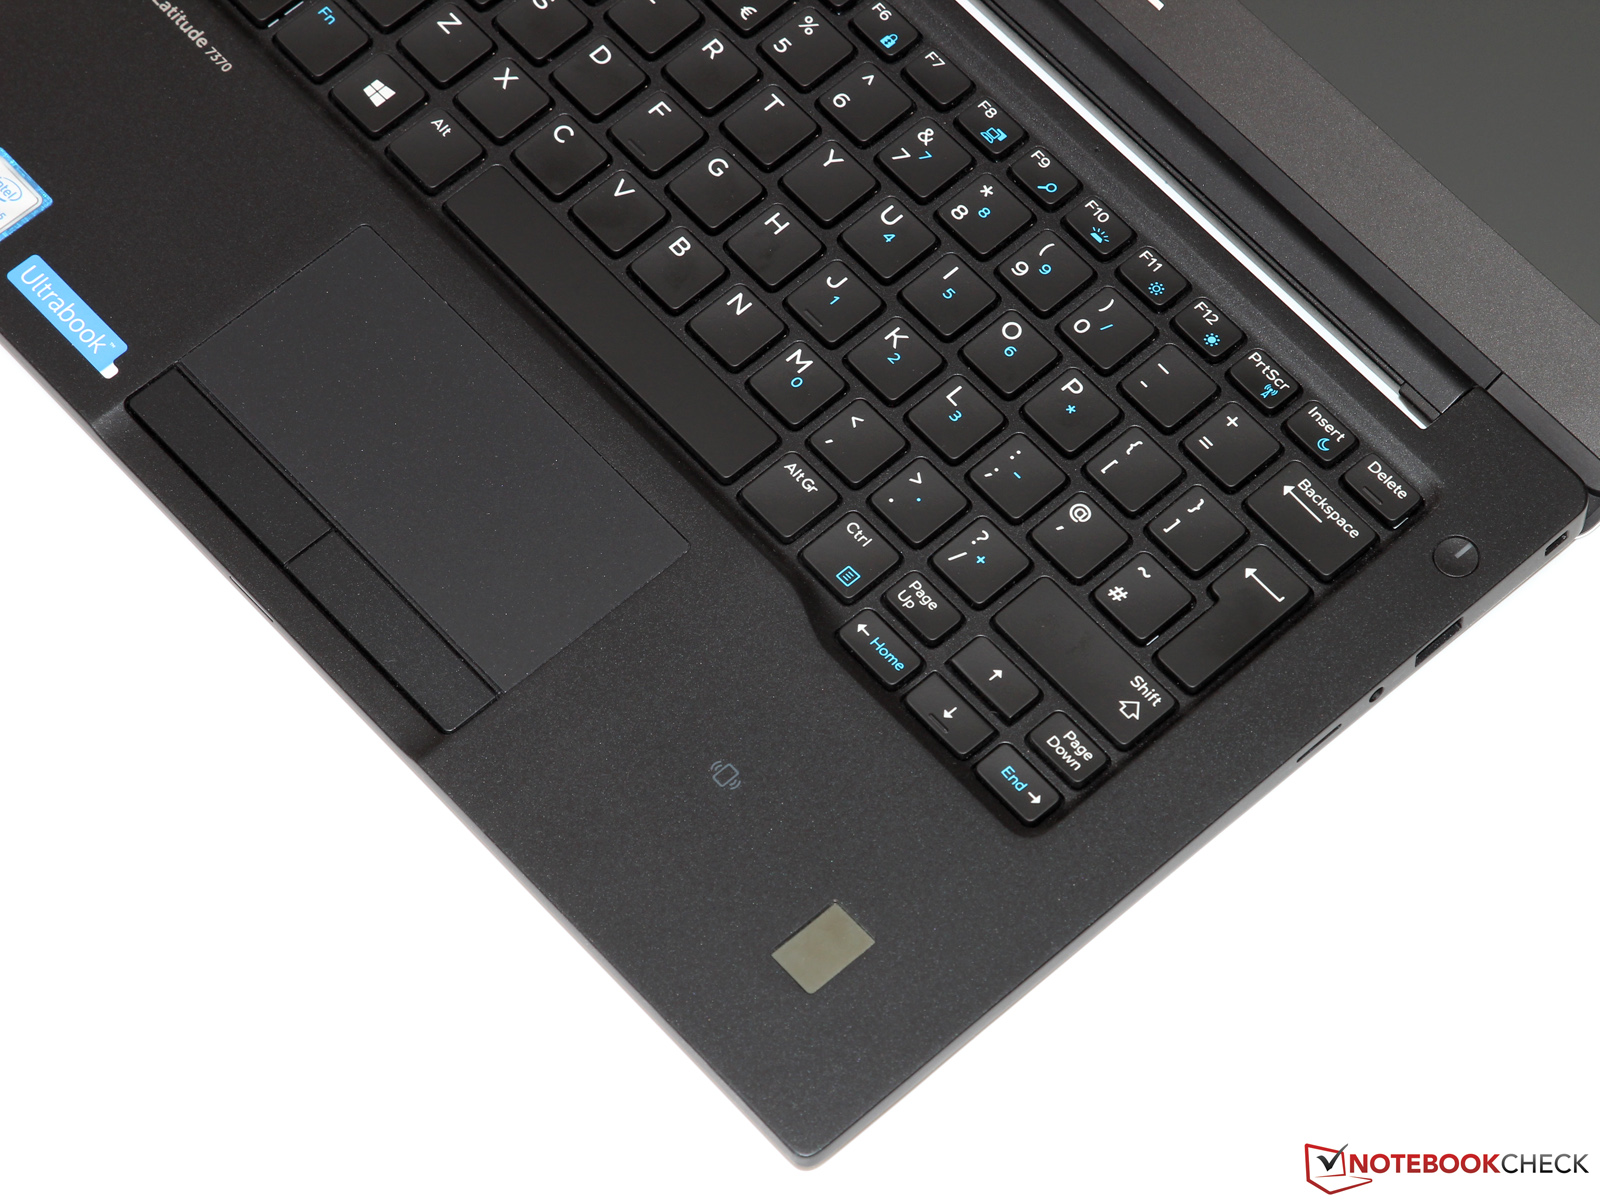
Breve análisis del Ultrabook Dell Latitude 13 7370
Parpadeo de Pantalla / PWM (Pulse-Width Modulation)
| Parpadeo de Pantalla / PWM no detectado | ||
Comparación: 52 % de todos los dispositivos testados no usaron PWM para atenuar el display. Si se usó, medimos una media de 7769 (mínimo: 5 - máxmo: 343500) Hz. | ||
| |||||||||||||||||||||||||
iluminación: 85 %
Brillo con batería: 261 cd/m²
Contraste: 1004:1 (Negro: 0.26 cd/m²)
ΔE ColorChecker Calman: 4.3 | ∀{0.5-29.43 Ø4.72}
ΔE Greyscale Calman: 5.82 | ∀{0.09-98 Ø4.97}
77.84% sRGB (Argyll 1.6.3 3D)
49.18% AdobeRGB 1998 (Argyll 1.6.3 3D)
53.9% AdobeRGB 1998 (Argyll 3D)
78.3% sRGB (Argyll 3D)
52.2% Display P3 (Argyll 3D)
Gamma: 2.44
CCT: 6771 K
| Dell Latitude 13 7370 1920x1080, IPS | Lenovo ThinkPad X1 Carbon 20FB003RGE 2560x1440, IPS | HP EliteBook Folio 1040 G3 2560x1440, IPS | Toshiba Portege Z30-C-138 1920x1080, IPS | Apple MacBook 12 (Early 2016) 1.1 GHz 2304x1440, IPS | |
|---|---|---|---|---|---|
| Display | 25% | 28% | 28% | 25% | |
| Display P3 Coverage (%) | 52.2 | 66.7 28% | 67.9 30% | 67.9 30% | 66.8 28% |
| sRGB Coverage (%) | 78.3 | 94.7 21% | 96.8 24% | 98 25% | 95.4 22% |
| AdobeRGB 1998 Coverage (%) | 53.9 | 68.4 27% | 70 30% | 69.8 29% | 68 26% |
| Response Times | 21% | 15% | 17% | 14% | |
| Response Time Grey 50% / Grey 80% * (ms) | 50.4 ? | 44 ? 13% | 46.4 ? 8% | 42 ? 17% | 41.2 ? 18% |
| Response Time Black / White * (ms) | 33.6 ? | 24 ? 29% | 26.4 ? 21% | 28 ? 17% | 30.4 ? 10% |
| PWM Frequency (Hz) | 220 ? | 217 ? | |||
| Screen | 15% | 10% | 3% | 23% | |
| Brightness middle (cd/m²) | 261 | 272 4% | 327 25% | 300 15% | 387 48% |
| Brightness (cd/m²) | 241 | 268 11% | 316 31% | 280 16% | 358 49% |
| Brightness Distribution (%) | 85 | 95 12% | 87 2% | 87 2% | 88 4% |
| Black Level * (cd/m²) | 0.26 | 0.32 -23% | 0.35 -35% | 0.31 -19% | 0.47 -81% |
| Contrast (:1) | 1004 | 850 -15% | 934 -7% | 968 -4% | 823 -18% |
| Colorchecker dE 2000 * | 4.3 | 2.61 39% | 4.39 -2% | 4.9 -14% | 1.6 63% |
| Colorchecker dE 2000 max. * | 8.66 | 6.43 26% | 7.27 16% | 8.91 -3% | 4 54% |
| Greyscale dE 2000 * | 5.82 | 3.31 43% | 4.69 19% | 6.69 -15% | 1 83% |
| Gamma | 2.44 90% | 2.35 94% | 2.15 102% | 2.33 94% | 2.26 97% |
| CCT | 6771 96% | 6360 102% | 7101 92% | 6487 100% | 6680 97% |
| Color Space (Percent of AdobeRGB 1998) (%) | 49.18 | 63 28% | 62.52 27% | 63 28% | 61.6 25% |
| Color Space (Percent of sRGB) (%) | 77.84 | 95 22% | 96.71 24% | 98 26% | 82.2 6% |
| Media total (Programa/Opciones) | 20% /
18% | 18% /
14% | 16% /
10% | 21% /
22% |
* ... más pequeño es mejor
Tiempos de respuesta del display
| ↔ Tiempo de respuesta de Negro a Blanco | ||
|---|---|---|
| 33.6 ms ... subida ↗ y bajada ↘ combinada | ↗ 13.2 ms subida | |
| ↘ 20.4 ms bajada | ||
| La pantalla mostró tiempos de respuesta lentos en nuestros tests y podría ser demasiado lenta para los jugones. En comparación, todos los dispositivos de prueba van de ##min### (mínimo) a 240 (máximo) ms. » 90 % de todos los dispositivos son mejores. Eso quiere decir que el tiempo de respuesta es peor que la media (19.8 ms) de todos los dispositivos testados. | ||
| ↔ Tiempo de respuesta 50% Gris a 80% Gris | ||
| 50.4 ms ... subida ↗ y bajada ↘ combinada | ↗ 20.4 ms subida | |
| ↘ 30 ms bajada | ||
| La pantalla mostró tiempos de respuesta lentos en nuestros tests y podría ser demasiado lenta para los jugones. En comparación, todos los dispositivos de prueba van de ##min### (mínimo) a 636 (máximo) ms. » 87 % de todos los dispositivos son mejores. Eso quiere decir que el tiempo de respuesta es peor que la media (31 ms) de todos los dispositivos testados. | ||
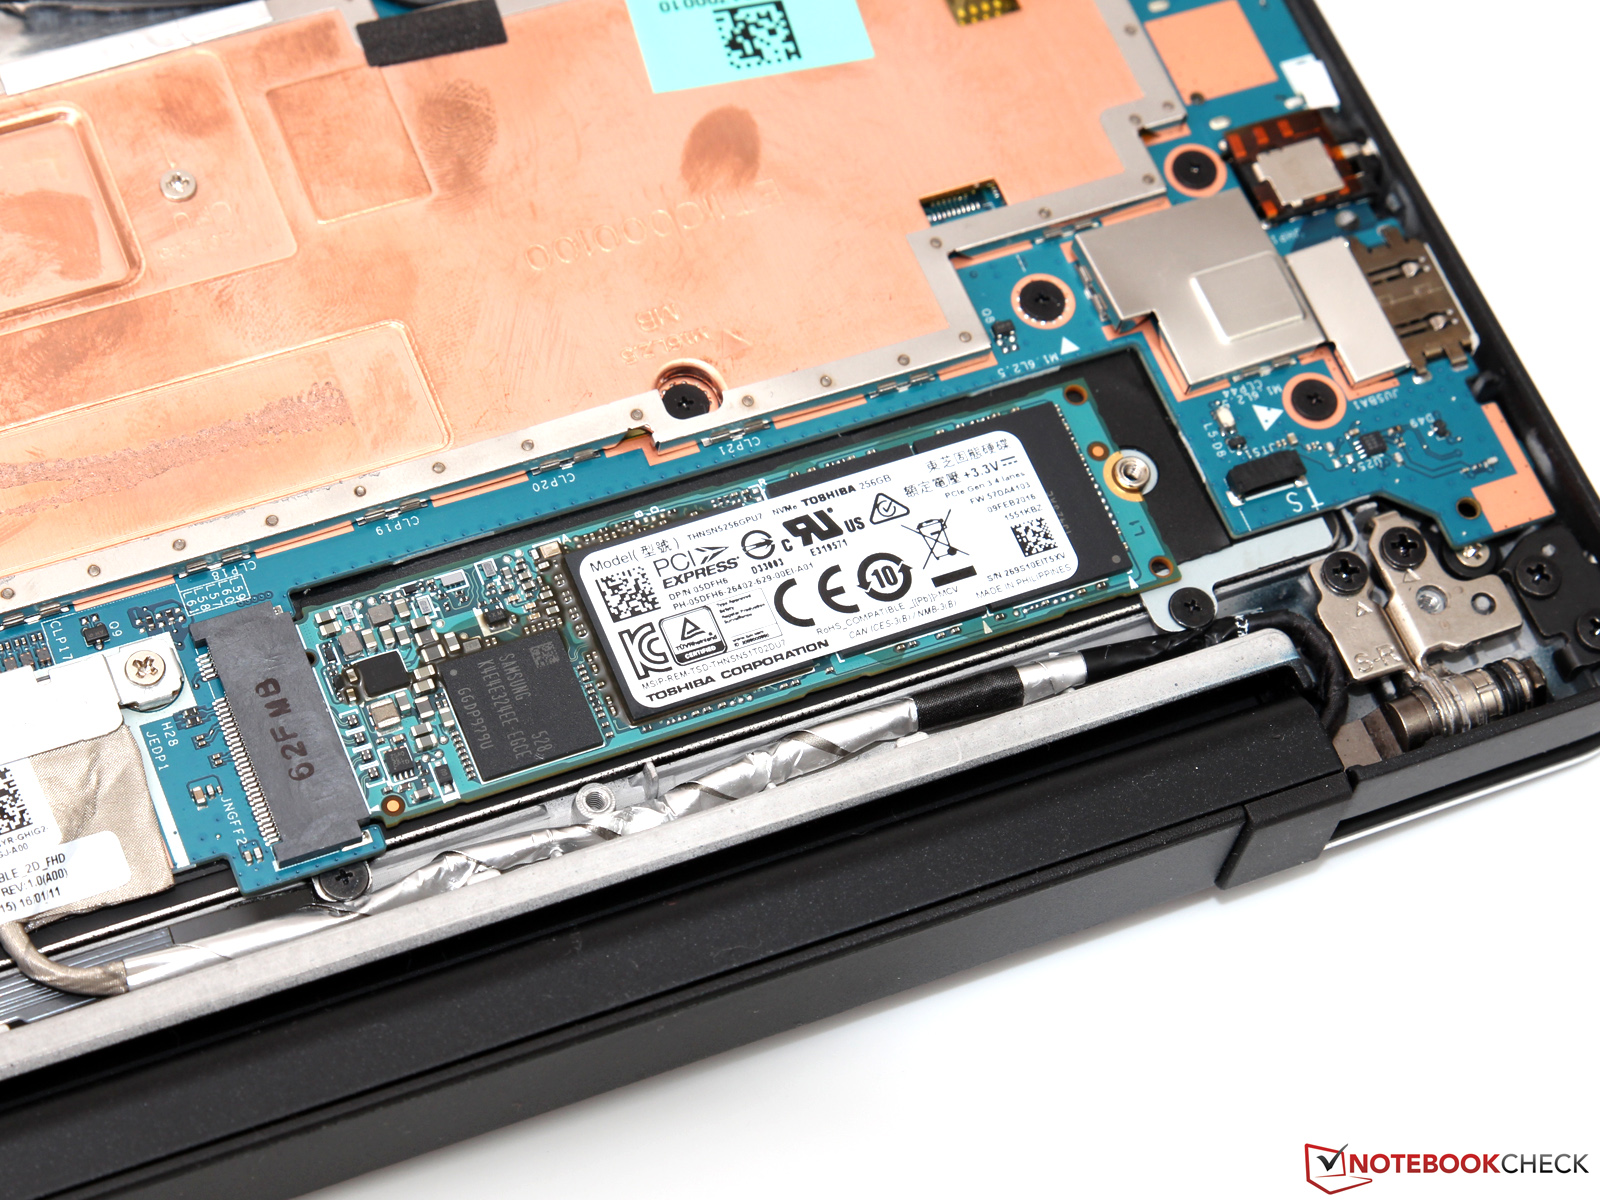
| Dell Latitude 13 7370 Toshiba NVMe THNSN5256GPU7 | Lenovo ThinkPad X1 Carbon 20FB003RGE Samsung SSD PM871 MZNLN256HCHP | HP EliteBook Folio 1040 G3 Samsung SM951 MZVPV256HDGL m.2 PCI-e | Toshiba Portege Z30-C-138 Toshiba HG6 THNSNJ512G8NY | Apple MacBook 12 (Early 2016) 1.1 GHz Apple SSD AP0256 | |
|---|---|---|---|---|---|
| AS SSD | -40% | 75% | -52% | -30% | |
| Seq Read (MB/s) | 1425 | 499.1 -65% | 1839 29% | 494.9 -65% | 1056 -26% |
| Seq Write (MB/s) | 889 | 294 -67% | 1190 34% | 431.9 -51% | 651 -27% |
| 4K Read (MB/s) | 35.72 | 30.43 -15% | 47.72 34% | 16.97 -52% | 16.4 -54% |
| 4K Write (MB/s) | 97.9 | 74.6 -24% | 126.6 29% | 65.6 -33% | 22.1 -77% |
| 4K-64 Read (MB/s) | 450.6 | 370.4 -18% | 1858 312% | 217.9 -52% | 509 13% |
| 4K-64 Write (MB/s) | 347.2 | 253.4 -27% | 344.3 -1% | 147.9 -57% | 283 -18% |
| Copy ISO MB/s (MB/s) | 704 | 236.2 -66% | 1313 87% | 545 -23% |

| PCMark 7 - Score | |
| Lenovo ThinkPad X1 Carbon 20FB003RGE | |
| Microsoft Surface Pro 4, Core m3 | |
| Dell Latitude 13 7370 | |
| PCMark 7 Score | 4165 puntos | |
| PCMark 8 Home Score Accelerated v2 | 3048 puntos | |
| PCMark 8 Creative Score Accelerated v2 | 3528 puntos | |
| PCMark 8 Work Score Accelerated v2 | 4238 puntos | |
ayuda | ||
| 3DMark 06 Standard Score | 6244 puntos | |
| 3DMark 11 Performance | 1094 puntos | |
| 3DMark Ice Storm Standard Score | 38931 puntos | |
| 3DMark Cloud Gate Standard Score | 3481 puntos | |
| 3DMark Fire Strike Score | 509 puntos | |
ayuda | ||
| bajo | medio | alto | ultra | |
|---|---|---|---|---|
| BioShock Infinite (2013) | 38 | 20.3 | 17.6 | 5.3 |
| Metro: Last Light (2013) | 16.4 | 13.5 | 8.7 | |
| Battlefield 4 (2013) | 24.6 | 18.2 | 12.8 |
(±) La temperatura máxima en la parte superior es de 43.2 °C / 110 F, frente a la media de 35.9 °C / 97 F, que oscila entre 21.4 y 59 °C para la clase Subnotebook.
(-) El fondo se calienta hasta un máximo de 50.8 °C / 123 F, frente a la media de 39.2 °C / 103 F
(+) En reposo, la temperatura media de la parte superior es de 28.3 °C / 83# F, frente a la media del dispositivo de 30.8 °C / 87 F.
(+) El reposamanos y el panel táctil están a una temperatura inferior a la de la piel, con un máximo de 29.8 °C / 85.6 F y, por tanto, son fríos al tacto.
(±) La temperatura media de la zona del reposamanos de dispositivos similares fue de 28.2 °C / 82.8 F (-1.6 °C / -2.8 F).
| Off / Standby | |
| Ocioso | |
| Carga |
|
Clave:
min: | |
| Dell Latitude 13 7370 34 Wh | Lenovo ThinkPad X1 Carbon 20FB003RGE 52 Wh | HP EliteBook Folio 1040 G3 45.6 Wh | Toshiba Portege Z30-C-138 52 Wh | Apple MacBook 12 (Early 2016) 1.1 GHz 41.4 Wh | |
|---|---|---|---|---|---|
| Duración de Batería | 19% | -15% | -5% | 34% | |
| Reader / Idle (h) | 9.8 | 15.7 60% | 8.8 -10% | ||
| H.264 (h) | 6.5 | 8.5 31% | 5.7 -12% | 8.5 31% | |
| WiFi v1.3 (h) | 6.1 | 7.2 18% | 5.2 -15% | 5.8 -5% | 8.4 38% |
| Load (h) | 2.9 | 1.9 -34% | 2.2 -24% | 3.9 34% |
Pro
Contra
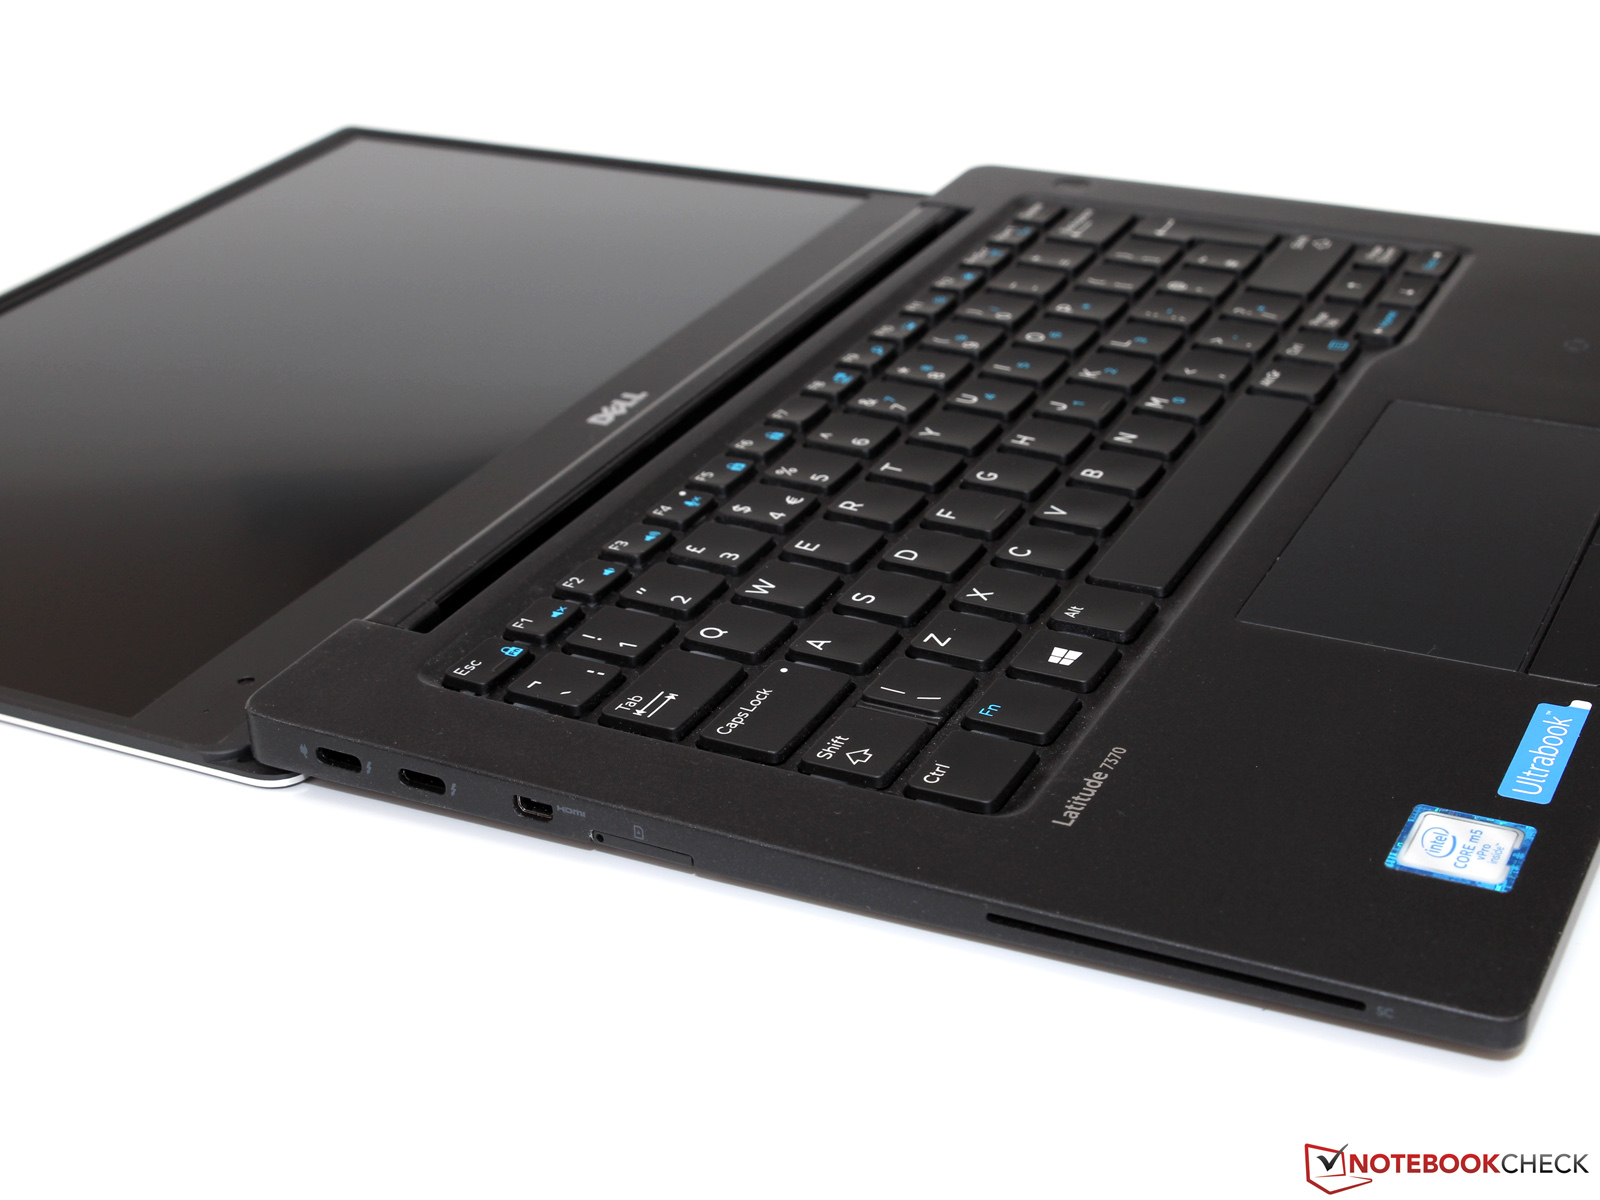
Un display casi sin bisel, ventilación pasiva y puertos Thunderbolt 3 – el Dell Latitude 13 7370 ciertamente sobresale entre los aburridos portátiles business establecidos. El Ultrabook no tiene que temer mucha competencia en términos de movilidad y calidad y convence con una calidad de construcción impecable, una estabilidad excelente y unos dispositivos de entrada firmes. El rendimiento de la plataforma Core-m también es bastante bueno: Los picos breves de carga los maneja – al menos tras actualizar la BIOS – casi tan bien como los rivales de ventilación activa. Las frecuencias y el rendimiento sólo sufrirán bajo carga sostenida, pero no debería ser un problema habitual durante tus tareas ofimáticas típicas.
Que el 7370 no logre una valoración de muy bueno se debe principalmente al display. Dell ha implementado un panel muy decente con una potente retroiluminación, pero no puedes usarlo siempre a causa del ajuste automático de brillo y contraste. Un problema molesto, pero esperamos que otra actualización de BIOS lo resuelva. De ser así, sólo el altísimo precio le impediría una recomendación de compra sin reservas: Actualmente a unos 2200 Euros, el Latitude 13 ciertamente no es ninguna ganga – aunque un (ciertamente orientado al usuario doméstico) Apple MacBook 12 cuesta unos cuantos cientos de Euros menos.
Ésta es una versión acortada del análisis original. Puedes leer el análisis completo en inglés aquí.
Dell Latitude 13 7370
- 05/12/2016 v5.1 (old)
Till Schönborn
Price comparison
