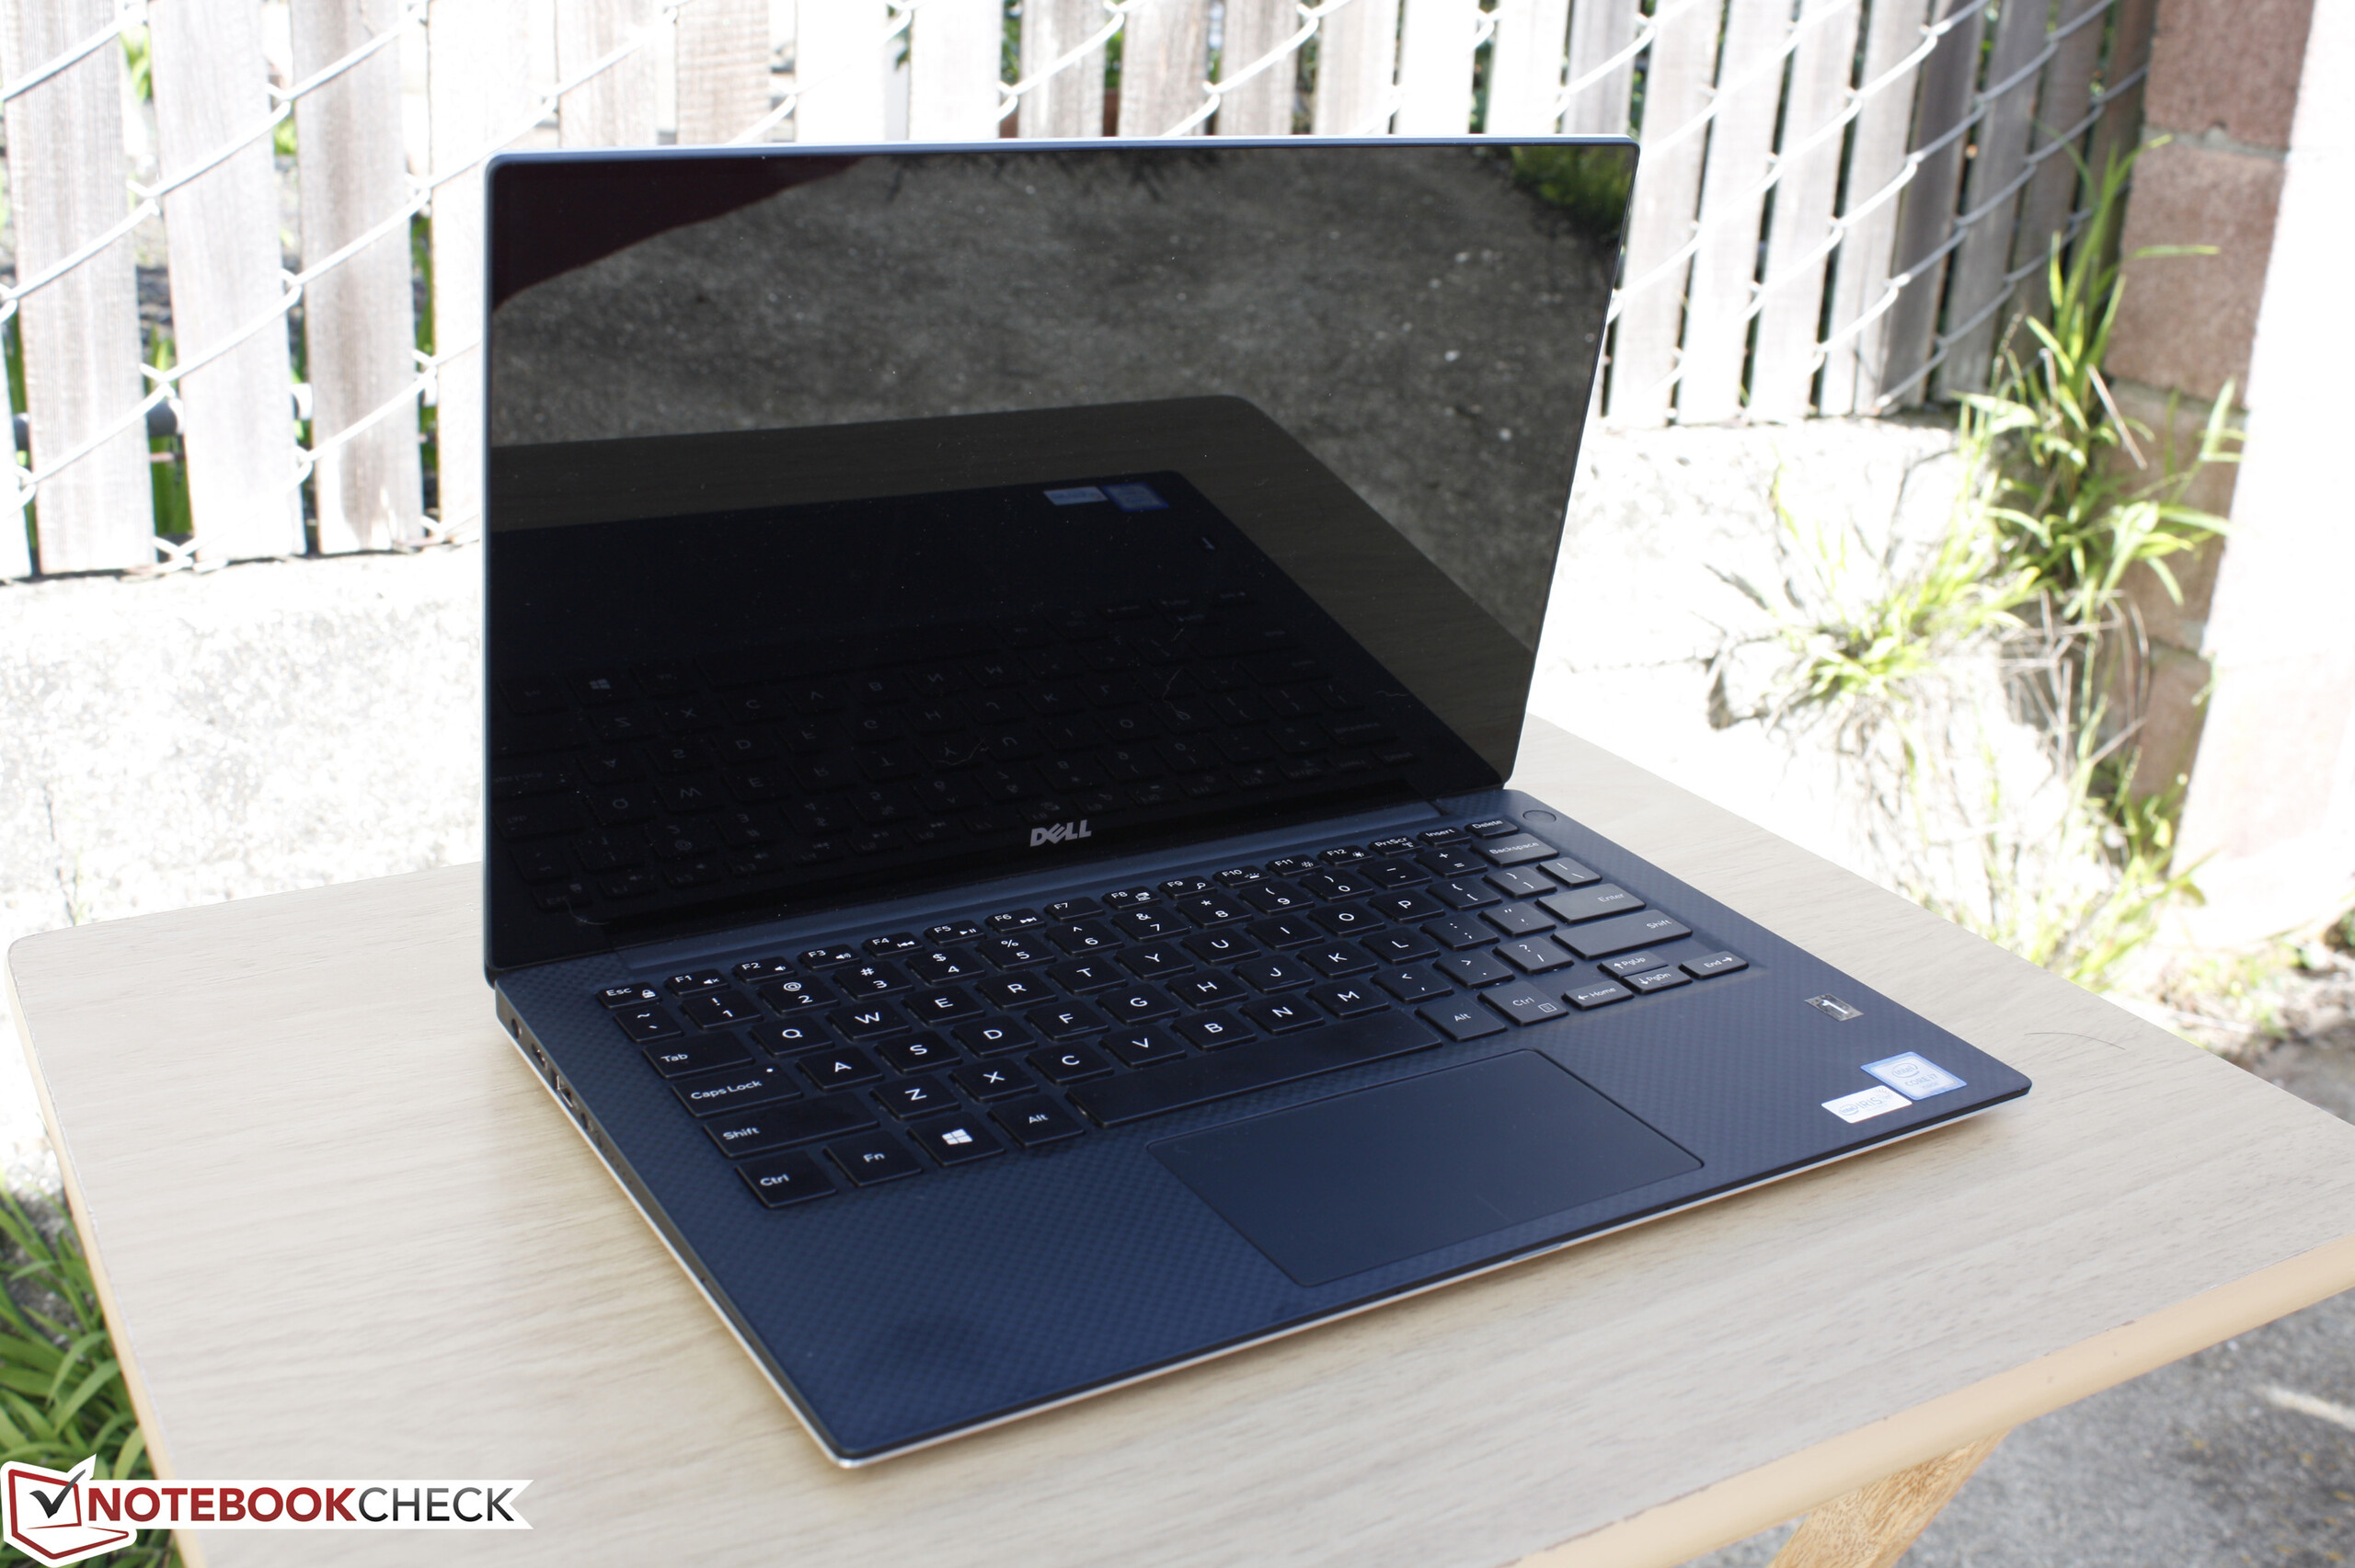
Breve análisis del Ultrabook Dell XPS 13 9350 (i7-6560U, QHD+)
| |||||||||||||||||||||||||
iluminación: 92 %
Brillo con batería: 307.5 cd/m²
Contraste: 1486:1 (Negro: 0.207 cd/m²)
ΔE ColorChecker Calman: 4.18 | ∀{0.5-29.43 Ø4.71}
ΔE Greyscale Calman: 4.94 | ∀{0.09-98 Ø4.96}
92% sRGB (Argyll 1.6.3 3D)
59% AdobeRGB 1998 (Argyll 1.6.3 3D)
65.4% AdobeRGB 1998 (Argyll 3D)
92.3% sRGB (Argyll 3D)
63.6% Display P3 (Argyll 3D)
Gamma: 2.31
CCT: 7645 K
| Dell XPS 13 9350 WQXGA 13.3", 3200x1800 | HP ProBook 430 G3 P5T00ES 13.3", 1366x768 | Asus Zenbook UX303UB-DH74T 13.3", 3200x1800 | Apple MacBook Air 13 inch 2015-03 13.3", 1440x900 | Lenovo Yoga 900-13ISK 80MK 13.3", 3200x1800 | HP Spectre x360 13-4104ng 13.3", 2560x1440 | |
|---|---|---|---|---|---|---|
| Display | -43% | -5% | -36% | -2% | 3% | |
| Display P3 Coverage (%) | 63.6 | 35.87 -44% | 60.9 -4% | 40.1 -37% | 63.2 -1% | 66.8 5% |
| sRGB Coverage (%) | 92.3 | 54 -41% | 85.4 -7% | 59.8 -35% | 88.7 -4% | 92.8 1% |
| AdobeRGB 1998 Coverage (%) | 65.4 | 37.06 -43% | 62.5 -4% | 41.51 -37% | 64.9 -1% | 67.3 3% |
| Response Times | -9% | -5% | 24% | 45% | ||
| Response Time Grey 50% / Grey 80% * (ms) | 50.8 ? | 54.4 ? -7% | 44.4 ? 13% | 38.8 ? 24% | 24 ? 53% | |
| Response Time Black / White * (ms) | 29.6 ? | 32.8 ? -11% | 36 ? -22% | 22.4 ? 24% | 19 ? 36% | |
| PWM Frequency (Hz) | 192 ? | 1389 | 1316 | |||
| Screen | -92% | -56% | -17% | -33% | -9% | |
| Brightness middle (cd/m²) | 307.5 | 212 -31% | 291.4 -5% | 329 7% | 319.8 4% | 324 5% |
| Brightness (cd/m²) | 297 | 205 -31% | 270 -9% | 310 4% | 302 2% | 324 9% |
| Brightness Distribution (%) | 92 | 90 -2% | 84 -9% | 82 -11% | 88 -4% | 90 -2% |
| Black Level * (cd/m²) | 0.207 | 0.71 -243% | 0.954 -361% | 0.405 -96% | 0.835 -303% | 0.34 -64% |
| Contrast (:1) | 1486 | 299 -80% | 305 -79% | 812 -45% | 383 -74% | 953 -36% |
| Colorchecker dE 2000 * | 4.18 | 12.06 -189% | 4.63 -11% | 3.96 5% | 2.68 36% | 4.36 -4% |
| Colorchecker dE 2000 max. * | 7.84 | 7.51 4% | ||||
| Greyscale dE 2000 * | 4.94 | 13.41 -171% | 5.65 -14% | 3.51 29% | 2.35 52% | 4.62 6% |
| Gamma | 2.31 95% | 2.41 91% | 2.16 102% | 3.83 57% | 2.09 105% | 2.18 101% |
| CCT | 7645 85% | 15382 42% | 6320 103% | 6711 97% | 6975 93% | 6857 95% |
| Color Space (Percent of AdobeRGB 1998) (%) | 59 | 34.3 -42% | 55.2 -6% | 38.4 -35% | 57 -3% | 60 2% |
| Color Space (Percent of sRGB) (%) | 92 | 54.2 -41% | 85.2 -7% | 59.8 -35% | 88 -4% | 93 1% |
| Media total (Programa/Opciones) | -48% /
-70% | -22% /
-38% | -27% /
-22% | -4% /
-18% | 13% /
1% |
* ... más pequeño es mejor
Tiempos de respuesta del display
| ↔ Tiempo de respuesta de Negro a Blanco | ||
|---|---|---|
| 29.6 ms ... subida ↗ y bajada ↘ combinada | ↗ 6 ms subida | 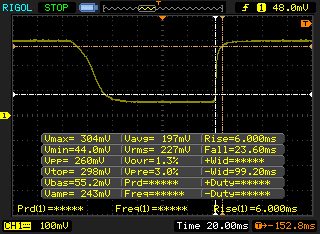 |
| ↘ 23.6 ms bajada | ||
| La pantalla mostró tiempos de respuesta relativamente lentos en nuestros tests pero podría ser demasiado lenta para los jugones. En comparación, todos los dispositivos de prueba van de ##min### (mínimo) a 240 (máximo) ms. » 79 % de todos los dispositivos son mejores. Eso quiere decir que el tiempo de respuesta es peor que la media (19.8 ms) de todos los dispositivos testados. | ||
| ↔ Tiempo de respuesta 50% Gris a 80% Gris | ||
| 50.8 ms ... subida ↗ y bajada ↘ combinada | ↗ 18.4 ms subida | 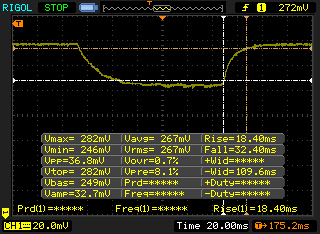 |
| ↘ 32.4 ms bajada | ||
| La pantalla mostró tiempos de respuesta lentos en nuestros tests y podría ser demasiado lenta para los jugones. En comparación, todos los dispositivos de prueba van de ##min### (mínimo) a 636 (máximo) ms. » 87 % de todos los dispositivos son mejores. Eso quiere decir que el tiempo de respuesta es peor que la media (31 ms) de todos los dispositivos testados. | ||
Parpadeo de Pantalla / PWM (Pulse-Width Modulation)
| Parpadeo de Pantalla / PWM no detectado | 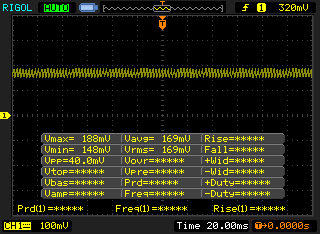 | ||
Comparación: 52 % de todos los dispositivos testados no usaron PWM para atenuar el display. Si se usó, medimos una media de 7751 (mínimo: 5 - máxmo: 343500) Hz. | |||
| Cinebench R11.5 | |
| CPU Single 64Bit (ordenar por valor) | |
| Dell XPS 13 9350 WQXGA | |
| Eurocom Shark 4 | |
| Microsoft Surface Pro 4 Core i7 | |
| Asus Zenbook UX303UB-DH74T | |
| Microsoft Surface Book Core i5 | |
| Lenovo ThinkPad T560-20FH001FGE | |
| CPU Multi 64Bit (ordenar por valor) | |
| Dell XPS 13 9350 WQXGA | |
| Eurocom Shark 4 | |
| Microsoft Surface Pro 4 Core i7 | |
| Asus Zenbook UX303UB-DH74T | |
| Microsoft Surface Book Core i5 | |
| Lenovo ThinkPad T560-20FH001FGE | |
| Cinebench R10 | |
| Rendering Single CPUs 64Bit (ordenar por valor) | |
| Eurocom Shark 4 | |
| Microsoft Surface Pro 4 Core i7 | |
| Microsoft Surface Book Core i5 | |
| Lenovo ThinkPad T560-20FH001FGE | |
| Rendering Multiple CPUs 64Bit (ordenar por valor) | |
| Eurocom Shark 4 | |
| Microsoft Surface Pro 4 Core i7 | |
| Microsoft Surface Book Core i5 | |
| Lenovo ThinkPad T560-20FH001FGE | |
| wPrime 2.10 - 1024m (ordenar por valor) | |
| Dell XPS 13 9350 WQXGA | |
| Eurocom Shark 4 | |
| Microsoft Surface Pro 4 Core i7 | |
| Asus Zenbook UX303UB-DH74T | |
| Microsoft Surface Book Core i5 | |
| Super Pi Mod 1.5 XS 32M - 32M (ordenar por valor) | |
| Dell XPS 13 9350 WQXGA | |
| Eurocom Shark 4 | |
| Microsoft Surface Pro 4 Core i7 | |
| Asus Zenbook UX303UB-DH74T | |
| Microsoft Surface Book Core i5 | |
| Lenovo ThinkPad T560-20FH001FGE | |
* ... más pequeño es mejor
| PCMark 7 - Score (ordenar por valor) | |
| Dell XPS 13 9350 WQXGA | |
| Lenovo Yoga 900-13ISK 80MK | |
| Apple MacBook Air 13 inch 2015-03 | |
| Asus Zenbook UX303UB-DH74T | |
| HP ProBook 430 G3 P5T00ES | |
| PCMark 7 Score | 5672 puntos | |
| PCMark 8 Home Score Accelerated v2 | 2928 puntos | |
| PCMark 8 Creative Score Accelerated v2 | 4470 puntos | |
| PCMark 8 Work Score Accelerated v2 | 3438 puntos | |
ayuda | ||
| Dell XPS 13 9350 WQXGA Iris Graphics 540, 6560U, Samsung PM951 NVMe 512 GB | HP ProBook 430 G2 L3Q21EA HD Graphics 5500, 5200U, Samsung SSD PM851 128 GB MZ7TE128HMGR | Asus Zenbook UX303UB-DH74T GeForce 940M, 6500U, CUK Cyclone SSD 1TB | Apple MacBook Air 13 inch 2015-03 HD Graphics 6000, 5650U, Apple SSD SD0256F | Lenovo Yoga 900-13ISK 80MK HD Graphics 520, 6500U, Samsung SSD PM871 MZNLN512HCJH | Dell XPS 13-9333 HD Graphics 4400, 4200U, Liteonit LMT-128M6M | |
|---|---|---|---|---|---|---|
| AS SSD | -74% | -63% | -68% | -42% | -63% | |
| Copy Game MB/s (MB/s) | 753 | 110.3 -85% | 392.8 -48% | 479.3 -36% | 298.7 -60% | |
| Copy Program MB/s (MB/s) | 271.8 | 105 -61% | 233.7 -14% | 245 -10% | 249.6 -8% | |
| Copy ISO MB/s (MB/s) | 1041 | 136.3 -87% | 382.5 -63% | 643 -38% | 364.5 -65% | |
| Score Total (Points) | 3158 | 838 -73% | 882 -72% | 2383 -25% | 1129 -64% | 902 -71% |
| Score Write (Points) | 664 | 218 -67% | 373 -44% | 463 -30% | 429 -35% | 337 -49% |
| Score Read (Points) | 1679 | 415 -75% | 333 -80% | 1281 -24% | 458 -73% | 373 -78% |
| Access Time Write * (ms) | 0.031 | 0.042 -35% | 0.051 -65% | 0.155 -400% | 0.039 -26% | 0.065 -110% |
| Access Time Read * (ms) | 0.046 | 0.141 -207% | 0.14 -204% | 0.171 -272% | 0.054 -17% | 0.078 -70% |
| 4K-64 Write (MB/s) | 492 | 111.1 -77% | 261.1 -47% | 338.9 -31% | 303 -38% | 249.5 -49% |
| 4K-64 Read (MB/s) | 1497 | 342.6 -77% | 256.9 -83% | 1140 -24% | 374.8 -75% | 294.2 -80% |
| 4K Write (MB/s) | 116.5 | 93.5 -20% | 71.3 -39% | 23.73 -80% | 80.6 -31% | 57.6 -51% |
| 4K Read (MB/s) | 38.29 | 26.84 -30% | 25.99 -32% | 19.16 -50% | 32.29 -16% | 29.32 -23% |
| Seq Write (MB/s) | 559 | 130.5 -77% | 409.8 -27% | 1001 79% | 454.6 -19% | 302.2 -46% |
| Seq Read (MB/s) | 1442 | 459 -68% | 505 -65% | 1212 -16% | 505 -65% | 492.7 -66% |
* ... más pequeño es mejor

| 3DMark 11 Performance | 2039 puntos | |
| 3DMark Ice Storm Standard Score | 58948 puntos | |
| 3DMark Cloud Gate Standard Score | 6730 puntos | |
| 3DMark Fire Strike Score | 1114 puntos | |
| 3DMark Fire Strike Extreme Score | 503 puntos | |
ayuda | ||
| Tomb Raider - 1366x768 Normal Preset AA:FX AF:4x (ordenar por valor) | |
| Dell XPS 13 9350 WQXGA | |
| Asus Zenbook UX303UB-DH74T | |
| Lenovo U31-70 80M5003EGE | |
| Asus Zenbook UX303UA-FN121T | |
| Lenovo IdeaPad Miix 700 | |
| Lenovo ThinkPad L440 20AT004QGE | |
| bajo | medio | alto | ultra | |
|---|---|---|---|---|
| Tomb Raider (2013) | 85 | 49.2 | 33.3 | |
| Metro: Last Light (2013) | 28.1 | 23 | 15.8 | |
| Thief (2014) | 23.3 | 15.7 | 13.7 | |
| Metal Gear Solid V (2015) | 48.6 | 28.9 | 13.9 |
| Dell XPS 13 9350 WQXGA Iris Graphics 540, 6560U, Samsung PM951 NVMe 512 GB | HP ProBook 430 G3 P5T00ES HD Graphics 520, 6200U, Hitachi Travelstar Z7K500 HTS725050A7E630 | Asus Zenbook UX303UB-DH74T GeForce 940M, 6500U, CUK Cyclone SSD 1TB | Apple MacBook Air 13 inch 2015-03 HD Graphics 6000, 5650U, Apple SSD SD0256F | Lenovo Yoga 900-13ISK 80MK HD Graphics 520, 6500U, Samsung SSD PM871 MZNLN512HCJH | HP Spectre x360 13-4104ng HD Graphics 520, 6200U, Samsung SSD PM851 256 GB MZNTE256HMHP | |
|---|---|---|---|---|---|---|
| Noise | -7% | -11% | -15% | -6% | -10% | |
| apagado / medio ambiente * (dB) | 29.2 | |||||
| Idle Minimum * (dB) | 29.2 | 29.8 -2% | 29.8 -2% | 29.2 -0% | 29.7 -2% | 29.6 -1% |
| Idle Average * (dB) | 29.2 | 29.8 -2% | 29.8 -2% | 29.2 -0% | 29.8 -2% | 29.6 -1% |
| Idle Maximum * (dB) | 29.2 | 30.9 -6% | 29.8 -2% | 29.2 -0% | 30 -3% | 34.6 -18% |
| Load Average * (dB) | 31.4 | 33.3 -6% | 37.4 -19% | 40.2 -28% | 32 -2% | 34.7 -11% |
| Load Maximum * (dB) | 31.4 | 37.4 -19% | 40.3 -28% | 46.3 -47% | 38.5 -23% | 37.9 -21% |
* ... más pequeño es mejor
Ruido
| Ocioso |
| 29.2 / 29.2 / 29.2 dB(A) |
| Carga |
| 31.4 / 31.4 dB(A) |
 | ||
30 dB silencioso 40 dB(A) audible 50 dB(A) ruidosamente alto |
||
min: | ||
(±) La temperatura máxima en la parte superior es de 41.4 °C / 107 F, frente a la media de 35.9 °C / 97 F, que oscila entre 21.4 y 59 °C para la clase Subnotebook.
(-) El fondo se calienta hasta un máximo de 49.2 °C / 121 F, frente a la media de 39.2 °C / 103 F
(+) En reposo, la temperatura media de la parte superior es de 26.7 °C / 80# F, frente a la media del dispositivo de 30.8 °C / 87 F.
(+) El reposamanos y el panel táctil están a una temperatura inferior a la de la piel, con un máximo de 28.7 °C / 83.7 F y, por tanto, son fríos al tacto.
(±) La temperatura media de la zona del reposamanos de dispositivos similares fue de 28.2 °C / 82.8 F (-0.5 °C / -0.9 F).
| Off / Standby | |
| Ocioso | |
| Carga |
|
Clave:
min: | |
| Dell XPS 13 9350 WQXGA 56 Wh | HP ProBook 430 G3 P5T00ES 44 Wh | Asus Zenbook UX303UB-DH74T 50 Wh | Apple MacBook Air 13 inch 2015-03 54 Wh | Lenovo Yoga 900-13ISK 80MK 66 Wh | HP Spectre x360 13-4104ng 56 Wh | |
|---|---|---|---|---|---|---|
| Duración de Batería | -3% | -2% | 78% | 23% | 60% | |
| Reader / Idle (h) | 10.1 | 7.5 -26% | 10.3 2% | 26.2 159% | 14.1 40% | |
| WiFi v1.3 (h) | 5.2 | 6.3 21% | 5.7 10% | 10.3 98% | 6.7 29% | 8.3 60% |
| Load (h) | 2.1 | 2 -5% | 1.7 -19% | 1.6 -24% | 2.1 0% |
Pro
Contra
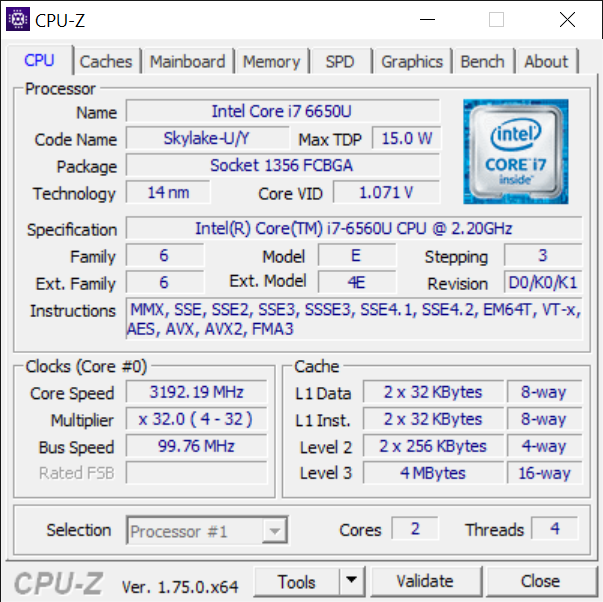
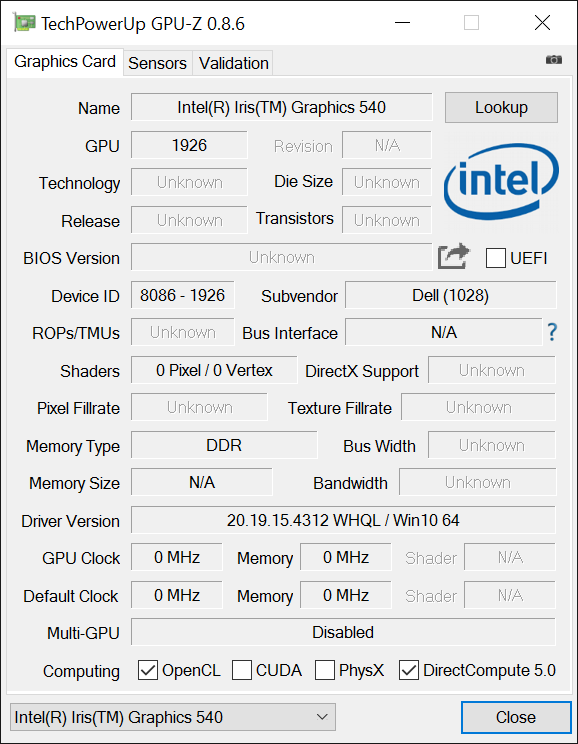
Algunos de los mejores aspectos del XPS 13 además de su extraordinario bajo peso incluyen sus ventiladores silenciosos y su display de primera. La Core i7-6560U y la Iris Graphics 540 integrada le dan más potencia al sistema sin necesidad de aumentar el ruido de ventilador, lo que es una hoja de doble filo. Si bien ha mejorado el rendimiento, las temperaturas superficiales y de núcleo son mucho más cálidas hasta el punto en que la CPU podría ralentizarse bajo cargas de juego. La duración de la batería en particular paga el precio de la pantalla QHD+ y la CPU más exigente. En general, el rendimiento está un paso por debajo del de la Core i7-6650U del Surface Pro 4, especialmente en términos de rendimiento gráfico.
Los usuarios que no precisen la gráfica Iris Graphics 540 más potente respecto a la Graphics 520 pueden querer optar por un modelo más asequible para tener mayor duración de batería. Si la potencia de GPU es más importante, puede merecer la pena invertir en el Zenbook UX303 ligeramente más grande con su discreta gráfica Nvidia para obtener un mejor retorno de rendimiento sin sacrificar demasiada movilidad.
Ésta es una versión acortada del análisis original. Puedes leer el análisis completo en inglés aquí.
Dell XPS 13 9350 WQXGA
- 02/26/2016 v5 (old)
Allen Ngo
Price comparison
