Breve análisis del portátil Asus Zenbook UX3430UQ (7500U, 940MX, 512 GB)

| SD Card Reader | |
| average JPG Copy Test (av. of 3 runs) | |
| Lenovo IdeaPad 710S Plus-13IKB | |
| Dell XPS 15 2017 9560 (7300HQ, Full-HD) | |
| Asus Zenbook UX3430UQ-GV012T | |
| Asus Zenbook UX3410UQ-GV077T | |
| maximum AS SSD Seq Read Test (1GB) | |
| Dell XPS 15 2017 9560 (7300HQ, Full-HD) | |
| Lenovo IdeaPad 710S Plus-13IKB | |
| Asus Zenbook UX3430UQ-GV012T | |
| Asus Zenbook UX3410UQ-GV077T | |
| Networking | |
| iperf3 transmit AX12 | |
| Asus Zenbook UX3430UQ-GV012T | |
| Dell XPS 15 2017 9560 (7300HQ, Full-HD) | |
| Lenovo IdeaPad 710S Plus-13IKB | |
| Asus Zenbook UX3410UQ-GV077T | |
| iperf3 receive AX12 | |
| Dell XPS 15 2017 9560 (7300HQ, Full-HD) | |
| Asus Zenbook UX3410UQ-GV077T | |
| Lenovo IdeaPad 710S Plus-13IKB | |
| Asus Zenbook UX3430UQ-GV012T | |
| |||||||||||||||||||||||||
iluminación: 88 %
Brillo con batería: 377 cd/m²
Contraste: 1038:1 (Negro: 0.34 cd/m²)
ΔE ColorChecker Calman: 2.88 | ∀{0.5-29.43 Ø4.73}
ΔE Greyscale Calman: 4.24 | ∀{0.09-98 Ø4.97}
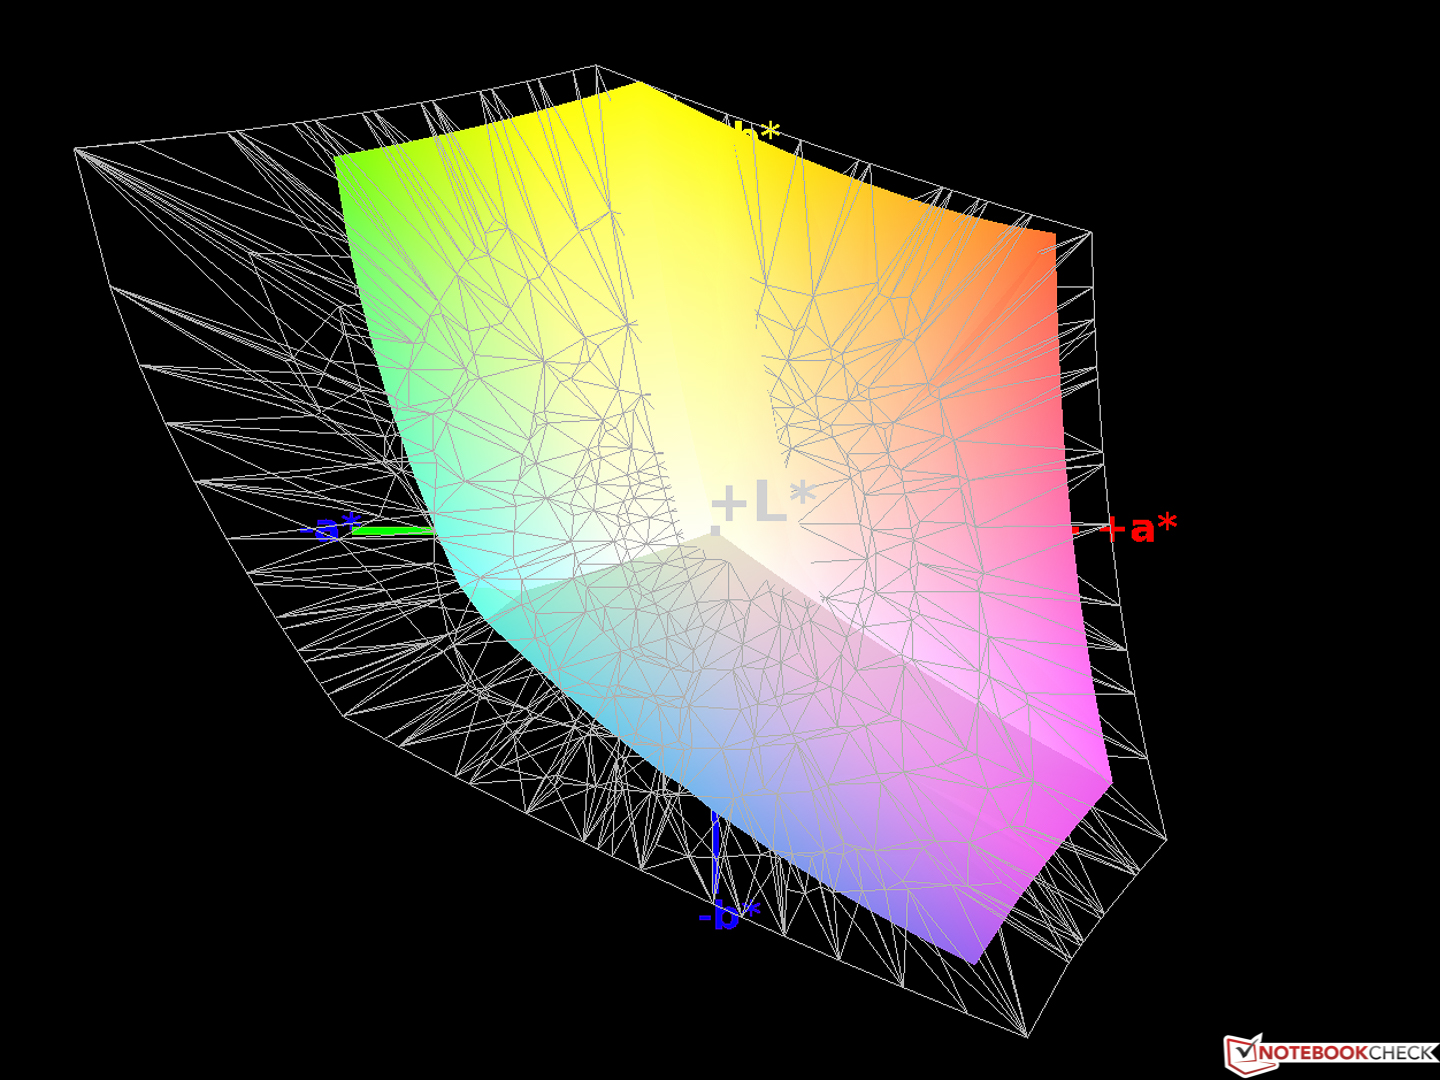
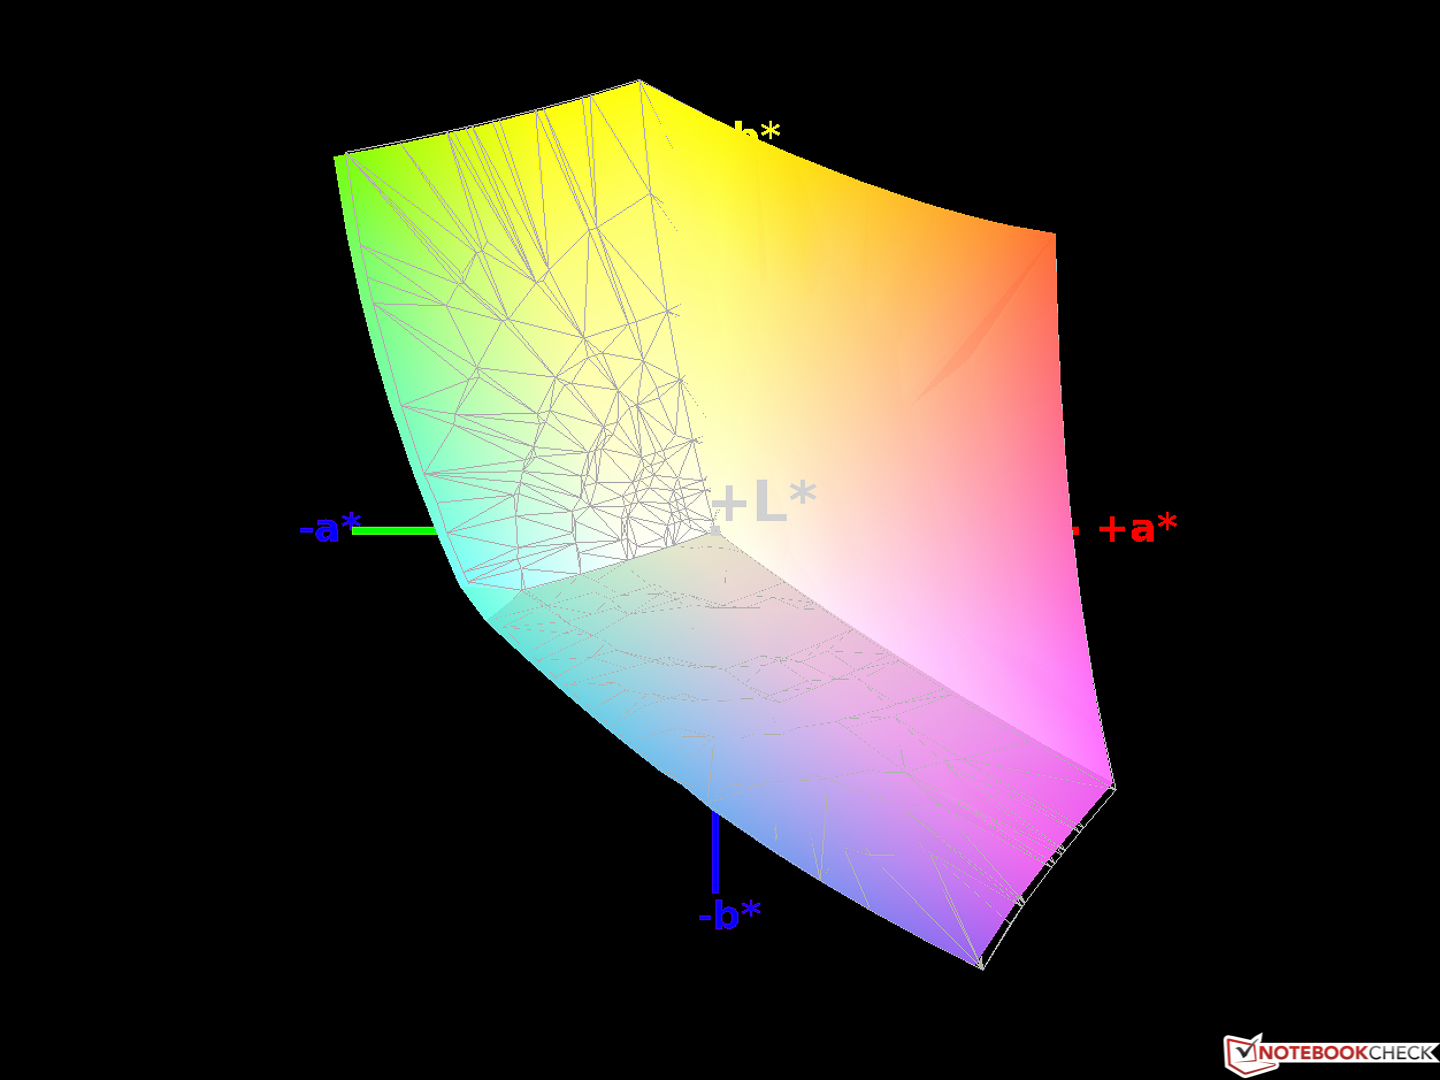
99% sRGB (Argyll 1.6.3 3D)
64% AdobeRGB 1998 (Argyll 1.6.3 3D)
69.3% AdobeRGB 1998 (Argyll 3D)
98.7% sRGB (Argyll 3D)
67.1% Display P3 (Argyll 3D)
Gamma: 2.38
CCT: 7380 K
| Asus Zenbook UX3430UQ-GV012T Chi Mei CMN14D2 / N140HCE-EN1, , 1920x1080, 14" | Lenovo IdeaPad 710S Plus-13IKB LG Philips LP133WF4-SPB1 (LGD04EF), , 1920x1080, 13.3" | Asus Zenbook UX3410UQ-GV077T Chi Mei N140HCE-EN1, , 1920x1080, 14" | Dell XPS 15 2017 9560 (7300HQ, Full-HD) Sharp SHP1453 LQ156M1, , 1920x1080, 15.6" | |
|---|---|---|---|---|
| Display | -11% | 0% | 2% | |
| Display P3 Coverage (%) | 67.1 | 65.3 -3% | 67.2 0% | 68.9 3% |
| sRGB Coverage (%) | 98.7 | 82.9 -16% | 99.2 1% | 98.9 0% |
| AdobeRGB 1998 Coverage (%) | 69.3 | 60.6 -13% | 69.3 0% | 70.9 2% |
| Response Times | -9% | -7% | -61% | |
| Response Time Grey 50% / Grey 80% * (ms) | 40 ? | 45 ? -13% | 44 ? -10% | 54 ? -35% |
| Response Time Black / White * (ms) | 28 ? | 29 ? -4% | 29 ? -4% | 52.4 ? -87% |
| PWM Frequency (Hz) | 60 ? | |||
| Screen | -12% | 2% | -11% | |
| Brightness middle (cd/m²) | 353 | 343 -3% | 381 8% | 400 13% |
| Brightness (cd/m²) | 366 | 306 -16% | 368 1% | 392 7% |
| Brightness Distribution (%) | 88 | 81 -8% | 84 -5% | 89 1% |
| Black Level * (cd/m²) | 0.34 | 0.3 12% | 0.3 12% | 0.26 24% |
| Contrast (:1) | 1038 | 1143 10% | 1270 22% | 1538 48% |
| Colorchecker dE 2000 * | 2.88 | 4.73 -64% | 2.84 1% | 4.9 -70% |
| Colorchecker dE 2000 max. * | 6.61 | 9.05 -37% | 6.5 2% | 11 -66% |
| Greyscale dE 2000 * | 4.24 | 3.29 22% | 4.02 5% | 7.2 -70% |
| Gamma | 2.38 92% | 2.36 93% | 2.42 91% | 2.11 104% |
| CCT | 7380 88% | 6437 101% | 7430 87% | 6911 94% |
| Color Space (Percent of AdobeRGB 1998) (%) | 64 | 54 -16% | 56 -12% | 64.2 0% |
| Color Space (Percent of sRGB) (%) | 99 | 83 -16% | 86 -13% | 98.9 0% |
| Media total (Programa/Opciones) | -11% /
-11% | -2% /
1% | -23% /
-15% |
* ... más pequeño es mejor
Tiempos de respuesta del display
| ↔ Tiempo de respuesta de Negro a Blanco | ||
|---|---|---|
| 28 ms ... subida ↗ y bajada ↘ combinada | ↗ 17 ms subida | 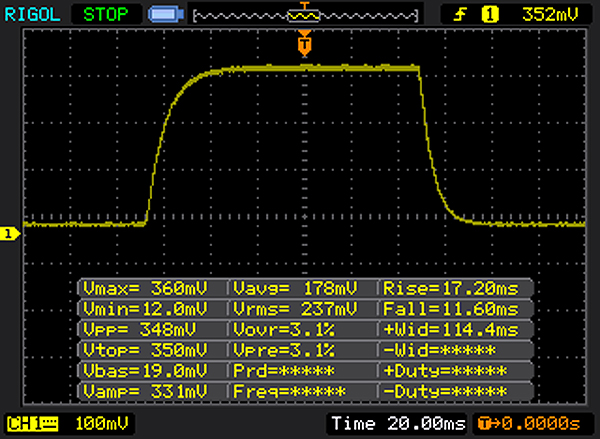 |
| ↘ 11 ms bajada | ||
| La pantalla mostró tiempos de respuesta relativamente lentos en nuestros tests pero podría ser demasiado lenta para los jugones. En comparación, todos los dispositivos de prueba van de ##min### (mínimo) a 240 (máximo) ms. » 71 % de todos los dispositivos son mejores. Eso quiere decir que el tiempo de respuesta es peor que la media (19.9 ms) de todos los dispositivos testados. | ||
| ↔ Tiempo de respuesta 50% Gris a 80% Gris | ||
| 40 ms ... subida ↗ y bajada ↘ combinada | ↗ 20 ms subida | 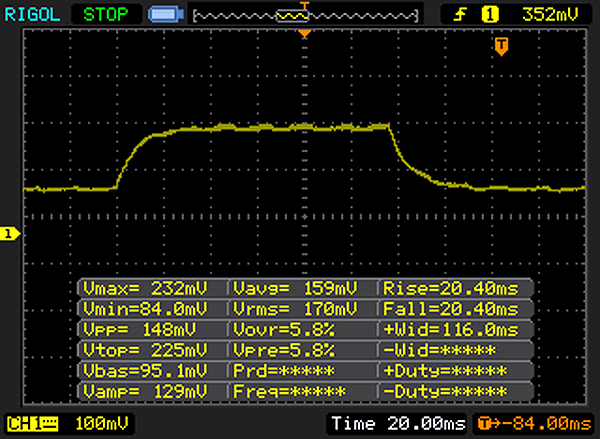 |
| ↘ 20 ms bajada | ||
| La pantalla mostró tiempos de respuesta lentos en nuestros tests y podría ser demasiado lenta para los jugones. En comparación, todos los dispositivos de prueba van de ##min### (mínimo) a 636 (máximo) ms. » 61 % de todos los dispositivos son mejores. Eso quiere decir que el tiempo de respuesta es peor que la media (31.1 ms) de todos los dispositivos testados. | ||
Parpadeo de Pantalla / PWM (Pulse-Width Modulation)
| Parpadeo de Pantalla / PWM no detectado | ||
Comparación: 52 % de todos los dispositivos testados no usaron PWM para atenuar el display. Si se usó, medimos una media de 7801 (mínimo: 5 - máxmo: 343500) Hz. | ||
| Cinebench R15 | |
| CPU Single 64Bit | |
| Asus Zenbook UX3410UQ-GV077T | |
| Dell XPS 15 2017 9560 (7300HQ, Full-HD) | |
| Asus Zenbook UX3430UQ-GV012T | |
| Lenovo IdeaPad 710S Plus-13IKB | |
| CPU Multi 64Bit | |
| Dell XPS 15 2017 9560 (7300HQ, Full-HD) | |
| Asus Zenbook UX3430UQ-GV012T | |
| Asus Zenbook UX3410UQ-GV077T | |
| Lenovo IdeaPad 710S Plus-13IKB | |
| PCMark 8 | |
| Home Score Accelerated v2 | |
| Asus Zenbook UX3410UQ-GV077T | |
| Asus Zenbook UX3430UQ-GV012T | |
| Dell XPS 15 2017 9560 (7300HQ, Full-HD) | |
| Lenovo IdeaPad 710S Plus-13IKB | |
| Work Score Accelerated v2 | |
| Dell XPS 15 2017 9560 (7300HQ, Full-HD) | |
| Asus Zenbook UX3430UQ-GV012T | |
| Lenovo IdeaPad 710S Plus-13IKB | |
| PCMark 8 Home Score Accelerated v2 | 3913 puntos | |
| PCMark 8 Work Score Accelerated v2 | 4812 puntos | |
ayuda | ||
| Asus Zenbook UX3430UQ-GV012T SanDisk SD8SN8U512G1002 | Lenovo IdeaPad 710S Plus-13IKB Samsung PM961 NVMe MZVLW512HMJP | Asus Zenbook UX3410UQ-GV077T SanDisk SD8SNAT256G1002 | Dell XPS 15 2017 9560 (7300HQ, Full-HD) WDC WD10SPCX-75KHST0 + SanDisk Z400s M.2 2242 32 GB Cache | |
|---|---|---|---|---|
| CrystalDiskMark 3.0 | 143% | -14% | -82% | |
| Read Seq (MB/s) | 500 | 1577 215% | 497 -1% | 123 -75% |
| Write Seq (MB/s) | 457.4 | 1472 222% | 323.7 -29% | 74.2 -84% |
| Read 512 (MB/s) | 345.6 | 1165 237% | 289 -16% | 101.7 -71% |
| Write 512 (MB/s) | 415 | 1244 200% | 288 -31% | 42.51 -90% |
| Read 4k (MB/s) | 28.34 | 54.8 93% | 22.78 -20% | 10.84 -62% |
| Write 4k (MB/s) | 56.8 | 121.5 114% | 79.5 40% | 1.021 -98% |
| Read 4k QD32 (MB/s) | 311.3 | 407.5 31% | 147 -53% | 69.8 -78% |
| Write 4k QD32 (MB/s) | 251.1 | 321.4 28% | 257.2 2% | 1.057 -100% |

| 3DMark 11 - 1280x720 Performance GPU | |
| Dell XPS 15 2017 9560 (7300HQ, Full-HD) | |
| Lenovo IdeaPad 710S Plus-13IKB | |
| Asus Zenbook UX3430UQ-GV012T | |
| Asus Zenbook UX3410UQ-GV077T | |
| Asus Zenbook UX3410UA | |
| 3DMark - 1920x1080 Fire Strike Graphics | |
| Dell XPS 15 2017 9560 (7300HQ, Full-HD) | |
| Lenovo IdeaPad 710S Plus-13IKB | |
| Asus Zenbook UX3430UQ-GV012T | |
| Asus Zenbook UX3410UA | |
| 3DMark 11 Performance | 2335 puntos | |
| 3DMark Cloud Gate Standard Score | 6852 puntos | |
| 3DMark Fire Strike Score | 1373 puntos | |
ayuda | ||
| bajo | medio | alto | ultra | |
|---|---|---|---|---|
| Diablo III (2012) | 70.2 | 66.8 | 41.7 | |
| The Witcher 3 (2015) | 27.8 | 17.3 | ||
| Farming Simulator 17 (2016) | 79.7 | 34.1 | 23.3 |
Ruido
| Ocioso |
| 30.8 / 30.8 / 32.4 dB(A) |
| Carga |
| 35.1 / 38.4 dB(A) |
 | ||
30 dB silencioso 40 dB(A) audible 50 dB(A) ruidosamente alto |
||
min: | ||
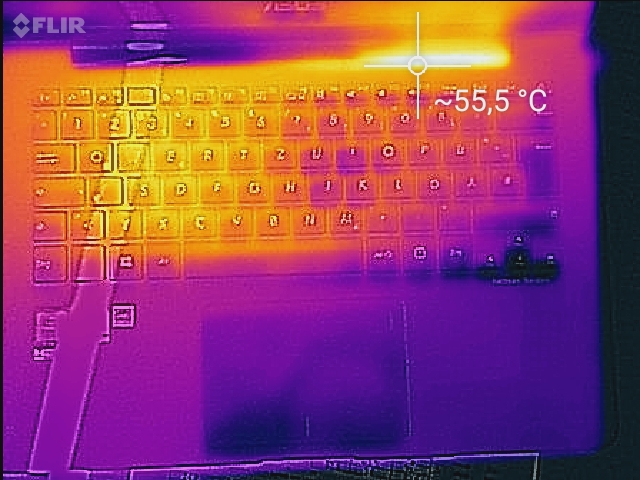
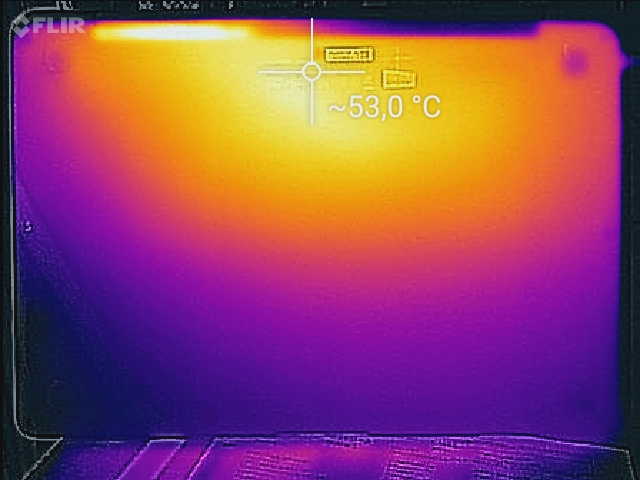
(±) La temperatura máxima en la parte superior es de 44 °C / 111 F, frente a la media de 35.9 °C / 97 F, que oscila entre 21.4 y 59 °C para la clase Subnotebook.
(-) El fondo se calienta hasta un máximo de 50.2 °C / 122 F, frente a la media de 39.2 °C / 103 F
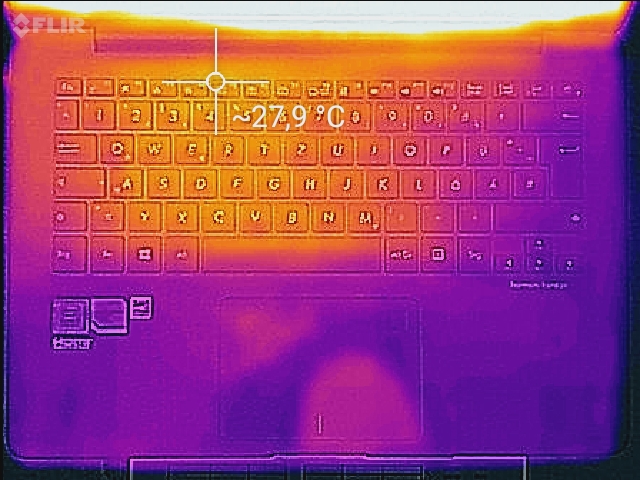
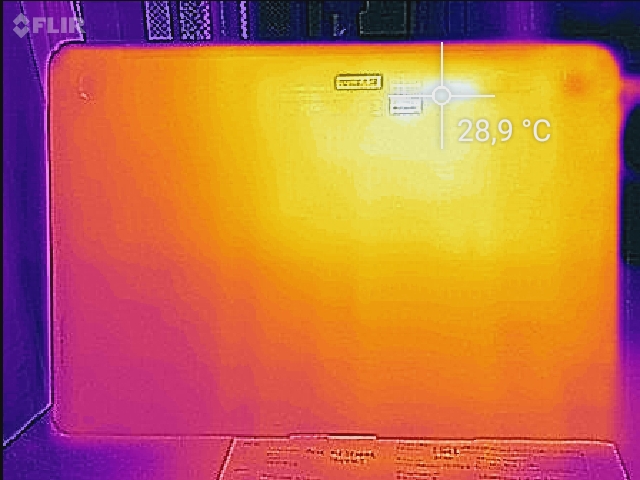
(+) En reposo, la temperatura media de la parte superior es de 25.5 °C / 78# F, frente a la media del dispositivo de 30.8 °C / 87 F.
(+) Los reposamanos y el panel táctil alcanzan como máximo la temperatura de la piel (33.4 °C / 92.1 F) y, por tanto, no están calientes.
(-) La temperatura media de la zona del reposamanos de dispositivos similares fue de 28.2 °C / 82.8 F (-5.2 °C / -9.3 F).
Asus Zenbook UX3430UQ-GV012T análisis de audio
(±) | la sonoridad del altavoz es media pero buena (75 dB)
Graves 100 - 315 Hz
(-) | casi sin bajos - de media 18.9% inferior a la mediana
(±) | la linealidad de los graves es media (12.2% delta a frecuencia anterior)
Medios 400 - 2000 Hz
(+) | medios equilibrados - a sólo 3.4% de la mediana
(+) | los medios son lineales (6.9% delta a la frecuencia anterior)
Altos 2 - 16 kHz
(+) | máximos equilibrados - a sólo 2.7% de la mediana
(+) | los máximos son lineales (5% delta a la frecuencia anterior)
Total 100 - 16.000 Hz
(±) | la linealidad del sonido global es media (20.4% de diferencia con la mediana)
En comparación con la misma clase
» 65% de todos los dispositivos probados de esta clase eran mejores, 8% similares, 27% peores
» El mejor tuvo un delta de 5%, la media fue 18%, el peor fue ###max##%
En comparación con todos los dispositivos probados
» 53% de todos los dispositivos probados eran mejores, 8% similares, 39% peores
» El mejor tuvo un delta de 4%, la media fue 24%, el peor fue ###max##%
Lenovo IdeaPad 710S Plus-13IKB análisis de audio
(±) | la sonoridad del altavoz es media pero buena (73 dB)
Graves 100 - 315 Hz
(-) | casi sin bajos - de media 21.4% inferior a la mediana
(±) | la linealidad de los graves es media (12.2% delta a frecuencia anterior)
Medios 400 - 2000 Hz
(±) | medias más altas - de media 6.7% más altas que la mediana
(±) | la linealidad de los medios es media (10.6% delta respecto a la frecuencia anterior)
Altos 2 - 16 kHz
(+) | máximos equilibrados - a sólo 2.2% de la mediana
(+) | los máximos son lineales (6.9% delta a la frecuencia anterior)
Total 100 - 16.000 Hz
(±) | la linealidad del sonido global es media (24.4% de diferencia con la mediana)
En comparación con la misma clase
» 82% de todos los dispositivos probados de esta clase eran mejores, 4% similares, 13% peores
» El mejor tuvo un delta de 5%, la media fue 18%, el peor fue ###max##%
En comparación con todos los dispositivos probados
» 74% de todos los dispositivos probados eran mejores, 6% similares, 20% peores
» El mejor tuvo un delta de 4%, la media fue 24%, el peor fue ###max##%
Asus Zenbook UX3410UQ-GV077T análisis de audio
(±) | la sonoridad del altavoz es media pero buena (73 dB)
Graves 100 - 315 Hz
(±) | lubina reducida - en promedio 12% inferior a la mediana
(+) | el bajo es lineal (4.5% delta a la frecuencia anterior)
Medios 400 - 2000 Hz
(±) | medias más altas - de media 6.5% más altas que la mediana
(+) | los medios son lineales (6.7% delta a la frecuencia anterior)
Altos 2 - 16 kHz
(+) | máximos equilibrados - a sólo 3.9% de la mediana
(+) | los máximos son lineales (4.8% delta a la frecuencia anterior)
Total 100 - 16.000 Hz
(±) | la linealidad del sonido global es media (17% de diferencia con la mediana)
En comparación con la misma clase
» 43% de todos los dispositivos probados de esta clase eran mejores, 8% similares, 49% peores
» El mejor tuvo un delta de 5%, la media fue 18%, el peor fue ###max##%
En comparación con todos los dispositivos probados
» 30% de todos los dispositivos probados eran mejores, 8% similares, 62% peores
» El mejor tuvo un delta de 4%, la media fue 24%, el peor fue ###max##%
Dell XPS 15 2017 9560 (7300HQ, Full-HD) análisis de audio
(+) | los altavoces pueden reproducir a un volumen relativamente alto (#87 dB)
Graves 100 - 315 Hz
(-) | casi sin bajos - de media 15.8% inferior a la mediana
(±) | la linealidad de los graves es media (13.9% delta a frecuencia anterior)
Medios 400 - 2000 Hz
(+) | medios equilibrados - a sólo 4.3% de la mediana
(±) | la linealidad de los medios es media (7.1% delta respecto a la frecuencia anterior)
Altos 2 - 16 kHz
(+) | máximos equilibrados - a sólo 3.1% de la mediana
(±) | la linealidad de los máximos es media (7.9% delta a frecuencia anterior)
Total 100 - 16.000 Hz
(+) | el sonido global es lineal (13.5% de diferencia con la mediana)
En comparación con la misma clase
» 29% de todos los dispositivos probados de esta clase eran mejores, 4% similares, 67% peores
» El mejor tuvo un delta de 5%, la media fue 17%, el peor fue ###max##%
En comparación con todos los dispositivos probados
» 14% de todos los dispositivos probados eran mejores, 4% similares, 82% peores
» El mejor tuvo un delta de 4%, la media fue 24%, el peor fue ###max##%
| Off / Standby | |
| Ocioso | |
| Carga |
|
Clave:
min: | |
| Asus Zenbook UX3430UQ-GV012T i7-7500U, GeForce 940MX, SanDisk SD8SN8U512G1002, IPS, 1920x1080, 14" | Lenovo IdeaPad 710S Plus-13IKB i7-7500U, GeForce 940MX, Samsung PM961 NVMe MZVLW512HMJP, IPS, 1920x1080, 13.3" | Asus Zenbook UX3410UQ-GV077T i7-7500U, GeForce 940MX, SanDisk SD8SNAT256G1002, IPS, 1920x1080, 14" | Dell XPS 15 2017 9560 (7300HQ, Full-HD) i5-7300HQ, GeForce GTX 1050 Mobile, WDC WD10SPCX-75KHST0 + SanDisk Z400s M.2 2242 32 GB Cache, LED IGZO IPS InfinityEdge, 1920x1080, 15.6" | |
|---|---|---|---|---|
| Power Consumption | -19% | -15% | -109% | |
| Idle Minimum * (Watt) | 2.6 | 3.6 -38% | 3.5 -35% | 6.6 -154% |
| Idle Average * (Watt) | 5.9 | 7.4 -25% | 6.6 -12% | 9 -53% |
| Idle Maximum * (Watt) | 6.25 | 8.7 -39% | 7.1 -14% | 10.7 -71% |
| Load Average * (Watt) | 42 | 43 -2% | 30 29% | 77.5 -85% |
| Load Maximum * (Watt) | 46 | 42 9% | 65 -41% | 130 -183% |
* ... más pequeño es mejor
| Asus Zenbook UX3430UQ-GV012T i7-7500U, GeForce 940MX, 50 Wh | Lenovo IdeaPad 710S Plus-13IKB i7-7500U, GeForce 940MX, 46 Wh | Asus Zenbook UX3410UQ-GV077T i7-7500U, GeForce 940MX, 48 Wh | Dell XPS 15 2017 9560 (7300HQ, Full-HD) i5-7300HQ, GeForce GTX 1050 Mobile, 56 Wh | |
|---|---|---|---|---|
| Duración de Batería | -35% | -3% | -35% | |
| Reader / Idle (h) | 21.5 | 7.8 -64% | 9.4 -56% | |
| WiFi v1.3 (h) | 8.8 | 5.6 -36% | 8.5 -3% | 5.6 -36% |
| Load (h) | 1.6 | 1.5 -6% | 1.4 -13% |
Pro
Contra
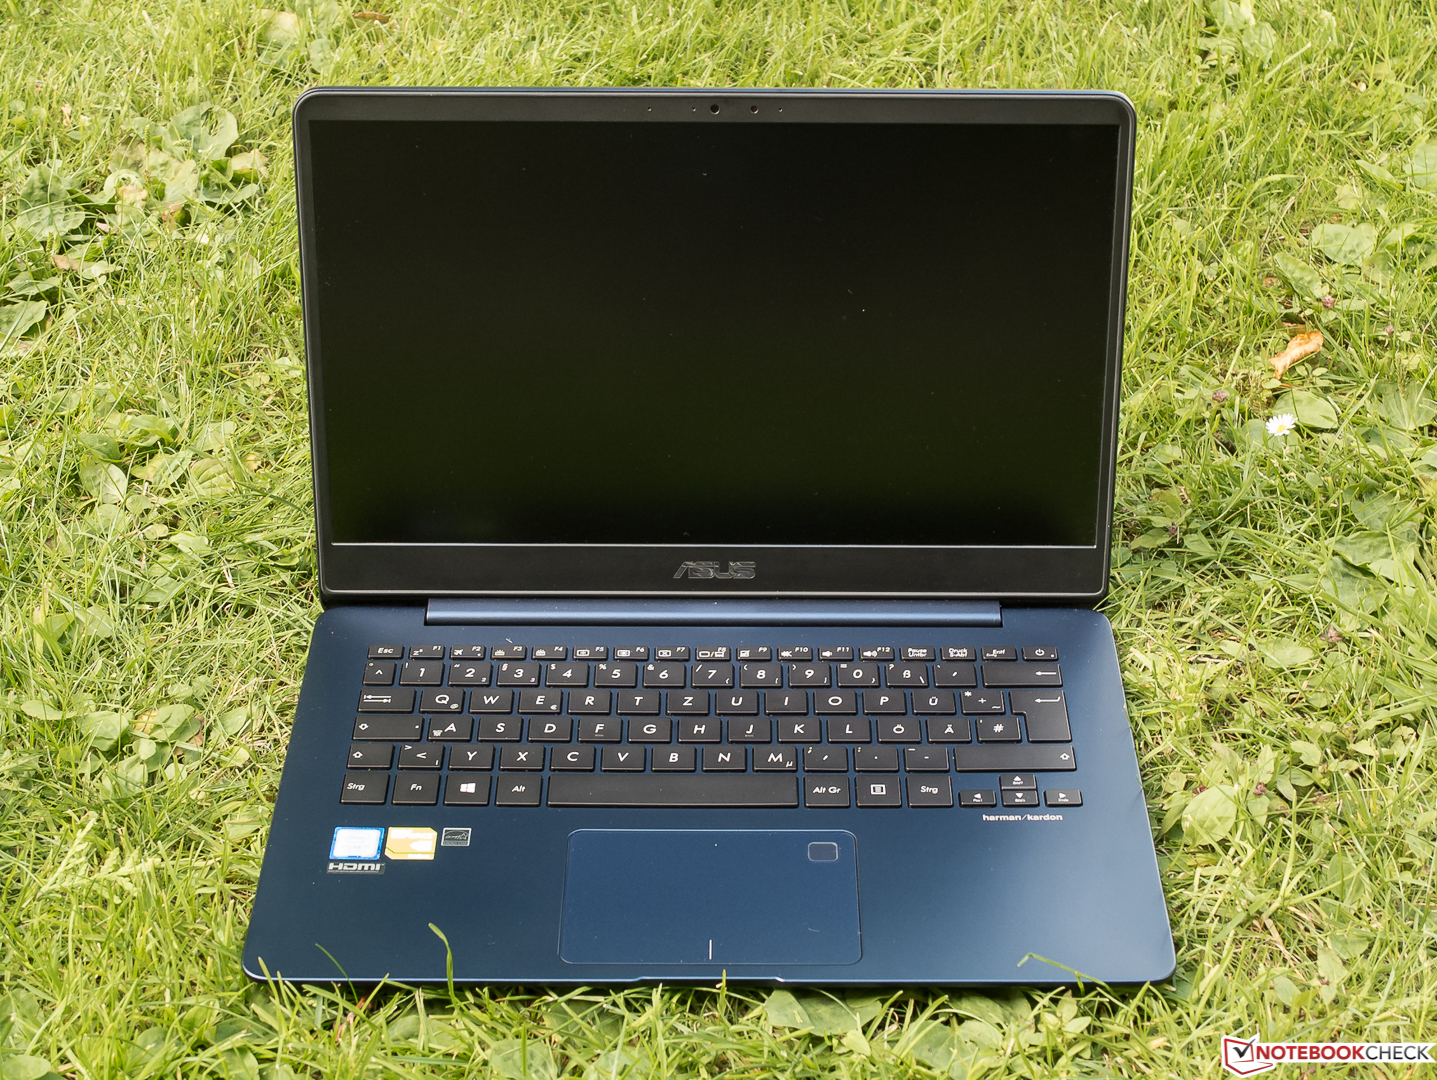
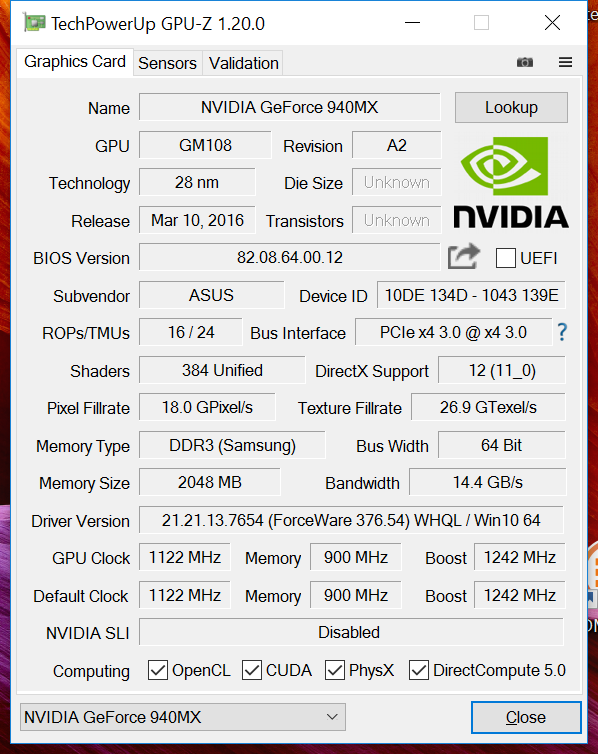
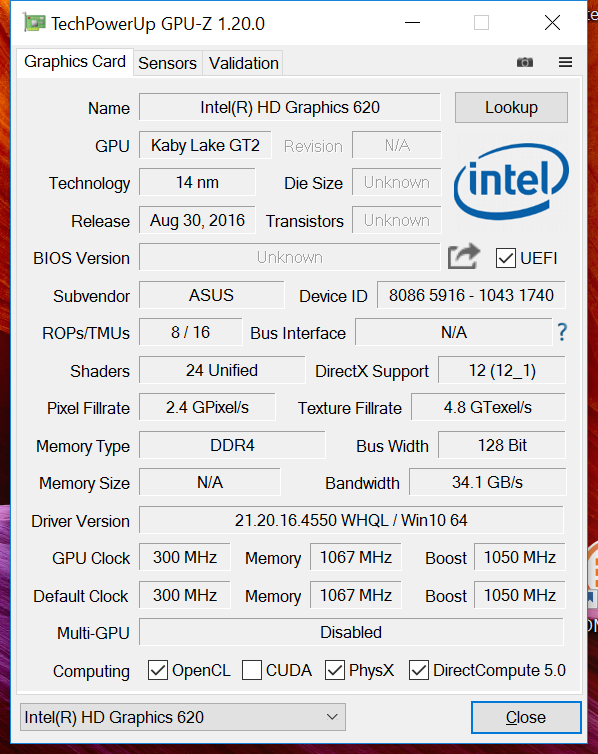
¿Por que Asus ha elegido para este portátil la vetusta GeForce 940MX? ¿Por que no consiguieron una mejor versión de este chip gráfico? Recordemos que la 940MX incluida en el Zenbook es solo un 30% más rápida que una Intel HD Graphics 620. Lo único que puede hacernos pensar en las aspiraciones multimedia se encuentra en la excelente pantalla del portátil. ¿Dispositivo multimedia? Ciertamente no.
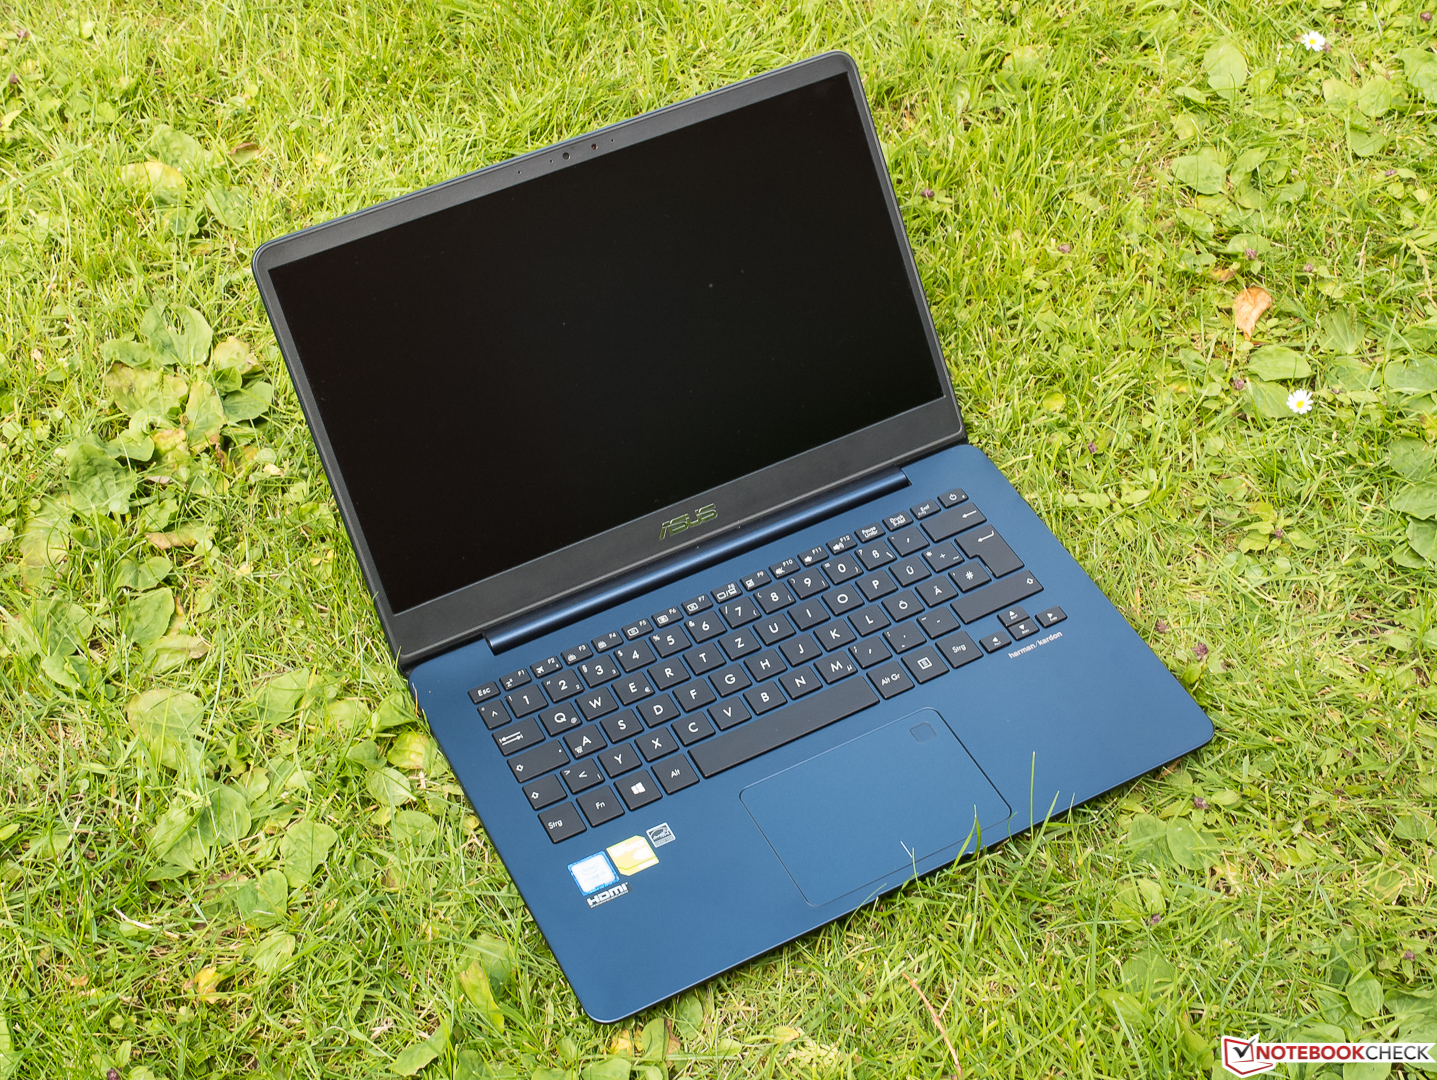
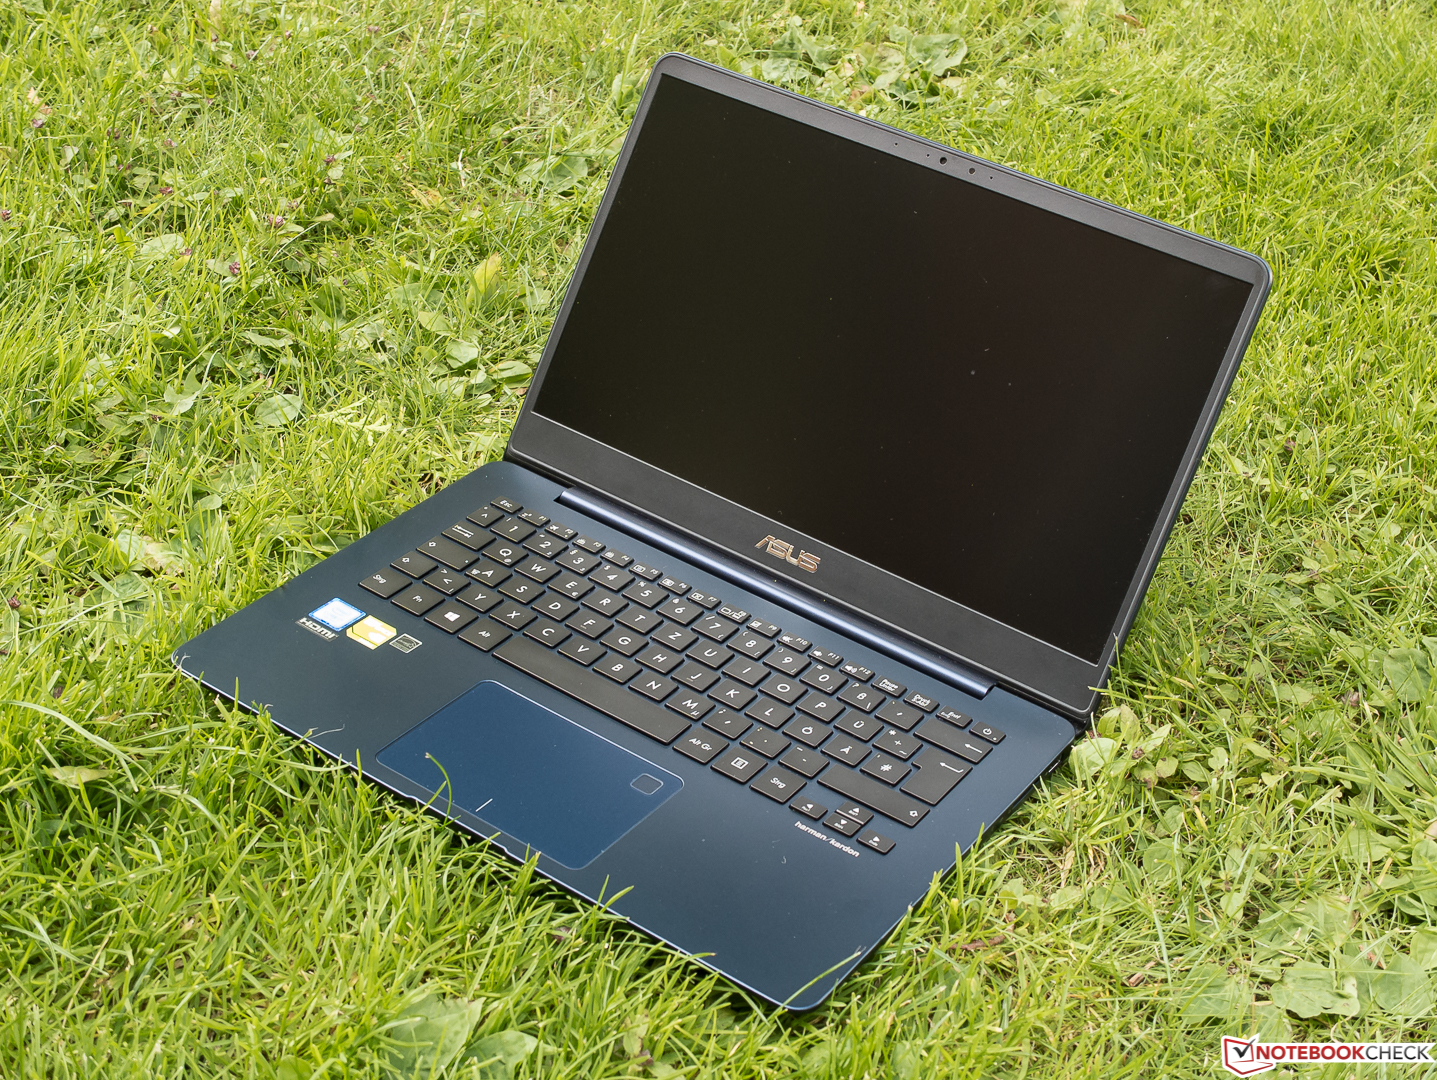
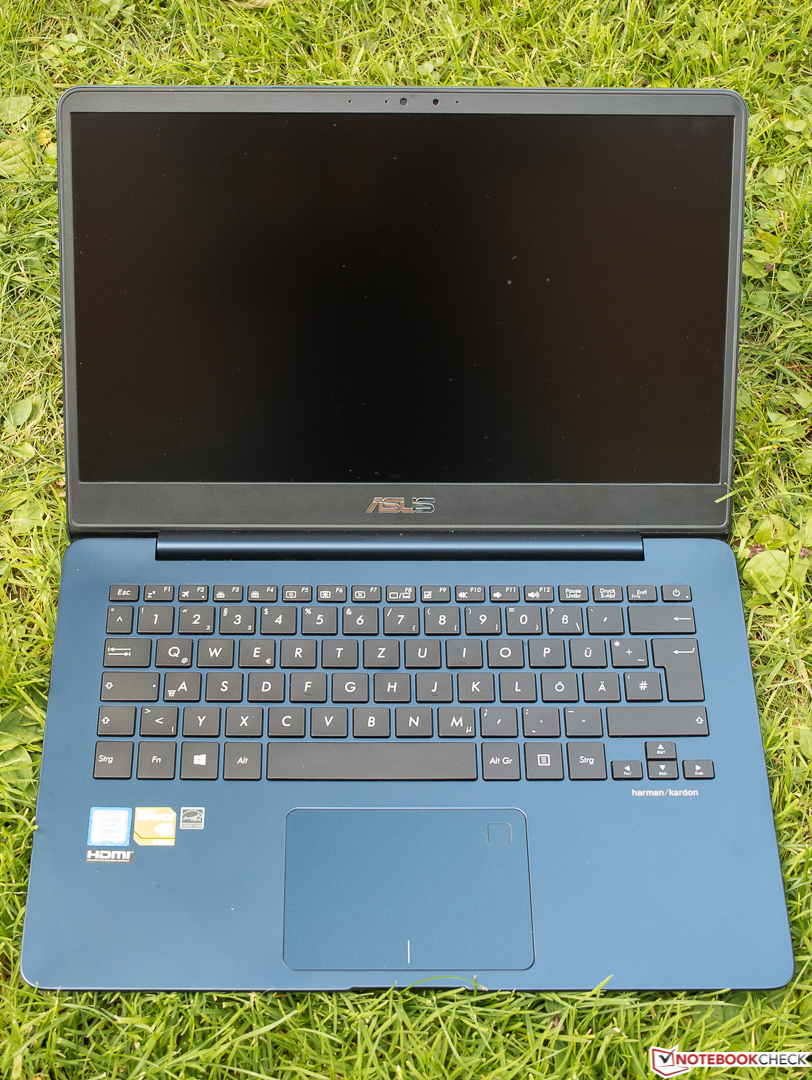
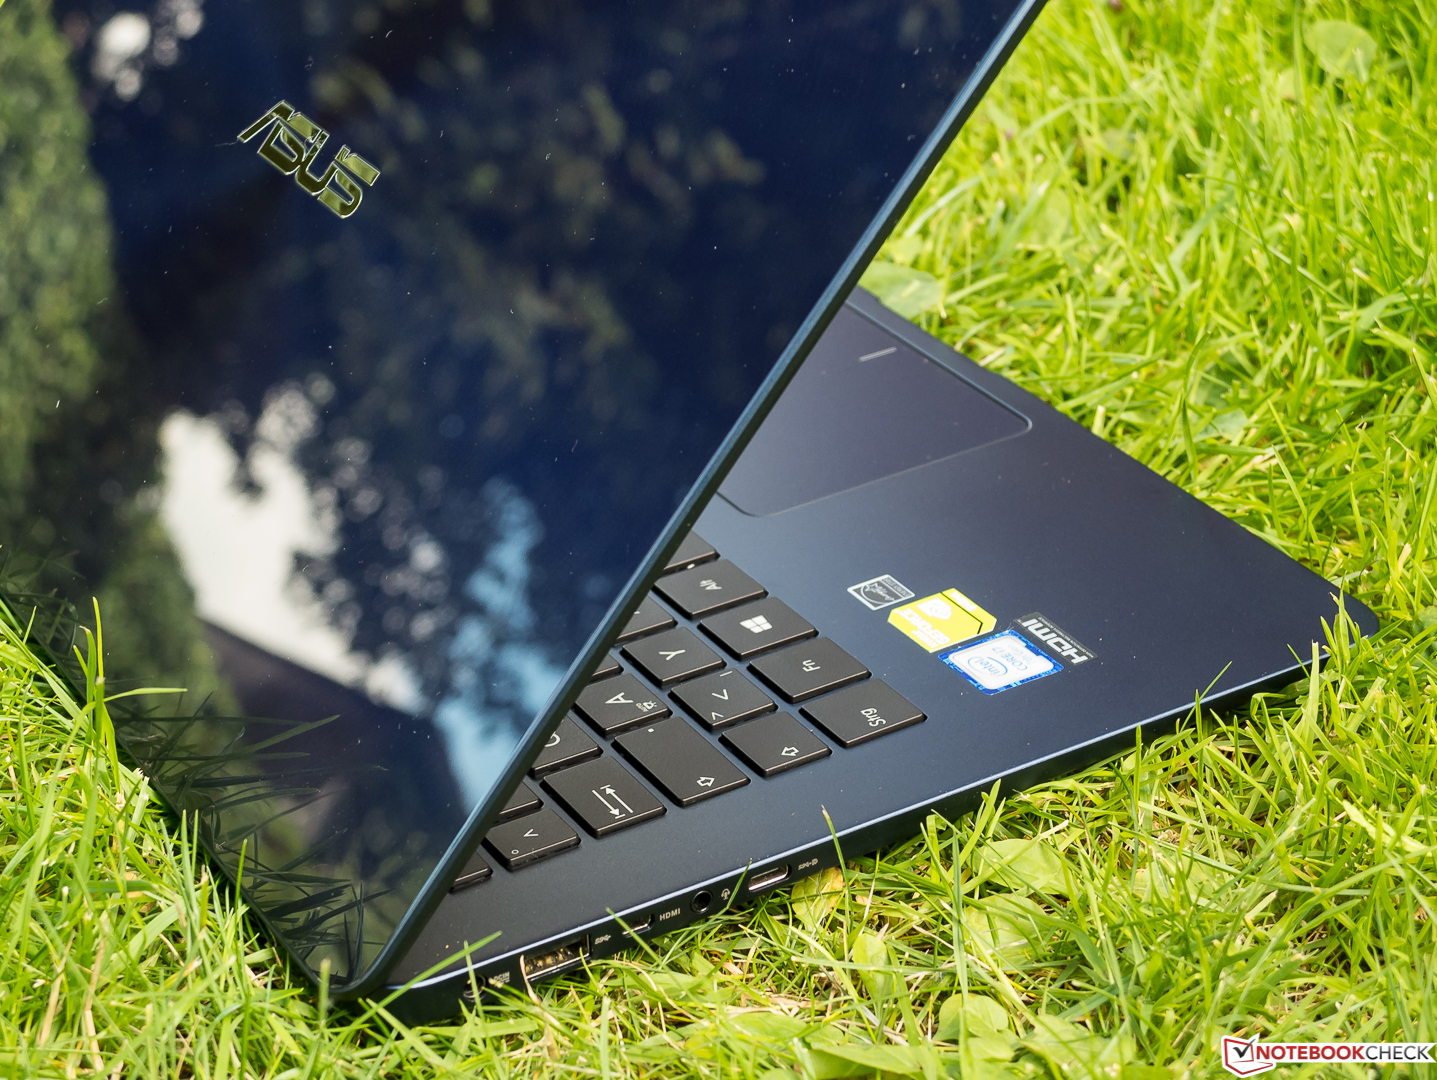
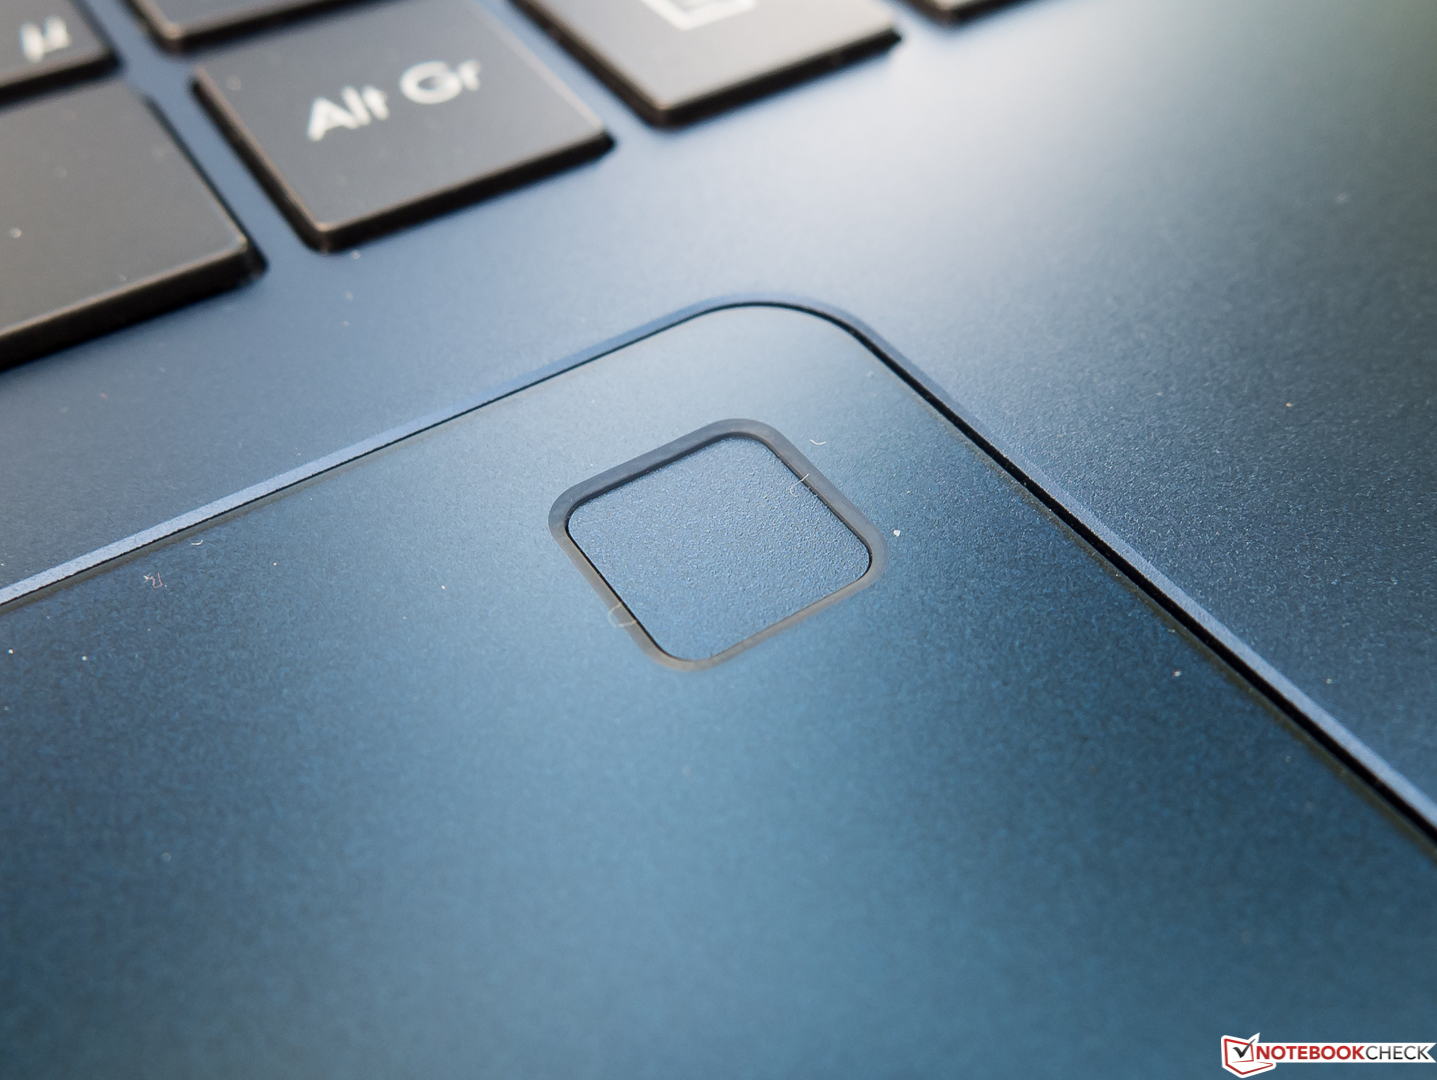
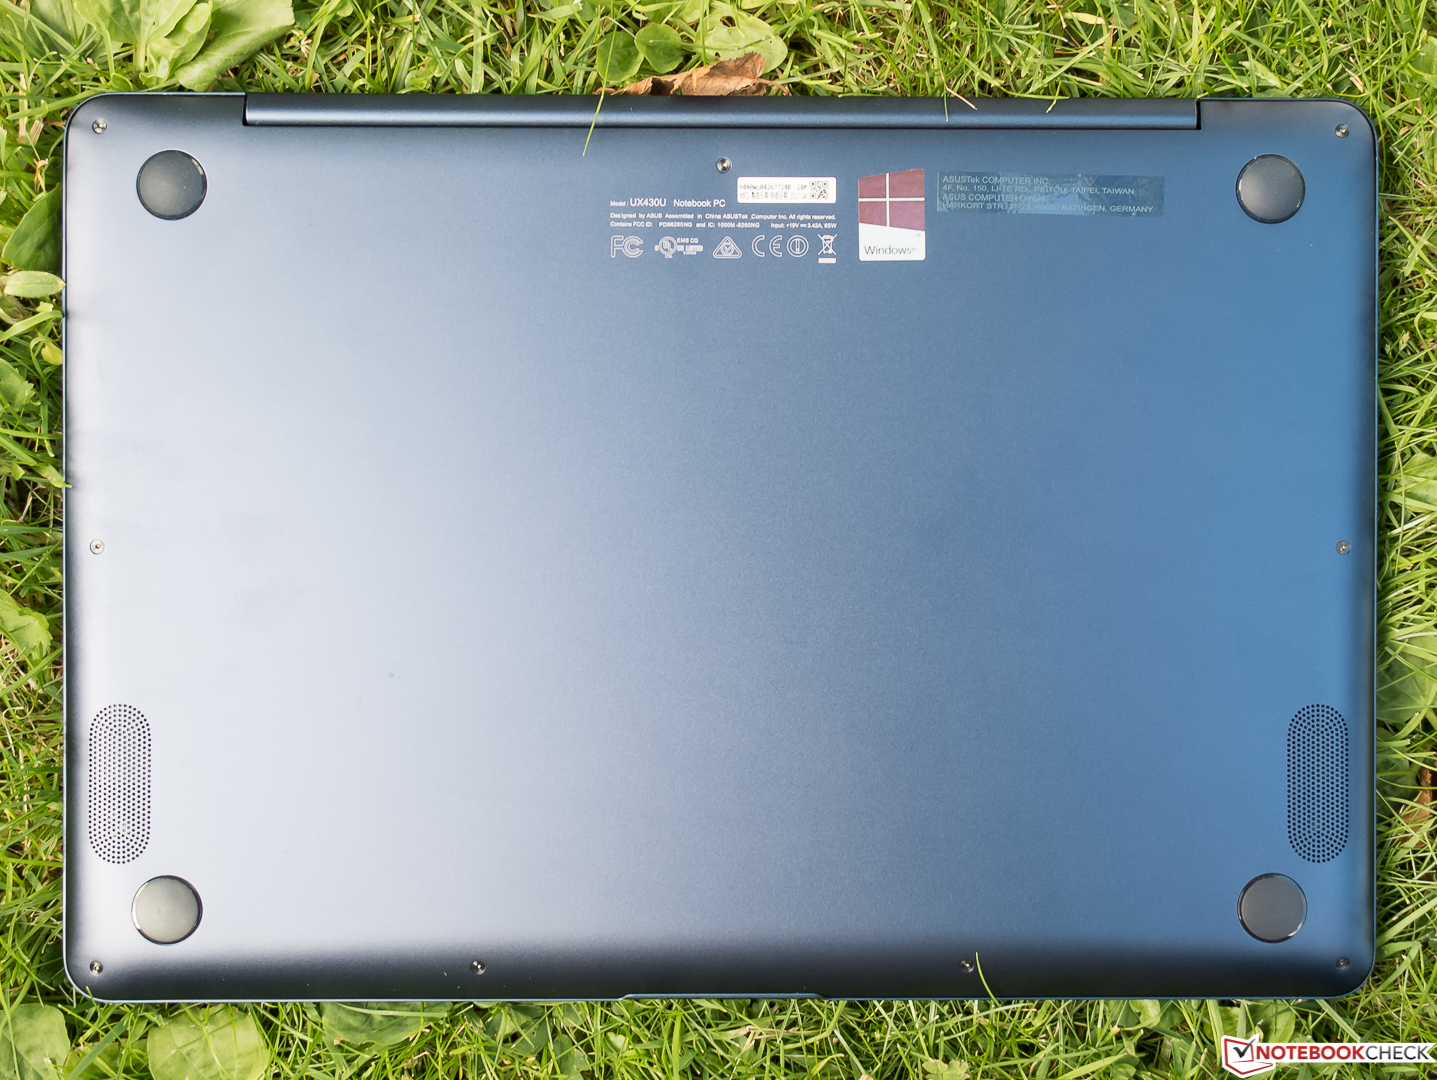
¿Portátil de negocios? Ciertamente. El Asus Zenbook UX3430UQ es más un portátil de negocios y oficina, y no defraurará a aquellos que deseen editar fotografías de forma no profesional. Gracias a los escasos marcos de la pantalla, el portátil de 14 pulgadas es bastante compacto. La muy larga duración de batería y las características de seguridad incluidas en el portátil lo hacen muy transportable. El dispositivo resulta muy silencioso en general, excepto por las teclas demasiado ruidosas. A pesar de todo, los dispositivos de entrada deberían resultar adecuado para la gran mayoría de lo usuarios.
Los usuarios de oficina y domésticos que busquen un portátil bonito, de alta calidad y portable son el nicho de mercado que busca este portátil. Los jugones, por otra parte, deben buscar otro dispositivo.
Con los precios actuales de 1500$ (GV010T) y 1600$ (GV012T), los dos modelos UX3430UQ resultan muy caros. Los potenciales compradores que esperen podrán encontrar un ratio precio-rendimiento más adecuado.
Ésta es una versión acortada del análisis original. Puedes leer el análisis completo en inglés aquí.
Asus Zenbook UX3430UQ-GV012T
- 07/05/2017 v6 (old)
Sven Kloevekorn
Price comparison
