Reseña del Schenker Work 14 Base - El portátil de oficina asequible con muchos puertos y una brillante pantalla IPS
El Work 14 Base de Schenker es un portátil de oficina compacto que, además de una pantalla IPS brillante y mate, ofrece muy buenas opciones de actualización y una amplia variedad de puertos, incluido Ethernet, que hoy en día ya no se da por supuesto ni siquiera en los portátiles de oficina o profesionales. Los precios del Work 14 empiezan en 750 dólares y nuestro dispositivo de prueba con 16 GB de RAM se puede encontrar actualmente por unos 770 dólares.
Posibles contendientes en la comparación
Valoración | Fecha | Modelo | Peso | Altura | Tamaño | Resolución | Precio |
|---|---|---|---|---|---|---|---|
| 82 % v7 (old) | 05/2024 | Schenker Work 14 Base i5-1235U, Iris Xe G7 80EUs | 1.3 kg | 20.2 mm | 14.00" | 1920x1080 | |
| 85.6 % v7 (old) | 11/2023 | Acer Swift Go 14 SFG14-71 i5-1335U, Iris Xe G7 80EUs | 1.3 kg | 14.9 mm | 14.00" | 2880x1800 | |
| 84.6 % v7 (old) | 10/2023 | HP ProBook 445 G10 R5 7530U, Vega 7 | 1.3 kg | 20 mm | 14.00" | 1920x1080 | |
| 85.3 % v7 (old) | 06/2023 | Dell Latitude 3440 i5-1345U, Iris Xe G7 80EUs | 1.5 kg | 19.4 mm | 14.00" | 1920x1080 | |
| 88.6 % v7 (old) | 08/2023 | Lenovo ThinkPad L14 G4 21H6S00900 R5 7530U, Vega 7 | 1.5 kg | 19.83 mm | 14.00" | 1920x1080 |
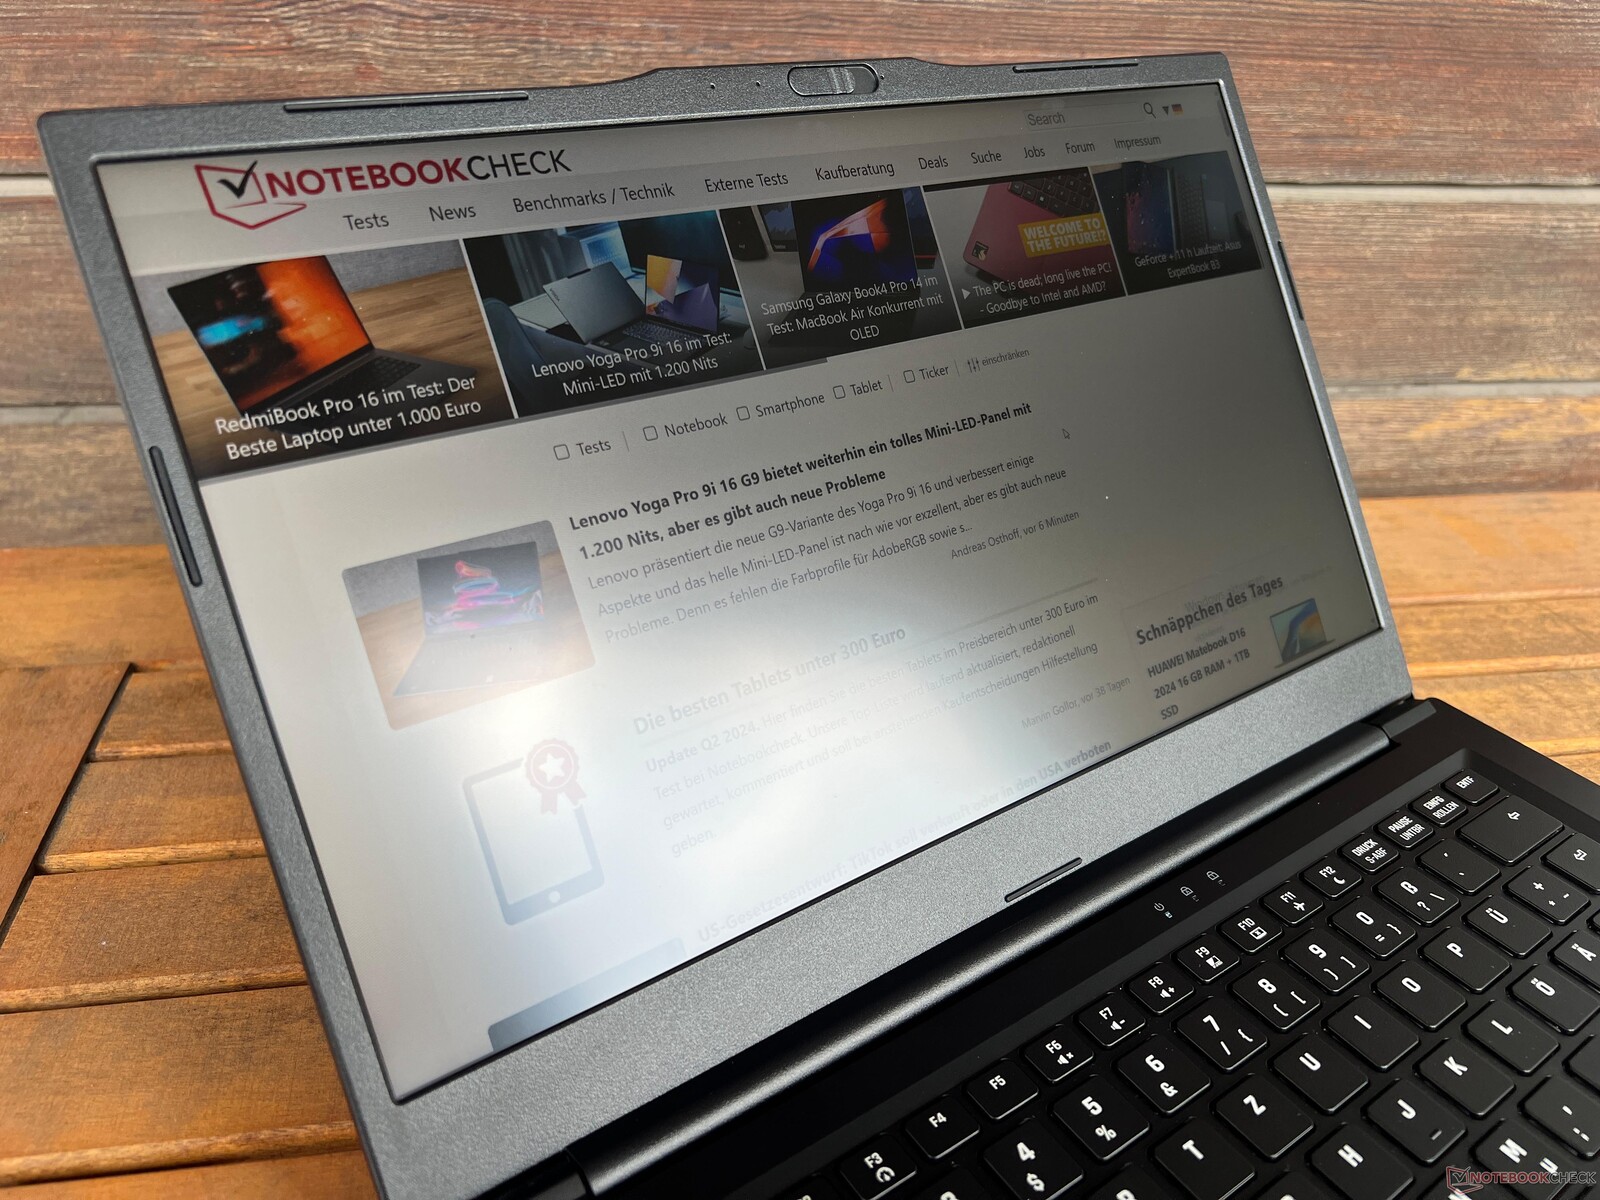
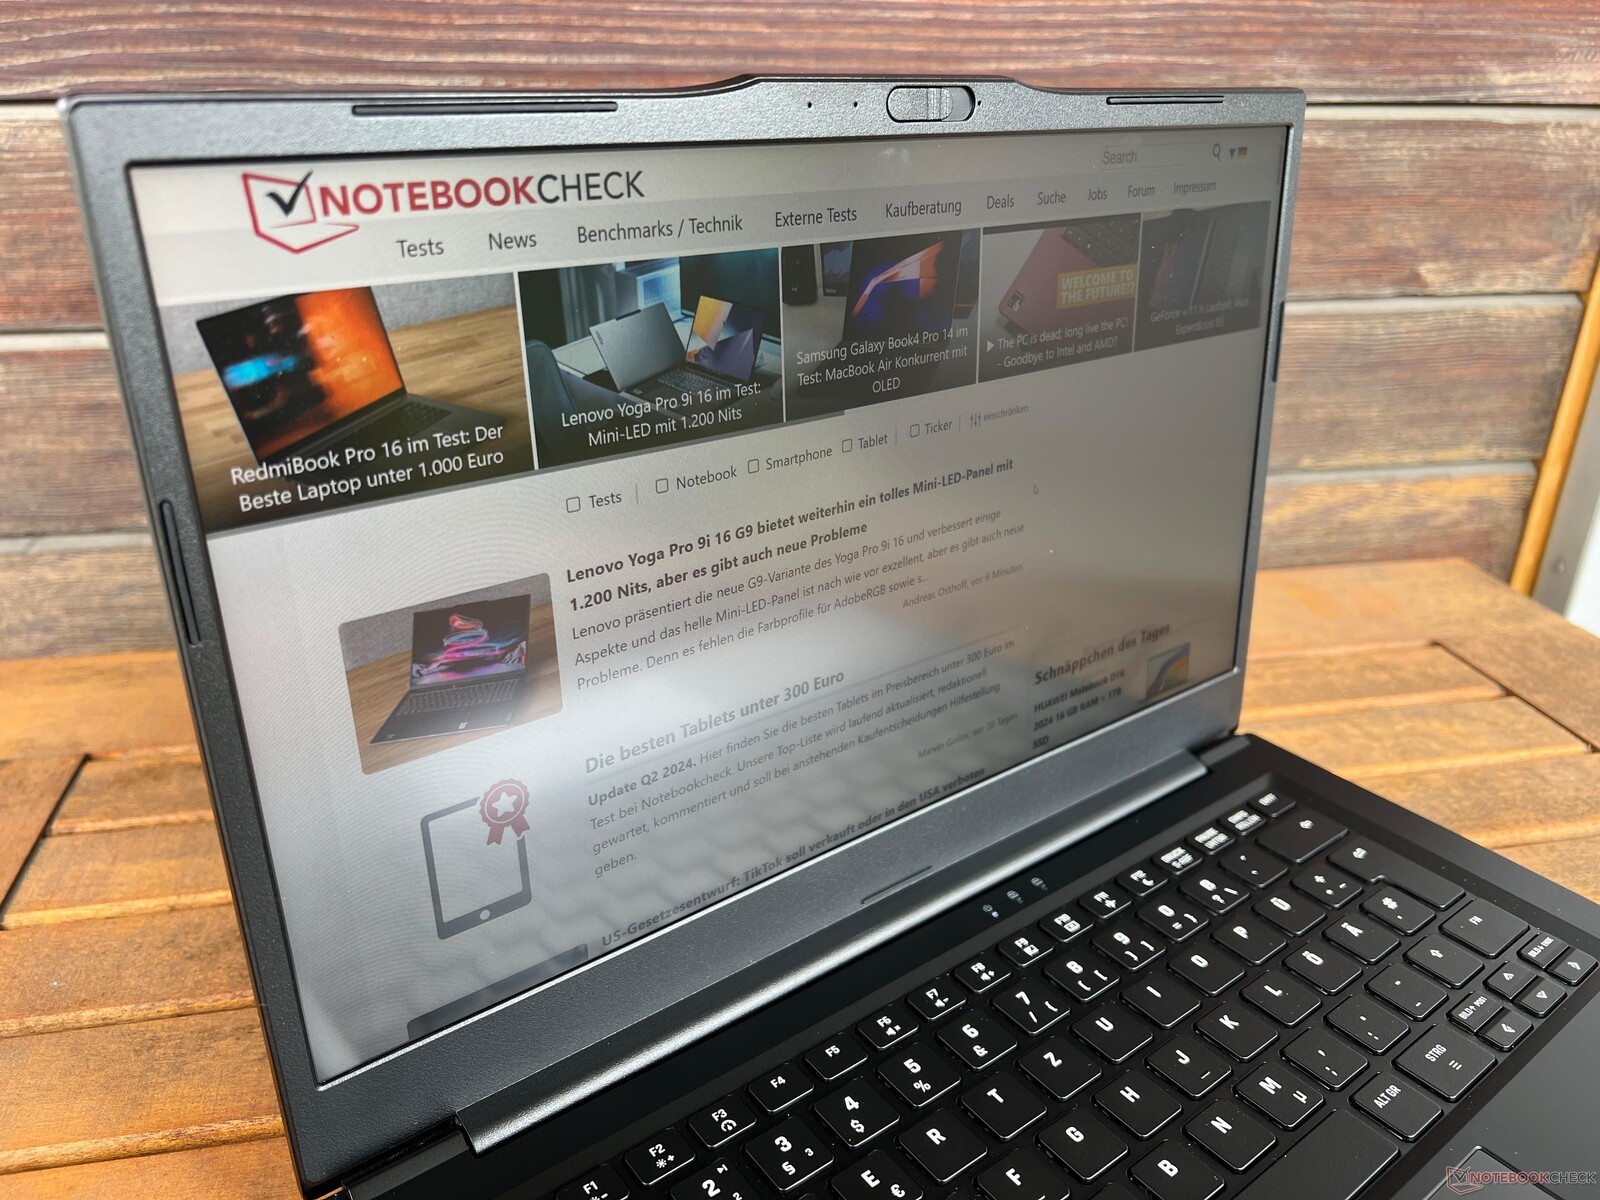
Estuche y conectividad
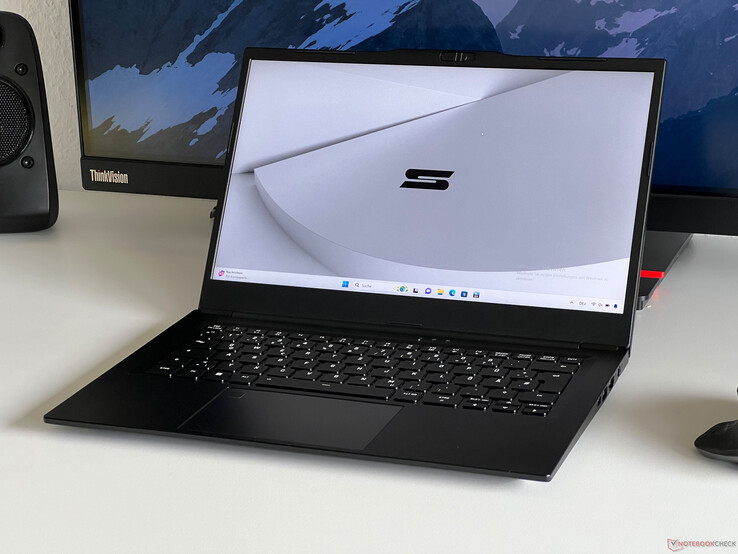
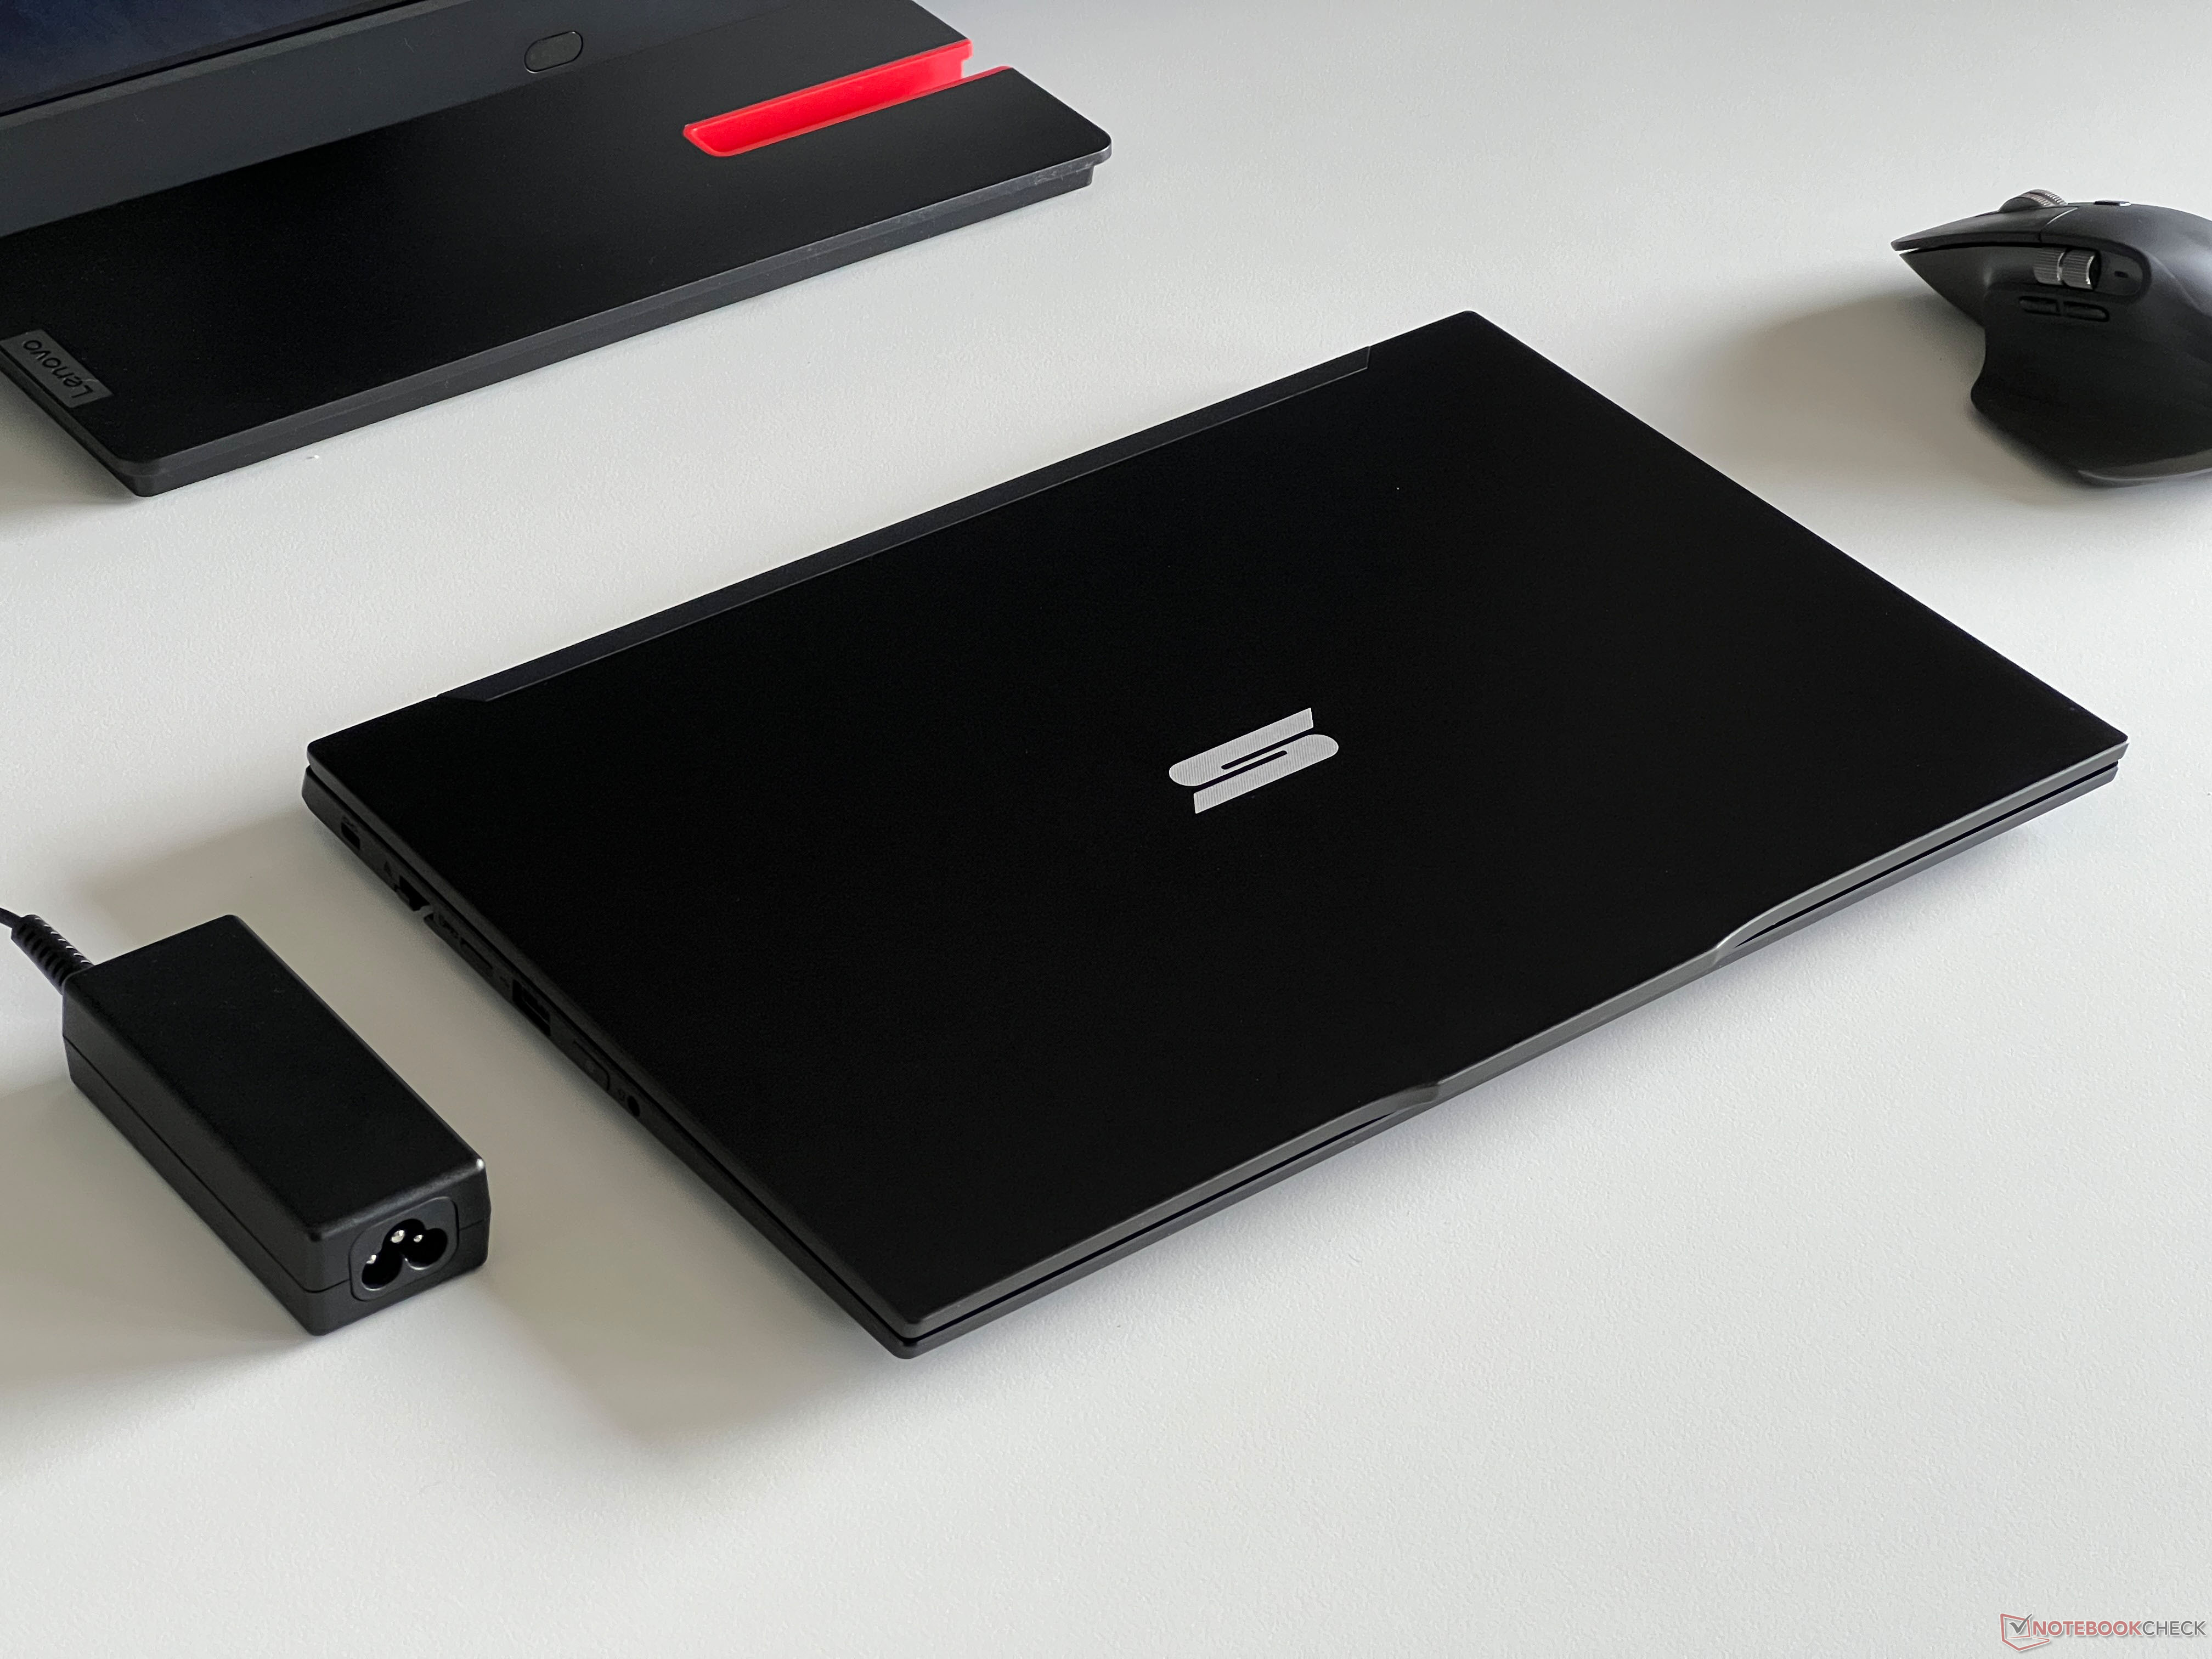
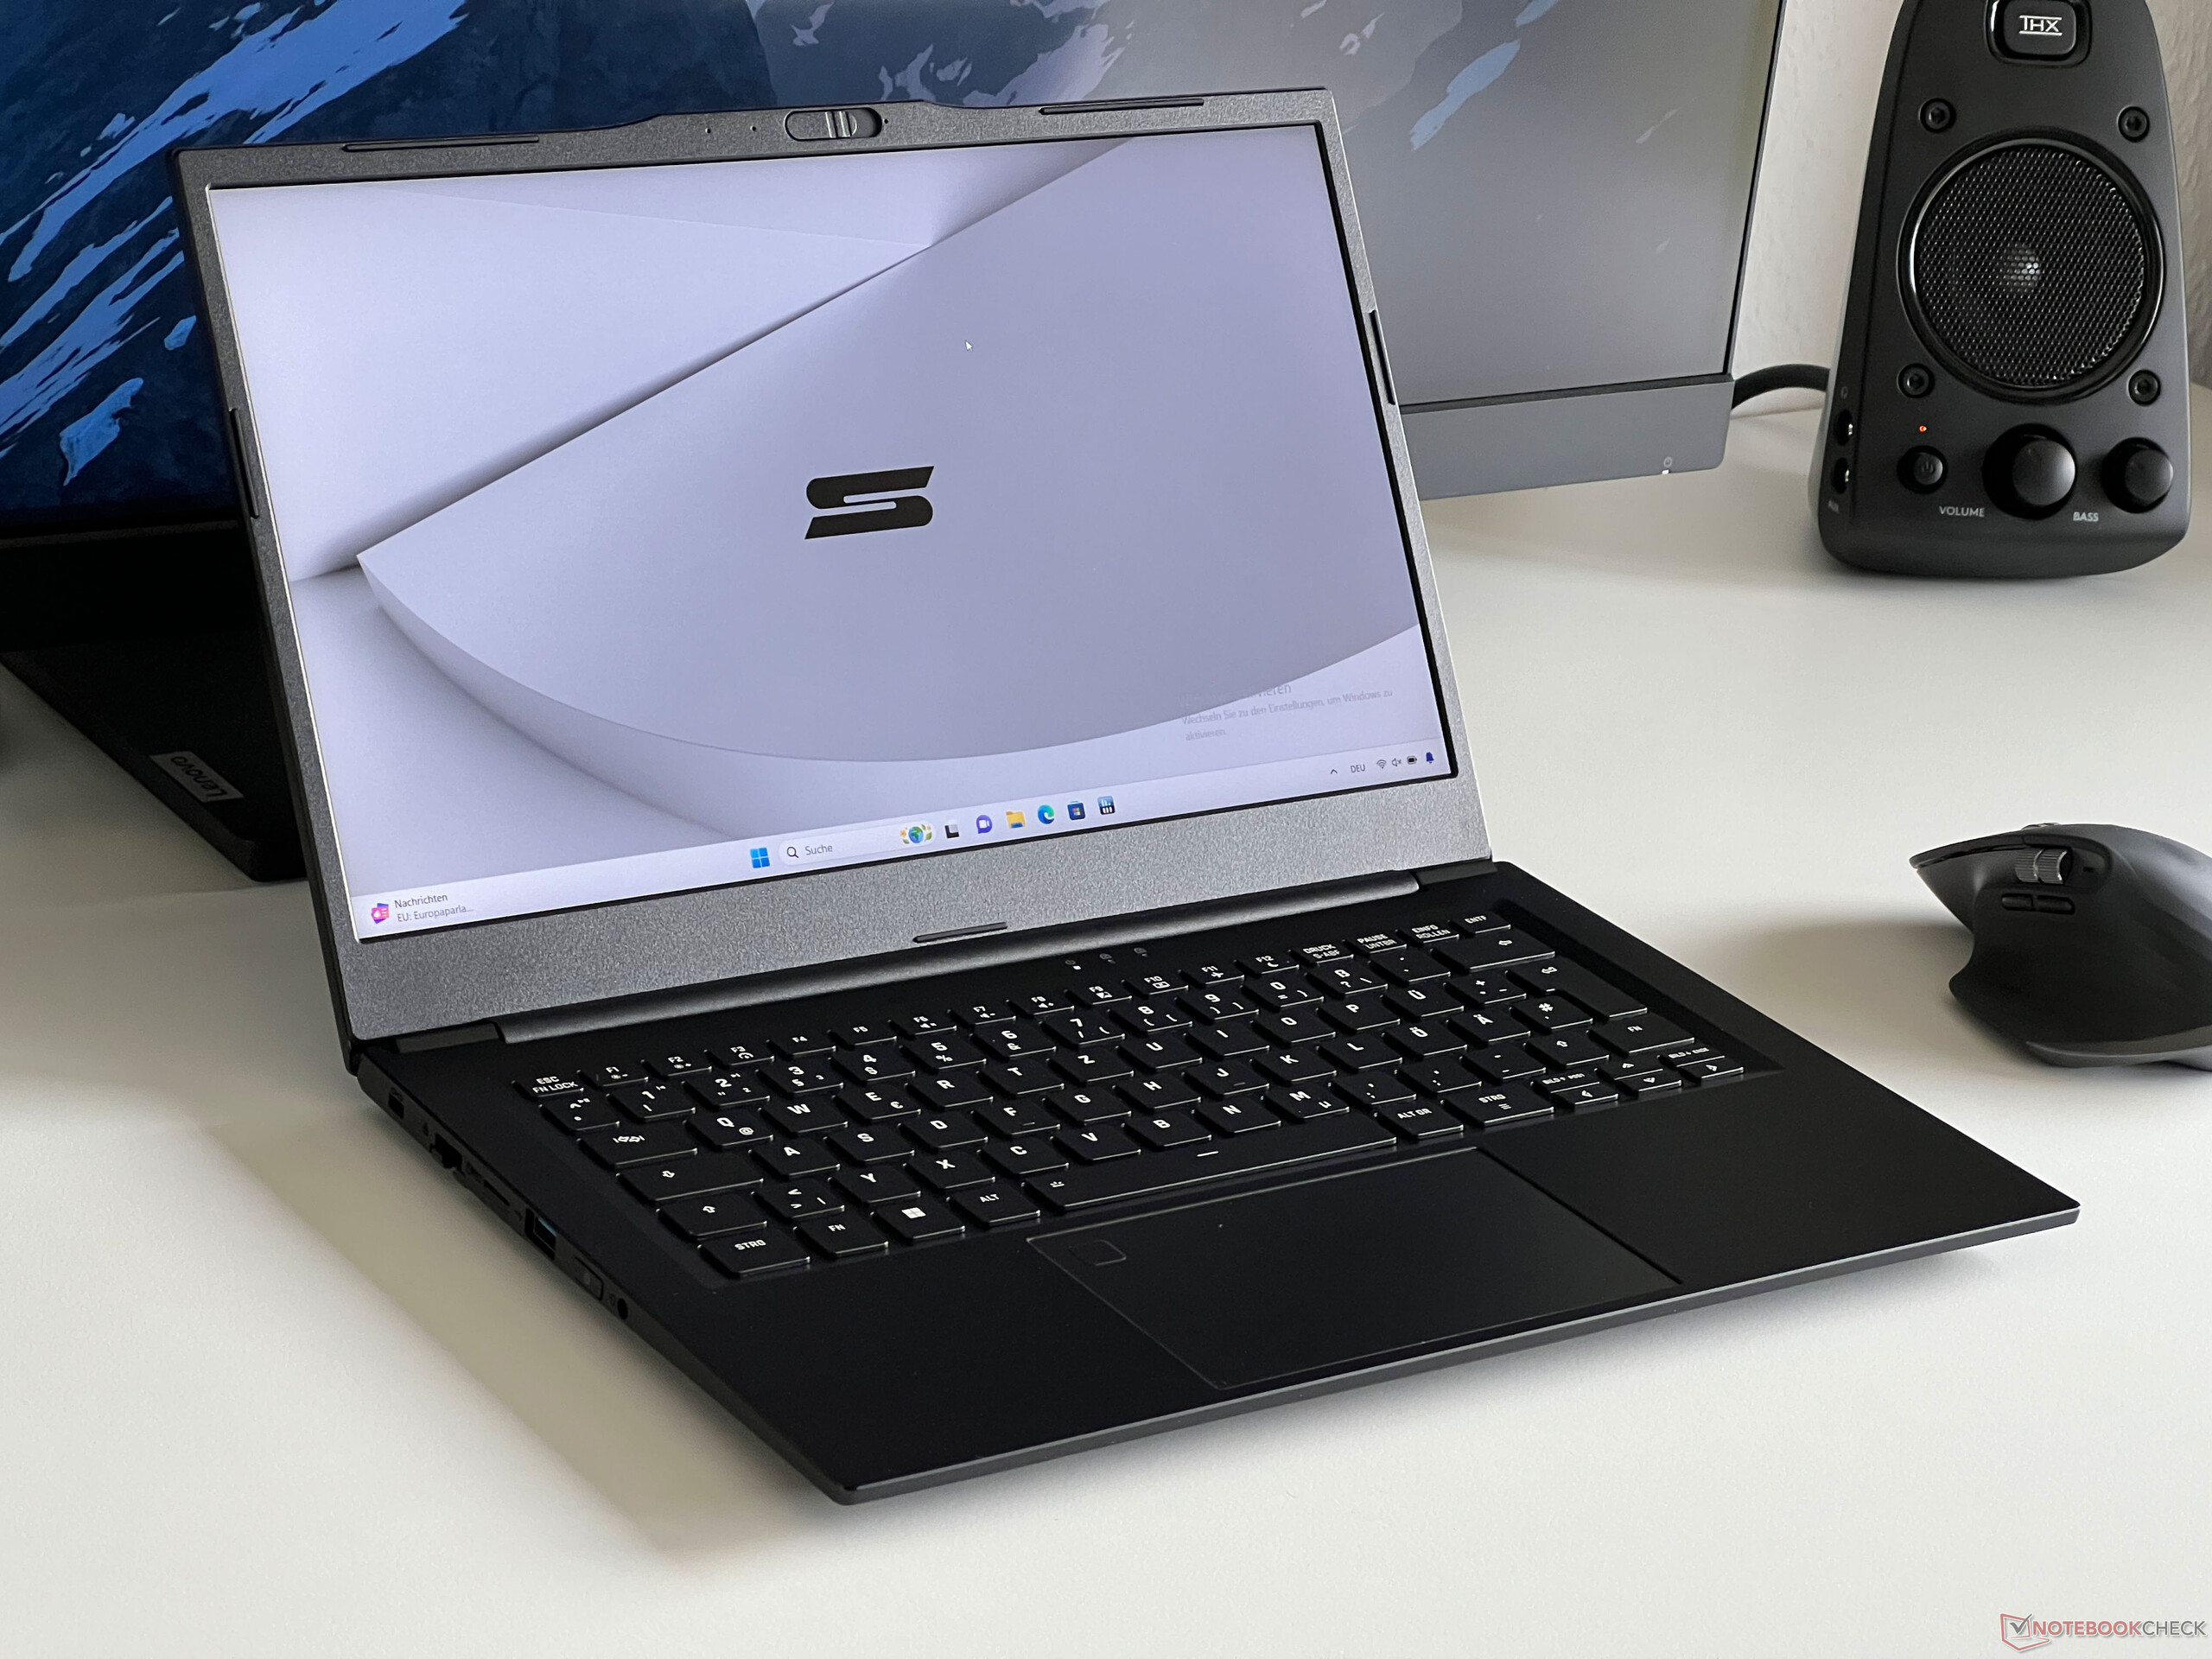
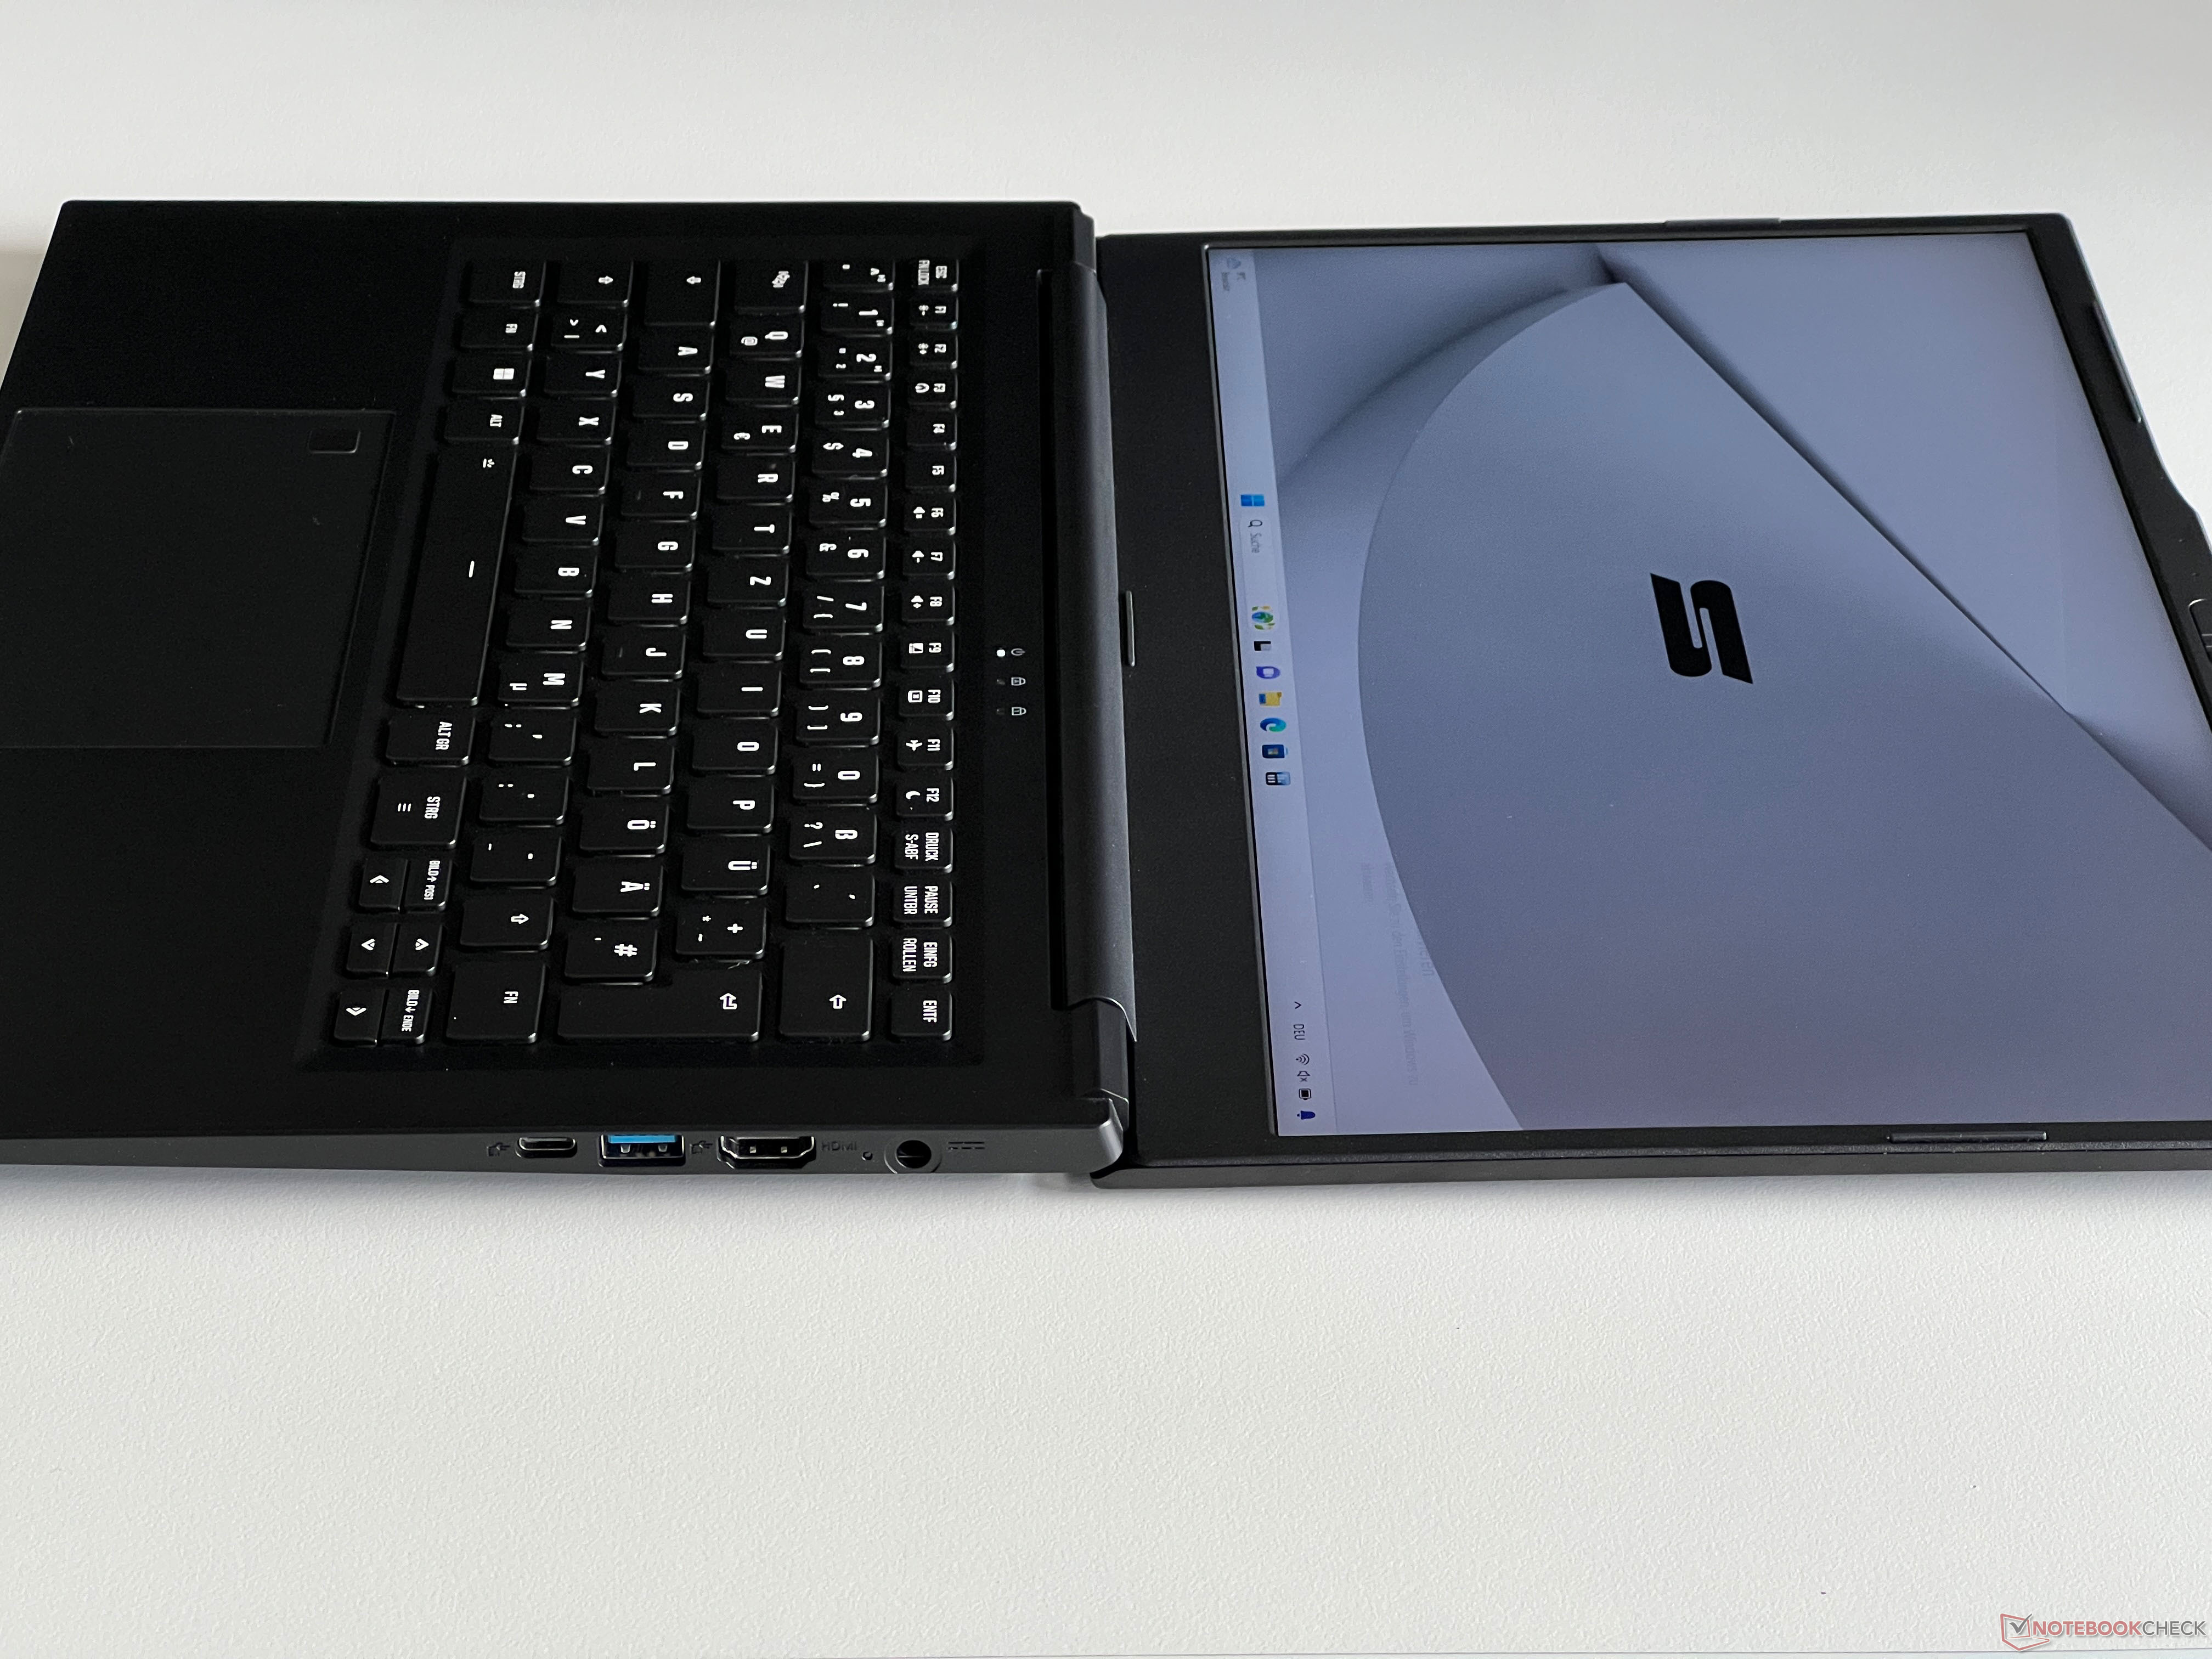
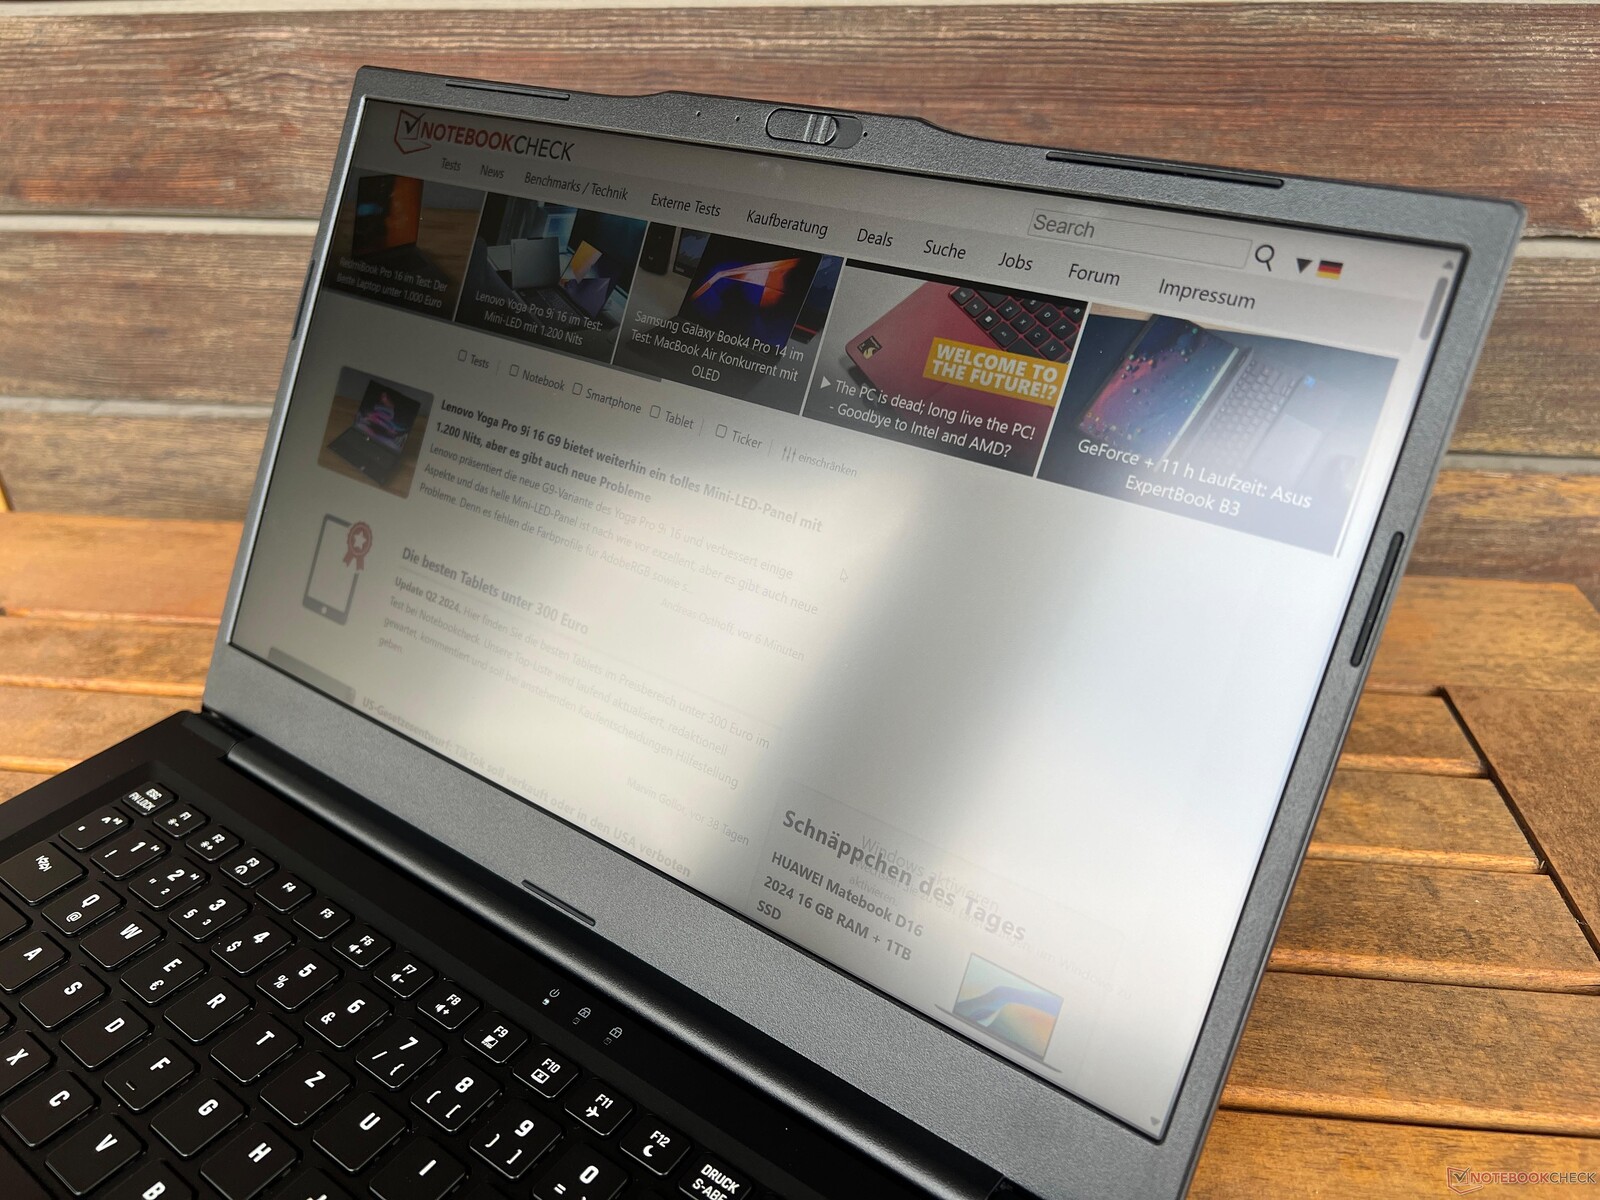
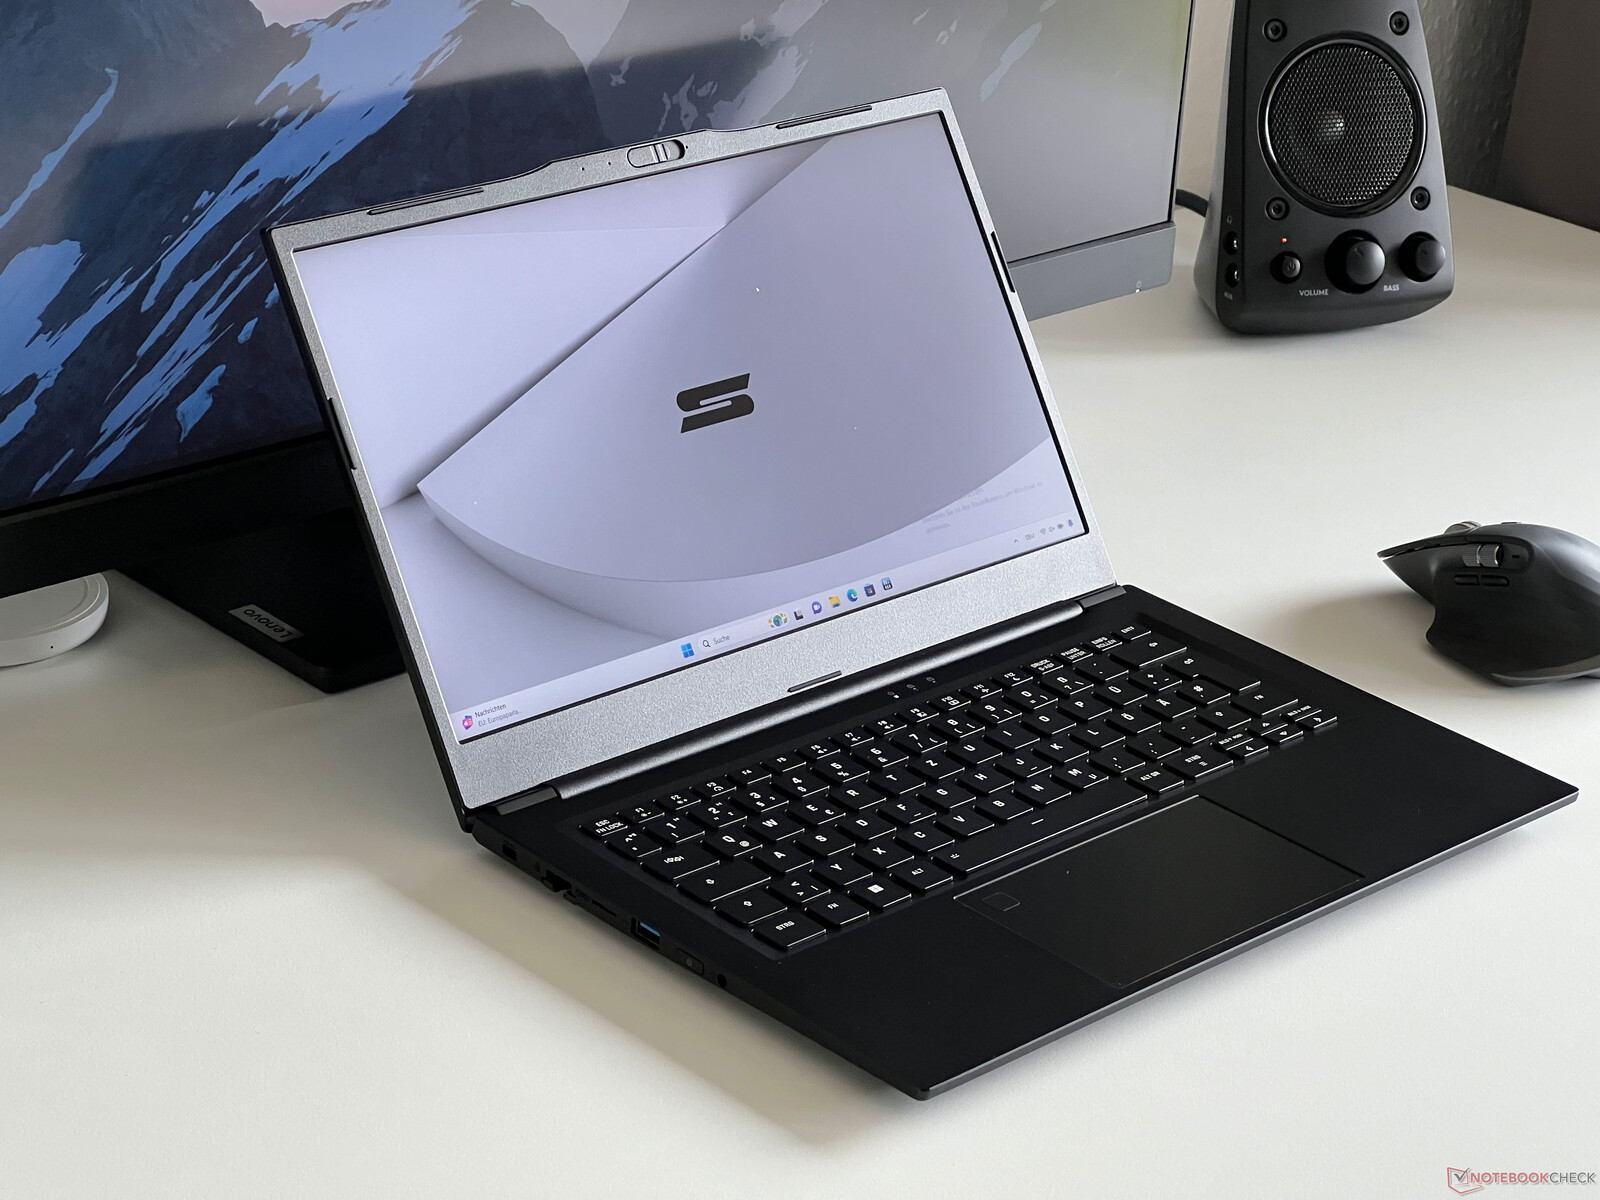
La Work 14 Base utiliza una carcasa de aluminio negro y, a primera vista, da una impresión de gran calidad. Sin embargo, sus superficies lisas son imanes extremos para las huellas dactilares y requieren una limpieza frecuente. Por un recargo, puede obtener el portátil sin el logotipo de Schenker en la tapa. Nada más abrir la tapa, lo que resulta muy fácil gracias a la joroba de la cámara no especialmente atractiva, le recibe un panel 16:9 con un marco ancho a lo largo de la parte inferior que está hecho de plástico rugoso. Esto ya no parece especialmente moderno. Su estabilidad está bien, sin embargo, notamos algunos ligeros crujidos al girar el portátil y, más notablemente, al abrir la pantalla (ángulo máximo de apertura 180 grados).
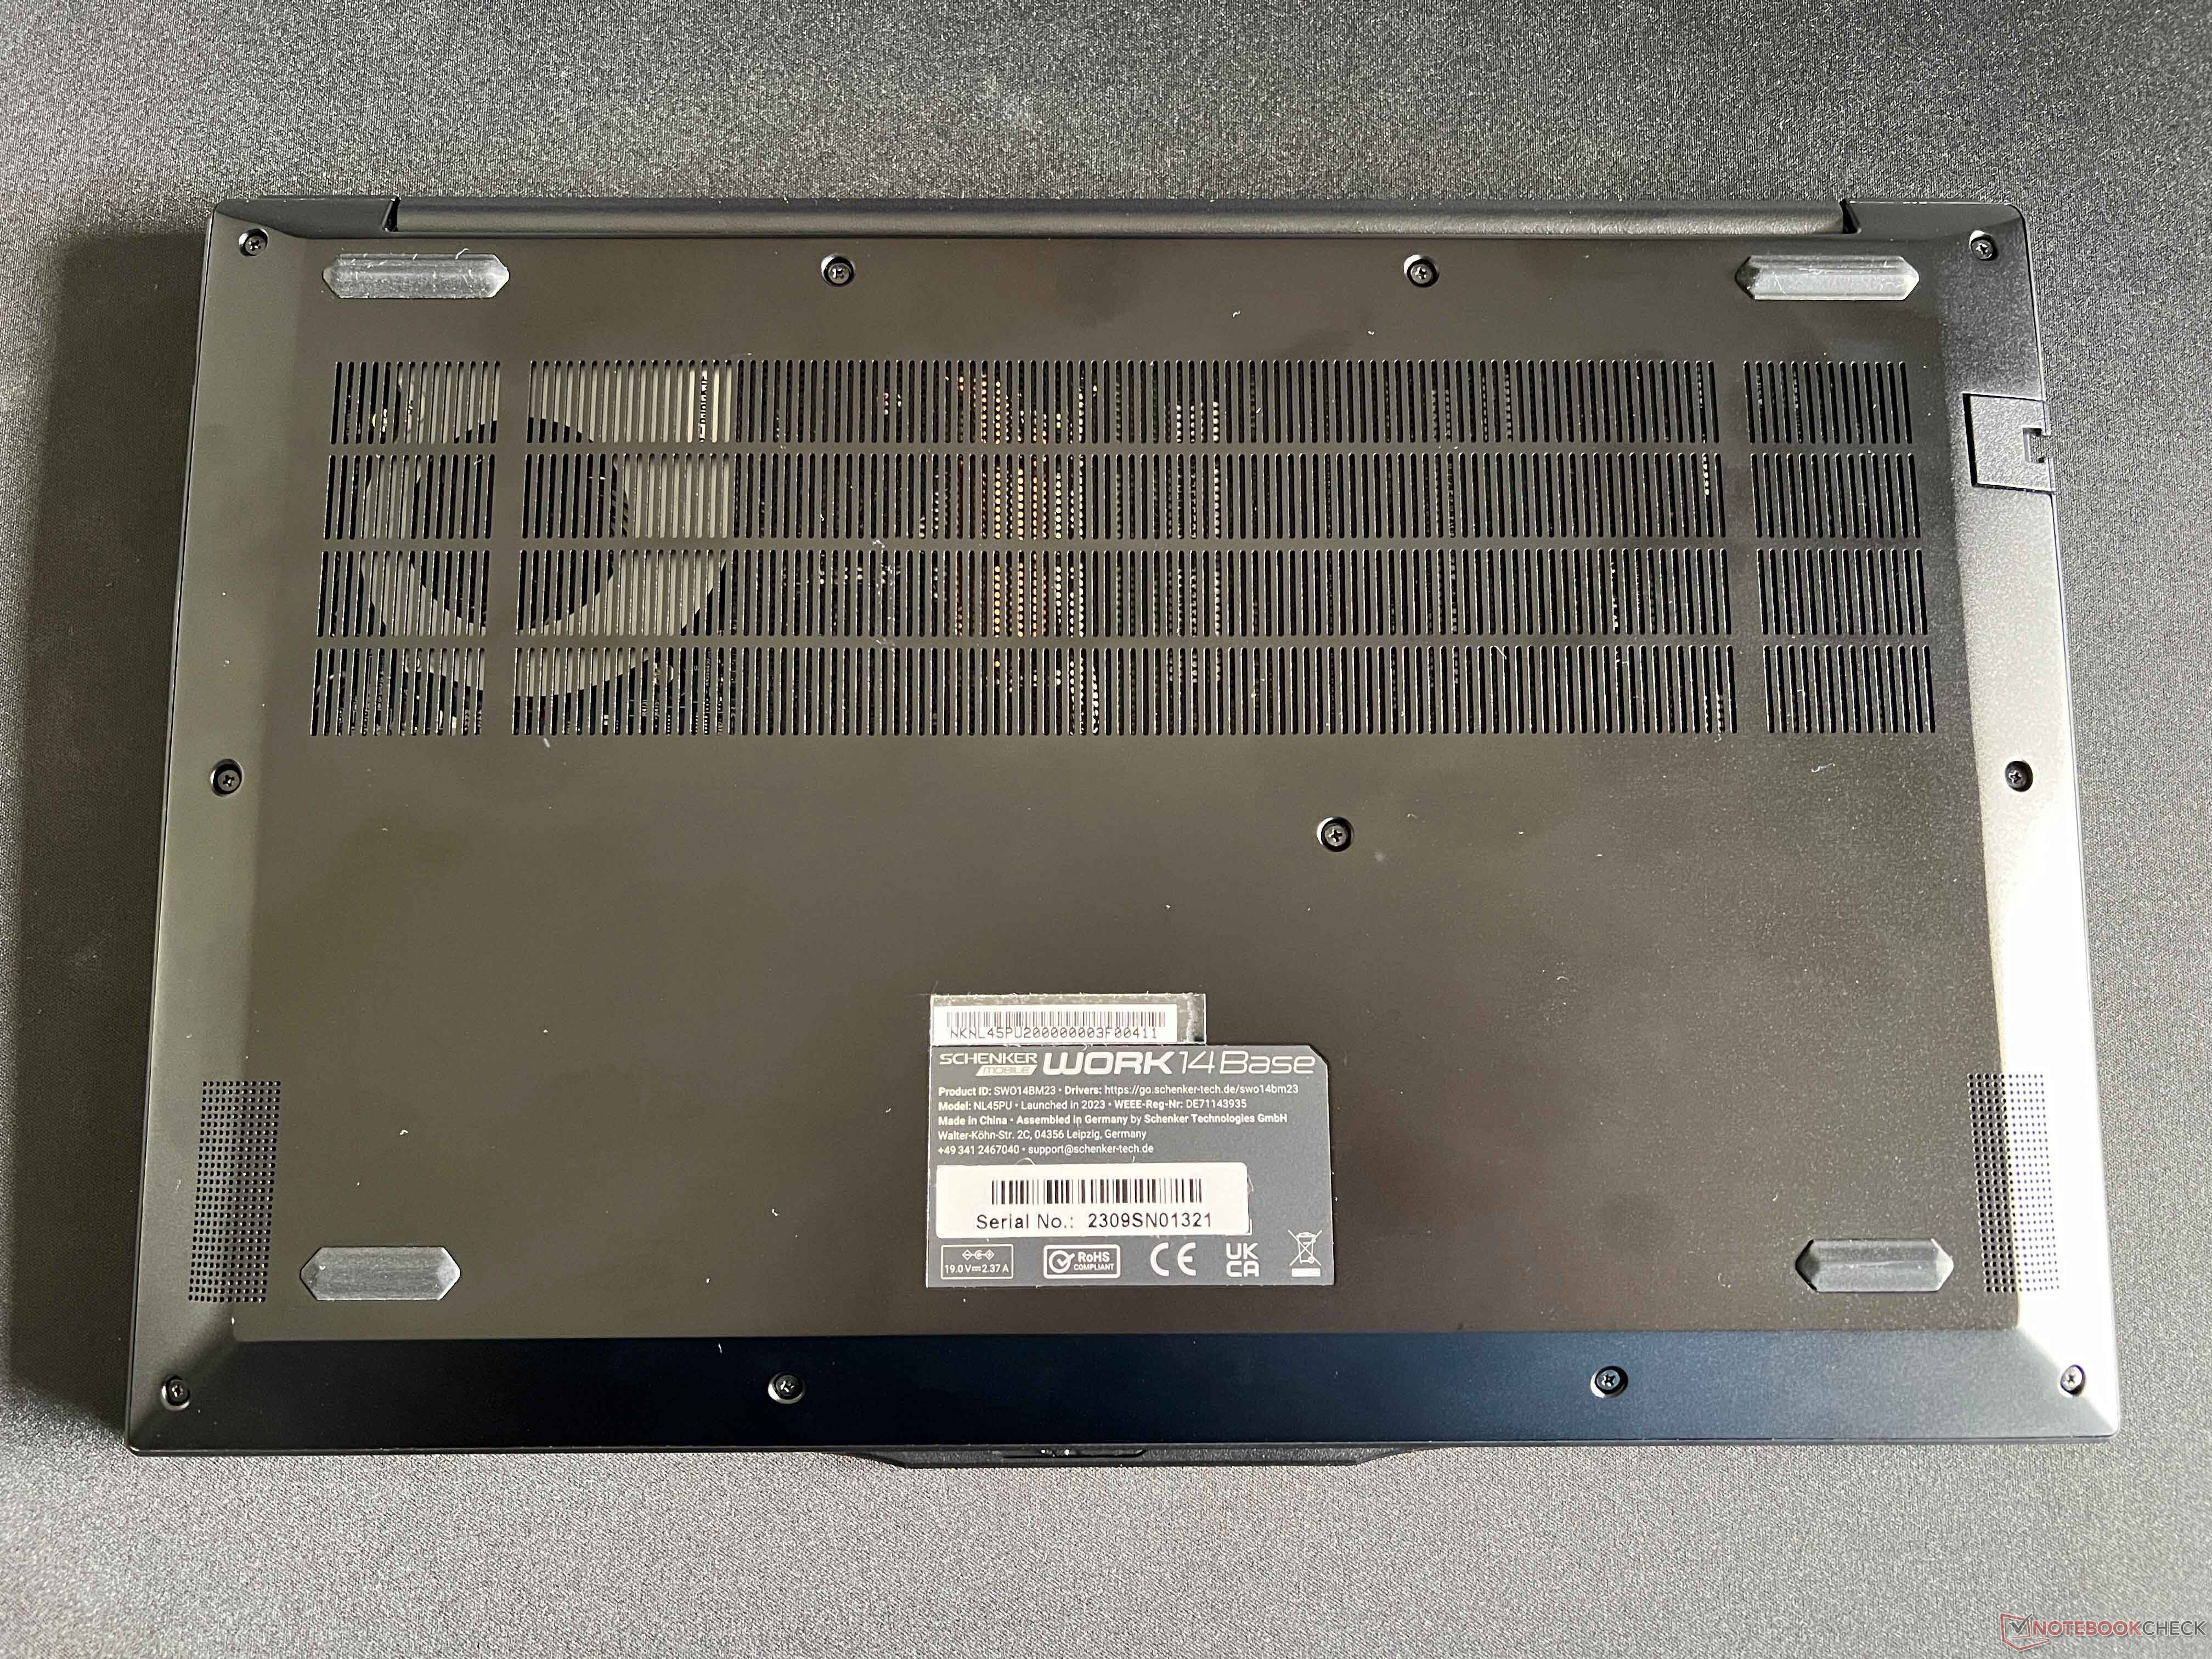
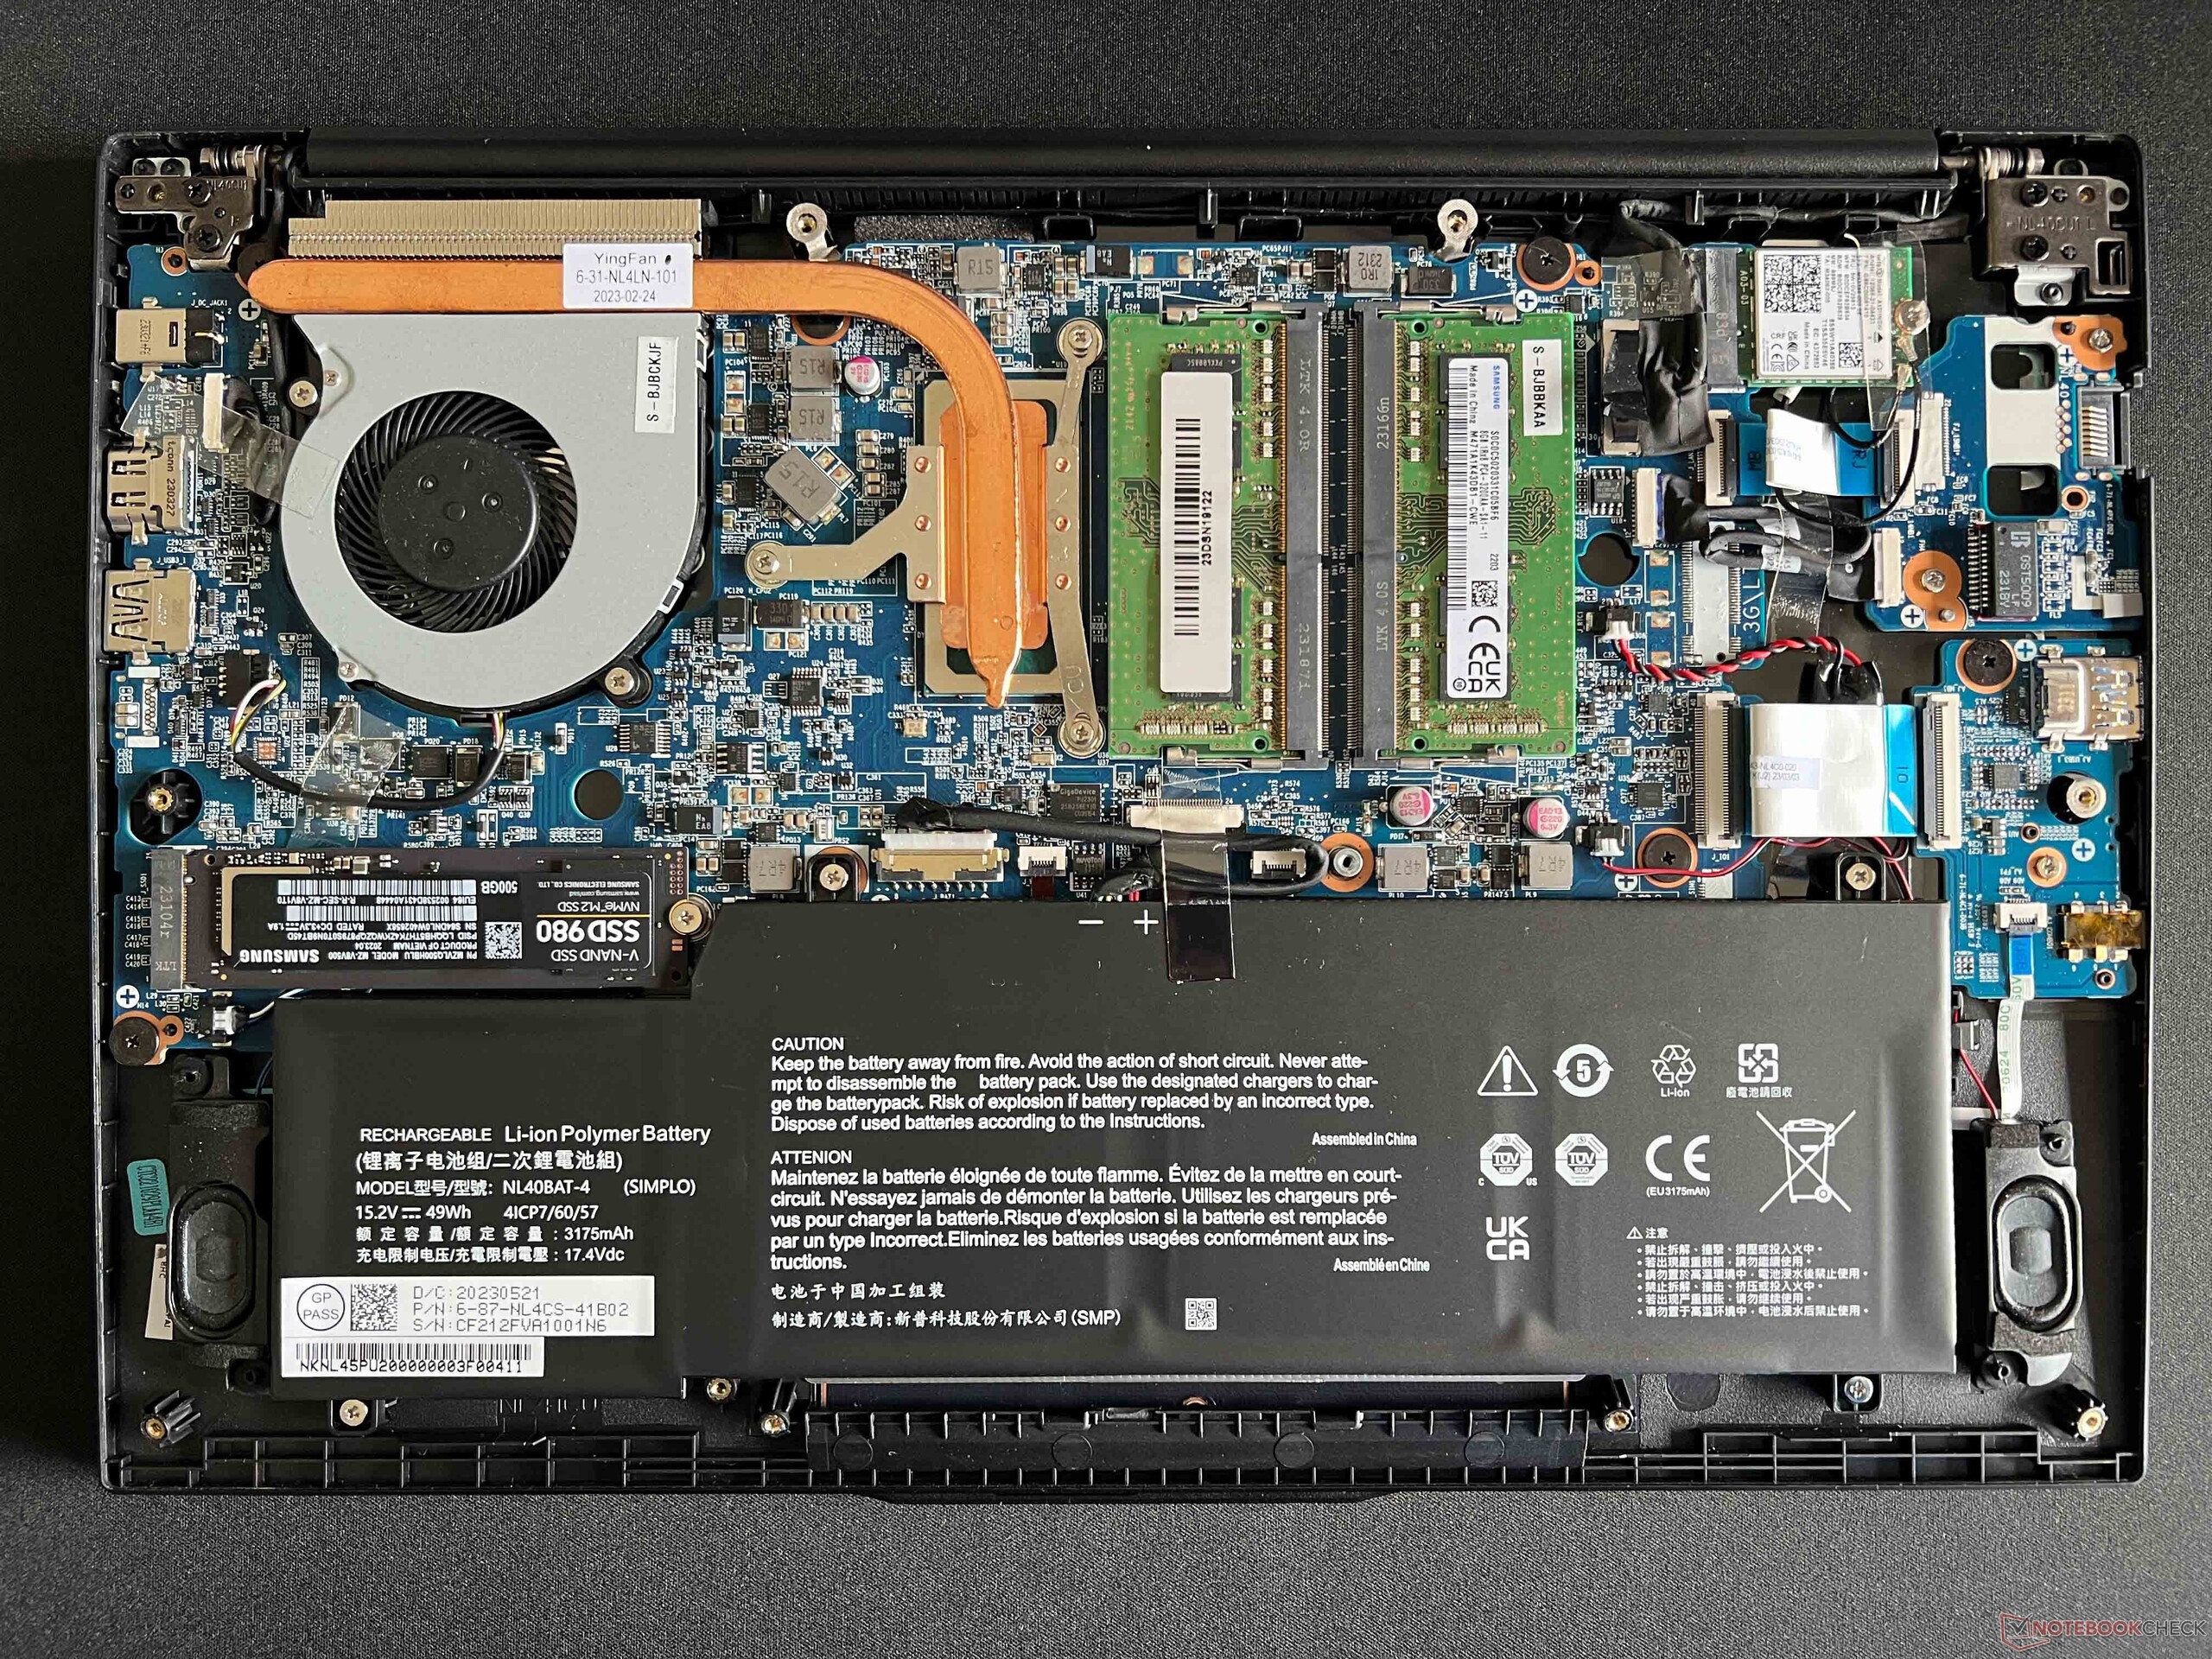
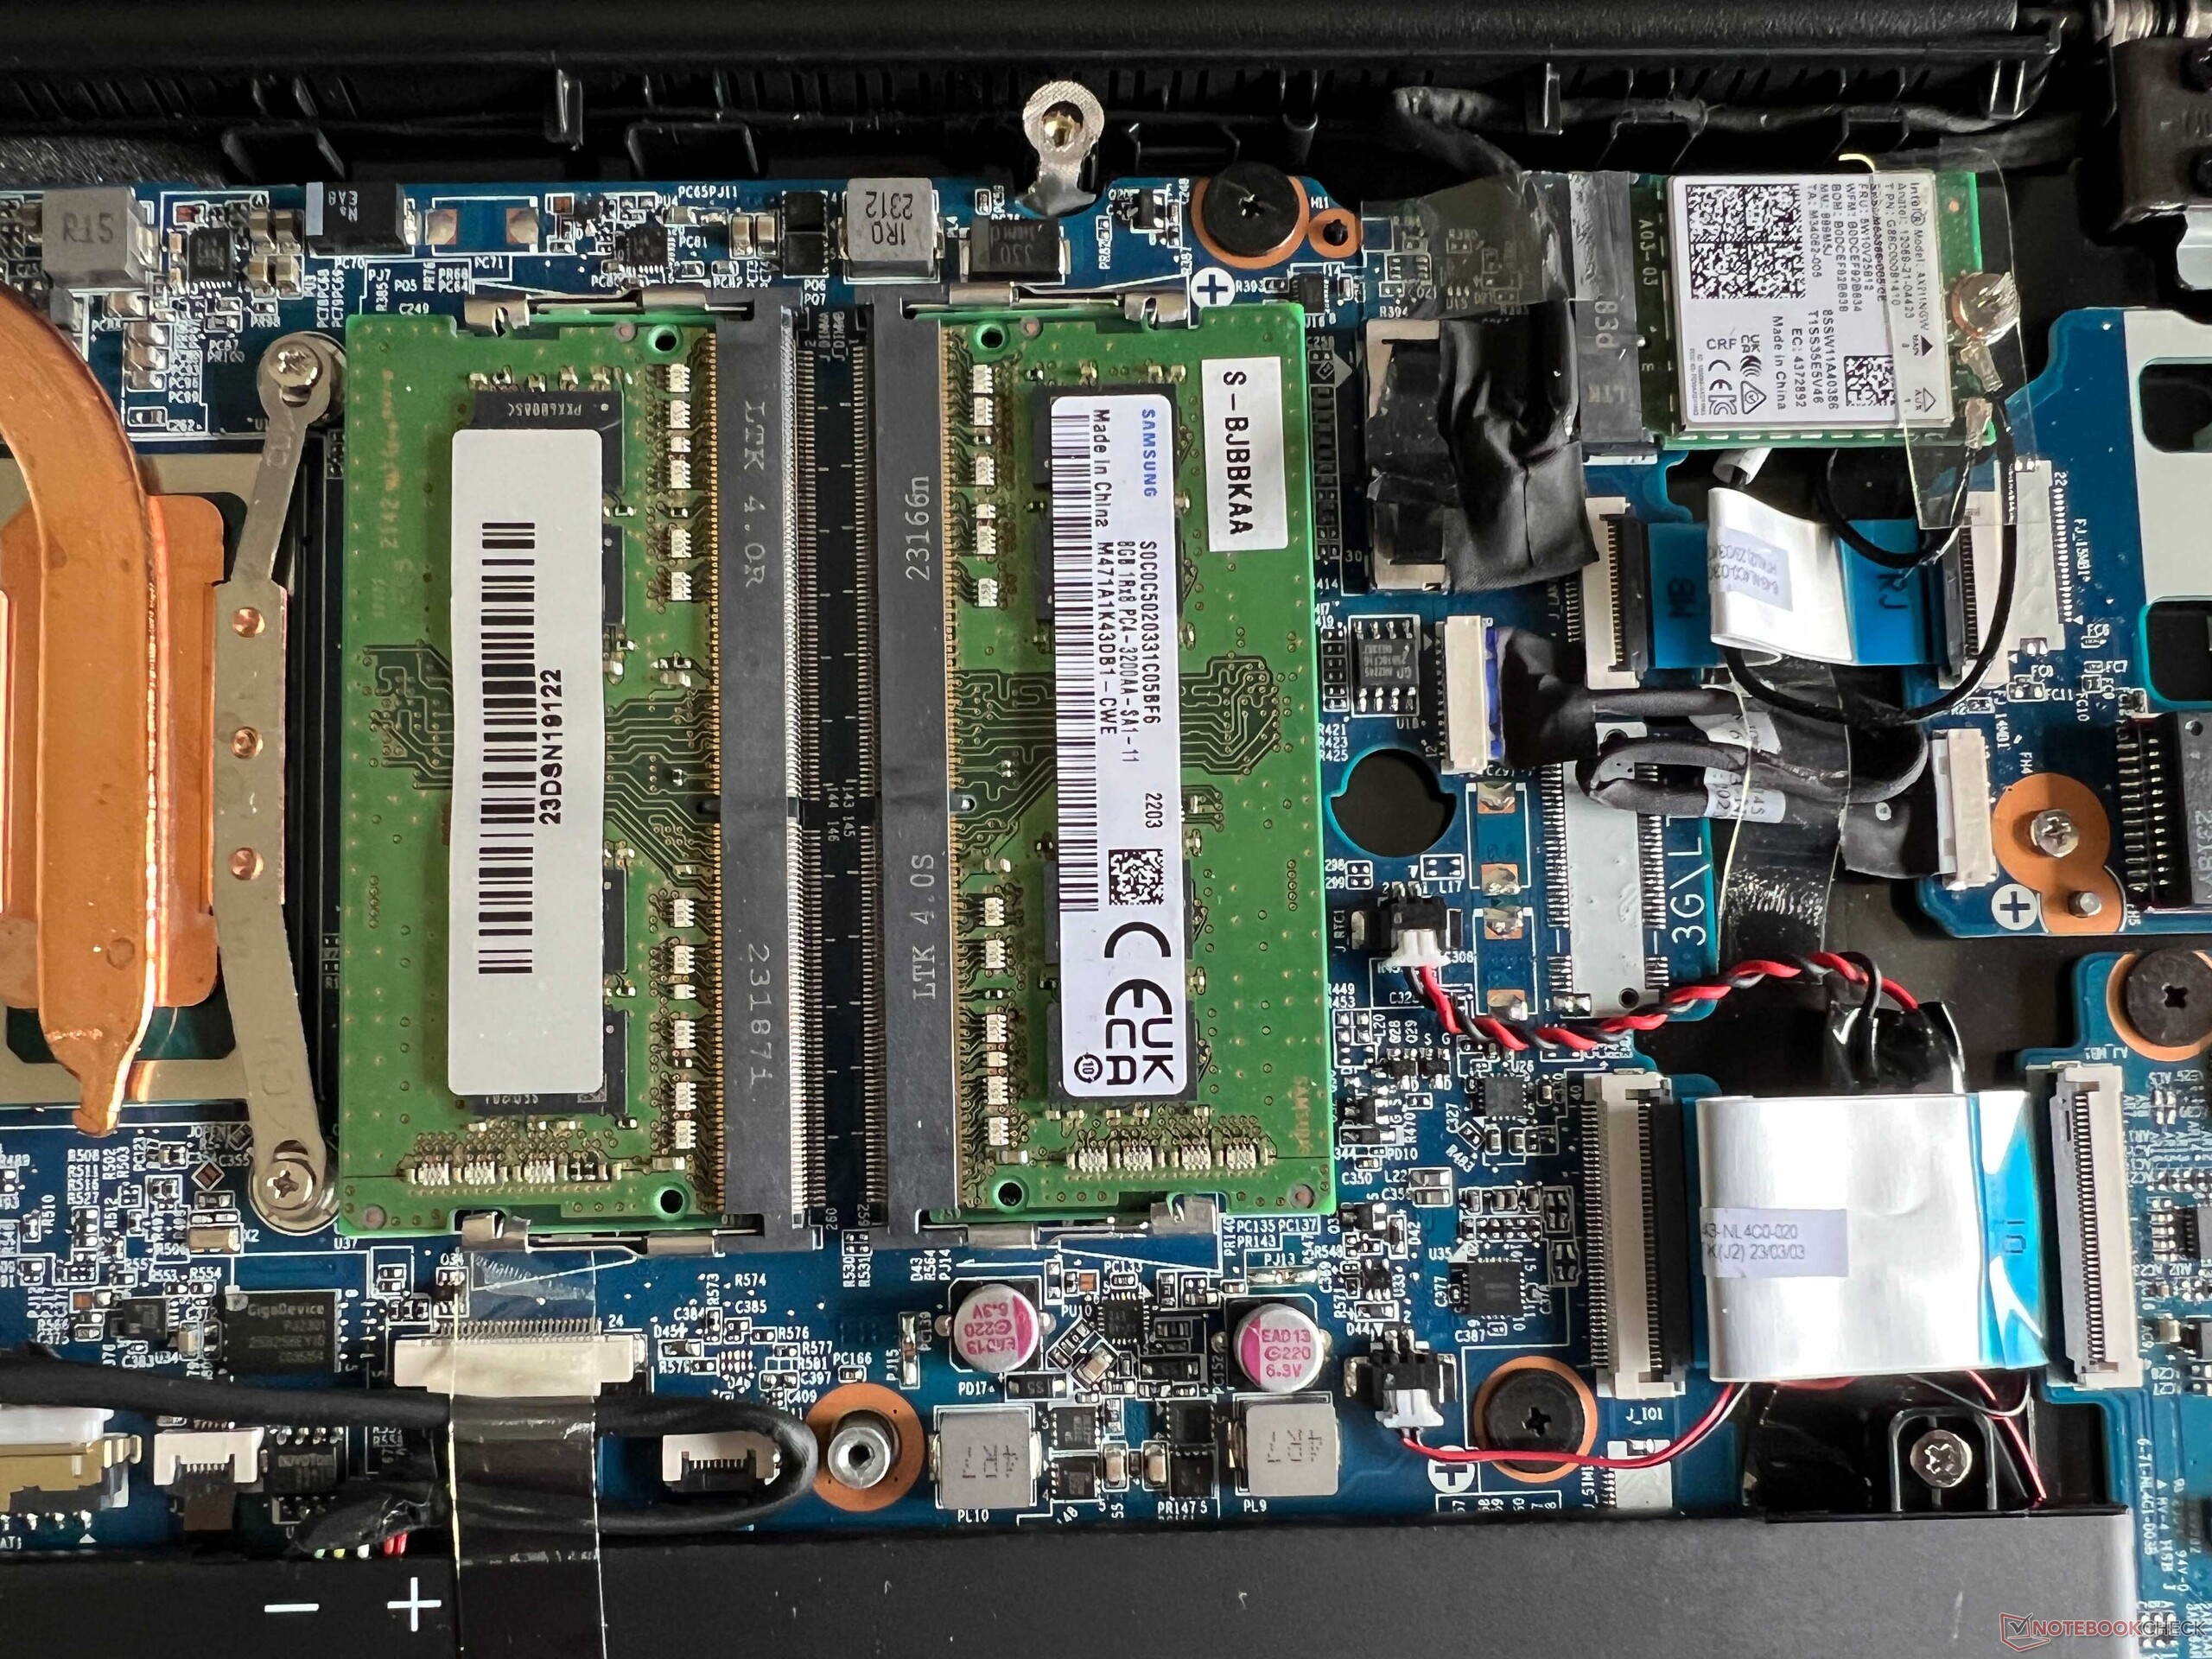
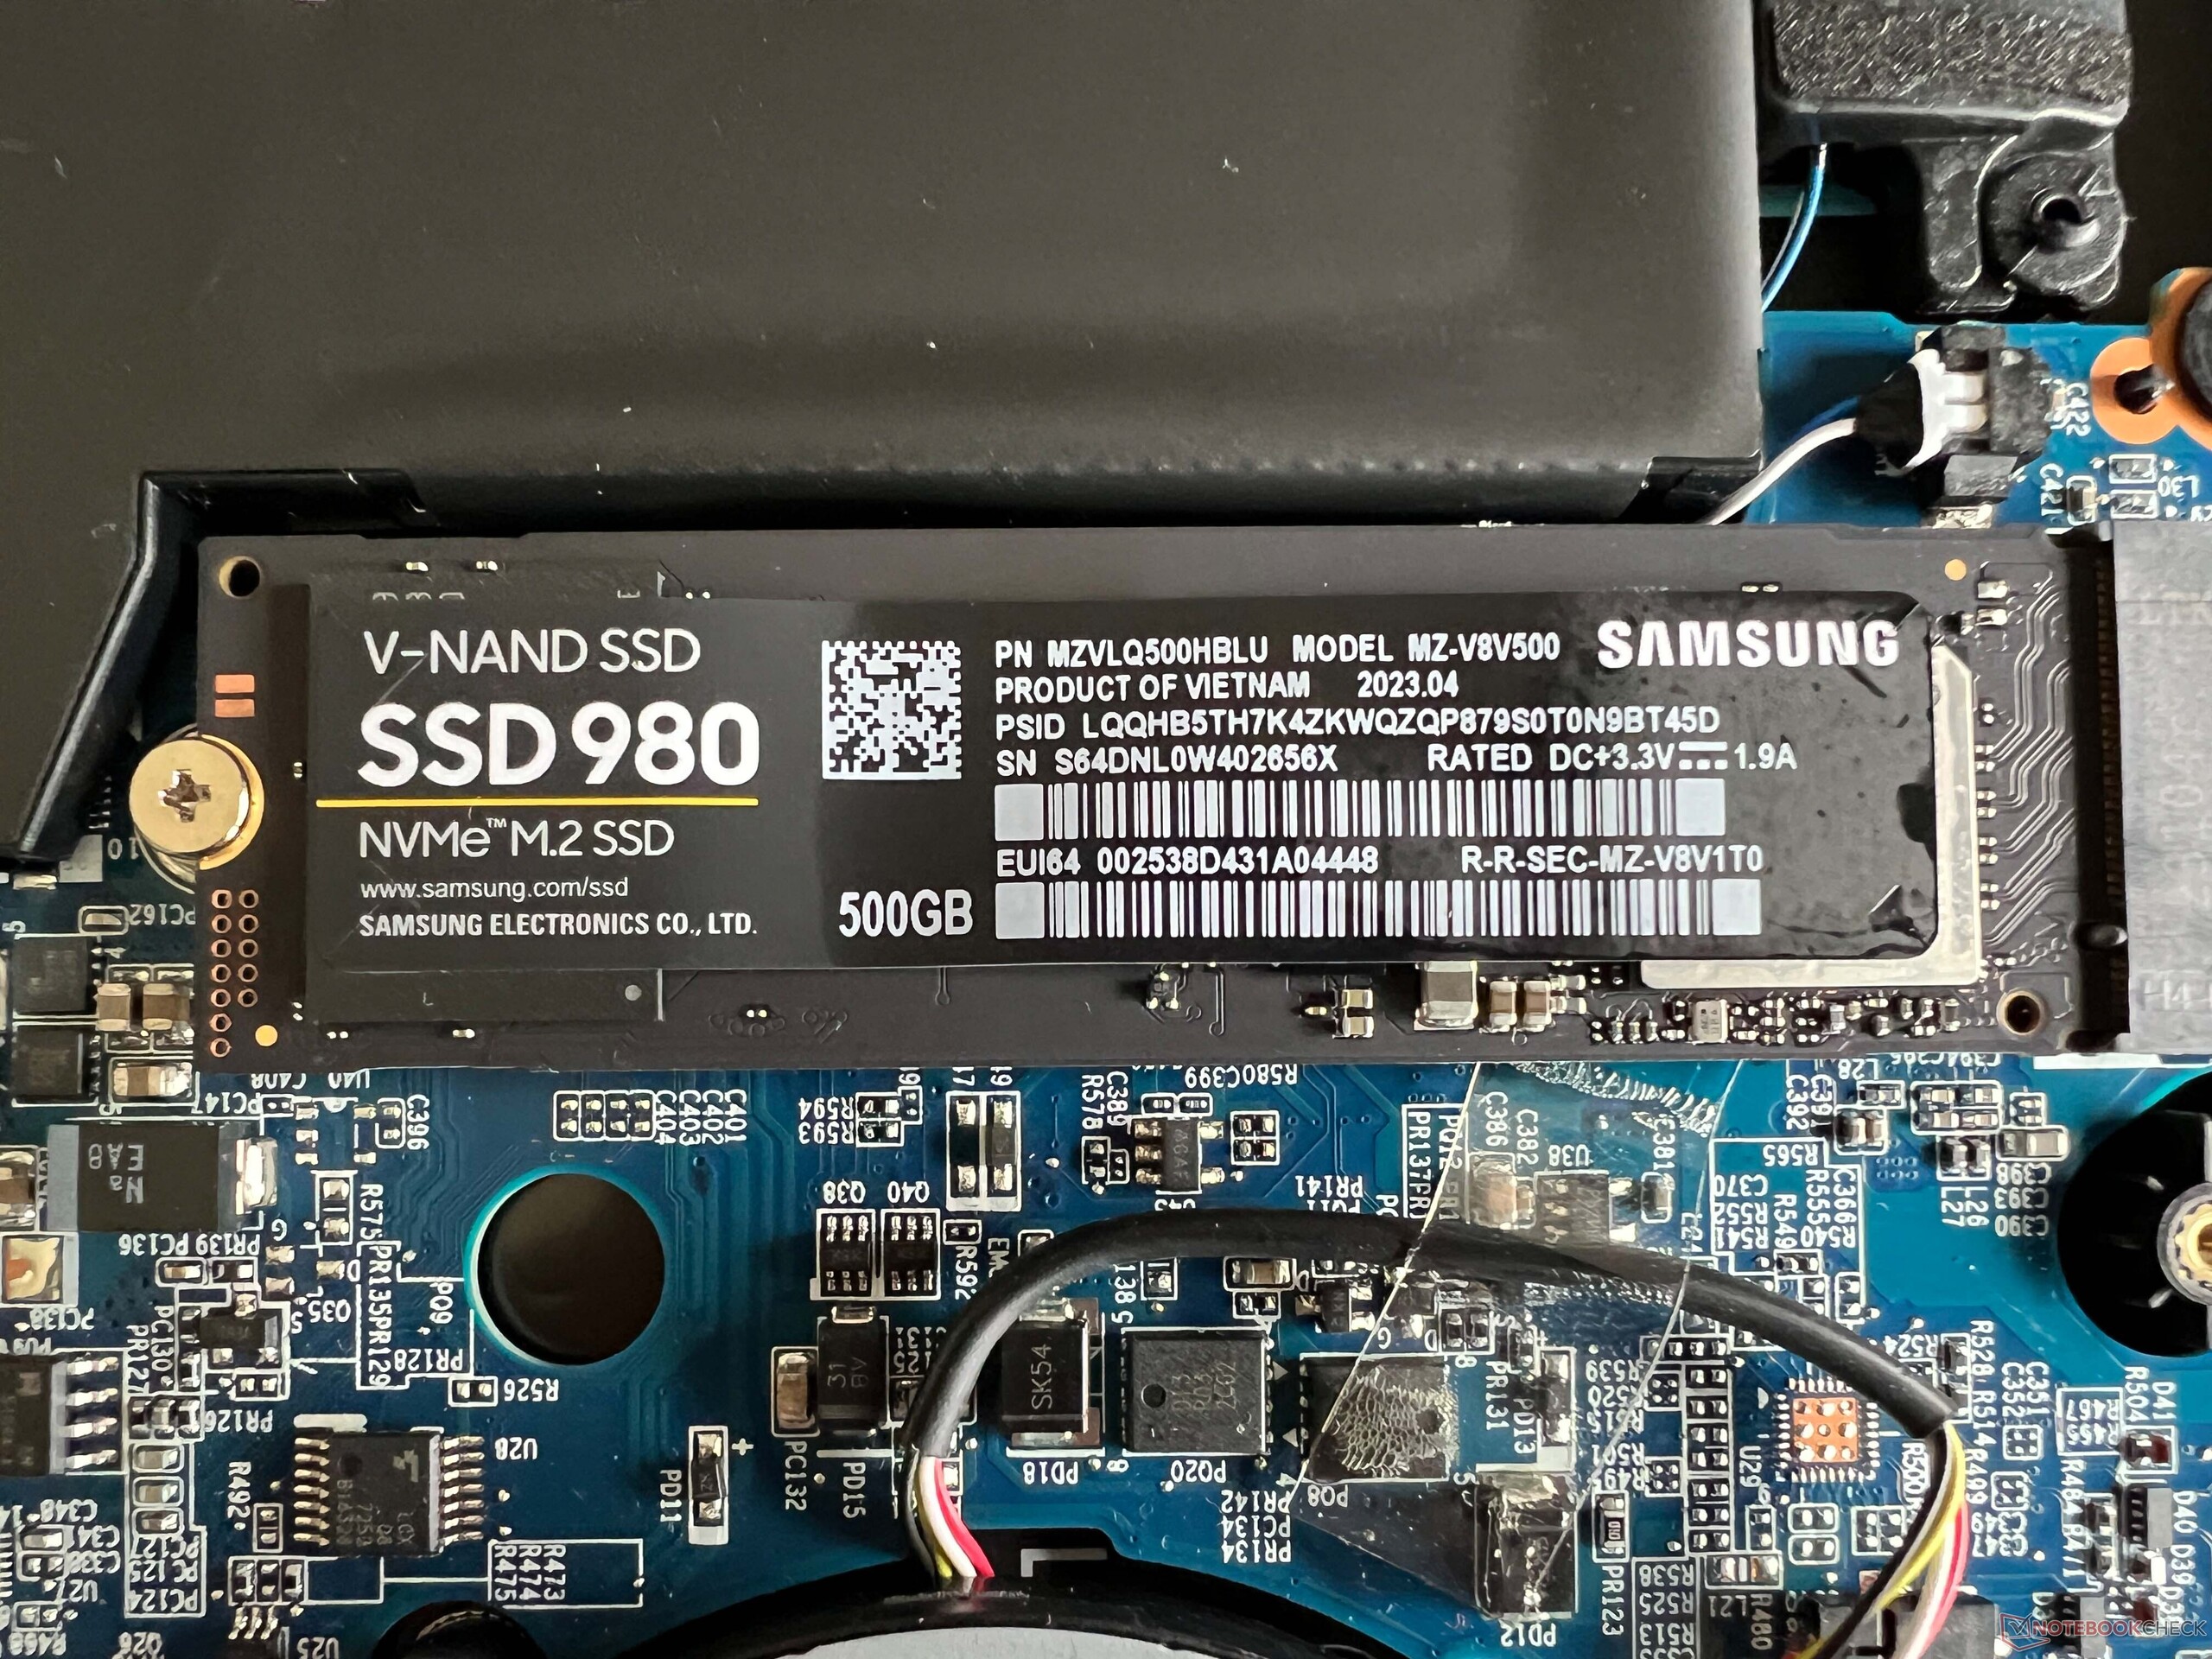
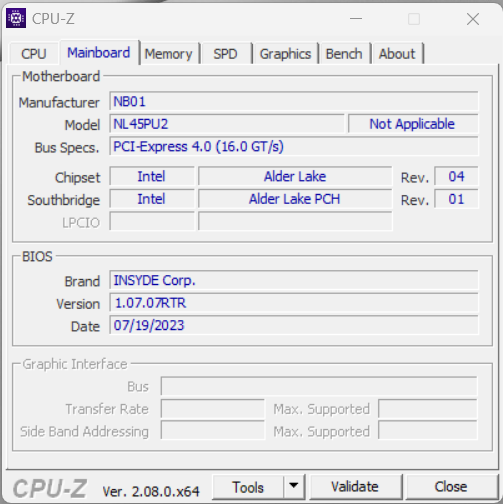
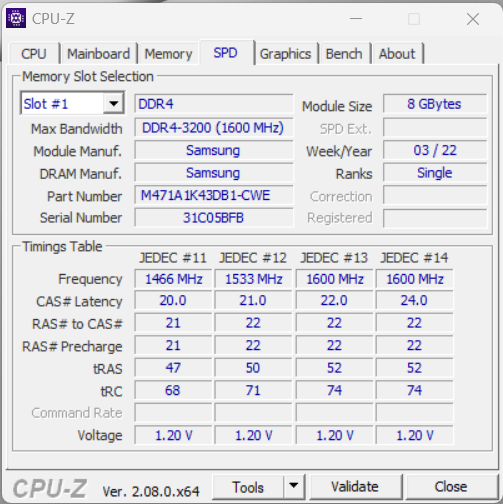
La cubierta inferior está asegurada por tornillos Philips normales y puede retirarse fácilmente. Las opciones de actualización del portátil son excelentes, ya que hay dos ranuras de RAM disponibles y, por supuesto, los modelos SSD y WLAN también pueden actualizarse. De hecho, este dispositivo ya está equipado con un módulo WLAN bastante moderno de Intel (AX211) y sus velocidades de transferencia también son excelentes.
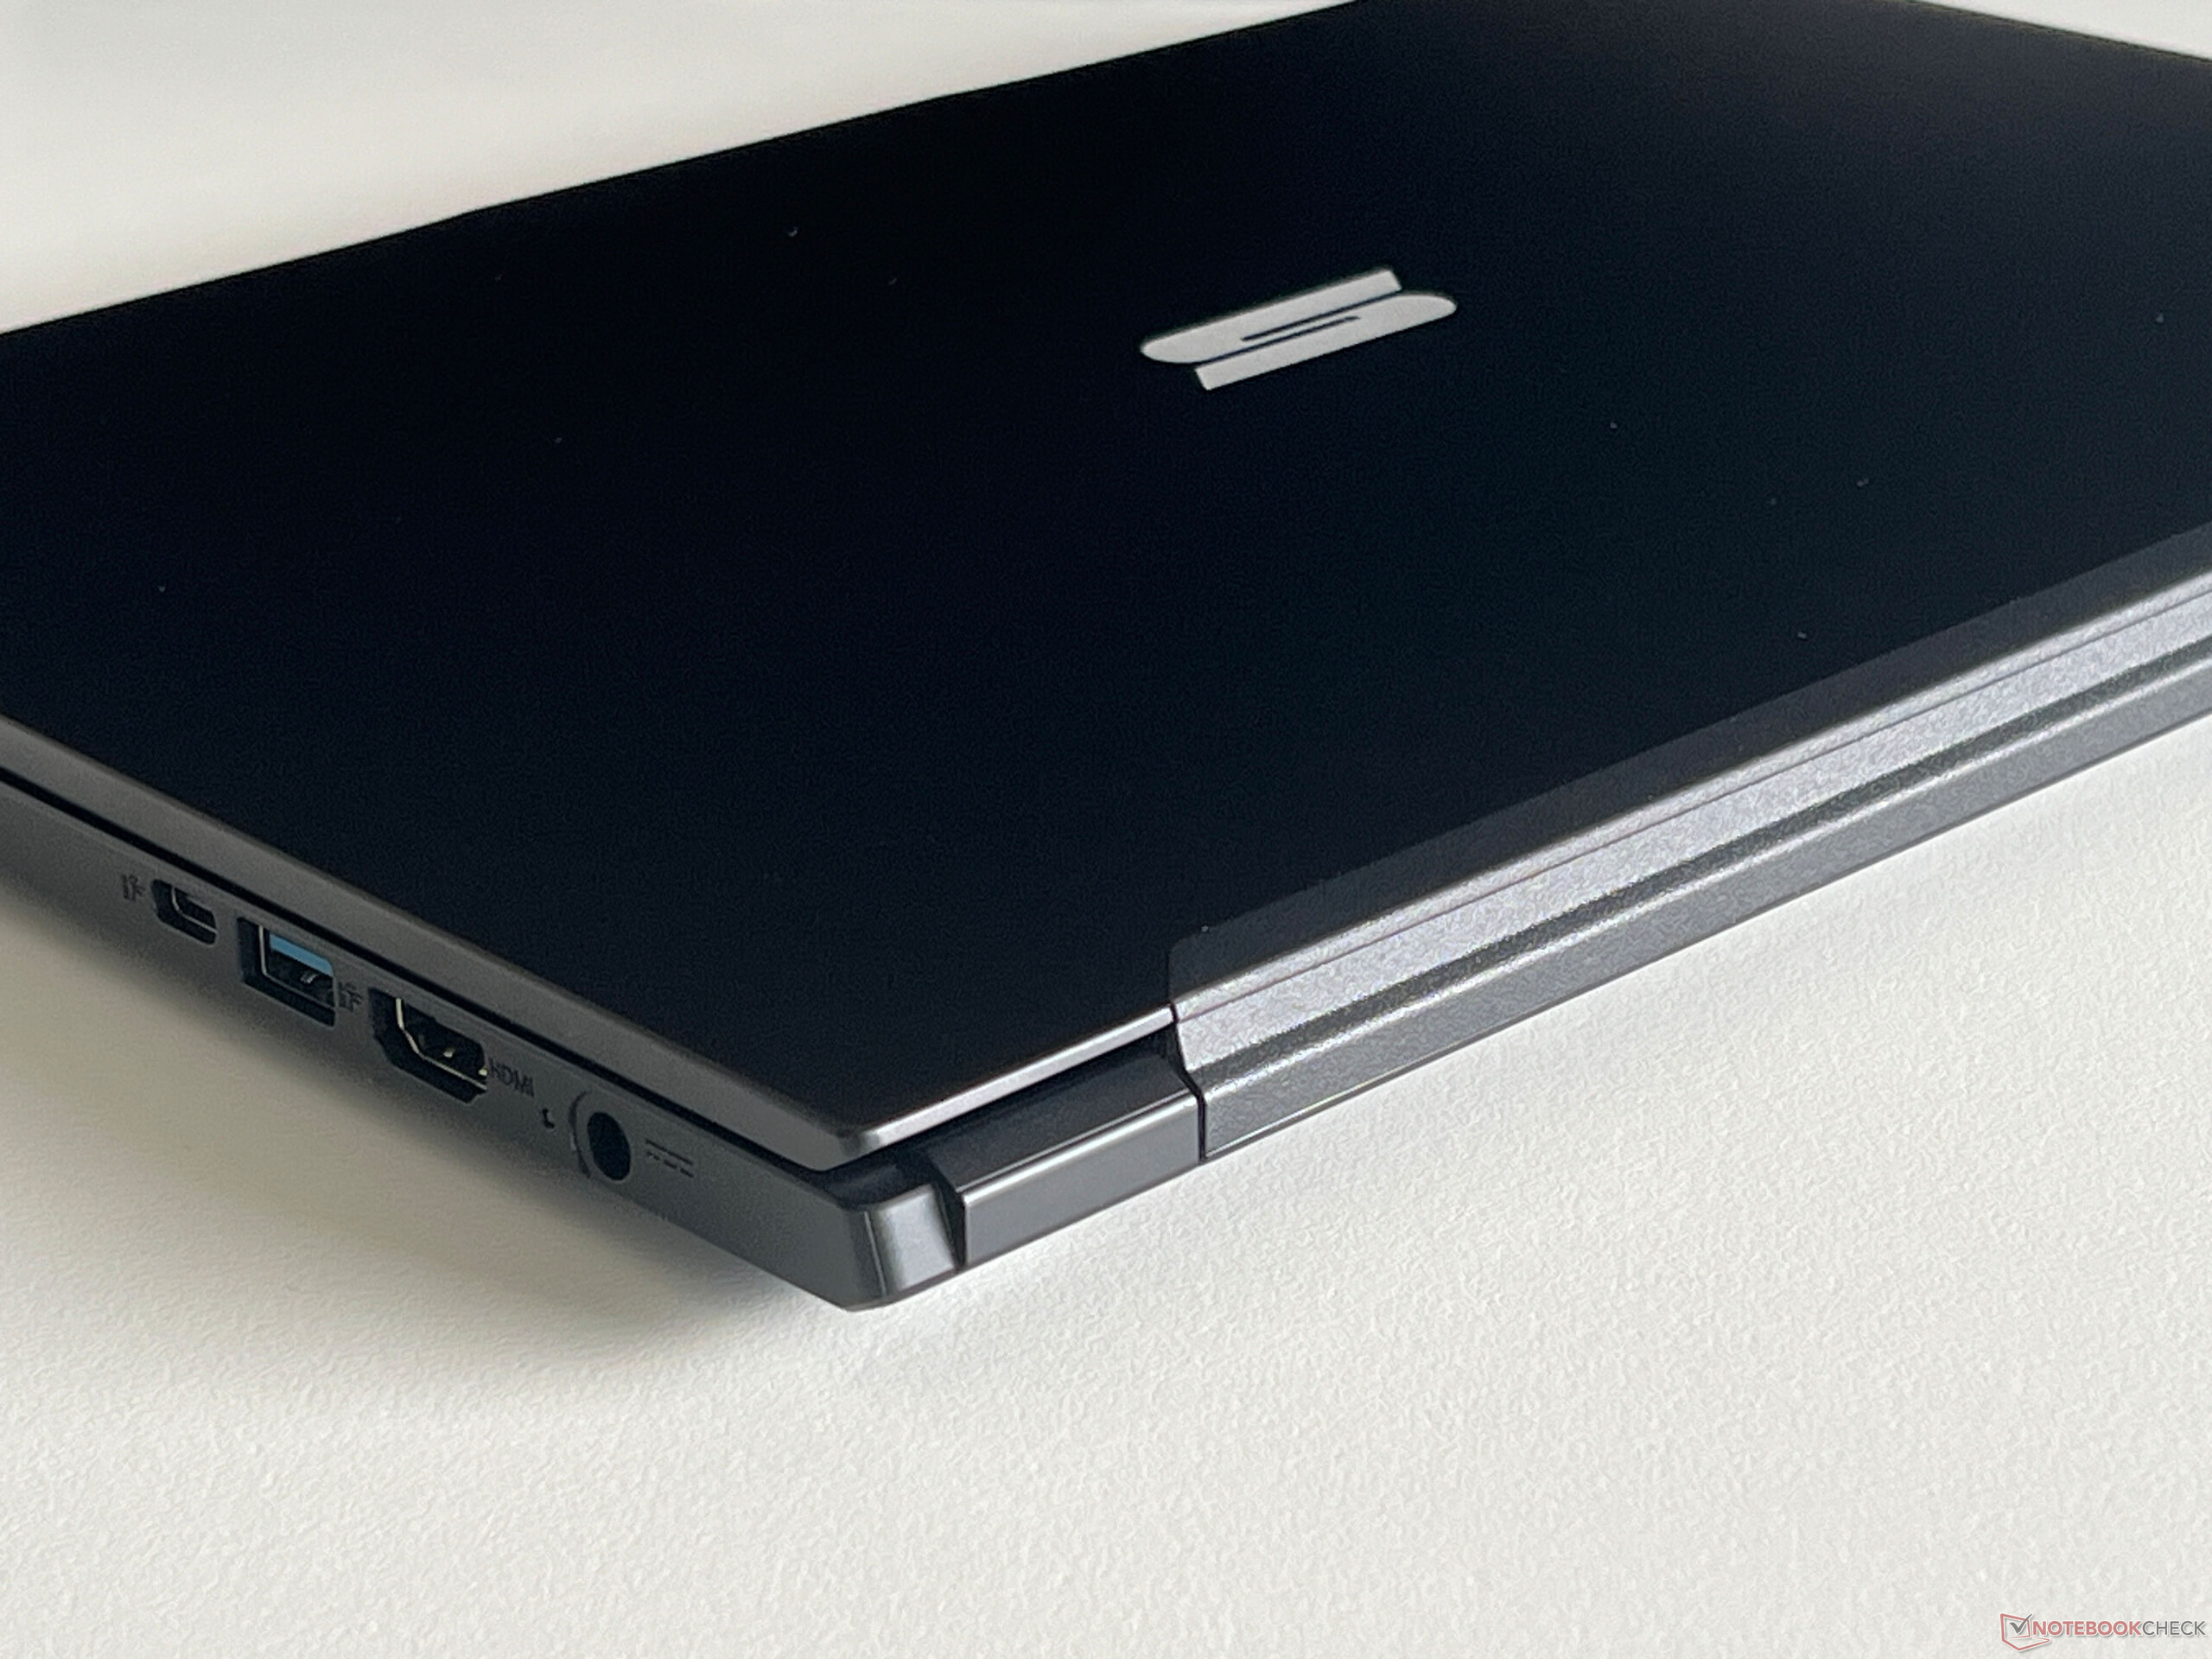
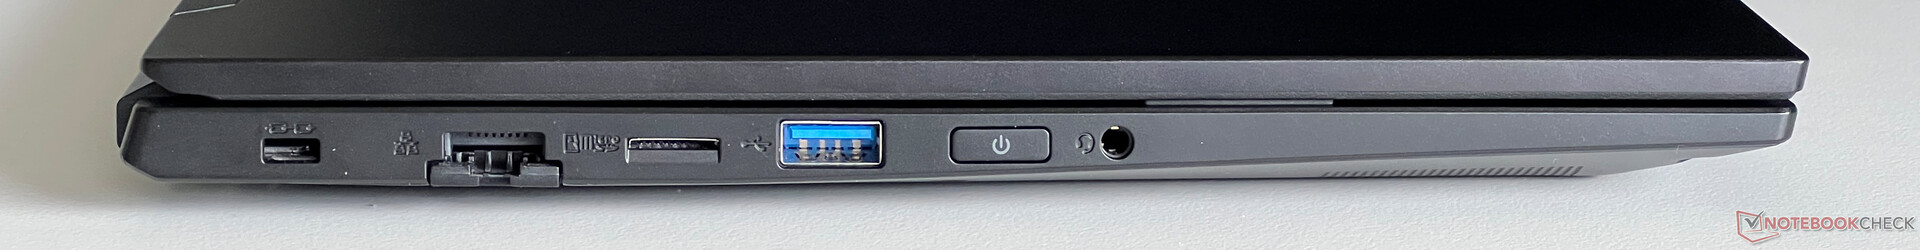
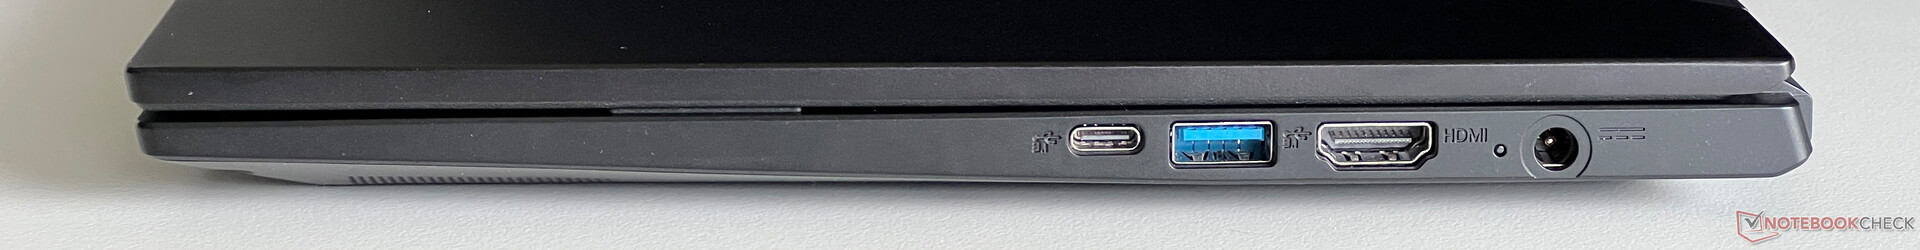
Las opciones de conectividad son otro de los puntos fuertes del Work 14. Aunque tendrá que prescindir de USB 4.0 y Thunderbolt, cuenta con suficientes conexiones USB y también puede hacer uso de estaciones de acoplamiento USB-C sin problemas. Además, cuenta con un puerto Gigabit Ethernet. Su cámara web de 1080p que incluye una cubierta mecánica toma fotos de aspecto medio.
| SD Card Reader | |
| average JPG Copy Test (av. of 3 runs) | |
| Schenker Work 14 Base (Angelbird AV Pro V60) | |
| Lenovo ThinkPad L14 G4 21H6S00900 | |
| Media de la clase Office (19.8 - 198.5, n=22, últimos 2 años) | |
| Acer Swift Go 14 SFG14-71 | |
| maximum AS SSD Seq Read Test (1GB) | |
| Lenovo ThinkPad L14 G4 21H6S00900 (AV Pro V60) | |
| Schenker Work 14 Base (Angelbird AV Pro V60) | |
| Media de la clase Office (27.4 - 249, n=21, últimos 2 años) | |
| Acer Swift Go 14 SFG14-71 (AV Pro SD microSD 128 GB V60) | |
| Networking | |
| Schenker Work 14 Base | |
| iperf3 transmit AXE11000 | |
| iperf3 receive AXE11000 | |
| Acer Swift Go 14 SFG14-71 | |
| iperf3 transmit AXE11000 | |
| iperf3 receive AXE11000 | |
| iperf3 transmit AXE11000 6GHz | |
| iperf3 receive AXE11000 6GHz | |
| HP ProBook 445 G10 | |
| iperf3 transmit AXE11000 | |
| iperf3 receive AXE11000 | |
| Dell Latitude 3440 | |
| iperf3 transmit AXE11000 | |
| iperf3 receive AXE11000 | |
| iperf3 transmit AXE11000 6GHz | |
| iperf3 receive AXE11000 6GHz | |
| Lenovo ThinkPad L14 G4 21H6S00900 | |
| iperf3 transmit AXE11000 | |
| iperf3 receive AXE11000 | |
| iperf3 transmit AXE11000 6GHz | |
| iperf3 receive AXE11000 6GHz | |

")
")
Dispositivos de entrada
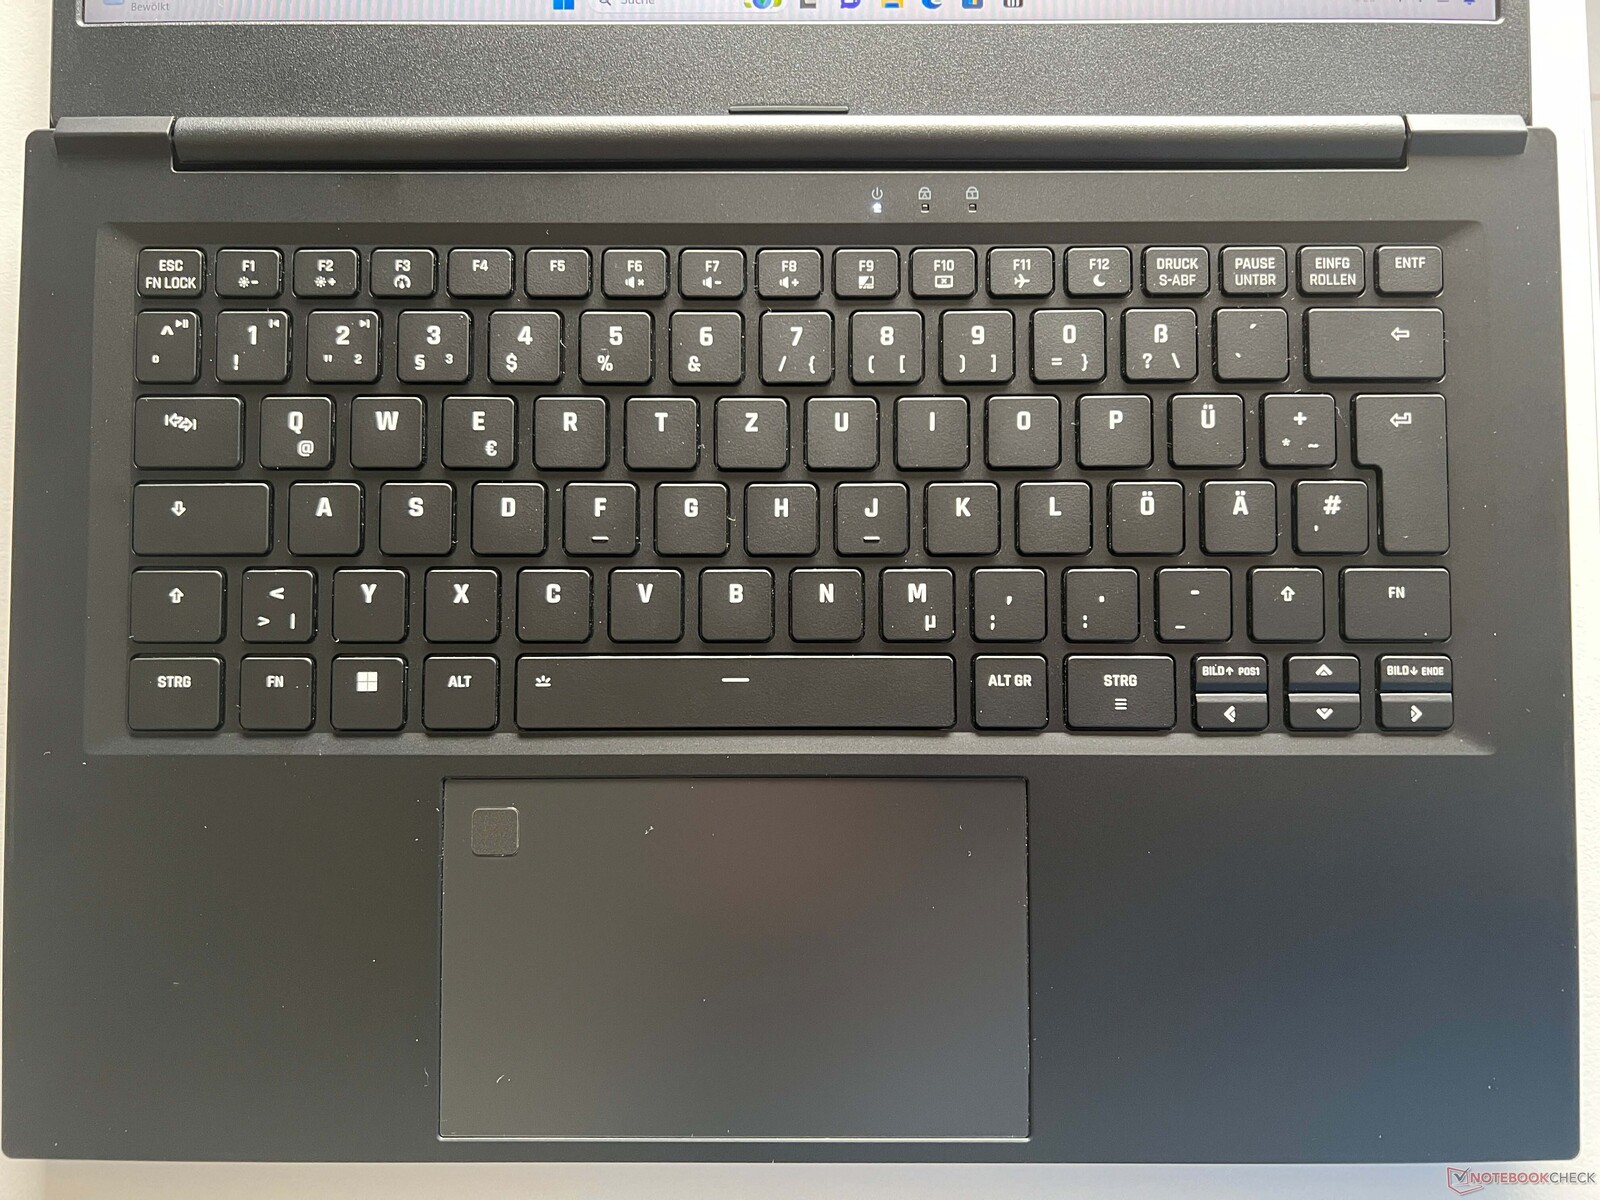
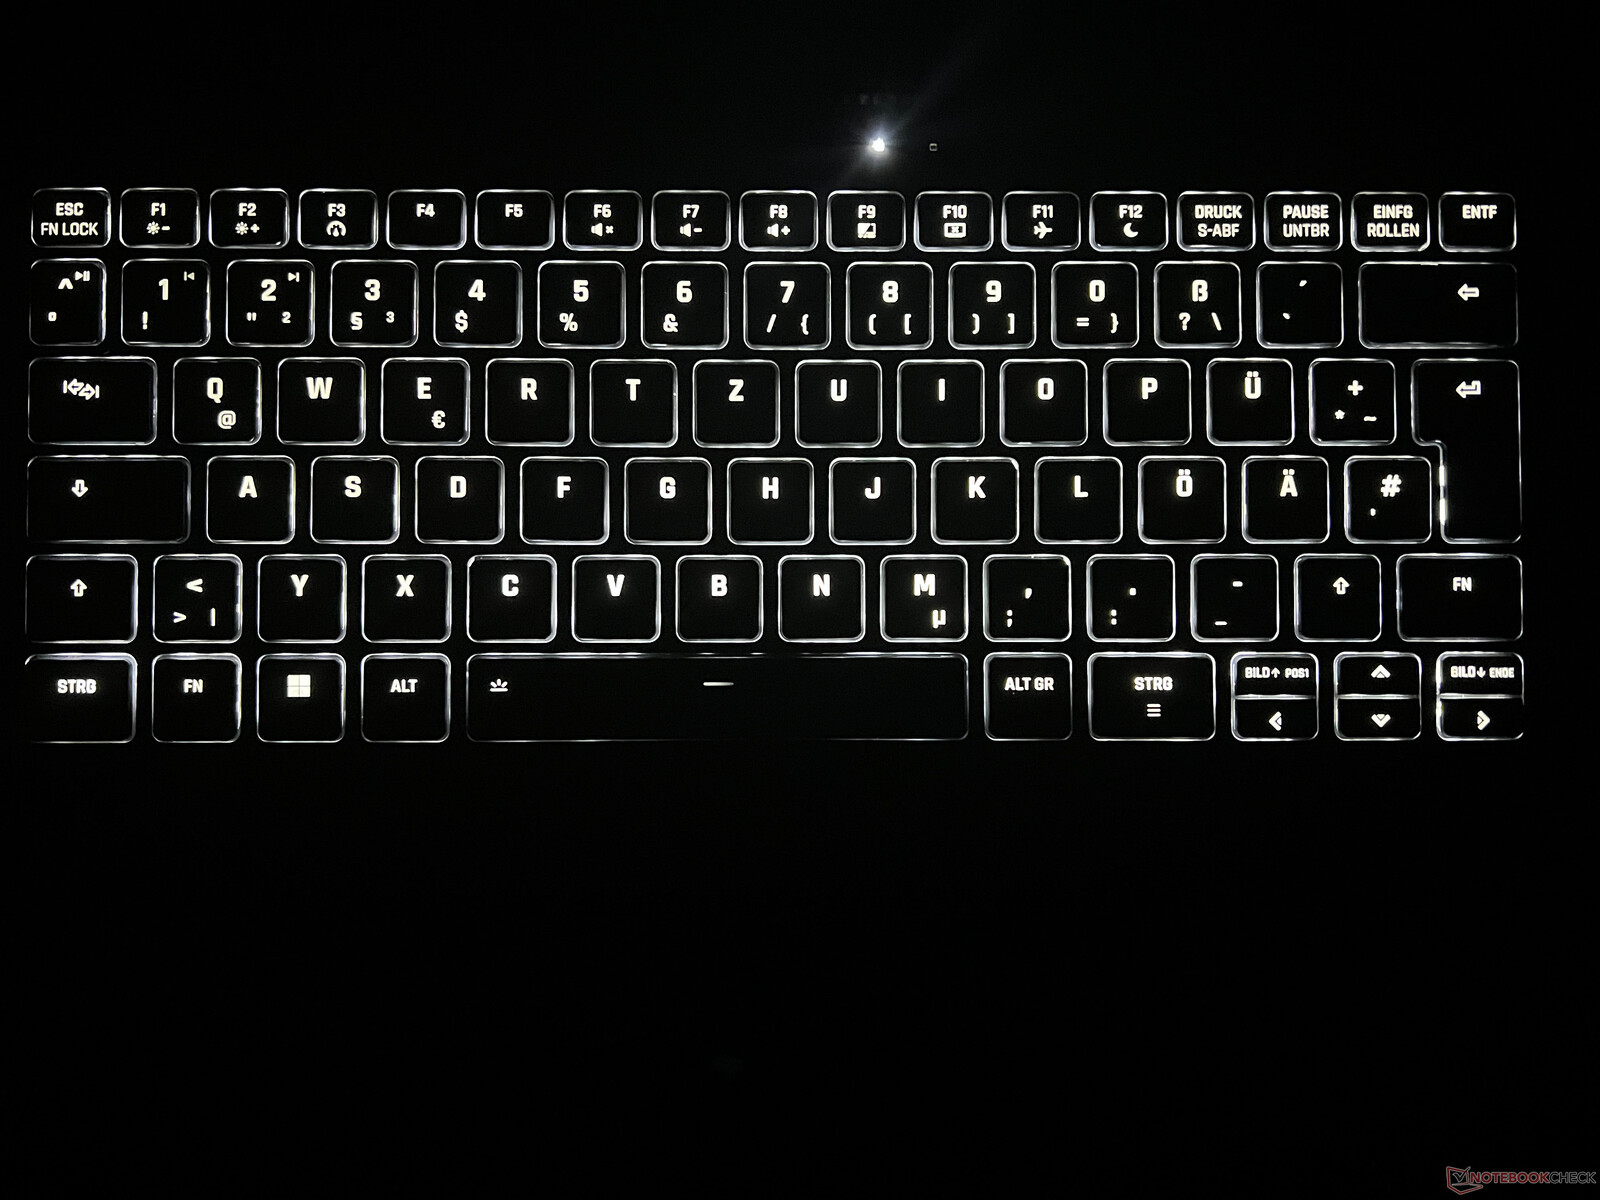
El teclado chiclet negro del portátil está retroiluminado y resulta cómodo para escribir, sin embargo, las teclas son un poco más delgadas de lo habitual y, en general, son bastante pequeñas. Las teclas de dirección son aún más pequeñas, pero al menos hay teclas dedicadas para subir/bajar imagen. El touchpad de Microsoft Precision es lo suficientemente grande como para utilizarlo cómodamente (12,1 x 7,3 cm) y está equipado con un escáner de huellas dactilares en la esquina superior izquierda. Por otro lado, no es totalmente suave y notará un poco de resistencia durante su uso. Además, sus chasquidos suenan muy fuertes y baratos, por lo que le recomendaríamos que sólo diera golpecitos al pad para realizar entradas en lugar de pulsarlo.
Pantalla - Panel IPS mate
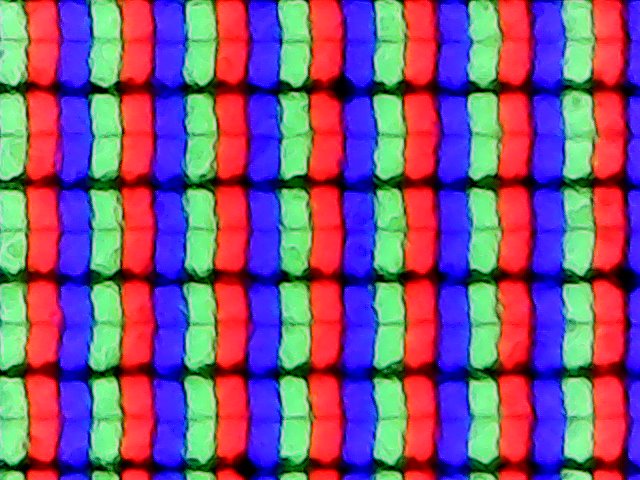
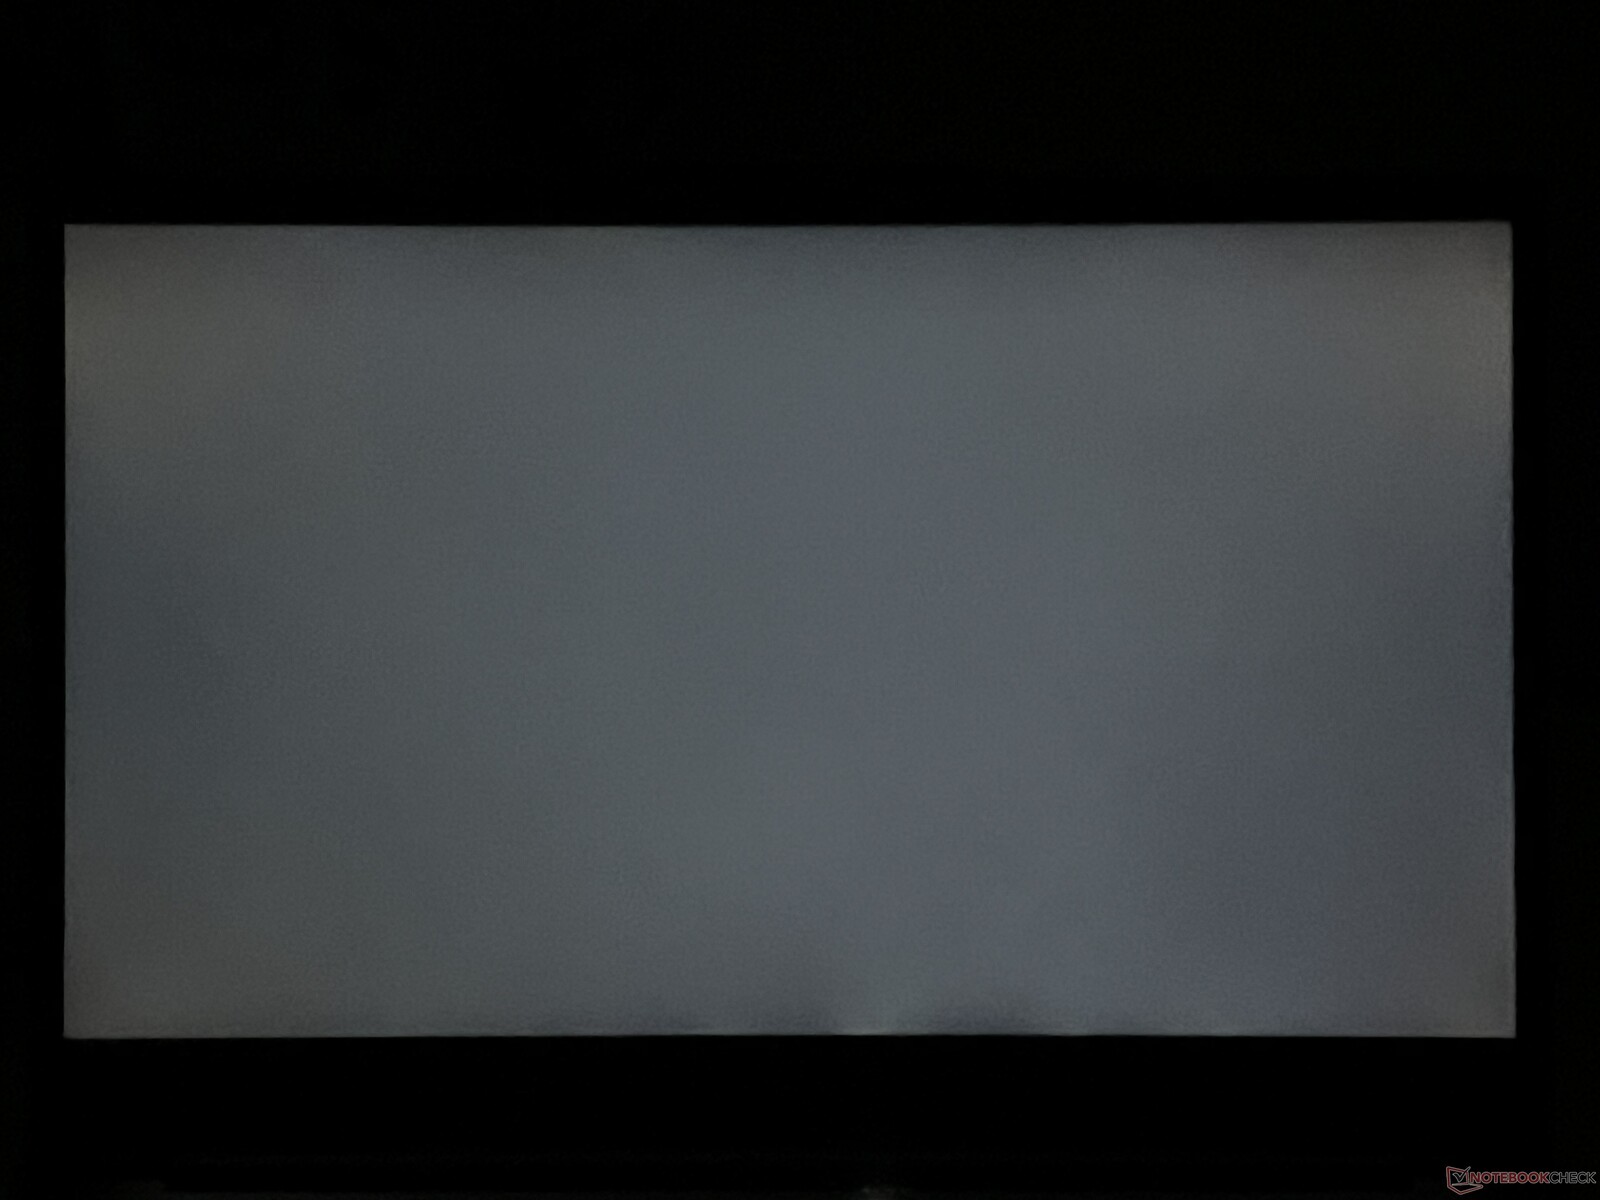
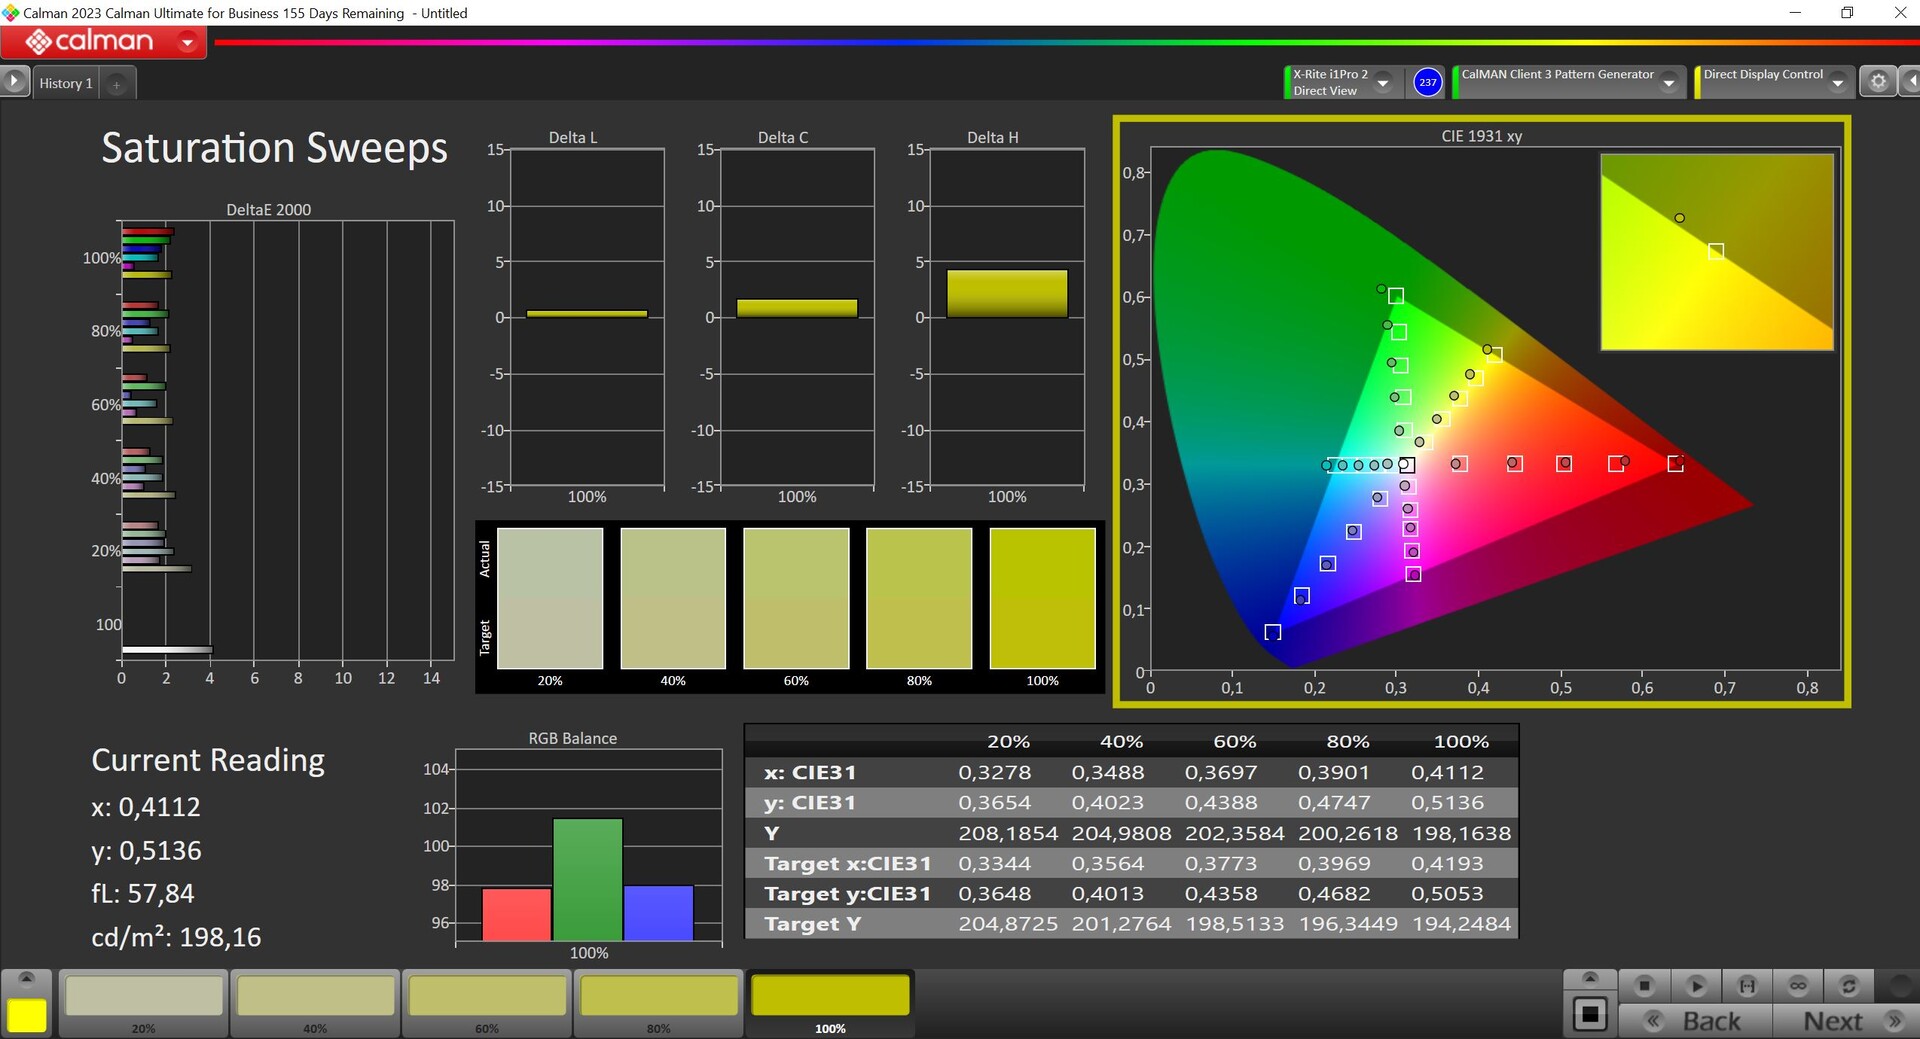
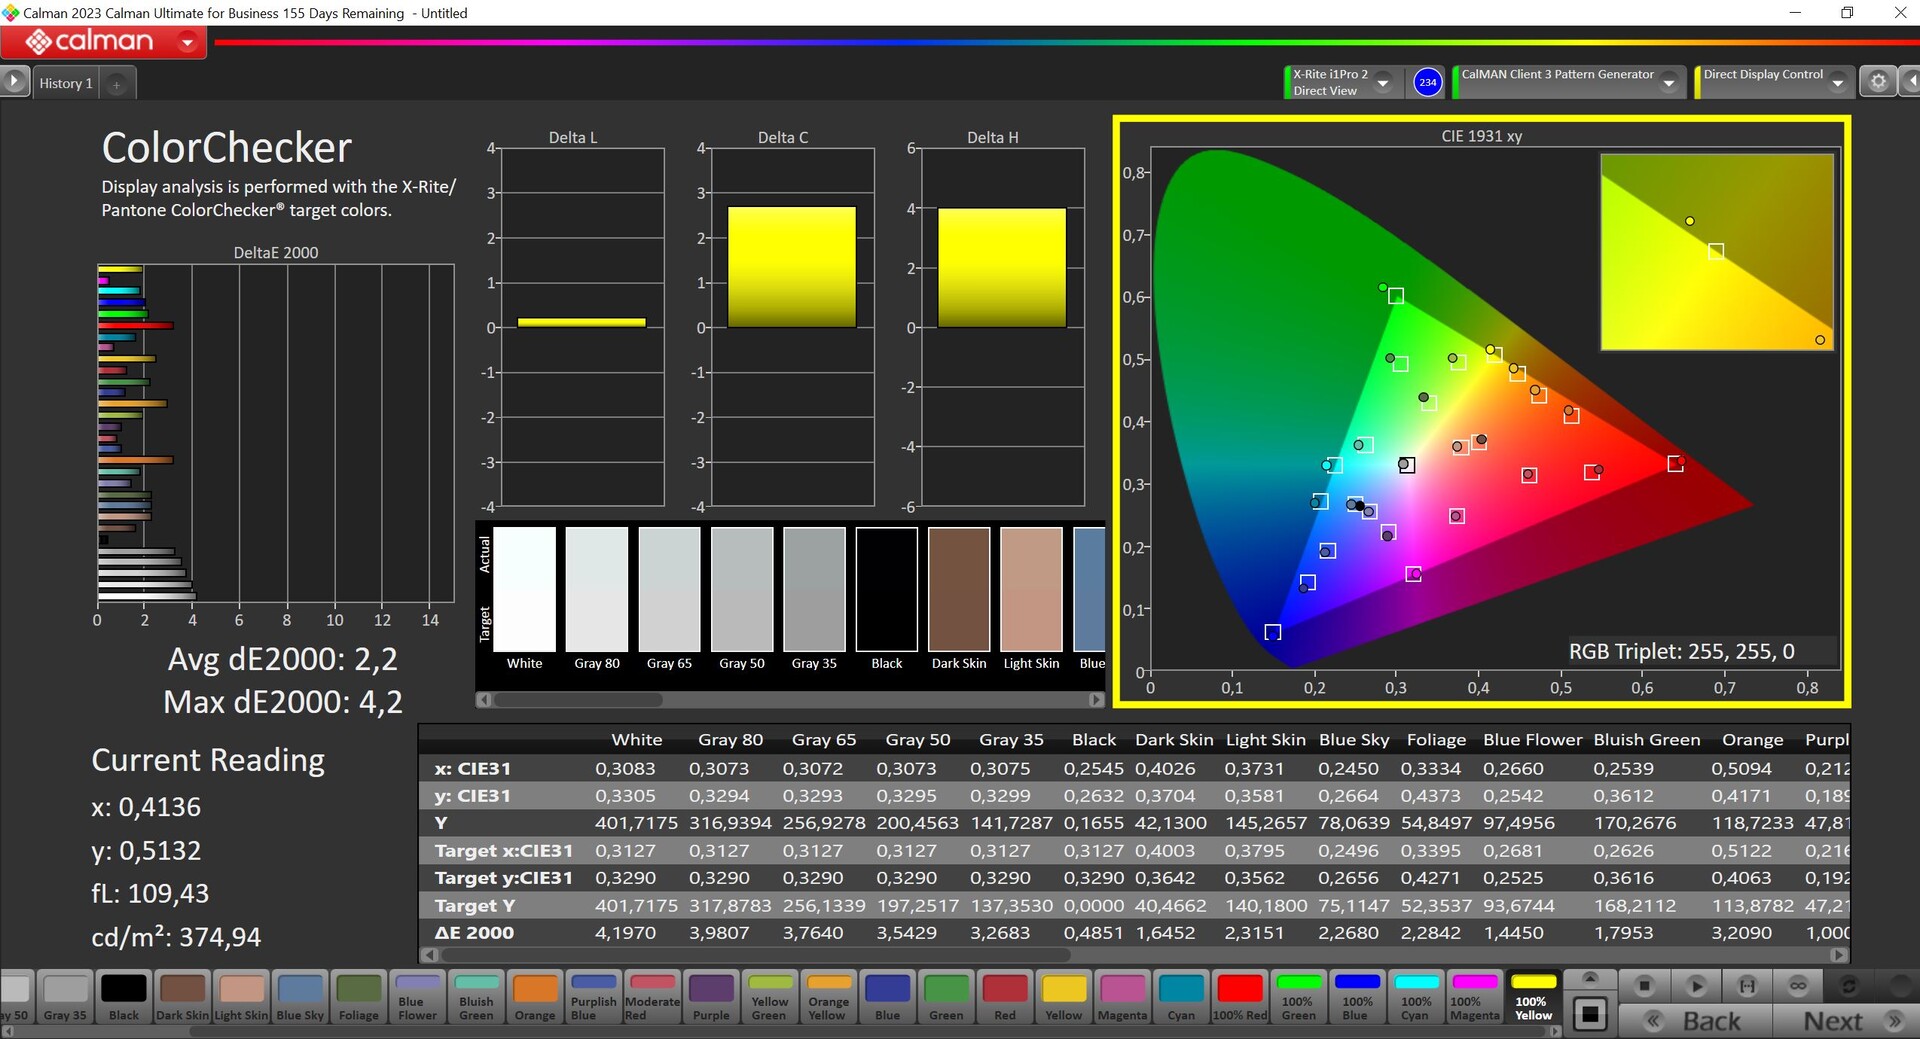
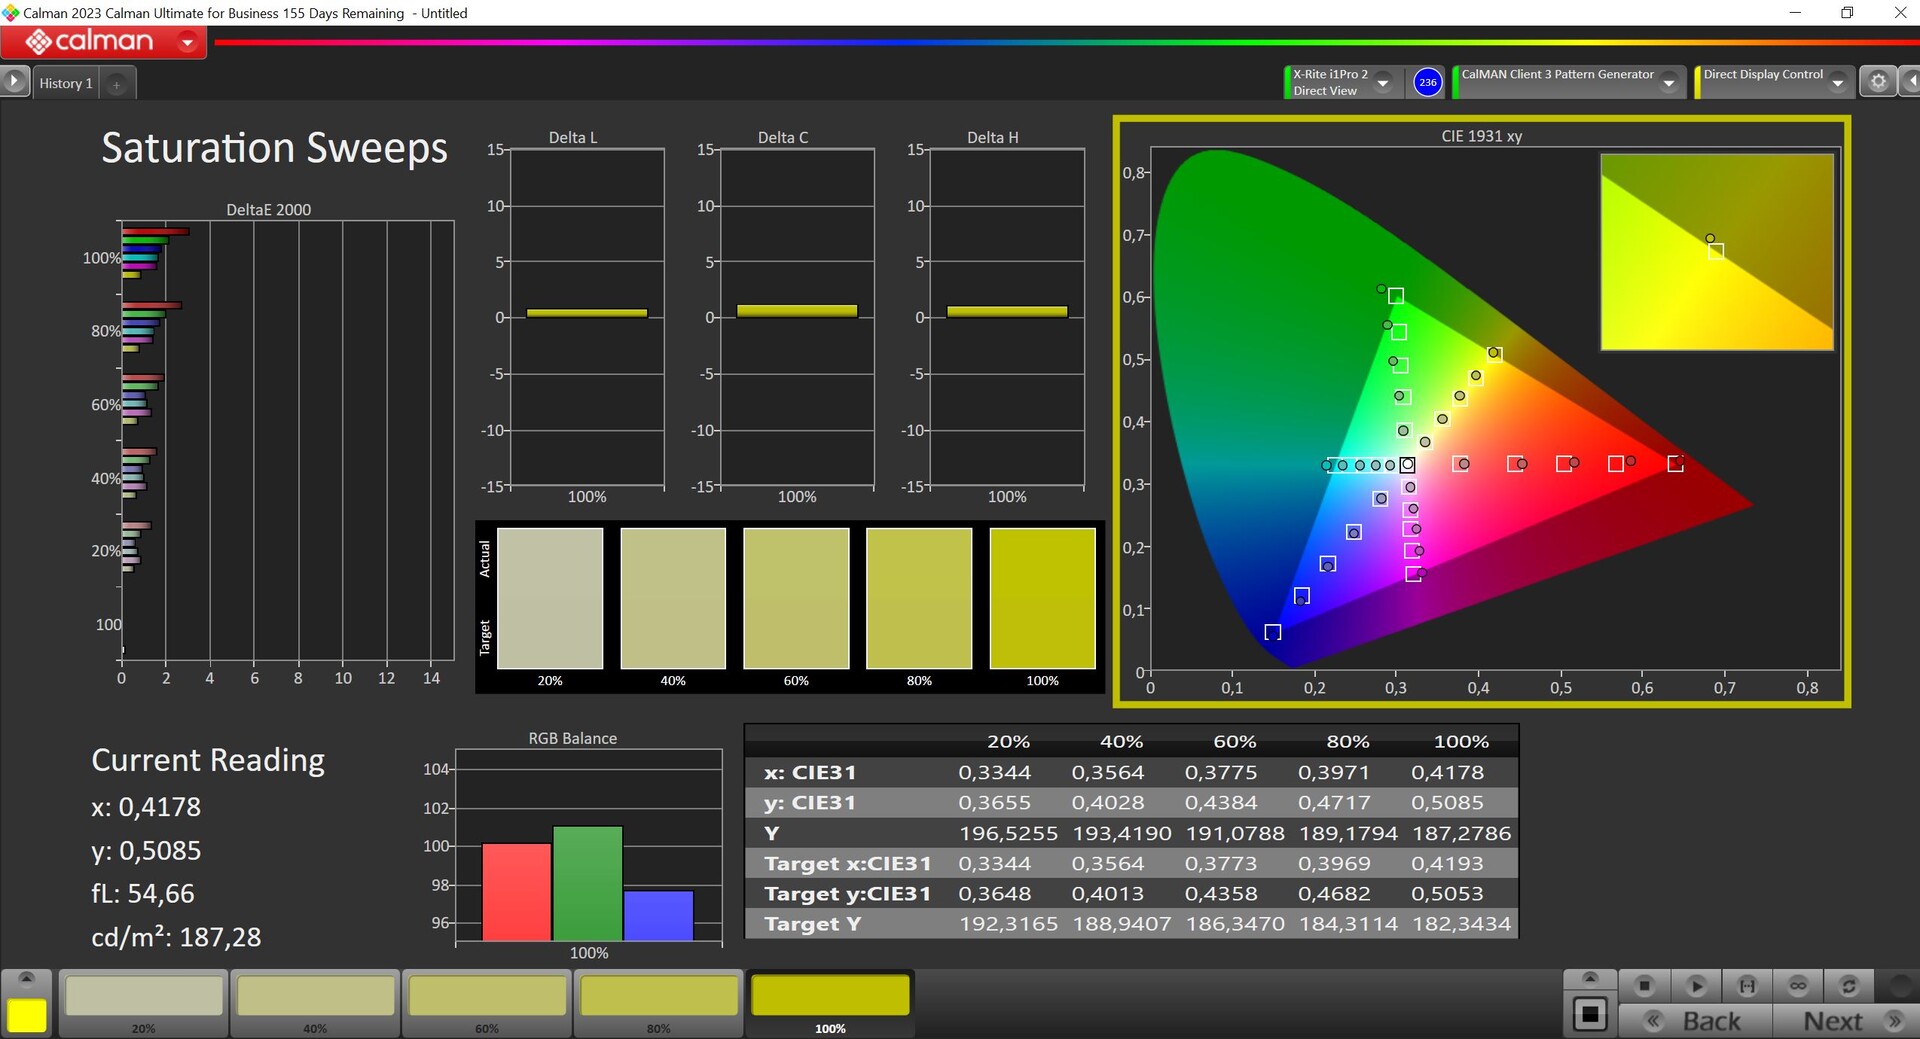
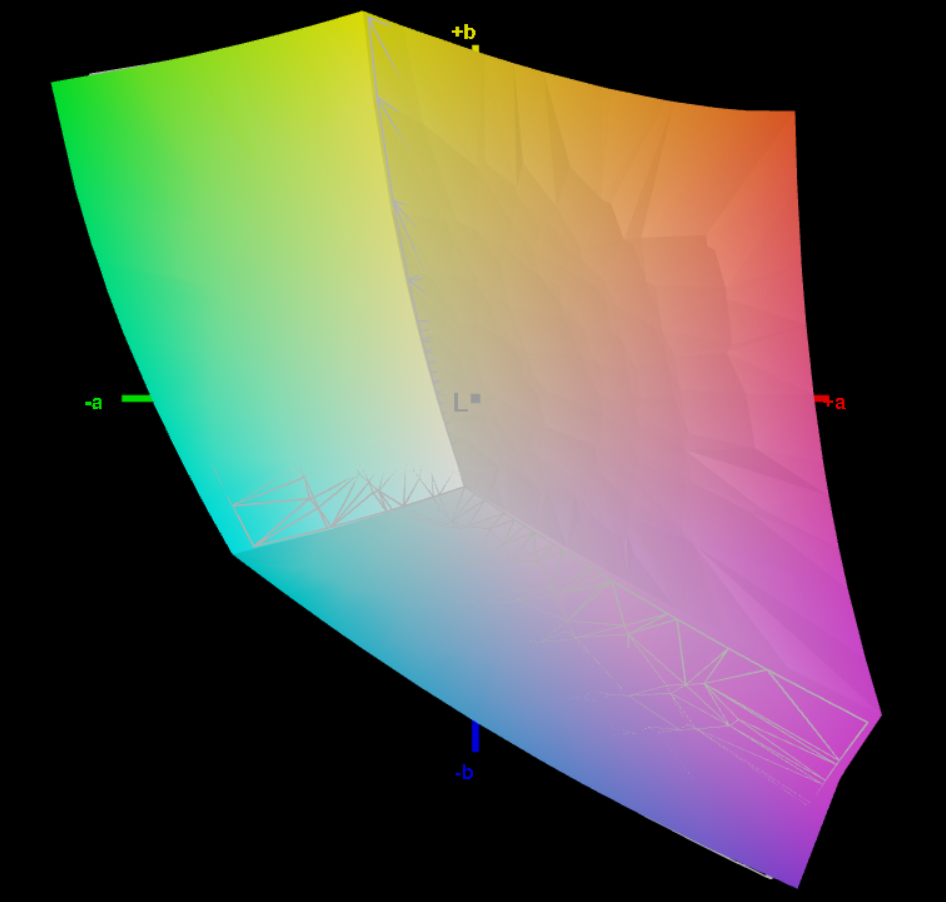
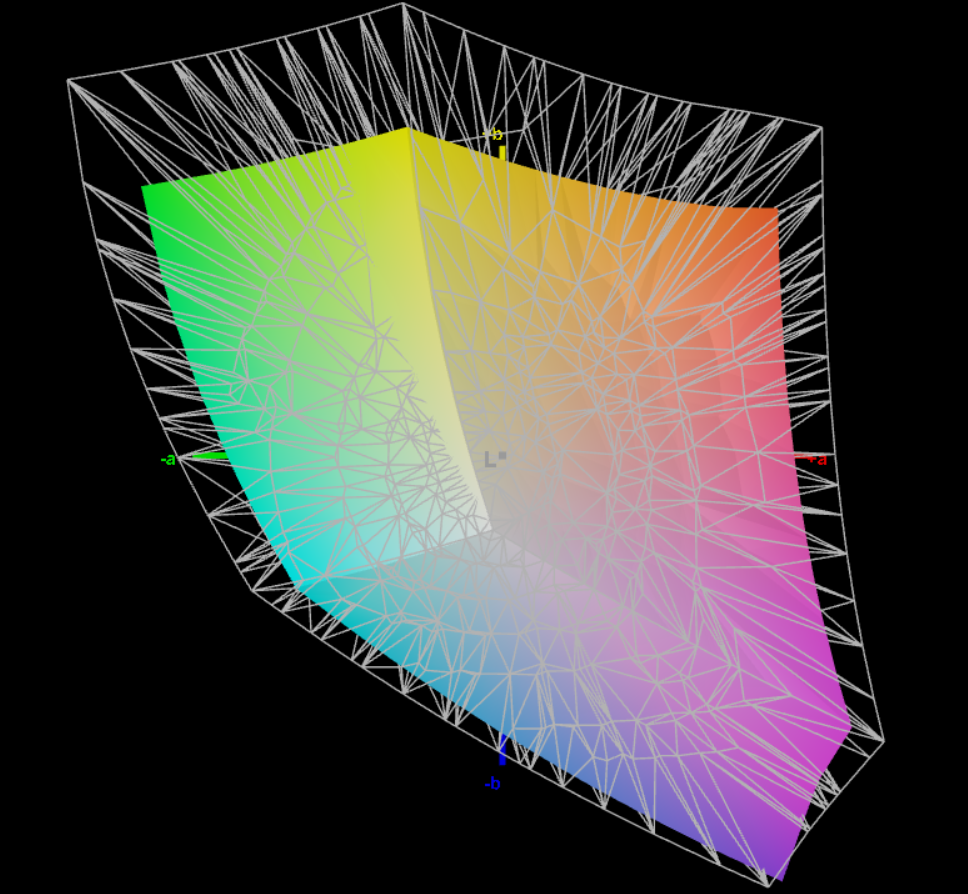
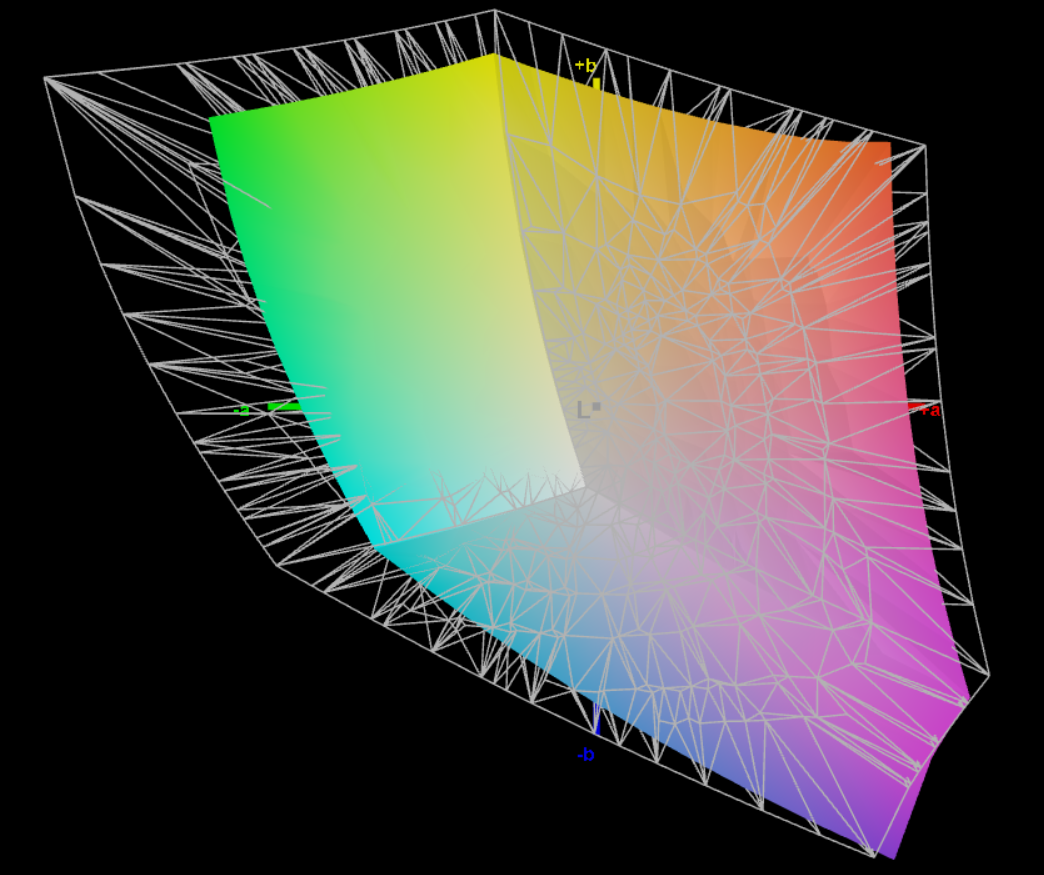
El Work 14 está equipado con un panel IPS mate (60 Hz) de AU Optronics que ofrece una resolución de 1.920 x 1.080 píxeles. Esto significa que sigue siendo un panel 16:9, pero la mayoría de las pantallas de sus competidores tienen la misma relación de aspecto. Subjetivamente, la calidad de imagen se resiente ligeramente debido a su aspecto granulado, sin embargo, el contenido es lo suficientemente nítido y la pantalla no hace uso de PWM. El sangrado de la retroiluminación no es un problema, pero sus tiempos de respuesta son muy lentos y observamos cantidades considerables de imágenes fantasma. En comparación directa, el Acer Swift Go ofrece una calidad de imagen subjetiva mucho mejor con su panel OLED pero, a cambio, los usuarios tienen que lidiar con el parpadeo PWM constante.
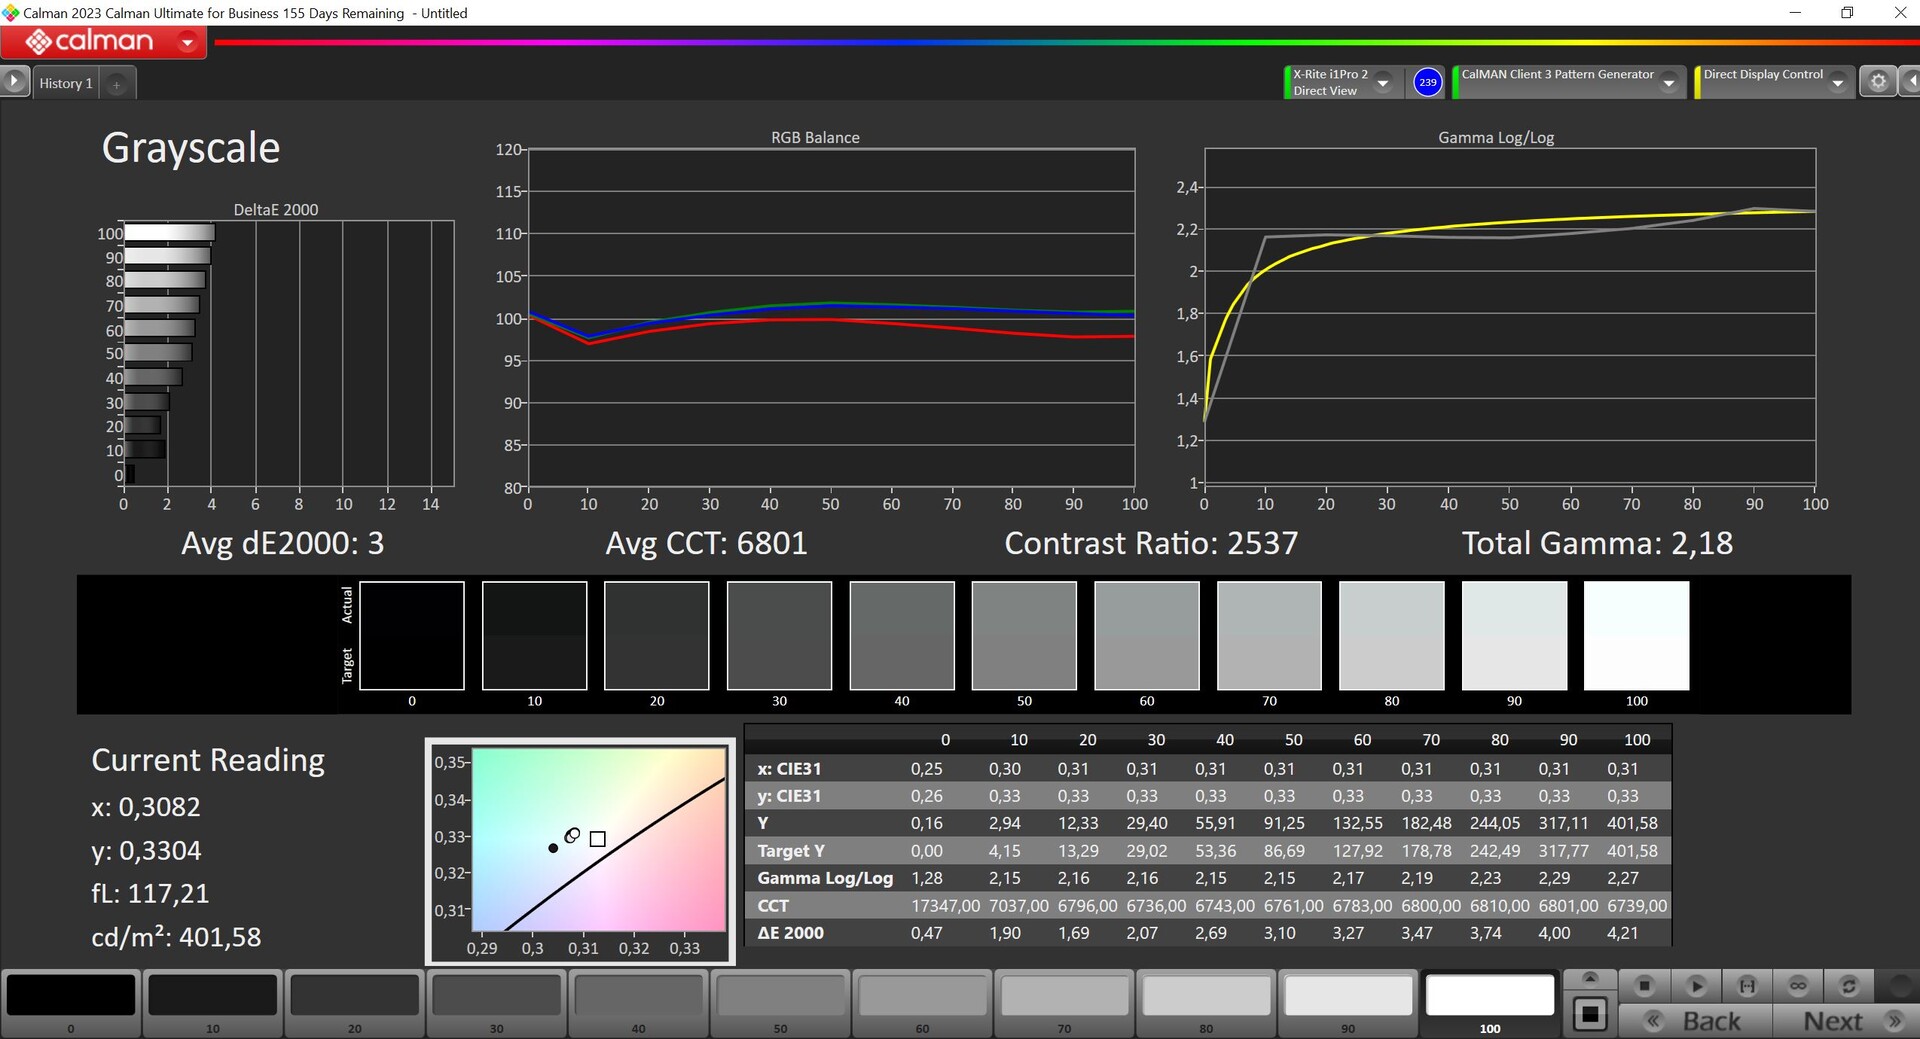
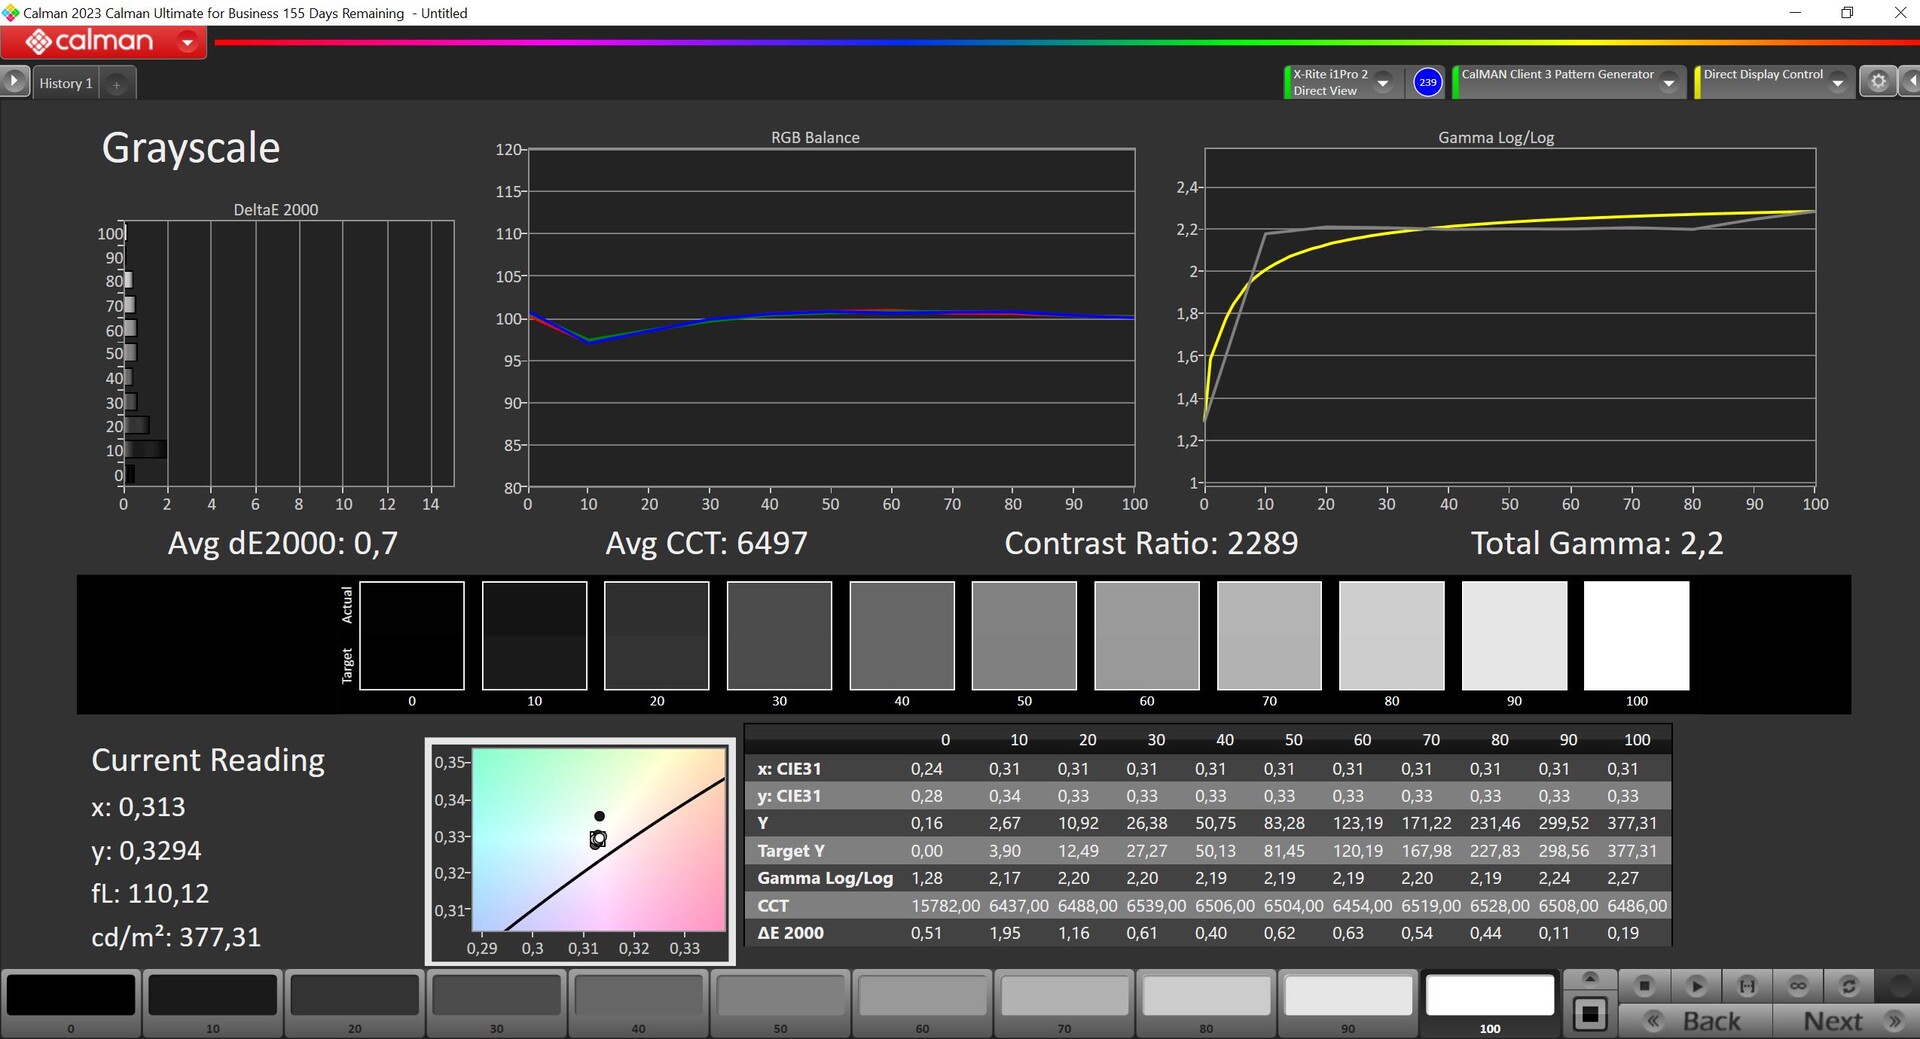
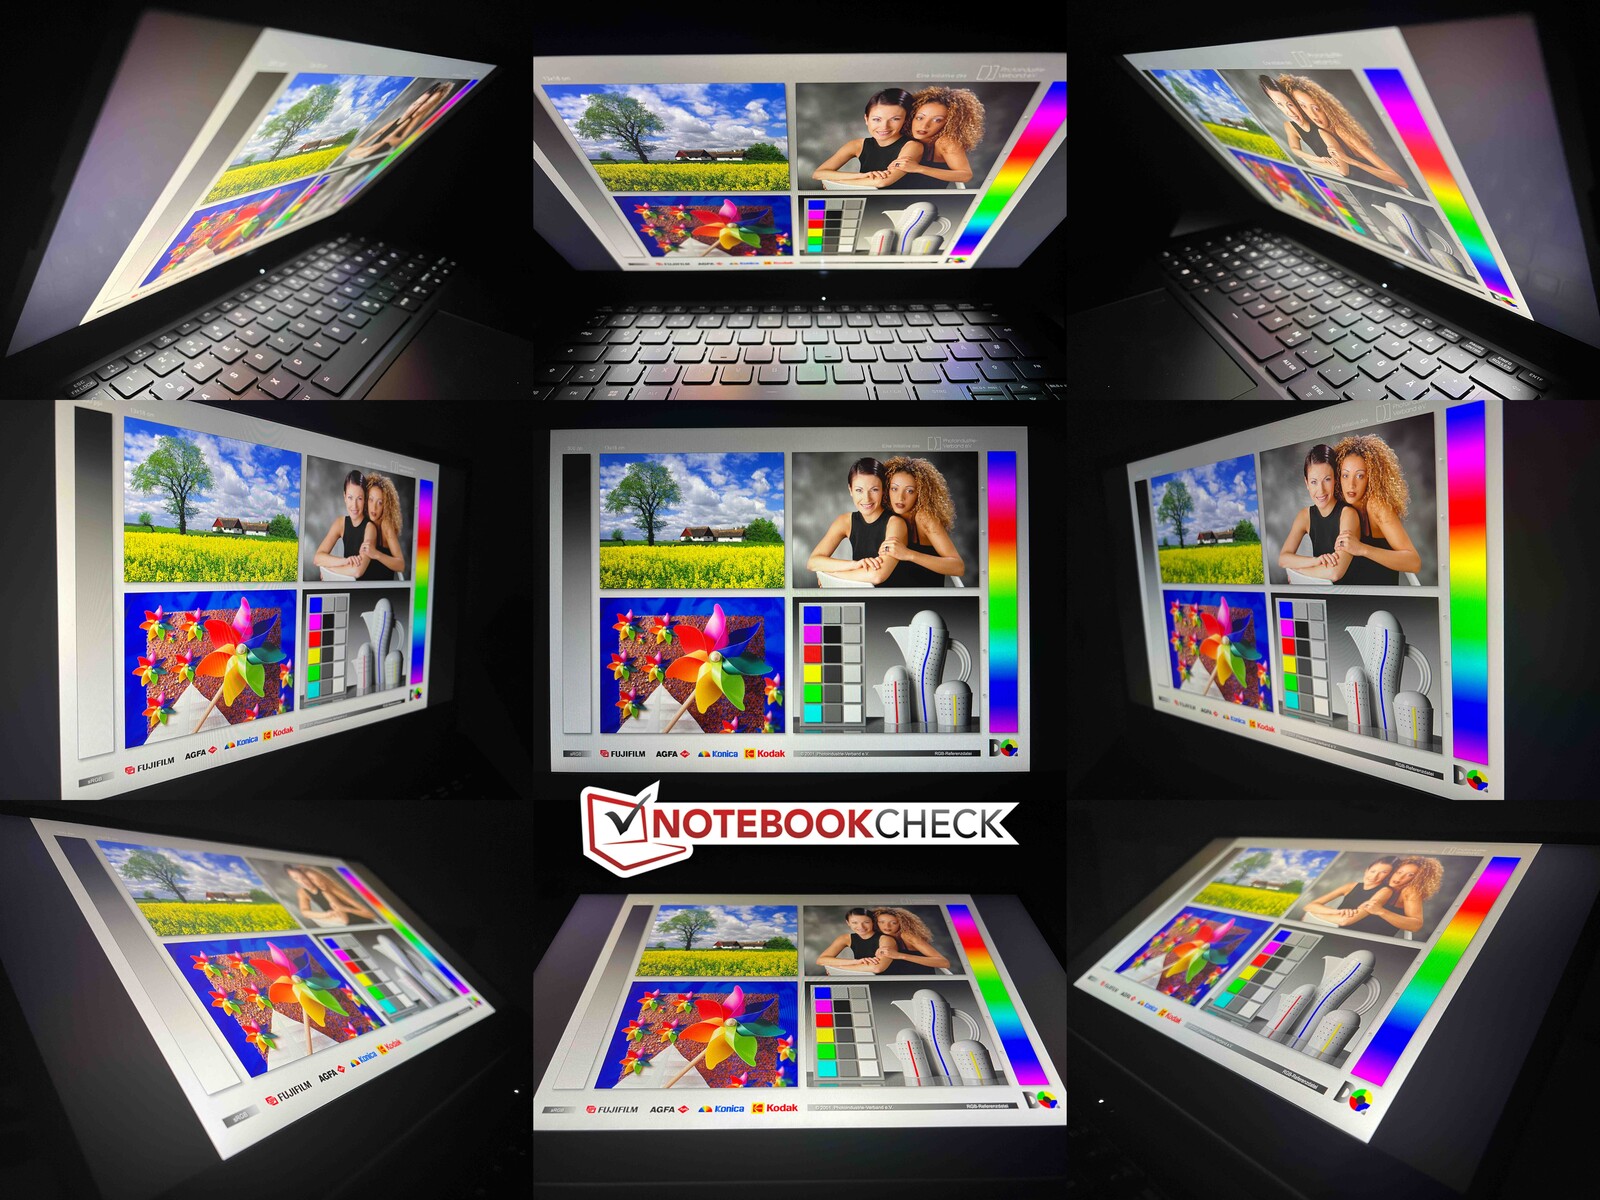
El fabricante declara un brillo típico de 300 cd/m² y nuestro dispositivo de prueba incluso mostró unos resultados mucho mejores de media, concretamente por encima de 400 cd/m². Además, su valor de negro es muy bajo, de 0,16 cd/m², lo que se traduce en una elevada relación de contraste máxima. Su calibración es decente nada más sacarlo de la caja y esto no debería suponer ningún problema en el uso diario. Si calibra la pantalla usted mismo, puede mejorar ligeramente su representación, pero esto se hace a costa de algo de brillo. Cubre el espacio de color sRGB más pequeño casi por completo. En el exterior, el panel da una impresión bastante buena y su estabilidad del ángulo de visión está bien.
| |||||||||||||||||||||||||
iluminación: 89 %
Brillo con batería: 402 cd/m²
Contraste: 2513:1 (Negro: 0.16 cd/m²)
ΔE ColorChecker Calman: 2.2 | ∀{0.5-29.43 Ø4.71}
calibrated: 1.3
ΔE Greyscale Calman: 3 | ∀{0.09-98 Ø4.96}
73.8% AdobeRGB 1998 (Argyll 3D)
99.8% sRGB (Argyll 3D)
72.4% Display P3 (Argyll 3D)
Gamma: 2.18
CCT: 6801 K
| Schenker Work 14 Base B140HAN06.8, IPS, 1920x1080, 14" | Acer Swift Go 14 SFG14-71 Samsung ATNA40YK11-0, OLED, 2880x1800, 14" | HP ProBook 445 G10 AUO2FA6, IPS, 1920x1080, 14" | Dell Latitude 3440 BOE NE140FH, IPS, 1920x1080, 14" | Lenovo ThinkPad L14 G4 21H6S00900 B140HAN06.9, IPS LED, 1920x1080, 14" | |
|---|---|---|---|---|---|
| Display | 22% | -5% | -42% | 0% | |
| Display P3 Coverage (%) | 72.4 | 99.9 38% | 68.4 -6% | 40.4 -44% | 73.2 1% |
| sRGB Coverage (%) | 99.8 | 100 0% | 95.2 -5% | 60.7 -39% | 98.9 -1% |
| AdobeRGB 1998 Coverage (%) | 73.8 | 95.4 29% | 70.6 -4% | 41.8 -43% | 73.9 0% |
| Response Times | 96% | 24% | 28% | 5% | |
| Response Time Grey 50% / Grey 80% * (ms) | 60 ? | 1.85 ? 97% | 53.4 ? 11% | 35.3 ? 41% | 58.1 ? 3% |
| Response Time Black / White * (ms) | 34.7 ? | 2 ? 94% | 21.8 ? 37% | 29.8 ? 14% | 32.7 ? 6% |
| PWM Frequency (Hz) | 357 ? | ||||
| Screen | -8% | -15% | -67% | -18% | |
| Brightness middle (cd/m²) | 402 | 278 -31% | 501 25% | 292.6 -27% | 430 7% |
| Brightness (cd/m²) | 404 | 279 -31% | 464 15% | 270 -33% | 409 1% |
| Brightness Distribution (%) | 89 | 96 8% | 87 -2% | 88 -1% | 88 -1% |
| Black Level * (cd/m²) | 0.16 | 0.04 75% | 0.26 -63% | 0.19 -19% | 0.31 -94% |
| Contrast (:1) | 2513 | 6950 177% | 1927 -23% | 1540 -39% | 1387 -45% |
| Colorchecker dE 2000 * | 2.2 | 3.01 -37% | 2.64 -20% | 4.63 -110% | 2.4 -9% |
| Colorchecker dE 2000 max. * | 4.2 | 4.43 -5% | 5.06 -20% | 17.1 -307% | 4.7 -12% |
| Colorchecker dE 2000 calibrated * | 1.3 | 4.14 -218% | 1.57 -21% | 2.13 -64% | 1.4 -8% |
| Greyscale dE 2000 * | 3 | 3.2 -7% | 3.8 -27% | 3.2 -7% | 3 -0% |
| Gamma | 2.18 101% | 2.194 100% | 2.103 105% | 2.34 94% | 2.3 96% |
| CCT | 6801 96% | 6126 106% | 6562 99% | 7184 90% | 6489 100% |
| Media total (Programa/Opciones) | 37% /
14% | 1% /
-7% | -27% /
-48% | -4% /
-11% |
* ... más pequeño es mejor

Tiempos de respuesta del display
| ↔ Tiempo de respuesta de Negro a Blanco | ||
|---|---|---|
| 34.7 ms ... subida ↗ y bajada ↘ combinada | ↗ 17 ms subida | 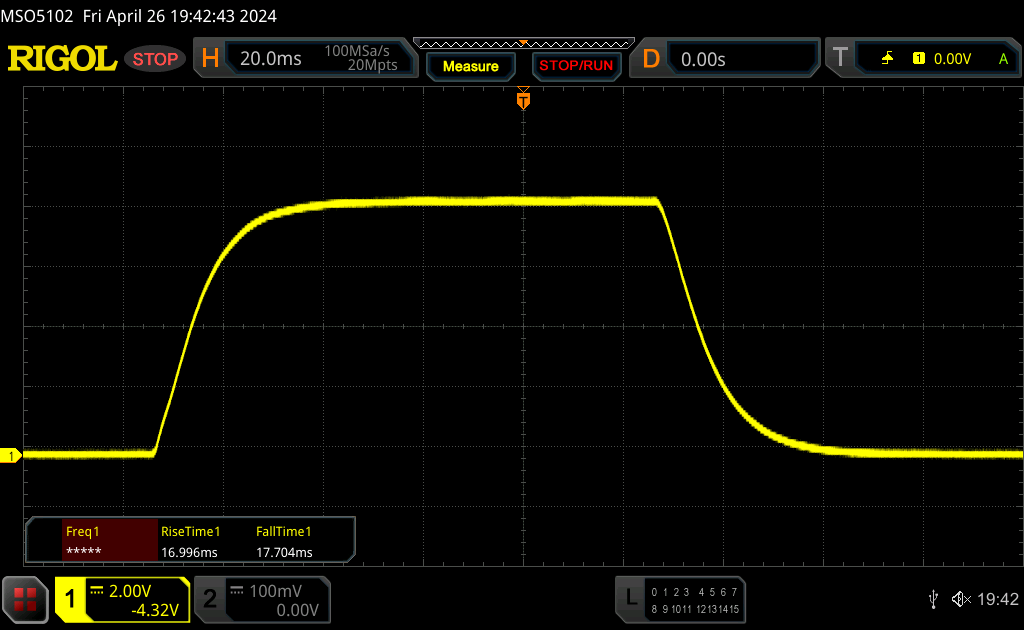 |
| ↘ 17.7 ms bajada | ||
| La pantalla mostró tiempos de respuesta lentos en nuestros tests y podría ser demasiado lenta para los jugones. En comparación, todos los dispositivos de prueba van de ##min### (mínimo) a 240 (máximo) ms. » 92 % de todos los dispositivos son mejores. Eso quiere decir que el tiempo de respuesta es peor que la media (19.8 ms) de todos los dispositivos testados. | ||
| ↔ Tiempo de respuesta 50% Gris a 80% Gris | ||
| 60 ms ... subida ↗ y bajada ↘ combinada | ↗ 27.5 ms subida | 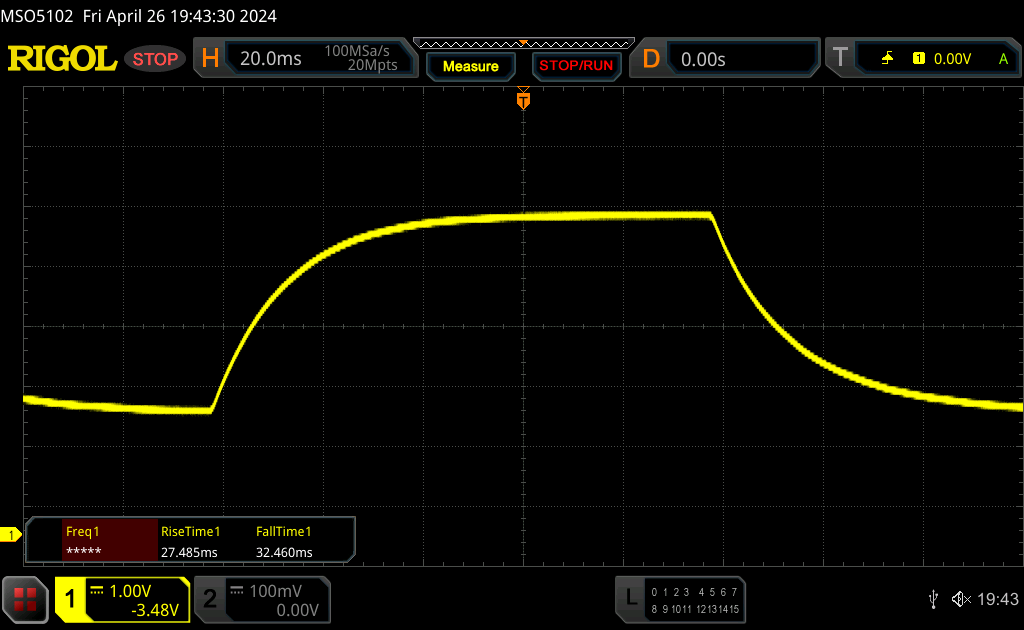 |
| ↘ 32.5 ms bajada | ||
| La pantalla mostró tiempos de respuesta lentos en nuestros tests y podría ser demasiado lenta para los jugones. En comparación, todos los dispositivos de prueba van de ##min### (mínimo) a 636 (máximo) ms. » 96 % de todos los dispositivos son mejores. Eso quiere decir que el tiempo de respuesta es peor que la media (31 ms) de todos los dispositivos testados. | ||
Parpadeo de Pantalla / PWM (Pulse-Width Modulation)
| Parpadeo de Pantalla / PWM no detectado | 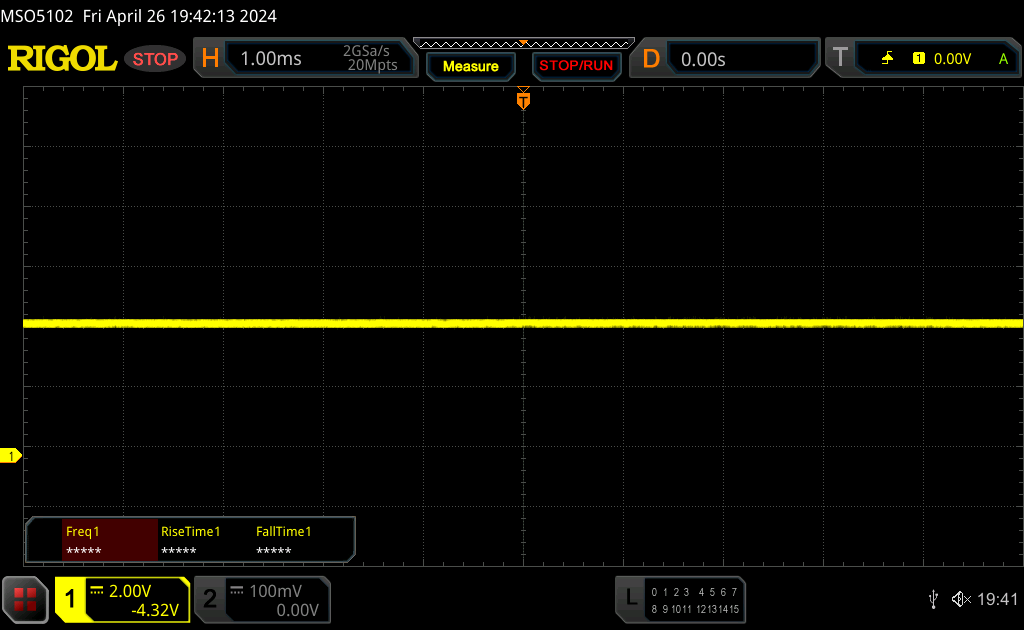 | ||
Comparación: 52 % de todos los dispositivos testados no usaron PWM para atenuar el display. Si se usó, medimos una media de 7747 (mínimo: 5 - máxmo: 343500) Hz. | |||
Actuación - La obra 14 con Alder Lake
Condiciones de prueba
Schenker ofrece varios perfiles de rendimiento. Hemos realizado las siguientes pruebas y mediciones utilizando el modo de entretenimiento, que está activo por defecto.
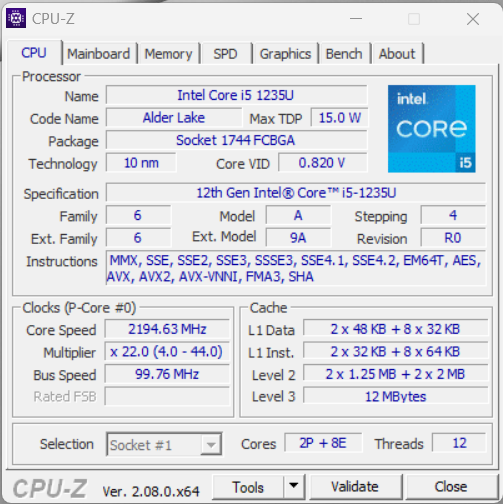
Procesador - Core i5-1235U
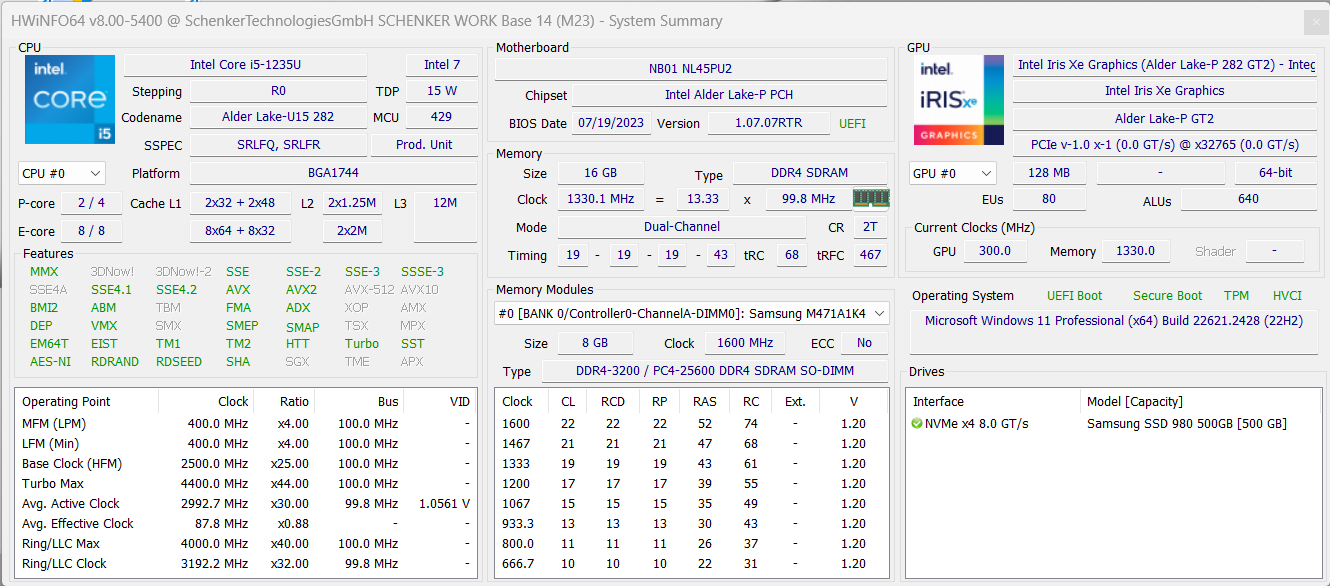
El Core i5-1235U pertenece a la generación Alder Lake de Intel, cuenta con 10 núcleos (rendimiento 2x, eficiencia 8x) y funciona a 25/20 vatios dentro del Work 14. Por supuesto, no debe esperar ningún milagro de rendimiento, sin embargo, su rendimiento general es comparable al del Core i5-1345U dentro del Dell Latitude 14. El rendimiento de la CPU es definitivamente lo suficientemente bueno para las tareas cotidianas sencillas cuando se trabaja desde casa o en la oficina y, además, el portátil no se siente demasiado lento. A cambio, tendrá que conformarse con prescindir de una NPU para las aplicaciones de IA. En uso de batería, el procesador puede consumir un máximo de 15 vatios, por lo que su rendimiento es entonces un 20 % inferior. Puede encontrar más pruebas comparativas de la CPU aquí.
Cinebench R15 Multi continuous test
Cinebench R23: Multi Core | Single Core
Cinebench R20: CPU (Multi Core) | CPU (Single Core)
Cinebench R15: CPU Multi 64Bit | CPU Single 64Bit
Blender: v2.79 BMW27 CPU
7-Zip 18.03: 7z b 4 | 7z b 4 -mmt1
Geekbench 6.7: Multi-Core | Single-Core
Geekbench 5.5: Multi-Core | Single-Core
HWBOT x265 Benchmark v2.2: 4k Preset
LibreOffice : 20 Documents To PDF
R Benchmark 2.5: Overall mean
| CPU Performance rating | |
| Media de la clase Office | |
| Acer Swift Go 14 SFG14-71 | |
| Dell Latitude 3440 -2! | |
| Lenovo ThinkPad L14 G4 21H6S00900 -2! | |
| HP ProBook 445 G10 | |
| Schenker Work 14 Base | |
| Medio Intel Core i5-1235U | |
| Cinebench R23 / Multi Core | |
| Media de la clase Office (1673 - 22808, n=75, últimos 2 años) | |
| Lenovo ThinkPad L14 G4 21H6S00900 | |
| HP ProBook 445 G10 | |
| Acer Swift Go 14 SFG14-71 | |
| Dell Latitude 3440 | |
| Schenker Work 14 Base | |
| Medio Intel Core i5-1235U (2485 - 9208, n=8) | |
| Cinebench R23 / Single Core | |
| Dell Latitude 3440 | |
| Media de la clase Office (708 - 2130, n=75, últimos 2 años) | |
| Medio Intel Core i5-1235U (1444 - 1698, n=8) | |
| Schenker Work 14 Base | |
| Acer Swift Go 14 SFG14-71 | |
| HP ProBook 445 G10 | |
| Lenovo ThinkPad L14 G4 21H6S00900 | |
| Cinebench R20 / CPU (Multi Core) | |
| Media de la clase Office (648 - 8840, n=74, últimos 2 años) | |
| Lenovo ThinkPad L14 G4 21H6S00900 | |
| HP ProBook 445 G10 | |
| Acer Swift Go 14 SFG14-71 | |
| Dell Latitude 3440 | |
| Schenker Work 14 Base | |
| Medio Intel Core i5-1235U (1783 - 3537, n=8) | |
| Cinebench R20 / CPU (Single Core) | |
| Dell Latitude 3440 | |
| Media de la clase Office (345 - 816, n=74, últimos 2 años) | |
| Schenker Work 14 Base | |
| Medio Intel Core i5-1235U (566 - 651, n=8) | |
| Acer Swift Go 14 SFG14-71 | |
| HP ProBook 445 G10 | |
| Lenovo ThinkPad L14 G4 21H6S00900 | |
| Cinebench R15 / CPU Multi 64Bit | |
| Media de la clase Office (250 - 3380, n=76, últimos 2 años) | |
| Lenovo ThinkPad L14 G4 21H6S00900 | |
| Acer Swift Go 14 SFG14-71 | |
| HP ProBook 445 G10 | |
| Dell Latitude 3440 | |
| Medio Intel Core i5-1235U (785 - 1587, n=8) | |
| Schenker Work 14 Base | |
| Cinebench R15 / CPU Single 64Bit | |
| Media de la clase Office (99.5 - 316, n=76, últimos 2 años) | |
| Dell Latitude 3440 | |
| Acer Swift Go 14 SFG14-71 | |
| HP ProBook 445 G10 | |
| Lenovo ThinkPad L14 G4 21H6S00900 | |
| Schenker Work 14 Base | |
| Medio Intel Core i5-1235U (151.5 - 242, n=8) | |
| Blender / v2.79 BMW27 CPU | |
| Schenker Work 14 Base | |
| Medio Intel Core i5-1235U (366 - 662, n=8) | |
| Dell Latitude 3440 | |
| Acer Swift Go 14 SFG14-71 | |
| Lenovo ThinkPad L14 G4 21H6S00900 | |
| HP ProBook 445 G10 | |
| Media de la clase Office (158 - 1940, n=75, últimos 2 años) | |
| 7-Zip 18.03 / 7z b 4 | |
| Media de la clase Office (7098 - 76886, n=76, últimos 2 años) | |
| HP ProBook 445 G10 | |
| Lenovo ThinkPad L14 G4 21H6S00900 | |
| Dell Latitude 3440 | |
| Acer Swift Go 14 SFG14-71 | |
| Medio Intel Core i5-1235U (20166 - 38643, n=8) | |
| Schenker Work 14 Base | |
| 7-Zip 18.03 / 7z b 4 -mmt1 | |
| Dell Latitude 3440 | |
| HP ProBook 445 G10 | |
| Media de la clase Office (3387 - 6469, n=76, últimos 2 años) | |
| Lenovo ThinkPad L14 G4 21H6S00900 | |
| Schenker Work 14 Base | |
| Acer Swift Go 14 SFG14-71 | |
| Medio Intel Core i5-1235U (4371 - 5233, n=8) | |
| Geekbench 6.7 / Multi-Core | |
| Media de la clase Office (757 - 17846, n=81, últimos 2 años) | |
| Acer Swift Go 14 SFG14-71 | |
| Medio Intel Core i5-1235U (6703 - 7046, n=2) | |
| Schenker Work 14 Base | |
| HP ProBook 445 G10 | |
| Geekbench 6.7 / Single-Core | |
| Media de la clase Office (462 - 2988, n=82, últimos 2 años) | |
| Acer Swift Go 14 SFG14-71 | |
| Medio Intel Core i5-1235U (1981 - 2208, n=2) | |
| Schenker Work 14 Base | |
| HP ProBook 445 G10 | |
| Geekbench 5.5 / Multi-Core | |
| Media de la clase Office (1483 - 16999, n=72, últimos 2 años) | |
| Acer Swift Go 14 SFG14-71 | |
| Medio Intel Core i5-1235U (5528 - 8571, n=10) | |
| Dell Latitude 3440 | |
| Schenker Work 14 Base | |
| HP ProBook 445 G10 | |
| Lenovo ThinkPad L14 G4 21H6S00900 | |
| Geekbench 5.5 / Single-Core | |
| Media de la clase Office (811 - 2175, n=72, últimos 2 años) | |
| Dell Latitude 3440 | |
| Acer Swift Go 14 SFG14-71 | |
| Schenker Work 14 Base | |
| Medio Intel Core i5-1235U (1426 - 1643, n=10) | |
| HP ProBook 445 G10 | |
| Lenovo ThinkPad L14 G4 21H6S00900 | |
| HWBOT x265 Benchmark v2.2 / 4k Preset | |
| Media de la clase Office (2.21 - 26, n=75, últimos 2 años) | |
| Lenovo ThinkPad L14 G4 21H6S00900 | |
| HP ProBook 445 G10 | |
| Acer Swift Go 14 SFG14-71 | |
| Dell Latitude 3440 | |
| Schenker Work 14 Base | |
| Medio Intel Core i5-1235U (4.99 - 9.43, n=8) | |
| LibreOffice / 20 Documents To PDF | |
| Acer Swift Go 14 SFG14-71 | |
| Media de la clase Office (39.9 - 102.3, n=75, últimos 2 años) | |
| HP ProBook 445 G10 | |
| Medio Intel Core i5-1235U (42.4 - 65.5, n=8) | |
| Dell Latitude 3440 | |
| Schenker Work 14 Base | |
| Lenovo ThinkPad L14 G4 21H6S00900 | |
| R Benchmark 2.5 / Overall mean | |
| Lenovo ThinkPad L14 G4 21H6S00900 | |
| HP ProBook 445 G10 | |
| Medio Intel Core i5-1235U (0.4986 - 0.603, n=8) | |
| Acer Swift Go 14 SFG14-71 | |
| Media de la clase Office (0.393 - 0.888, n=75, últimos 2 años) | |
| Schenker Work 14 Base | |
| Dell Latitude 3440 | |
* ... más pequeño es mejor
AIDA64: FP32 Ray-Trace | FPU Julia | CPU SHA3 | CPU Queen | FPU SinJulia | FPU Mandel | CPU AES | CPU ZLib | FP64 Ray-Trace | CPU PhotoWorxx
| Performance rating | |
| Media de la clase Office | |
| Lenovo ThinkPad L14 G4 21H6S00900 | |
| HP ProBook 445 G10 | |
| Dell Latitude 3440 | |
| Acer Swift Go 14 SFG14-71 | |
| Medio Intel Core i5-1235U | |
| Schenker Work 14 Base | |
| AIDA64 / FP32 Ray-Trace | |
| Media de la clase Office (2083 - 31245, n=82, últimos 2 años) | |
| HP ProBook 445 G10 | |
| Lenovo ThinkPad L14 G4 21H6S00900 | |
| Dell Latitude 3440 | |
| Acer Swift Go 14 SFG14-71 | |
| Schenker Work 14 Base | |
| Medio Intel Core i5-1235U (3078 - 7457, n=8) | |
| AIDA64 / FPU Julia | |
| Media de la clase Office (8191 - 125394, n=82, últimos 2 años) | |
| Lenovo ThinkPad L14 G4 21H6S00900 | |
| HP ProBook 445 G10 | |
| Dell Latitude 3440 | |
| Acer Swift Go 14 SFG14-71 | |
| Schenker Work 14 Base | |
| Medio Intel Core i5-1235U (15838 - 37760, n=8) | |
| AIDA64 / CPU SHA3 | |
| Media de la clase Office (433 - 5755, n=82, últimos 2 años) | |
| Lenovo ThinkPad L14 G4 21H6S00900 | |
| HP ProBook 445 G10 | |
| Dell Latitude 3440 | |
| Schenker Work 14 Base | |
| Acer Swift Go 14 SFG14-71 | |
| Medio Intel Core i5-1235U (978 - 2072, n=8) | |
| AIDA64 / CPU Queen | |
| Lenovo ThinkPad L14 G4 21H6S00900 | |
| HP ProBook 445 G10 | |
| Media de la clase Office (22784 - 115197, n=67, últimos 2 años) | |
| Dell Latitude 3440 | |
| Medio Intel Core i5-1235U (45680 - 62404, n=8) | |
| Acer Swift Go 14 SFG14-71 | |
| Schenker Work 14 Base | |
| AIDA64 / FPU SinJulia | |
| HP ProBook 445 G10 | |
| Lenovo ThinkPad L14 G4 21H6S00900 | |
| Media de la clase Office (1378 - 18321, n=82, últimos 2 años) | |
| Dell Latitude 3440 | |
| Medio Intel Core i5-1235U (3099 - 4644, n=8) | |
| Acer Swift Go 14 SFG14-71 | |
| Schenker Work 14 Base | |
| AIDA64 / FPU Mandel | |
| Media de la clase Office (4601 - 66922, n=82, últimos 2 años) | |
| Lenovo ThinkPad L14 G4 21H6S00900 | |
| HP ProBook 445 G10 | |
| Dell Latitude 3440 | |
| Acer Swift Go 14 SFG14-71 | |
| Schenker Work 14 Base | |
| Medio Intel Core i5-1235U (8046 - 18819, n=8) | |
| AIDA64 / CPU AES | |
| Lenovo ThinkPad L14 G4 21H6S00900 | |
| Media de la clase Office (4854 - 155900, n=82, últimos 2 años) | |
| Dell Latitude 3440 | |
| Medio Intel Core i5-1235U (23386 - 67140, n=8) | |
| Acer Swift Go 14 SFG14-71 | |
| HP ProBook 445 G10 | |
| Schenker Work 14 Base | |
| AIDA64 / CPU ZLib | |
| Media de la clase Office (114.6 - 1366, n=82, últimos 2 años) | |
| Dell Latitude 3440 | |
| HP ProBook 445 G10 | |
| Lenovo ThinkPad L14 G4 21H6S00900 | |
| Schenker Work 14 Base | |
| Medio Intel Core i5-1235U (329 - 633, n=8) | |
| Acer Swift Go 14 SFG14-71 | |
| AIDA64 / FP64 Ray-Trace | |
| Media de la clase Office (1109 - 17834, n=82, últimos 2 años) | |
| HP ProBook 445 G10 | |
| Lenovo ThinkPad L14 G4 21H6S00900 | |
| Dell Latitude 3440 | |
| Schenker Work 14 Base | |
| Acer Swift Go 14 SFG14-71 | |
| Medio Intel Core i5-1235U (1670 - 3928, n=8) | |
| AIDA64 / CPU PhotoWorxx | |
| Media de la clase Office (11090 - 65229, n=82, últimos 2 años) | |
| Acer Swift Go 14 SFG14-71 | |
| Medio Intel Core i5-1235U (15933 - 41909, n=8) | |
| Schenker Work 14 Base | |
| Dell Latitude 3440 | |
| HP ProBook 445 G10 | |
| Lenovo ThinkPad L14 G4 21H6S00900 | |
Rendimiento del sistema
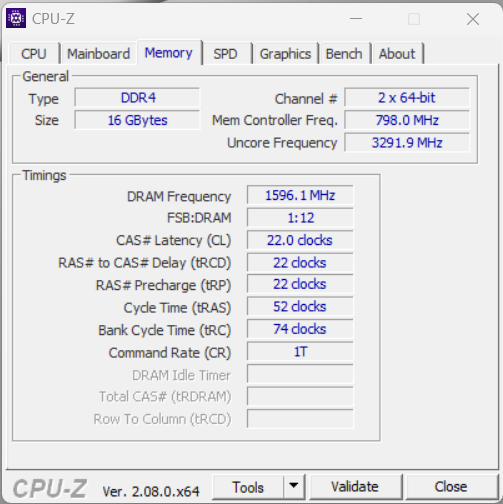
En el uso diario, el rendimiento del portátil es decente, aunque su SSD PCIe también influye en ello. Durante nuestra prueba, en ningún momento notamos problemas con la estabilidad de su sistema y, si es necesario, la memoria RAM del dispositivo puede ampliarse hasta 64 GB.
CrossMark: Overall | Productivity | Creativity | Responsiveness
WebXPRT 3: Overall
WebXPRT 4: Overall
Mozilla Kraken 1.1: Total
| PCMark 10 / Score | |
| Media de la clase Office (2601 - 9298, n=67, últimos 2 años) | |
| Lenovo ThinkPad L14 G4 21H6S00900 | |
| HP ProBook 445 G10 | |
| Acer Swift Go 14 SFG14-71 | |
| Dell Latitude 3440 | |
| Medio Intel Core i5-1235U, Intel Iris Xe Graphics G7 80EUs (4528 - 5543, n=8) | |
| Schenker Work 14 Base | |
| PCMark 10 / Essentials | |
| Lenovo ThinkPad L14 G4 21H6S00900 | |
| Dell Latitude 3440 | |
| HP ProBook 445 G10 | |
| Acer Swift Go 14 SFG14-71 | |
| Media de la clase Office (3245 - 11594, n=67, últimos 2 años) | |
| Medio Intel Core i5-1235U, Intel Iris Xe Graphics G7 80EUs (9143 - 11273, n=8) | |
| Schenker Work 14 Base | |
| PCMark 10 / Productivity | |
| Media de la clase Office (5336 - 17243, n=67, últimos 2 años) | |
| HP ProBook 445 G10 | |
| Lenovo ThinkPad L14 G4 21H6S00900 | |
| Acer Swift Go 14 SFG14-71 | |
| Dell Latitude 3440 | |
| Medio Intel Core i5-1235U, Intel Iris Xe Graphics G7 80EUs (6440 - 7354, n=8) | |
| Schenker Work 14 Base | |
| PCMark 10 / Digital Content Creation | |
| Media de la clase Office (2049 - 13541, n=67, últimos 2 años) | |
| Acer Swift Go 14 SFG14-71 | |
| Dell Latitude 3440 | |
| Schenker Work 14 Base | |
| Lenovo ThinkPad L14 G4 21H6S00900 | |
| Medio Intel Core i5-1235U, Intel Iris Xe Graphics G7 80EUs (4220 - 5839, n=8) | |
| HP ProBook 445 G10 | |
| CrossMark / Overall | |
| Media de la clase Office (381 - 2010, n=74, últimos 2 años) | |
| Acer Swift Go 14 SFG14-71 | |
| Dell Latitude 3440 | |
| Medio Intel Core i5-1235U, Intel Iris Xe Graphics G7 80EUs (983 - 1644, n=8) | |
| Schenker Work 14 Base | |
| Lenovo ThinkPad L14 G4 21H6S00900 | |
| CrossMark / Productivity | |
| Acer Swift Go 14 SFG14-71 | |
| Media de la clase Office (464 - 1880, n=74, últimos 2 años) | |
| Dell Latitude 3440 | |
| Medio Intel Core i5-1235U, Intel Iris Xe Graphics G7 80EUs (1026 - 1676, n=8) | |
| Schenker Work 14 Base | |
| Lenovo ThinkPad L14 G4 21H6S00900 | |
| CrossMark / Creativity | |
| Media de la clase Office (319 - 2361, n=74, últimos 2 años) | |
| Dell Latitude 3440 | |
| Acer Swift Go 14 SFG14-71 | |
| Medio Intel Core i5-1235U, Intel Iris Xe Graphics G7 80EUs (1032 - 1618, n=8) | |
| Schenker Work 14 Base | |
| Lenovo ThinkPad L14 G4 21H6S00900 | |
| CrossMark / Responsiveness | |
| Acer Swift Go 14 SFG14-71 | |
| Media de la clase Office (360 - 1820, n=74, últimos 2 años) | |
| Medio Intel Core i5-1235U, Intel Iris Xe Graphics G7 80EUs (746 - 1867, n=8) | |
| Dell Latitude 3440 | |
| Schenker Work 14 Base | |
| Lenovo ThinkPad L14 G4 21H6S00900 | |
| WebXPRT 3 / Overall | |
| Media de la clase Office (129.9 - 444, n=76, últimos 2 años) | |
| Dell Latitude 3440 | |
| Medio Intel Core i5-1235U, Intel Iris Xe Graphics G7 80EUs (233 - 305, n=11) | |
| Lenovo ThinkPad L14 G4 21H6S00900 | |
| Acer Swift Go 14 SFG14-71 | |
| Schenker Work 14 Base | |
| WebXPRT 4 / Overall | |
| Dell Latitude 3440 | |
| Media de la clase Office (104.2 - 313, n=76, últimos 2 años) | |
| Medio Intel Core i5-1235U, Intel Iris Xe Graphics G7 80EUs (206 - 236, n=10) | |
| Schenker Work 14 Base | |
| Lenovo ThinkPad L14 G4 21H6S00900 | |
| Mozilla Kraken 1.1 / Total | |
| Lenovo ThinkPad L14 G4 21H6S00900 | |
| Schenker Work 14 Base | |
| Medio Intel Core i5-1235U, Intel Iris Xe Graphics G7 80EUs (486 - 634, n=11) | |
| Media de la clase Office (391 - 1297, n=77, últimos 2 años) | |
| Acer Swift Go 14 SFG14-71 | |
| Acer Swift Go 14 SFG14-71 | |
| Dell Latitude 3440 | |
* ... más pequeño es mejor
| PCMark 10 Score | 4873 puntos | |
ayuda | ||
| AIDA64 / Memory Copy | |
| Media de la clase Office (20075 - 110930, n=79, últimos 2 años) | |
| Acer Swift Go 14 SFG14-71 | |
| Medio Intel Core i5-1235U (24653 - 61921, n=8) | |
| Schenker Work 14 Base | |
| Dell Latitude 3440 | |
| HP ProBook 445 G10 | |
| Lenovo ThinkPad L14 G4 21H6S00900 | |
| AIDA64 / Memory Read | |
| Media de la clase Office (10084 - 128030, n=80, últimos 2 años) | |
| Medio Intel Core i5-1235U (24441 - 66108, n=8) | |
| Schenker Work 14 Base | |
| Acer Swift Go 14 SFG14-71 | |
| Dell Latitude 3440 | |
| HP ProBook 445 G10 | |
| Lenovo ThinkPad L14 G4 21H6S00900 | |
| AIDA64 / Memory Write | |
| Media de la clase Office (20073 - 119858, n=80, últimos 2 años) | |
| Acer Swift Go 14 SFG14-71 | |
| Medio Intel Core i5-1235U (25156 - 75808, n=8) | |
| Schenker Work 14 Base | |
| Dell Latitude 3440 | |
| HP ProBook 445 G10 | |
| Lenovo ThinkPad L14 G4 21H6S00900 | |
| AIDA64 / Memory Latency | |
| Acer Swift Go 14 SFG14-71 | |
| Media de la clase Office (7.6 - 162.9, n=75, últimos 2 años) | |
| Lenovo ThinkPad L14 G4 21H6S00900 | |
| HP ProBook 445 G10 | |
| Medio Intel Core i5-1235U (76.3 - 119, n=8) | |
| Schenker Work 14 Base | |
| Dell Latitude 3440 | |
* ... más pequeño es mejor
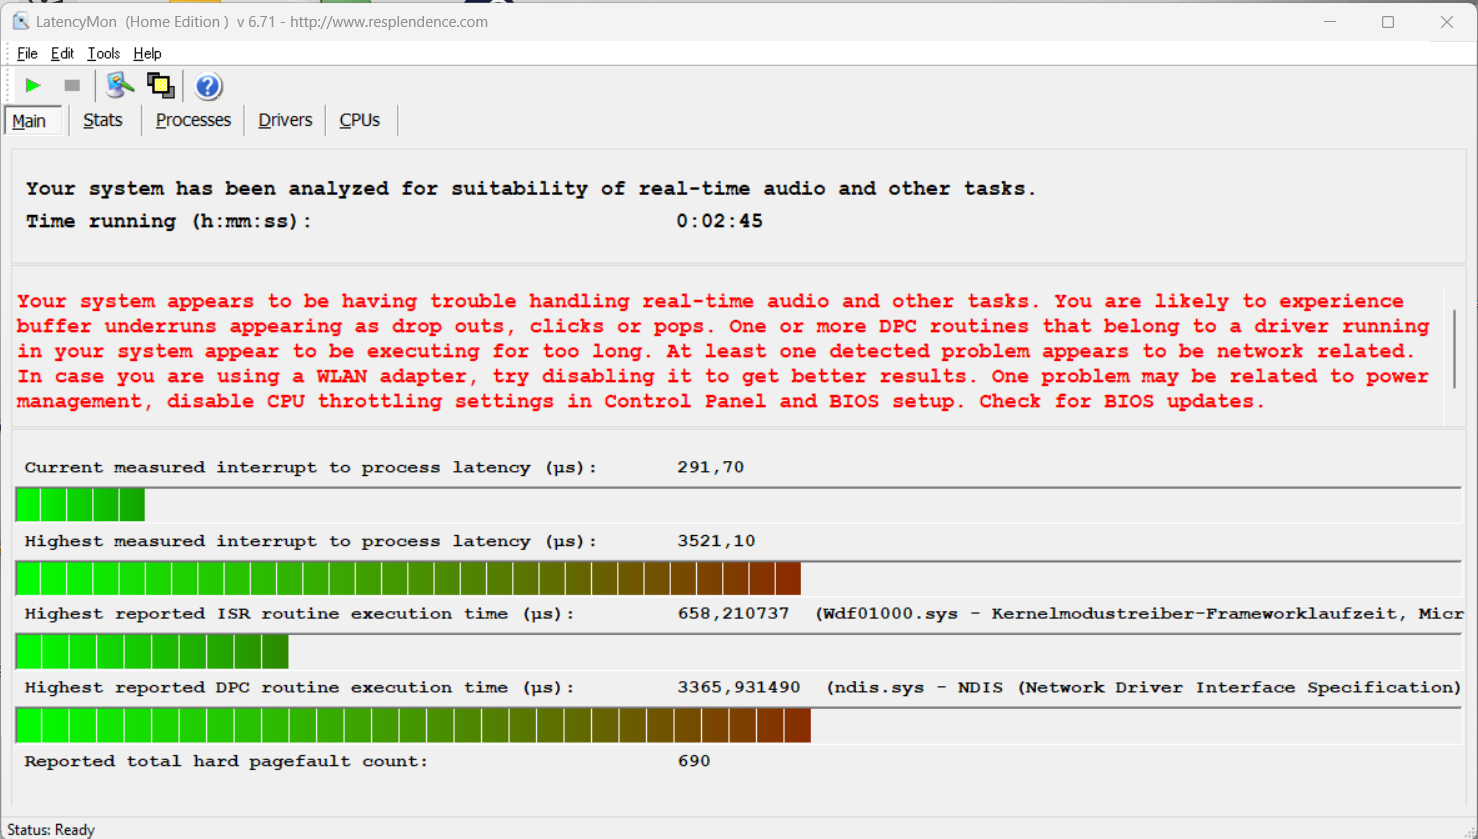
Latencias del CPD
Durante nuestra prueba de latencia estandarizada, el dispositivo de prueba con la versión actual de la BIOS mostró limitaciones al utilizar aplicaciones de audio en tiempo real.
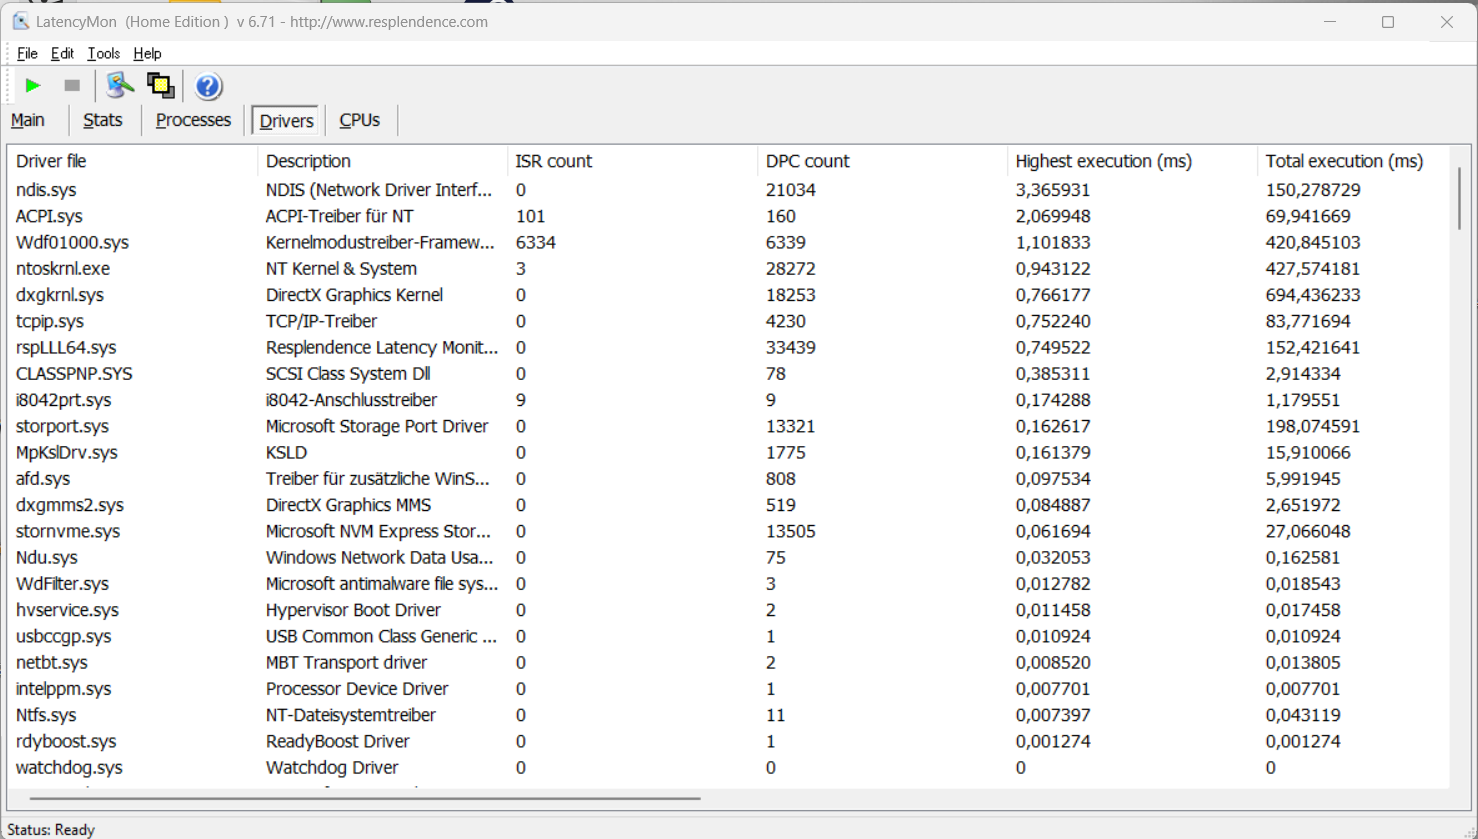
| DPC Latencies / LatencyMon - interrupt to process latency (max), Web, Youtube, Prime95 | |
| Schenker Work 14 Base | |
| Dell Latitude 3440 | |
| Lenovo ThinkPad L14 G4 21H6S00900 | |
| HP ProBook 445 G10 | |
| Acer Swift Go 14 SFG14-71 | |
* ... más pequeño es mejor
Dispositivo de almacenamiento
El Work 14 incorpora una rápida ranura PCIe 4.0 para unidades SSD M.2-2280. Nuestro dispositivo de pruebas está equipado con la versión de 500 GB del Samsung 980, que ofrece unas tasas de transferencia decentes y estables. Tras arrancar el portátil por primera vez, los usuarios disponen de 422 GB para utilizar. Puede encontrar más pruebas comparativas de SSD aquí.

* ... más pequeño es mejor
Reading continuous performance: DiskSpd Read Loop, Queue Depth 8
Tarjeta gráfica
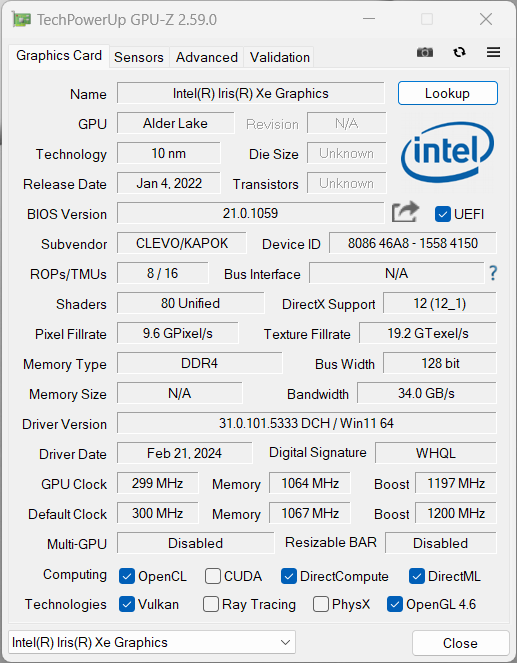
De los cálculos gráficos se encarga la integrada Gráficos Iris Xe G7 (80 UE). La iGPU se encarga bien de las tareas cotidianas, incluida la reproducción de vídeos de alta resolución, pero no hay que esperar mucho más de ella. Sin embargo, lo mismo puede decirse de sus competidores que también están equipados con la GPU Iris o, en el caso del HP ProBook 445, la anticuada AMD RX Vega 7.
Nuestros benchmarks de juegos mostraron muy claramente que el Work 14 Base apenas es adecuado para jugar. Incluso al ejecutar juegos más antiguos o menos exigentes, por lo general se limita a niveles de detalle bajos.
Bajo carga permanente, su rendimiento gráfico no permanece completamente estable y cae alrededor de un 10 %. Durante el uso en batería, no observamos ninguna caída adicional del rendimiento. Encontrará más pruebas comparativas de la GPU en .
| 3DMark 11 Performance | 5431 puntos | |
| 3DMark Fire Strike Score | 3537 puntos | |
| 3DMark Time Spy Score | 1331 puntos | |
ayuda | ||
| Blender / v3.3 Classroom HIP/AMD | |
| Lenovo ThinkPad L14 G4 21H6S00900 | |
| HP ProBook 445 G10 | |
| Media de la clase Office (296 - 507, n=5, últimos 2 años) | |
| Blender / v3.3 Classroom CPU | |
| Schenker Work 14 Base | |
| Medio Intel Iris Xe Graphics G7 80EUs (463 - 3047, n=53) | |
| Dell Latitude 3440 | |
| Lenovo ThinkPad L14 G4 21H6S00900 | |
| Acer Swift Go 14 SFG14-71 | |
| HP ProBook 445 G10 | |
| Media de la clase Office (245 - 3219, n=74, últimos 2 años) | |
* ... más pequeño es mejor
| Performance rating - Percent | |
| Media de la clase Office | |
| Acer Swift Go 14 SFG14-71 | |
| Dell Latitude 3440 | |
| Schenker Work 14 Base | |
| HP ProBook 445 G10 | |
| Lenovo ThinkPad L14 G4 21H6S00900 | |
| The Witcher 3 - 1920x1080 Ultra Graphics & Postprocessing (HBAO+) | |
| Media de la clase Office (14.8 - 28.1, n=3, últimos 2 años) | |
| Acer Swift Go 14 SFG14-71 | |
| HP ProBook 445 G10 | |
| Dell Latitude 3440 | |
| Schenker Work 14 Base | |
| Lenovo ThinkPad L14 G4 21H6S00900 | |
| GTA V - 1920x1080 Highest AA:4xMSAA + FX AF:16x | |
| Media de la clase Office (5.77 - 45.3, n=68, últimos 2 años) | |
| Acer Swift Go 14 SFG14-71 | |
| Lenovo ThinkPad L14 G4 21H6S00900 | |
| Schenker Work 14 Base | |
| HP ProBook 445 G10 | |
| Dell Latitude 3440 | |
| Final Fantasy XV Benchmark - 1920x1080 High Quality | |
| Media de la clase Office (8.09 - 79.5, n=70, últimos 2 años) | |
| Acer Swift Go 14 SFG14-71 | |
| Dell Latitude 3440 | |
| Schenker Work 14 Base | |
| HP ProBook 445 G10 | |
| Lenovo ThinkPad L14 G4 21H6S00900 | |
| Strange Brigade - 1920x1080 ultra AA:ultra AF:16 | |
| Media de la clase Office (12.9 - 142.1, n=52, últimos 2 años) | |
| Acer Swift Go 14 SFG14-71 | |
| Dell Latitude 3440 | |
| Schenker Work 14 Base | |
| HP ProBook 445 G10 | |
| Lenovo ThinkPad L14 G4 21H6S00900 | |
| Dota 2 Reborn - 1920x1080 ultra (3/3) best looking | |
| Media de la clase Office (14.6 - 135, n=76, últimos 2 años) | |
| Acer Swift Go 14 SFG14-71 | |
| Dell Latitude 3440 | |
| Schenker Work 14 Base | |
| HP ProBook 445 G10 | |
| Lenovo ThinkPad L14 G4 21H6S00900 | |
| X-Plane 11.11 - 1920x1080 high (fps_test=3) | |
| Media de la clase Office (12 - 82.4, n=68, últimos 2 años) | |
| Dell Latitude 3440 | |
| HP ProBook 445 G10 | |
| Lenovo ThinkPad L14 G4 21H6S00900 | |
| Schenker Work 14 Base | |
| Acer Swift Go 14 SFG14-71 | |
Witcher 3 FPS diagram
| bajo | medio | alto | ultra | |
|---|---|---|---|---|
| GTA V (2015) | 76.2 | 66.4 | 15.8 | 6.87 |
| The Witcher 3 (2015) | 66 | 43 | 23 | 9.6 |
| Dota 2 Reborn (2015) | 82.5 | 60 | 46.6 | 41.9 |
| Final Fantasy XV Benchmark (2018) | 30.2 | 17.4 | 12.1 | |
| X-Plane 11.11 (2018) | 30.2 | 23.7 | 21.8 | |
| Far Cry 5 (2018) | 36 | 20 | 19 | 17 |
| Strange Brigade (2018) | 64.6 | 28.3 | 22.4 | 17.6 |
| F1 23 (2023) | 29.3 | 26.7 | 18.3 |
Emisiones y potencia
Emisiones sonoras
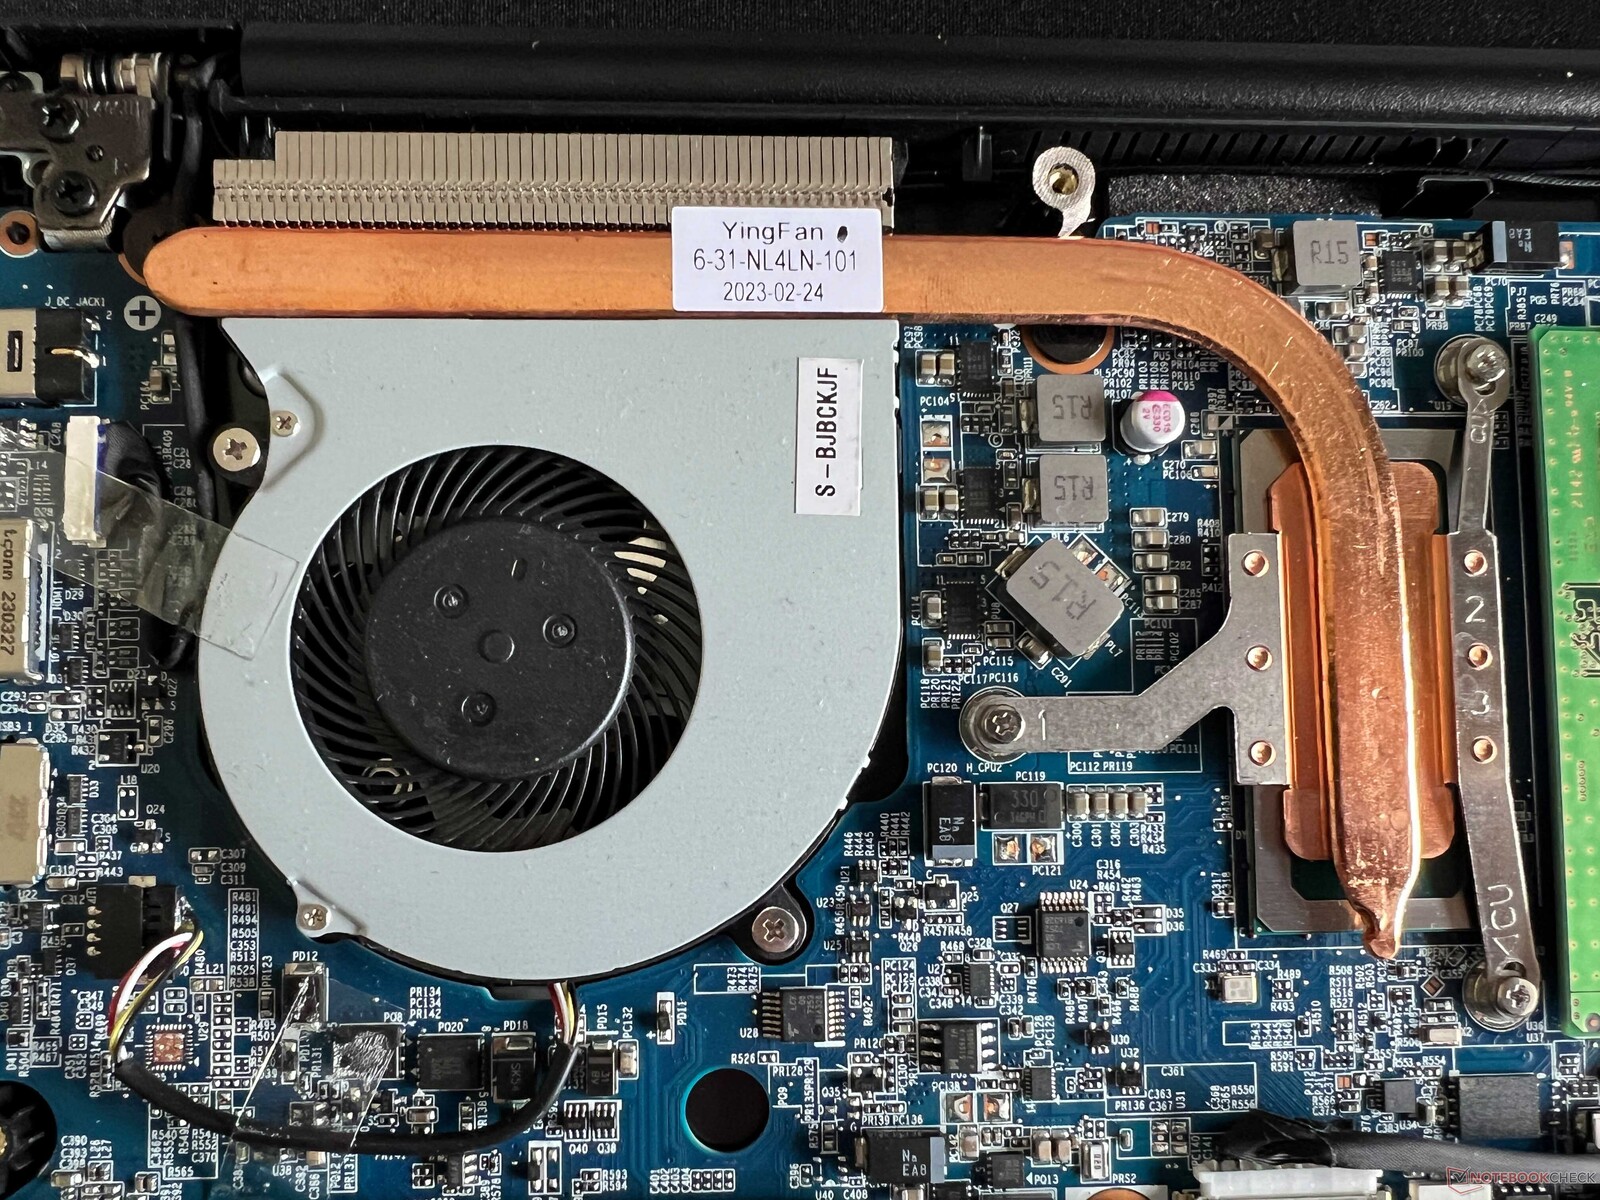
Se utiliza un único ventilador para refrigerar el portátil. En ralentí y con poca carga, permanece bastante silencioso, pero si se exige más al sistema, el ventilador se vuelve bastante ruidoso (35 dB(A)) y, además, emite un ruido de alta frecuencia. Durante la prueba de estrés, sus 43 dB(A) son demasiado altos, sobre todo si se tiene en cuenta el bajo rendimiento del portátil. No notamos ningún ruido electrónico adicional procedente de nuestro dispositivo de prueba.
Ruido
| Ocioso |
| 23.6 / 23.6 / 24.8 dB(A) |
| Carga |
| 34.2 / 42.9 dB(A) |
 | ||
30 dB silencioso 40 dB(A) audible 50 dB(A) ruidosamente alto |
||
min: | ||
| Schenker Work 14 Base Iris Xe G7 80EUs, i5-1235U, Samsung SSD 980 500GB (MZ-V8V500BW) | Acer Swift Go 14 SFG14-71 Iris Xe G7 80EUs, i5-1335U, WD PC SN740 SDDQNQD-512G-1014 | HP ProBook 445 G10 Vega 7, R5 7530U, Kioxia BG5 KBG50ZNS512G | Dell Latitude 3440 Iris Xe G7 80EUs, i5-1345U, Samsung PM9A1 MZVL2512HCJQ | Lenovo ThinkPad L14 G4 21H6S00900 Vega 7, R5 7530U, Kioxia BG5 KBG5AZNT512G | |
|---|---|---|---|---|---|
| Noise | -5% | -1% | -3% | -3% | |
| apagado / medio ambiente * (dB) | 23.6 | 24.9 -6% | 24 -2% | 23.9 -1% | 25.2 -7% |
| Idle Minimum * (dB) | 23.6 | 24.9 -6% | 24 -2% | 24.4 -3% | 25.2 -7% |
| Idle Average * (dB) | 23.6 | 24.9 -6% | 25 -6% | 24.4 -3% | 25.2 -7% |
| Idle Maximum * (dB) | 24.8 | 24.9 -0% | 28 -13% | 24.4 2% | 27.3 -10% |
| Load Average * (dB) | 34.2 | 31.9 7% | 33 4% | 37.1 -8% | 32.1 6% |
| Witcher 3 ultra * (dB) | 34.2 | 43.2 -26% | 36 -5% | 38.2 -12% | 35.7 -4% |
| Load Maximum * (dB) | 42.9 | 43.2 -1% | 36 16% | 40.2 6% | 38.3 11% |
* ... más pequeño es mejor
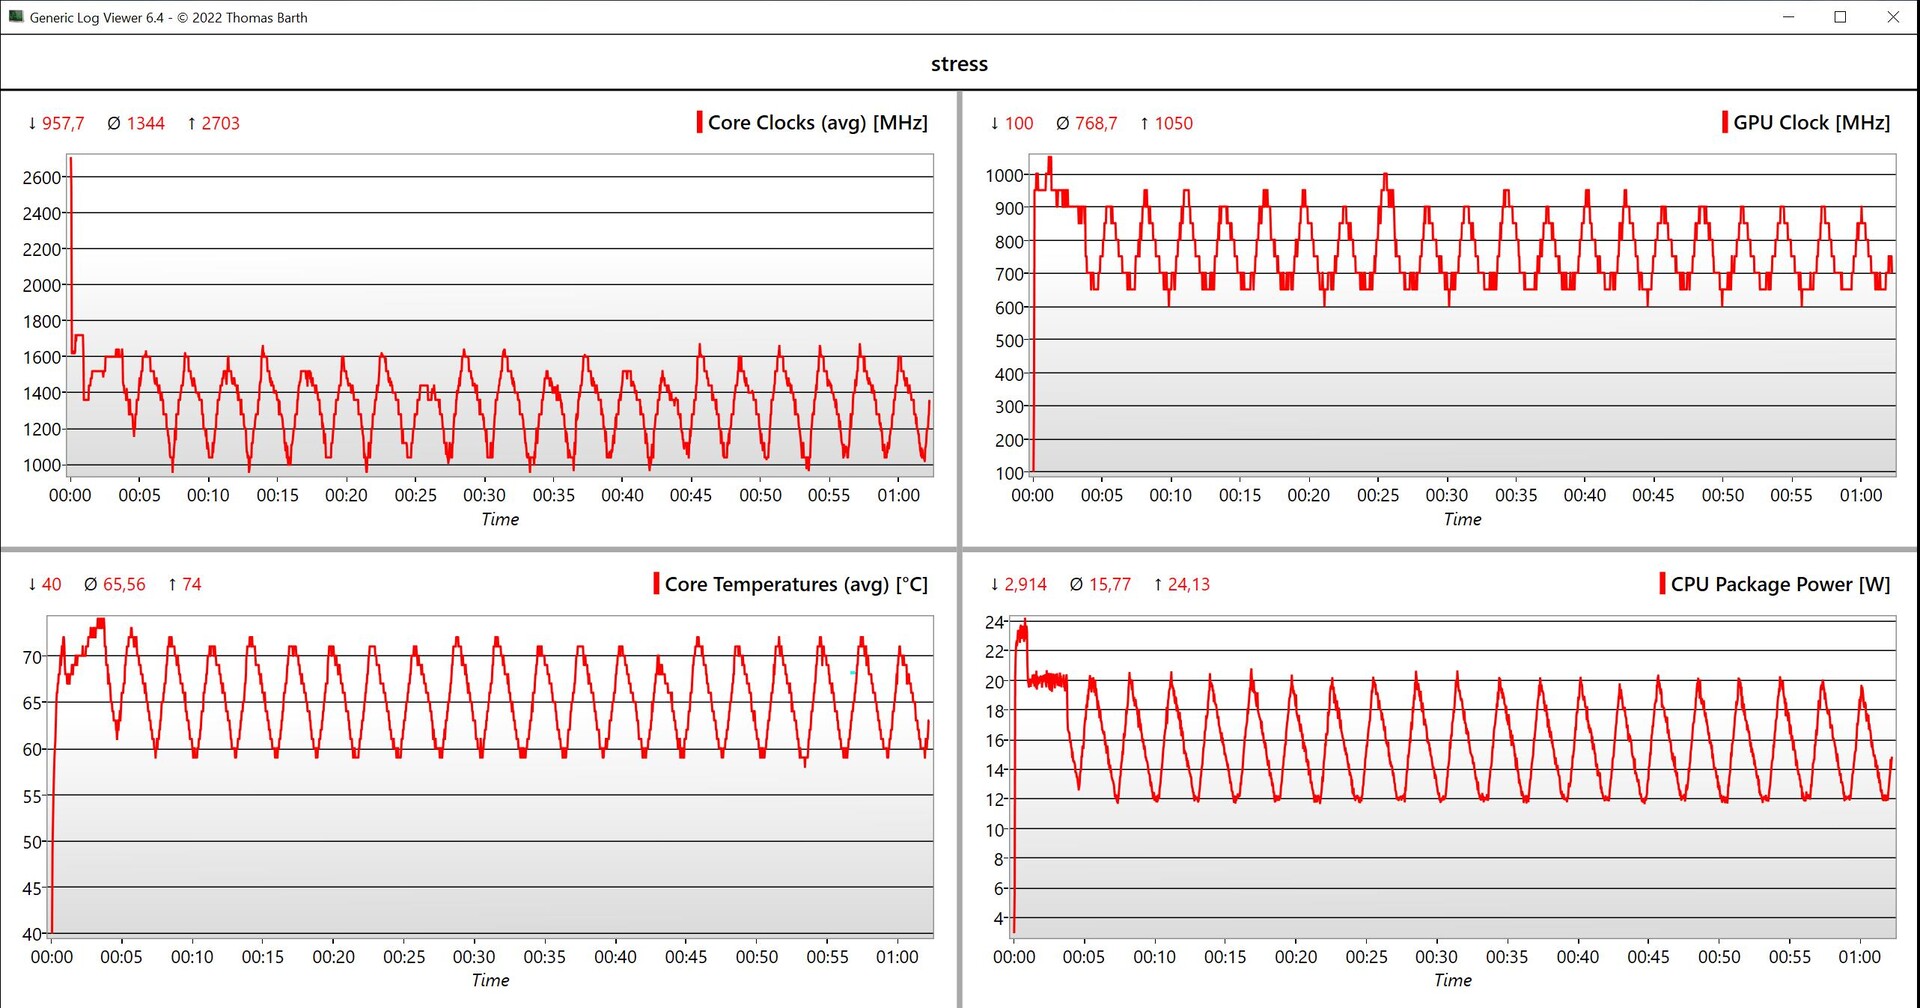
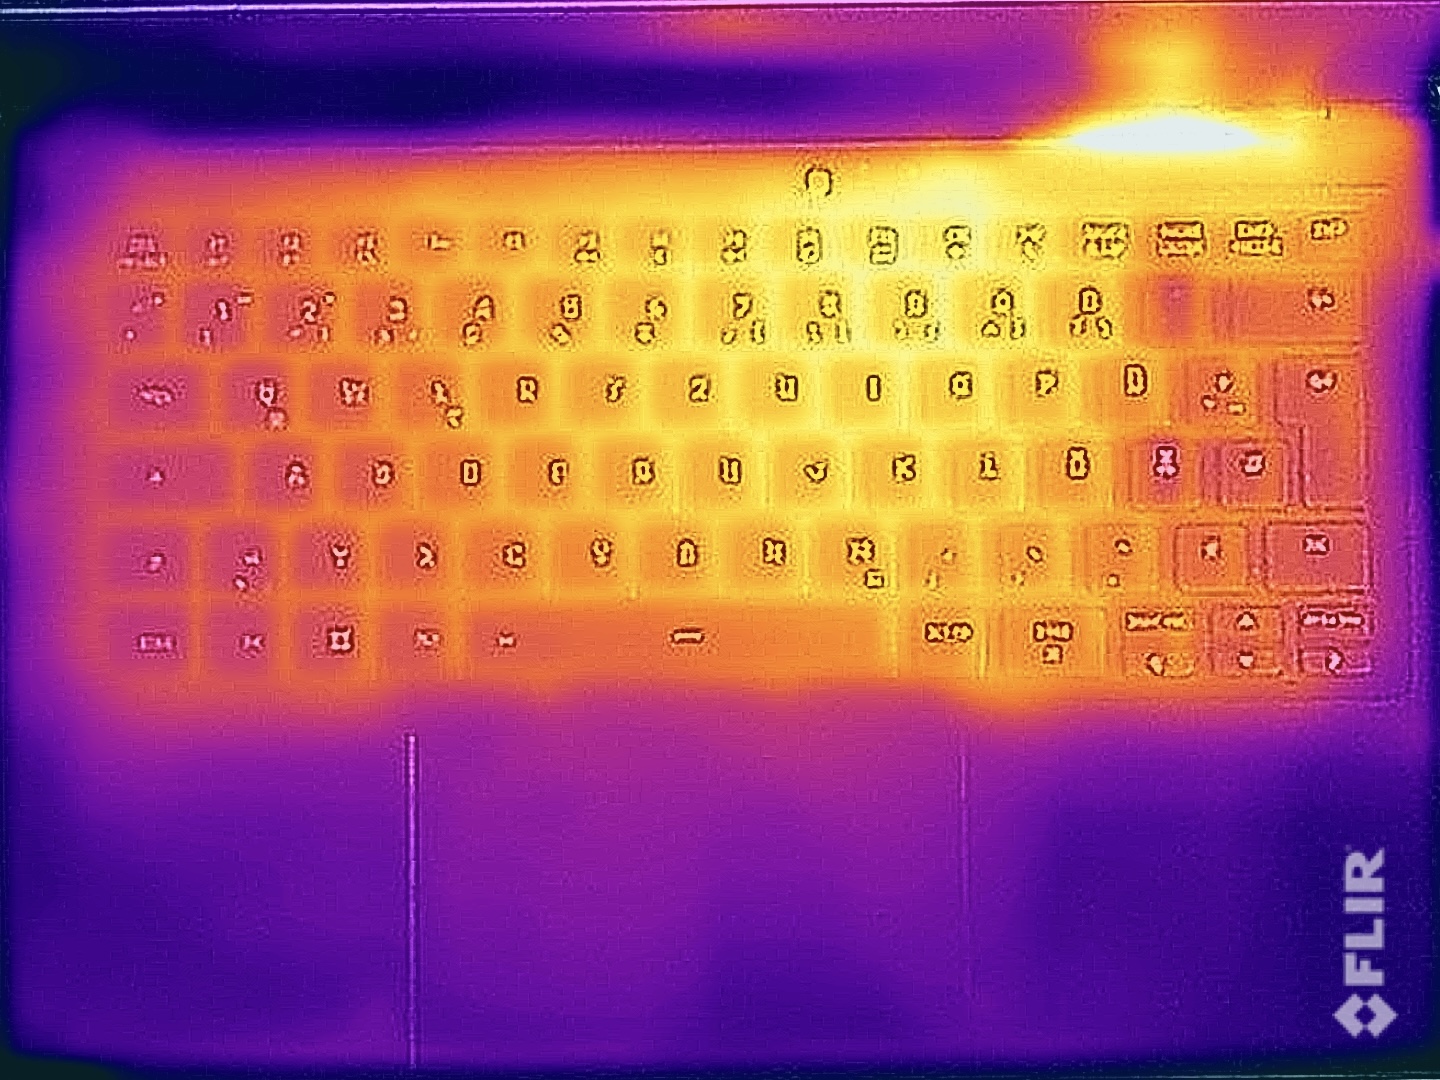
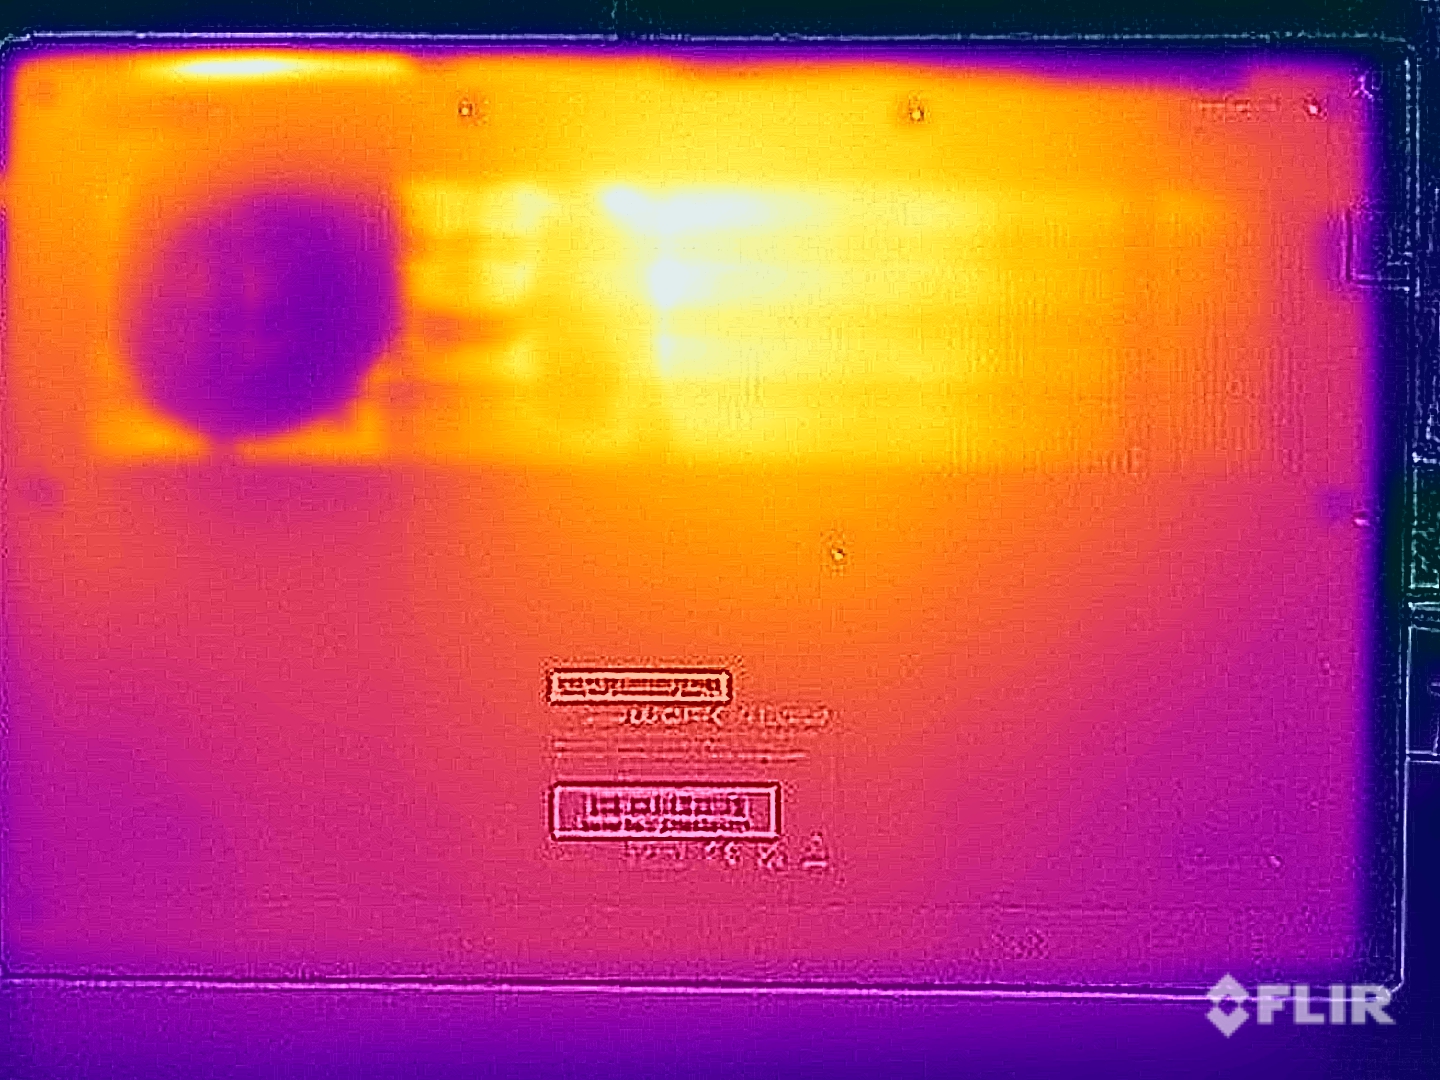
Temperatura
Las temperaturas de su superficie permanecen acríticas e incluso a plena carga, se puede colocar el Work 14 sobre los muslos sin problemas, además, los dedos no se calientan al teclear. Durante la prueba de estrés, el procesador consumió 20 vatios durante unos buenos minutos y durante el curso posterior, se equilibró entre 12 y 20 vatios.
(+) La temperatura máxima en la parte superior es de 39.2 °C / 103 F, frente a la media de 34.3 °C / 94 F, que oscila entre 21.2 y 62.5 °C para la clase Office.
(±) El fondo se calienta hasta un máximo de 40.4 °C / 105 F, frente a la media de 36.8 °C / 98 F
(+) En reposo, la temperatura media de la parte superior es de 24.4 °C / 76# F, frente a la media del dispositivo de 29.5 °C / 85 F.
(±) Jugando a The Witcher 3, la temperatura media de la parte superior es de 33.3 °C / 92 F, frente a la media del dispositivo de 29.5 °C / 85 F.
(+) El reposamanos y el panel táctil están a una temperatura inferior a la de la piel, con un máximo de 27 °C / 80.6 F y, por tanto, son fríos al tacto.
(±) La temperatura media de la zona del reposamanos de dispositivos similares fue de 27.5 °C / 81.5 F (+0.5 °C / 0.9 F).
| Schenker Work 14 Base Intel Core i5-1235U, Intel Iris Xe Graphics G7 80EUs | Acer Swift Go 14 SFG14-71 Intel Core i5-1335U, Intel Iris Xe Graphics G7 80EUs | HP ProBook 445 G10 AMD Ryzen 5 7530U, AMD Radeon RX Vega 7 | Dell Latitude 3440 Intel Core i5-1345U, Intel Iris Xe Graphics G7 80EUs | Lenovo ThinkPad L14 G4 21H6S00900 AMD Ryzen 5 7530U, AMD Radeon RX Vega 7 | |
|---|---|---|---|---|---|
| Heat | -12% | -15% | -8% | -16% | |
| Maximum Upper Side * (°C) | 39.2 | 44.8 -14% | 43 -10% | 35.2 10% | 39 1% |
| Maximum Bottom * (°C) | 40.4 | 34.8 14% | 51 -26% | 41 -1% | 46.3 -15% |
| Idle Upper Side * (°C) | 25.3 | 30.7 -21% | 27 -7% | 29.8 -18% | 26.3 -4% |
| Idle Bottom * (°C) | 25.8 | 32.5 -26% | 30 -16% | 32 -24% | 37.5 -45% |
* ... más pequeño es mejor
Altavoces
Los dos altavoces estéreo del portátil pueden alcanzar un volumen máximo elevado, sin embargo, su calidad general es extremadamente débil y uno de los principales puntos débiles del Work 14. Aunque los portátiles de oficina económicos nunca son realmente famosos por su impresionante sonido, el Dell Latitude 14 demuestra que se puede hacer más. El resto de la competencia también tiene ventaja en este aspecto.
Schenker Work 14 Base análisis de audio
(+) | los altavoces pueden reproducir a un volumen relativamente alto (#84.4 dB)
Graves 100 - 315 Hz
(-) | casi sin bajos - de media 22.8% inferior a la mediana
(±) | la linealidad de los graves es media (8.6% delta a frecuencia anterior)
Medios 400 - 2000 Hz
(±) | medias más altas - de media 9.7% más altas que la mediana
(±) | la linealidad de los medios es media (11.7% delta respecto a la frecuencia anterior)
Altos 2 - 16 kHz
(+) | máximos equilibrados - a sólo 4.6% de la mediana
(±) | la linealidad de los máximos es media (8.5% delta a frecuencia anterior)
Total 100 - 16.000 Hz
(±) | la linealidad del sonido global es media (25.9% de diferencia con la mediana)
En comparación con la misma clase
» 79% de todos los dispositivos probados de esta clase eran mejores, 7% similares, 14% peores
» El mejor tuvo un delta de 7%, la media fue 21%, el peor fue ###max##%
En comparación con todos los dispositivos probados
» 80% de todos los dispositivos probados eran mejores, 4% similares, 16% peores
» El mejor tuvo un delta de 4%, la media fue 23%, el peor fue ###max##%
Dell Latitude 3440 análisis de audio
(+) | los altavoces pueden reproducir a un volumen relativamente alto (#85.8 dB)
Graves 100 - 315 Hz
(±) | lubina reducida - en promedio 14.6% inferior a la mediana
(±) | la linealidad de los graves es media (9.8% delta a frecuencia anterior)
Medios 400 - 2000 Hz
(+) | medios equilibrados - a sólo 3% de la mediana
(+) | los medios son lineales (3.5% delta a la frecuencia anterior)
Altos 2 - 16 kHz
(+) | máximos equilibrados - a sólo 4.2% de la mediana
(+) | los máximos son lineales (5.9% delta a la frecuencia anterior)
Total 100 - 16.000 Hz
(+) | el sonido global es lineal (11.6% de diferencia con la mediana)
En comparación con la misma clase
» 3% de todos los dispositivos probados de esta clase eran mejores, 2% similares, 95% peores
» El mejor tuvo un delta de 7%, la media fue 21%, el peor fue ###max##%
En comparación con todos los dispositivos probados
» 8% de todos los dispositivos probados eran mejores, 2% similares, 90% peores
» El mejor tuvo un delta de 4%, la media fue 23%, el peor fue ###max##%
Consumo de energía
No observamos ninguna sorpresa en cuanto a los valores de consumo de energía del dispositivo y la fuente de alimentación de 45 vatios es más que suficiente.
| Off / Standby | |
| Ocioso | |
| Carga |
|
Clave:
min: | |
Power consumption Witcher 3 / stress test
Power consumption with external monitor
Tiempos de ejecución
El Work 14 dispone de una batería de 49 Wh, lo que se traduce en una autonomía práctica de 7:38 horas a 150 cd/m² (38 % del brillo máximo de nuestro dispositivo de prueba) y de 5:33 horas a brillo máximo durante nuestra prueba WLAN. Como resultado, este dispositivo quedó por detrás de la mayoría de la competencia y el Work 14 no conseguirá aguantar una jornada laboral completa sin necesitar su cargador. Cargar el dispositivo por completo lleva unas 2,5 horas con él encendido.
Pro
Contra
Veredicto - Un portátil de oficina con buenas opciones de mantenimiento
El Schenker Work 14 Base es un portátil de oficina básico que, además de una carcasa de aluminio, cuenta con muy buenas opciones de mantenimiento y una amplia selección de puertos. Por desgracia, tendrá que prescindir de estándares modernos como USB4 y Thunderbolt pero, a cambio, cuenta con suficientes puertos USB y una conexión Gigabit Ethernet, algo que no siempre se da por hecho en los portátiles de oficina de hoy en día. Su carcasa de aluminio parece de más calidad que las de plástico de sus competidores, sin embargo, sus superficies atraen muchas marcas de huellas dactilares y notamos algunos ligeros crujidos durante nuestra prueba.
El portátil está equipado con un Core i5-1235U anticuado que utiliza límites de potencia bajos, por lo que su rendimiento es completamente suficiente para las tareas cotidianas sencillas. En parte, su SSD PCIe también es responsable de esta buena impresión subjetiva. Por otro lado, su pequeño ventilador resulta bastante molesto bajo carga, ya que emite un ruido agudo y, en general, resulta demasiado ruidoso. La pantalla IPS mate del portátil con resolución Full HD es muy brillante con 400 cd/m².
El Schenker Work 14 Base es un portátil de oficina sencillo con una carcasa de aluminio, buenas opciones de mantenimiento y una pantalla IPS mate. Sin embargo, tendrá que vivir con una imagen granulada y un nivel de rendimiento generalmente bajo.
El Work 14 Base tampoco lo tiene fácil para competir con sus competidores, que en general ofrecen un rendimiento ligeramente superior, mayor autonomía y mejores altavoces. las pantallas 16:9, sin embargo, siguen siendo la norma dentro de esta clase de precio y, en general, tendrá que hacer algunos compromisos dentro de este segmento cuando se trata de rendimiento.
Precio y disponibilidad
Actualmente, la Schenker Work 14 Base se vende al por menor por unos 750 dólares, pero no está disponible para su compra en Estados Unidos.
Schenker Work 14 Base
- 05/01/2024 v7 (old)
Andreas Osthoff
Transparencia
La selección de los dispositivos que se van a reseñar corre a cargo de nuestro equipo editorial. La muestra de prueba fue proporcionada al autor en calidad de préstamo por el fabricante o el minorista a los efectos de esta reseña. El prestamista no tuvo ninguna influencia en esta reseña, ni el fabricante recibió una copia de la misma antes de su publicación. No había ninguna obligación de publicar esta reseña. Como empresa de medios independiente, Notebookcheck no está sujeta a la autoridad de fabricantes, minoristas o editores.
Así es como prueba Notebookcheck
Cada año, Notebookcheck revisa de forma independiente cientos de portátiles y smartphones utilizando procedimientos estandarizados para asegurar que todos los resultados son comparables. Hemos desarrollado continuamente nuestros métodos de prueba durante unos 20 años y hemos establecido los estándares de la industria en el proceso. En nuestros laboratorios de pruebas, técnicos y editores experimentados utilizan equipos de medición de alta calidad. Estas pruebas implican un proceso de validación en varias fases. Nuestro complejo sistema de clasificación se basa en cientos de mediciones y puntos de referencia bien fundamentados, lo que mantiene la objetividad.Price comparison

