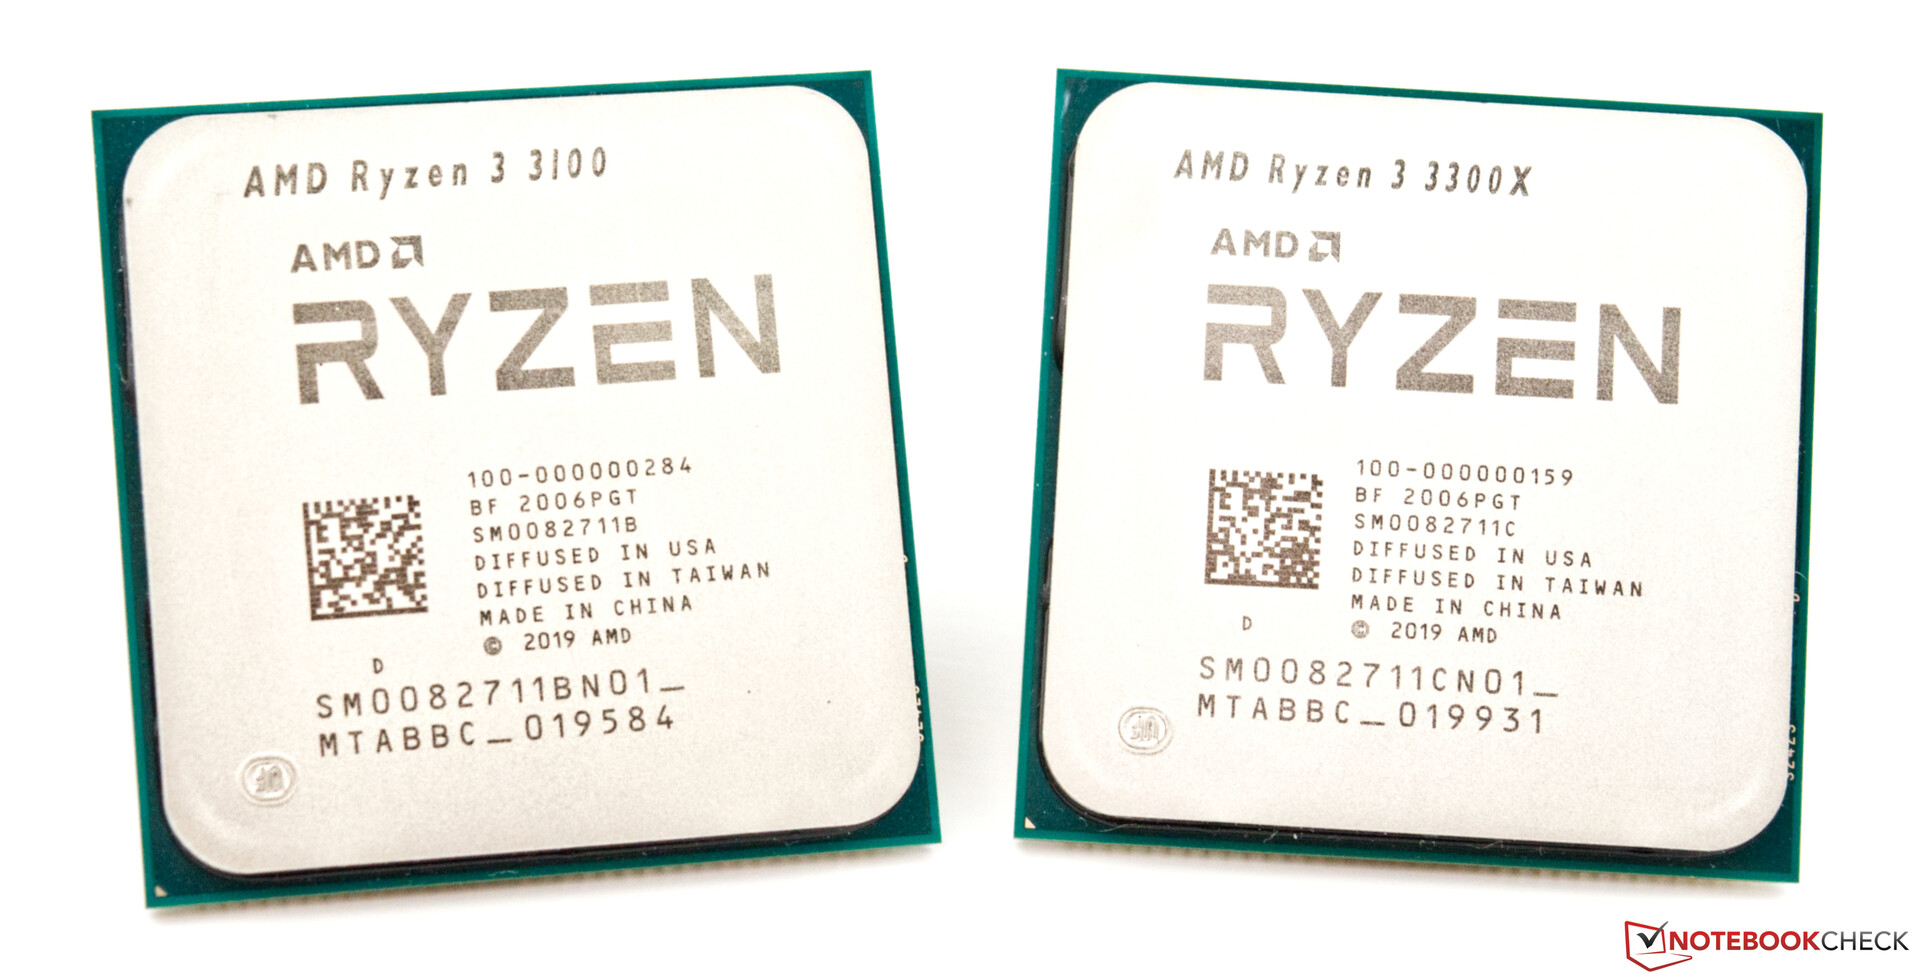
Review de AMD Ryzen 3 3100 y Ryzen 3 3300X con 4 núcleos y 8 hilos
El simple jugador no necesita necesariamente una CPU de 12 o 16 núcleos, que se ofrece como modelo superior para la plataforma AM4. En su lugar, cuatro núcleos con una alta velocidad de reloj son suficientes. Este ha sido el argumento que ha contado hasta la fecha. Intel siempre estuvo un paso adelante de AMD en este aspecto debido a la mucho mejor IPC, pero esto ha cambiado un poco con la introducción de la arquitectura Zen2. AMD fue capaz de ponerse al día considerablemente y también las CPUs de nivel básico se benefician de estas ventajas ahora.
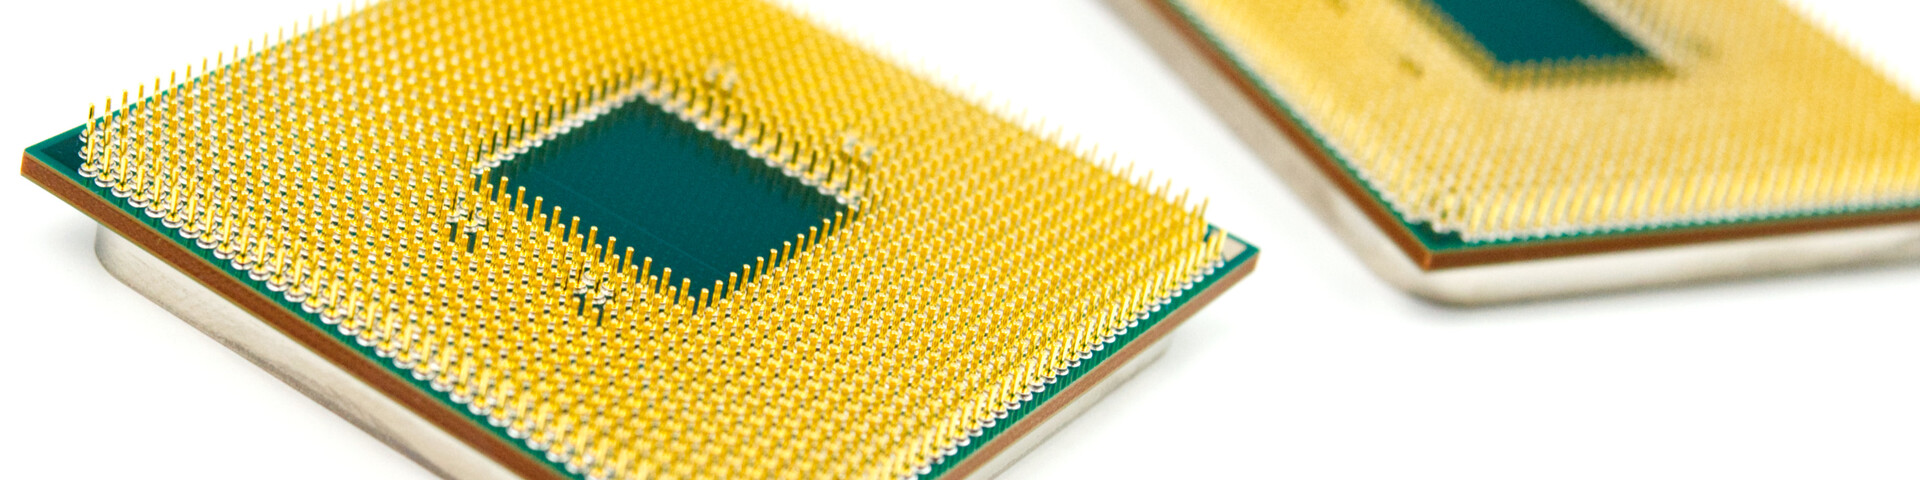
A diferencia de Intel, estas CPUs también ofrecen SMT, lo que significa que un total de 8 hilos pueden ser procesados simultáneamente, porque tanto el Ryzen 3 3100 como el Ryzen 3 3300X son procesadores nativos de cuatro núcleos. Queda por ver cómo se comportarán las nuevas CPU de AMD frente a los ya anunciados procesadores de Comet Lake, porque Intel también ha aprendido una lección y está usando Hyper-Threading en casi todos los nuevos procesadores.
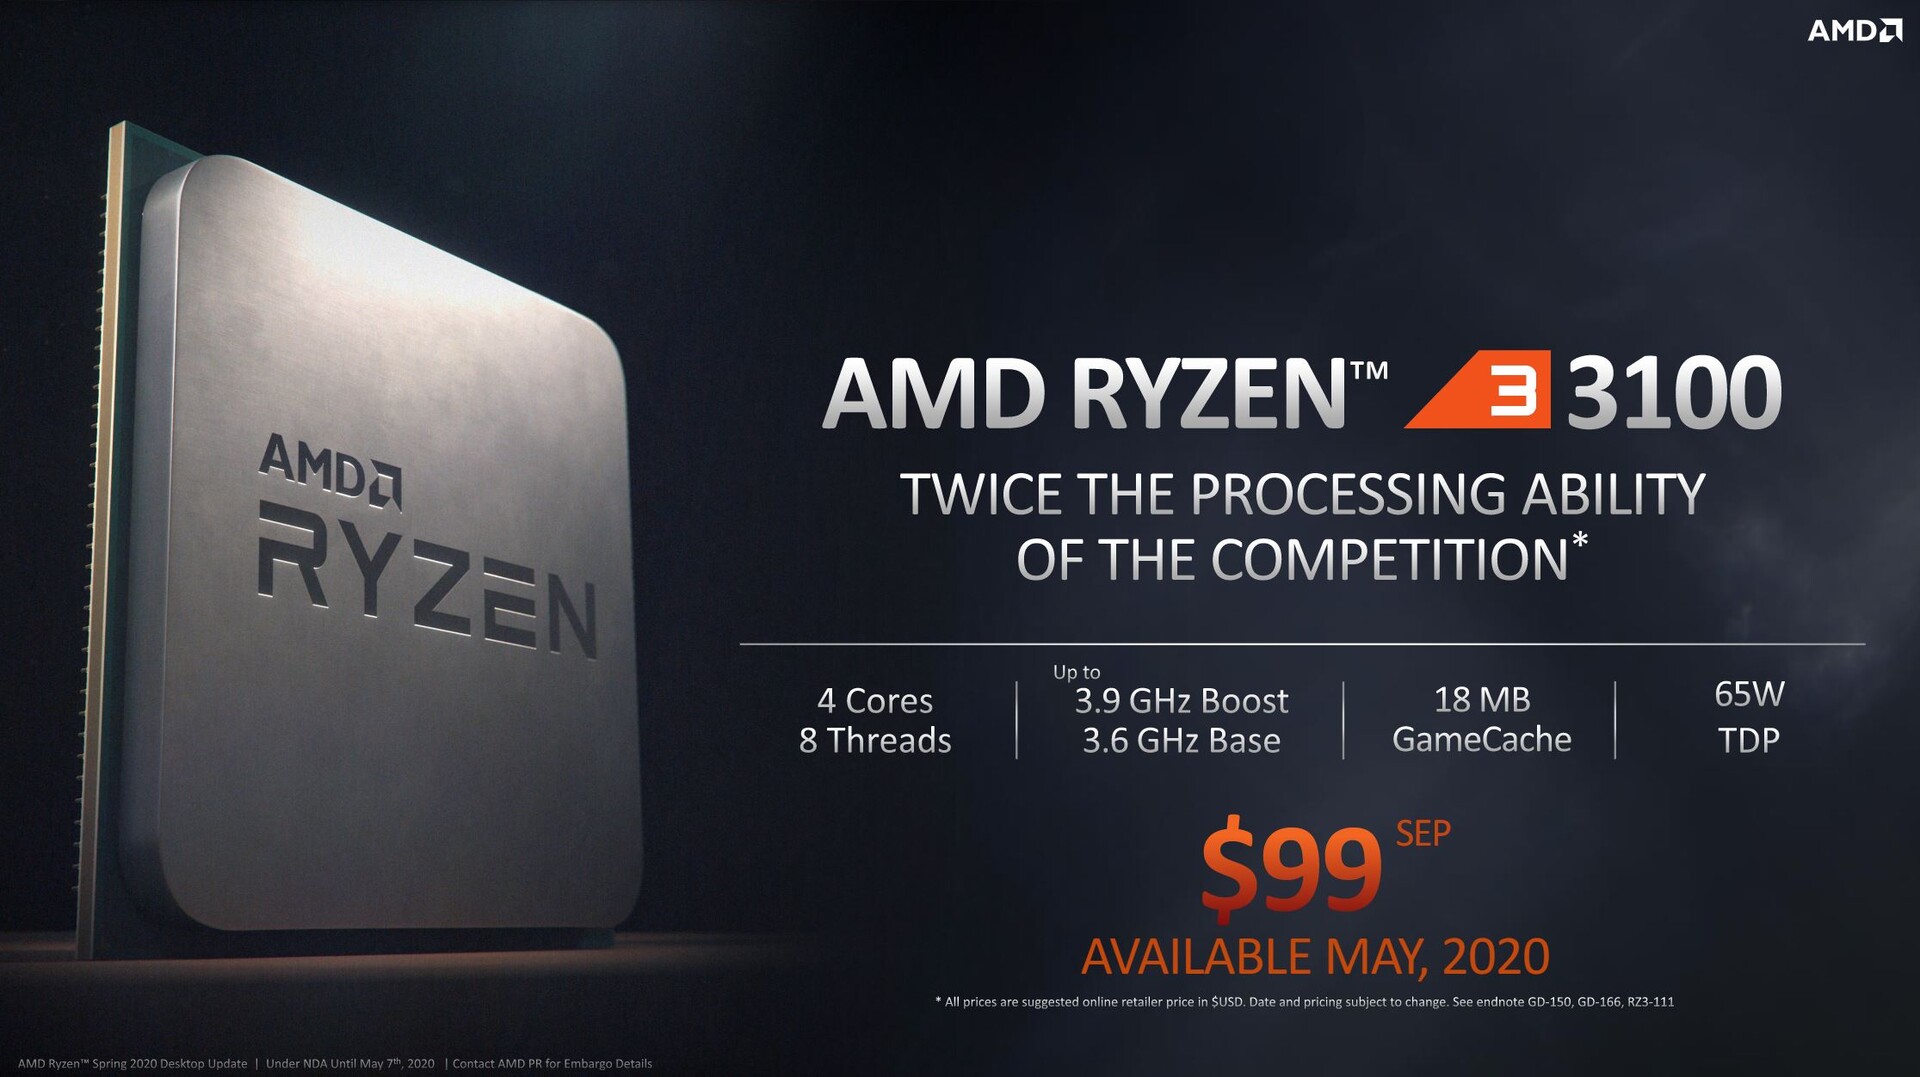
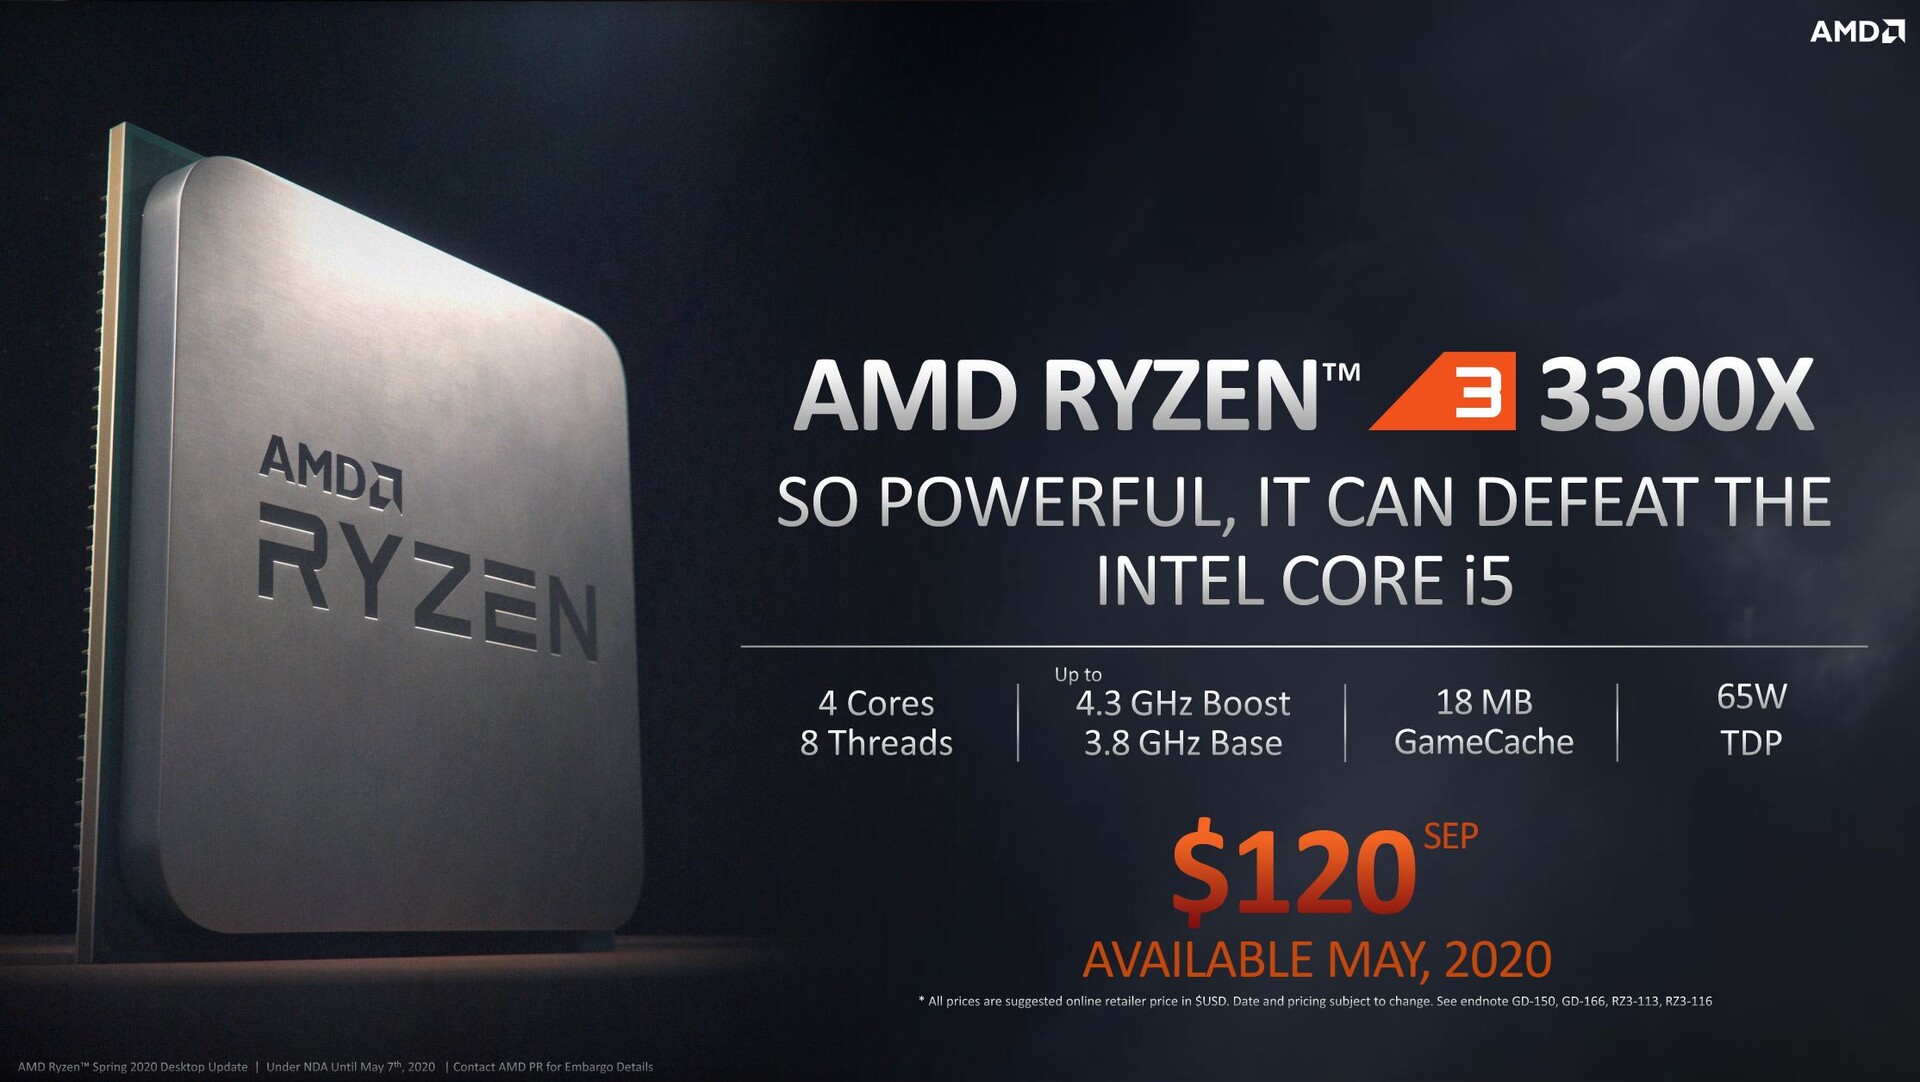
AMD ha puesto a Intel bajo mucha presión últimamente, lo que en última instancia también ha tenido un impacto en los precios. AMD continúa en este camino, y el Ryzen 3 3100 cuesta poco menos de 110 Euros (~$119) en su lanzamiento, aunque el Ryzen 3 3300X cuesta sólo unos 20 Euros (~$22) más a poco menos de 130 Euros (~$141). Esta es una clara declaración de guerra contra Intel, ya que el Intel Core i5-9400F cuesta alrededor de 160 Euros (~$173) al momento de realizar la revisión.
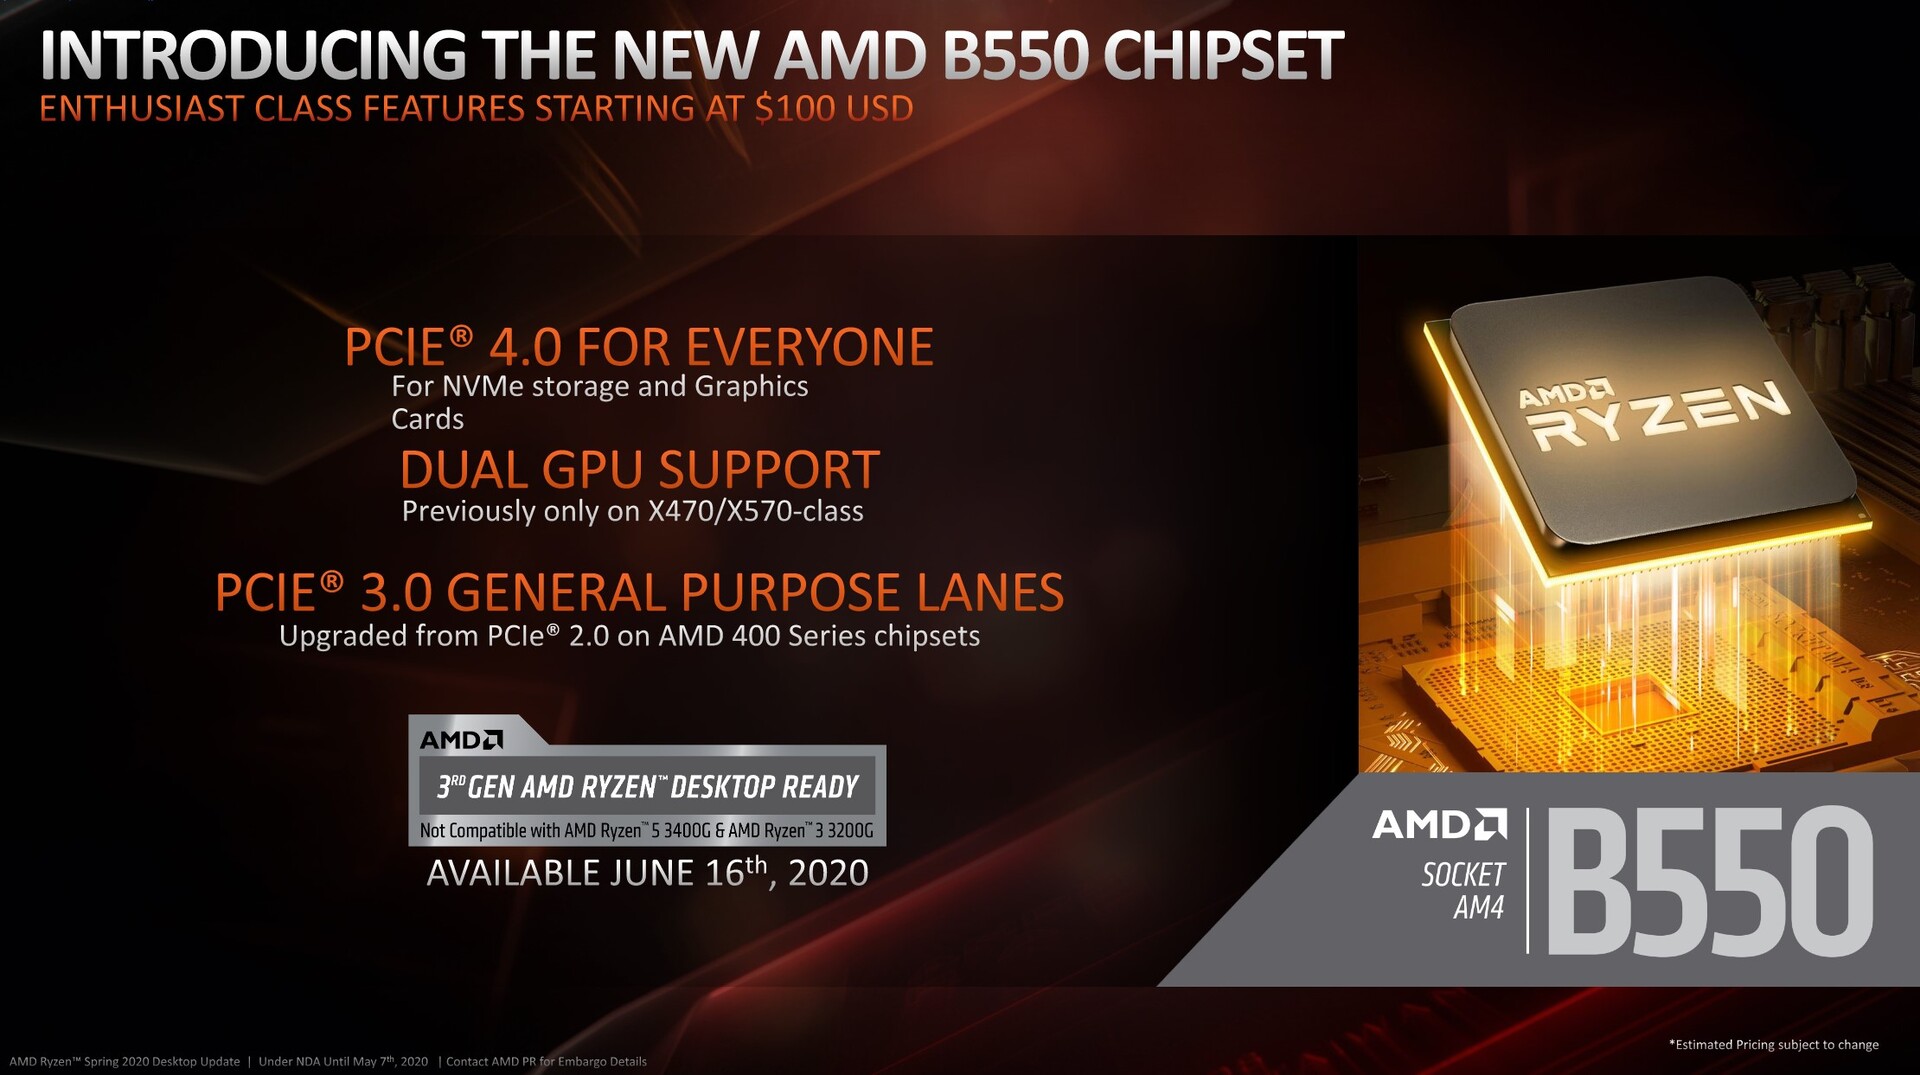
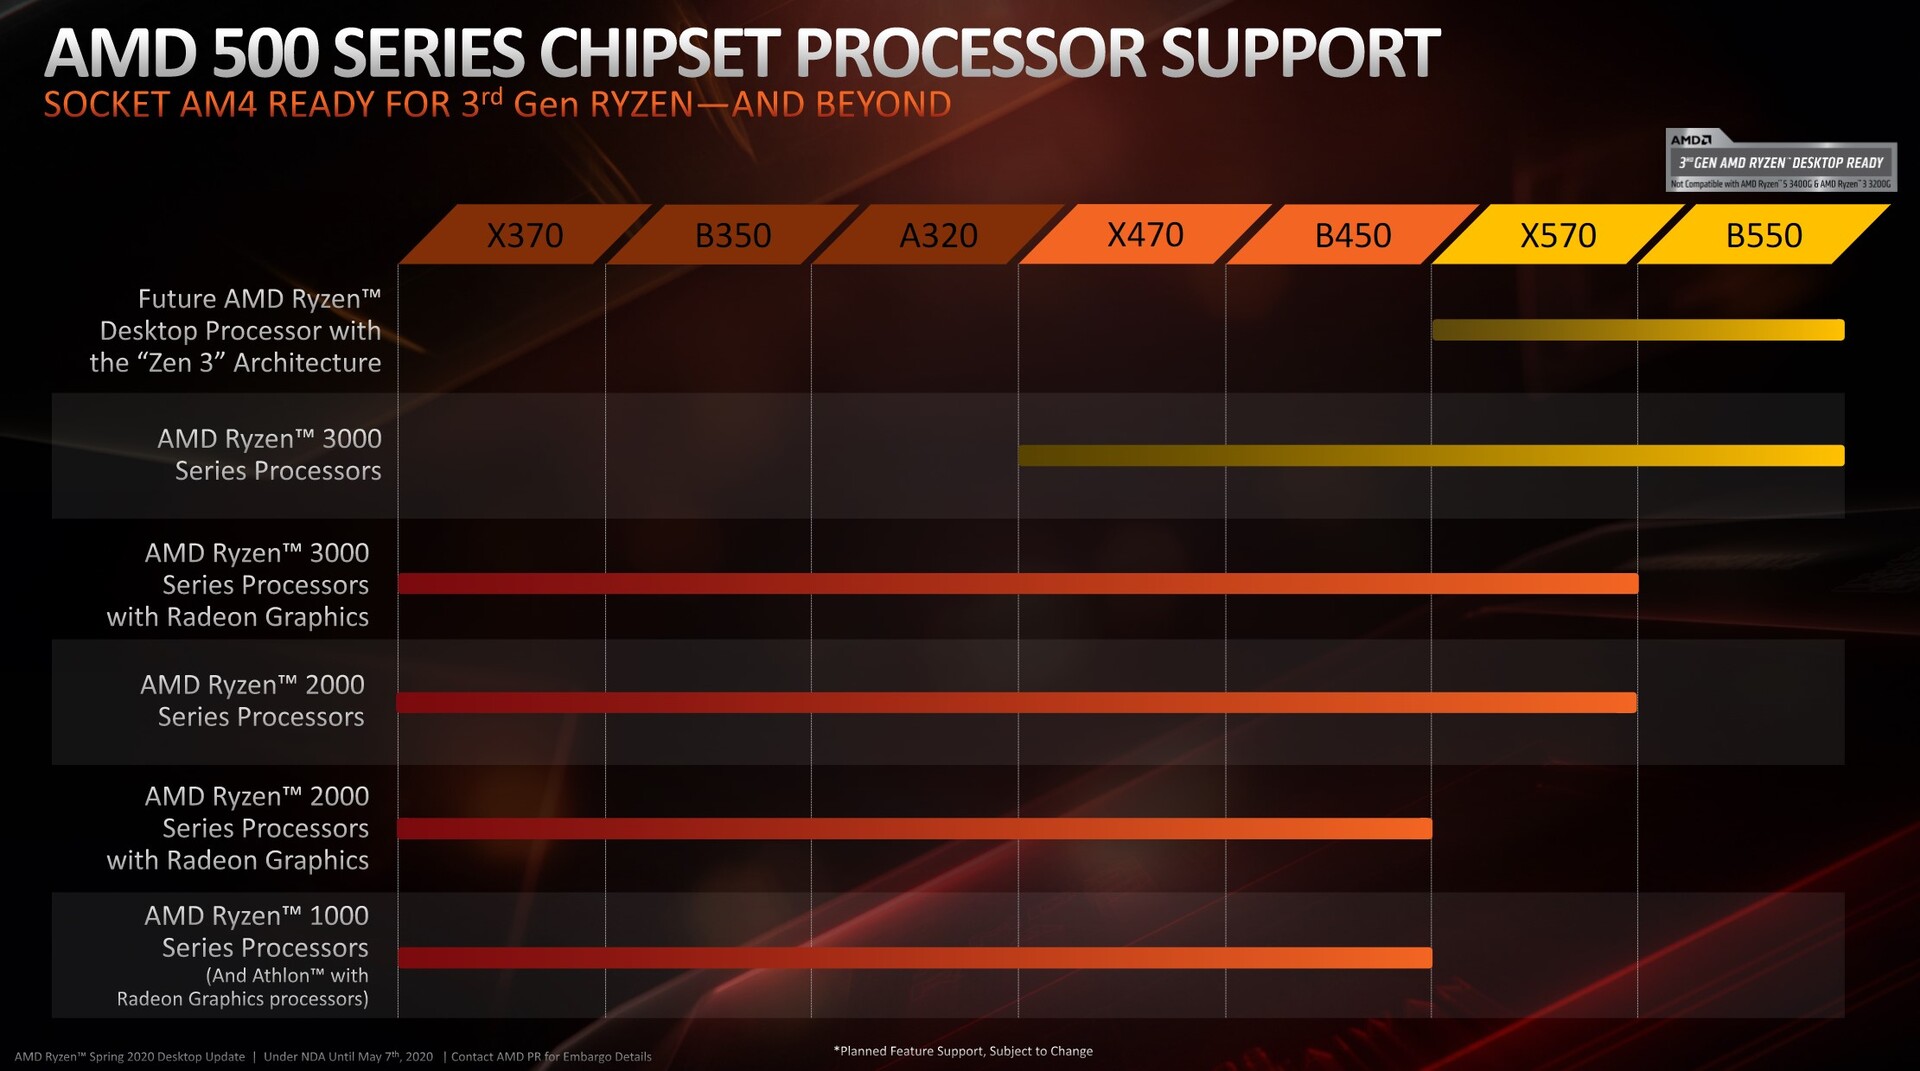
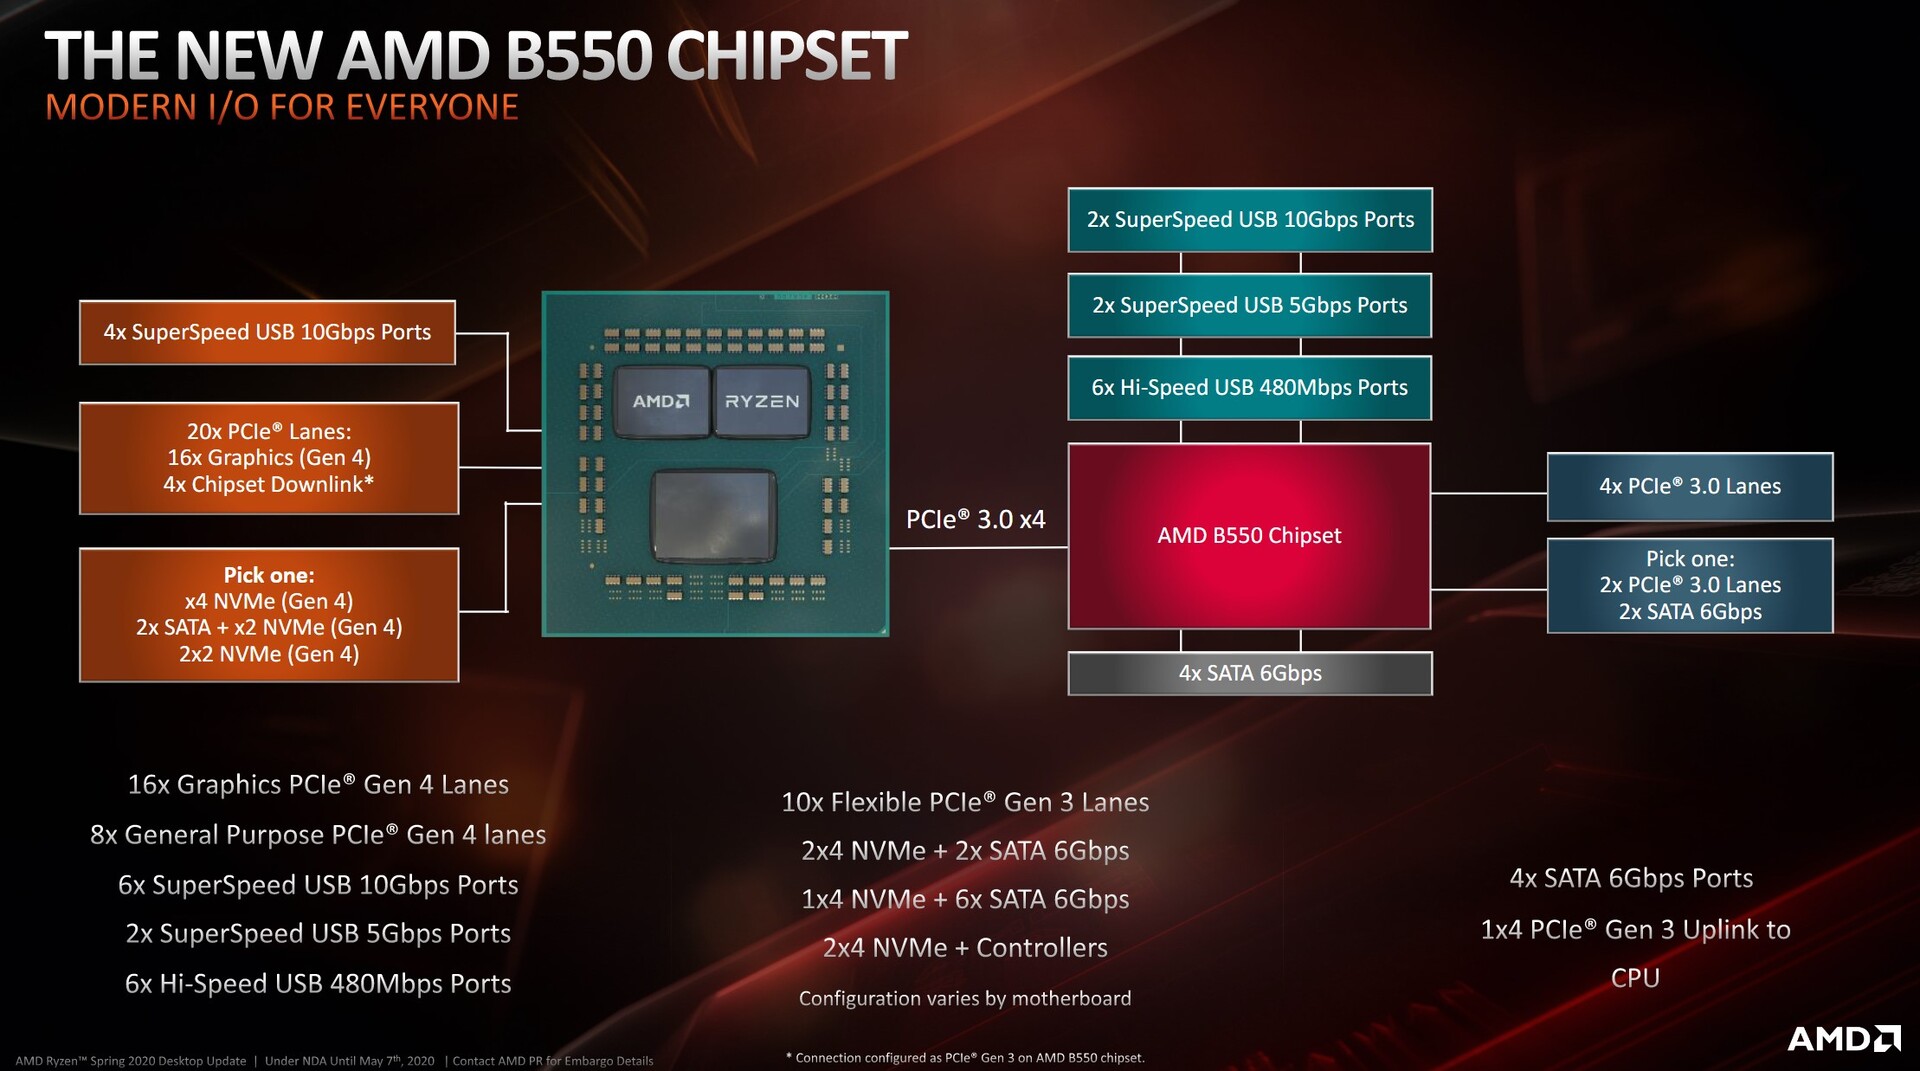
Si quieres usar la nueva serie Ryzen 3 3000, no tienes que instalar necesariamente una costosa placa X570. Con el lanzamiento de los dos nuevos modelos Ryzen, AMD también introdujo el chipset B550, que permite placas madre mucho más baratas. Pero si todavía tienes una placa madre con el chipset X470 o B450, tienes suerte porque también son compatibles después de una actualización de la BIOS. Los futuros procesadores Zen3 sólo serán compatibles con los últimos chipsets en ese momento.
The AMD Ryzen processors in overview
| Modelo-Cores/ Threads |
Velocidad del reloj base | Velocidad del reloj turbo | L3 cache | Precio de lanzamiento |
|---|---|---|---|---|
| Ryzen R9 3900X | 12/24 | 3.8 GHz | 4.6 GHz | 64 MB |
| Ryzen R7 3800X | 8/16 | 3.9 GHz | 4.5 GHz | 32 MB |
| Ryzen R7 3700X | 8/16 | 3.6 GHz | 4.4 GHz | 32 MB |
| Ryzen R5 3600X | 6/12 | 3.8 GHz | 4.4 GHz | 32 MB |
| Ryzen R5 3600 | 6/12 | 3.6 GHz | 4.2 GHz | 32 MB |
| Ryzen R3 3300X | 4/8 | 3.8 GHz | 4.3 GHz | 16 MB |
| Ryzen R3 3100 | 4/8 | 3.6 GHz | 3.9 GHz | 16 MB |
AMD Ryzen 3 3100 y AMD Ryzen 3 3300X en detalle
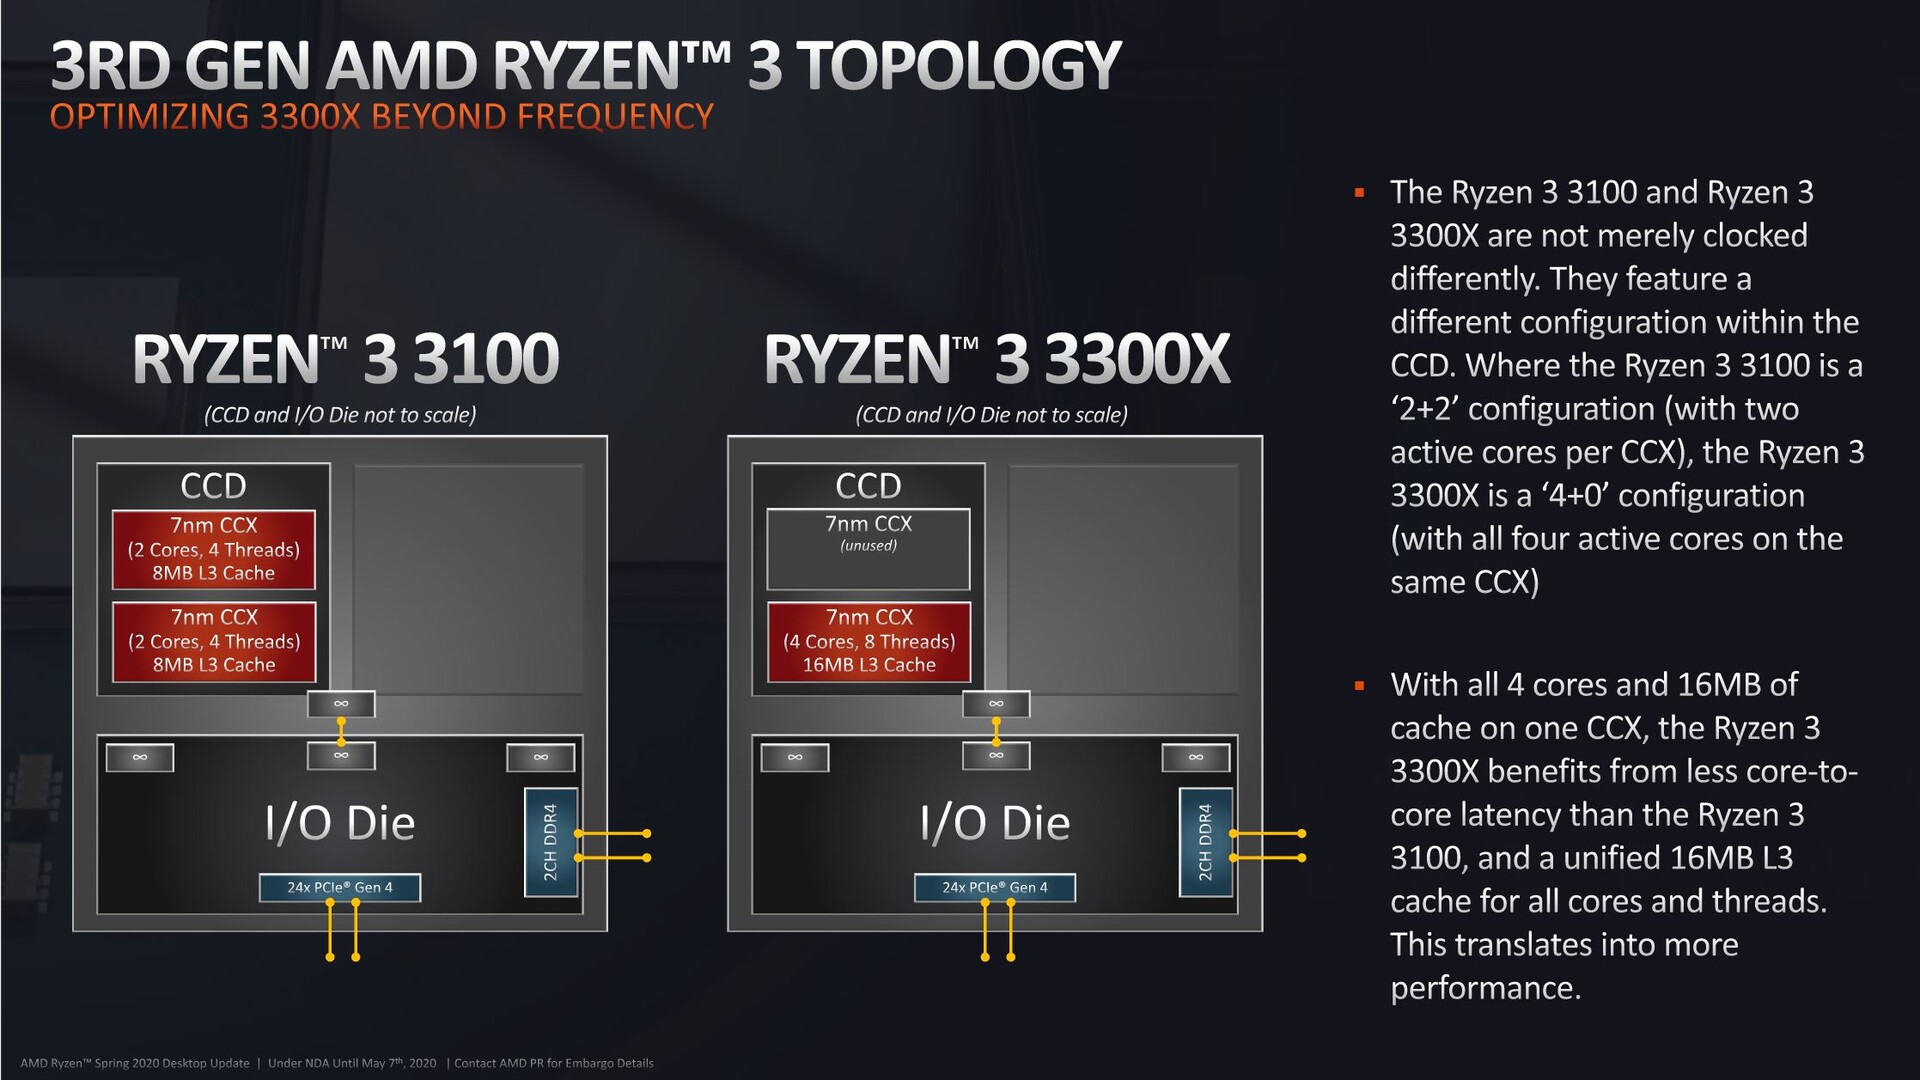
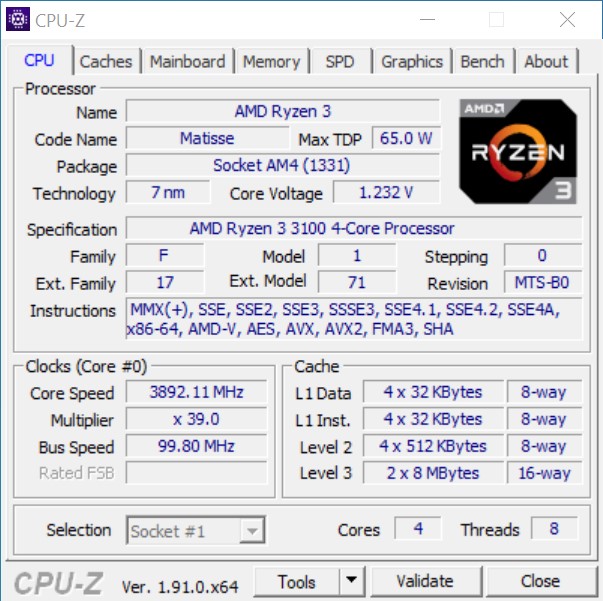
Como ya se ha mencionado, ambos modelos Ryzen 3 utilizan cuatro núcleos Zen2 incluyendo SMT (multihilo simultáneo). Sin embargo, hay claras diferencias en el diseño y uso de los núcleos nativos. El gráfico proporcionado por AMD muestra que el Ryzen 3 3100 tiene dos clusters CCX activos con dos núcleos activos cada uno. Un clúster CCX tiene un máximo de cuatro núcleos, como en el caso del ejemplo del Ryzen 3 3300X, que sólo tiene un clúster CCX activo.
Además, los dos procesadores difieren en sus velocidades de reloj, lo que también ayuda a definir las diferentes clases de rendimiento. Sin embargo, AMD especifica un TDP idéntico de 65 vatios para ambos procesadores. El propio AMD creó un ranking en términos de precio-rendimiento, lo que nos llevó a utilizar los competidores directos (Intel Core i3-9100F e Intel Core i5-9400F) para esta prueba.
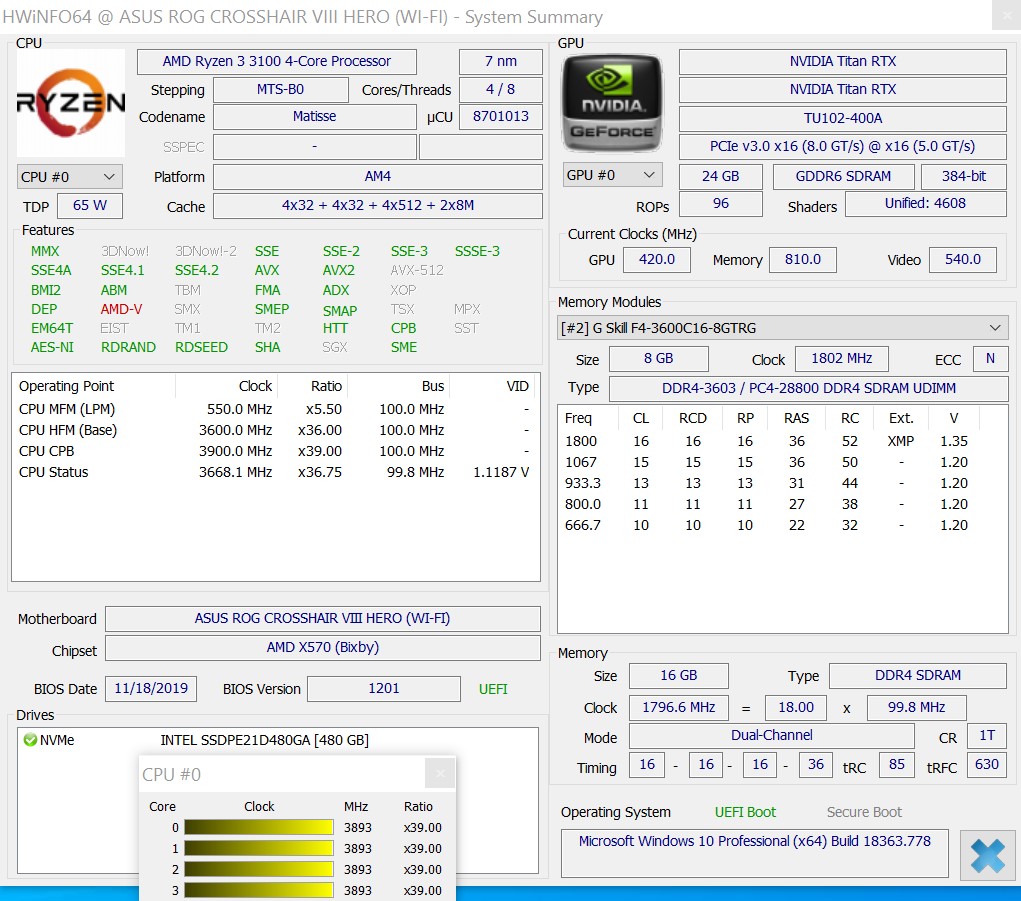
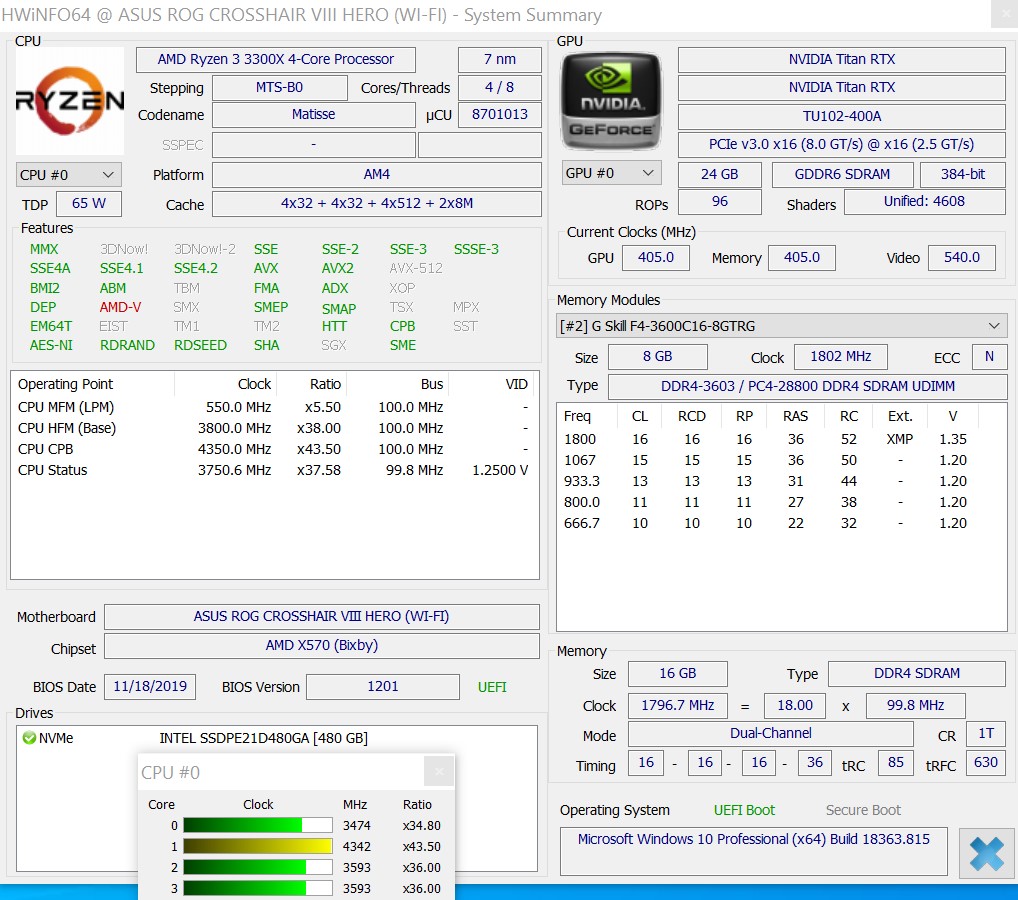
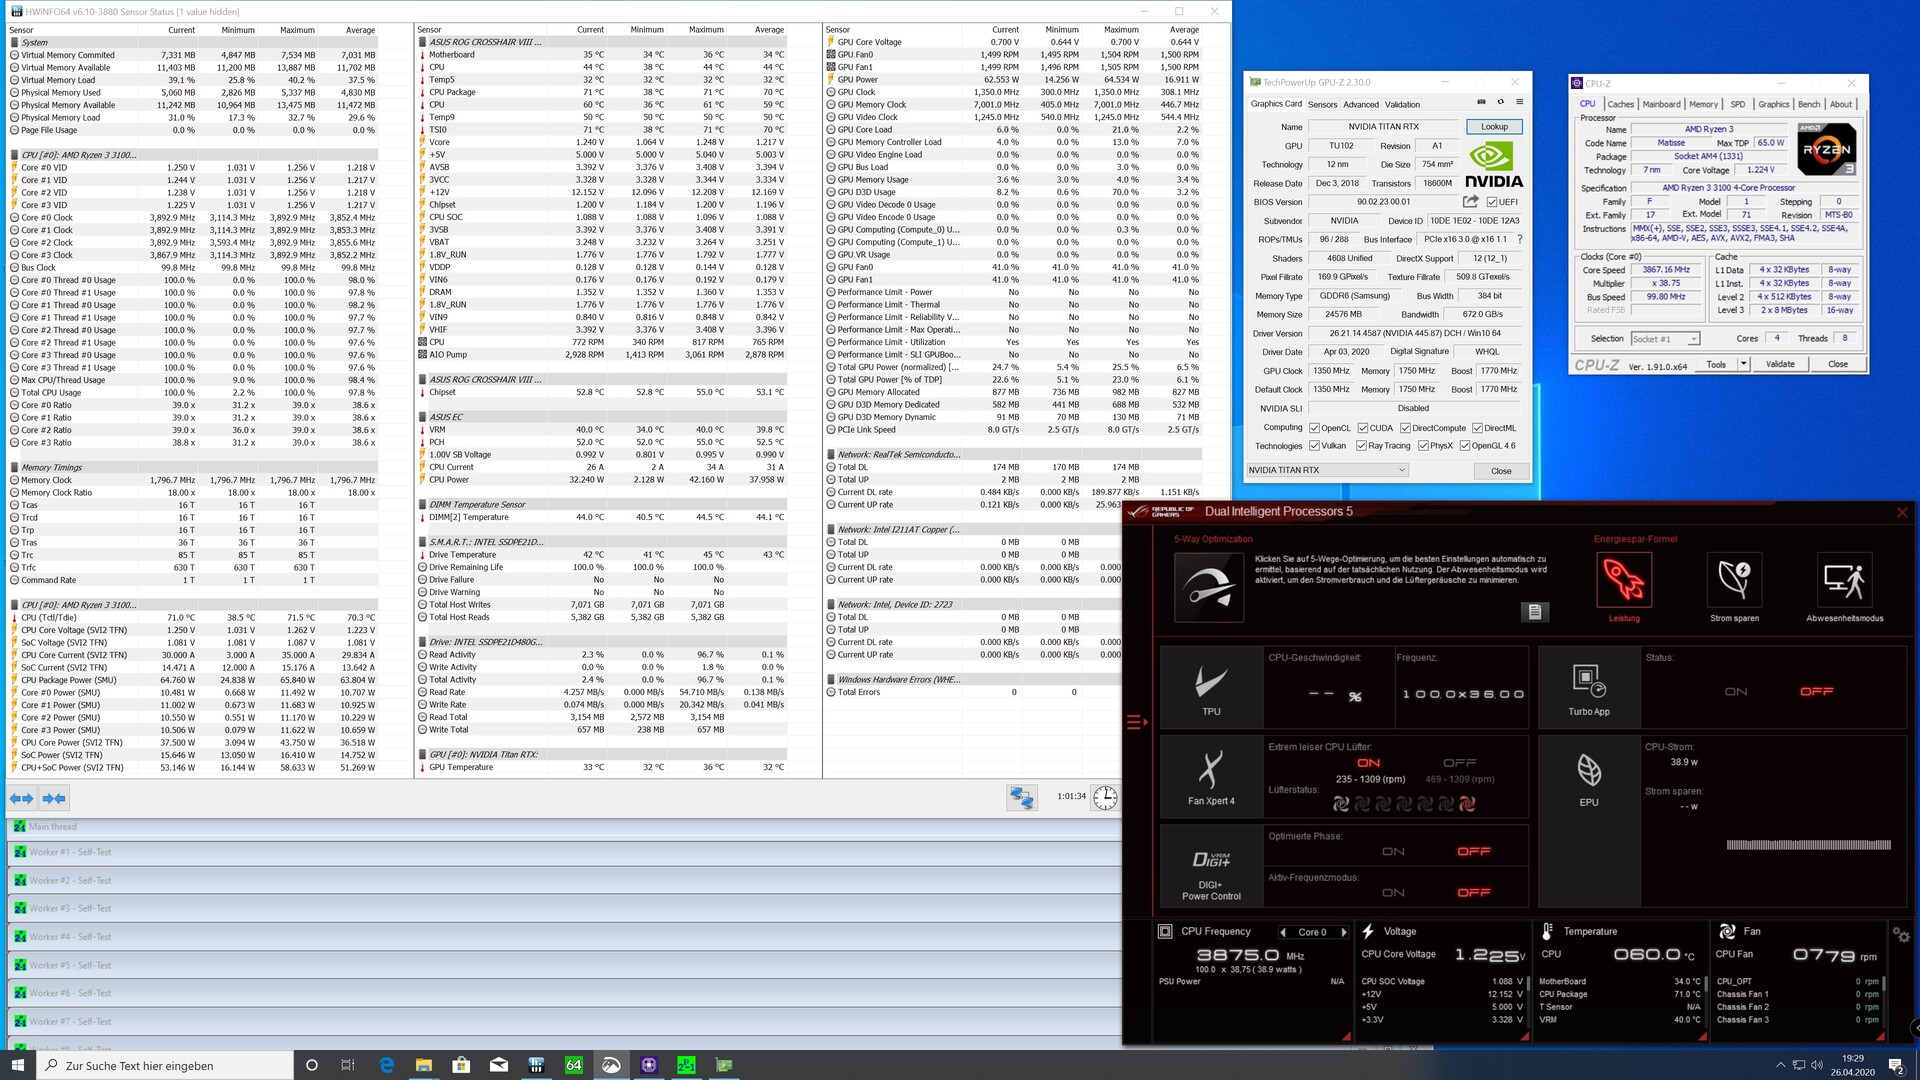
Detalles del sistema de pruebas - AMD vs. Intel
We use the following system for the subsequent benchmarks and tests:
- Raijintek Pean Benchtable
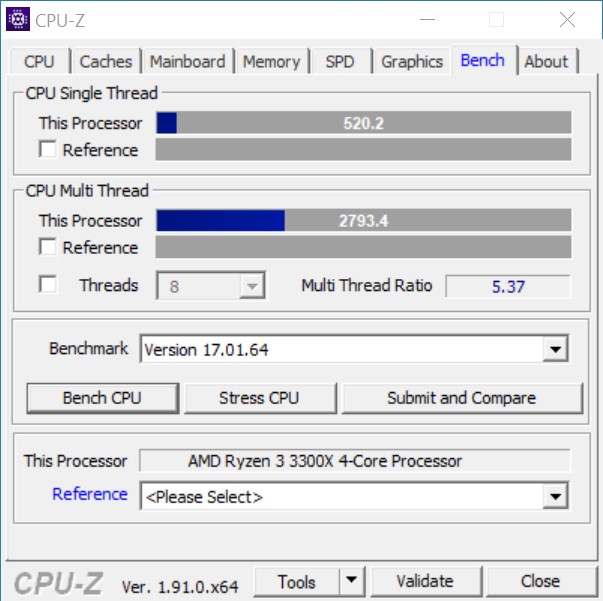
- AMD Ryzen 3 3100 / AMD Ryzen 3 3300X
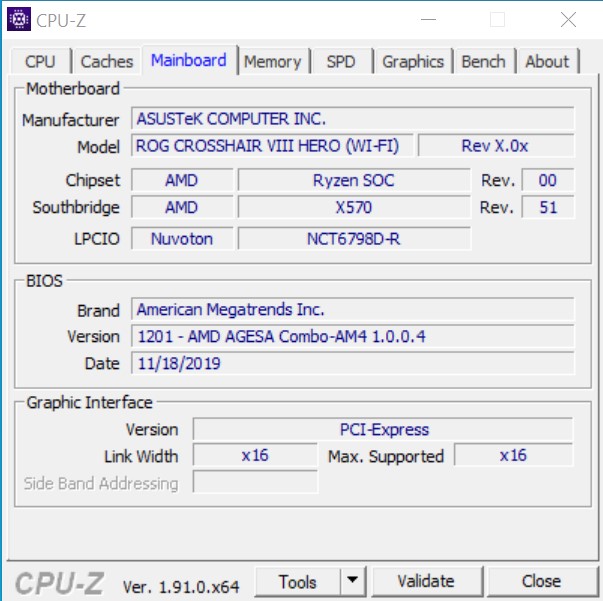
- Asus ROG Crosshair VIII Hero X570
- Intel Core i3-9100F / Intel Core i5-9400F
- Asus ROG Strix Z390E-Gaming
- Alphacool Eisbaer 280 AiO
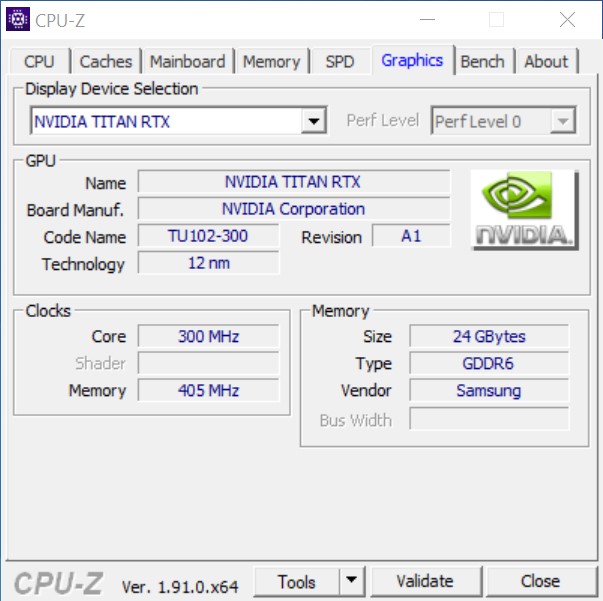
- Nvidia Titan RTX
Fuente de alimentación Corsair RM1000X
- Intel Optane 905P 480 GB PCIe SSD
- Kit de memoria G.Skill Trident Z Royal gold DDR4-3600 (2 x 8 GB), ajustado a DDR4-3600 CL16-16-16-36
- Microsoft Windows 10 Professional 64-bit (version 1909)
Los componentes proporcionados para esta prueba, como la placa madre y la RAM, así como las CPU, provienen directamente de AMD. También nos gustaría agradecer a Asus por prestarnos la placa base Z390, que sirve como nuestra fundación Intel. La refrigeración proviene de Alphacool, que también habíamos revisado ampliamente, y el caso vino a ser en cooperación con Caseking.
Puntos de referencia del procesador
Si nos fijamos únicamente en los puntos de referencia de la CPU, el AMD Ryzen 3 3300X marca claramente la pauta. Sin embargo, el Intel Core i5-9400F puede desplegar sus puntos fuertes en las pruebas del Geekbench Multi y fácilmente se pone delante del AMD Ryzen 3 3300X. Los seis núcleos de computación física del Intel Core i5 parecen rendir un poco aquí. En general, el procesador de núcleo hexa nativo no puede superar al AMD Ryzen 3 3300X. El Intel Core i3-9100F tiene que conformarse con el último lugar en casi todas las pruebas. Aquí se muestra claramente que un procesador de cuatro núcleos sin HT es destruido sin piedad en los sistemas modernos. Esto subraya una vez más el paso que AMD ha dado con el nuevo Ryzen 3 y que Intel también seguirá en un futuro próximo.
AMD Ryzen 3 3100


AMD Ryzen 3 3300X


| Performance rating - Percent | |
| Medio Intel Core i7-7740X | |
| AMD Ryzen 3 3300X | |
| Intel Core i5-9400F | |
| AMD Ryzen 3 3100 | |
| AMD Ryzen 5 1600 | |
| Intel Core i3-9100F | |
| Cinebench R10 | |
| Rendering Single CPUs 64Bit | |
| AMD Ryzen 3 3300X | |
| Medio Intel Core i7-7740X (n=1) | |
| AMD Ryzen 3 3100 | |
| Intel Core i3-9100F | |
| Intel Core i5-9400F | |
| AMD Ryzen 5 1600 | |
| Rendering Multiple CPUs 64Bit | |
| AMD Ryzen 5 1600 | |
| AMD Ryzen 3 3300X | |
| Intel Core i5-9400F | |
| Medio Intel Core i7-7740X (n=1) | |
| AMD Ryzen 3 3100 | |
| Intel Core i3-9100F | |
| Blender - v2.79 BMW27 CPU | |
| Intel Core i3-9100F | |
| AMD Ryzen 3 3100 | |
| Intel Core i5-9400F | |
| Medio Intel Core i7-7740X (n=1) | |
| AMD Ryzen 3 3300X | |
| AMD Ryzen 5 1600 | |
| WinRAR - Result | |
| AMD Ryzen 3 3300X | |
| Medio Intel Core i7-7740X (n=1) | |
| Intel Core i5-9400F | |
| AMD Ryzen 3 3100 | |
| AMD Ryzen 5 1600 | |
| Intel Core i3-9100F | |
| Geekbench 4.4 | |
| 64 Bit Single-Core Score | |
| Medio Intel Core i7-7740X (n=1) | |
| AMD Ryzen 3 3300X | |
| Intel Core i5-9400F | |
| Intel Core i3-9100F | |
| AMD Ryzen 3 3100 | |
| AMD Ryzen 5 1600 | |
| 64 Bit Multi-Core Score | |
| Intel Core i5-9400F | |
| AMD Ryzen 5 1600 | |
| AMD Ryzen 3 3300X | |
| Medio Intel Core i7-7740X (n=1) | |
| AMD Ryzen 3 3100 | |
| Intel Core i3-9100F | |
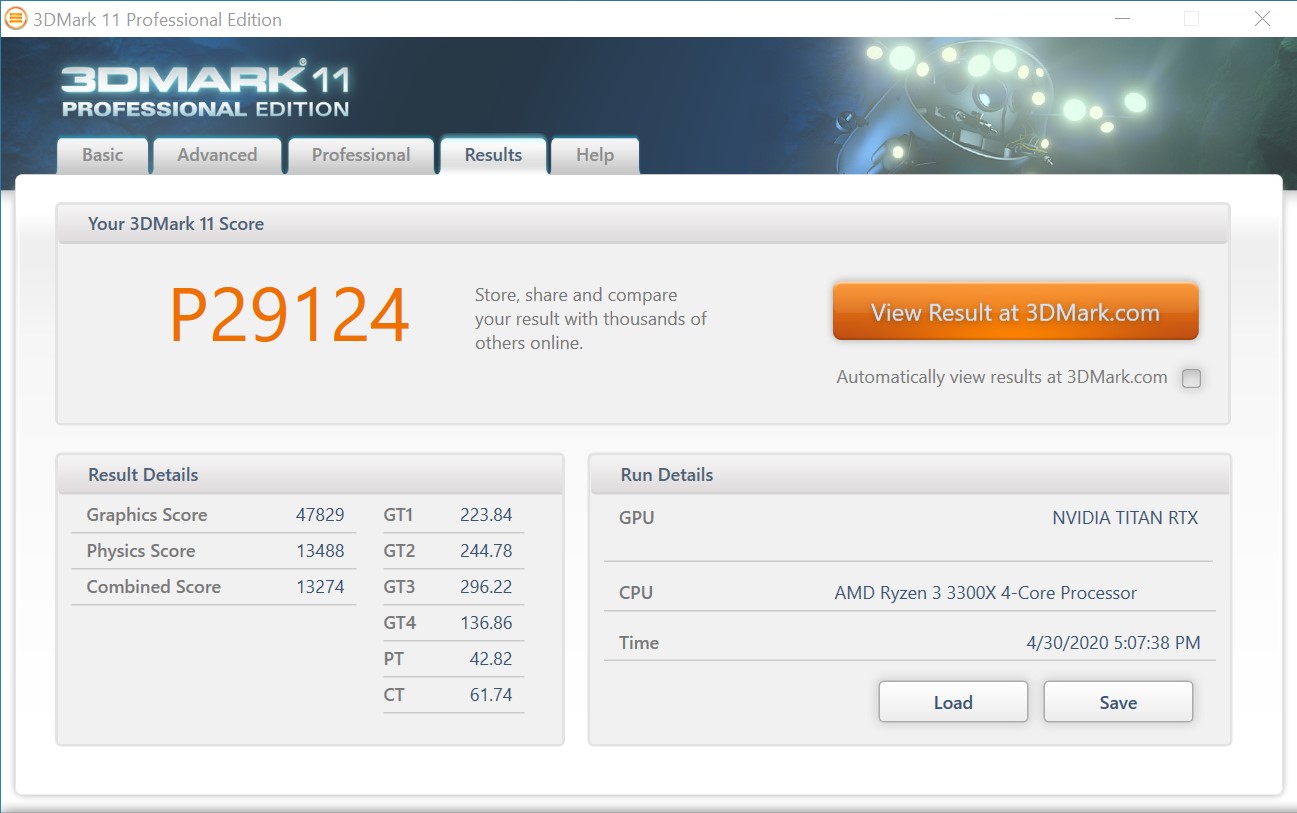
| 3DMark 11 - 1280x720 Performance Physics | |
| AMD Ryzen 3 3300X | |
| Medio Intel Core i7-7740X (12196 - 12488, n=6) | |
| AMD Ryzen 5 1600 | |
| Intel Core i5-9400F | |
| AMD Ryzen 3 3100 | |
| Intel Core i3-9100F | |
| HWBOT x265 Benchmark v2.2 - 4k Preset | |
| Intel Core i5-9400F | |
| Medio Intel Core i7-7740X (n=1) | |
| AMD Ryzen 3 3300X | |
| AMD Ryzen 3 3100 | |
| AMD Ryzen 5 1600 | |
| Intel Core i3-9100F | |
| R Benchmark 2.5 - Overall mean | |
| Intel Core i5-9400F | |
| Intel Core i3-9100F | |
| AMD Ryzen 5 1600 | |
| AMD Ryzen 3 3100 | |
| Medio Intel Core i7-7740X (n=1) | |
| AMD Ryzen 3 3300X | |
| LibreOffice - 20 Documents To PDF | |
| AMD Ryzen 5 1600 | |
| Intel Core i3-9100F | |
| AMD Ryzen 3 3100 | |
| Intel Core i5-9400F | |
| Medio Intel Core i7-7740X (n=1) | |
| AMD Ryzen 3 3300X | |
| WebXPRT 3 - Overall | |
| Medio Intel Core i7-7740X (247 - 265, n=2) | |
| AMD Ryzen 3 3300X | |
| Intel Core i5-9400F | |
| AMD Ryzen 3 3100 | |
| Intel Core i3-9100F | |
| AMD Ryzen 5 1600 | |
| Mozilla Kraken 1.1 - Total | |
| AMD Ryzen 5 1600 | |
| Intel Core i5-9400F | |
| Intel Core i3-9100F | |
| AMD Ryzen 3 3100 | |
| Medio Intel Core i7-7740X (n=1) | |
| AMD Ryzen 3 3300X | |
| 3DMark | |
| 3840x2160 Fire Strike Ultra Physics | |
| AMD Ryzen 5 1600 | |
| AMD Ryzen 3 3300X | |
| Medio Intel Core i7-7740X (n=1) | |
| AMD Ryzen 3 3100 | |
| Intel Core i5-9400F | |
| Intel Core i3-9100F | |
| 1920x1080 Fire Strike Physics | |
| AMD Ryzen 5 1600 | |
| AMD Ryzen 3 3300X | |
| Medio Intel Core i7-7740X (13230 - 14523, n=7) | |
| AMD Ryzen 3 3100 | |
| Intel Core i5-9400F | |
| Intel Core i3-9100F | |
| 2560x1440 Time Spy CPU | |
| AMD Ryzen 5 1600 | |
| Intel Core i5-9400F | |
| Medio Intel Core i7-7740X (5632 - 5792, n=7) | |
| AMD Ryzen 3 3300X | |
| AMD Ryzen 3 3100 | |
| Intel Core i3-9100F | |
* ... más pequeño es mejor
Los sujetos de prueba en el bucle múltiple Cinebench R15
Durante la prueba de estrés con el multilazo Cinebench R15, el casi sobredimensionado AiO asegura que todas las mediciones se mantengan estables. Ambos modelos Ryzen 3 pueden incluso superar a la competencia de Intel en esta prueba. Incluso el Core i5-9400F con sus seis núcleos tiene que admitir la derrota ante el pequeño Ryzen 3 3100 con sólo cuatro núcleos. El recién lanzado Ryzen 5 1600 (en 12 nm) lidera claramente el campo gracias a sus seis núcleos incluyendo SMT.
Rendimiento de la aplicación
En la vida cotidiana, todos los sistemas funcionan bien y muy rápido. Pero en los detalles, puedes ver las sutilezas que la plataforma Zen2 tiene para ofrecer. En comparación con el popular AMD Ryzen 5 1600, que experimentó un renacimiento con el Zen+, los nuevos procesadores Zen2 pueden diferenciarse claramente. Intel también se vio cada vez más presionada por las innovaciones de AMD. Pero con el Comet Lake-S, los sucesores de las CPU Coffee Lake-R ya están en los bloques de partida.
Como argumento de compra imbatible, AMD todavía puede ganar puntos con PCI Express 4.0, porque Intel tampoco soporta este último con el Comet Lake-S. Además, el nuevo chipset B550 asegura que incluso los sistemas más baratos pueden tener acceso al nuevo estándar.
| PCMark 10 - Score | |
| AMD Ryzen 3 3300X | |
| Intel Core i5-9400F | |
| AMD Ryzen 3 3100 | |
| Intel Core i3-9100F | |
| AMD Ryzen 5 1600 | |
| PCMark 8 | |
| Work Score Accelerated v2 | |
| AMD Ryzen 3 3300X | |
| Intel Core i3-9100F | |
| Intel Core i5-9400F | |
| AMD Ryzen 3 3100 | |
| AMD Ryzen 5 1600 | |
| Creative Score Accelerated v2 | |
| AMD Ryzen 3 3300X | |
| Intel Core i5-9400F | |
| AMD Ryzen 3 3100 | |
| Intel Core i3-9100F | |
| AMD Ryzen 5 1600 | |
| Home Score Accelerated v2 | |
| AMD Ryzen 3 3300X | |
| Intel Core i5-9400F | |
| Intel Core i3-9100F | |
| AMD Ryzen 3 3100 | |
| AMD Ryzen 5 1600 | |
| Performance rating - Percent | |
| AMD Ryzen 3 3300X | |
| Intel Core i5-9400F | |
| AMD Ryzen 5 1600 | |
| AMD Ryzen 3 3100 | |
| Intel Core i3-9100F | |
| 3DMark 11 | |
| 1280x720 Performance | |
| AMD Ryzen 3 3300X | |
| Intel Core i5-9400F | |
| AMD Ryzen 5 1600 | |
| AMD Ryzen 3 3100 | |
| Intel Core i3-9100F | |
| 1280x720 Performance GPU | |
| Intel Core i3-9100F | |
| Intel Core i5-9400F | |
| AMD Ryzen 3 3300X | |
| AMD Ryzen 5 1600 | |
| AMD Ryzen 3 3100 | |
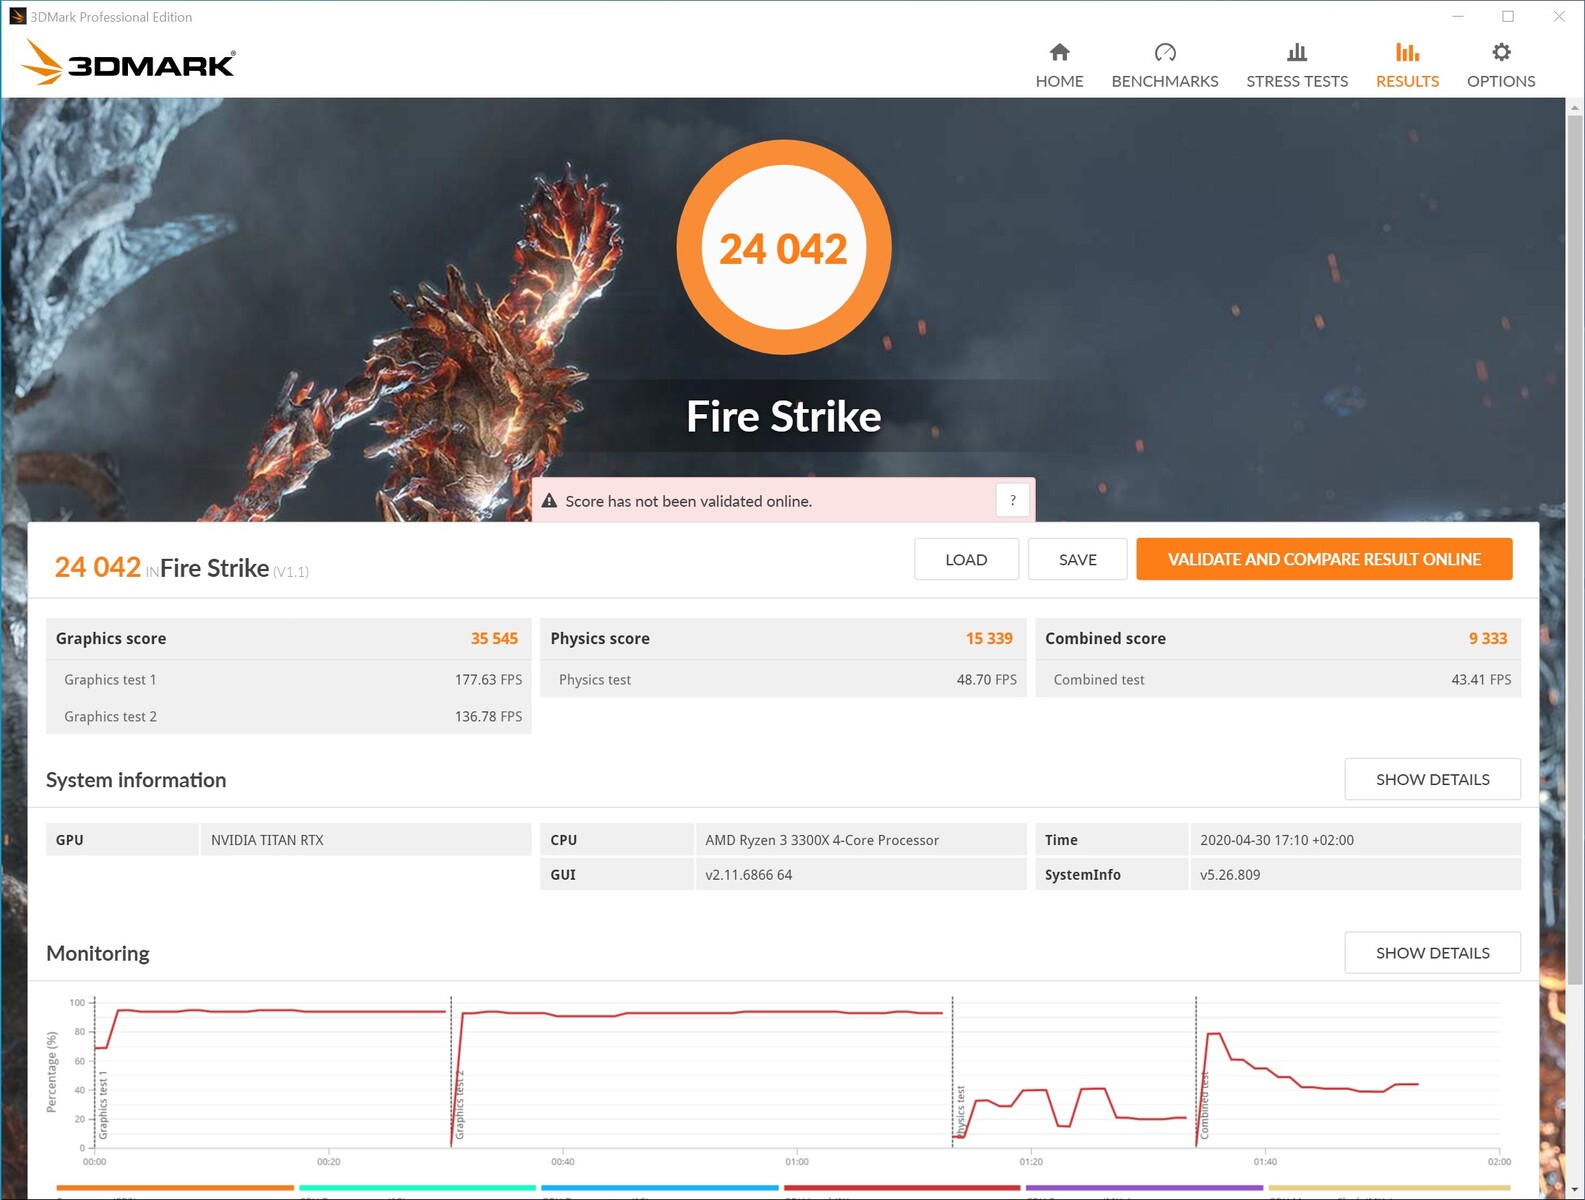
| 3DMark | |
| 1920x1080 Fire Strike Score | |
| AMD Ryzen 3 3300X | |
| Intel Core i5-9400F | |
| AMD Ryzen 5 1600 | |
| AMD Ryzen 3 3100 | |
| Intel Core i3-9100F | |
| 1920x1080 Fire Strike Graphics | |
| Intel Core i3-9100F | |
| Intel Core i5-9400F | |
| AMD Ryzen 3 3100 | |
| AMD Ryzen 3 3300X | |
| AMD Ryzen 5 1600 | |
| 3840x2160 Fire Strike Ultra Score | |
| AMD Ryzen 3 3300X | |
| Intel Core i5-9400F | |
| AMD Ryzen 5 1600 | |
| AMD Ryzen 3 3100 | |
| Intel Core i3-9100F | |
| 2560x1440 Time Spy Graphics | |
| Intel Core i5-9400F | |
| AMD Ryzen 3 3300X | |
| Intel Core i3-9100F | |
| AMD Ryzen 5 1600 | |
| AMD Ryzen 3 3100 | |
| 2560x1440 Time Spy Score | |
| Intel Core i5-9400F | |
| AMD Ryzen 5 1600 | |
| AMD Ryzen 3 3300X | |
| AMD Ryzen 3 3100 | |
| Intel Core i3-9100F | |
Las nuevas CPU de Ryzen en la prueba de juego
En contraste con los puntos de referencia de la CPU pura, se muestra aquí que AMD no es tan superior en las pruebas de juego realizadas. Intel también está bien posicionado con los antiguos Core i3 y Core i5, y especialmente el Intel Core i5-9400F podría producir las mayores velocidades de cuadro en nuestras pruebas de juego. La ventaja de rendimiento se reduce con resoluciones más altas, ya que la tarjeta gráfica se convierte cada vez más en el factor decisivo aquí. Sin embargo, es evidente que la nueva arquitectura Zen2 tiene una clara ventaja de rendimiento sobre la Zen+. El Ryzen 5 1600 ofrece seis núcleos como el Core i5-9400F. Debido al menor IPC, el Ryzen 5 casi siempre está en último lugar.
| Performance rating - Percent | |
| Intel Core i5 9400F | |
| AMD Ryzen 3 3300X | |
| Intel Core i3 9100F | |
| AMD Ryzen 3 3100 | |
| AMD Ryzen 5 1600 (12nm) | |
| Borderlands 3 | |
| 1280x720 Very Low Overall Quality (DX11) | |
| Intel Core i5 9400F | |
| AMD Ryzen 3 3300X | |
| Intel Core i3 9100F | |
| AMD Ryzen 3 3100 | |
| AMD Ryzen 5 1600 (12nm) | |
| 1920x1080 Badass Overall Quality (DX11) | |
| Intel Core i5 9400F | |
| AMD Ryzen 3 3300X | |
| Intel Core i3 9100F | |
| AMD Ryzen 3 3100 | |
| AMD Ryzen 5 1600 (12nm) | |
| Metro Exodus | |
| 1280x720 Low Quality AF:4x | |
| Intel Core i5 9400F | |
| AMD Ryzen 3 3300X | |
| AMD Ryzen 3 3100 | |
| AMD Ryzen 5 1600 (12nm) | |
| Intel Core i3 9100F | |
| 1920x1080 Ultra Quality AF:16x | |
| Intel Core i5 9400F | |
| AMD Ryzen 3 3300X | |
| AMD Ryzen 3 3100 | |
| AMD Ryzen 5 1600 (12nm) | |
| Intel Core i3 9100F | |
| Far Cry New Dawn | |
| 1280x720 Low Preset | |
| Intel Core i5 9400F | |
| AMD Ryzen 3 3300X | |
| Intel Core i3 9100F | |
| AMD Ryzen 5 1600 (12nm) | |
| AMD Ryzen 3 3100 | |
| 1920x1080 Ultra Preset | |
| Intel Core i5 9400F | |
| Intel Core i3 9100F | |
| AMD Ryzen 3 3300X | |
| AMD Ryzen 3 3100 | |
| AMD Ryzen 5 1600 (12nm) | |
| Forza Horizon 4 | |
| 1280x720 Very Low Preset | |
| Intel Core i5 9400F | |
| AMD Ryzen 3 3300X | |
| Intel Core i3 9100F | |
| AMD Ryzen 3 3100 | |
| AMD Ryzen 5 1600 (12nm) | |
| 1920x1080 Ultra Preset AA:2xMS | |
| Intel Core i5 9400F | |
| AMD Ryzen 3 3300X | |
| Intel Core i3 9100F | |
| AMD Ryzen 3 3100 | |
| AMD Ryzen 5 1600 (12nm) | |
| Shadow of the Tomb Raider | |
| 1280x720 Lowest Preset | |
| Intel Core i5 9400F | |
| AMD Ryzen 3 3300X | |
| Intel Core i3 9100F | |
| AMD Ryzen 3 3100 | |
| AMD Ryzen 5 1600 (12nm) | |
| 1920x1080 Highest Preset AA:T | |
| Intel Core i5 9400F | |
| AMD Ryzen 3 3300X | |
| AMD Ryzen 3 3100 | |
| AMD Ryzen 5 1600 (12nm) | |
| Intel Core i3 9100F | |
| Far Cry 5 | |
| 1280x720 Low Preset AA:T | |
| AMD Ryzen 3 3300X | |
| Intel Core i5 9400F | |
| AMD Ryzen 3 3100 | |
| AMD Ryzen 5 1600 (12nm) | |
| Intel Core i3 9100F | |
| 1920x1080 Ultra Preset AA:T | |
| Intel Core i5 9400F | |
| AMD Ryzen 3 3300X | |
| AMD Ryzen 3 3100 | |
| AMD Ryzen 5 1600 (12nm) | |
| Intel Core i3 9100F | |
| X-Plane 11.11 | |
| 1280x720 low (fps_test=1) | |
| Intel Core i5 9400F | |
| AMD Ryzen 3 3300X | |
| Intel Core i3 9100F | |
| AMD Ryzen 3 3100 | |
| AMD Ryzen 5 1600 (12nm) | |
| 1920x1080 high (fps_test=3) | |
| Intel Core i5 9400F | |
| AMD Ryzen 3 3300X | |
| Intel Core i3 9100F | |
| AMD Ryzen 3 3100 | |
| AMD Ryzen 5 1600 (12nm) | |
| Final Fantasy XV Benchmark | |
| 1280x720 Lite Quality | |
| Intel Core i5 9400F | |
| AMD Ryzen 3 3300X | |
| AMD Ryzen 3 3100 | |
| AMD Ryzen 5 1600 (12nm) | |
| Intel Core i3 9100F | |
| 1920x1080 High Quality | |
| Intel Core i5 9400F | |
| AMD Ryzen 3 3300X | |
| AMD Ryzen 5 1600 (12nm) | |
| AMD Ryzen 3 3100 | |
| Intel Core i3 9100F | |
| Dota 2 Reborn | |
| 1280x720 min (0/3) fastest | |
| Intel Core i5 9400F | |
| Intel Core i3 9100F | |
| AMD Ryzen 3 3300X | |
| AMD Ryzen 5 1600 (12nm) | |
| AMD Ryzen 3 3100 | |
| 1920x1080 ultra (3/3) best looking | |
| Intel Core i5 9400F | |
| Intel Core i3 9100F | |
| AMD Ryzen 3 3300X | |
| AMD Ryzen 5 1600 (12nm) | |
| AMD Ryzen 3 3100 | |
| The Witcher 3 | |
| 1024x768 Low Graphics & Postprocessing | |
| Intel Core i5 9400F | |
| AMD Ryzen 3 3300X | |
| AMD Ryzen 5 1600 (12nm) | |
| AMD Ryzen 3 3100 | |
| Intel Core i3 9100F | |
| 1920x1080 Ultra Graphics & Postprocessing (HBAO+) | |
| Intel Core i5 9400F | |
| AMD Ryzen 5 1600 (12nm) | |
| AMD Ryzen 3 3300X | |
| Intel Core i3 9100F | |
| AMD Ryzen 3 3100 | |
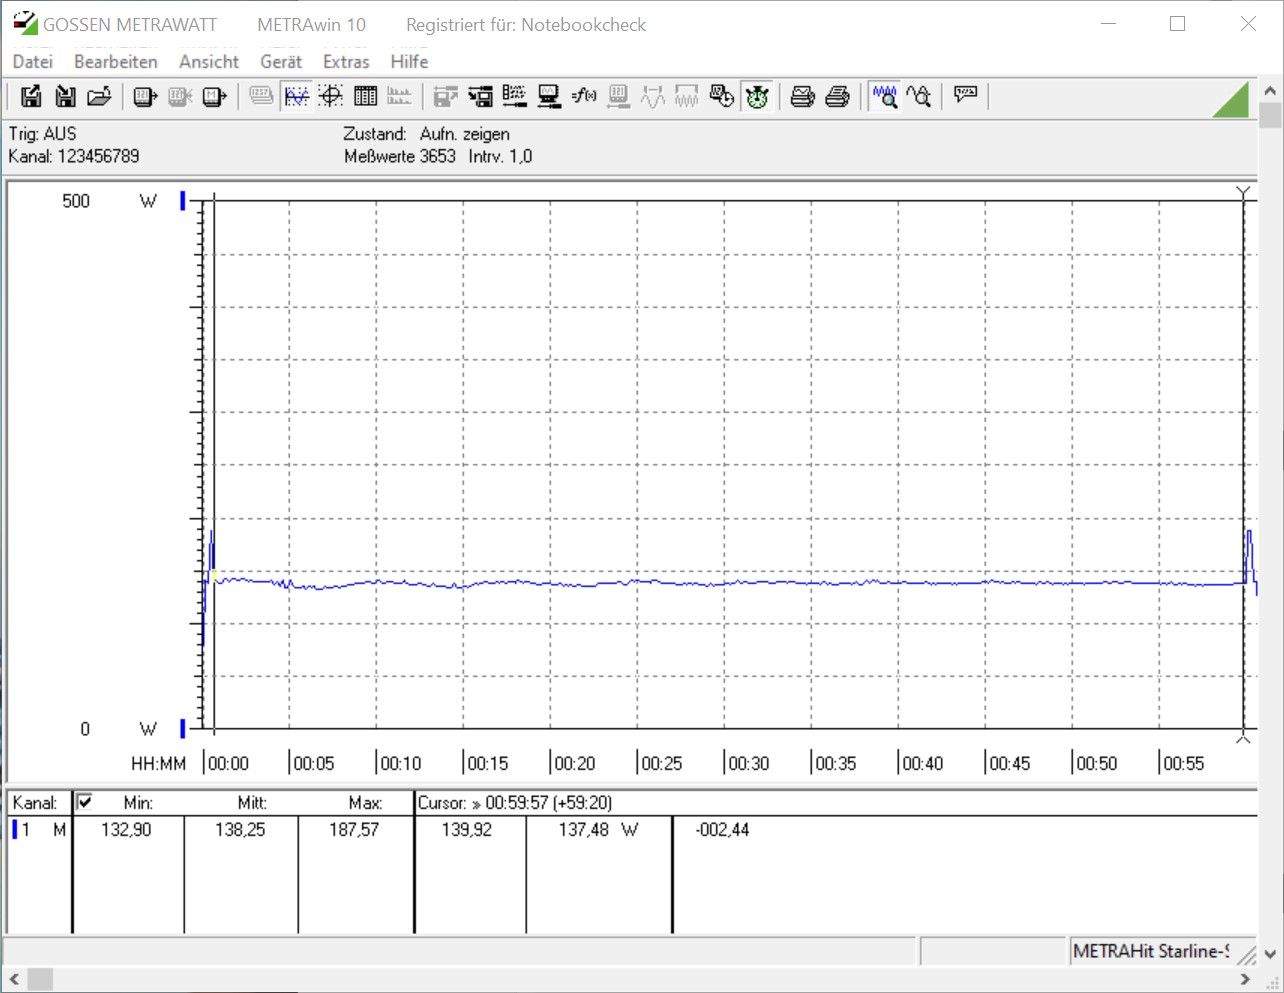
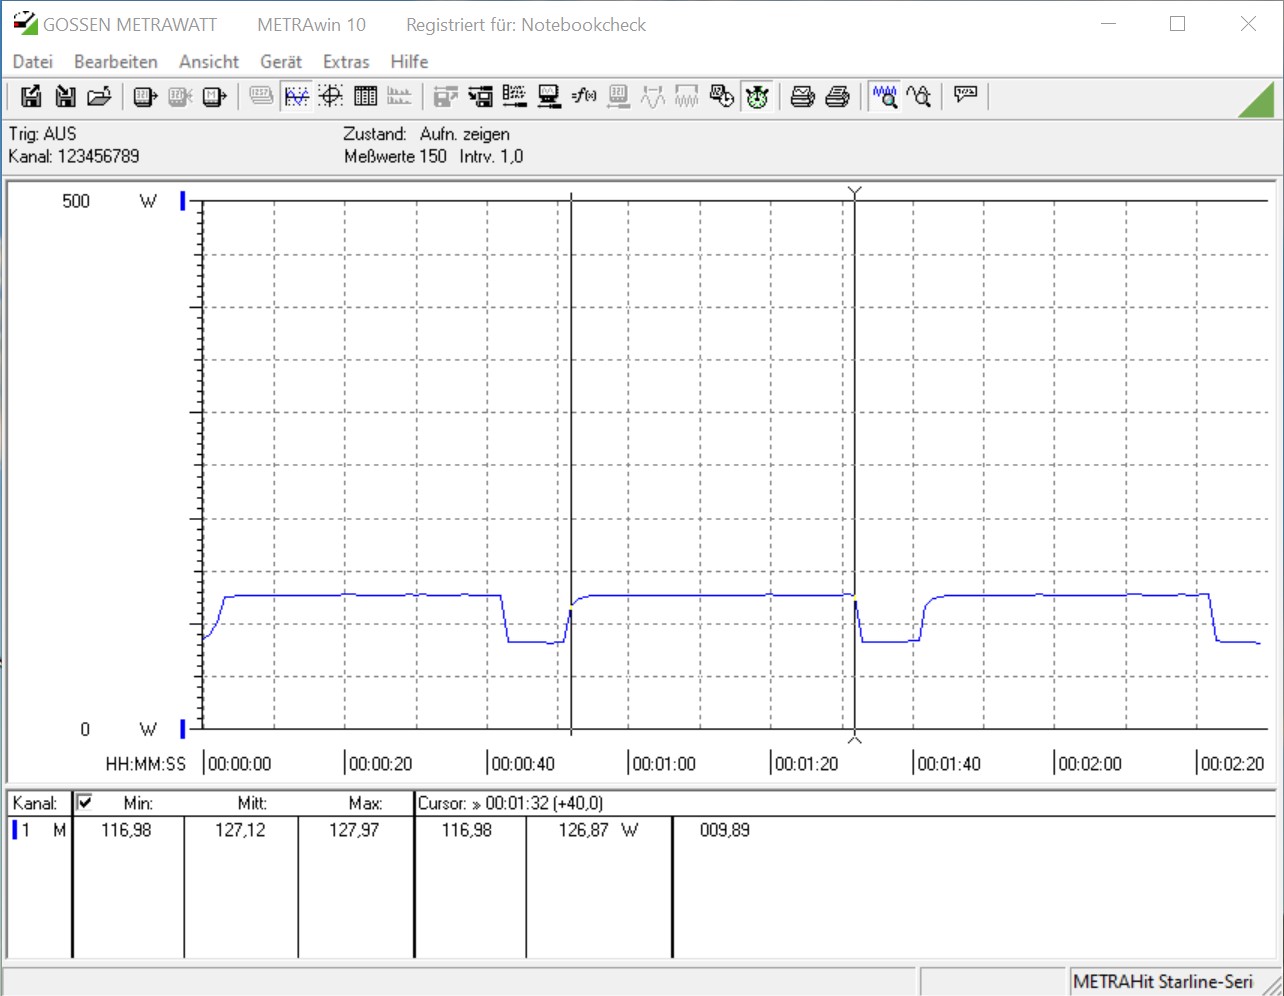
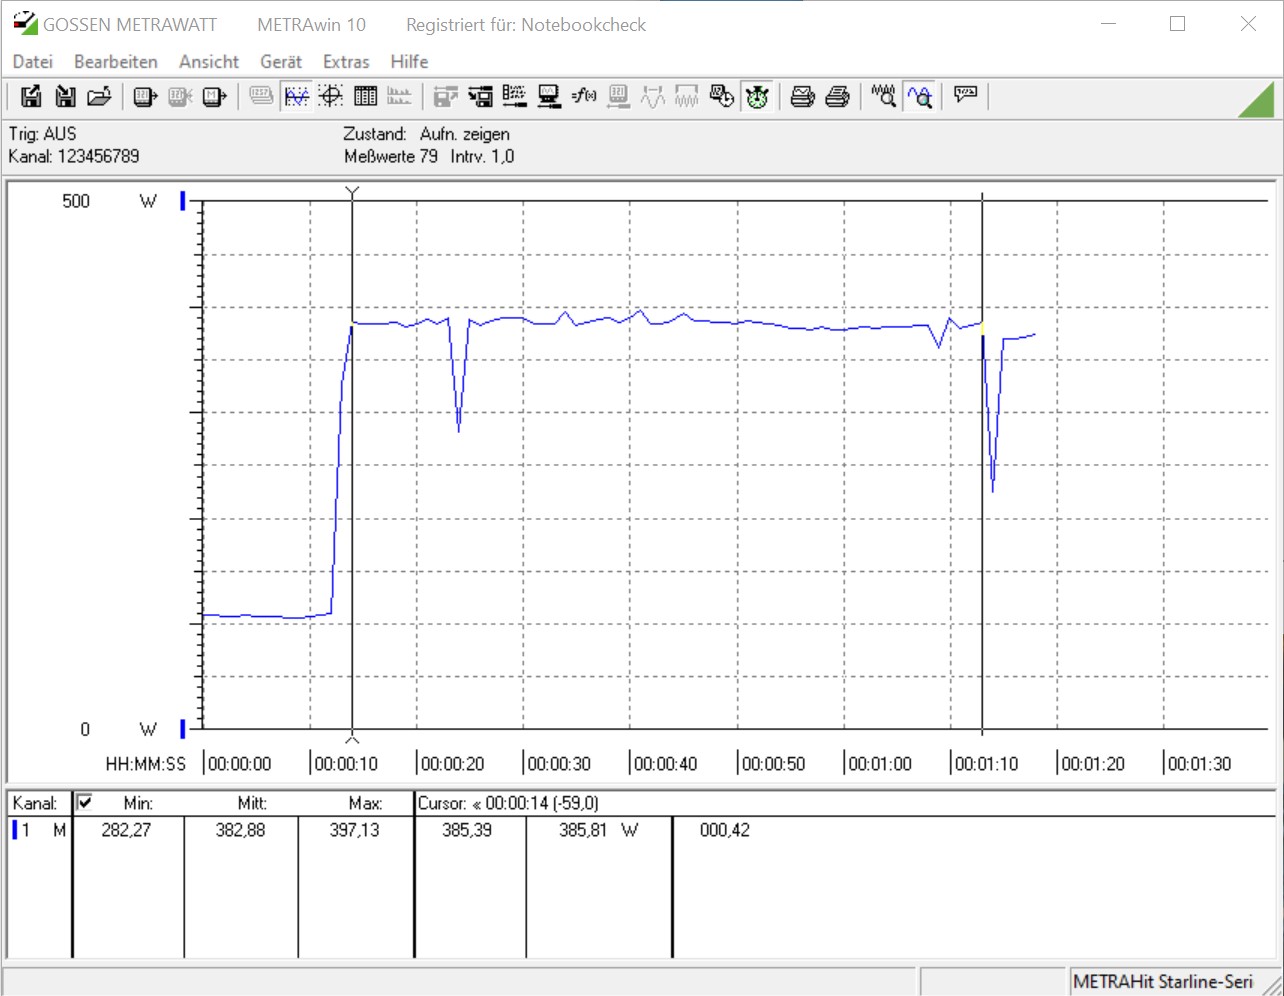
Consumo de energía - ¿Qué tan eficientes son las nuevas CPU de cuatro núcleos?
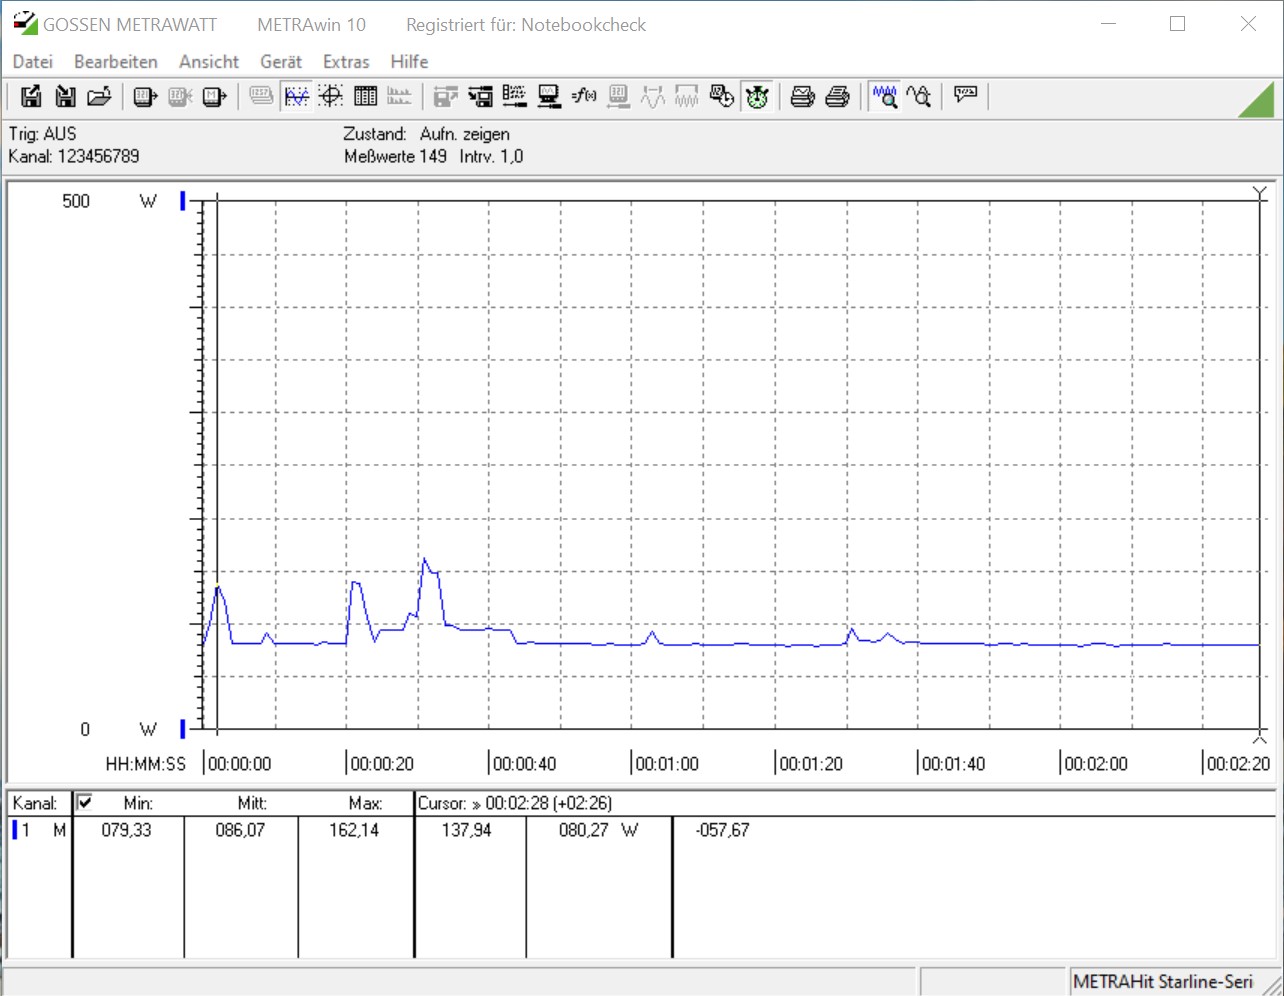
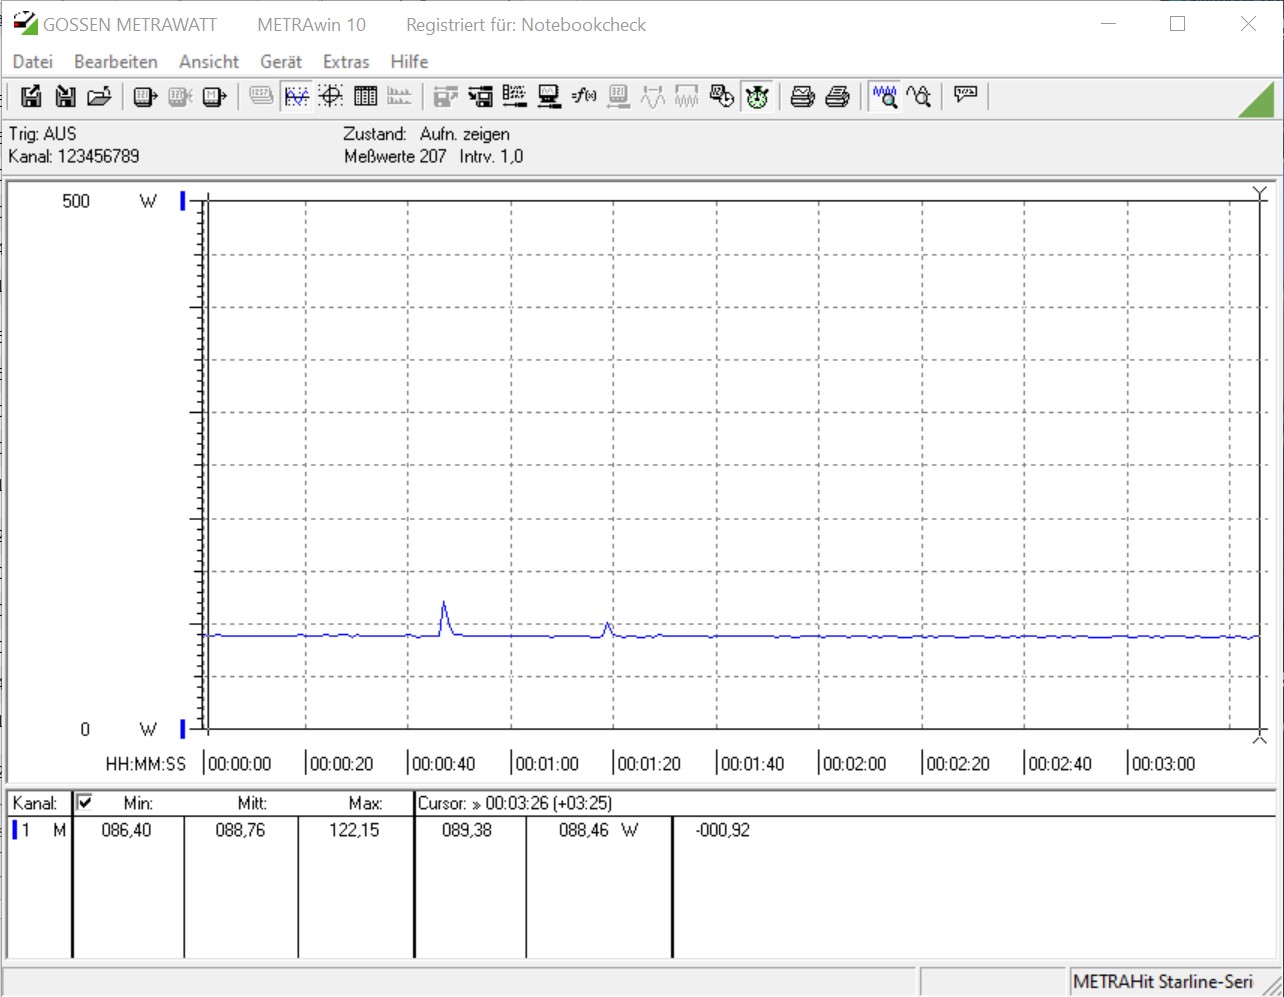
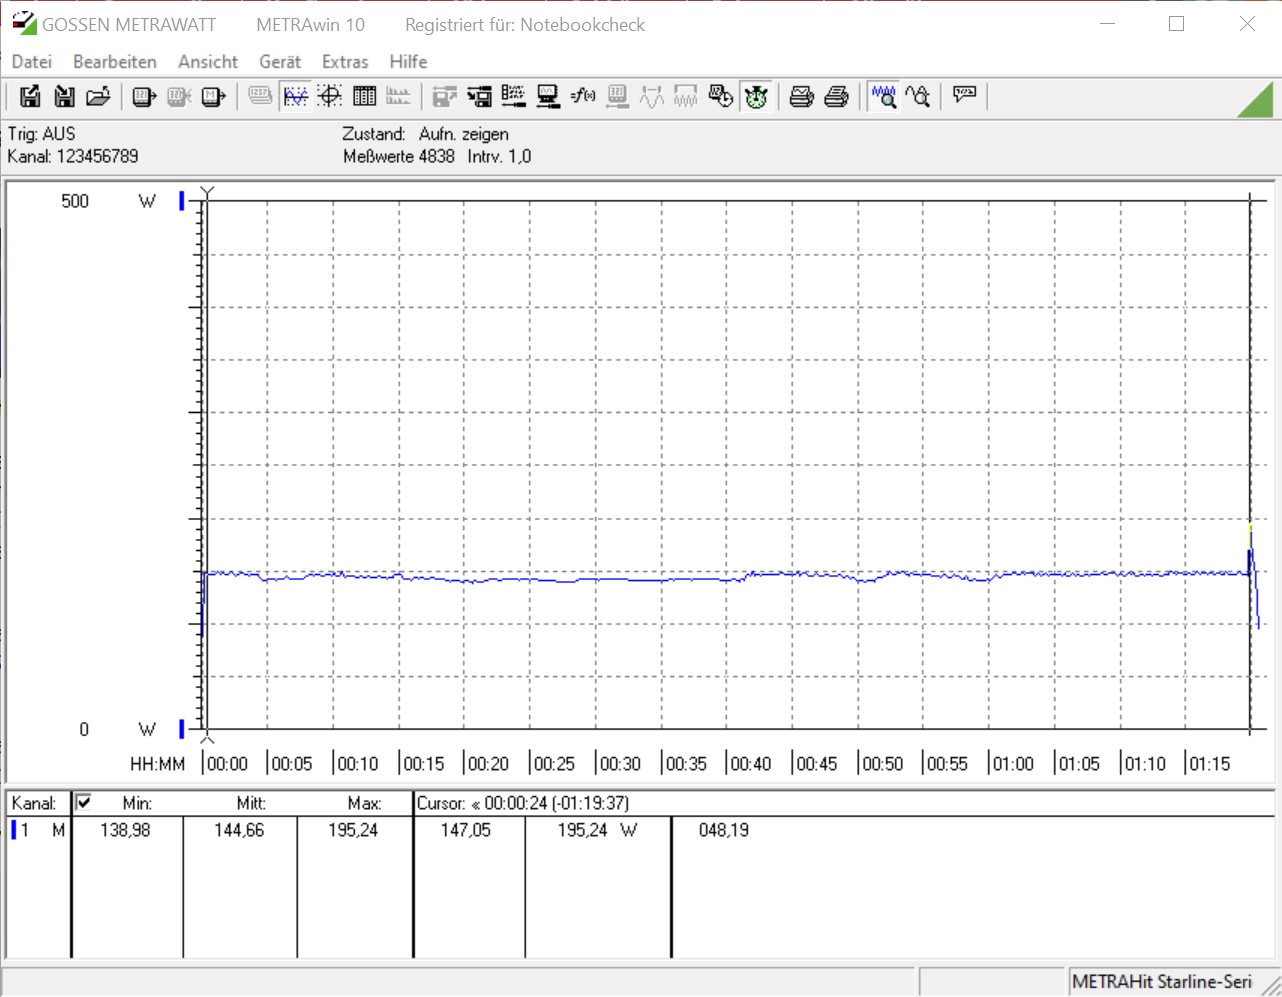
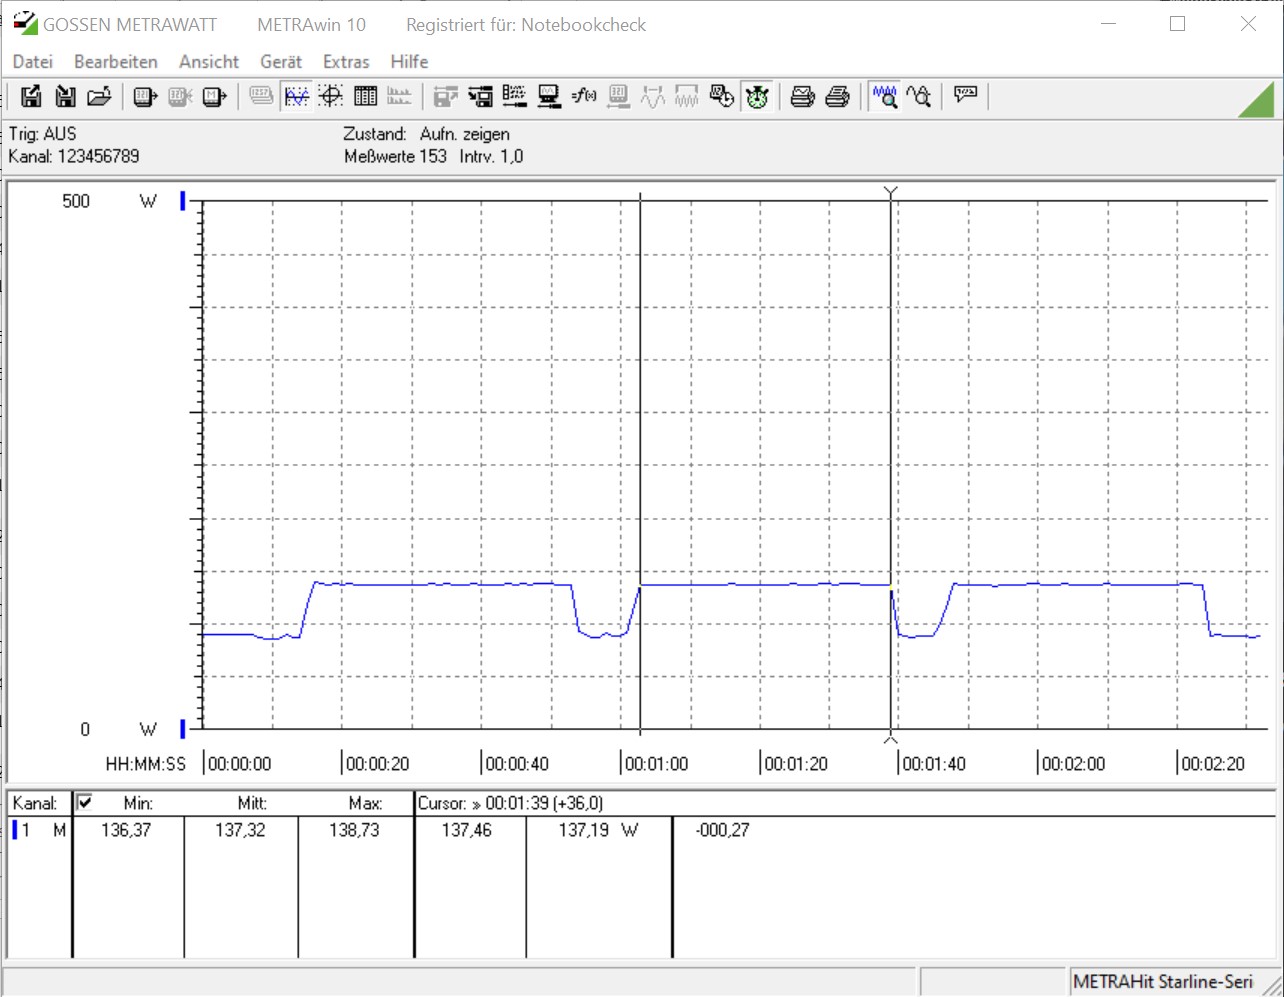
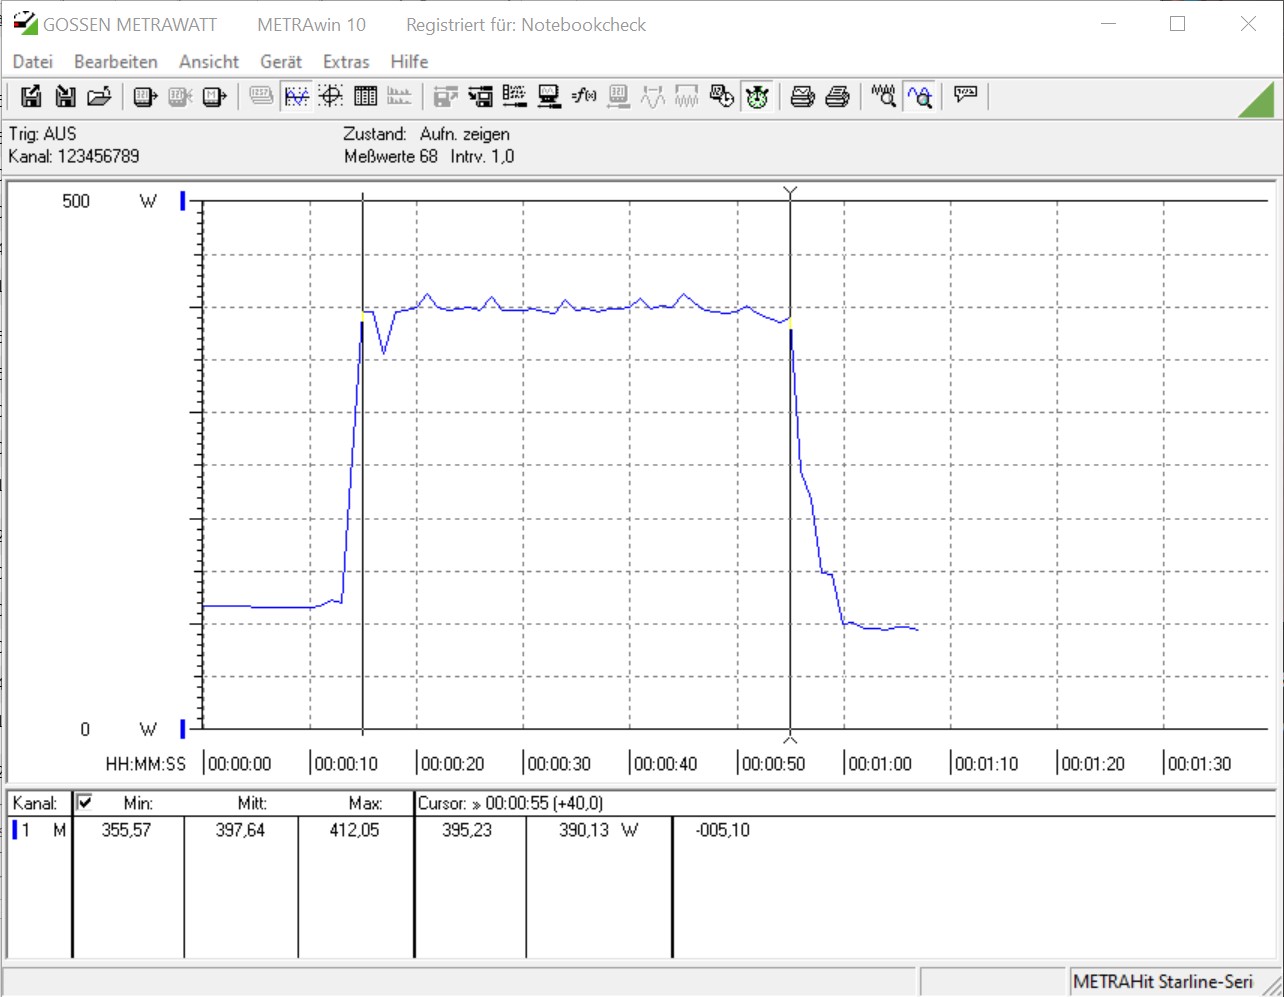
Según AMD, los dos nuevos modelos Ryzen 3 están especificados con un TDP máximo de 65 vatios, que también se cumplió en la prueba de esfuerzo de nuestra revisión. Sin embargo, AMD todavía tiene que hacer algunos deberes con respecto al modo de inactividad si la compañía quiere poner a Intel bajo más presión aquí. Con 86 y 88 vatios, el sistema de AMD consume sin carga casi 30 vatios más de energía que nuestra plataforma Intel. La placa madre y la correspondiente configuración de la BIOS también juegan un papel importante en esta clasificación, por lo que no hay que culpar sólo a las CPU de AMD por el mayor consumo de energía.
En la práctica, el AMD Ryzen 3 3100 es algo más eficiente en cuanto a energía que el AMD Ryzen 3 3300X. Sin embargo, Intel muestra en este punto que su manejo de energía funciona bastante bien. En los juegos en los que la tarjeta gráfica (Nvidia Titan RTX con aprox. 280 vatios) representa la mayor parte, todos los sistemas están cerca unos de otros.
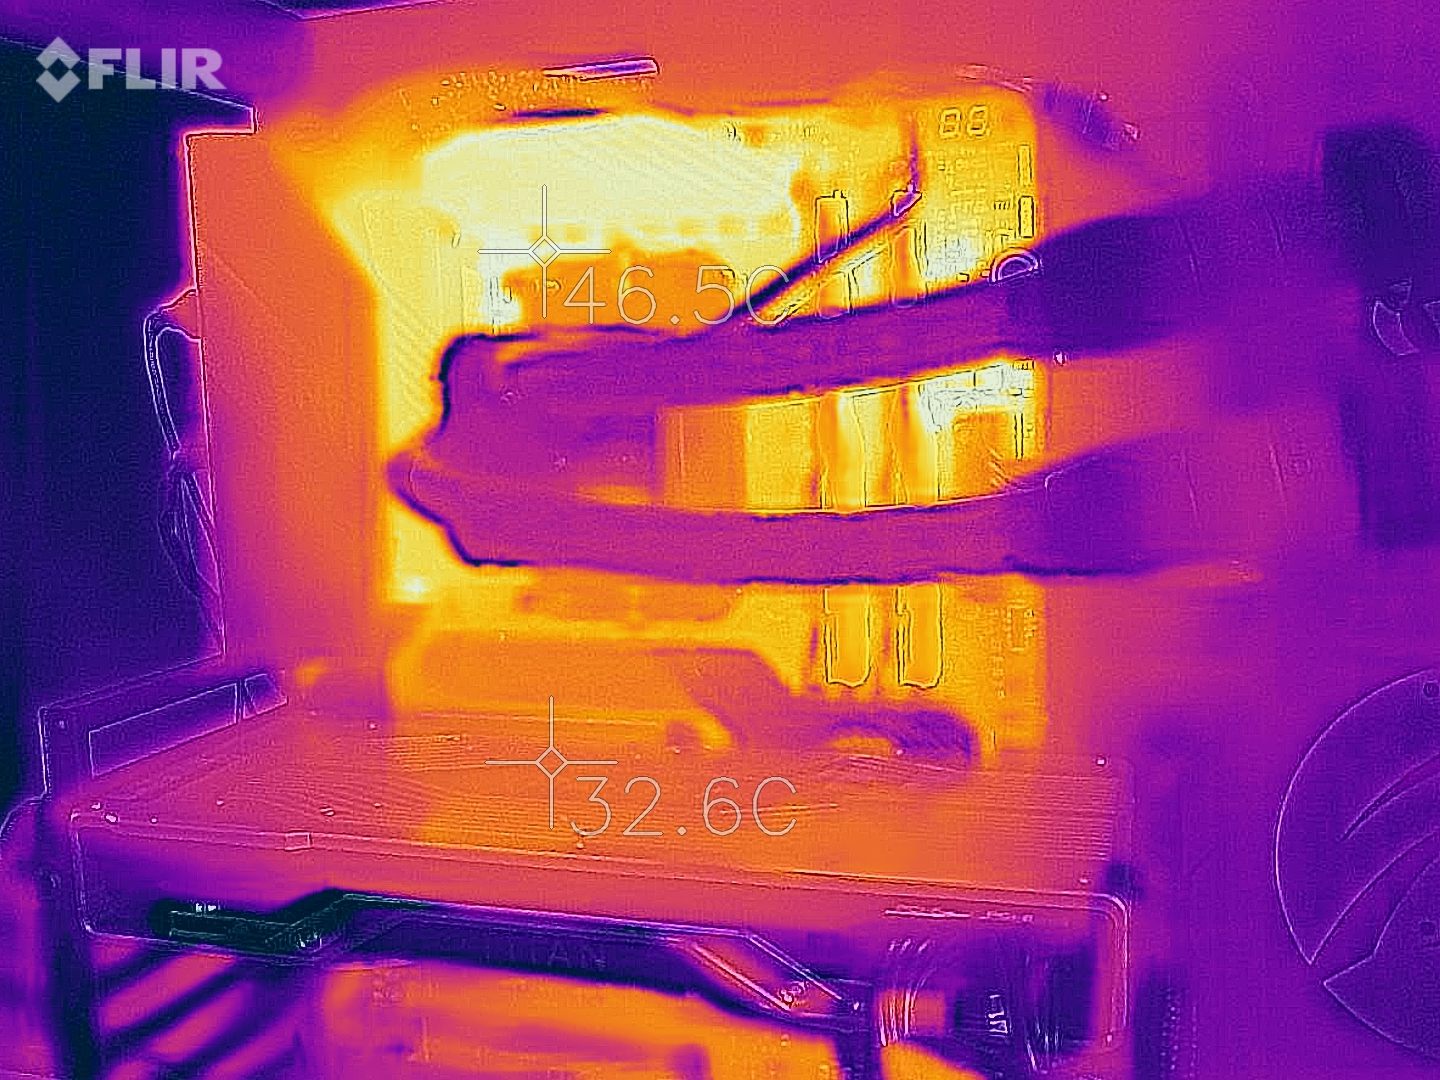
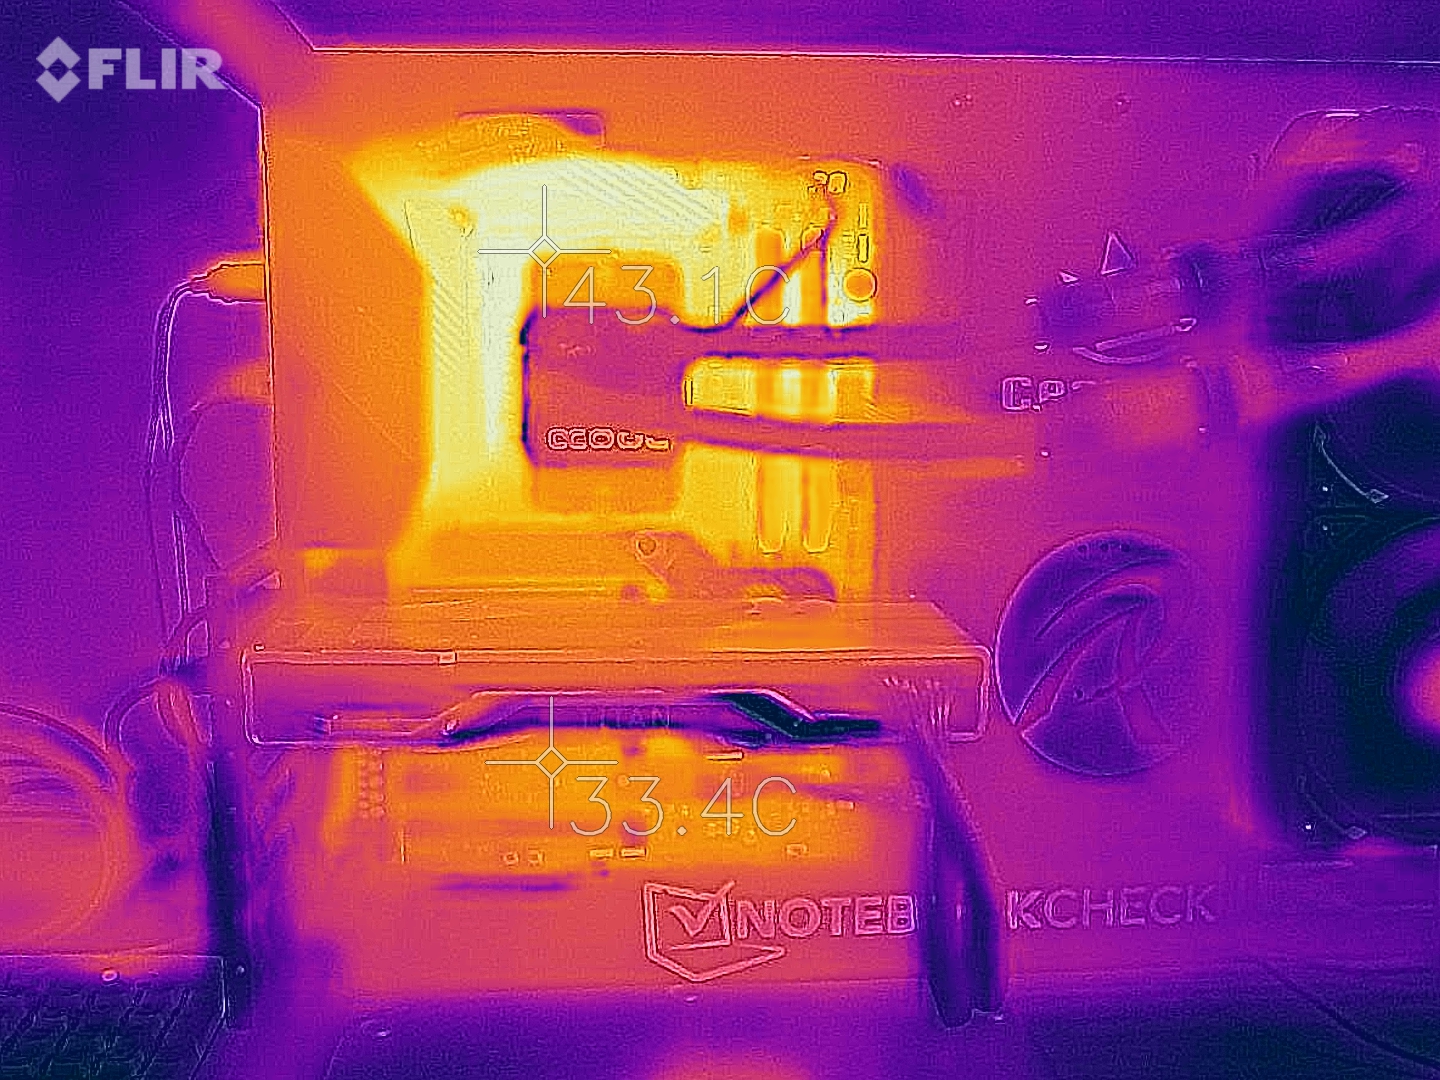
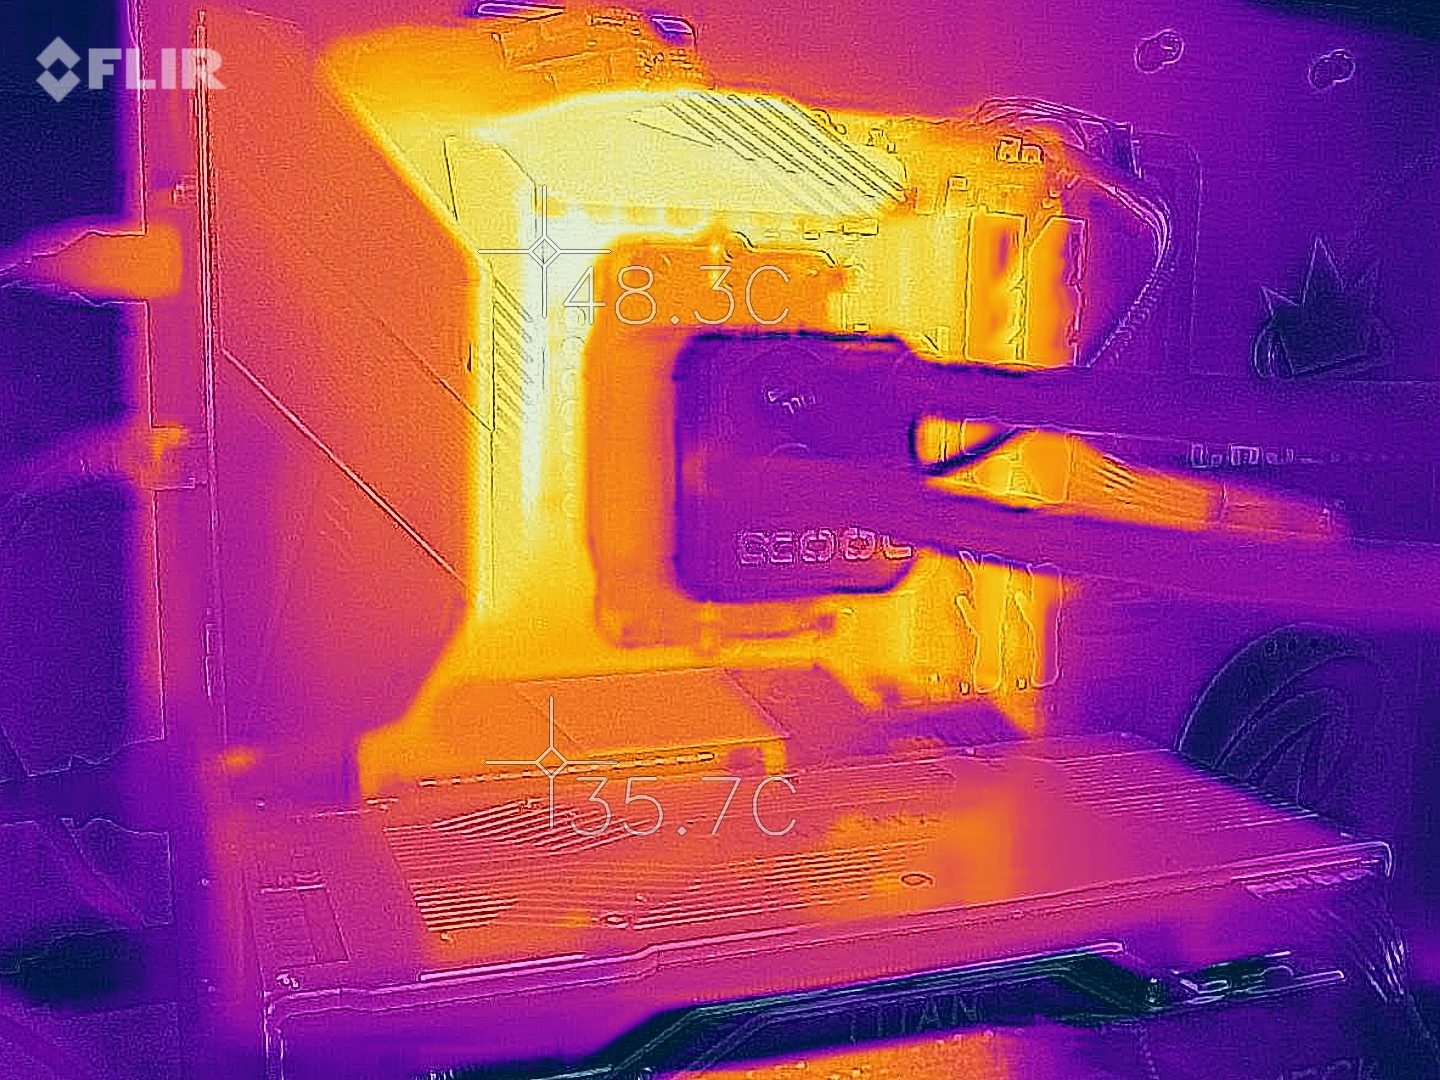
Las temperaturas medidas en la prueba de esfuerzo están en rangos no críticos en todo momento debido al Alphacool Eisbaer 280 AiO. El AMD Ryzen 3 3300X fue el más caliente con 77,5 °C. Dado que aquí sólo un cúmulo de CCX está activo, el calor se concentra en un área más pequeña, lo que probablemente sea también la razón por la que el procesador se calentó un poco más que el AMD Ryzen 3 3100 (70,3 °C (~159 °F)) en la prueba.
Nota: Se consideró todo el sistema de prueba sin un monitor para determinar los valores de consumo de energía.
| Power Consumption | |
| 1920x1080 The Witcher 3 ultra (external Monitor) | |
| AMD Ryzen 5 1600 (12nm) (Idle: 85.9 W) | |
| AMD Ryzen 3 3300X (Idle: 88.8 W) | |
| AMD Ryzen 3 3100 (Idle: 86 W) | |
| Intel Core i5 9400F (Idle: 57 W) | |
| Intel Core i3 9100F (Idle: 56 W) | |
| Prime95 V2810 Stress (external Monitor) | |
| AMD Ryzen 5 1600 (12nm) (Idle: 85.9 W) | |
| AMD Ryzen 3 3300X (Idle: 88.8 W) | |
| Intel Core i3 9100F (Idle: 56 W) | |
| AMD Ryzen 3 3100 (Idle: 86 W) | |
| Intel Core i5 9400F (Idle: 57 W) | |
| Cinebench R15 Multi (external Monitor) | |
| AMD Ryzen 5 1600 (12nm) (Idle: 85.9 W) | |
| AMD Ryzen 3 3300X (Idle: 88.8 W) | |
| AMD Ryzen 3 3100 (Idle: 86 W) | |
| Intel Core i5 9400F (Idle: 57 W) | |
| Intel Core i3 9100F (Idle: 56 W) | |
| Temperatures - CPU Temperature Prime95 | |
| AMD Ryzen 3 3300X | |
| Intel Core i3 9100F | |
| AMD Ryzen 3 3100 | |
| AMD Ryzen 5 1600 (12nm) | |
| Intel Core i5 9400F | |
* ... más pequeño es mejor
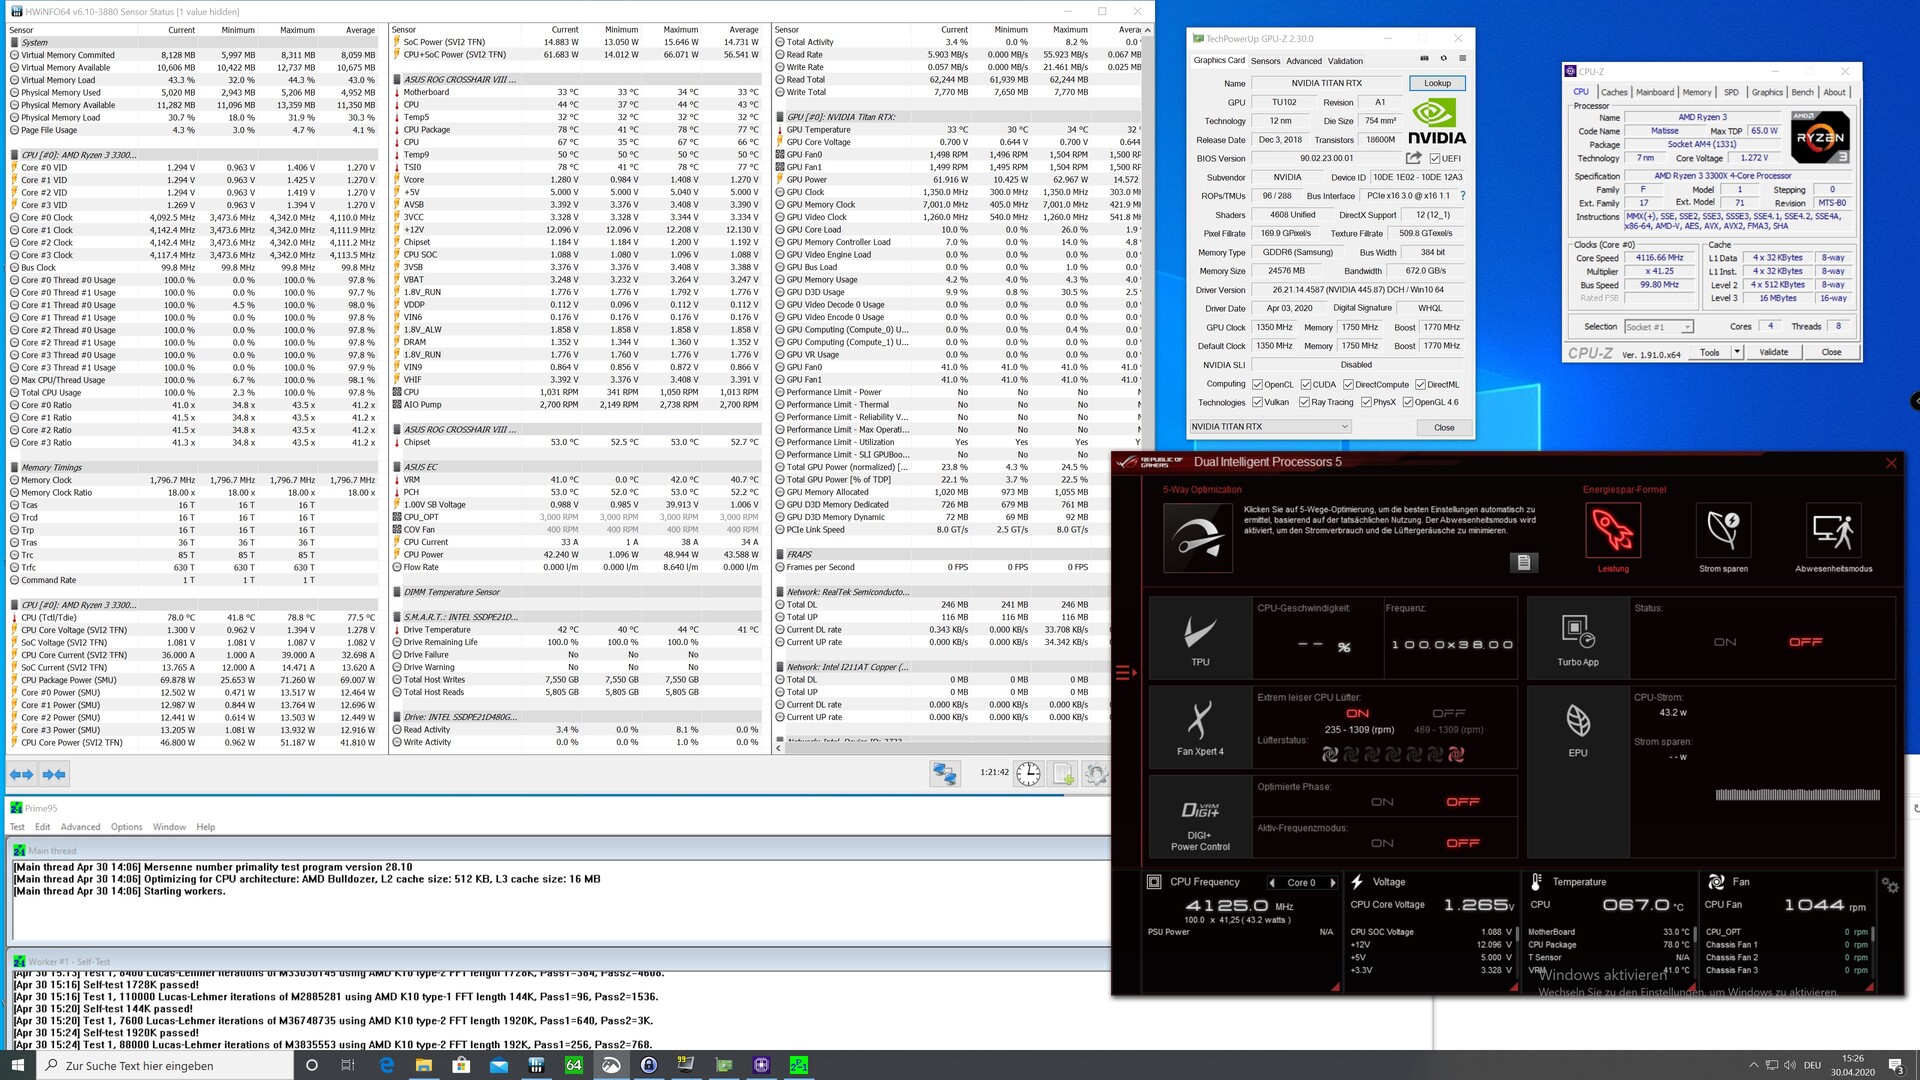
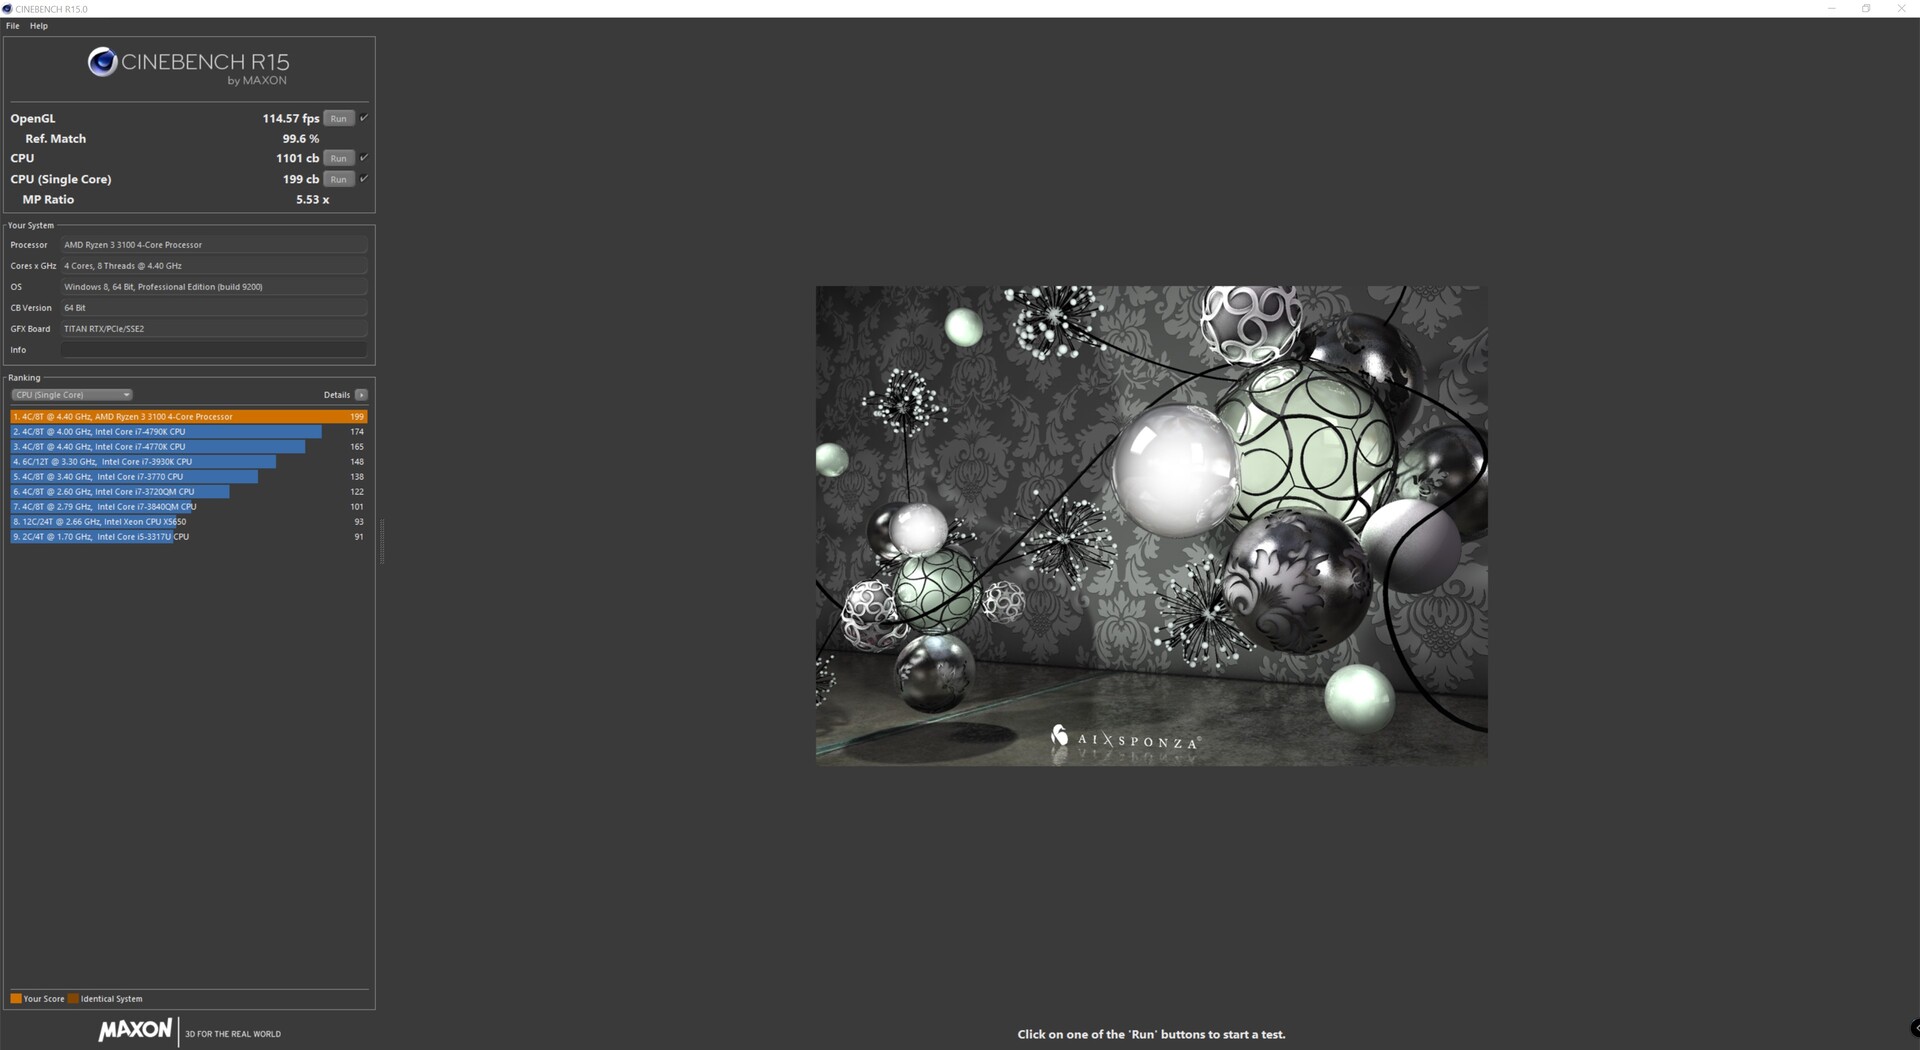
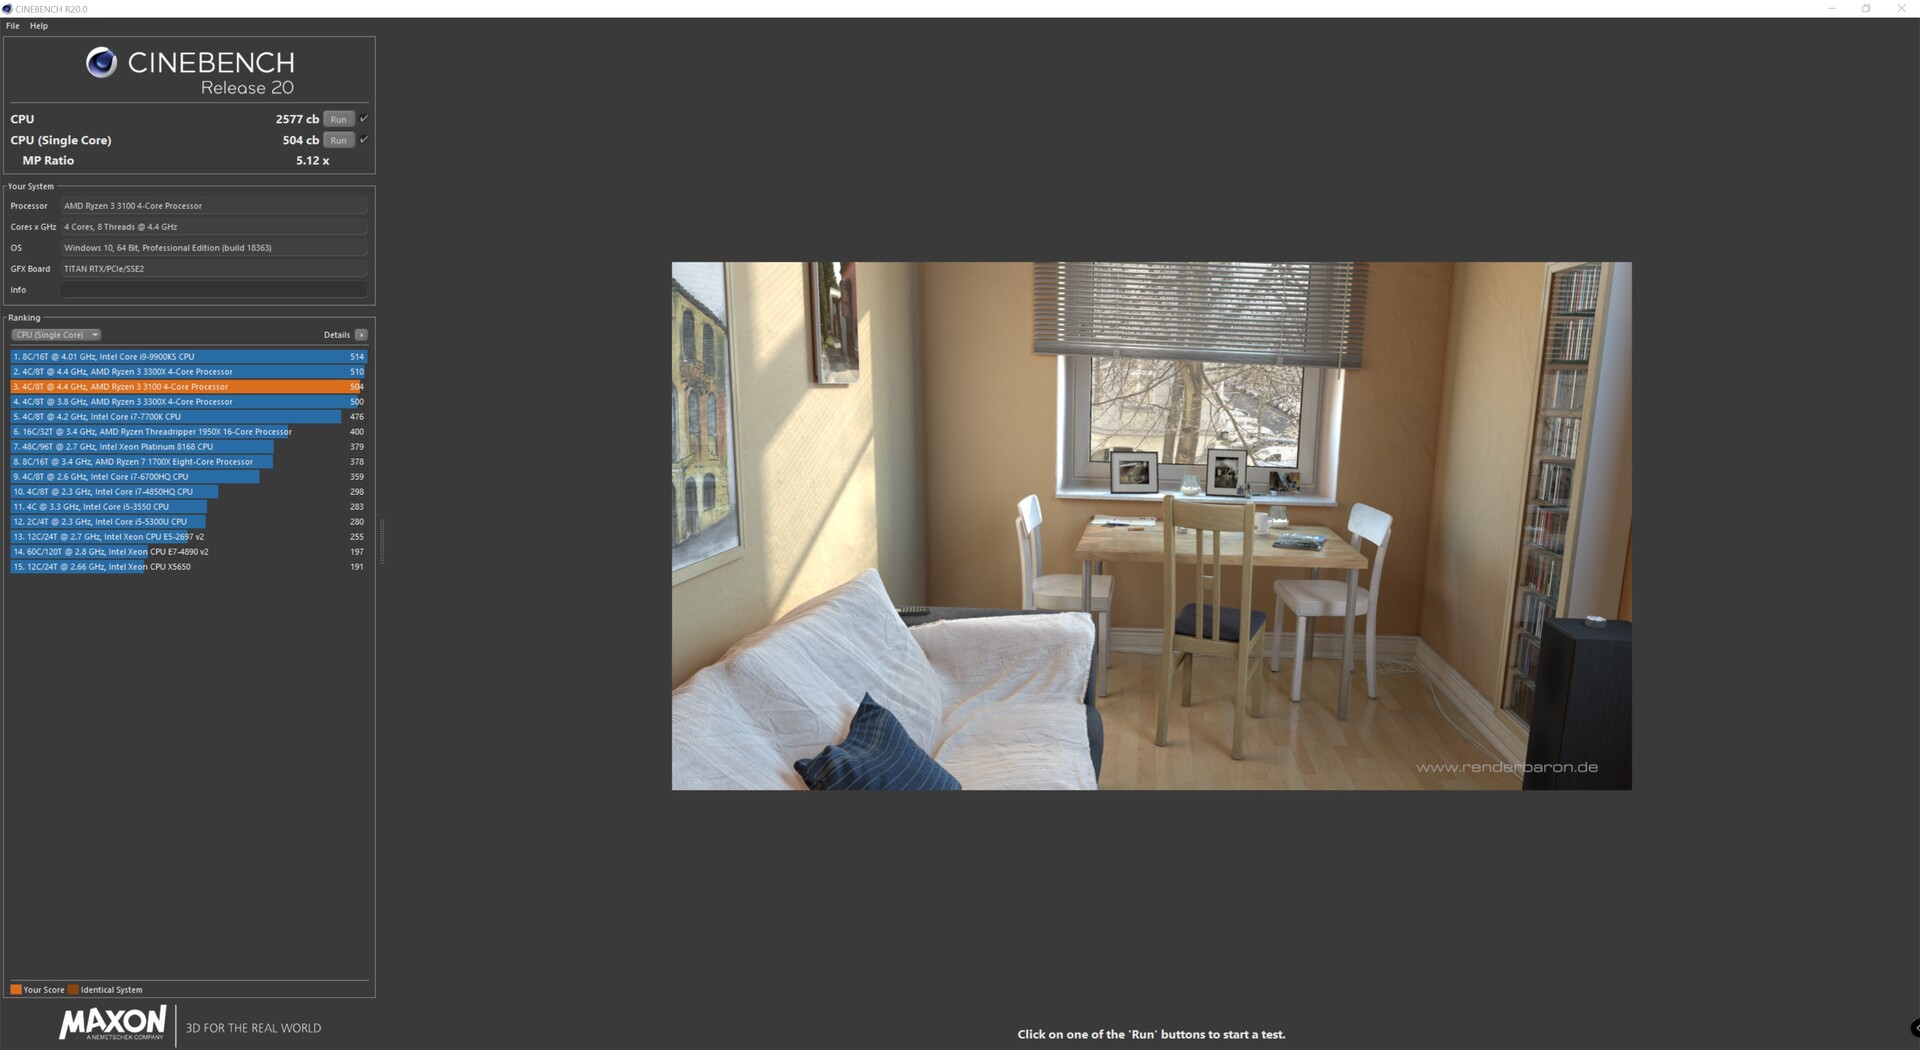
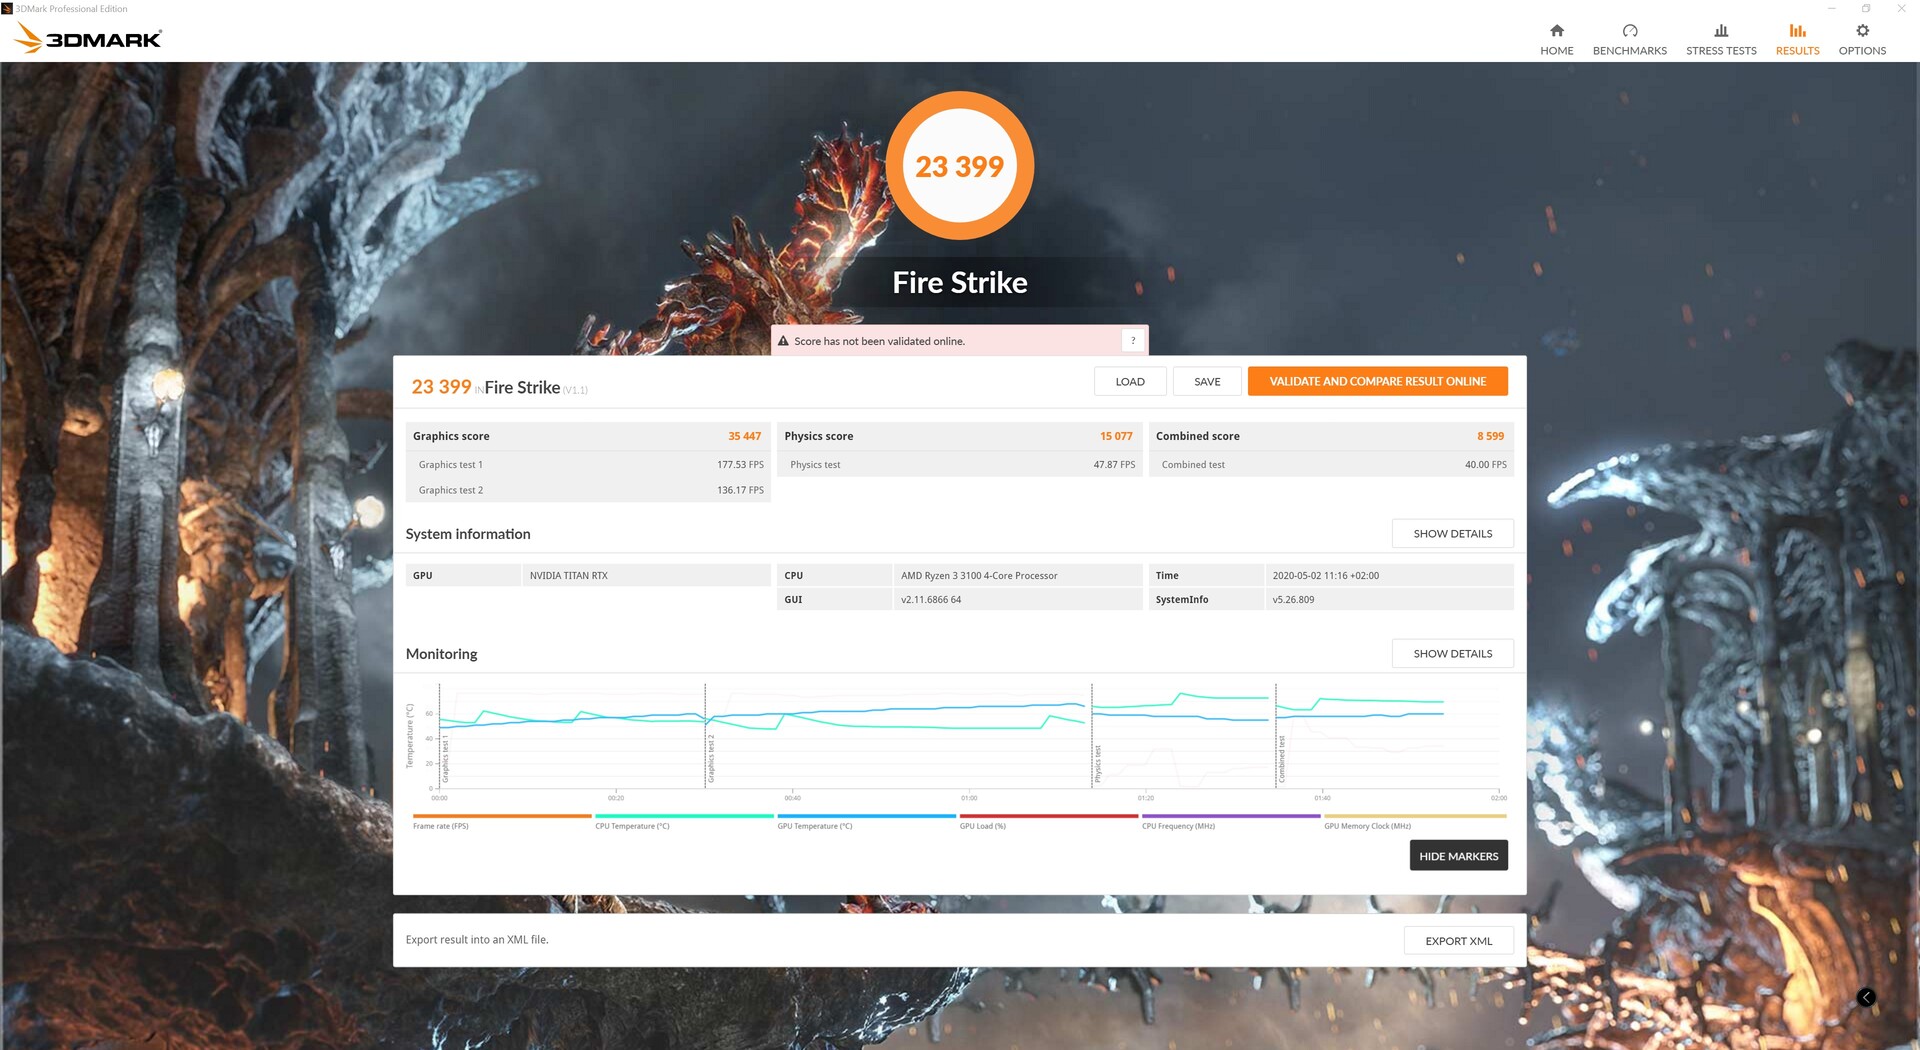
Overclocking - Extrayendo el poder oculto
Si quieres exprimir un poco más el rendimiento del procesador, la única opción que queda es el overclocking. También lo hicimos con los dos modelos Ryzen 3 y pudimos conseguir un aumento de rendimiento de hasta el 14%. El AMD Ryzen 3 3100 hace el mayor salto de rendimiento debido a la menor velocidad del reloj base.
Ambos procesadores pudieron funcionar a 4,4 GHz en todos los núcleos sin problemas y con poco esfuerzo. Sin embargo, una operación estable ya no era posible a 4,5 GHz. Pero esto requiere suficiente refrigeración para asegurar un funcionamiento estable. Sin embargo, el Nvidia Titan RTX utilizado en la prueba no pudo beneficiarse de la mejora en el rendimiento de la CPU.
| Performance rating - Percent | |
| AMD Ryzen 3 3300X @ 4.4 GHz | |
| AMD Ryzen 3 3300X | |
| AMD Ryzen 3 3100 @ 4.4 GHz | |
| AMD Ryzen 5 1600 (12nm) | |
| Intel Core i5 9400F | |
| AMD Ryzen 3 3100 | |
| Intel Core i3 9100F | |
| Cinebench R15 | |
| CPU Single 64Bit | |
| AMD Ryzen 3 3300X @ 4.4 GHz | |
| AMD Ryzen 3 3100 @ 4.4 GHz | |
| AMD Ryzen 3 3300X | |
| AMD Ryzen 3 3100 | |
| Intel Core i5 9400F | |
| Intel Core i3 9100F | |
| AMD Ryzen 5 1600 (12nm) | |
| CPU Multi 64Bit | |
| AMD Ryzen 5 1600 (12nm) | |
| AMD Ryzen 3 3300X @ 4.4 GHz | |
| AMD Ryzen 3 3100 @ 4.4 GHz | |
| AMD Ryzen 3 3300X | |
| AMD Ryzen 3 3100 | |
| Intel Core i5 9400F | |
| Intel Core i3 9100F | |
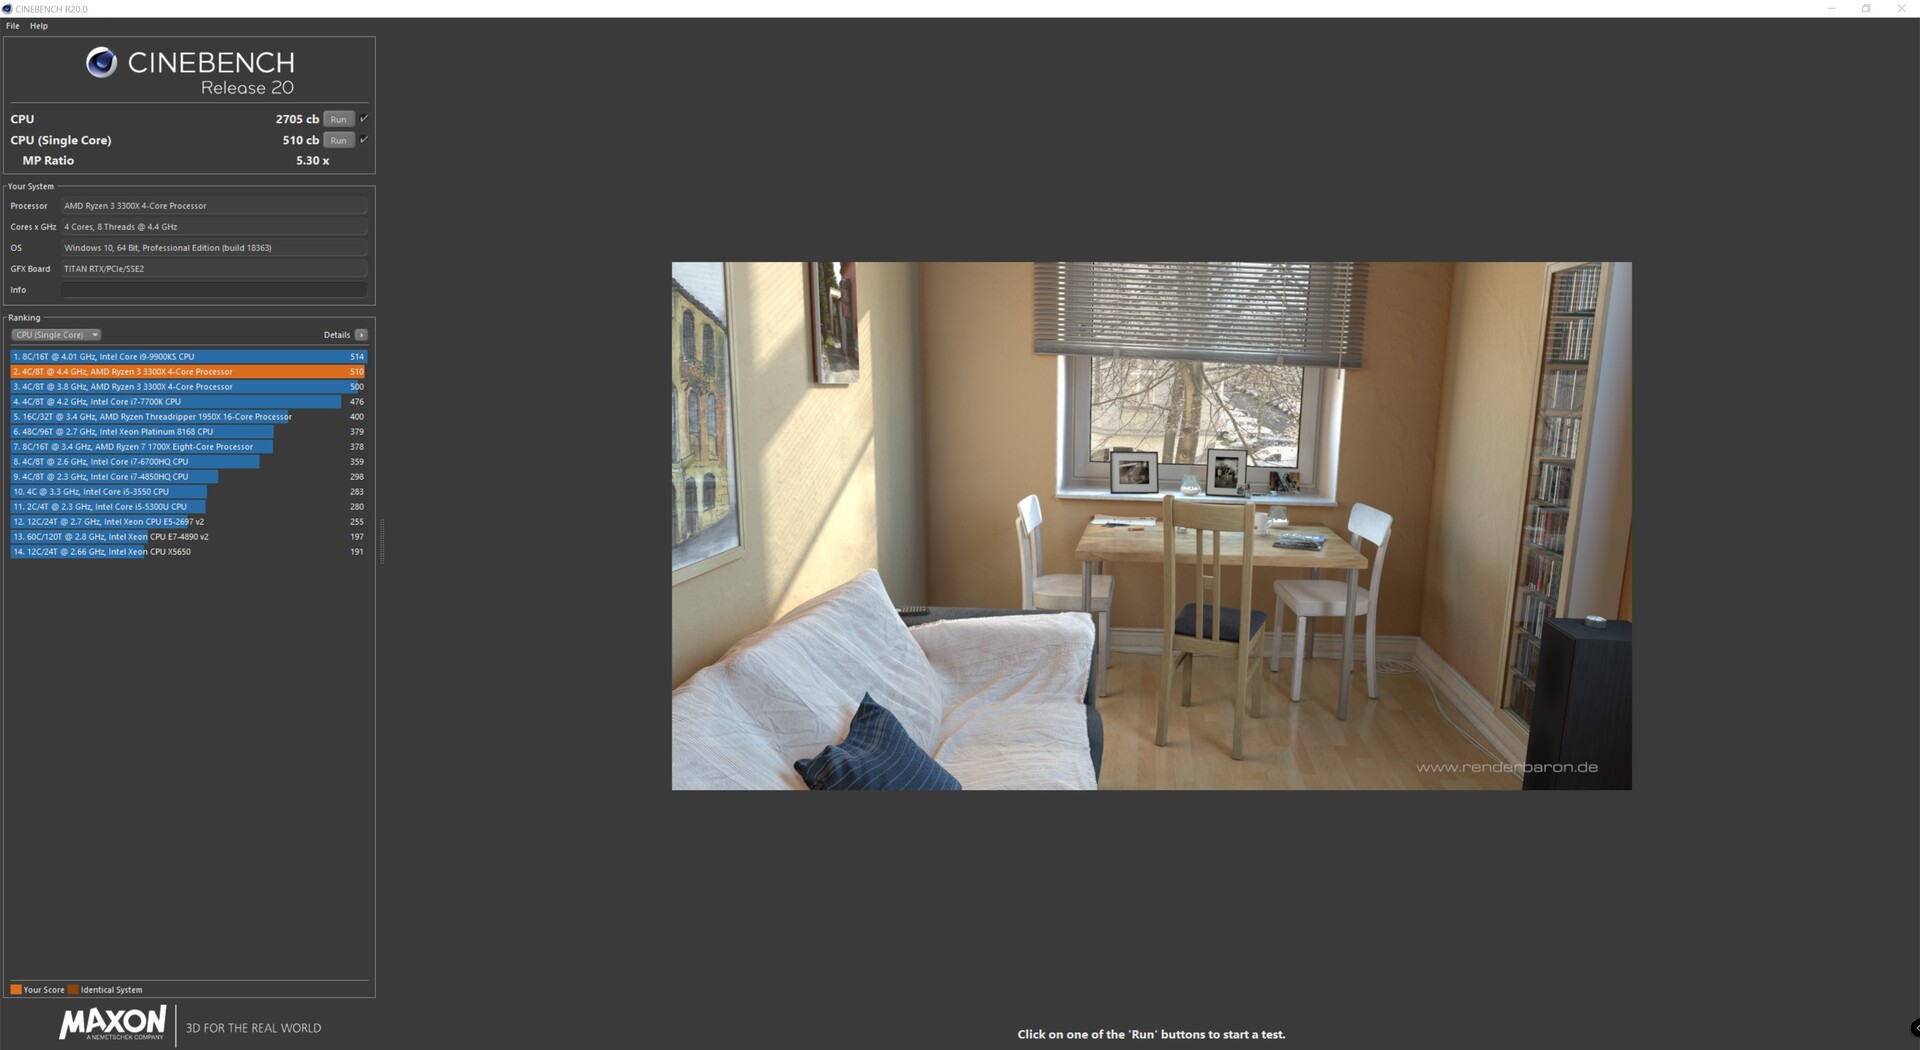
| Cinebench R20 | |
| CPU (Single Core) | |
| AMD Ryzen 3 3300X @ 4.4 GHz | |
| AMD Ryzen 3 3100 @ 4.4 GHz | |
| AMD Ryzen 3 3300X | |
| AMD Ryzen 3 3100 | |
| Intel Core i5 9400F | |
| Intel Core i3 9100F | |
| AMD Ryzen 5 1600 (12nm) | |
| CPU (Multi Core) | |
| AMD Ryzen 3 3300X @ 4.4 GHz | |
| AMD Ryzen 5 1600 (12nm) | |
| AMD Ryzen 3 3100 @ 4.4 GHz | |
| AMD Ryzen 3 3300X | |
| Intel Core i5 9400F | |
| AMD Ryzen 3 3100 | |
| Intel Core i3 9100F | |
| 3DMark 11 | |
| 1280x720 Performance | |
| AMD Ryzen 3 3300X @ 4.4 GHz | |
| AMD Ryzen 3 3300X | |
| AMD Ryzen 3 3100 @ 4.4 GHz | |
| Intel Core i5 9400F | |
| AMD Ryzen 5 1600 (12nm) | |
| AMD Ryzen 3 3100 | |
| Intel Core i3 9100F | |
| 1280x720 Performance GPU | |
| Intel Core i3 9100F | |
| Intel Core i5 9400F | |
| AMD Ryzen 3 3300X | |
| AMD Ryzen 3 3100 @ 4.4 GHz | |
| AMD Ryzen 3 3300X @ 4.4 GHz | |
| AMD Ryzen 5 1600 (12nm) | |
| AMD Ryzen 3 3100 | |
| 1280x720 Performance Physics | |
| AMD Ryzen 3 3300X @ 4.4 GHz | |
| AMD Ryzen 3 3300X | |
| AMD Ryzen 5 1600 (12nm) | |
| AMD Ryzen 3 3100 @ 4.4 GHz | |
| Intel Core i5 9400F | |
| AMD Ryzen 3 3100 | |
| Intel Core i3 9100F | |
| 3DMark | |
| 1920x1080 Fire Strike Score | |
| AMD Ryzen 3 3300X @ 4.4 GHz | |
| AMD Ryzen 3 3300X | |
| AMD Ryzen 3 3100 @ 4.4 GHz | |
| Intel Core i5 9400F | |
| AMD Ryzen 5 1600 (12nm) | |
| AMD Ryzen 3 3100 | |
| Intel Core i3 9100F | |
| 1920x1080 Fire Strike Graphics | |
| Intel Core i3 9100F | |
| Intel Core i5 9400F | |
| AMD Ryzen 3 3100 | |
| AMD Ryzen 3 3300X @ 4.4 GHz | |
| AMD Ryzen 3 3100 @ 4.4 GHz | |
| AMD Ryzen 3 3300X | |
| AMD Ryzen 5 1600 (12nm) | |
| 1920x1080 Fire Strike Physics | |
| AMD Ryzen 5 1600 (12nm) | |
| AMD Ryzen 3 3300X @ 4.4 GHz | |
| AMD Ryzen 3 3100 @ 4.4 GHz | |
| AMD Ryzen 3 3300X | |
| AMD Ryzen 3 3100 | |
| Intel Core i5 9400F | |
| Intel Core i3 9100F | |
Ryzen 3 3100 @ 4.4 GHz

Ryzen 3 3300X @ 4.4 GHz

Pro
Contra
Veredicto - Mucho rendimiento por un pequeño precio
Con el nuevo Ryzen 3, AMD muestra una vez más lo que es posible con el Zen2. Comparado con la generación anterior basada en el Zen+, el rendimiento podría aumentar significativamente. Además, Intel se puso cada vez más bajo presión, pero esto puede parecer diferente pronto porque el Comet Lake-S ya está en los bloques de salida. Por esta razón, uno casi podría pensar que AMD ha dormido un poco durante el comienzo de la nueva generación Ryzen 3, ya que Zen2 ha estado en el mercado por un tiempo. Pero AMD todavía puede confiar en PCI Express 4.0 como un punto de venta único, ya que la décima generación de Intel tampoco lo soportará. El hecho de que el Ryzen 3 esté ahora también equipado con SMT no sólo nos complace sino que ha sido demandado durante mucho tiempo. Esto permite unos pocos puntos porcentuales en la comparación de rendimiento, que AMD a menudo gana con los nuevos procesadores en comparación con Intel.
La versión económica de los nuevos procesadores Ryzen 3 resulta ser un verdadero ganador de precio y rendimiento debido a su buena capacidad de overclocking.
Ambos modelos de Ryzen son rápidos en términos de puro rendimiento, aunque los seis núcleos nativos del Intel Core i5-9400F proporcionan una velocidad de cuadro ligeramente mejor en los juegos. Ambos modelos están cerca en cuanto a precio y son significativamente más baratos que el Intel Core i5-9400F. El AMD Ryzen 3 3100 comienza con 109 euros (~118 dólares) y ofrece un sólido rendimiento para poner en marcha un sistema rápido. Debido a las bajas velocidades de la base y del turbo reloj, el Ryzen 3 3100 carece de un poco de IPC en comparación con el Ryzen 3 3300X, por lo que el Ryzen 3 3300X alcanzó velocidades de cuadro significativamente mejores en los juegos junto con el Nvidia Titan RTX. Sólo hay que pagar 20 euros (~ 22 dólares) más por el modelo más rápido, lo que nos parece justificable.
Sin embargo, ambos modelos tienen una recomendación de compra porque ofrecen un muy buen rendimiento para el uso respectivo sin hacer una profunda abolladura en la cartera. Además, hay una buena capacidad de overclocking del Ryzen 3 3100, que puede alcanzar el rendimiento de un Ryzen 3 3300X con unos pocos ajustes hábiles. El potencial de overclocking del Ryzen 3 3300X es significativamente menor.
