 Deutsch
 English
 Español
 Français
 Italiano
 Nederlands
 Polski
 Português
 Русский
 Türkçe
 Svenska
 Chinese
 Magyar
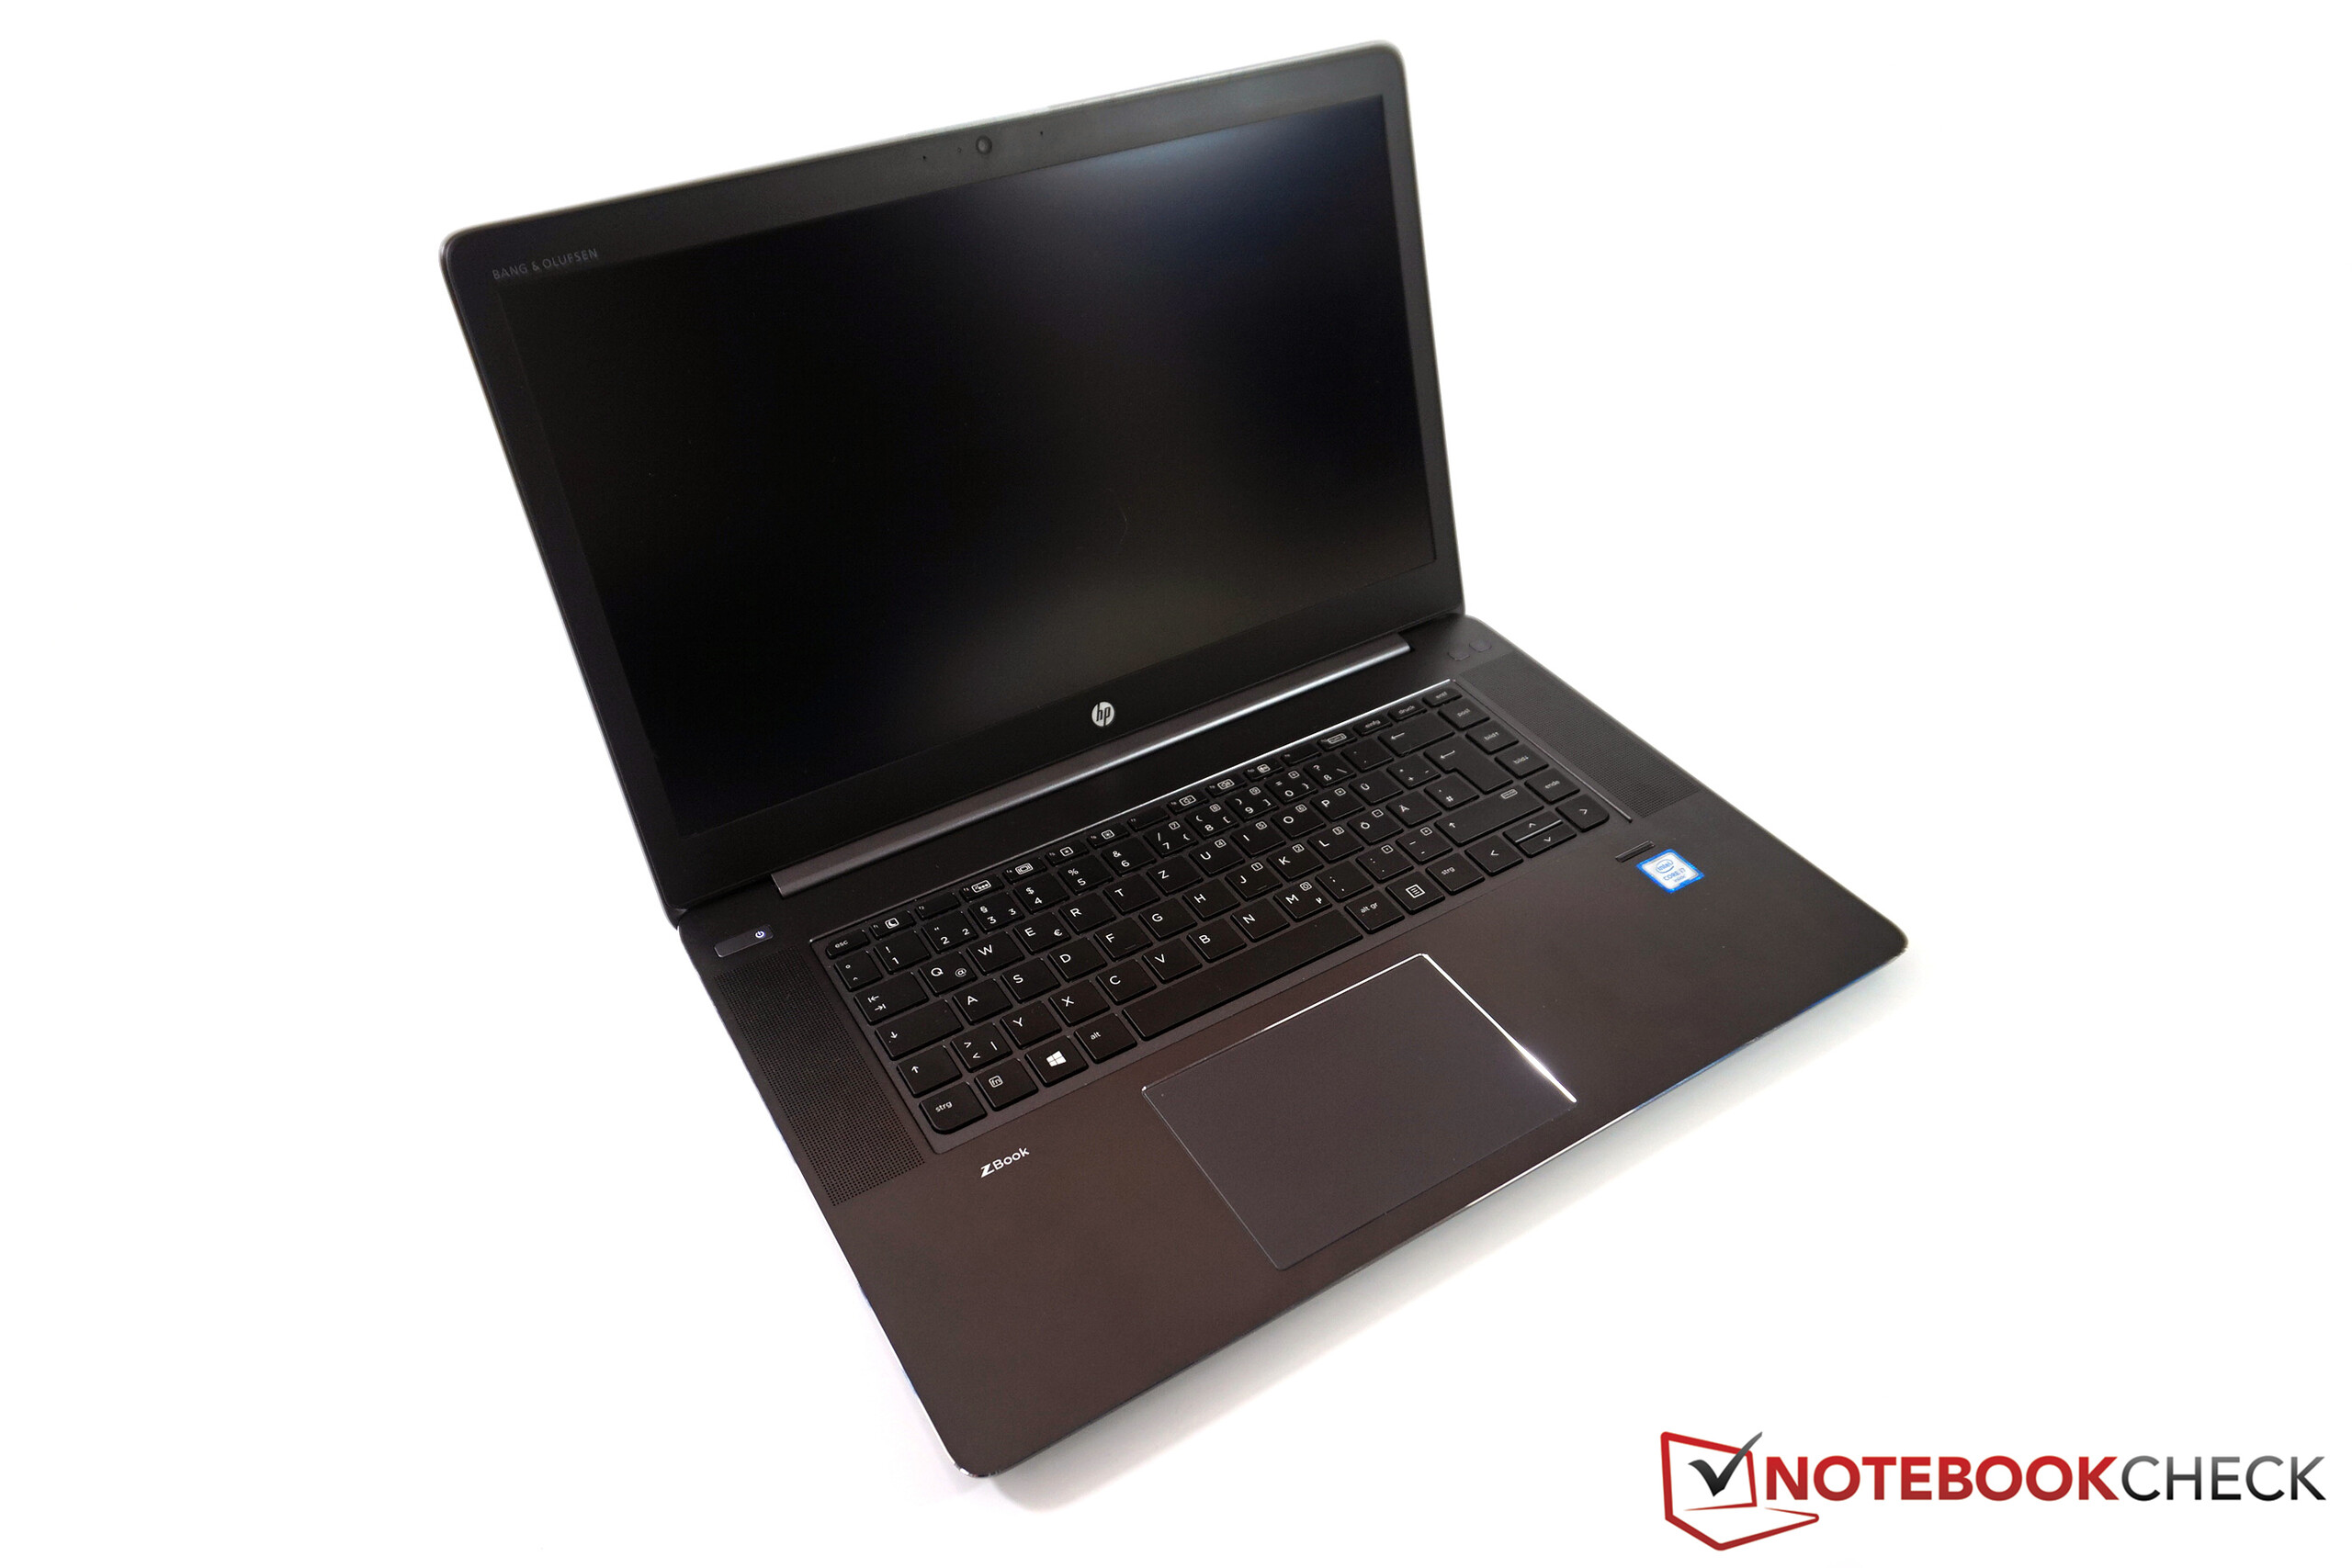
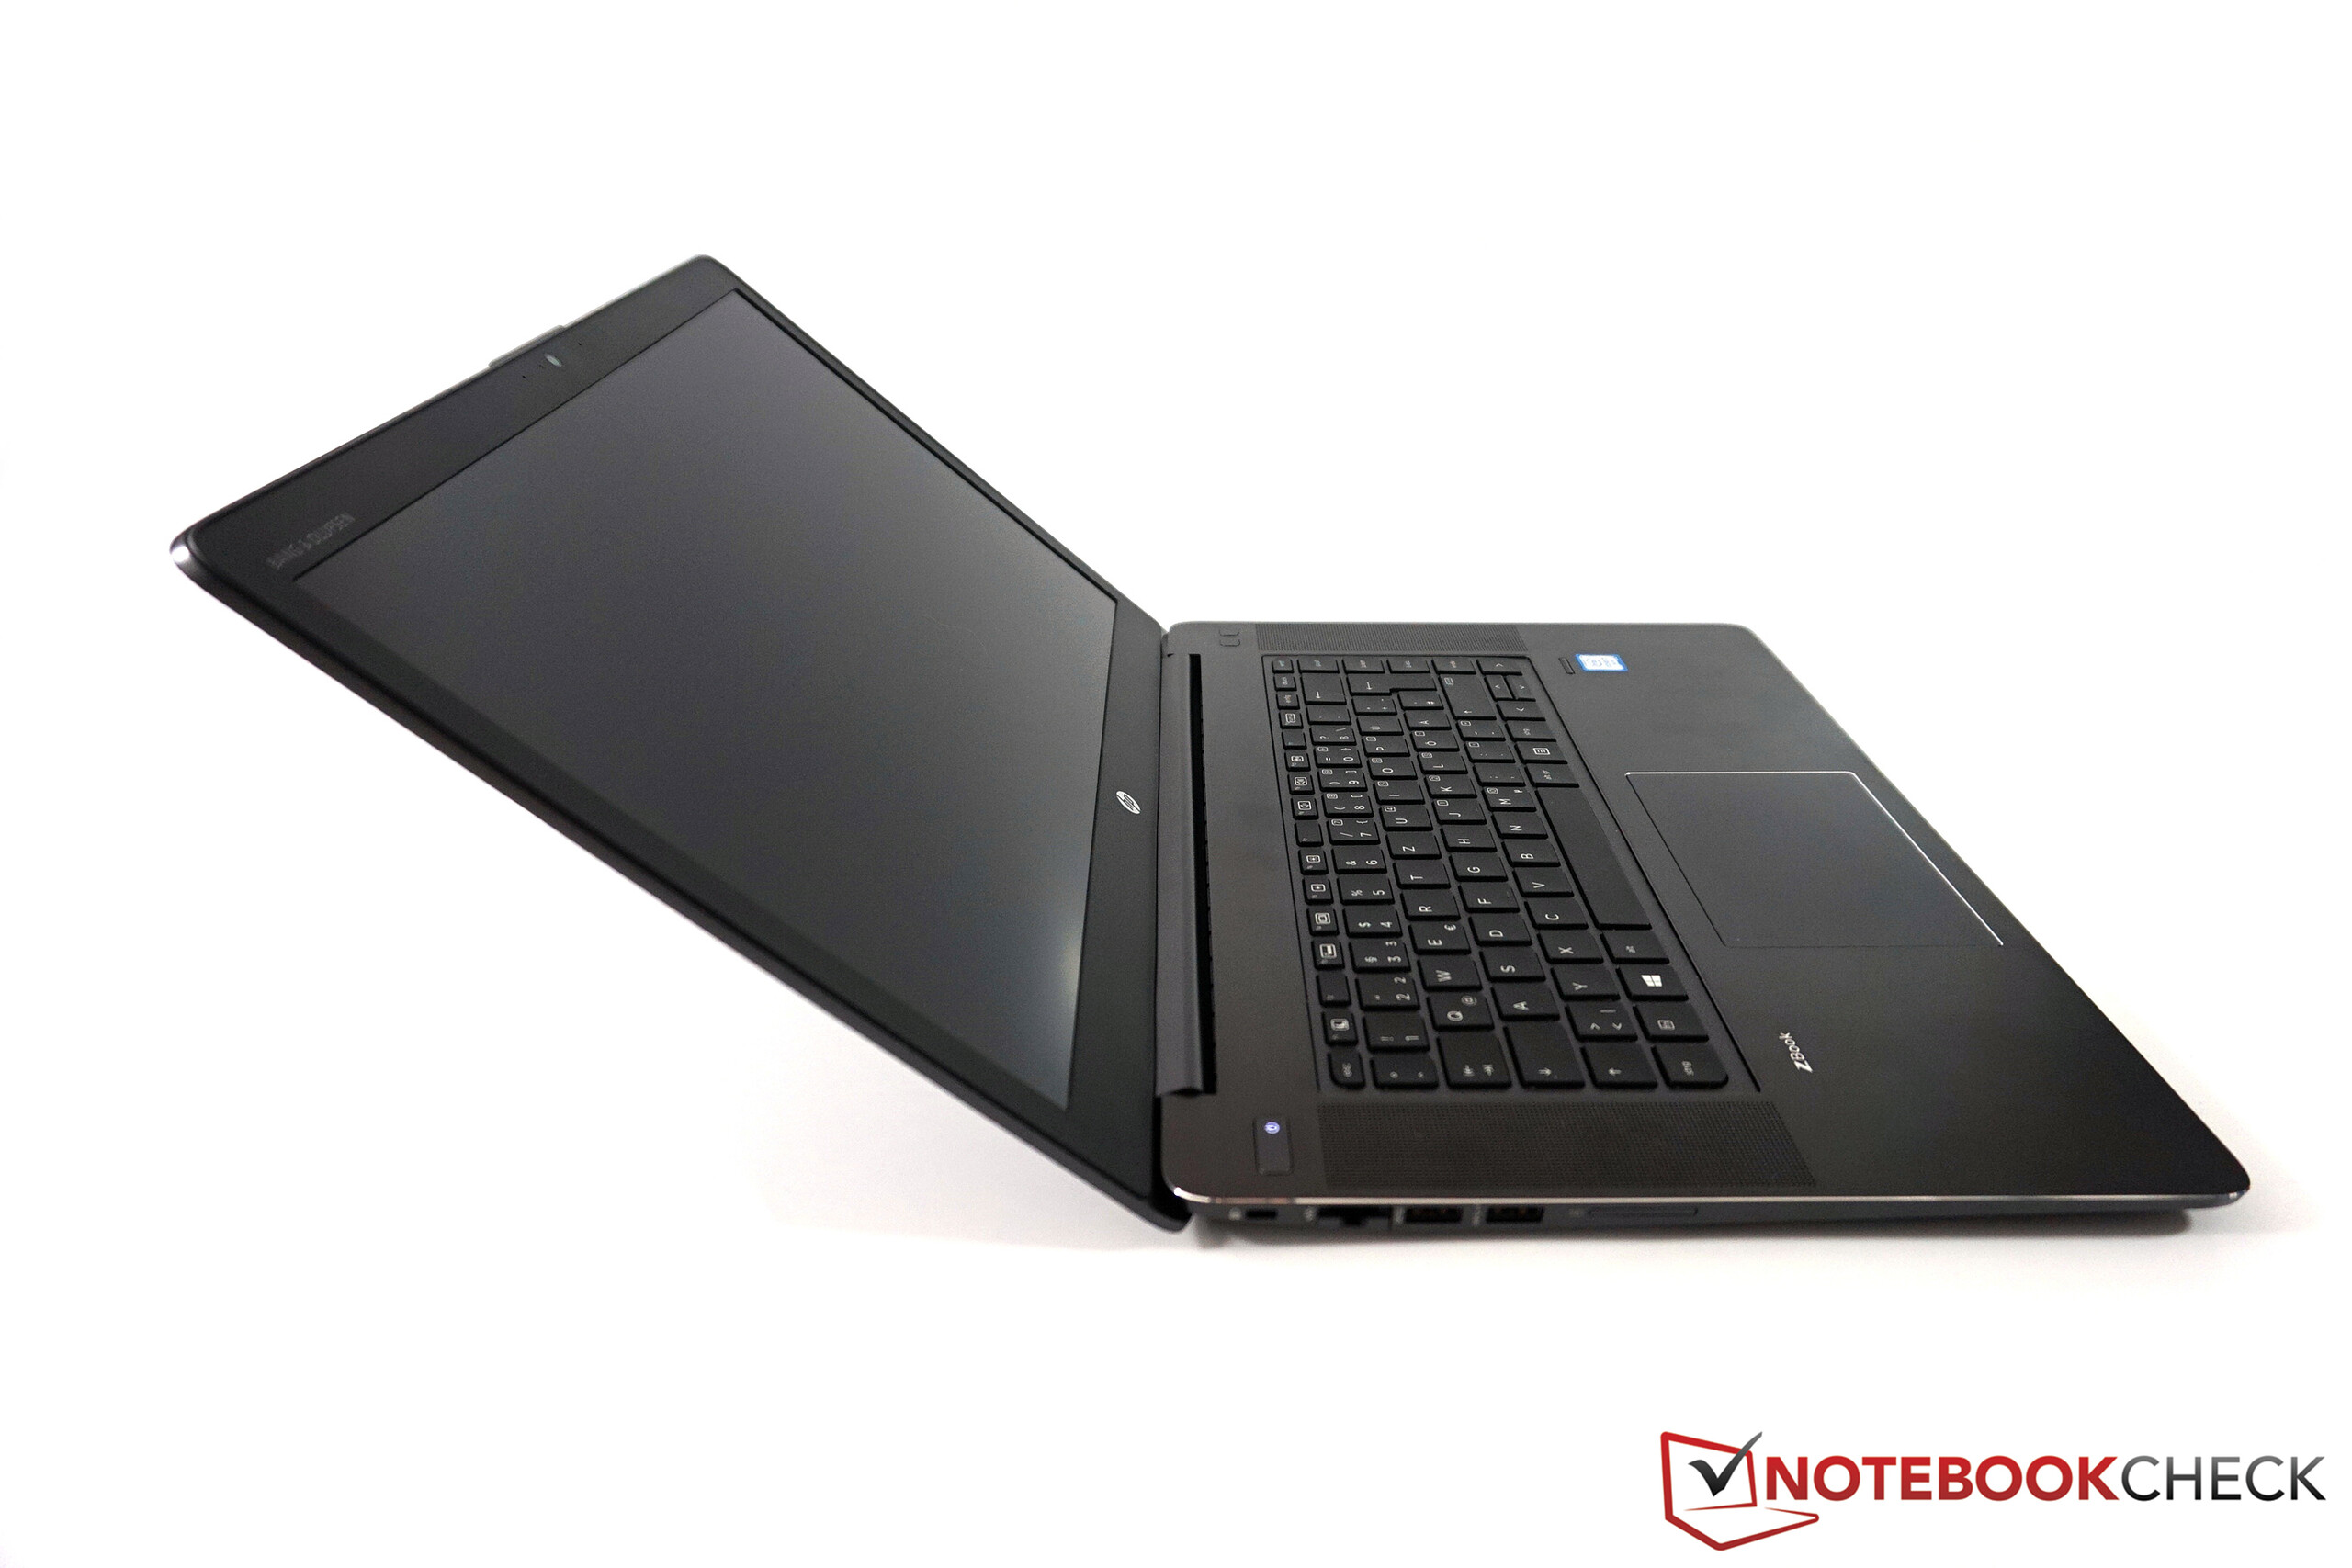
Breve análisis de la estación de trabajo HP ZBook Studio G3
| |||||||||||||||||||||||||
iluminación: 86 %
Brillo con batería: 307 cd/m²
Contraste: 1069:1 (Negro: 0.29 cd/m²)
ΔE Color 5.9 | 0.5-29.43 Ø5
ΔE Greyscale 5.5 | 0.57-98 Ø5.3
99.9% sRGB (Calman 2D)
99% sRGB (Argyll 1.6.3 3D)
85% AdobeRGB 1998 (Argyll 1.6.3 3D)
98% AdobeRGB 1998 (Argyll 2.2.0 3D)
98.9% sRGB (Argyll 2.2.0 3D)
86% Display P3 (Argyll 2.2.0 3D)
Gamma: 2.09
| HP ZBook Studio G3 15.60, 3840x2160, IPS | Dell Precision 5510 15.60, 3840x2160, IGZO LED | MSI WS60-6QJE316H11 15.60, 3840x2160, IPS | Lenovo ThinkPad P50 15.60, 1920x1080, IPS | Lenovo ThinkPad P50s-20FKS00400 15.50, 2880x1620, IPS | HP ZBook 15 G3 15.60, 1920x1080, UWVA-IPS | HP ZBook 15u G3 15.60, 1920x1080, TN LED | Apple MacBook Pro Retina 15 inch 2015-05 15.40, 2880x1800, IPS-Panel | |
|---|---|---|---|---|---|---|---|---|
| Display | 2% | -31% | -51% | -24% | -18% | -34% | -24% | |
| Display P3 Coverage | 86 | 88.4 3% | 55.1 -36% | 39.13 -54% | 63.7 -26% | 66.8 -22% | 53.2 -38% | 61.4 -29% |
| sRGB Coverage | 98.9 | 100 1% | 83 -16% | 58.5 -41% | 87.6 -11% | 95.5 -3% | 80.1 -19% | 90.8 -8% |
| AdobeRGB 1998 Coverage | 98 | 99.5 2% | 56.9 -42% | 40.45 -59% | 63.8 -35% | 69 -30% | 54.9 -44% | 62.9 -36% |
| Response Times | -38% | 193% | -9% | 0% | -26% | -18% | ||
| Response Time Grey 50% / Grey 80% * | 44 ? | 56.4 ? -28% | 34 ? 23% | 46 ? -5% | 38 ? 14% | 54 ? -23% | 45.6 ? -4% | |
| Response Time Black / White * | 23.2 ? | 34 ? -47% | 24 ? -3% | 26 ? -12% | 28.8 ? -24% | 35.6 ? -53% | 34.4 ? -48% | |
| PWM Frequency | 200 ? | 1316 ? 558% | 219 ? 10% | 198 ? -1% | 198.4 ? -1% | |||
| Screen | 7% | -6% | -10% | -2% | -8% | -48% | 15% | |
| Brightness middle | 310 | 391 26% | 237 -24% | 263 -15% | 319 3% | 306 -1% | 297.8 -4% | 341 10% |
| Brightness | 299 | 361 21% | 208 -30% | 236 -21% | 290 -3% | 289 -3% | 284 -5% | 315 5% |
| Brightness Distribution | 86 | 87 1% | 77 -10% | 78 -9% | 82 -5% | 85 -1% | 89 3% | 82 -5% |
| Black Level * | 0.29 | 0.4 -38% | 0.26 10% | 0.34 -17% | 0.31 -7% | 0.34 -17% | 0.849 -193% | 0.34 -17% |
| Contrast | 1069 | 978 -9% | 912 -15% | 774 -28% | 1029 -4% | 900 -16% | 351 -67% | 1003 -6% |
| Colorchecker dE 2000 * | 5.9 | 4.85 18% | 4.42 25% | 2.35 60% | 4.8 19% | 5.1 14% | 8.68 -47% | 2.07 65% |
| Colorchecker dE 2000 max. * | 10.7 | 8.54 20% | 7.8 27% | 9.9 7% | 14.98 -40% | 3.27 69% | ||
| Greyscale dE 2000 * | 5.5 | 4.01 27% | 4.43 19% | 3.33 39% | 5.7 -4% | 7.4 -35% | 9.3 -69% | 1.9 65% |
| Gamma | 2.09 105% | 2.18 101% | 2.23 99% | 2.38 92% | 2.07 106% | 2.37 93% | 2.27 97% | 2.62 84% |
| CCT | 5980 109% | 7340 89% | 6133 106% | 6917 94% | 6260 104% | 7263 89% | 10585 61% | 6514 100% |
| Color Space (Percent of AdobeRGB 1998) | 85 | 96 13% | 52.5 -38% | 37 -56% | 56.9 -33% | 63 -26% | 50.99 -40% | 58 -32% |
| Color Space (Percent of sRGB) | 99 | 100 1% | 82.9 -16% | 58 -41% | 87.4 -12% | 95 -4% | 80.42 -19% | 91 -8% |
| Media total (Programa/Opciones) | -10% /
-1% | 52% /
27% | -23% /
-19% | -9% /
-6% | -17% /
-13% | -33% /
-40% | -5% /
6% |
* ... más pequeño es mejor
Tiempos de respuesta del display
| ↔ Tiempo de respuesta de Negro a Blanco | ||
|---|---|---|
| 23.2 ms ... subida ↗ y bajada ↘ combinada | ↗ 6 ms subida | 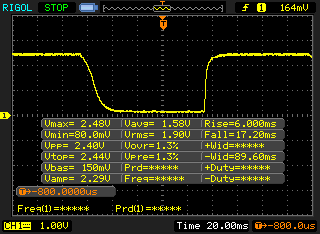 |
| ↘ 17.2 ms bajada | ||
| La pantalla mostró buenos tiempos de respuesta en nuestros tests pero podría ser demasiado lenta para los jugones competitivos. En comparación, todos los dispositivos de prueba van de ##min### (mínimo) a 240 (máximo) ms. » 47 % de todos los dispositivos son mejores. Eso quiere decir que el tiempo de respuesta es similar al dispositivo testado medio (21.5 ms). | ||
| ↔ Tiempo de respuesta 50% Gris a 80% Gris | ||
| 44 ms ... subida ↗ y bajada ↘ combinada | ↗ 17 ms subida |  |
| ↘ 27 ms bajada | ||
| La pantalla mostró tiempos de respuesta lentos en nuestros tests y podría ser demasiado lenta para los jugones. En comparación, todos los dispositivos de prueba van de ##min### (mínimo) a 636 (máximo) ms. » 70 % de todos los dispositivos son mejores. Eso quiere decir que el tiempo de respuesta es peor que la media (33.7 ms) de todos los dispositivos testados. | ||
Parpadeo de Pantalla / PWM (Pulse-Width Modulation)
| Parpadeo de Pantalla / PWM detectado | 200 Hz | ≤ 55 % de brillo | 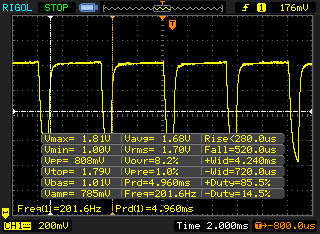 |
La retroiluminación del display parpadea a 200 Hz (seguramente usa PWM - Pulse-Width Modulation) a un brillo del 55 % e inferior. Sobre este nivel de brillo no debería darse parpadeo / PWM. La frecuencia de 200 Hz es relativamente baja, por lo que la gente sensible debería ver parpadeos y padecer fatiga visual por la pantalla (usado al brillo indicado a continuación). Comparación: 53 % de todos los dispositivos testados no usaron PWM para atenuar el display. Si se usó, medimos una media de 17900 (mínimo: 5 - máxmo: 3846000) Hz. | |||


| PCMark 7 - Score | |
| HP ZBook 15 G3 | |
| HP ZBook 15u G3 | |
| Apple MacBook Pro Retina 15 inch 2015-05 | |
| MSI WS60-6QJE316H11 | |
| HP ZBook Studio G3 | |
| Dell Precision 5510 | |
| Lenovo ThinkPad P50s-20FKS00400 | |
| Lenovo ThinkPad P50 | |
| PCMark 7 Score | 5336 puntos | |
| PCMark 8 Home Score Accelerated v2 | 3262 puntos | |
| PCMark 8 Creative Score Accelerated v2 | 4235 puntos | |
| PCMark 8 Work Score Accelerated v2 | 4301 puntos | |
ayuda | ||

| SiSoft Sandra 2016 | |
| Image Processing | |
| HP ZBook 15 G3 | |
| HP ZBook Studio G3 | |
| MSI WS60-6QJE316H11 | |
| Lenovo ThinkPad P50 | |
| Dell Precision 5510 | |
| Lenovo ThinkPad P50s-20FKS00400 | |
| GP Cryptography (Higher Security AES256+SHA2-512) | |
| Lenovo ThinkPad P50 | |
| HP ZBook 15 G3 | |
| MSI WS60-6QJE316H11 | |
| HP ZBook Studio G3 | |
| Dell Precision 5510 | |
| Lenovo ThinkPad P50s-20FKS00400 | |
| GP Financial Analysis (FP High/Double Precision) | |
| HP ZBook 15 G3 | |
| Lenovo ThinkPad P50 | |
| MSI WS60-6QJE316H11 | |
| Dell Precision 5510 | |
| HP ZBook Studio G3 | |
| Lenovo ThinkPad P50s-20FKS00400 | |
| Unigine Heaven 3.0 | |
| 1920x1080 DX 11, Normal Tessellation, High Shaders AA:Off AF:Off | |
| MSI WS60-6QJE316H11 | |
| Lenovo ThinkPad P50 | |
| HP ZBook 15 G3 | |
| Dell Precision 5510 | |
| HP ZBook Studio G3 | |
| Lenovo ThinkPad P50s-20FKS00400 | |
| 1920x1080 OpenGL, Normal Tessellation, High Shaders AA:Off AF:Off | |
| HP ZBook 15 G3 | |
| HP ZBook Studio G3 | |
| Dell Precision 5510 | |
| MSI WS60-6QJE316H11 | |
| Lenovo ThinkPad P50 | |
| Lenovo ThinkPad P50s-20FKS00400 | |
| Unigine Valley 1.0 | |
| 1920x1080 Extreme HD DirectX AA:x8 | |
| Lenovo ThinkPad P50 | |
| HP ZBook 15 G3 | |
| MSI WS60-6QJE316H11 | |
| HP ZBook Studio G3 | |
| Dell Precision 5510 | |
| Lenovo ThinkPad P50s-20FKS00400 | |
| 1920x1080 Extreme HD Preset OpenGL AA:x8 | |
| HP ZBook 15 G3 | |
| HP ZBook Studio G3 | |
| Dell Precision 5510 | |
| MSI WS60-6QJE316H11 | |
| Lenovo ThinkPad P50 | |
| Lenovo ThinkPad P50s-20FKS00400 | |
| 3DMark 06 Standard Score | 24393 puntos | |
| 3DMark 11 Performance | 4673 puntos | |
| 3DMark Ice Storm Standard Score | 42096 puntos | |
| 3DMark Cloud Gate Standard Score | 15717 puntos | |
| 3DMark Fire Strike Score | 3302 puntos | |
ayuda | ||
| bajo | medio | alto | ultra | 4K | |
| BioShock Infinite (2013) | 176.7 | 115 | 100.1 | 37 | |
| The Witcher 3 (2015) | 59.4 | 36.5 | 20.8 | 10.8 | 7.7 |
| Rainbow Six Siege (2015) | 137.8 | 79.9 | 43.5 | 32 | 13.2 |
Ruido
| Ocioso |
| 30 / 30 / 30 dB(A) |
| Carga |
| 51 / 52.8 dB(A) |
 | ||
30 dB silencioso 40 dB(A) audible 50 dB(A) ruidosamente alto |
||
min: | ||
| HP ZBook Studio G3 6820HQ, Quadro M1000M | Dell Precision 5510 E3-1505M v5, Quadro M1000M | MSI WS60-6QJE316H11 E3-1505M v5, Quadro M2000M | Lenovo ThinkPad P50 6820HQ, Quadro M2000M | Lenovo ThinkPad P50s-20FKS00400 6500U, Quadro M500M | HP ZBook 15 G3 E3-1505M v5, Quadro M2000M | HP ZBook 15u G3 6600U, FirePro W4190M | Apple MacBook Pro Retina 15 inch 2015-05 4870HQ, Radeon R9 M370X | |
|---|---|---|---|---|---|---|---|---|
| Noise | 6% | -10% | 10% | 11% | 3% | 9% | 7% | |
| off / environment * | 30 | 30 -0% | ||||||
| Idle Minimum * | 30 | 30 -0% | 37.2 -24% | 30 -0% | 30 -0% | 30 -0% | 29.8 1% | 28.9 4% |
| Idle Average * | 30 | 30 -0% | 37.2 -24% | 30 -0% | 30 -0% | 30 -0% | 29.8 1% | 28.9 4% |
| Idle Maximum * | 30 | 30 -0% | 37.2 -24% | 30 -0% | 30 -0% | 30 -0% | 29.8 1% | 28.9 4% |
| Load Average * | 51 | 42.08 17% | 42.1 17% | 34.5 32% | 33.5 34% | 45.3 11% | 39.5 23% | 46 10% |
| Load Maximum * | 52.8 | 46.78 11% | 50.7 4% | 42.1 20% | 41.9 21% | 49.7 6% | 43.2 18% | 46 13% |
* ... más pequeño es mejor
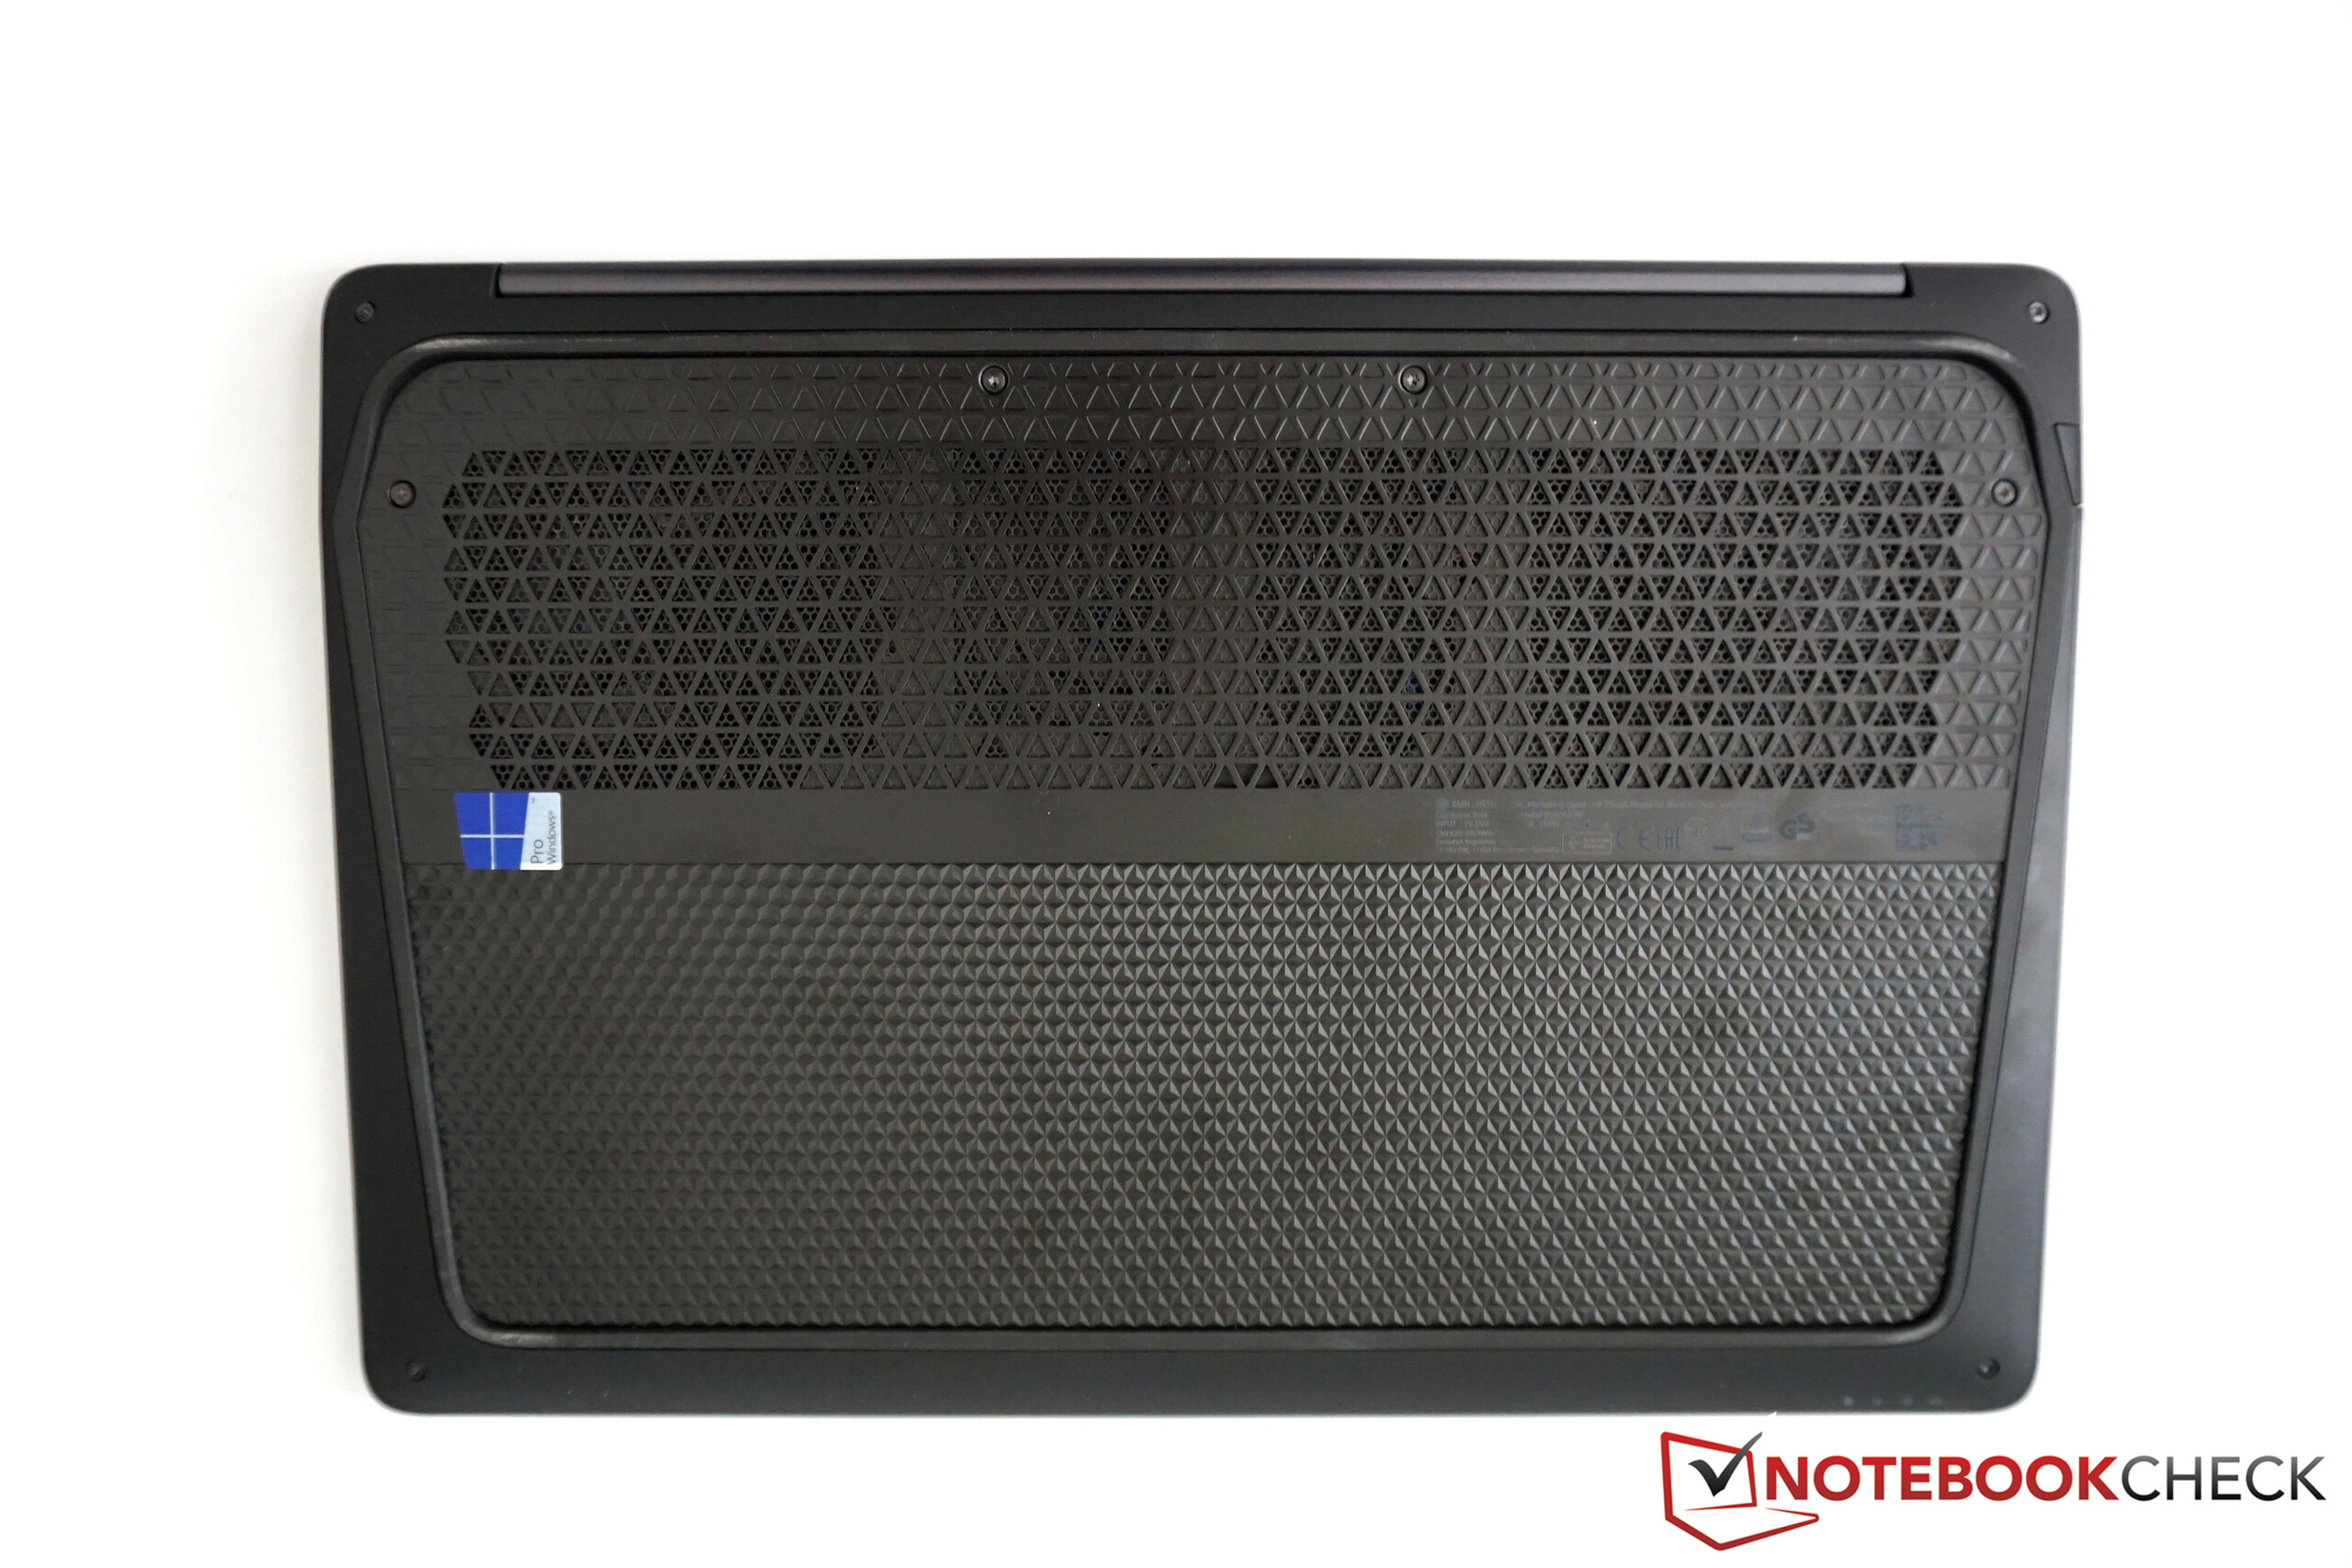
(-) The maximum temperature on the upper side is 69.8 °C / 158 F, compared to the average of 38.1 °C / 101 F, ranging from 22.2 to 69.8 °C for the class Workstation.
(-) The bottom heats up to a maximum of 77.3 °C / 171 F, compared to the average of 41.3 °C / 106 F
(+) In idle usage, the average temperature for the upper side is 30.1 °C / 86 F, compared to the device average of 32 °C / 90 F.
(±) The palmrests and touchpad can get very hot to the touch with a maximum of 38 °C / 100.4 F.
(-) The average temperature of the palmrest area of similar devices was 27.8 °C / 82 F (-10.2 °C / -18.4 F).
| HP ZBook Studio G3 6820HQ, Quadro M1000M | Dell Precision 5510 E3-1505M v5, Quadro M1000M | MSI WS60-6QJE316H11 E3-1505M v5, Quadro M2000M | Lenovo ThinkPad P50 6820HQ, Quadro M2000M | Lenovo ThinkPad P50s-20FKS00400 6500U, Quadro M500M | HP ZBook 15 G3 E3-1505M v5, Quadro M2000M | HP ZBook 15u G3 6600U, FirePro W4190M | Apple MacBook Pro Retina 15 inch 2015-05 4870HQ, Radeon R9 M370X | |
|---|---|---|---|---|---|---|---|---|
| Heat | 22% | 17% | 24% | 26% | 16% | 30% | 29% | |
| Maximum Upper Side * | 69.8 | 45.8 34% | 42.3 39% | 36.7 47% | 44.2 37% | 54.6 22% | 44.6 36% | 43.2 38% |
| Maximum Bottom * | 77.3 | 46.7 40% | 60.1 22% | 41.3 47% | 57.8 25% | 60.8 21% | 46 40% | 39 50% |
| Idle Upper Side * | 37.8 | 31.2 17% | 32.7 13% | 31.1 18% | 26.4 30% | 30.3 20% | 25.8 32% | 30 21% |
| Idle Bottom * | 31.4 | 31.9 -2% | 33.1 -5% | 36.2 -15% | 28.1 11% | 30.7 2% | 27.4 13% | 29.3 7% |
* ... más pequeño es mejor
| Off / Standby | |
| Ocioso | |
| Carga |
|
| HP ZBook Studio G3 64 Wh, 3840x2160 | Dell Precision 5510 56 Wh, 3840x2160 | MSI WS60-6QJE316H11 47 Wh, 3840x2160 | Lenovo ThinkPad P50 90 Wh, 1920x1080 | Lenovo ThinkPad P50s-20FKS00400 67 Wh, 2880x1620 | HP ZBook 15 G3 90 Wh, 1920x1080 | HP ZBook 15u G3 90 Wh, 1920x1080 | Apple MacBook Pro Retina 15 inch 2015-05 100 Wh, 2880x1800 | |
|---|---|---|---|---|---|---|---|---|
| Power Consumption | -5% | -71% | 25% | 43% | 11% | 42% | 16% | |
| Idle Minimum * | 8.7 | 8.6 1% | 18.8 -116% | 5.6 36% | 4.3 51% | 5.7 34% | 4.3 51% | 6 31% |
| Idle Average * | 14.2 | 16.2 -14% | 29.6 -108% | 8.6 39% | 9.7 32% | 12.2 14% | 7.9 44% | 12.8 10% |
| Idle Maximum * | 14.4 | 16.7 -16% | 30.3 -110% | 9.3 35% | 10.2 29% | 12.6 12% | 11.5 20% | 13.3 8% |
| Load Average * | 85.6 | 82.6 4% | 90.4 -6% | 89.5 -5% | 45.7 47% | 83.1 3% | 43.3 49% | 82.4 4% |
| Load Maximum * | 129.7 | 131.8 -2% | 150.2 -16% | 105 19% | 55.8 57% | 138.2 -7% | 72.3 44% | 91.8 29% |
* ... más pequeño es mejor
| HP ZBook Studio G3 64 Wh | Dell Precision 5510 56 Wh | MSI WS60-6QJE316H11 47 Wh | Lenovo ThinkPad P50 90 Wh | Lenovo ThinkPad P50s-20FKS00400 67 Wh | HP ZBook 15 G3 90 Wh | HP ZBook 15u G3 90 Wh | Apple MacBook Pro Retina 15 inch 2015-05 100 Wh | |
|---|---|---|---|---|---|---|---|---|
| Duración de Batería | 19% | -45% | 104% | 112% | 78% | 72% | 89% | |
| Reader / Idle | 511 | 428 -16% | 160 -69% | 860 68% | 1107 117% | 822 61% | 756 48% | 1039 103% |
| H.264 | 228 | 197 -14% | 141 -38% | 533 134% | 537 136% | 449 97% | 413 81% | |
| WiFi v1.3 | 208 | 286 38% | 106 -49% | 498 139% | 408 96% | 386 86% | 312 50% | 432 108% |
| Load | 65 | 109 68% | 51 -22% | 113 74% | 129 98% | 110 69% | 141 117% | 105 62% |
| WiFi | 298 |
Pro
Contra
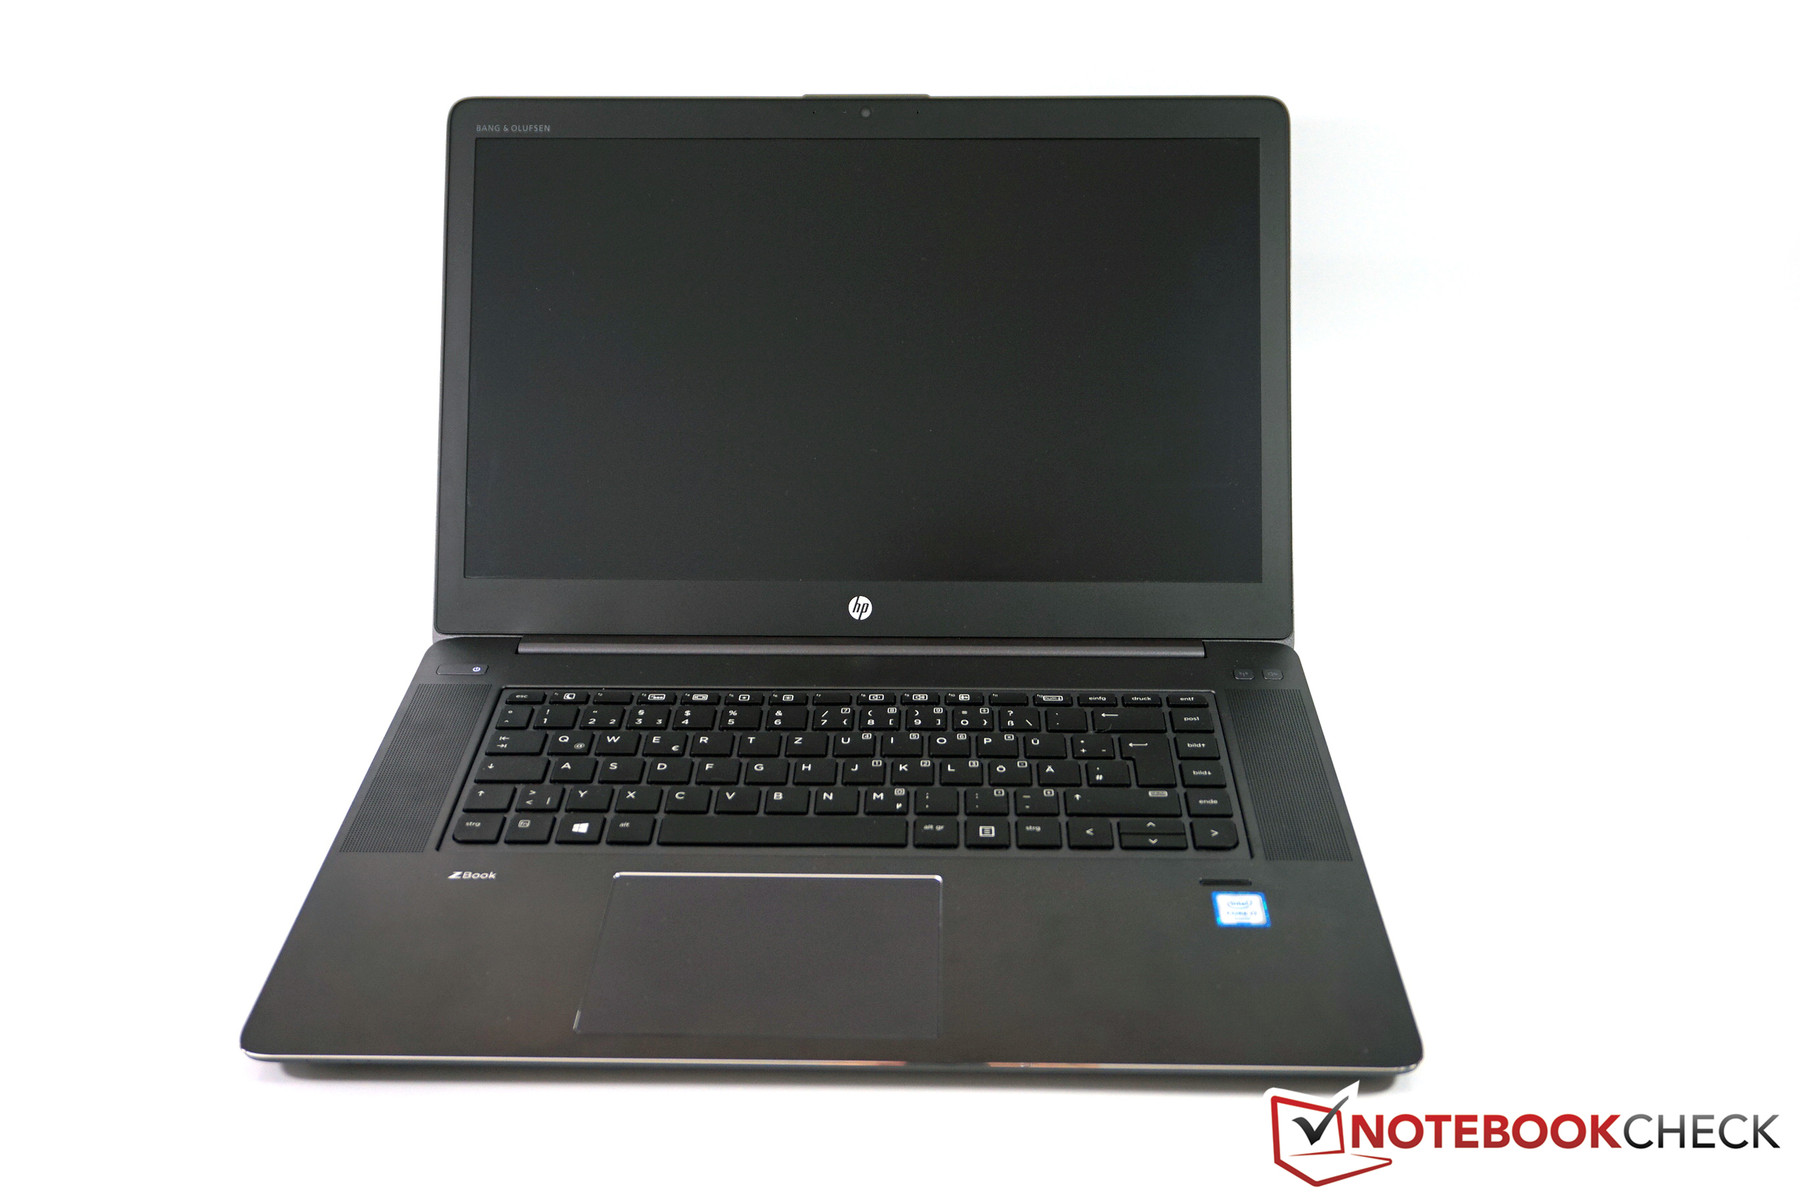
El ZBook Studio G3 es un pequeño misterio para nosotros. HP ofrece un producto genial en ciertos aspectos, pero decepciona en otras categorías. Por desgracia, en general, nuestra opinión de la ambiciosa estación de trabajo es negativa. Esto se debe principalmente a las emisiones así como al aguante de la batería. Las superficies alcanzan temperaturas alarmantemente altas que pueden causar quemaduras, incluso con cargas normales. El comportamiento del ventilador también es muy molesto, ya que ambos ventiladores actúan independientemente, hacen mucho ruido y pulsan mucho. El aguante práctico de menos de cuatro horas también es difícil de justificar en un dispositivo que en realidad es muy móvil. Por lo demás, son pequeños problemas como la ausencia de lector de SmartCard o la falta de un módulo WWAN.
El ZBook Studio es un proyecto ambicioso. Tiene mucho rendimiento en un paquete compacto, pero también temperaturas extremas y ventiladores molestos. Esto no debería darse en un dispositivo de 3800 Euros.
El ZBook Studio logra convencer en muchos aspectos: Tiene mucho rendimiento en un chasis combinado con una genial pantalla 4K y unos buenos dispositivos de entrada. Seguimos creyendo que las limitaciones son demasiado severas. También está el altísimo precio de 3800 Euros de nuestra configuración de pruebas, algo que cuesta justificar vistos los problemas. Las actualizaciones de BIOS no han mejorado la situación por ahora, pero esperamos que HP pueda al menos mejorar el molesto control de ventilador con una actualización futura . Por ahora, las estaciones de trabajo más grandes tienen ventajas en términos de emisiones y también se pueden equipar con componentes incluso más potentes.
Ésta es una versión acortada del análisis original. Puedes leer el análisis completo en inglés aquí.
HP ZBook Studio G3
-
05/19/2016 v5.1(old)
Andreas Osthoff
Pricecompare
