 Deutsch
 English
 Español
 Français
 Italiano
 Nederlands
 Polski
 Português
 Русский
 Türkçe
 Svenska
 Chinese
 Magyar
Breve análisis del MSI PE70 2QE
| |||||||||||||||||||||||||
iluminación: 79 %
Brillo con batería: 245 cd/m²
Contraste: 610:1 (Negro: 0.5 cd/m²)
ΔE Color 4.83 | 0.5-29.43 Ø5
ΔE Greyscale 3.29 | 0.57-98 Ø5.3
84% sRGB (Argyll 1.6.3 3D)
56% AdobeRGB 1998 (Argyll 1.6.3 3D)
61.9% AdobeRGB 1998 (Argyll 2.2.0 3D)
84.6% sRGB (Argyll 2.2.0 3D)
66.6% Display P3 (Argyll 2.2.0 3D)
Gamma: 2.39
| MSI PE70-2QEi581 GeForce GTX 960M, 4210H, Toshiba HG5d THNSNH256GMCT | Acer Aspire V Nitro 7-791G-70TW GeForce GTX 960M, 4720HQ, Kingston RBU-SNS8100S3256GD | Asus N751JX-T4056H GeForce GTX 950M, 4720HQ, Toshiba MQ01ABD100 | Lenovo Y70 DU004HUS GeForce GTX 860M, 4710HQ, Western Digital WD10S21X SSHD 1TB + 8GB SSD-Cache | Asus GL771JM GeForce GTX 860M, 4710HQ, Kingston RBU-SC100S37128GD | |
|---|---|---|---|---|---|
| Display | 4% | 15% | 4% | 6% | |
| Display P3 Coverage | 66.6 | 70.1 5% | 76.8 15% | 69.2 4% | 71.8 8% |
| sRGB Coverage | 84.6 | 87.5 3% | 97.6 15% | 87.8 4% | 88.7 5% |
| AdobeRGB 1998 Coverage | 61.9 | 63.9 3% | 71.4 15% | 64.4 4% | 64.8 5% |
| Screen | -7% | -0% | 15% | -1% | |
| Brightness middle | 305 | 347 14% | 337 10% | 329.5 8% | 336 10% |
| Brightness | 265 | 326 23% | 312 18% | 325 23% | 309 17% |
| Brightness Distribution | 79 | 90 14% | 86 9% | 91 15% | 84 6% |
| Black Level * | 0.5 | 0.409 18% | 0.61 -22% | 0.381 24% | 0.41 18% |
| Contrast | 610 | 848 39% | 552 -10% | 865 42% | 820 34% |
| Colorchecker dE 2000 * | 4.83 | 6.81 -41% | 5.84 -21% | 4.45 8% | 7.21 -49% |
| Greyscale dE 2000 * | 3.29 | 7.27 -121% | 3.86 -17% | 3.45 -5% | 4.96 -51% |
| Gamma | 2.39 92% | 2.4 92% | 2.59 85% | 2.03 108% | 2.98 74% |
| CCT | 7080 92% | 7546 86% | 6859 95% | 6623 98% | 6572 99% |
| Color Space (Percent of AdobeRGB 1998) | 56 | 57 2% | 64 14% | 57.81 3% | 58 4% |
| Color Space (Percent of sRGB) | 84 | 97 15% | |||
| Media total (Programa/Opciones) | -2% /
-4% | 8% /
3% | 10% /
12% | 3% /
1% |
* ... más pequeño es mejor
| PCMark 7 - Score (ordenar por valor) | |
| MSI PE70-2QEi581 | |
| Acer Aspire V Nitro 7-791G-70TW | |
| Lenovo Y70 DU004HUS | |
| Asus GL771JM | |
| PCMark 8 | |
| Home Score Accelerated v2 (ordenar por valor) | |
| MSI PE70-2QEi581 | |
| Asus N751JX-T4056H | |
| Lenovo Y70 DU004HUS | |
| Asus GL771JM | |
| Work Score Accelerated v2 (ordenar por valor) | |
| MSI PE70-2QEi581 | |
| Asus N751JX-T4056H | |
| Lenovo Y70 DU004HUS | |
| Asus GL771JM | |
| PCMark 7 Score | 3126 puntos | |
| PCMark 8 Home Score Accelerated v2 | 3194 puntos | |
| PCMark 8 Work Score Accelerated v2 | 4407 puntos | |
ayuda | ||

| 3DMark 11 - 1280x720 Performance (ordenar por valor) | |
| MSI PE70-2QEi581 | |
| Acer Aspire V Nitro 7-791G-70TW | |
| Asus N751JX-T4056H | |
| Lenovo Y70 DU004HUS | |
| Asus GL771JM | |
| 3DMark - 1920x1080 Fire Strike Score (ordenar por valor) | |
| MSI PE70-2QEi581 | |
| Acer Aspire V Nitro 7-791G-70TW | |
| Asus N751JX-T4056H | |
| Lenovo Y70 DU004HUS | |
| Asus GL771JM | |
| 3DMark 06 Standard Score | 20363 puntos | |
| 3DMark 11 Performance | 4880 puntos | |
| 3DMark Ice Storm Standard Score | 47288 puntos | |
| 3DMark Cloud Gate Standard Score | 10548 puntos | |
| 3DMark Fire Strike Score | 3661 puntos | |
ayuda | ||
| Tomb Raider | |
| 1366x768 High Preset AA:FX AF:8x (ordenar por valor) | |
| MSI PE70-2QEi581 | |
| Acer Aspire V Nitro 7-791G-70TW | |
| Asus N751JX-T4056H | |
| Lenovo Y70 DU004HUS | |
| Asus GL771JM | |
| 1920x1080 Ultra Preset AA:FX AF:16x (ordenar por valor) | |
| MSI PE70-2QEi581 | |
| Acer Aspire V Nitro 7-791G-70TW | |
| Asus N751JX-T4056H | |
| Lenovo Y70 DU004HUS | |
| Asus GL771JM | |
| BioShock Infinite | |
| 1366x768 High Preset (ordenar por valor) | |
| MSI PE70-2QEi581 | |
| Acer Aspire V Nitro 7-791G-70TW | |
| Lenovo Y70 DU004HUS | |
| Asus GL771JM | |
| 1920x1080 Ultra Preset, DX11 (DDOF) (ordenar por valor) | |
| MSI PE70-2QEi581 | |
| Acer Aspire V Nitro 7-791G-70TW | |
| Lenovo Y70 DU004HUS | |
| Asus GL771JM | |
| bajo | medio | alto | ultra | |
| Tomb Raider (2013) | 178.4 | 158 | 104.5 | 48.4 |
| BioShock Infinite (2013) | 115.8 | 109.1 | 96.4 | 37.7 |
| Dirt Rally (2015) | 98.7 | 69.3 | 40.5 | 29.3 |
| MSI PE70-2QEi581 GeForce GTX 960M, 4210H, Toshiba HG5d THNSNH256GMCT | Acer Aspire V Nitro 7-791G-70TW GeForce GTX 960M, 4720HQ, Kingston RBU-SNS8100S3256GD | Asus N751JX-T4056H GeForce GTX 950M, 4720HQ, Toshiba MQ01ABD100 | Lenovo Y70 DU004HUS GeForce GTX 860M, 4710HQ, Western Digital WD10S21X SSHD 1TB + 8GB SSD-Cache | Asus GL771JM GeForce GTX 860M, 4710HQ, Kingston RBU-SC100S37128GD | |
|---|---|---|---|---|---|
| Noise | -1% | 3% | 8% | 7% | |
| Idle Minimum * | 33 | 29.6 10% | 33.2 -1% | 29.1 12% | 29.8 10% |
| Idle Average * | 34 | 32.1 6% | 33.3 2% | 30.8 9% | 32.4 5% |
| Idle Maximum * | 36.2 | 35.4 2% | 33.6 7% | 31.2 14% | 33.2 8% |
| Load Average * | 39.1 | 47.3 -21% | 40.4 -3% | 39.1 -0% | 39.6 -1% |
| Load Maximum * | 48.1 | 48.1 -0% | 42.4 12% | 46.5 3% | 41.6 14% |
* ... más pequeño es mejor
Ruido
| Ocioso |
| 33 / 34 / 36.2 dB(A) |
| HDD |
| 33.3 dB(A) |
| DVD |
| 37.4 / dB(A) |
| Carga |
| 39.1 / 48.1 dB(A) |
 | ||
30 dB silencioso 40 dB(A) audible 50 dB(A) ruidosamente alto |
||
min: | ||
(-) The maximum temperature on the upper side is 46 °C / 115 F, compared to the average of 36.9 °C / 98 F, ranging from 21.1 to 71 °C for the class Multimedia.
(±) The bottom heats up to a maximum of 42.3 °C / 108 F, compared to the average of 39.1 °C / 102 F
(±) In idle usage, the average temperature for the upper side is 32.4 °C / 90 F, compared to the device average of 31.2 °C / 88 F.
(±) The palmrests and touchpad can get very hot to the touch with a maximum of 36 °C / 96.8 F.
(-) The average temperature of the palmrest area of similar devices was 28.8 °C / 83.8 F (-7.2 °C / -13 F).
| MSI PE70-2QEi581 GeForce GTX 960M, 4210H, Toshiba HG5d THNSNH256GMCT | Acer Aspire V Nitro 7-791G-70TW GeForce GTX 960M, 4720HQ, Kingston RBU-SNS8100S3256GD | Asus N751JX-T4056H GeForce GTX 950M, 4720HQ, Toshiba MQ01ABD100 | Asus GL771JM GeForce GTX 860M, 4710HQ, Kingston RBU-SC100S37128GD | |
|---|---|---|---|---|
| Power Consumption | 34% | 31% | 27% | |
| Idle Minimum * | 19.1 | 5.8 70% | 9.1 52% | 7.2 62% |
| Idle Average * | 24.3 | 13.1 46% | 13.8 43% | 14.2 42% |
| Idle Maximum * | 29.2 | 14.5 50% | 17.8 39% | 23.5 20% |
| Load Average * | 88.6 | 98 -11% | 89.7 -1% | 85.6 3% |
| Load Maximum * | 122 | 104.9 14% | 92.3 24% | 111.4 9% |
* ... más pequeño es mejor
| Off / Standby | |
| Ocioso | |
| Carga |
|
| MSI PE70-2QEi581 GeForce GTX 960M, 4210H, Toshiba HG5d THNSNH256GMCT | Acer Aspire V Nitro 7-791G-70TW GeForce GTX 960M, 4720HQ, Kingston RBU-SNS8100S3256GD | Asus N751JK-T4144H GeForce GTX 850M, 4710HQ, SanDisk X300s SD7SB3Q-128G | Lenovo Y70 DU004HUS GeForce GTX 860M, 4710HQ, Western Digital WD10S21X SSHD 1TB + 8GB SSD-Cache | Asus GL771JM GeForce GTX 860M, 4710HQ, Kingston RBU-SC100S37128GD | |
|---|---|---|---|---|---|
| Duración de Batería | 29% | -14% | 39% | 39% | |
| Reader / Idle | 345 | 356 3% | 438 27% | 574 66% | |
| WiFi v1.3 | 158 | 204 29% | 251 59% | ||
| Load | 61 | 42 -31% | 92 51% | 56 -8% | |
| WiFi | 298 | 218 |
Pro
Contra
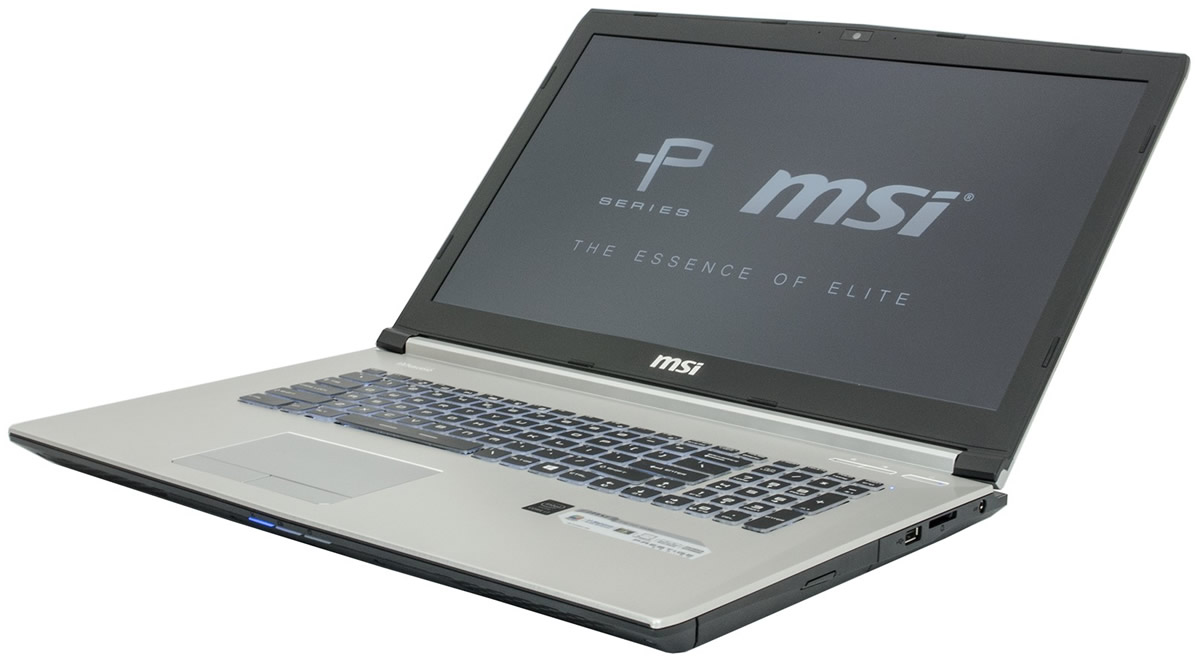
MSI usa un maketing muy agresivo para su nueva línea Prestige e incluye un montón de características, pero no todas nos pudieron convencer druante el análisis. El chasis causa una noble primera impresión con sus superficies de aluminio, pero la estabilidad de la unidad base y el teclado están a la altura. Nos gustó la experiencia de mecanografiado del teclado en sí mismo, pero no los botones del touchpad que ciertamente no encajan con lo que afirma Prestige. La pequeña batería y la corta duración afectan a la movilidad del dispositivo.
Obviamente también hay muchos aspectos positivos en el PE70. El display mate Full HD IPS tiene una buena calidad de imagen, aunque MSI usa un panel aún mejor para el PE60. Puedes usar todo el rendimiento de los componentes enchufado, y los altavoces funcionan bien combinado con el software Nahimic. Los añadidos software convencen en general.
El MSI PE70 es un portátil multimedia decente, pero no puede cumplir sus propias promesas.
Y también está el precio. La versión básica del PE70 tiene un PVR de 1,299 Euros, pero sólo trae un procesador dual-core y un HDD convencional. La competencia trae quad-cores y a veces SSDs por el mismo precio, pero el quad-core es un aspecto particularmente importante si quieres un dispositivo a prueba de tiempo. Se recomienda echar un vistazo a los rivales ya que la relación precio-rendimiento del PE70 no es muy buena.
Ésta es una versión acortada del análisis original. Puedes leer el análisis completo en inglés aquí.
MSI PE70-2QEi581
-
03/10/2016 v5(old)
Andreas Osthoff
Pricecompare
