 Deutsch
 English
 Español
 Français
 Italiano
 Nederlands
 Polski
 Português
 Русский
 Türkçe
 Svenska
 Chinese
 Magyar
Breve análisis del Razer Blade Pro 2015
| |||||||||||||||||||||||||
iluminación: 87 %
Brillo con batería: 315.5 cd/m²
Contraste: 384:1 (Negro: 0.822 cd/m²)
ΔE Color 12.21 | 0.5-29.43 Ø5
ΔE Greyscale 13.4 | 0.57-98 Ø5.3
90.3% sRGB (Argyll 1.6.3 3D)
59% AdobeRGB 1998 (Argyll 1.6.3 3D)
66.8% AdobeRGB 1998 (Argyll 2.2.0 3D)
90.4% sRGB (Argyll 2.2.0 3D)
69.7% Display P3 (Argyll 2.2.0 3D)
Gamma: 2.39
| Razer Blade Pro 17 inch 2015 GeForce GTX 960M, 4720HQ, Samsung PM851 Series MZMTE256HMHP | MSI GS70-2QE16SR51 GeForce GTX 970M, 4720HQ, Toshiba HG6 THNSNJ256GMCU | Gigabyte P37X GeForce GTX 980M, 4720HQ, 2x Lite-On LMT-128L9M (RAID 0) | Acer Aspire V Nitro 7-791G-70TW GeForce GTX 960M, 4720HQ, Kingston RBU-SNS8100S3256GD | Aorus X7 Pro GeForce GTX 970M SLI, 4870HQ, 2x Lite-On LMT-256L9M (RAID 0) | Asus G751JY-T7009H GeForce GTX 980M, 4710HQ, Samsung SSD XP941 MZHPU256HCGL | |
|---|---|---|---|---|---|---|
| Display | -8% | -3% | -2% | -3% | -6% | |
| Display P3 Coverage | 69.7 | 61.1 -12% | 68.7 -1% | 70.1 1% | 67.9 -3% | 66.4 -5% |
| sRGB Coverage | 90.4 | 85 -6% | 87.9 -3% | 87.5 -3% | 88.7 -2% | 85.3 -6% |
| AdobeRGB 1998 Coverage | 66.8 | 62.1 -7% | 64 -4% | 63.9 -4% | 64.9 -3% | 62.1 -7% |
| Screen | 28% | 30% | 35% | 28% | 36% | |
| Brightness middle | 315.5 | 251 -20% | 361.7 15% | 347 10% | 318 1% | 329 4% |
| Brightness | 295 | 249 -16% | 347 18% | 326 11% | 283 -4% | 326 11% |
| Brightness Distribution | 87 | 84 -3% | 91 5% | 90 3% | 82 -6% | 93 7% |
| Black Level * | 0.822 | 0.28 66% | 0.734 11% | 0.409 50% | 0.54 34% | 0.47 43% |
| Contrast | 384 | 896 133% | 493 28% | 848 121% | 589 53% | 700 82% |
| Colorchecker dE 2000 * | 12.21 | 11.19 8% | 2.81 77% | 6.81 44% | 3.79 69% | 3.95 68% |
| Greyscale dE 2000 * | 13.4 | 4.57 66% | 1.92 86% | 7.27 46% | 2.35 82% | 3.36 75% |
| Gamma | 2.39 92% | 2.38 92% | 2.21 100% | 2.4 92% | 2.37 93% | 2.46 89% |
| CCT | 19530 33% | 14550 45% | 6384 102% | 7546 86% | 6775 96% | 5961 109% |
| Color Space (Percent of AdobeRGB 1998) | 59 | 55 -7% | 57.95 -2% | 57 -3% | 58 -2% | 56 -5% |
| Color Space (Percent of sRGB) | 90.3 | |||||
| Media total (Programa/Opciones) | 10% /
18% | 14% /
21% | 17% /
25% | 13% /
20% | 15% /
24% |
* ... más pequeño es mejor
| Cinebench R11.5 | |
| CPU Single 64Bit (ordenar por valor) | |
| Razer Blade Pro 17 inch 2015 | |
| Alienware 15 | |
| Asus G501JW | |
| One M73-2N, Ivy Bridge | |
| Eurocom X8 | |
| CPU Multi 64Bit (ordenar por valor) | |
| Razer Blade Pro 17 inch 2015 | |
| Alienware 15 | |
| Asus G501JW | |
| One M73-2N, Ivy Bridge | |
| Eurocom X8 | |
| OpenGL 64Bit (ordenar por valor) | |
| Razer Blade Pro 17 inch 2015 | |
| Alienware 15 | |
| Asus G501JW | |
| Eurocom X8 | |
| Cinebench R15 | |
| CPU Single 64Bit (ordenar por valor) | |
| Razer Blade Pro 17 inch 2015 | |
| Alienware 15 | |
| Asus G501JW | |
| Eurocom X8 | |
| CPU Multi 64Bit (ordenar por valor) | |
| Razer Blade Pro 17 inch 2015 | |
| Alienware 15 | |
| Asus G501JW | |
| Eurocom X8 | |
| Ref. Match 64Bit (ordenar por valor) | |
| Razer Blade Pro 17 inch 2015 | |
| Asus G501JW | |
| Eurocom X8 | |
| OpenGL 64Bit (ordenar por valor) | |
| Razer Blade Pro 17 inch 2015 | |
| Alienware 15 | |
| Asus G501JW | |
| Eurocom X8 | |
| wPrime 2.10 | |
| 1024m (ordenar por valor) | |
| Razer Blade Pro 17 inch 2015 | |
| Asus G501JW | |
| One M73-2N, Ivy Bridge | |
| Eurocom X8 | |
| 32m (ordenar por valor) | |
| Razer Blade Pro 17 inch 2015 | |
| Asus G501JW | |
| One M73-2N, Ivy Bridge | |
| Eurocom X8 | |
| Super Pi Mod 1.5 XS 32M - 32M (ordenar por valor) | |
| Razer Blade Pro 17 inch 2015 | |
| Asus G501JW | |
| Eurocom X8 | |
| X264 HD Benchmark 4.0 | |
| Pass 2 (ordenar por valor) | |
| Razer Blade Pro 17 inch 2015 | |
| Alienware 15 | |
| Asus G501JW | |
| One M73-2N, Ivy Bridge | |
| Eurocom X8 | |
| Pass 1 (ordenar por valor) | |
| Razer Blade Pro 17 inch 2015 | |
| Alienware 15 | |
| Asus G501JW | |
| One M73-2N, Ivy Bridge | |
| Eurocom X8 | |
* ... más pequeño es mejor
| PCMark 7 Score | 6049 puntos | |
| PCMark 8 Home Score Accelerated v2 | 3741 puntos | |
| PCMark 8 Creative Score Accelerated v2 | 4528 puntos | |
| PCMark 8 Work Score Accelerated v2 | 4448 puntos | |
ayuda | ||
| 3DMark 06 Standard Score | 25997 puntos | |
| 3DMark 11 Performance | 5692 puntos | |
| 3DMark Ice Storm Standard Score | 105900 puntos | |
| 3DMark Cloud Gate Standard Score | 16363 puntos | |
| 3DMark Fire Strike Score | 4094 puntos | |
| 3DMark Fire Strike Extreme Score | 2041 puntos | |
ayuda | ||
| bajo | medio | alto | ultra | |
| Sleeping Dogs (2012) | 93.1 | 24.3 | ||
| Guild Wars 2 (2012) | 62.6 | 36 | ||
| Tomb Raider (2013) | 113.2 | 50.8 | ||
| StarCraft II: Heart of the Swarm (2013) | 127.8 | 55.1 | ||
| BioShock Infinite (2013) | 120 | 46.8 | ||
| Metro: Last Light (2013) | 61.9 | 32.2 | ||
| Thief (2014) | 54.1 | 28.3 | ||
| Middle-earth: Shadow of Mordor (2014) | 40.1 | 31 | ||
| Ryse: Son of Rome (2014) | 30.5 | 28.2 | ||
| F1 2014 (2014) | 113 | 94 |
| Tomb Raider | |
| 1920x1080 Ultra Preset AA:FX AF:16x (ordenar por valor) | |
| Razer Blade Pro 17 inch 2015 | |
| Lenovo Y70 DU004HUS | |
| SCHENKER M505 | |
| Razer Blade 14 2015 | |
| Gigabyte P37X | |
| 1366x768 High Preset AA:FX AF:8x (ordenar por valor) | |
| Razer Blade Pro 17 inch 2015 | |
| Lenovo Y70 DU004HUS | |
| SCHENKER M505 | |
| Razer Blade 14 2015 | |
| Gigabyte P37X | |
| 1366x768 Normal Preset AA:FX AF:4x (ordenar por valor) | |
| SCHENKER M505 | |
| 1024x768 Low Preset (ordenar por valor) | |
| SCHENKER M505 | |
| Sleeping Dogs | |
| 1920x1080 Extreme Preset AA:Extreme (ordenar por valor) | |
| Razer Blade Pro 17 inch 2015 | |
| Lenovo Y70 DU004HUS | |
| Razer Blade 14 2015 | |
| Gigabyte P37X | |
| 1366x768 High Preset AA:High (ordenar por valor) | |
| Razer Blade Pro 17 inch 2015 | |
| Lenovo Y70 DU004HUS | |
| Razer Blade 14 2015 | |
| Gigabyte P37X | |
| Guild Wars 2 | |
| 1920x1080 All Maximum / On AA:FX (ordenar por valor) | |
| Razer Blade Pro 17 inch 2015 | |
| Lenovo Y70 DU004HUS | |
| Razer Blade 14 2015 | |
| Gigabyte P37X | |
| 1366x768 Best Appearance Preset AA:FX (ordenar por valor) | |
| Razer Blade Pro 17 inch 2015 | |
| Lenovo Y70 DU004HUS | |
| Razer Blade 14 2015 | |
| Gigabyte P37X | |
| StarCraft II: Heart of the Swarm | |
| 1920x1080 Ultra / Extreme AA:on (ordenar por valor) | |
| Razer Blade Pro 17 inch 2015 | |
| Lenovo Y70 DU004HUS | |
| Razer Blade 14 2015 | |
| Gigabyte P37X | |
| 1366x768 High AA:on (ordenar por valor) | |
| Razer Blade Pro 17 inch 2015 | |
| Lenovo Y70 DU004HUS | |
| Razer Blade 14 2015 | |
| Gigabyte P37X | |
| BioShock Infinite | |
| 1920x1080 Ultra Preset, DX11 (DDOF) (ordenar por valor) | |
| Razer Blade Pro 17 inch 2015 | |
| Lenovo Y70 DU004HUS | |
| SCHENKER M505 | |
| Razer Blade 14 2015 | |
| Gigabyte P37X | |
| 1366x768 High Preset (ordenar por valor) | |
| Razer Blade Pro 17 inch 2015 | |
| Lenovo Y70 DU004HUS | |
| SCHENKER M505 | |
| Razer Blade 14 2015 | |
| Gigabyte P37X | |
| 1366x768 Medium Preset (ordenar por valor) | |
| SCHENKER M505 | |
| 1280x720 Very Low Preset (ordenar por valor) | |
| SCHENKER M505 | |
| Metro: Last Light | |
| 1920x1080 Very High (DX11) AF:16x (ordenar por valor) | |
| Razer Blade Pro 17 inch 2015 | |
| Lenovo Y70 DU004HUS | |
| SCHENKER M505 | |
| Razer Blade 14 2015 | |
| Gigabyte P37X | |
| 1366x768 High (DX11) AF:16x (ordenar por valor) | |
| Razer Blade Pro 17 inch 2015 | |
| Lenovo Y70 DU004HUS | |
| SCHENKER M505 | |
| Razer Blade 14 2015 | |
| Gigabyte P37X | |
| 1366x768 Medium (DX10) AF:4x (ordenar por valor) | |
| SCHENKER M505 | |
| 1024x768 Low (DX10) AF:4x (ordenar por valor) | |
| SCHENKER M505 | |
| Thief | |
| 1920x1080 Very High Preset AA:FXAA & High SS AF:8x (ordenar por valor) | |
| Razer Blade Pro 17 inch 2015 | |
| Lenovo Y70 DU004HUS | |
| SCHENKER M505 | |
| Razer Blade 14 2015 | |
| Gigabyte P37X | |
| 1366x768 High Preset AA:FXAA & Low SS AF:4x (ordenar por valor) | |
| Razer Blade Pro 17 inch 2015 | |
| Lenovo Y70 DU004HUS | |
| SCHENKER M505 | |
| Razer Blade 14 2015 | |
| Gigabyte P37X | |
| 1366x768 Normal Preset AA:FX (ordenar por valor) | |
| SCHENKER M505 | |
| 1024x768 Very Low Preset (ordenar por valor) | |
| SCHENKER M505 | |
| Middle-earth: Shadow of Mordor | |
| 1920x1080 Ultra Preset (HD Package) (ordenar por valor) | |
| Razer Blade Pro 17 inch 2015 | |
| SCHENKER M505 | |
| Razer Blade 14 2015 | |
| Gigabyte P37X | |
| 1920x1080 High Preset (ordenar por valor) | |
| Razer Blade Pro 17 inch 2015 | |
| SCHENKER M505 | |
| Razer Blade 14 2015 | |
| Gigabyte P37X | |
| 1344x756 Medium Preset (ordenar por valor) | |
| SCHENKER M505 | |
| 1280x720 Lowest Preset (ordenar por valor) | |
| SCHENKER M505 | |
| Ryse: Son of Rome | |
| 1920x1080 Very High Texture Res. + High Graphics Quality (Motion Blur & Temporal AA On, Rest Off/Disabled) AF:8x (ordenar por valor) | |
| Razer Blade Pro 17 inch 2015 | |
| SCHENKER M505 | |
| Razer Blade 14 2015 | |
| Gigabyte P37X | |
| 1920x1080 High Texture Res. + High Graphics Quality (Rest Off/Disabled) AF:8x (ordenar por valor) | |
| Razer Blade Pro 17 inch 2015 | |
| Lenovo Y70 DU004HUS | |
| SCHENKER M505 | |
| Razer Blade 14 2015 | |
| Gigabyte P37X | |
| 1366x768 Medium Texture Res. + Normal Graphics Quality (Rest Off/Disabled) AF:4x (ordenar por valor) | |
| Lenovo Y70 DU004HUS | |
| SCHENKER M505 | |
| 1024x768 Low Texture Res. + Low Graphics Quality (Rest Off/Disabled) AF:2x (ordenar por valor) | |
| SCHENKER M505 | |
| F1 2014 | |
| 1920x1080 Ultra Preset AA:4x MS (ordenar por valor) | |
| Razer Blade Pro 17 inch 2015 | |
| Lenovo Y70 DU004HUS | |
| SCHENKER M505 | |
| Razer Blade 14 2015 | |
| Gigabyte P37X | |
| 1920x1080 High Preset (ordenar por valor) | |
| Razer Blade Pro 17 inch 2015 | |
| Lenovo Y70 DU004HUS | |
| SCHENKER M505 | |
| Razer Blade 14 2015 | |
| Gigabyte P37X | |
| 1366x768 Medium Preset (ordenar por valor) | |
| SCHENKER M505 | |
| 1024x768 Ultra Low Preset (ordenar por valor) | |
| SCHENKER M505 | |
Ruido
| Ocioso |
| 30.6 / 30.7 / 32.6 dB(A) |
| Carga |
| 38.8 / 46.2 dB(A) |
 | ||
30 dB silencioso 40 dB(A) audible 50 dB(A) ruidosamente alto |
||
min: | ||
(±) The maximum temperature on the upper side is 44.6 °C / 112 F, compared to the average of 40.4 °C / 105 F, ranging from 21.2 to 68.8 °C for the class Gaming.
(-) The bottom heats up to a maximum of 45.2 °C / 113 F, compared to the average of 43.2 °C / 110 F
(+) In idle usage, the average temperature for the upper side is 23.8 °C / 75 F, compared to the device average of 33.8 °C / 93 F.
(+) The palmrests and touchpad are reaching skin temperature as a maximum (32.4 °C / 90.3 F) and are therefore not hot.
(-) The average temperature of the palmrest area of similar devices was 28.9 °C / 84 F (-3.5 °C / -6.3 F).
| Razer Blade Pro 17 inch 2015 | MSI GS70-2QE16SR51 | Gigabyte P37X | Acer Aspire V Nitro 7-791G-70TW | Aorus X7 Pro | Asus G751JY-T7009H | |
|---|---|---|---|---|---|---|
| Duración de Batería | -30% | 1% | -19% | -26% | -18% | |
| Reader / Idle | 513 | 308 -40% | 332 -35% | 178 -65% | 272 -47% | |
| WiFi v1.3 | 251 | 237 -6% | 204 -19% | |||
| Load | 76 | 61 -20% | 110 45% | 86 13% | 85 12% | |
| WiFi | 211 | 220 |
Pro
Contra
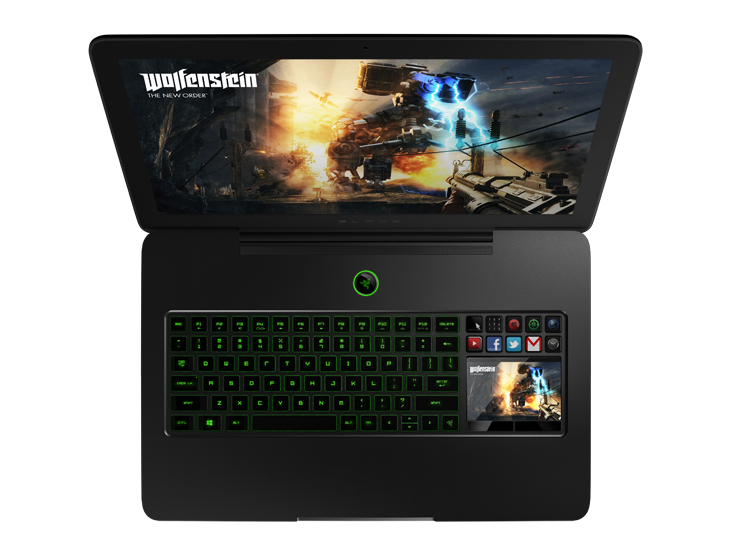
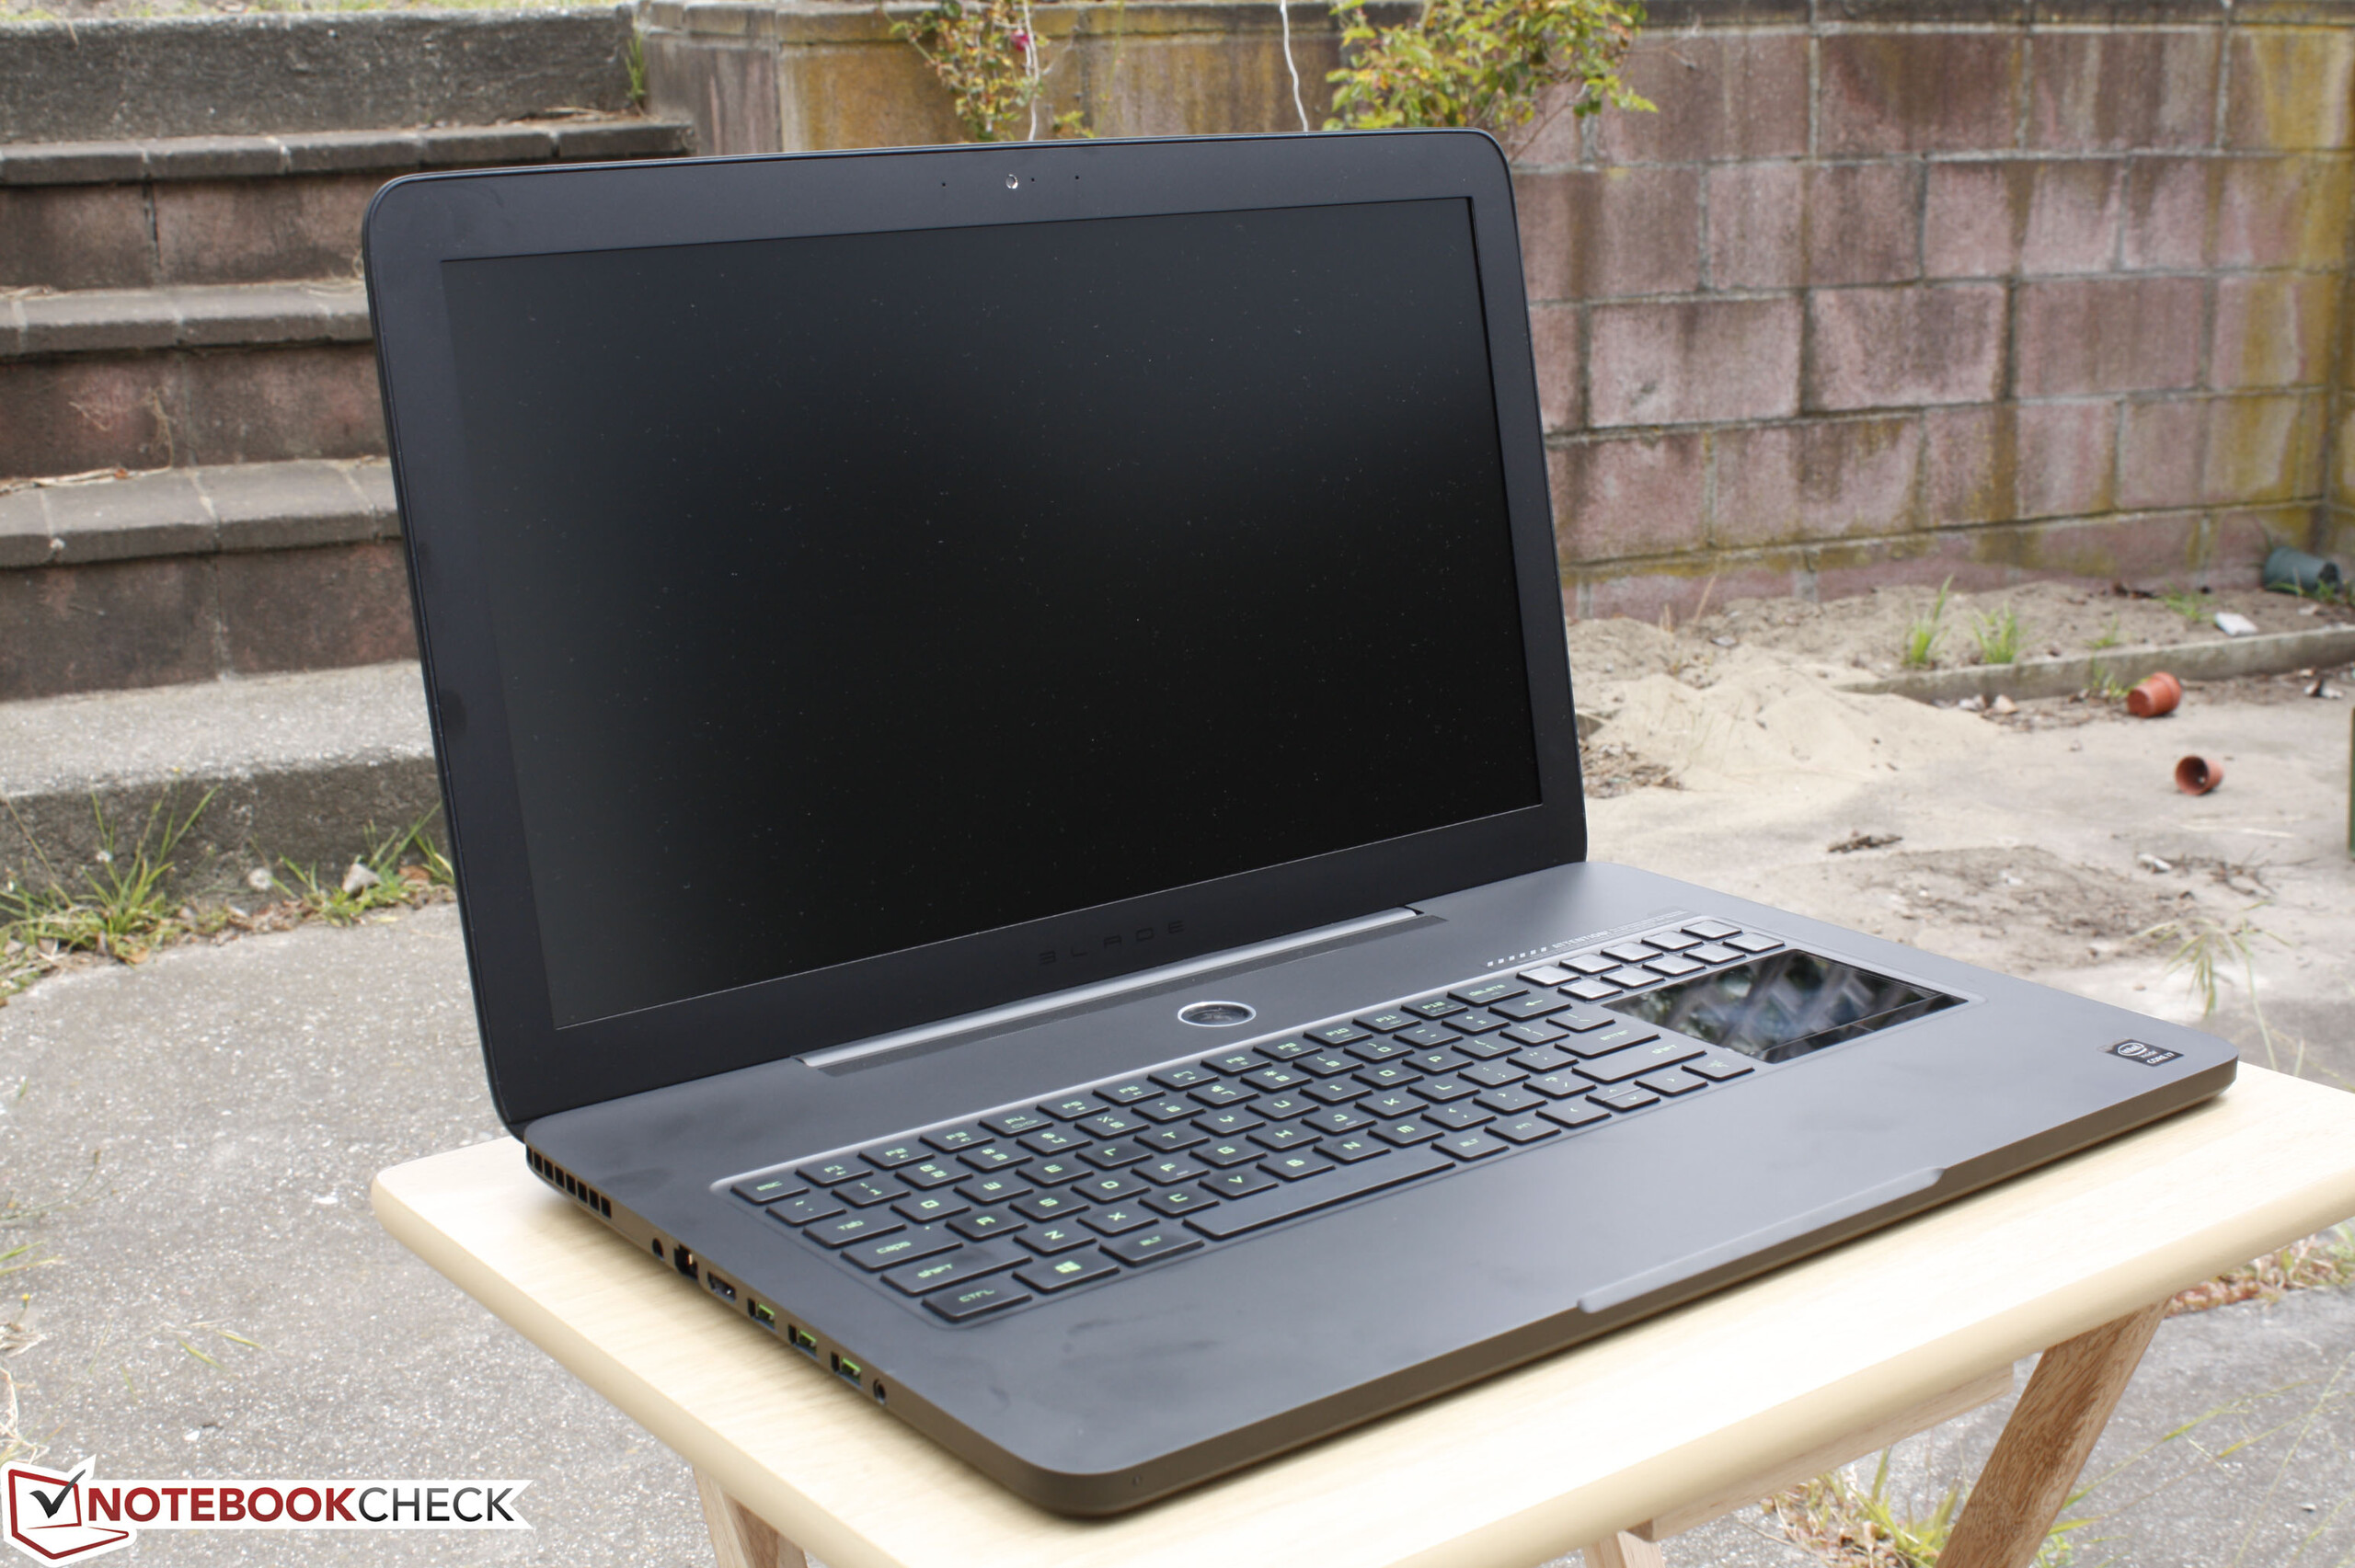
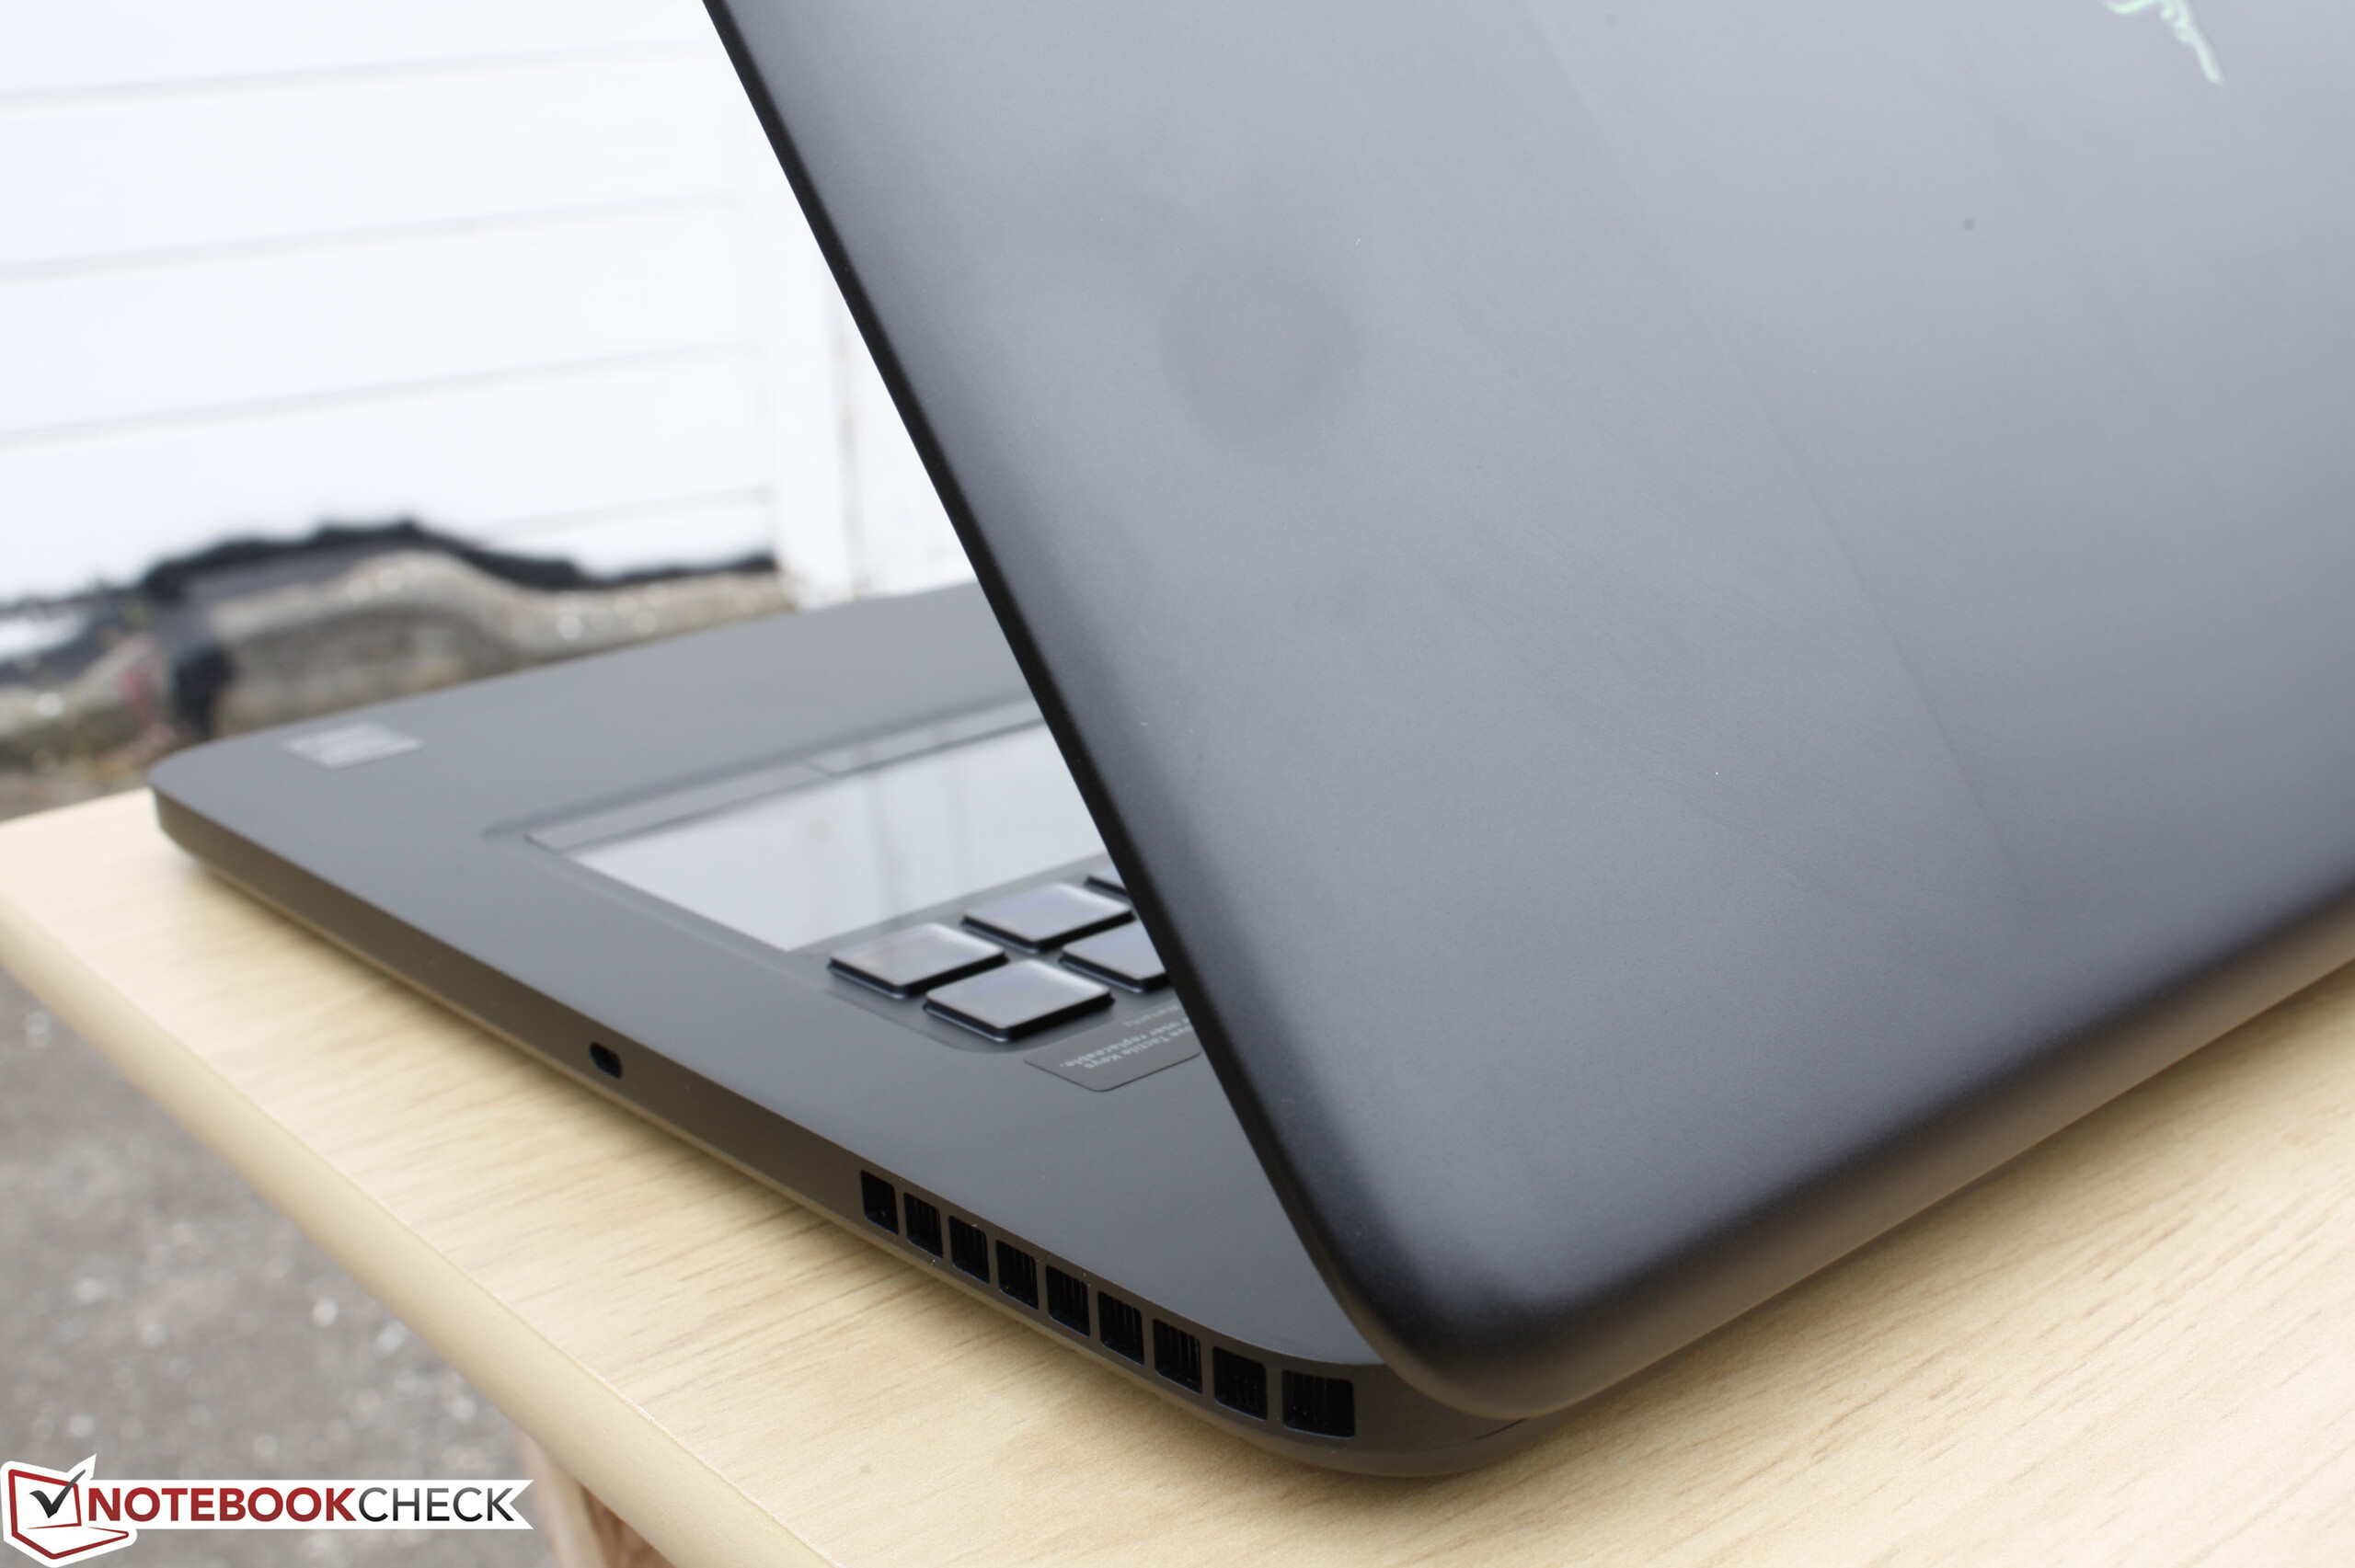
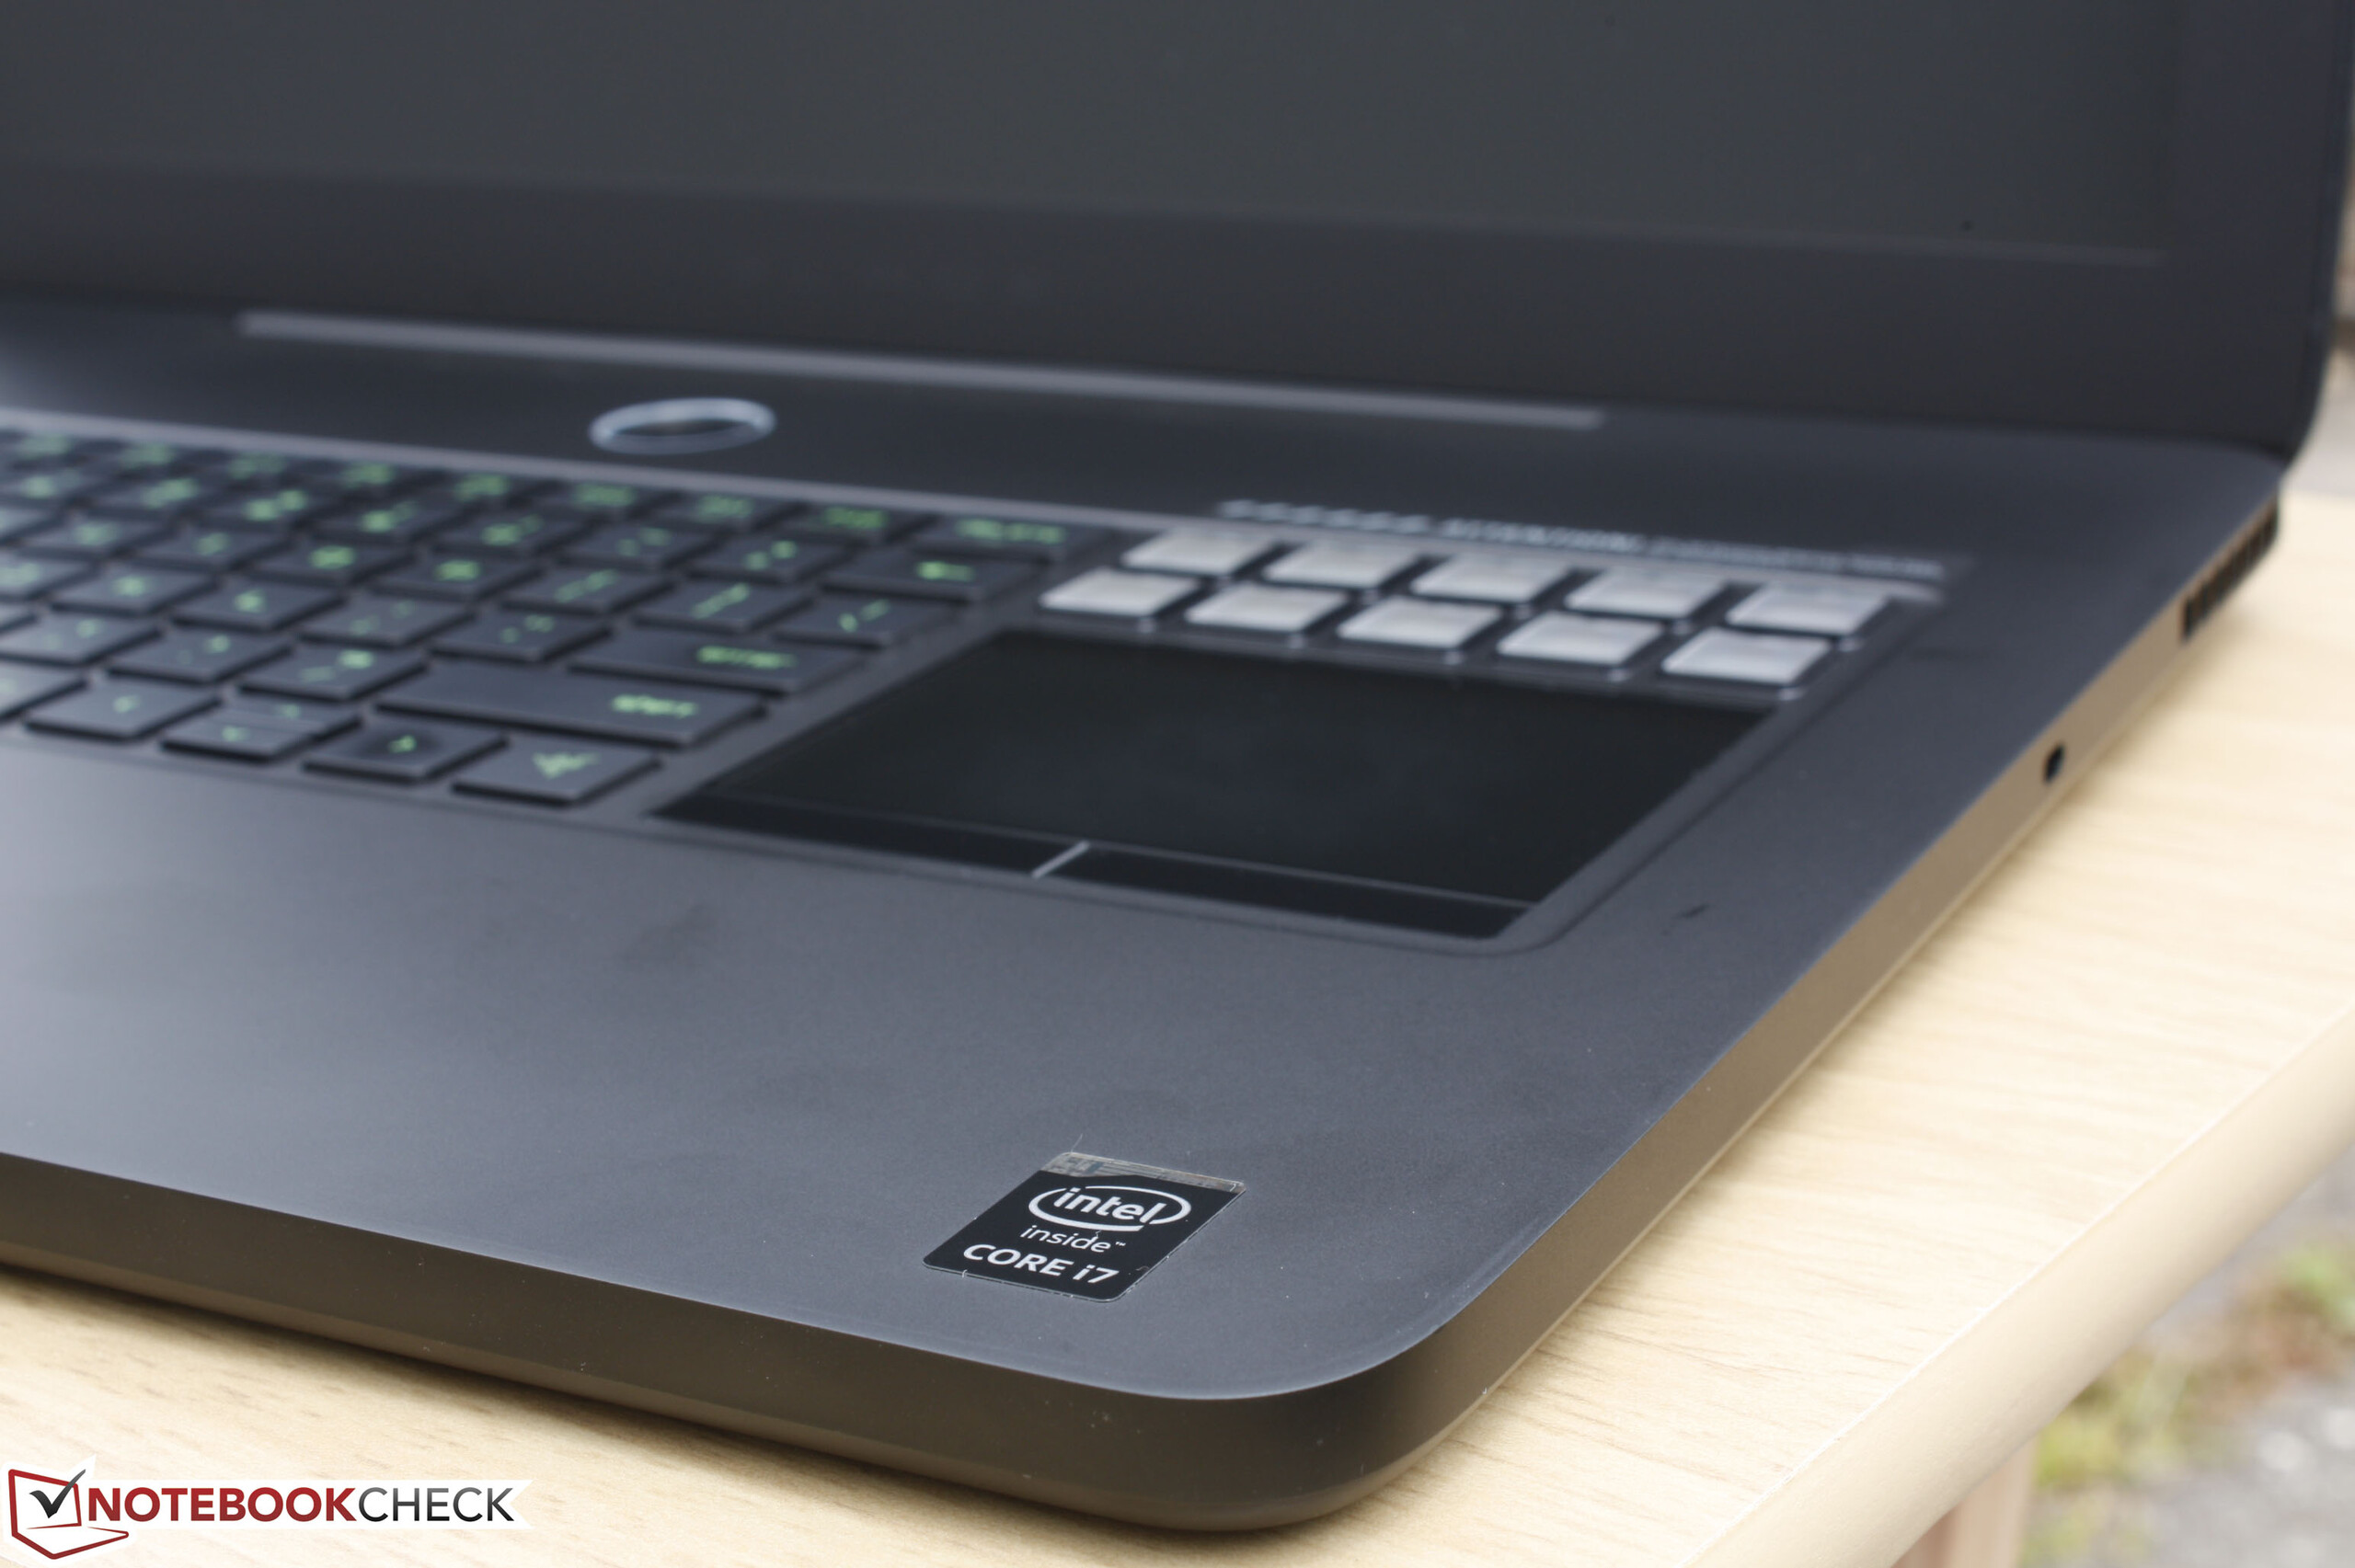
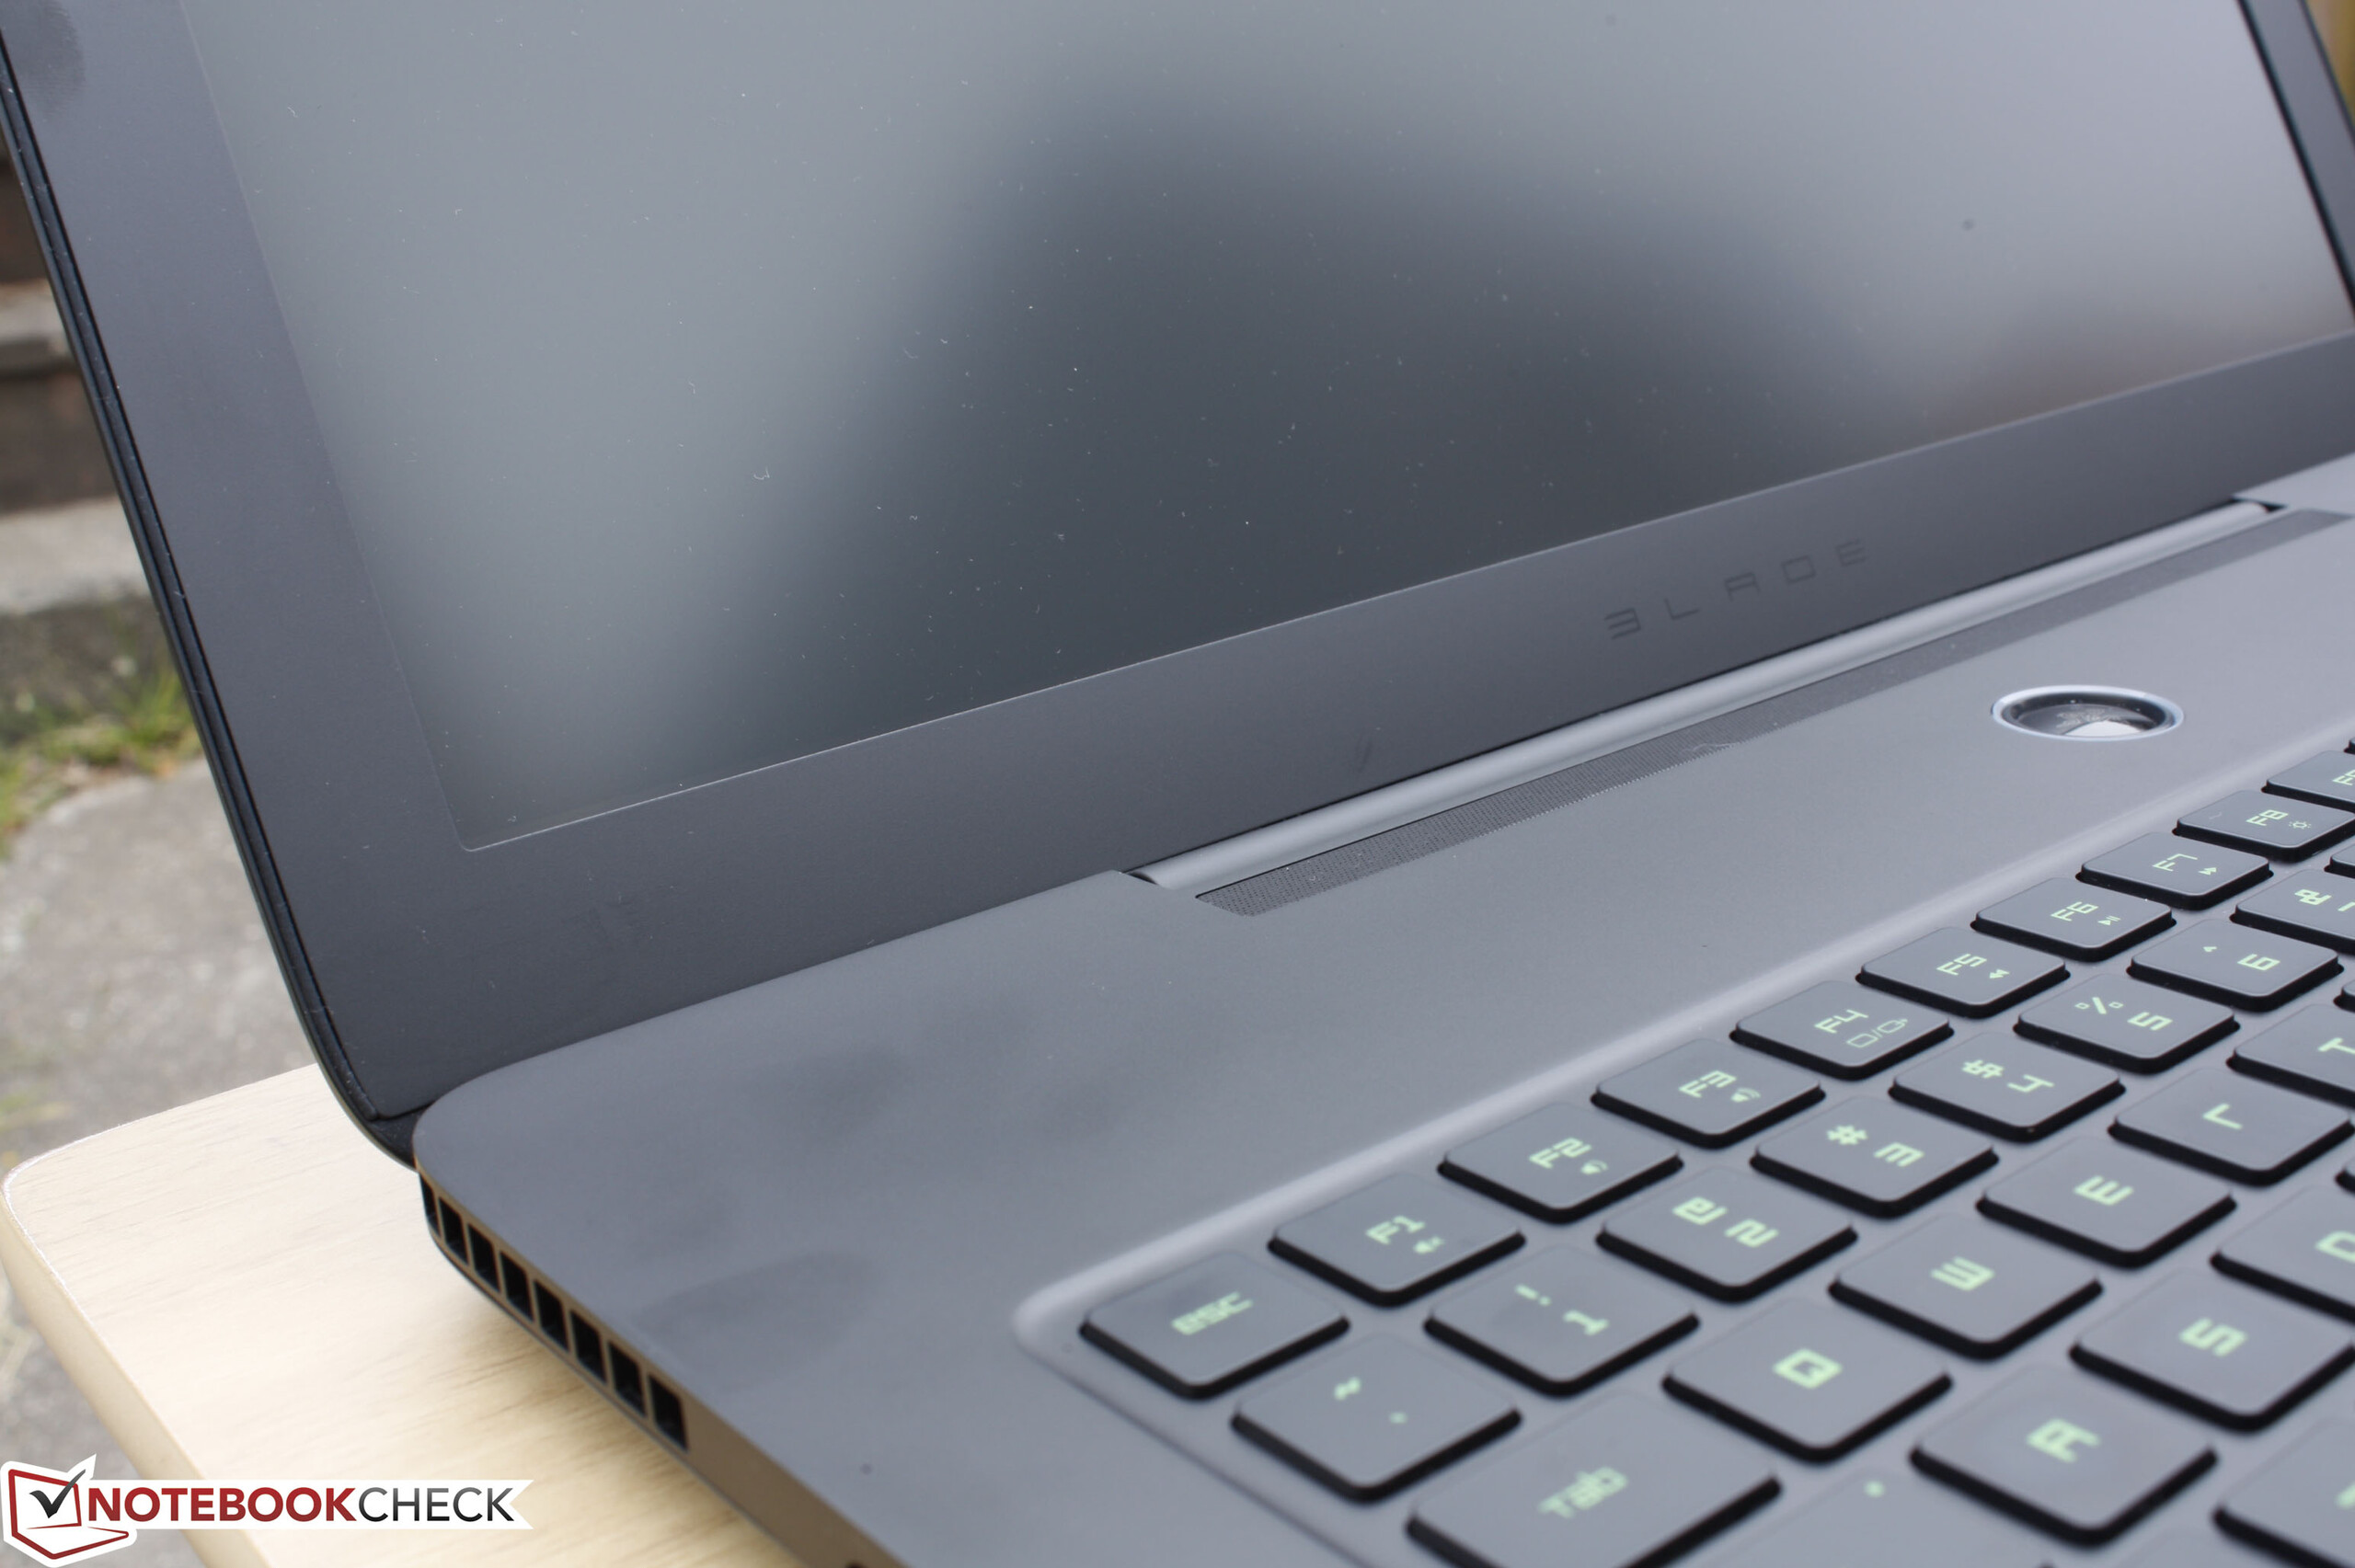
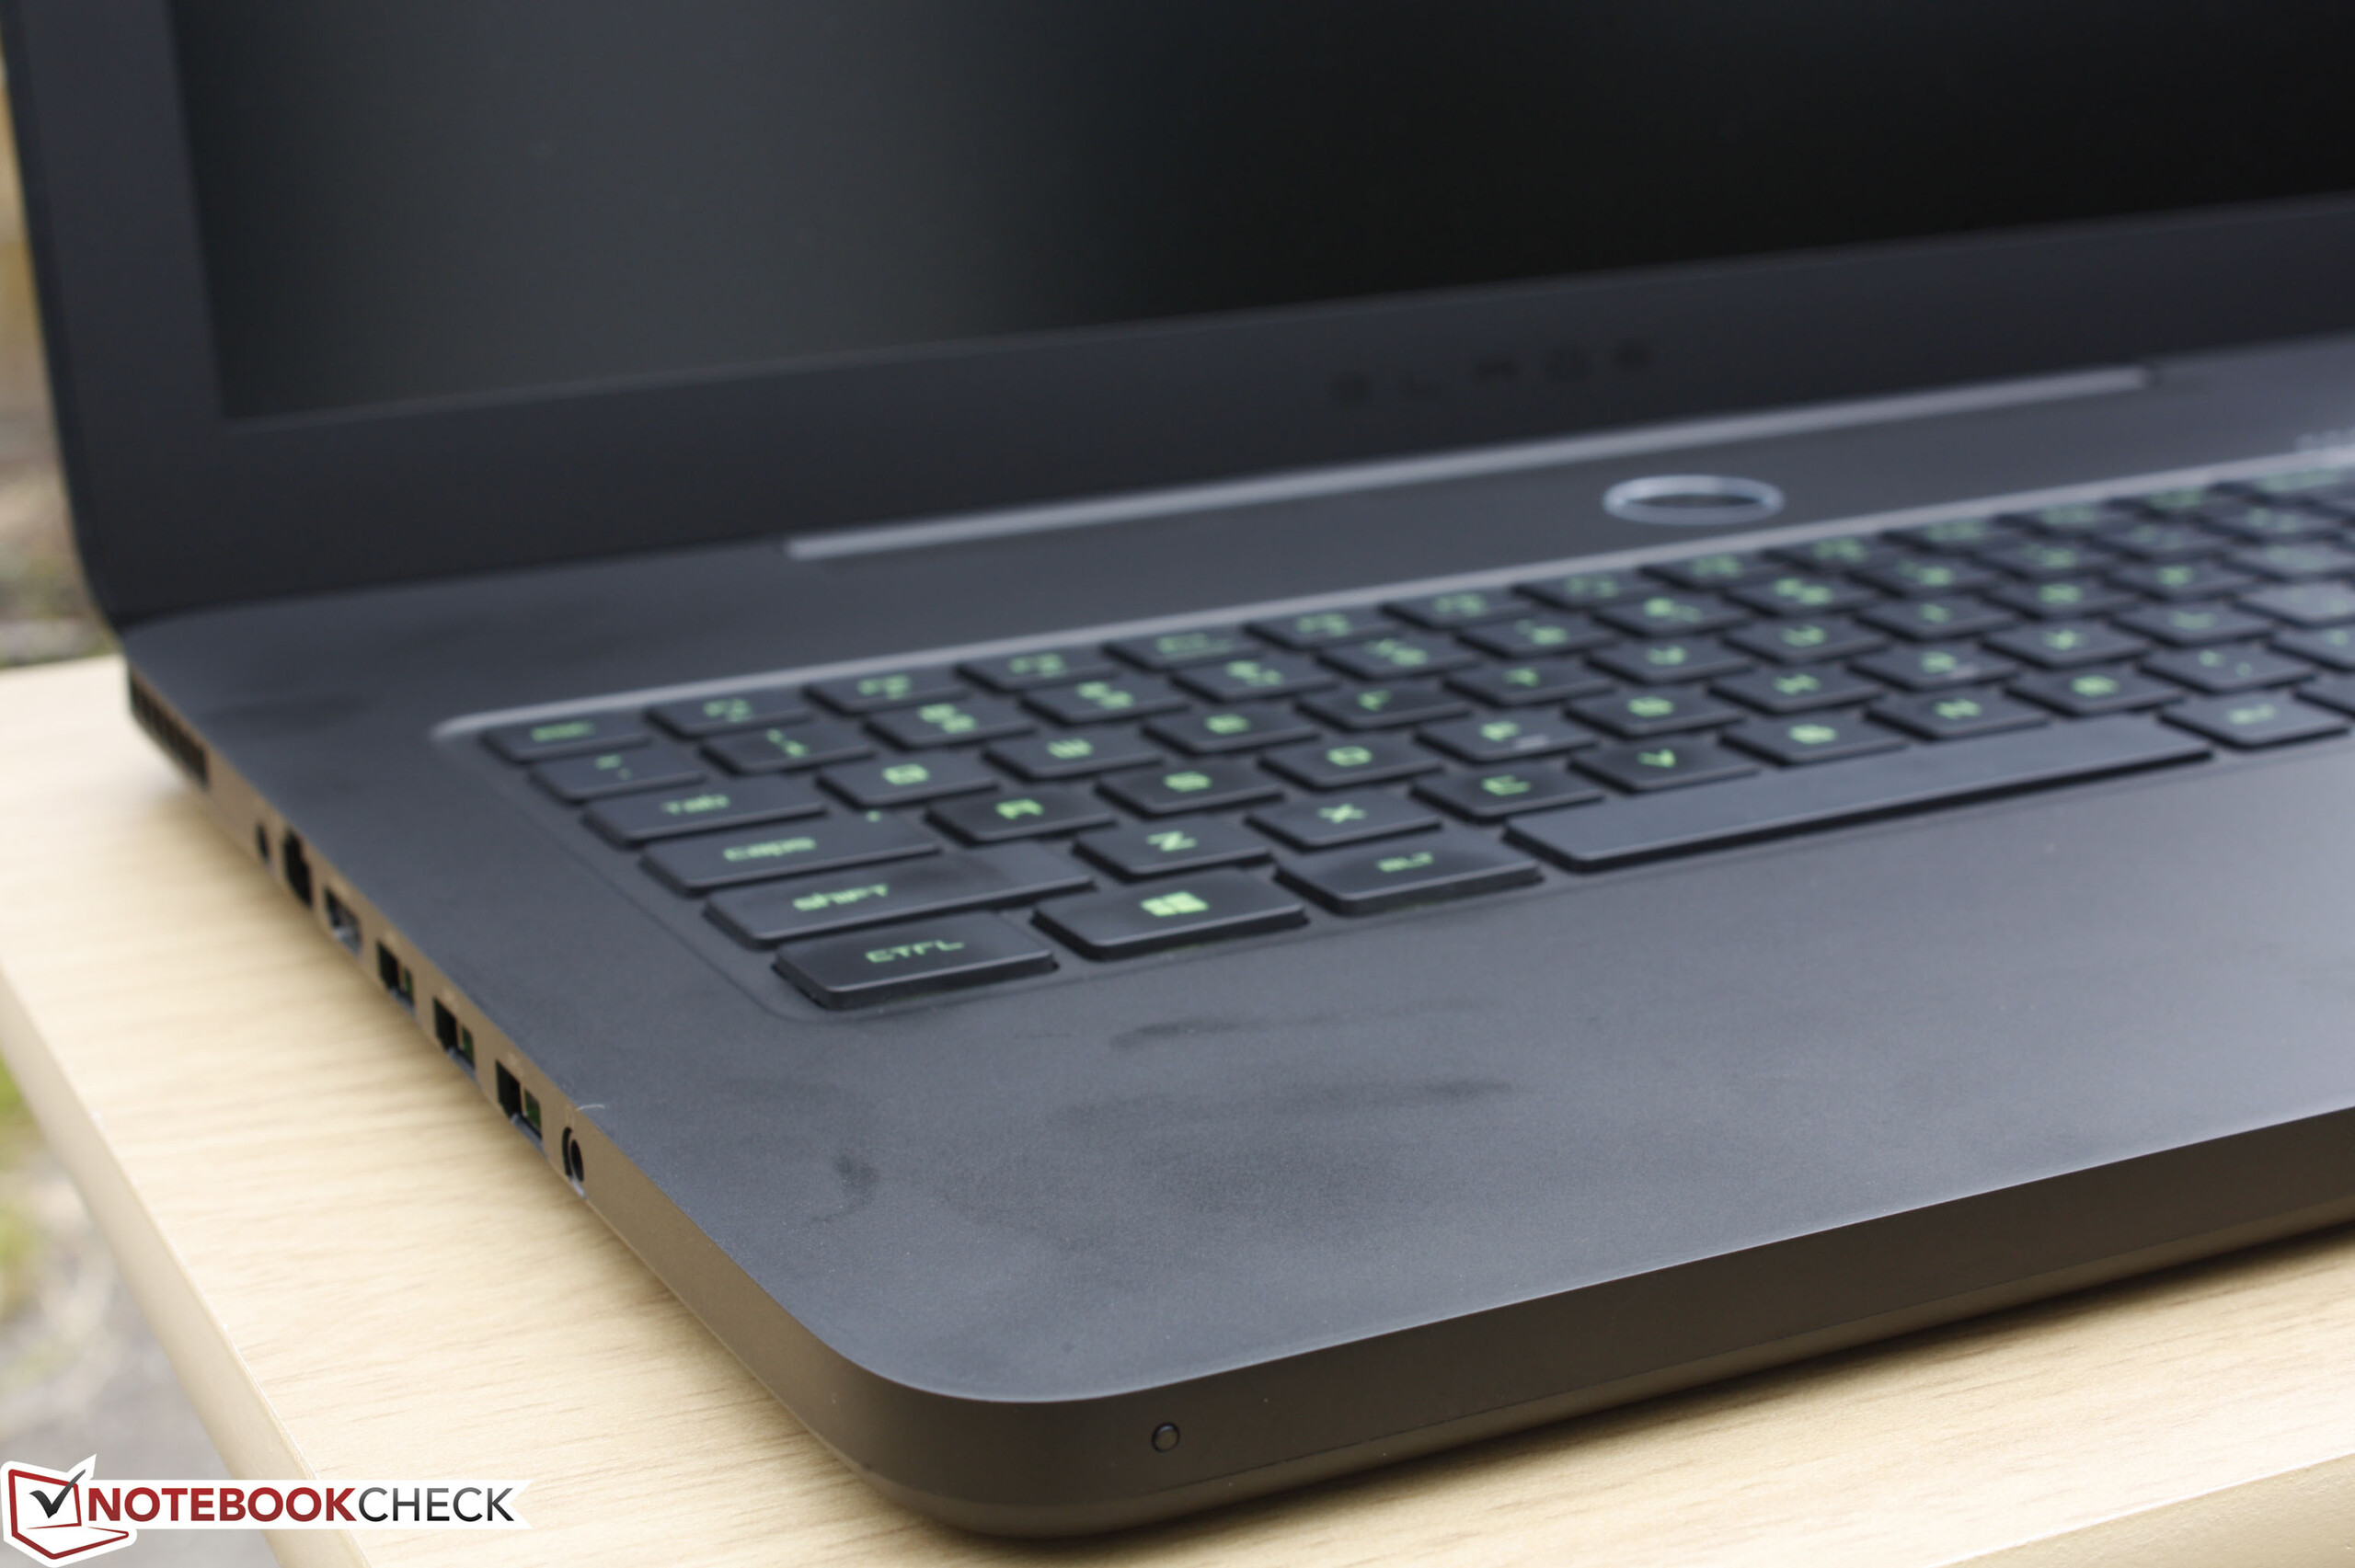
Nos encanta el Razer Blade Pro como concepto. Es un portátil centradísimo en el juego con hardware, estilo y rendimiento. El chasis sigue siendo sorprendentemente excelente a pesar de los años y más rígido que el de la competencia. Mientras tanto, la GPU no se achanta bajo la presión como puede pasar en otros portátiles de juego con problemas térmicos o de energía.
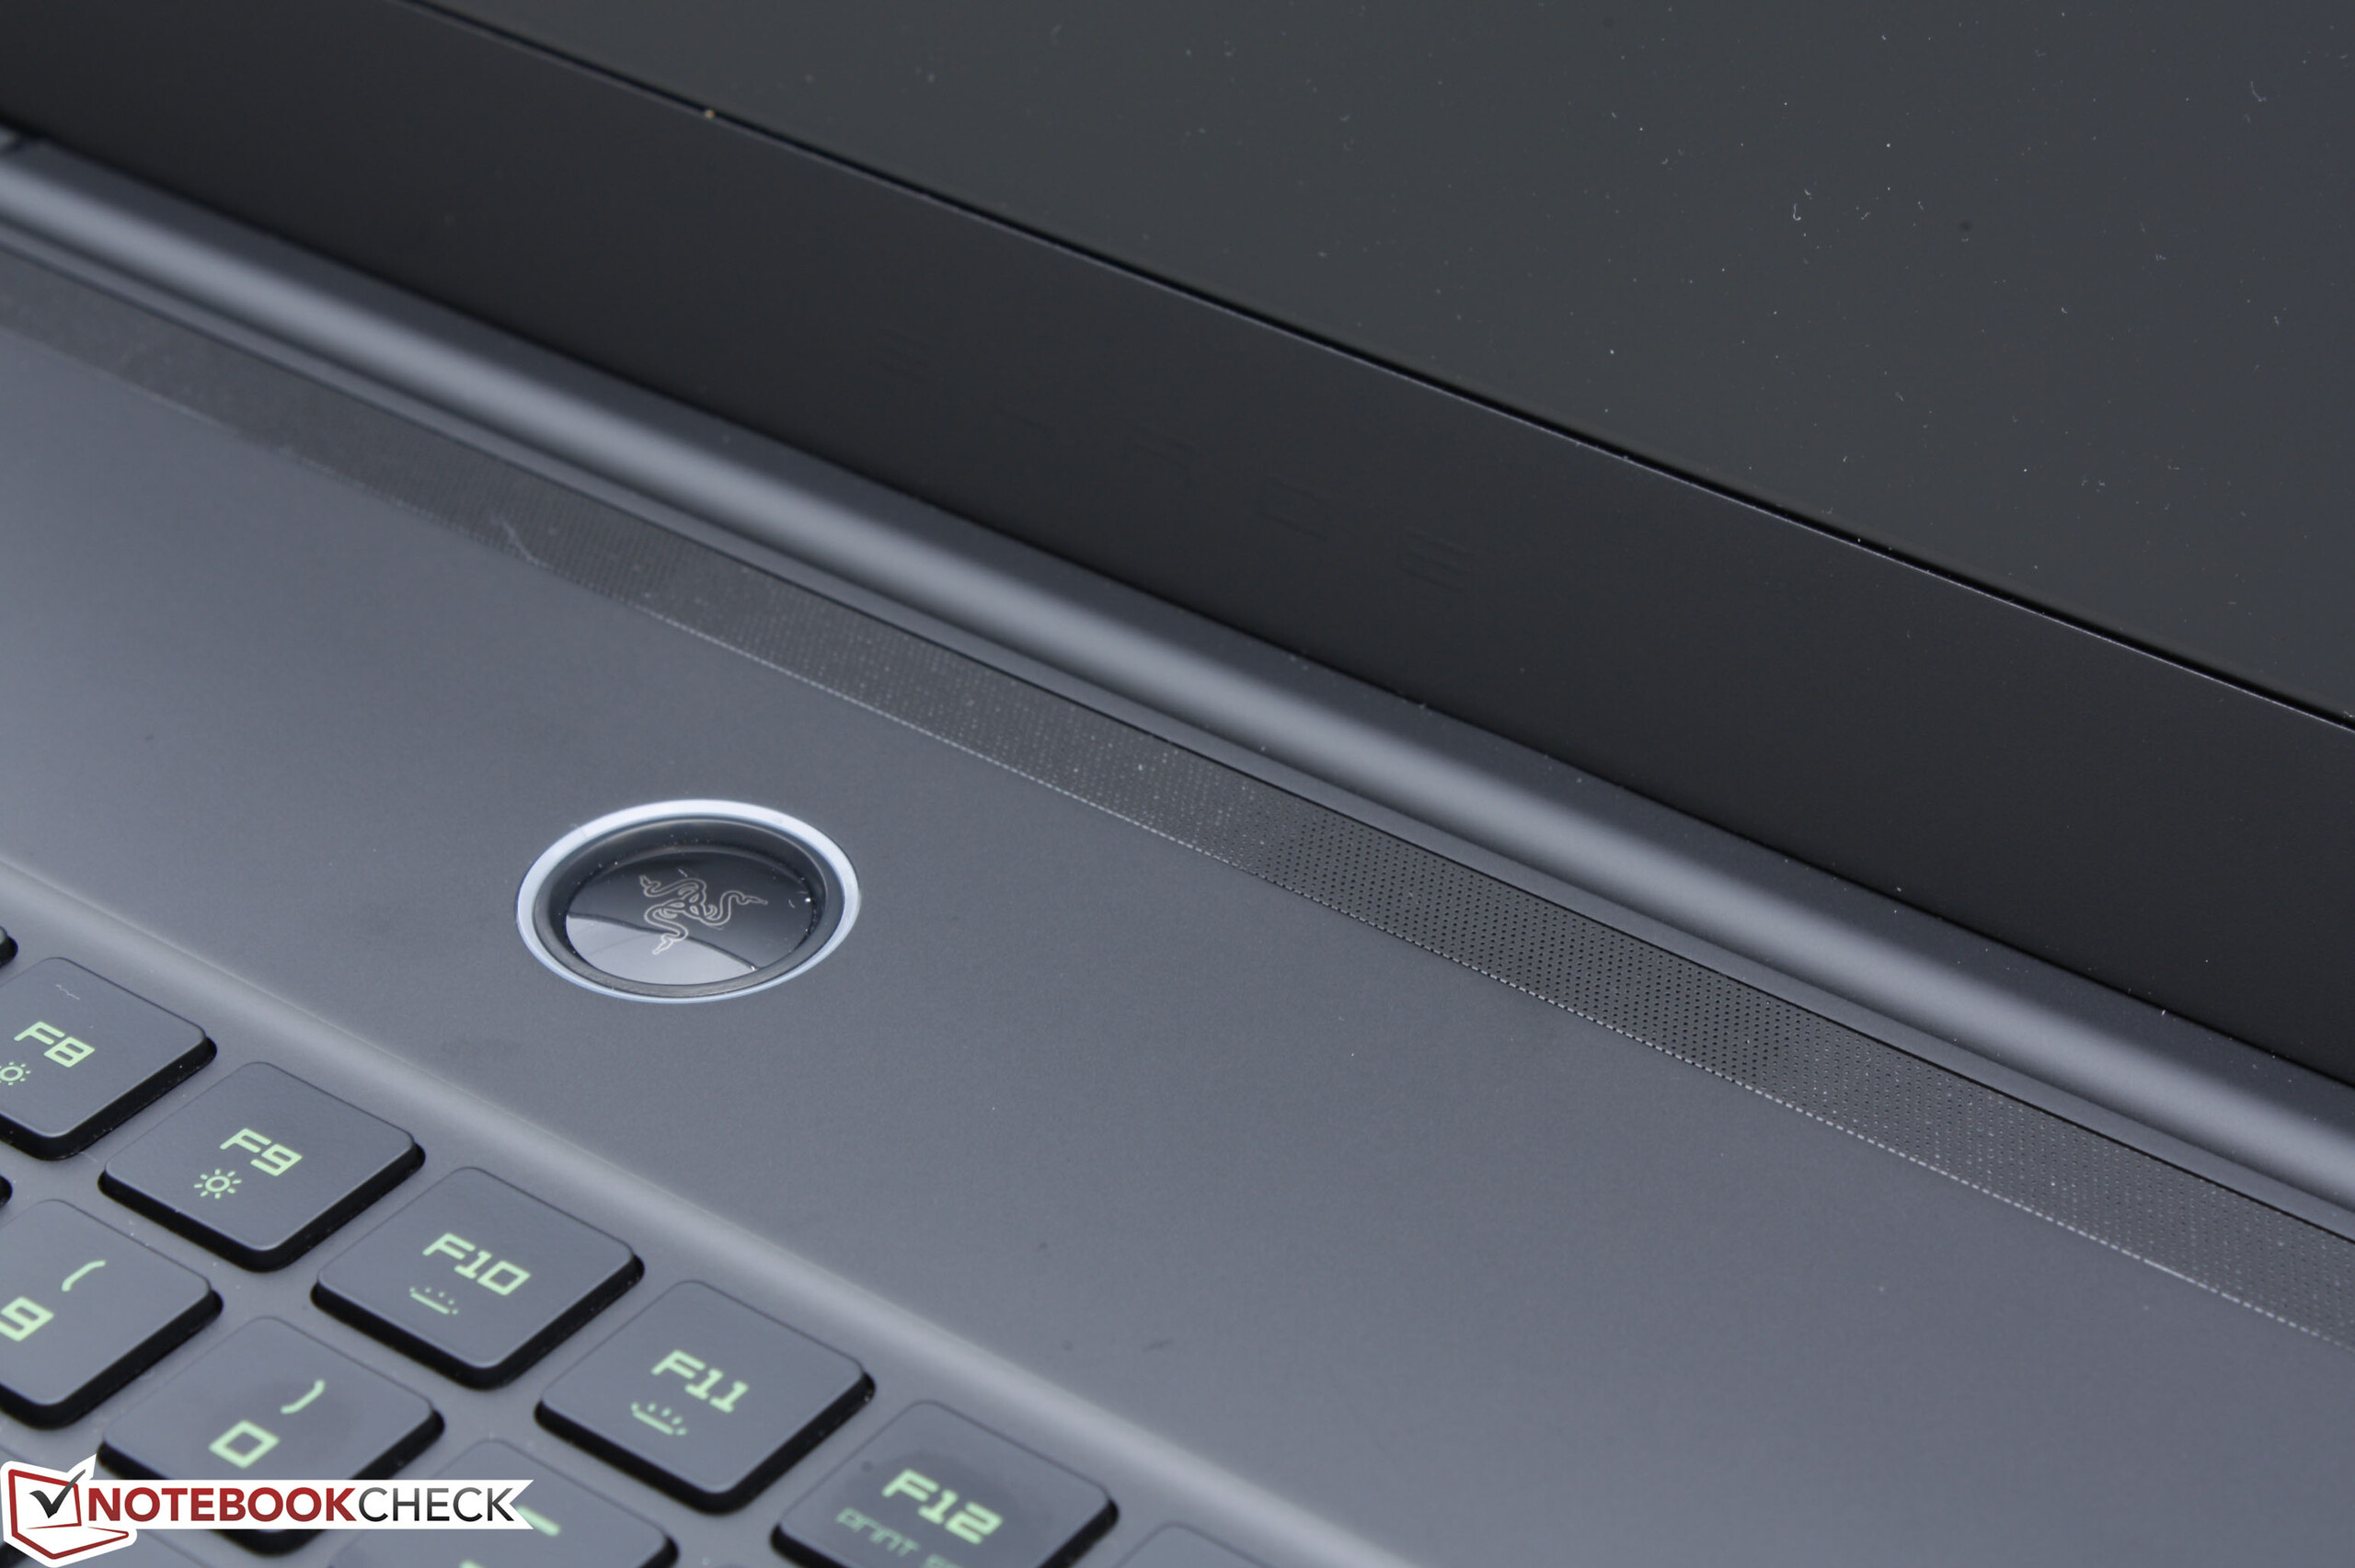
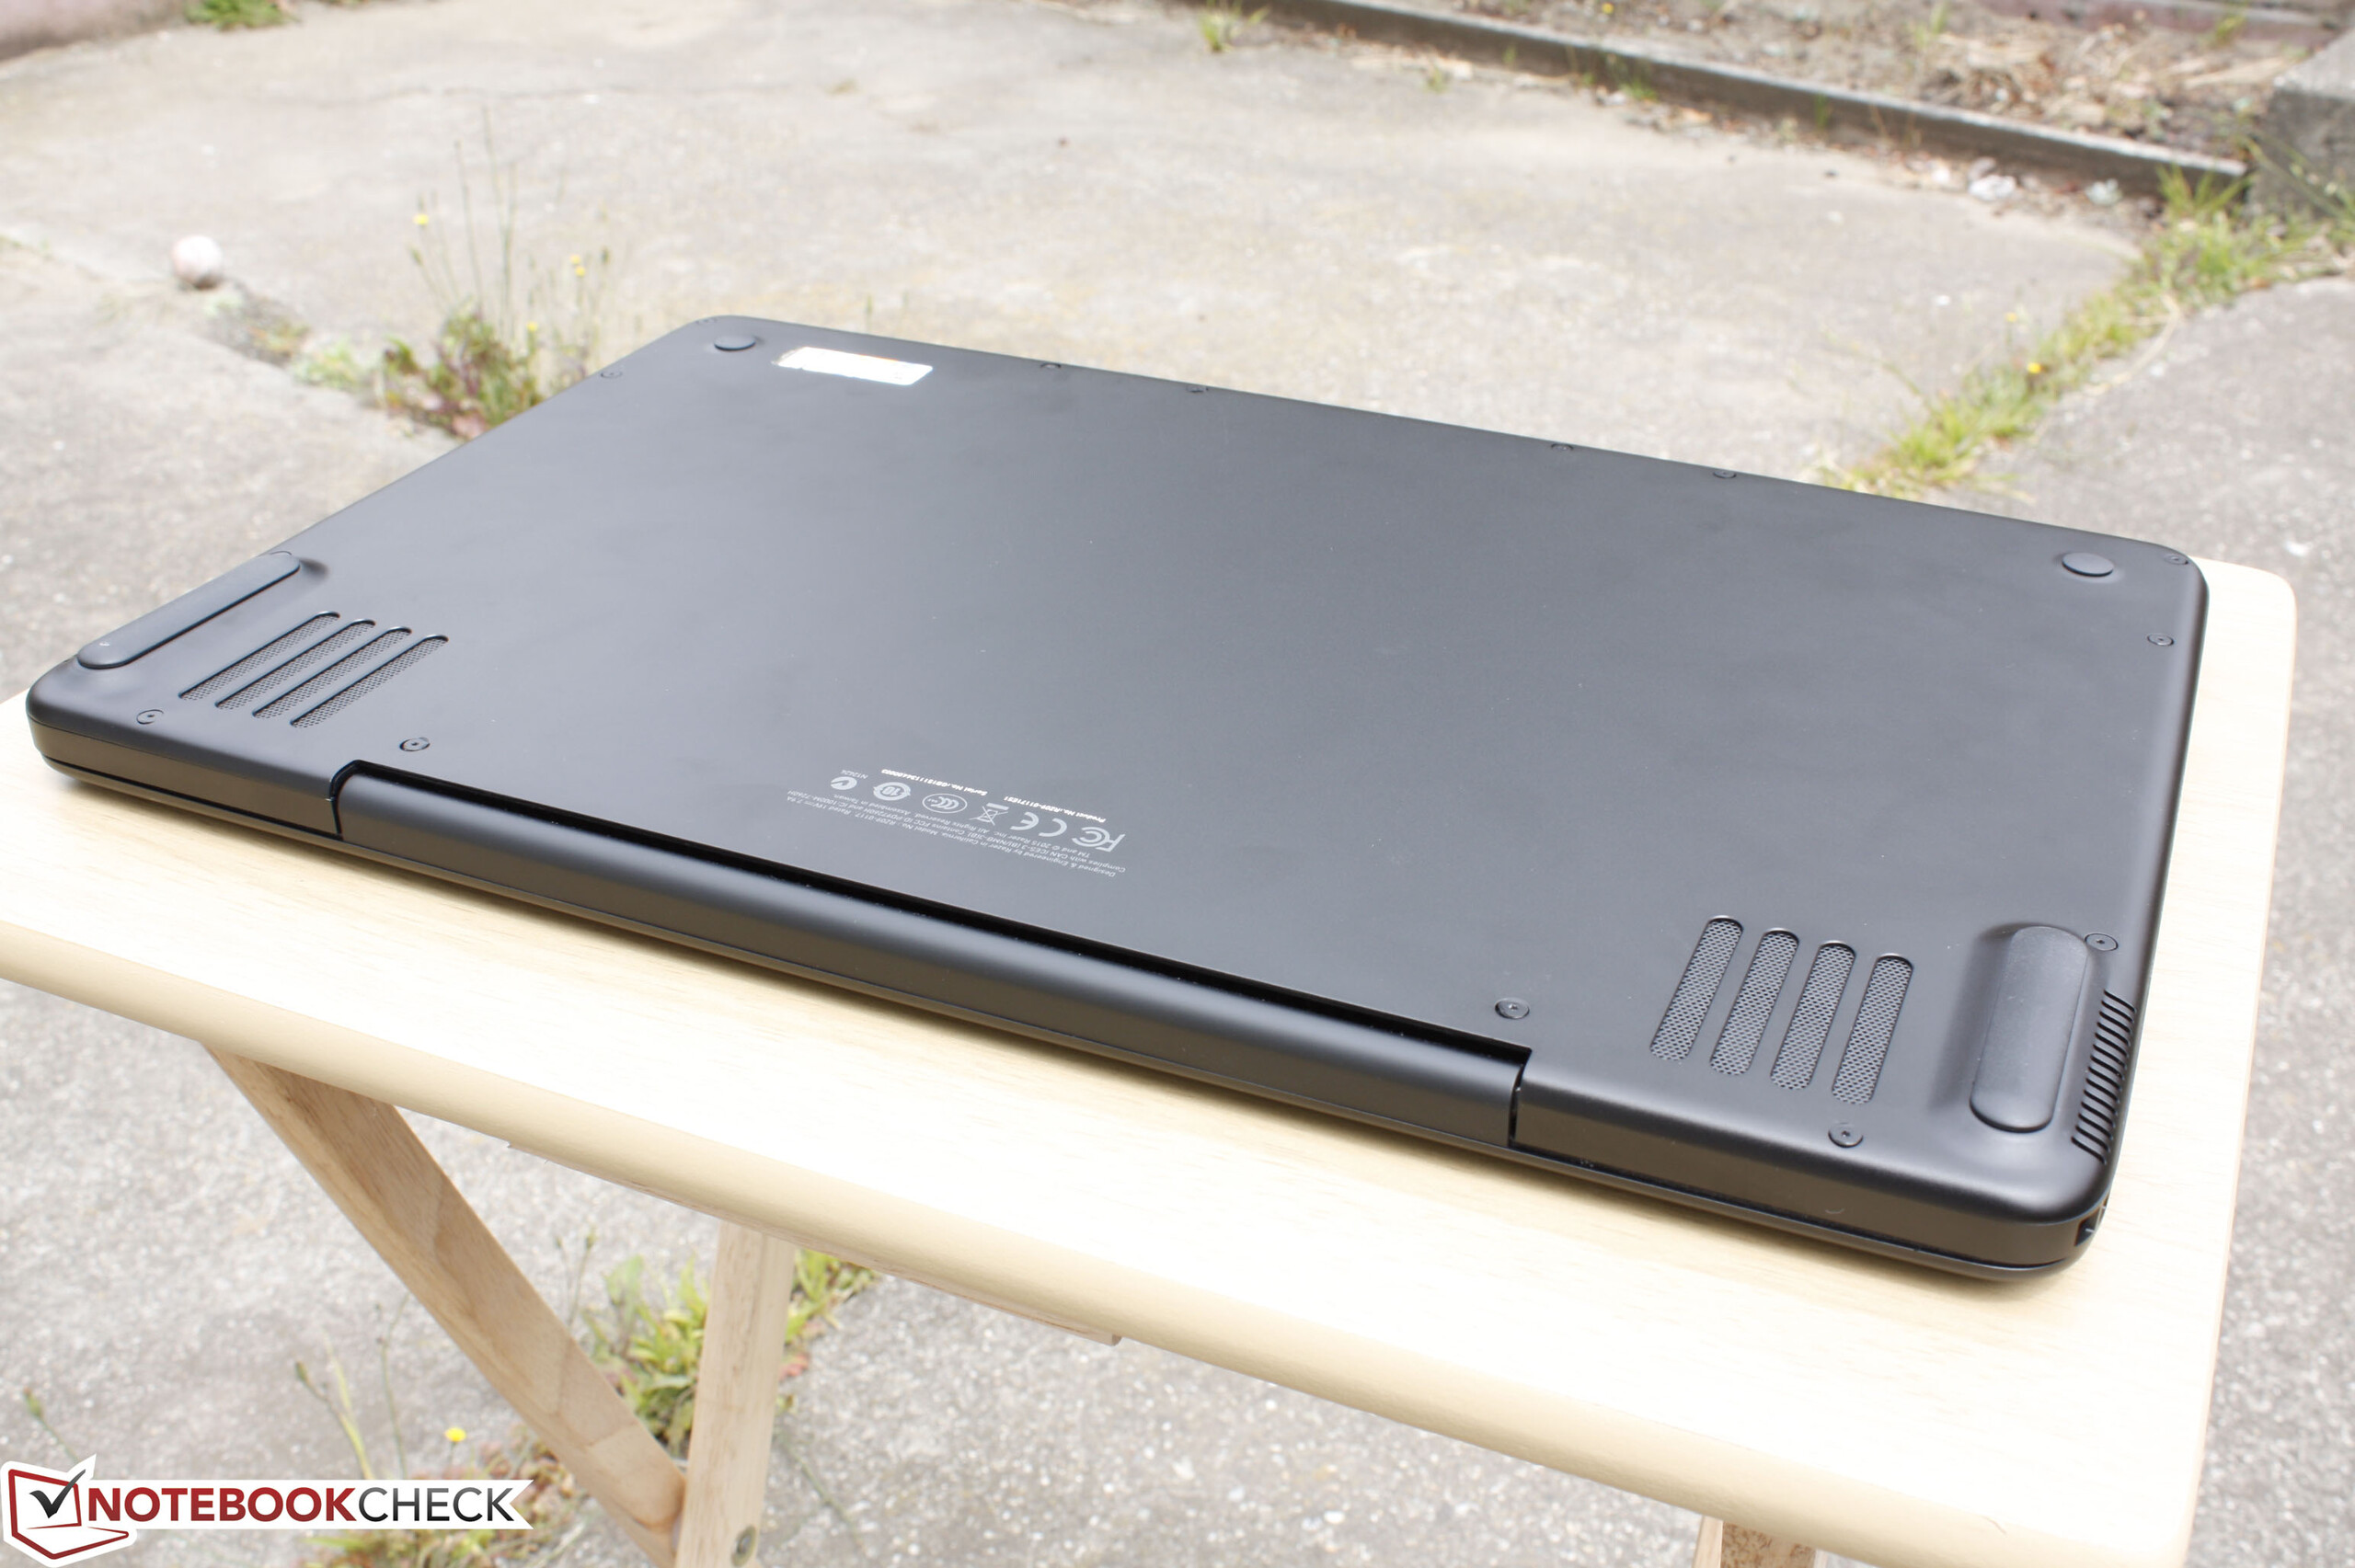
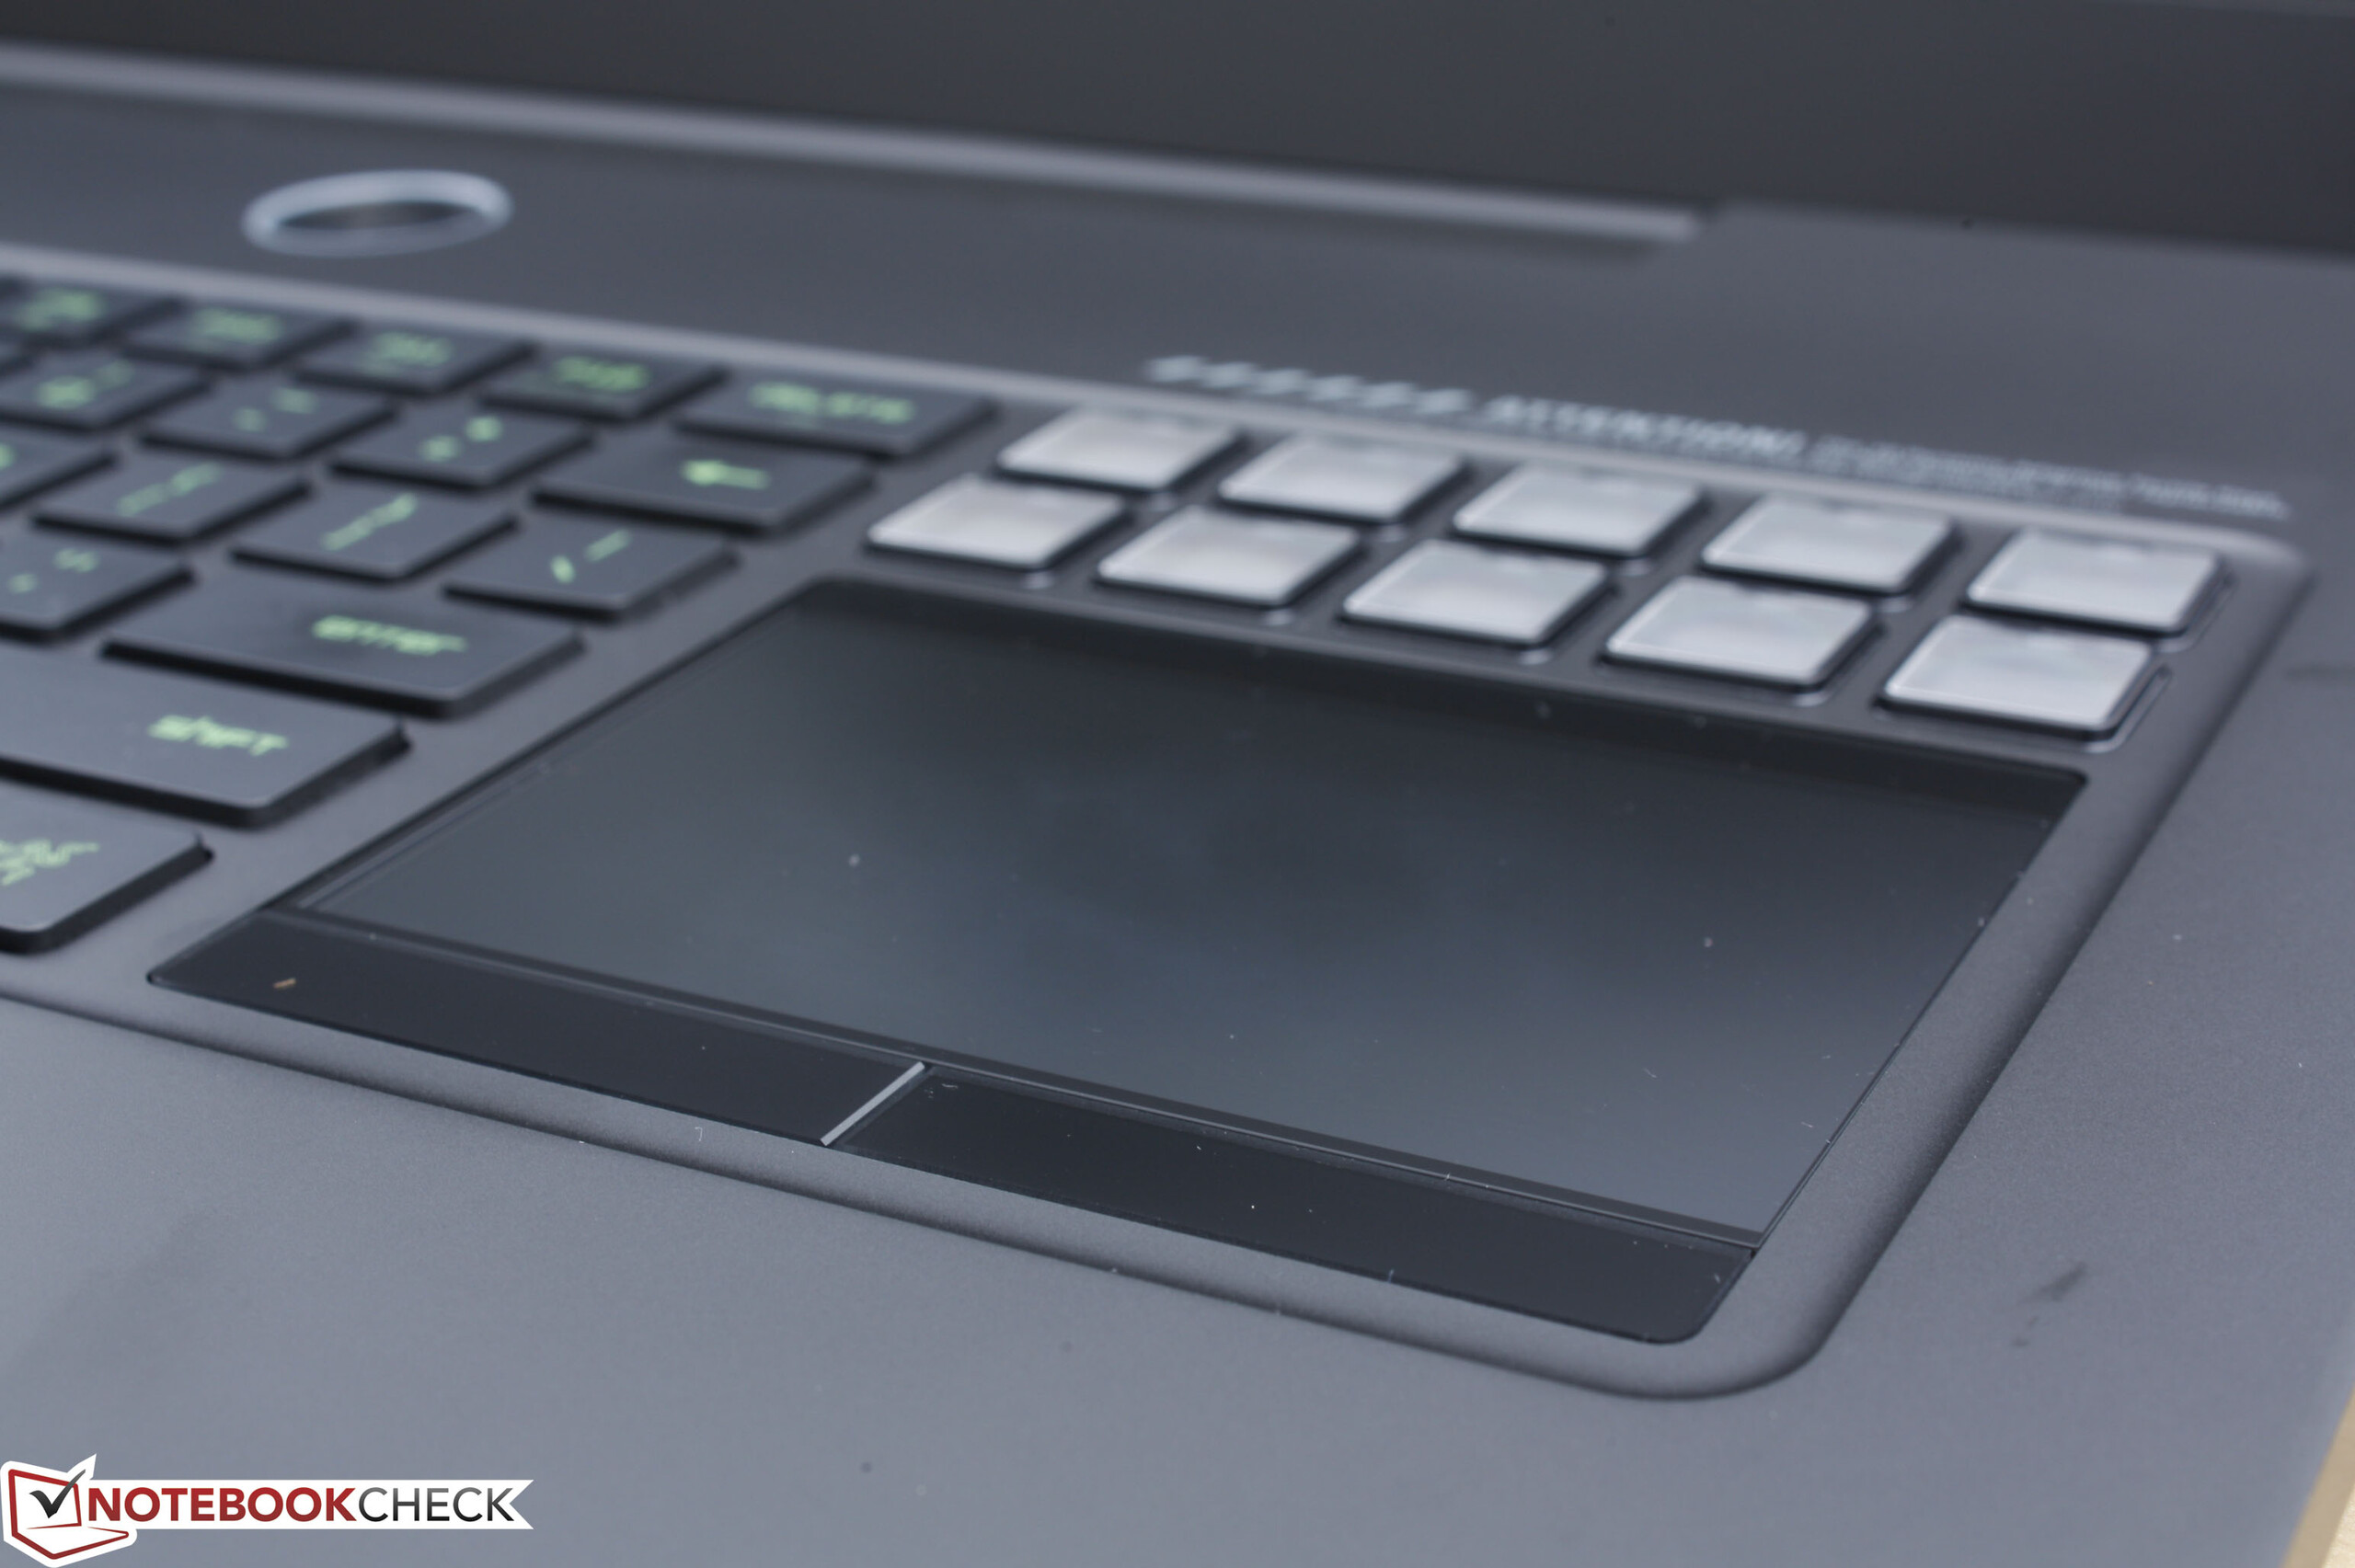
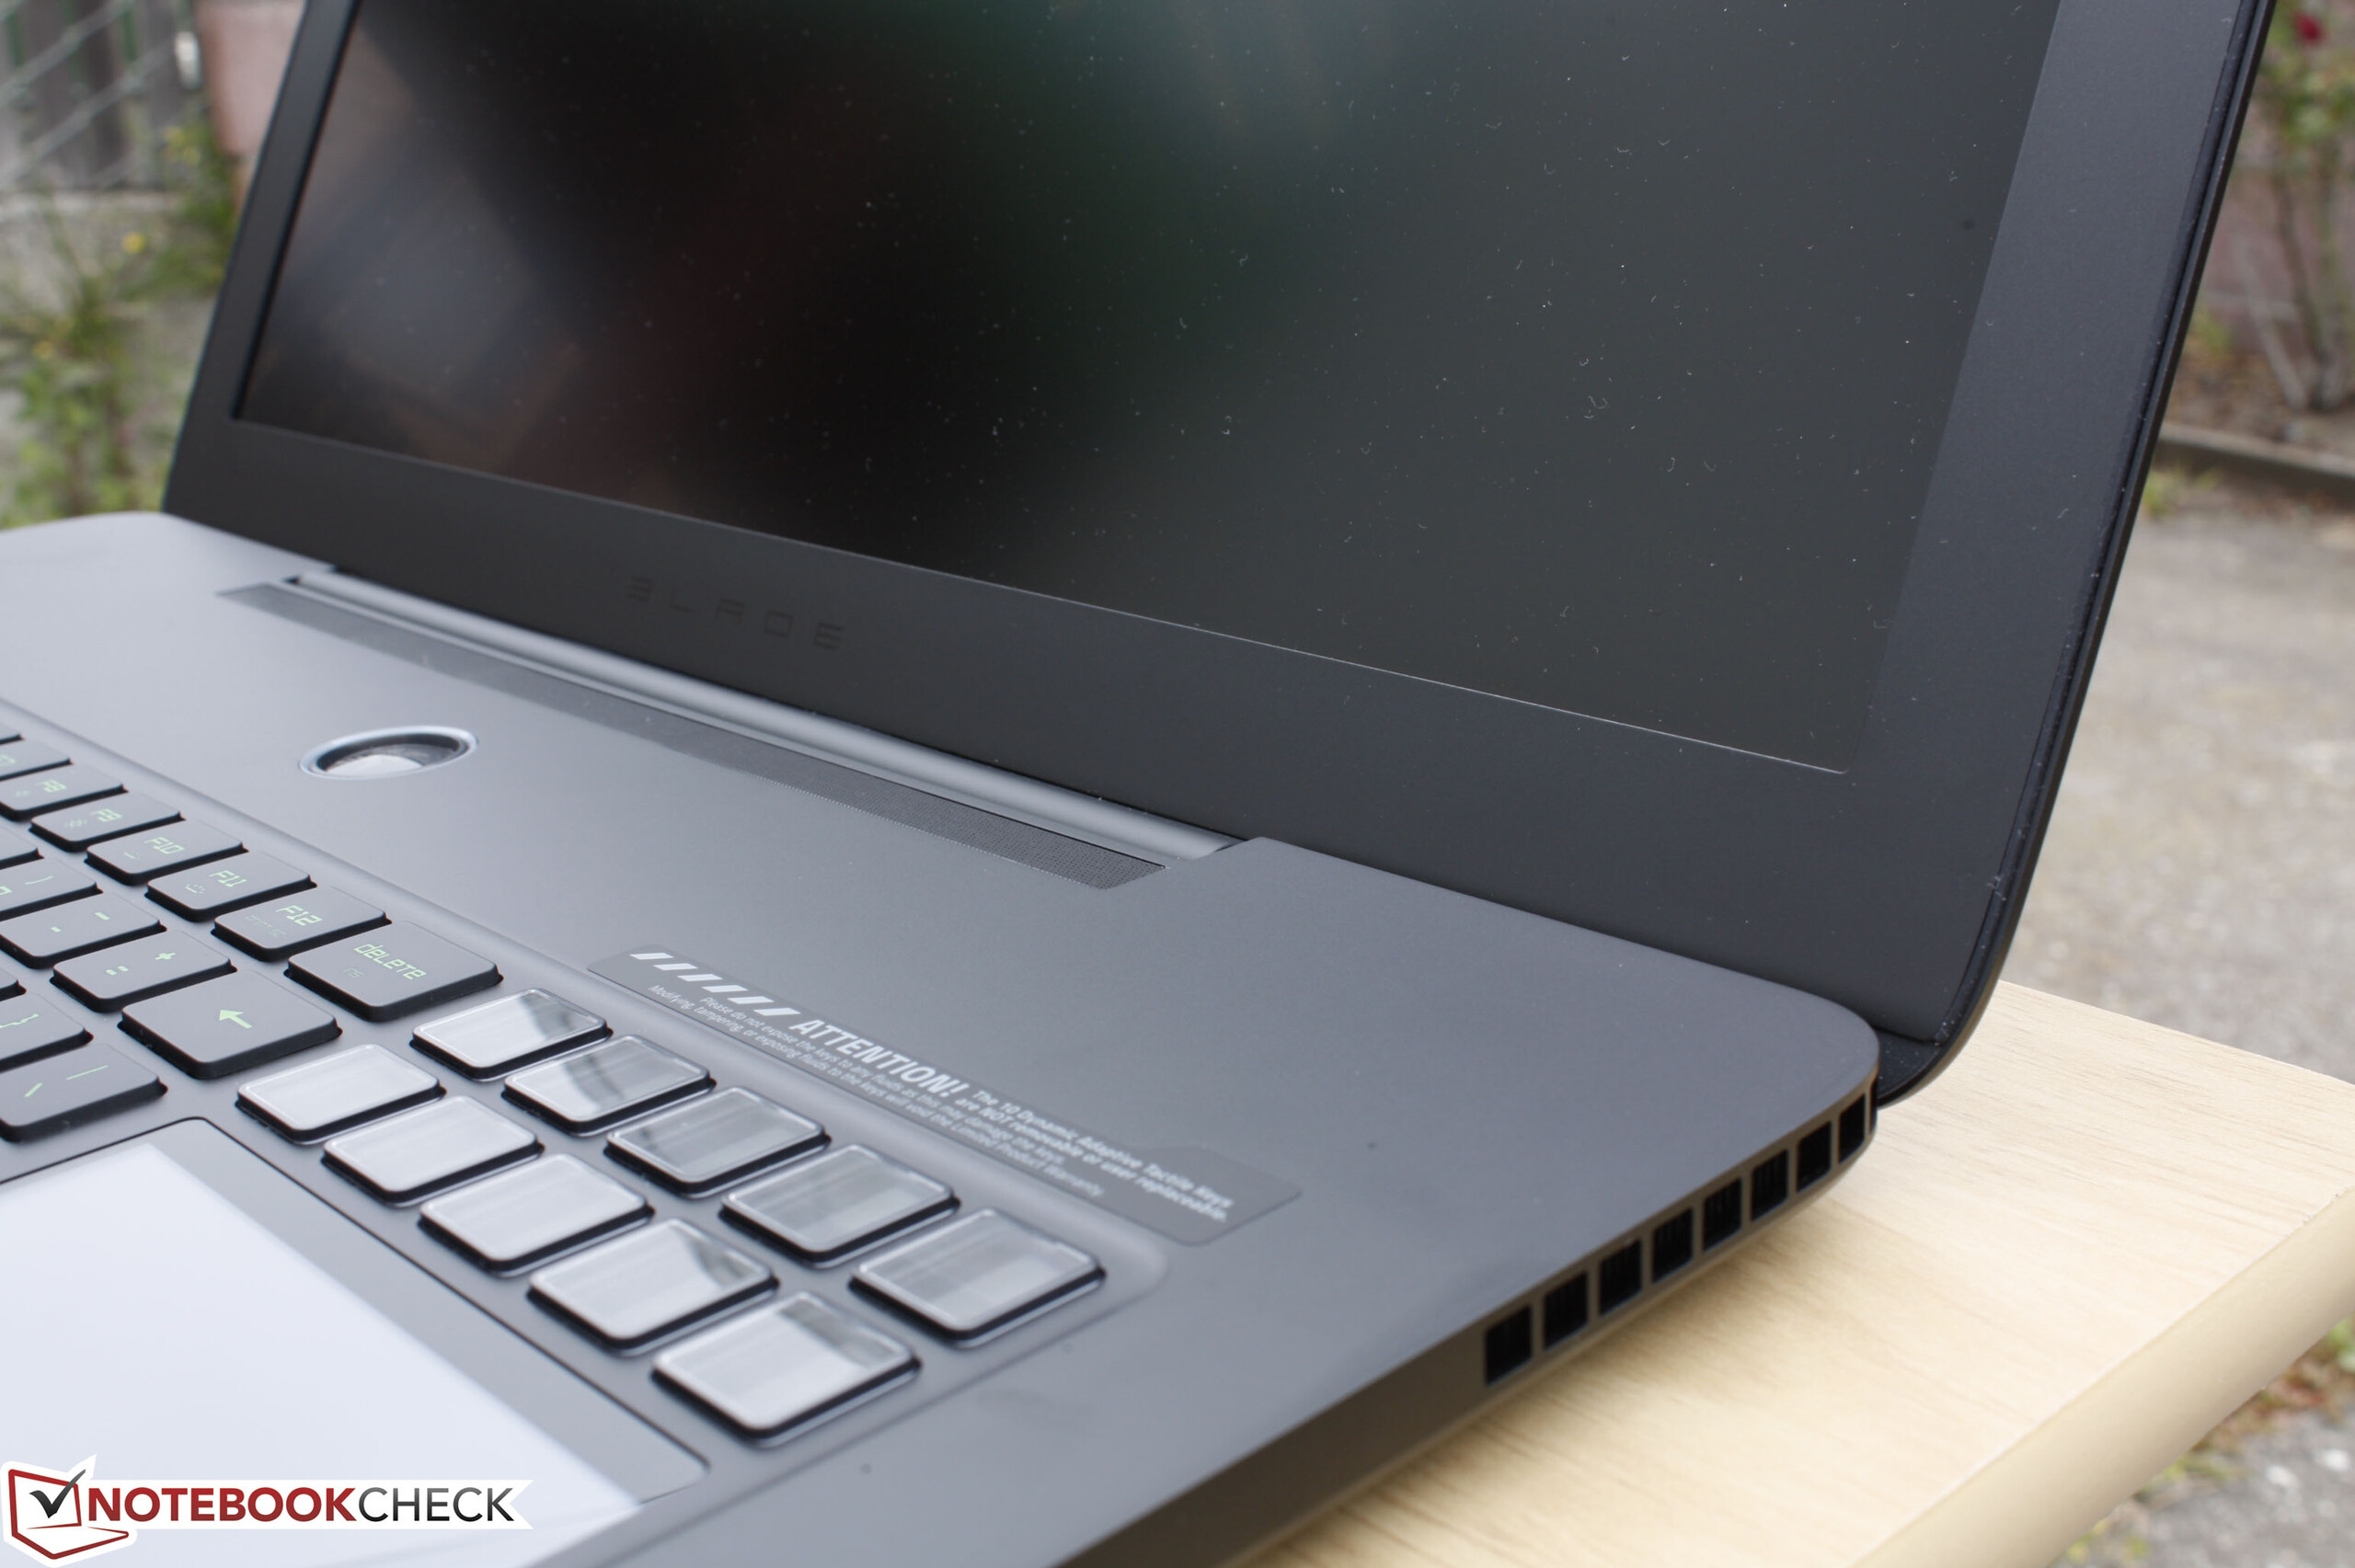
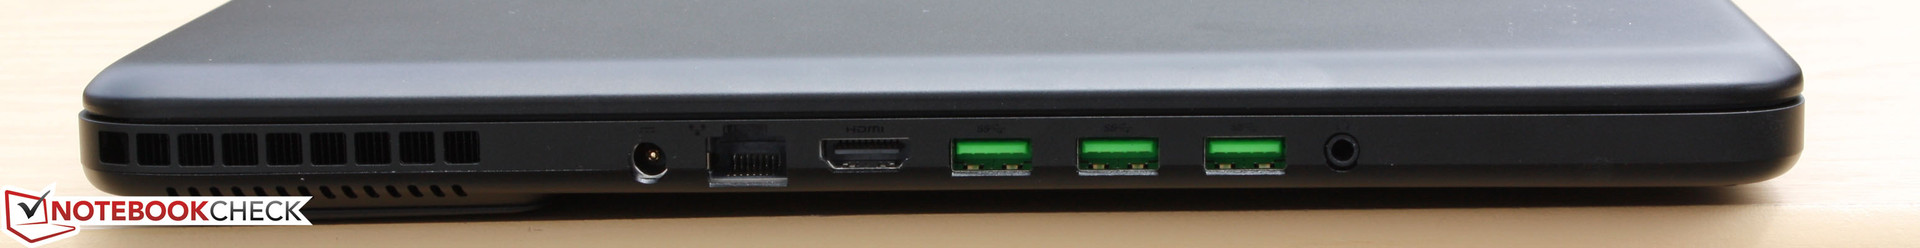
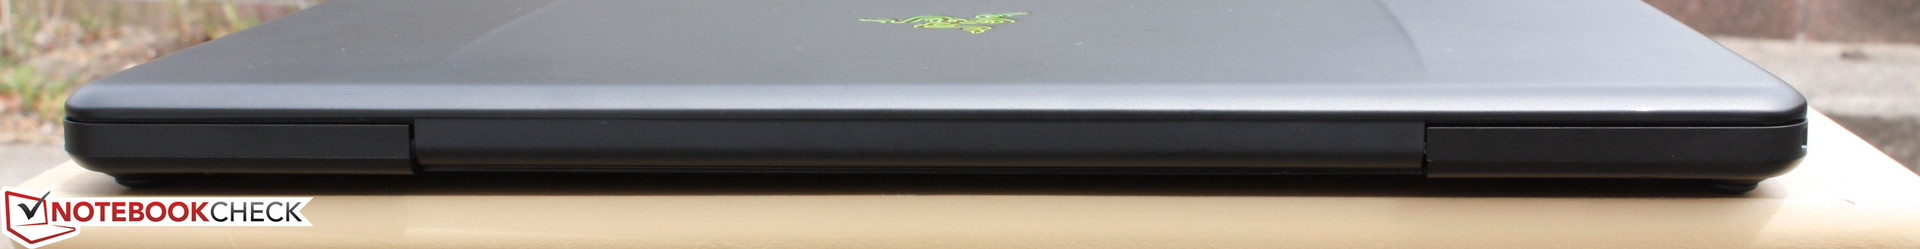
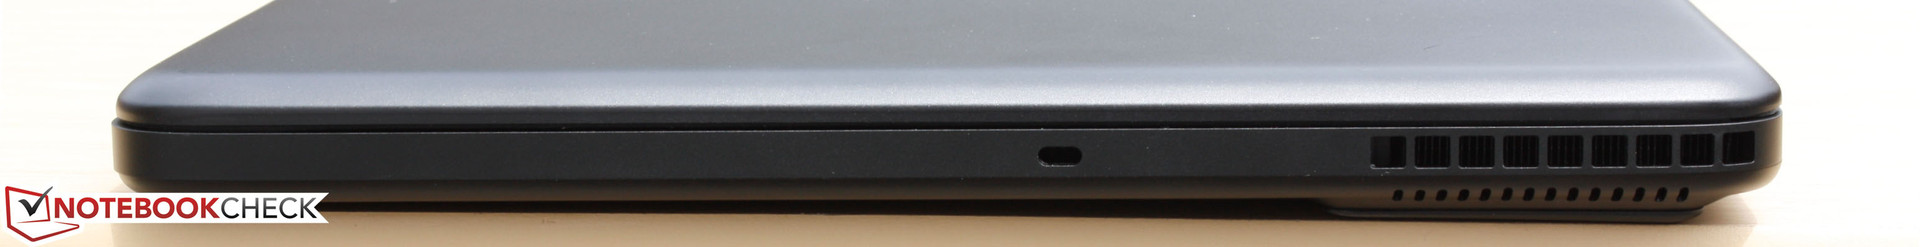
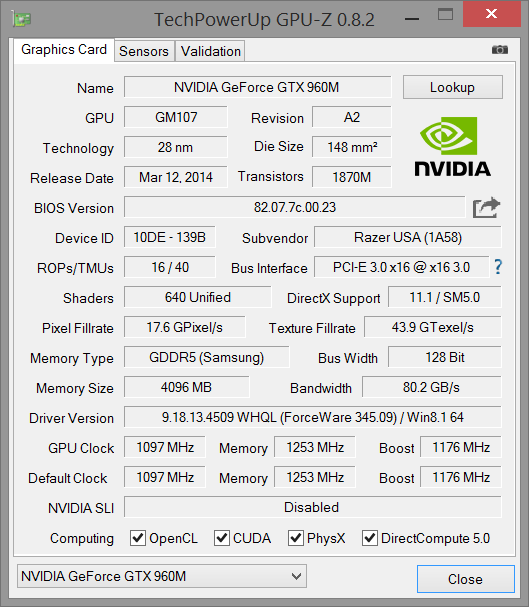
Pero por cada positivo hay un negativo que nos hace preguntar por qué aún existen estos problemas. Los puertos y las conexiones (sin lector de SD o salida dual de vídeo) son menos que los de los modelos de la competencia. La opción GPU es una modesta GTX 960M cuando sabemos que el Blade Pro puede con mucho más. Hasta el Blade 14 de 14" rinde espectacularmente con una GTX 970M más potente. La Switchblade es divertida y novedosa, pero es un touchpad pobre y al final parece un smartphone de 2007 con urgente necesidad de actualizarse. Podemos imaginar en el futuro una posible Switchblade 2.0 más útil y mucho más rápida con respuesta táctil.
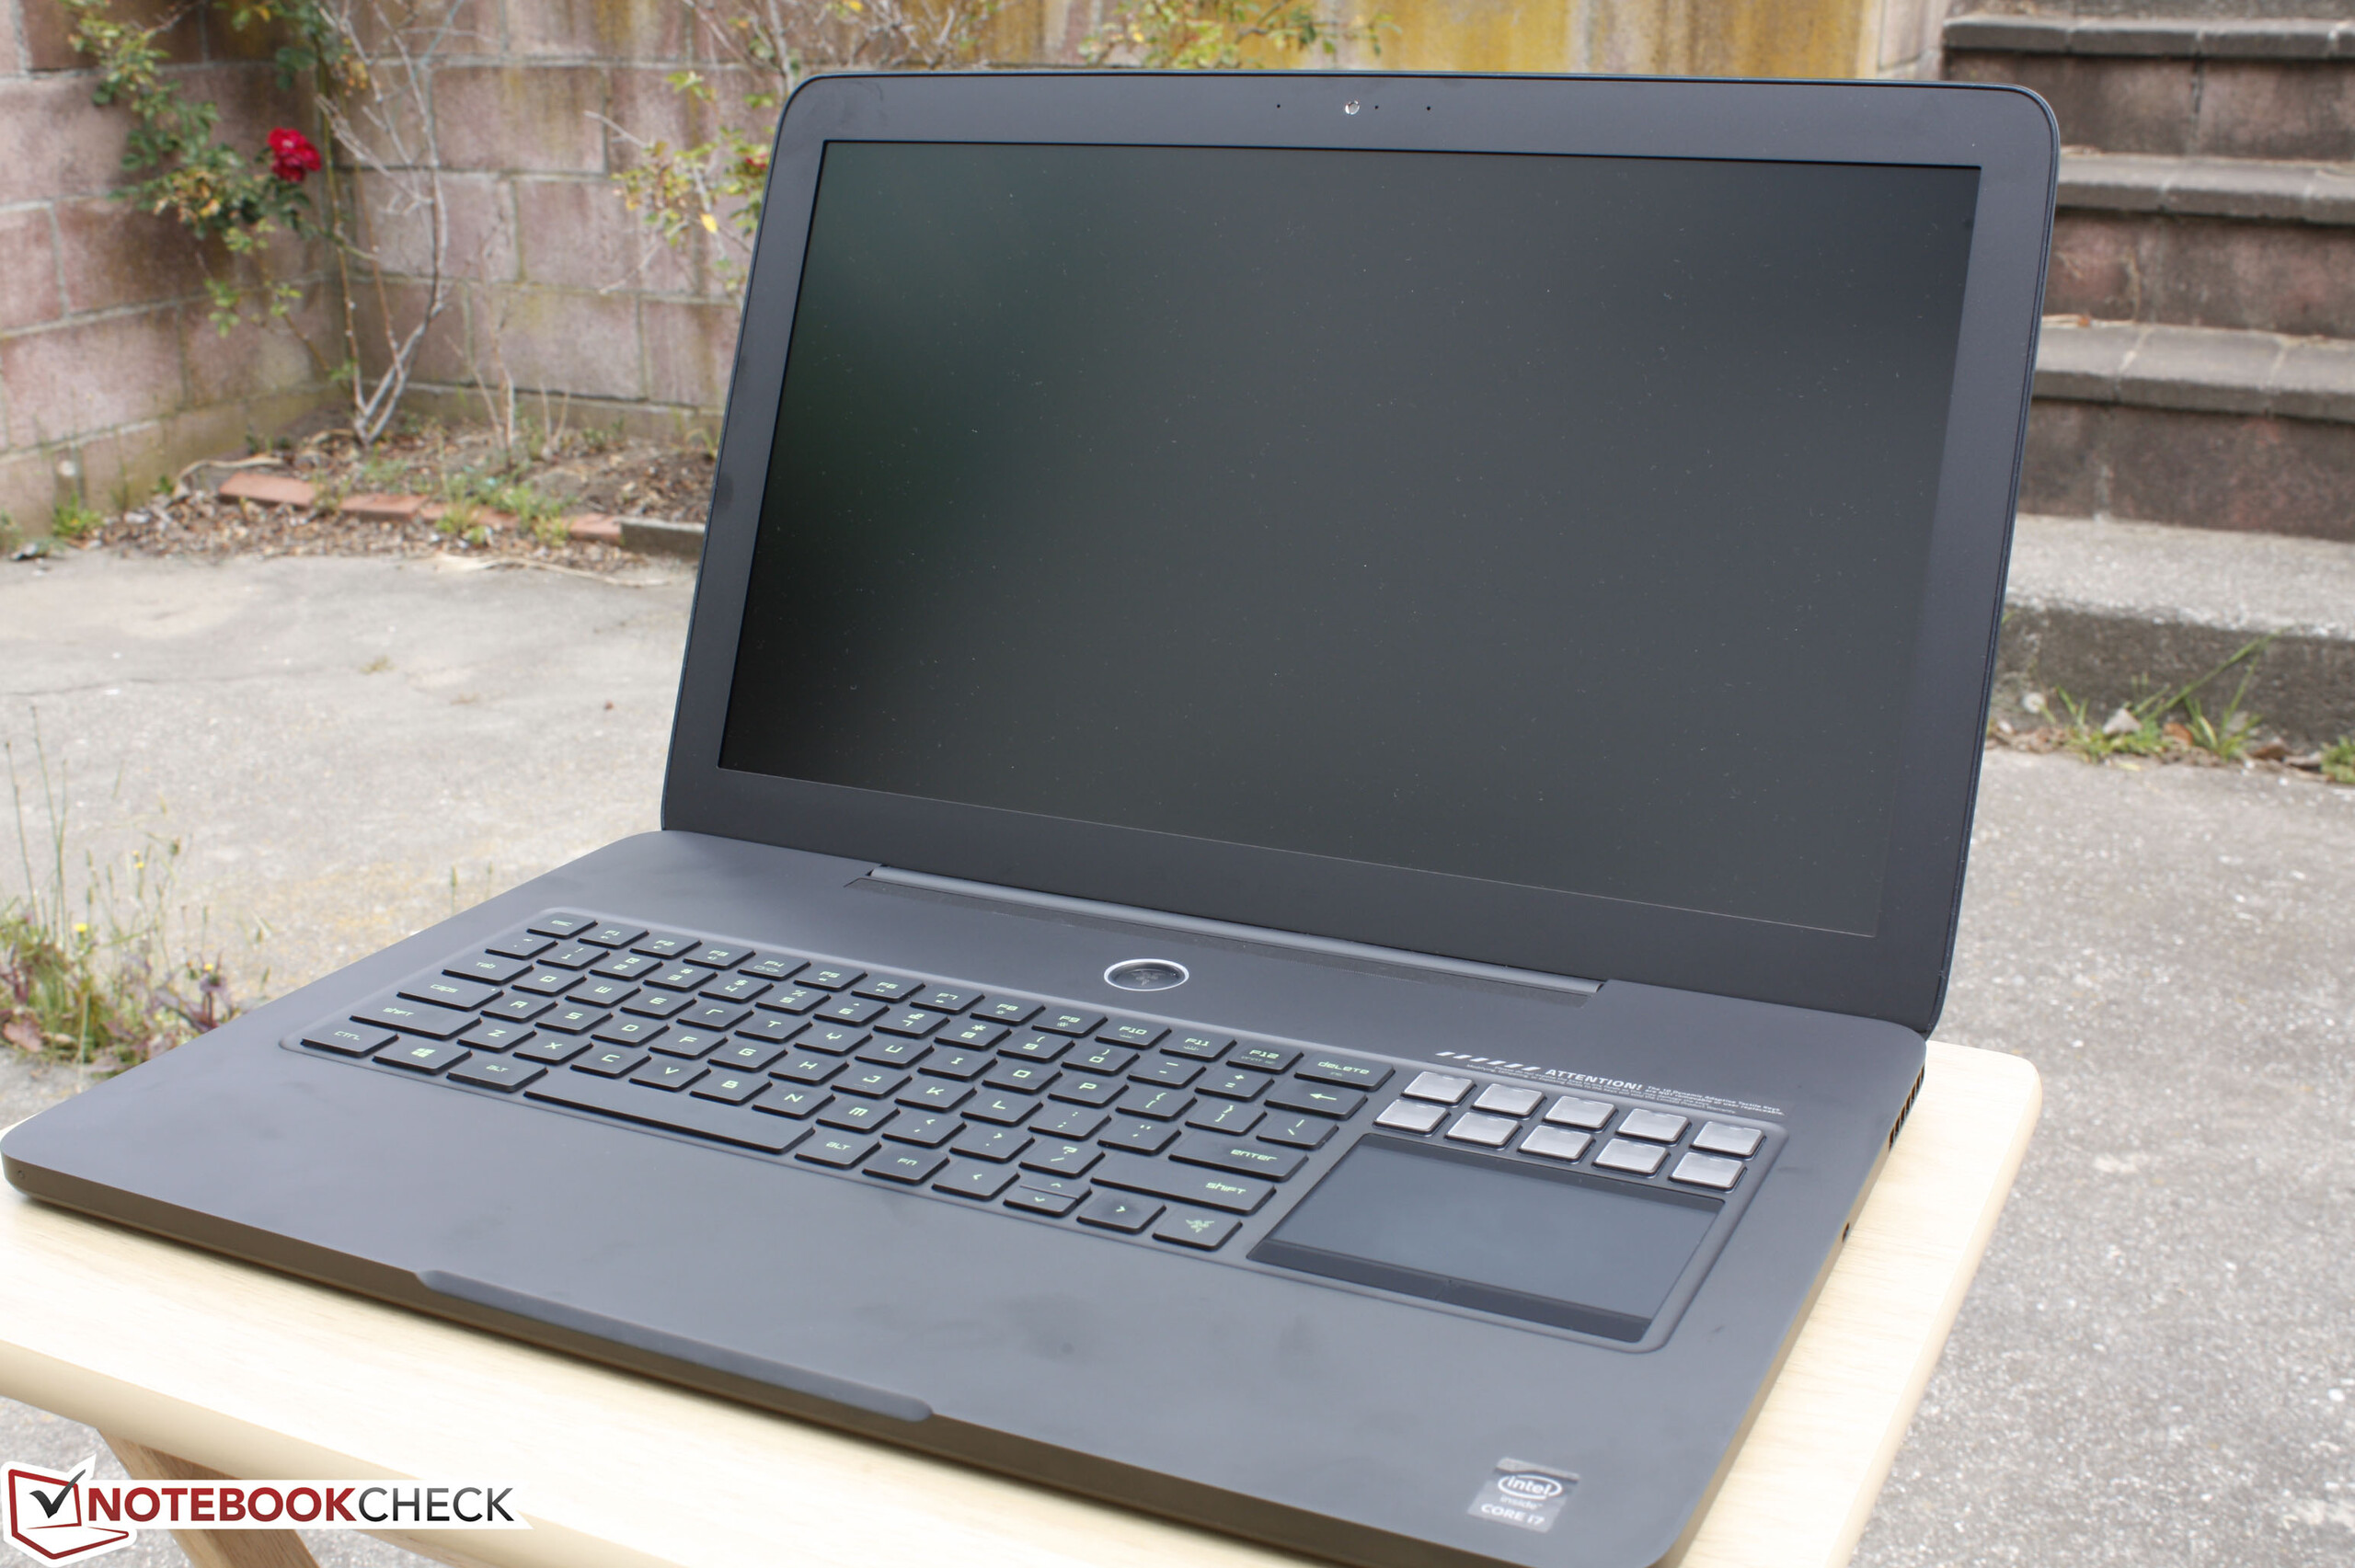
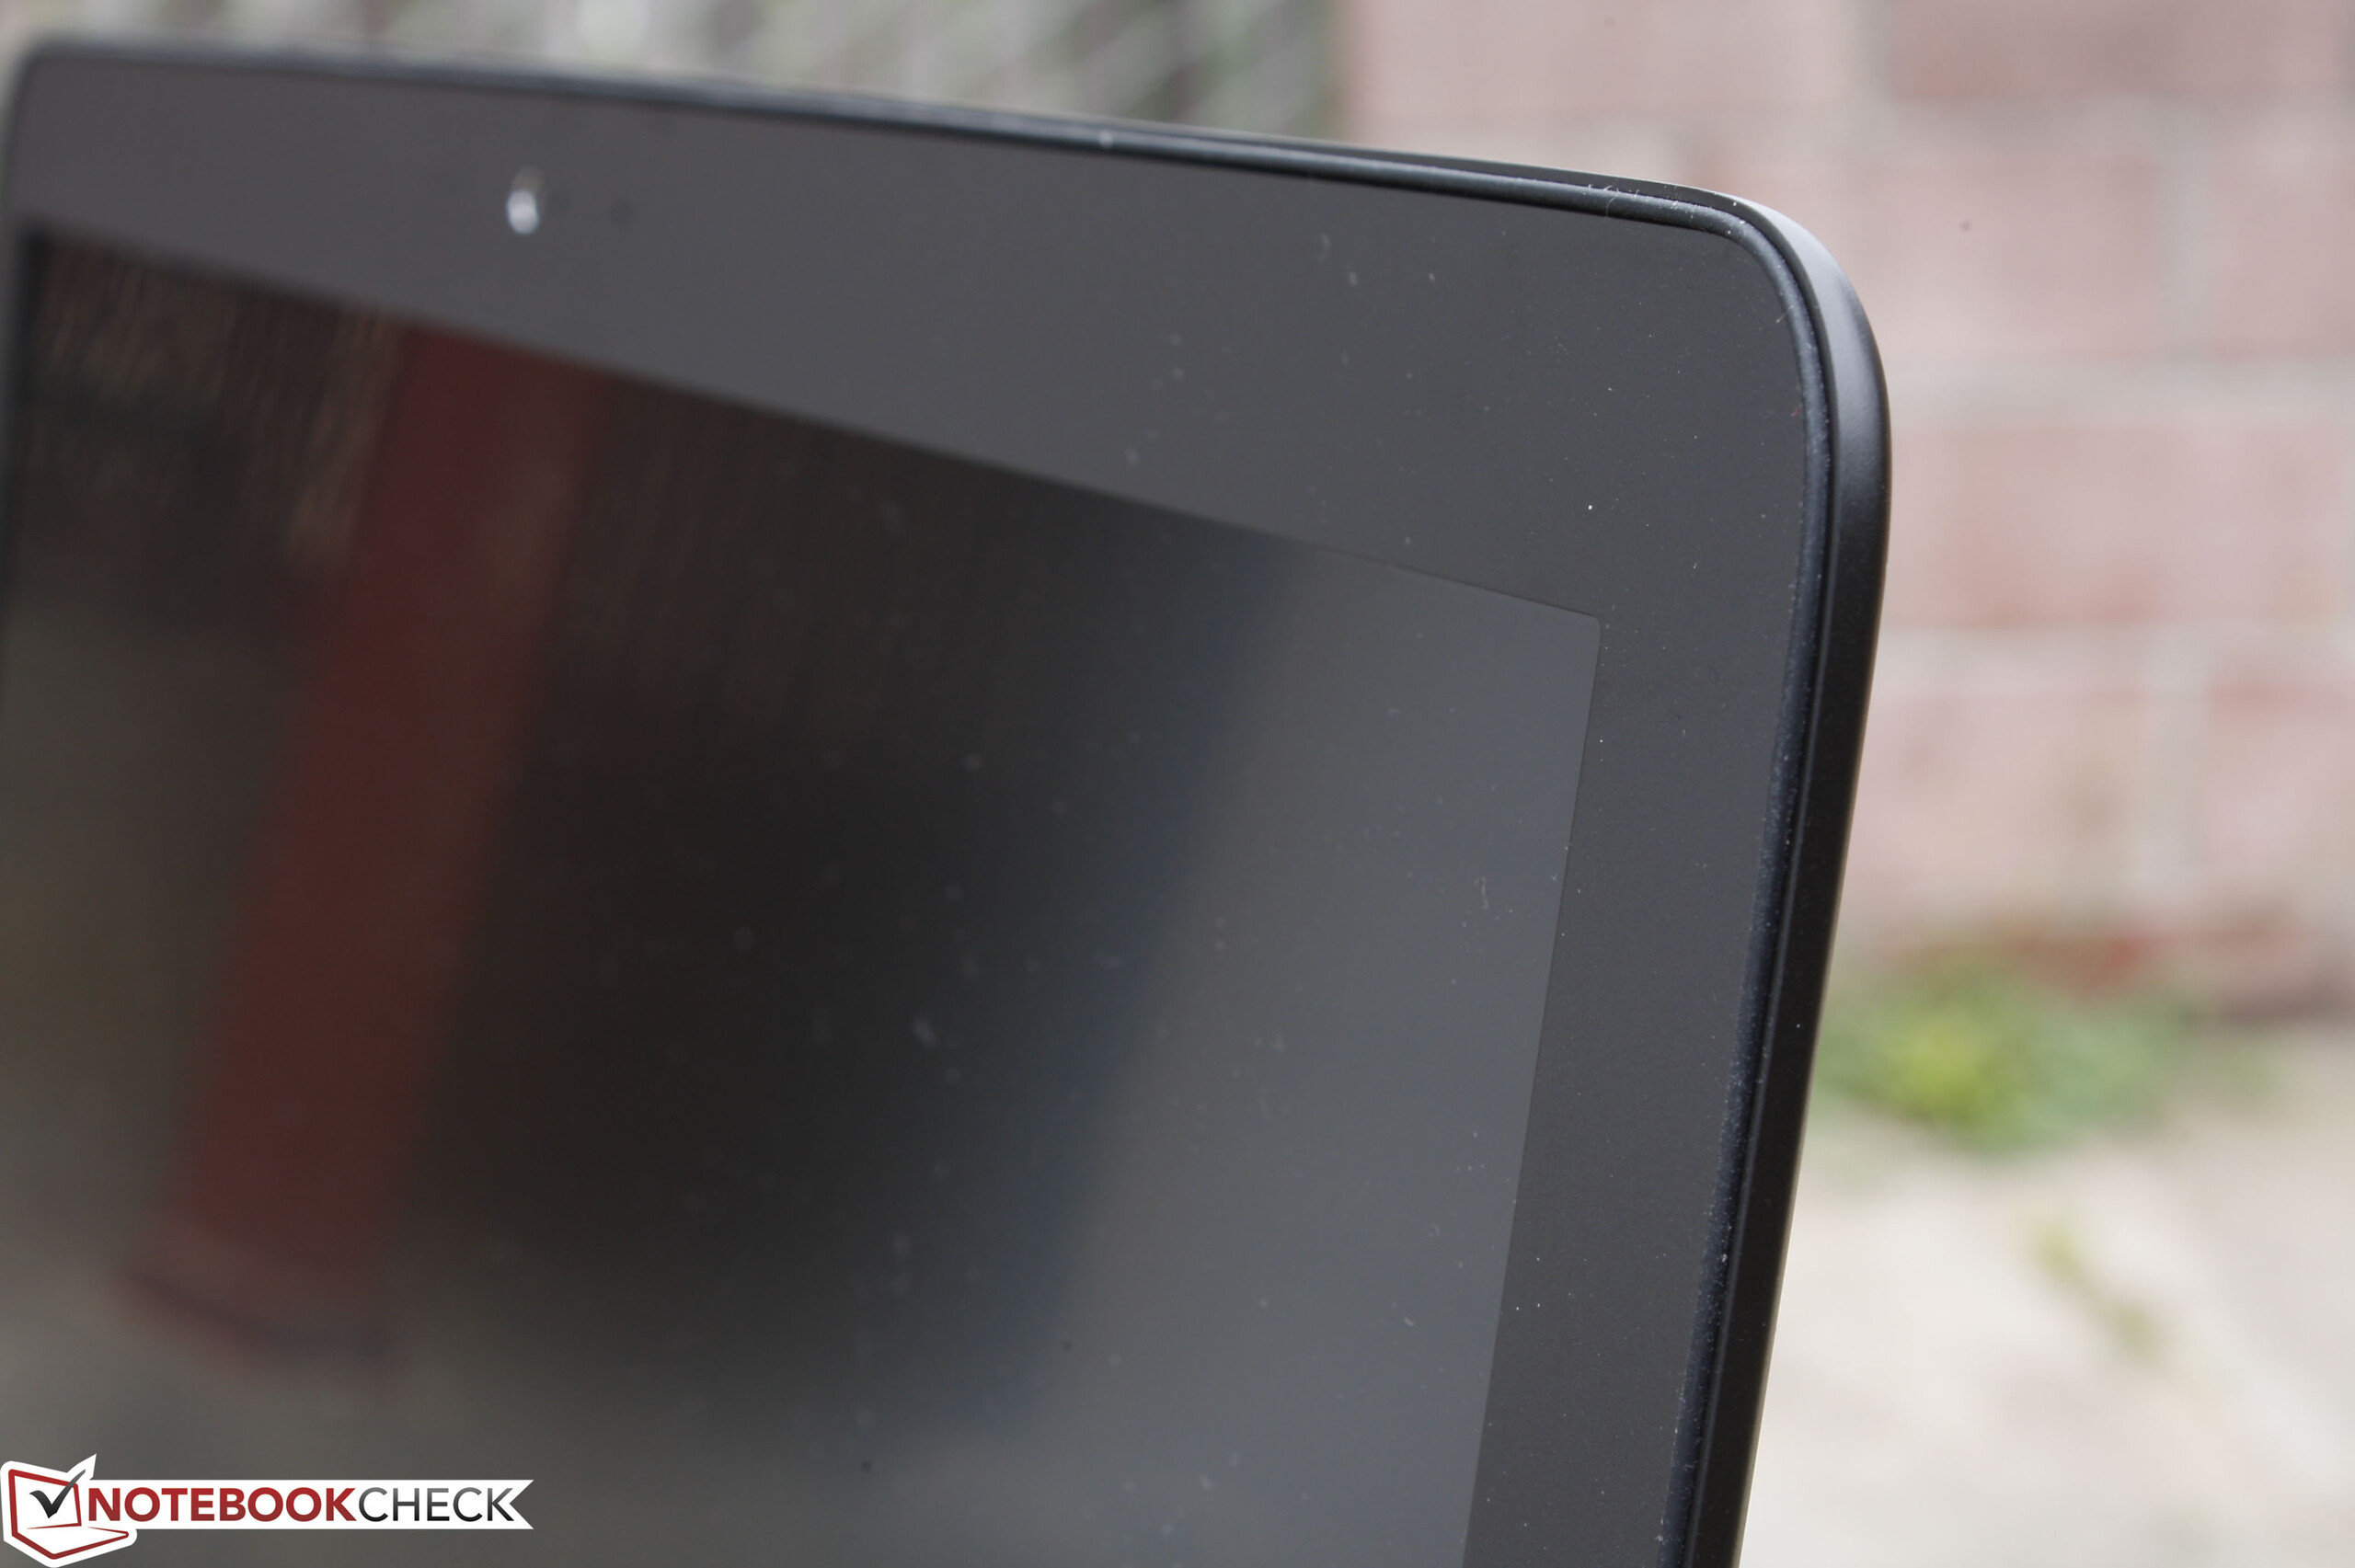
El display TN en sí mismo es bueno, aunque no podemos evitar esperar más de este nivel de precios. Los colores y la escala de grises son imprecisos de fábrica y recomendamos un calibrado para obtener la mejor imagen posible. Los distribuidores de gama alta como Eurocom ofrecen opciones de precalibrado y nos gustaría ver lo mismo de Razer.
Sin una opción de GPU más potente por ahora, la Blade 14 más pequeña y mucho más potente es una recomendación más sencilla y mejor para los que estén buscando su propio sistema Razer.
A partir de $2100, queremos un portátil de juego con patas largas y rendimiento que dure. Si bien no dudamos que el hardware del Blade Pro es de primera, la GTX 960M y la vieja Switchblade lo tendrán más difícil a la larga. Sin una opción de GPU más potente por ahora, la Blade 14 más pequeña y mucho más potente es una recomendación más sencilla y mejor para los que estén buscando su propio sistema Razer. Esperamos que haya un rediseño en marcha para el Blade Pro.
Ésta es una versión acortada del análisis original. Puedes leer el análisis completo en inglés aquí.
Razer Blade Pro 17 inch 2015
-
05/13/2015 v4(old)
Allen Ngo
Pricecompare
