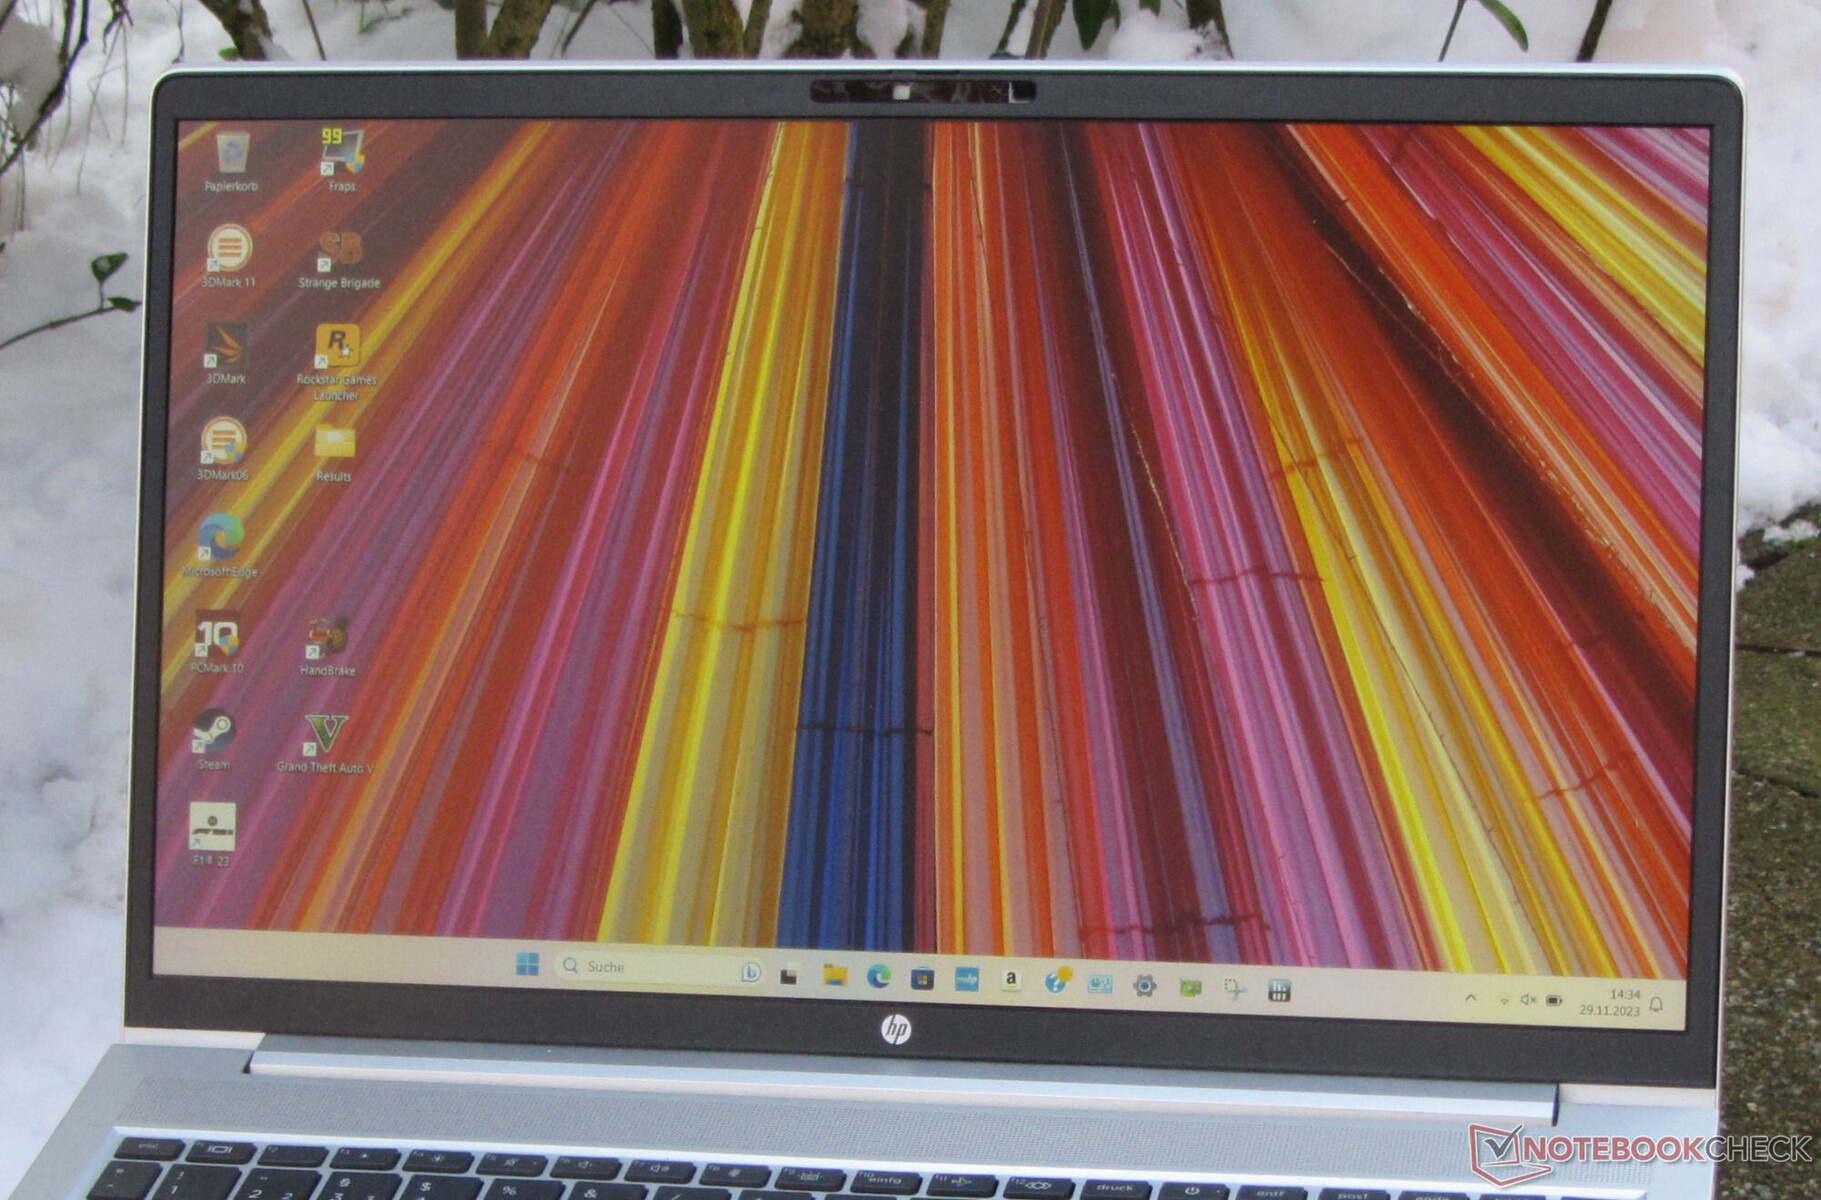
Análisis del HP ProBook 450 G10: GeForce La potencia RTX dentro de un portátil de oficina
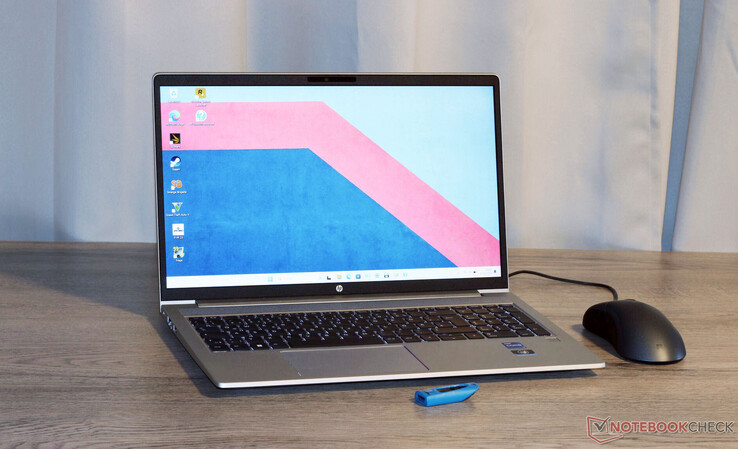
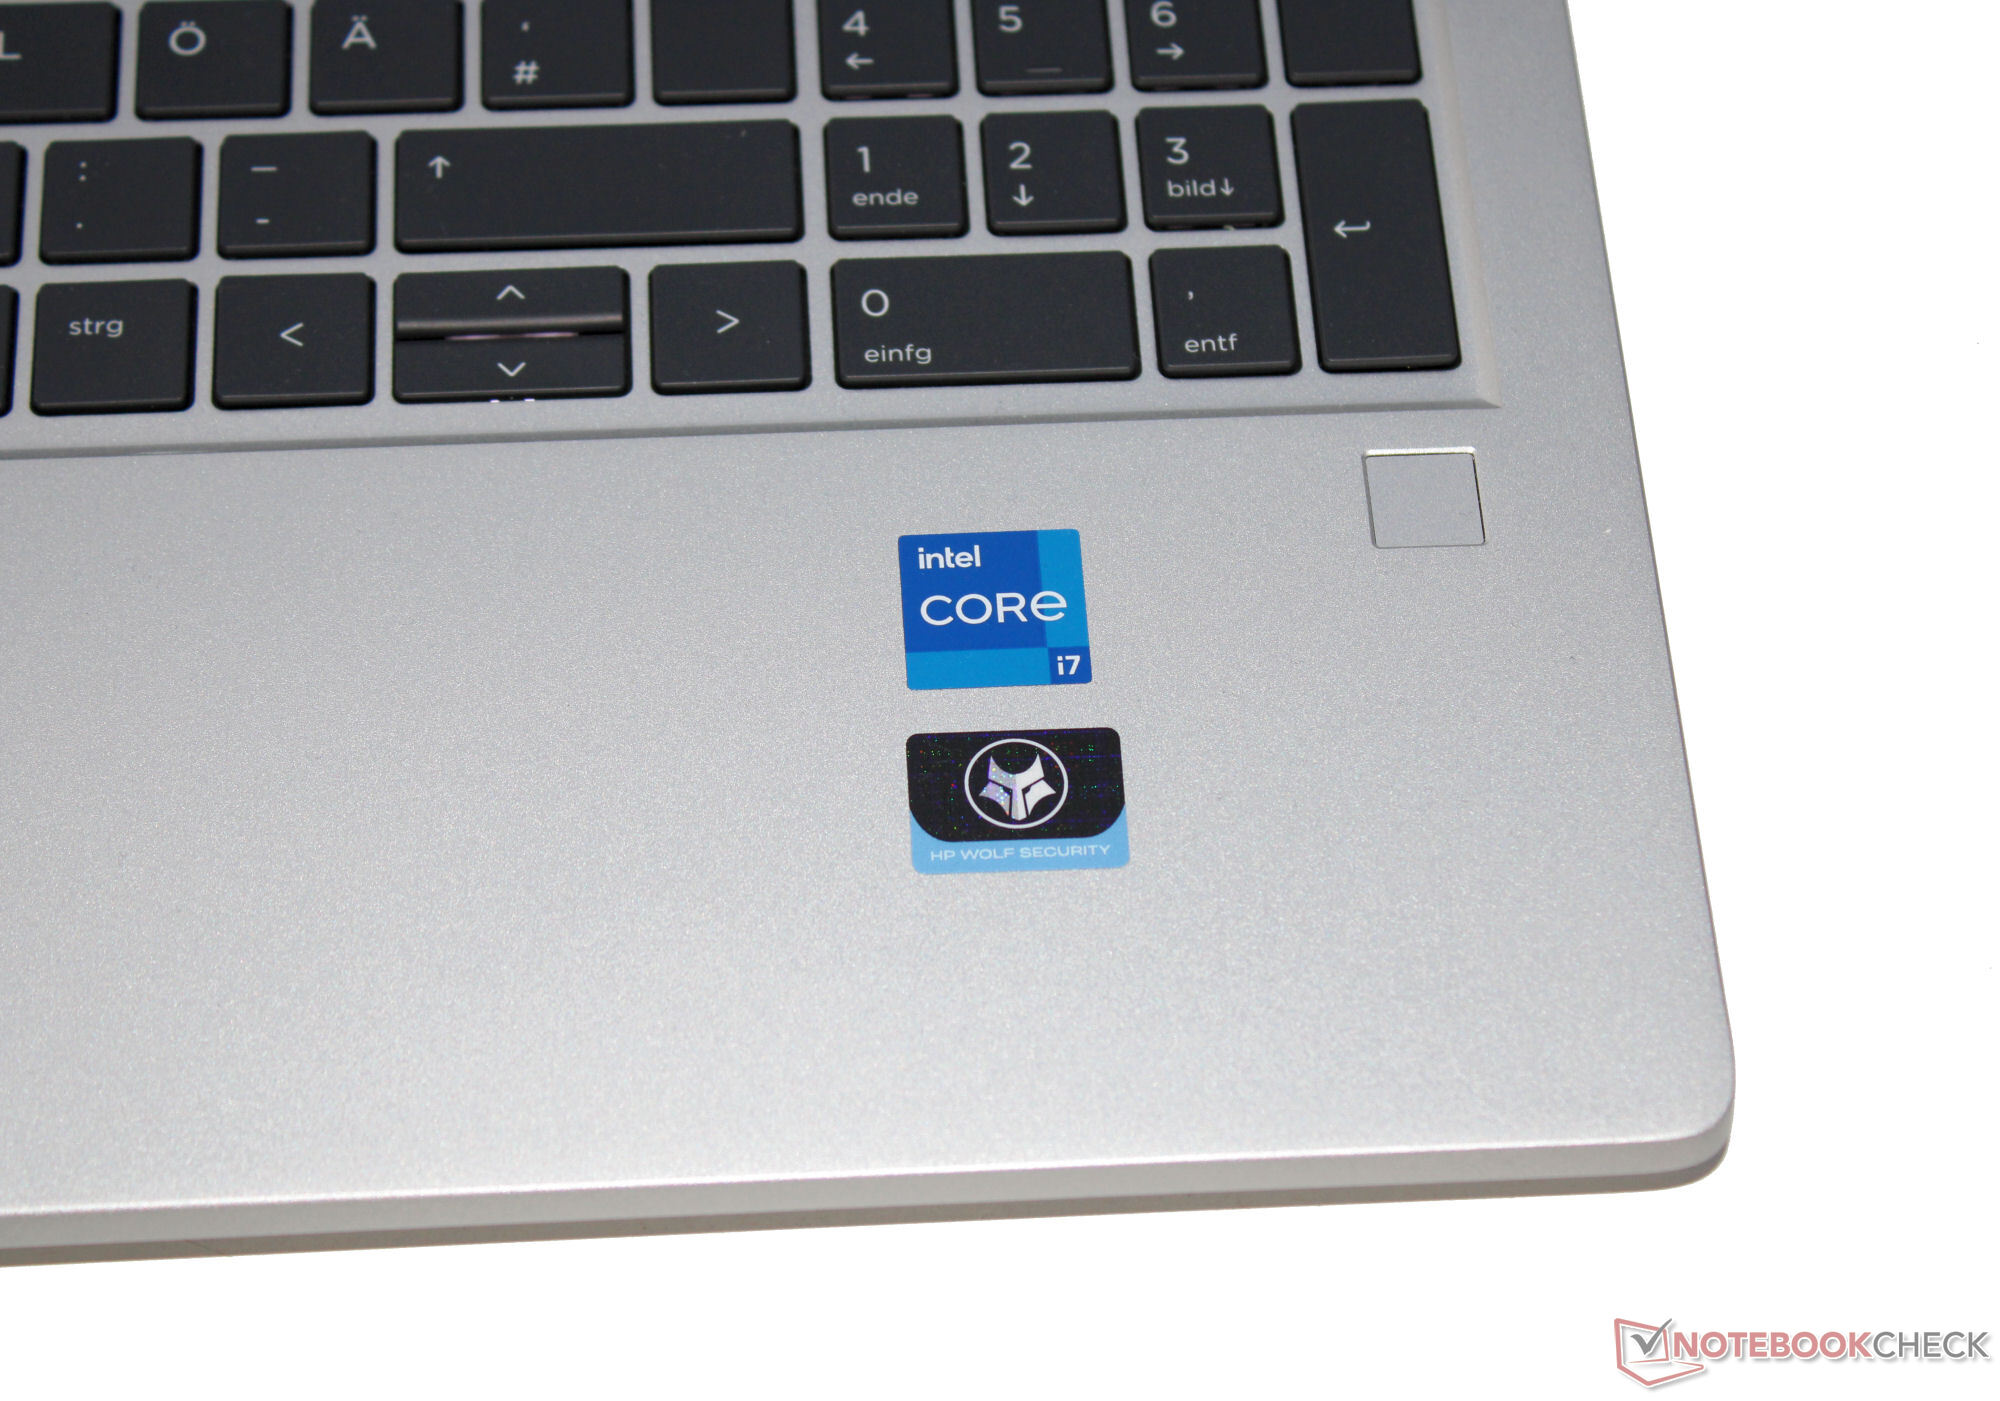
Dentro de la serie ProBook 400, HP ha agrupado portátiles empresariales de gama básica a media que no le costarán un ojo de la cara. Los modelos más baratos de 15,6 pulgadas parten de unos 750 dólares. Para nuestro dispositivo de prueba, el modelo tope de gama de esta serie, probablemente tendrá que desembolsar unos 1.000 dólares. HP confía en las CPU Raptor Lake de Intel para este modelo. Bastantes versiones cuentan además con una GeForce RTX 2050 siendo nuestro dispositivo de prueba uno de ellos.
La competencia incluye dispositivos como el Acer Aspire 5 A515-58GM, Schenker VIA 15 Pro M22, Lenovo ThinkPad L15 Gen 4, Fujitsu LifeBook E5412A y el Dell Latitude 3440 - en el caso de los dos últimos portátiles, esto se aplica en mayor medida a sus respectivos modelos hermanos de 15,6 pulgadas.
Posibles contendientes en la comparación
Valoración | Fecha | Modelo | Peso | Altura | Tamaño | Resolución | Precio |
|---|---|---|---|---|---|---|---|
| 86.2 % v7 (old) | 12/2023 | HP ProBook 450 G10 i7-1355U, GeForce RTX 2050 Mobile | 1.8 kg | 19.9 mm | 15.60" | 1920x1080 | |
| 82 % v7 (old) | 09/2023 | Acer Aspire 5 A515-58GM-76S8 i7-1355U, GeForce RTX 2050 Mobile | 1.8 kg | 19.7 mm | 15.60" | 1920x1080 | |
| 87.1 % v7 (old) | Schenker VIA 15 Pro M22 R7 5700U, Vega 8 | 1.4 kg | 16.8 mm | 15.60" | 2560x1440 | ||
| 86.6 % v7 (old) | 12/2023 | Lenovo ThinkPad L15 Gen 4 21H70021GE R7 PRO 7730U, Vega 8 | 1.9 kg | 19.93 mm | 15.60" | 1920x1080 | |
| 82.1 % v7 (old) | 06/2023 | Fujitsu LifeBook E5412A E542AMHAAMDE R5 PRO 5675U, Vega 7 | 1.4 kg | 19.9 mm | 14.00" | 1920x1080 | |
| 85.3 % v7 (old) | 06/2023 | Dell Latitude 3440 i5-1345U, Iris Xe G7 80EUs | 1.5 kg | 19.4 mm | 14.00" | 1920x1080 |
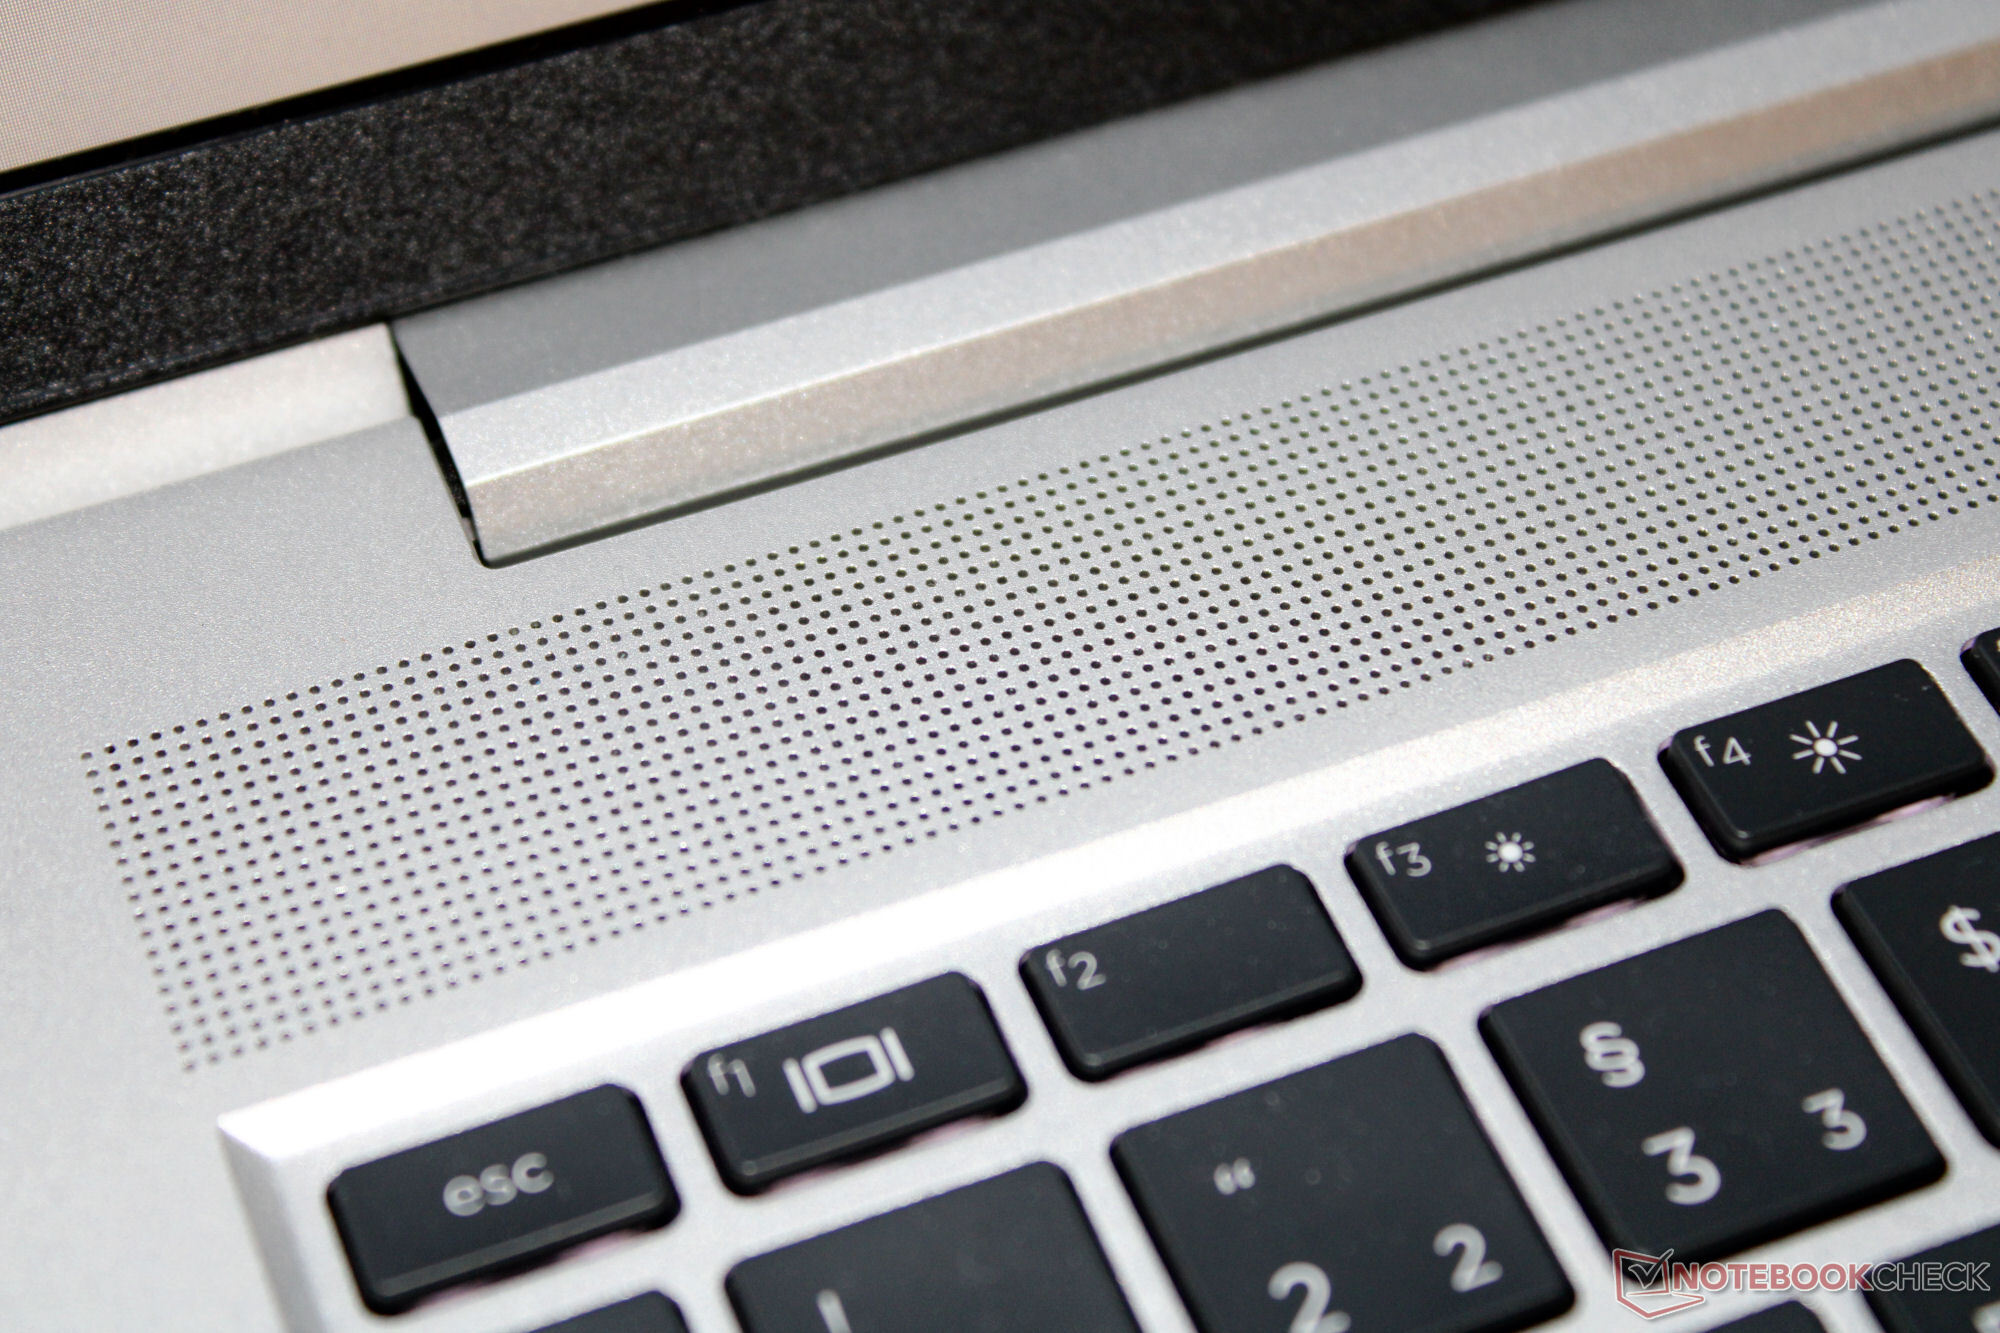
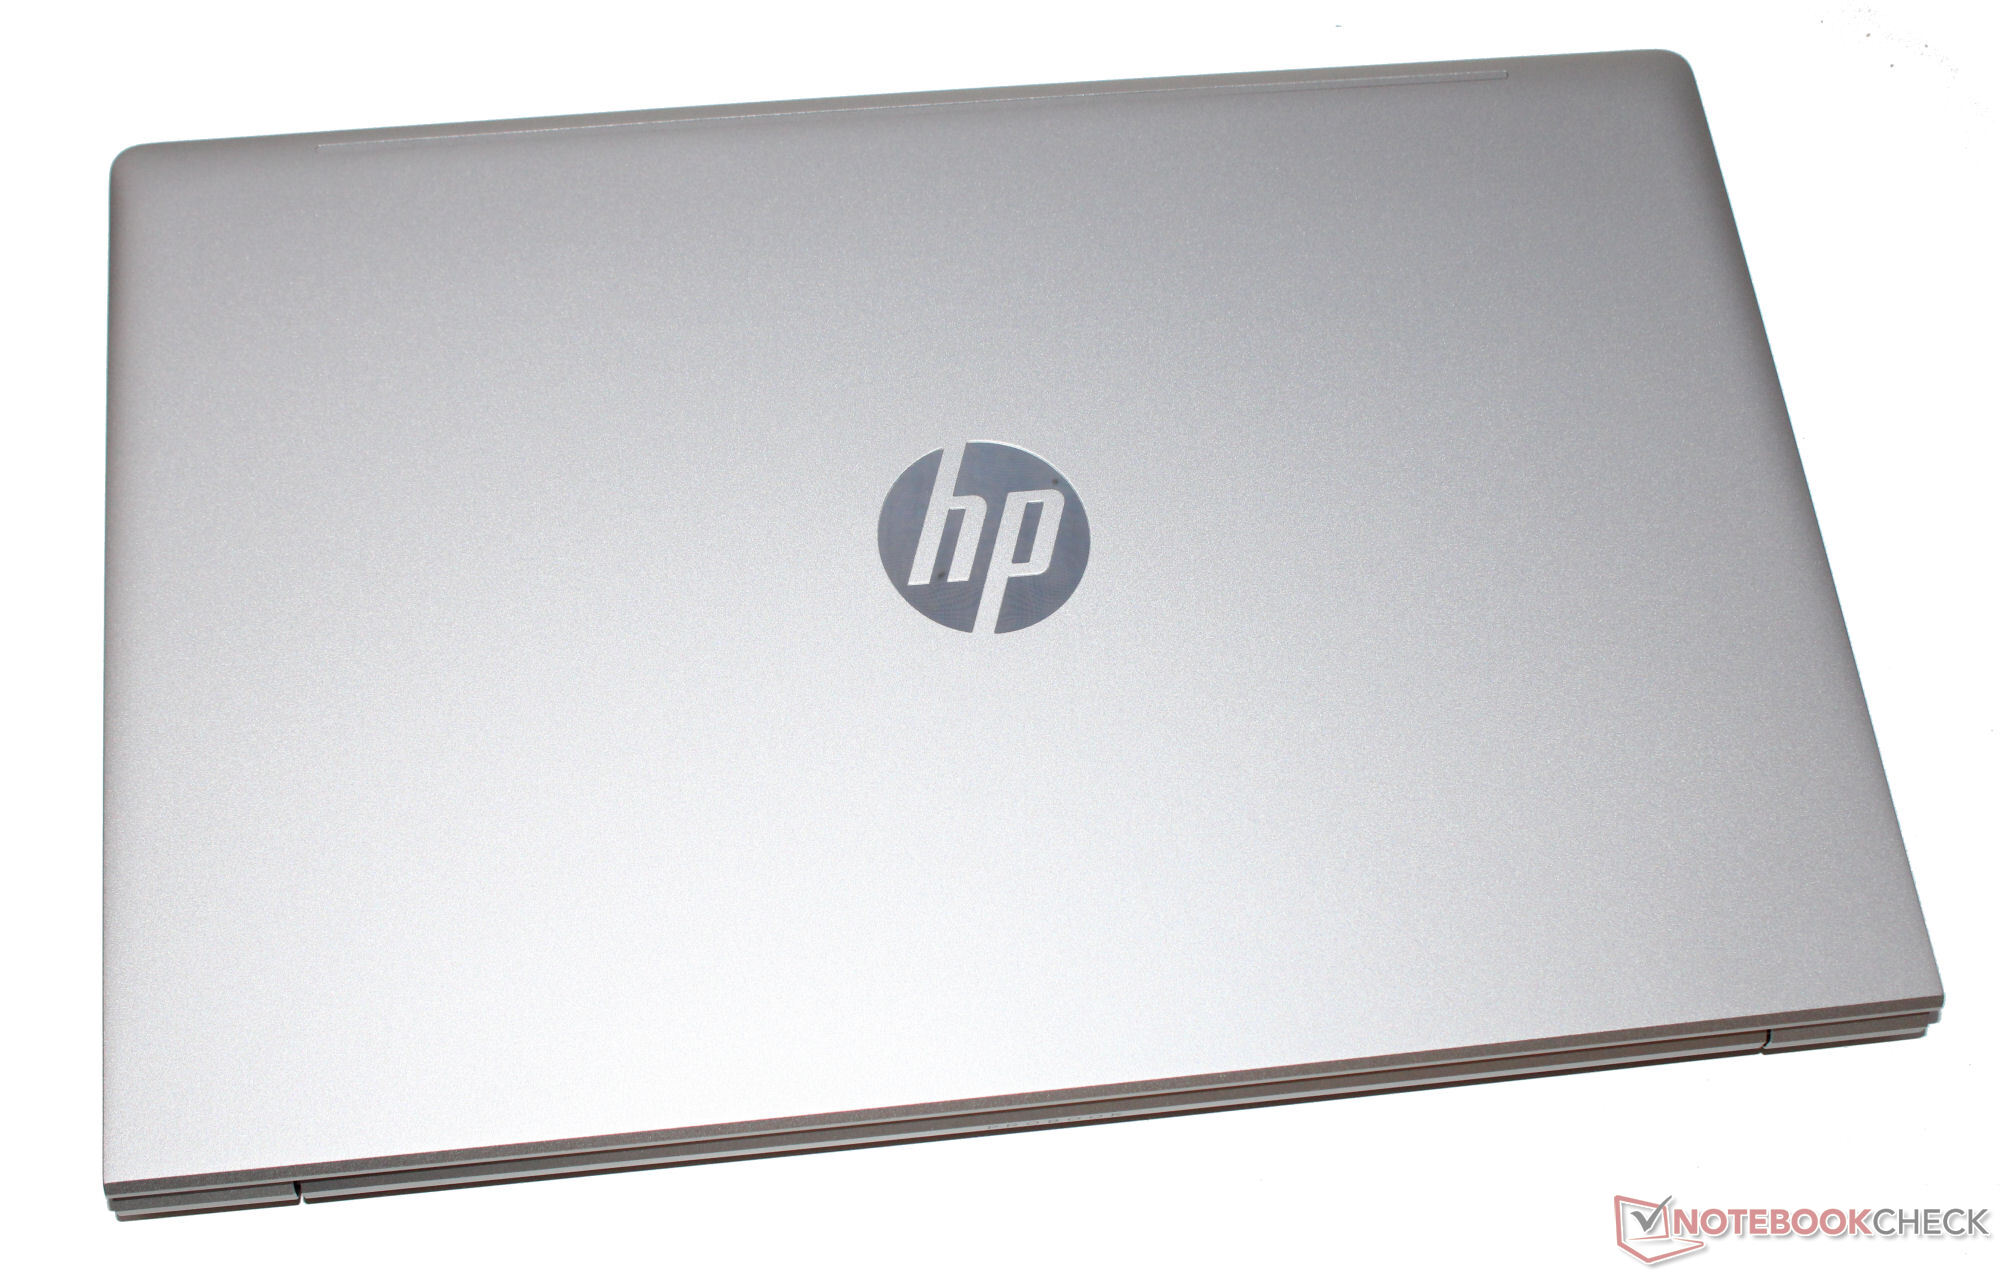
Carcasa - HP utiliza aluminio y plástico
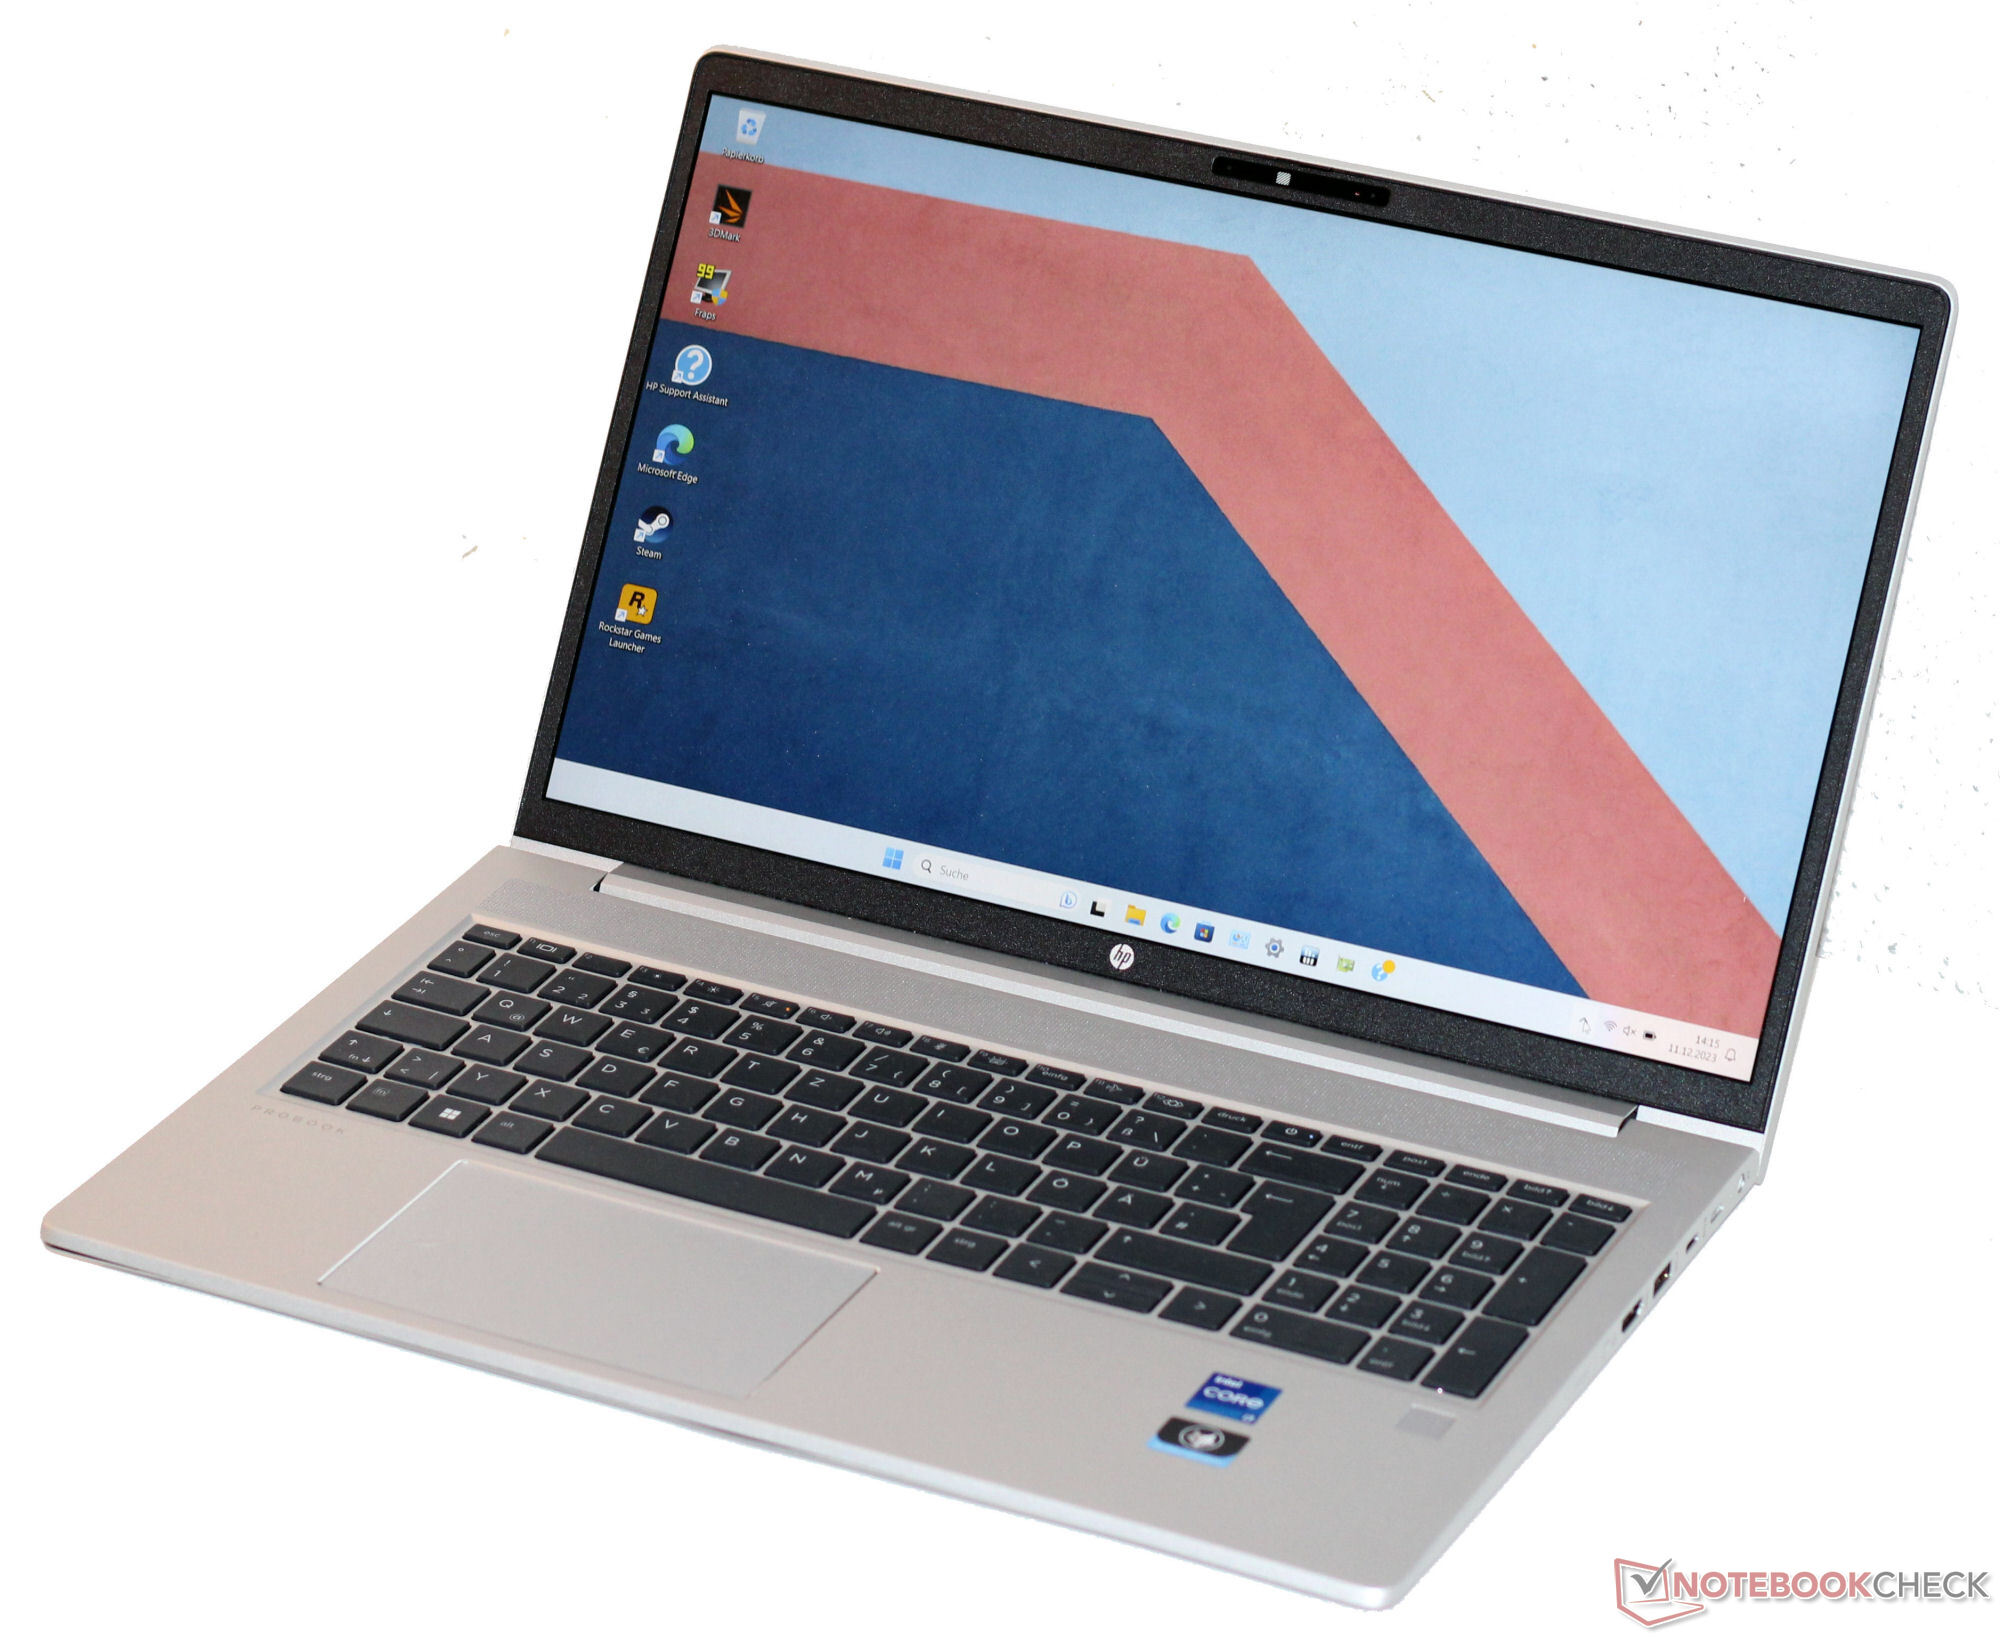
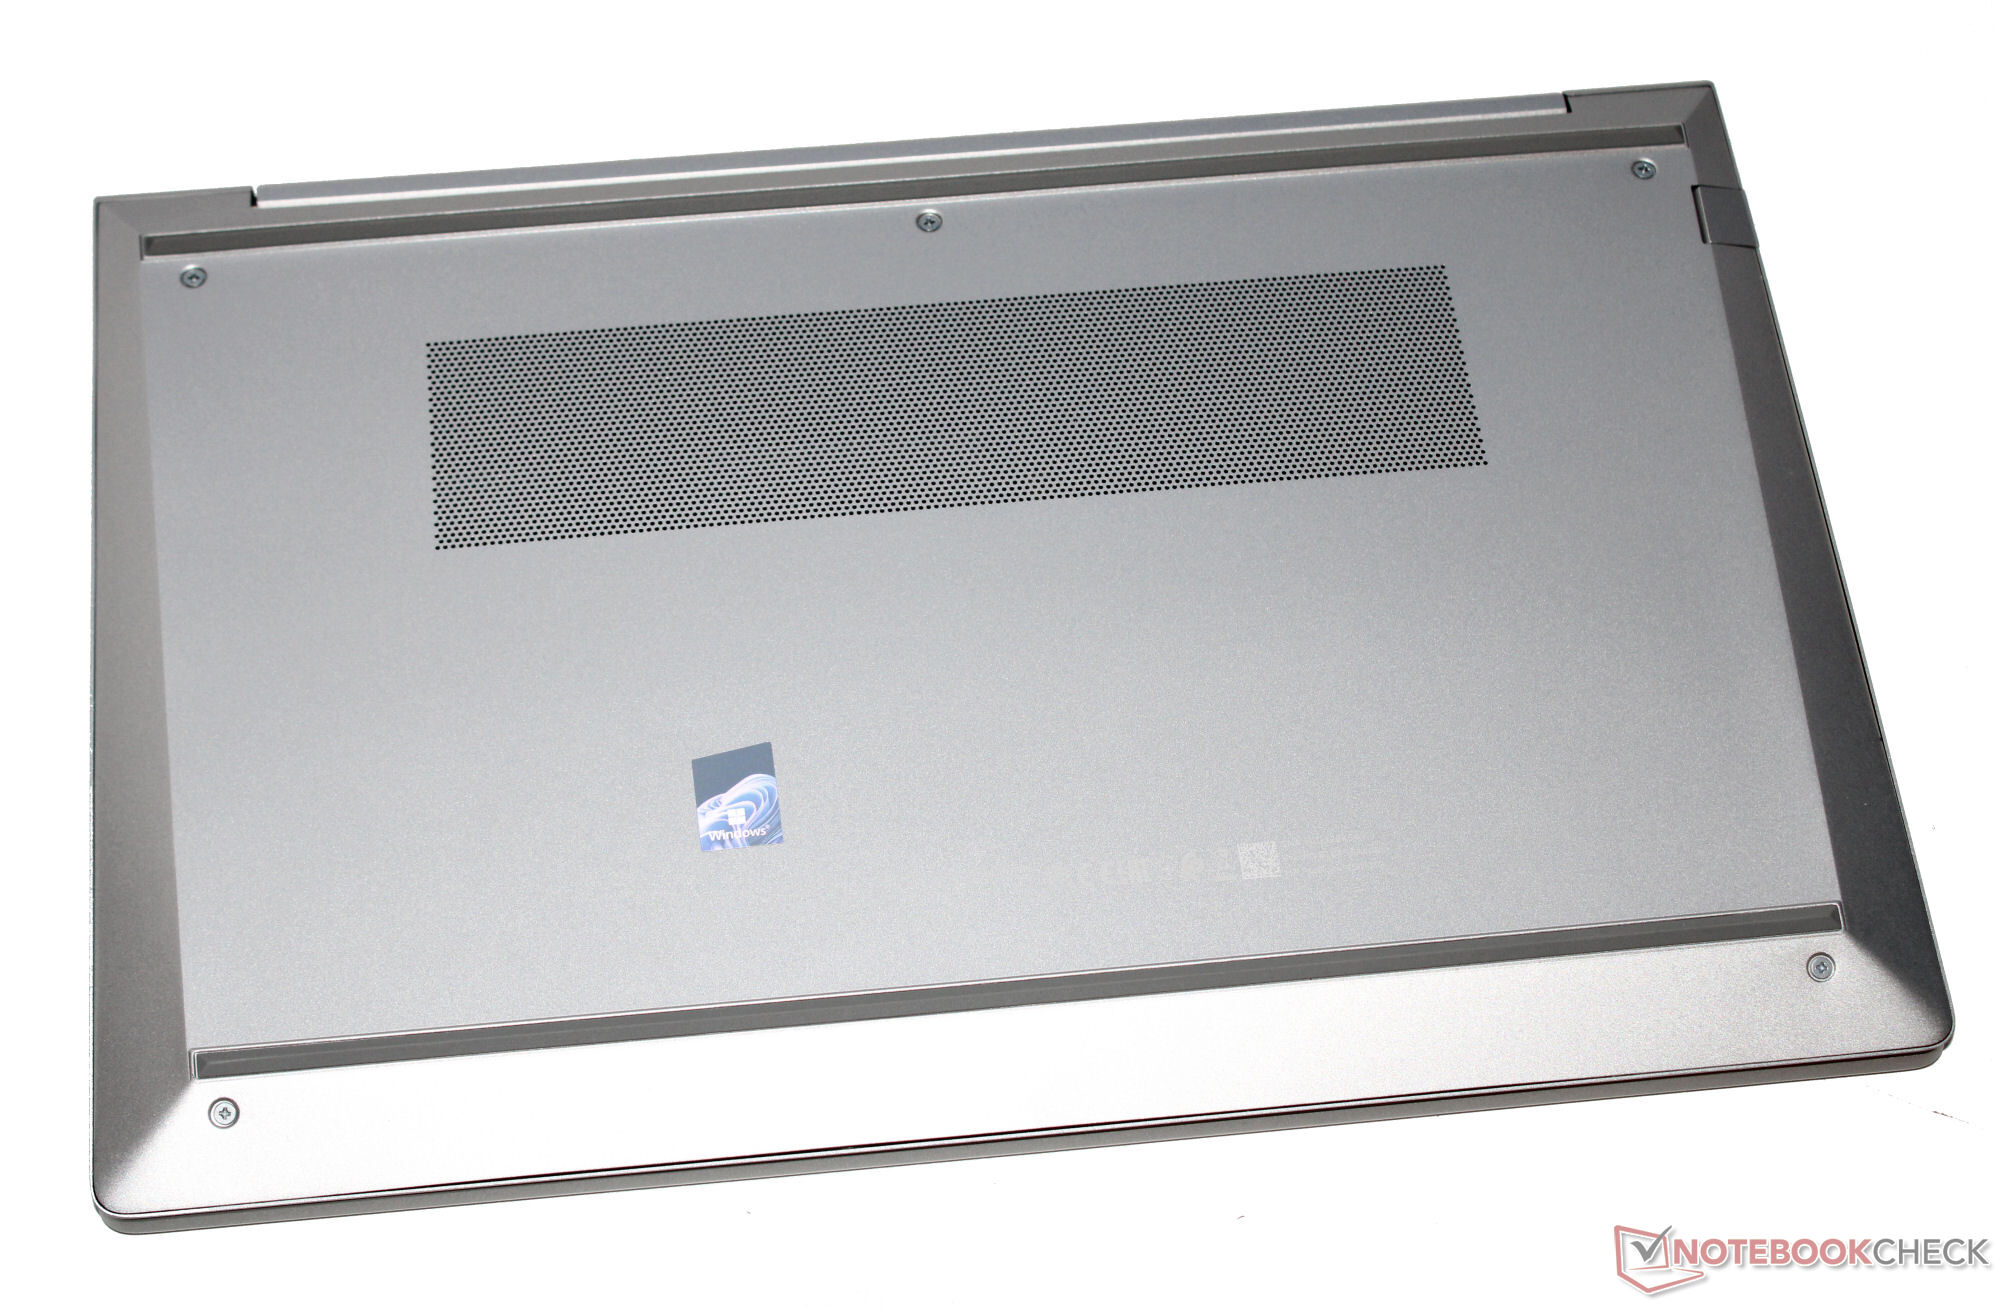
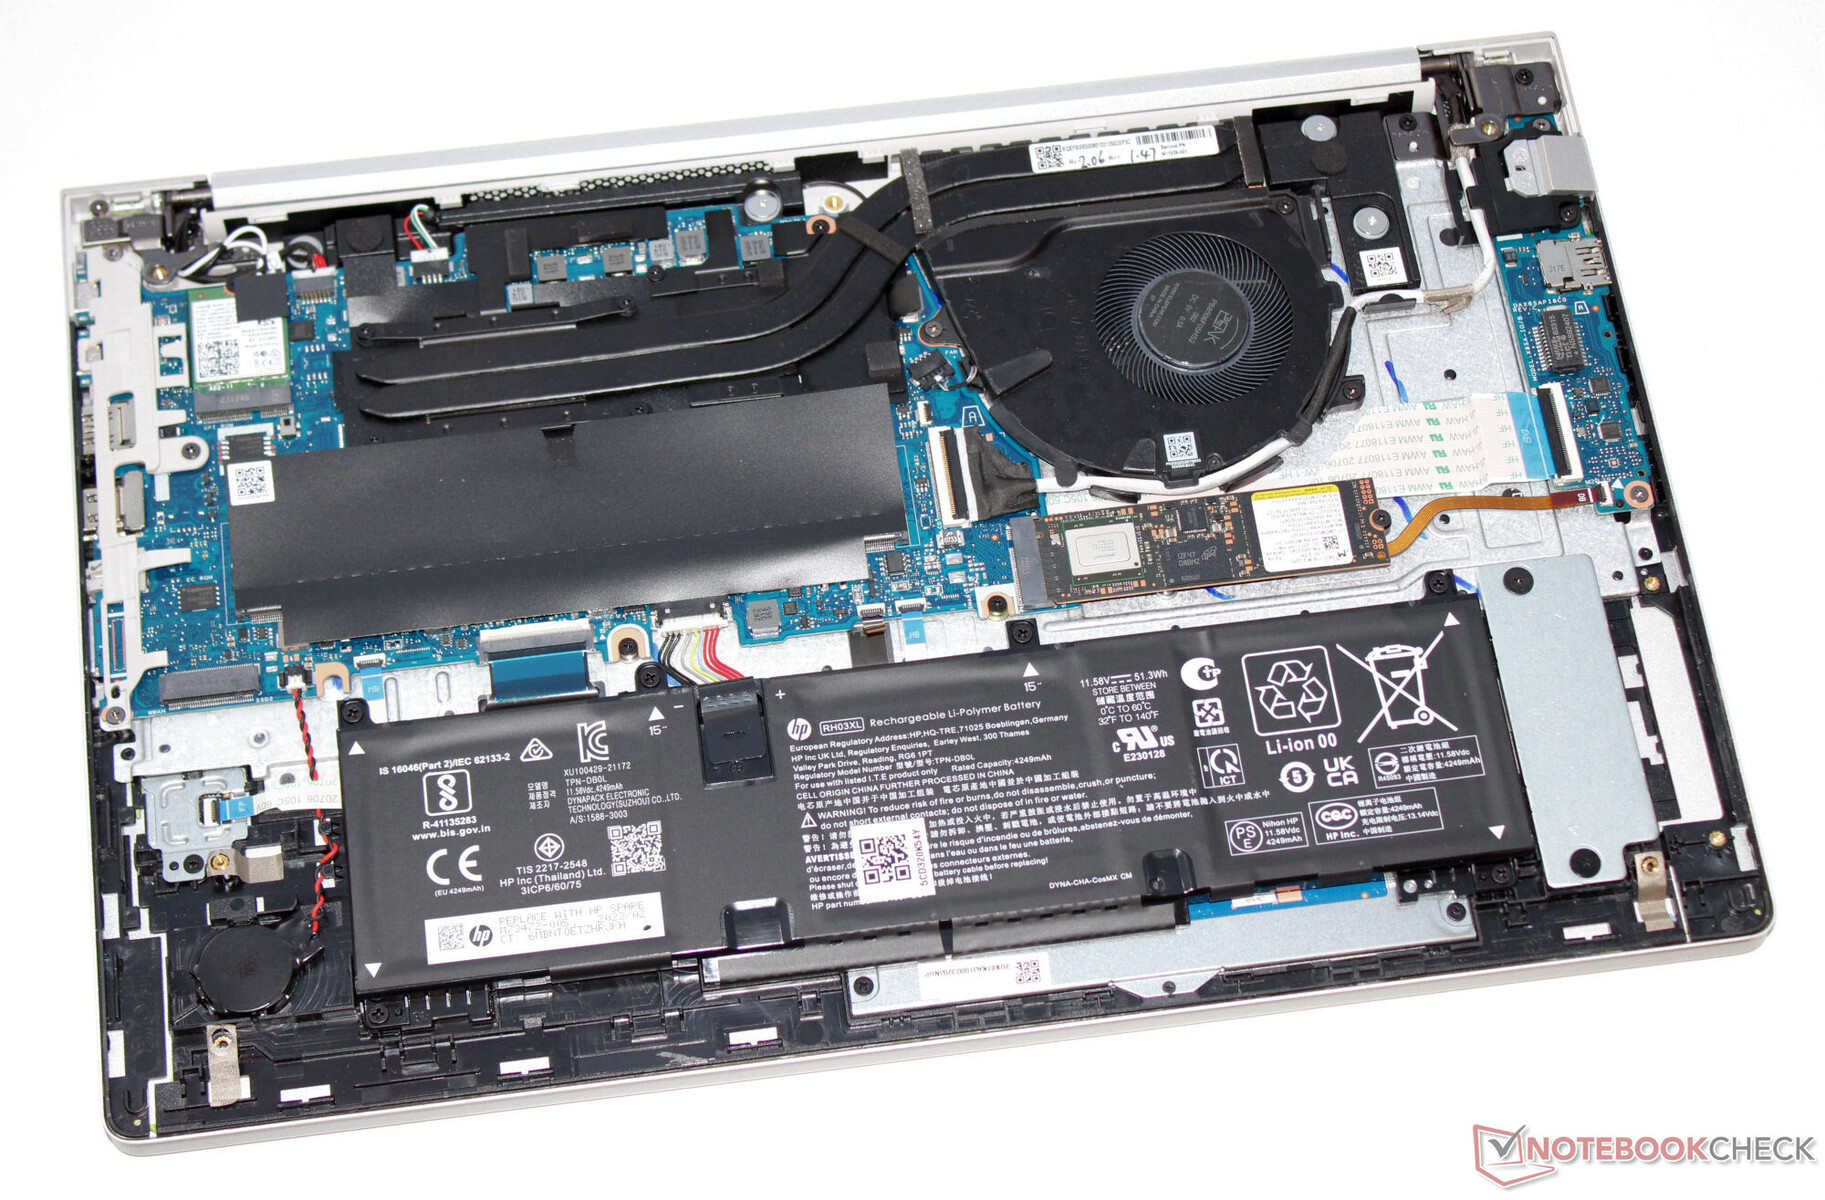
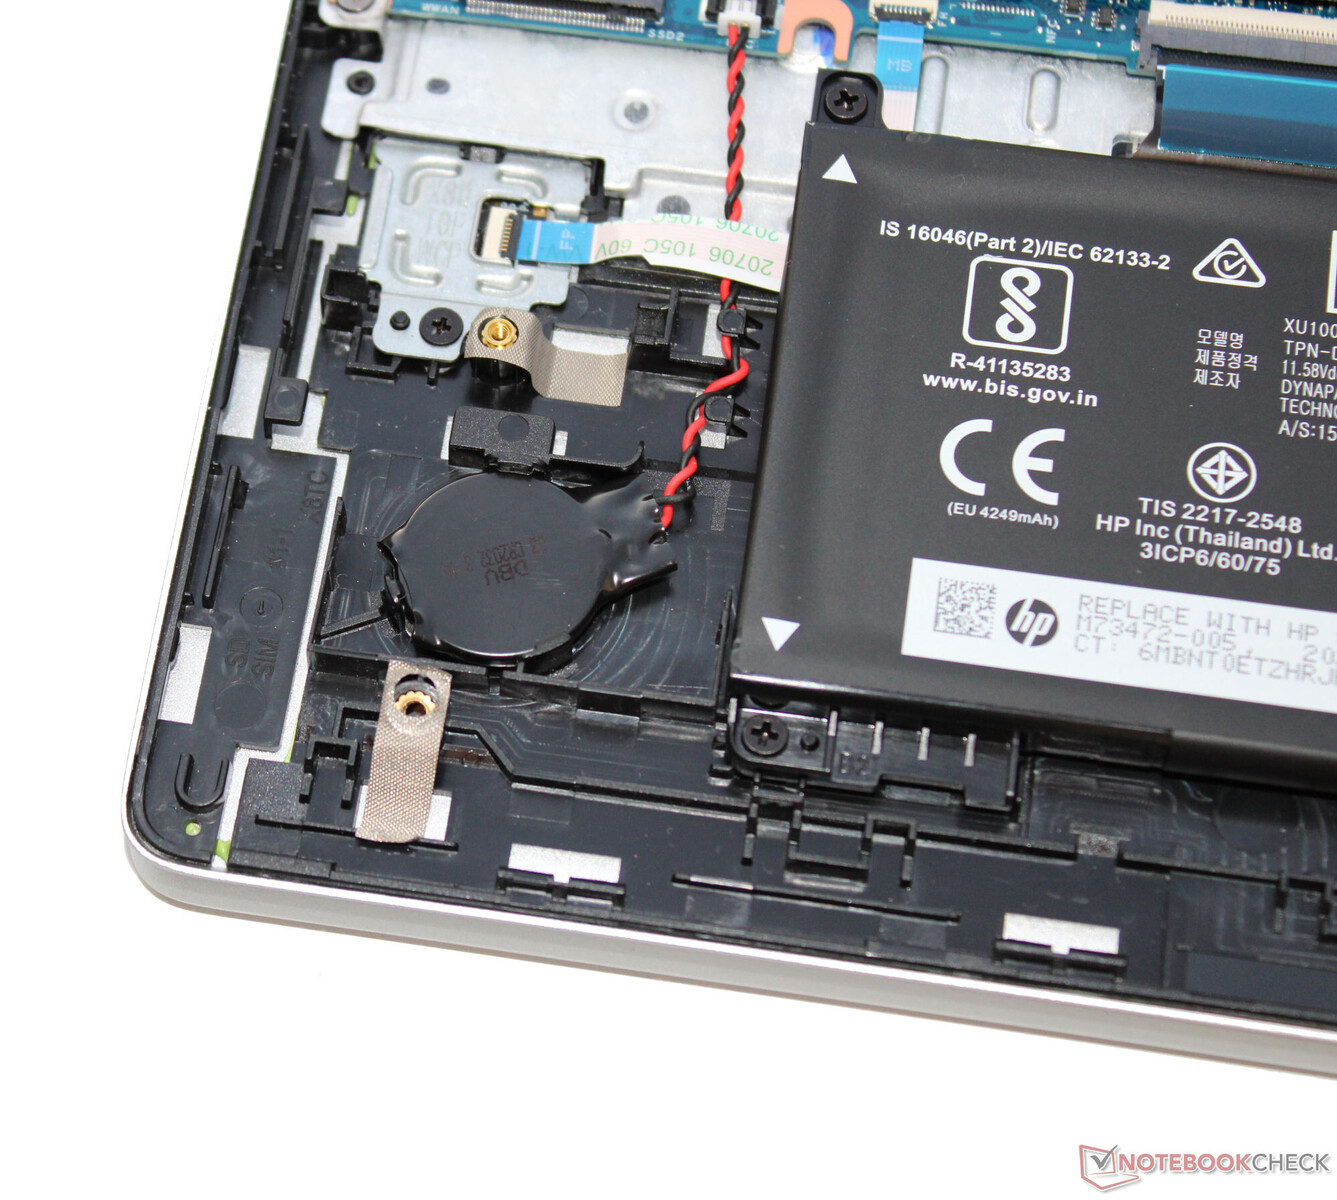
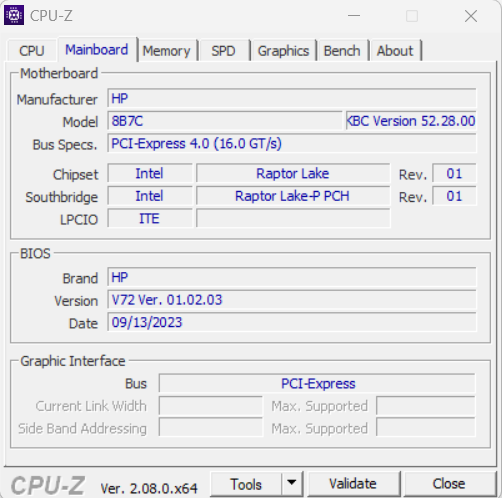
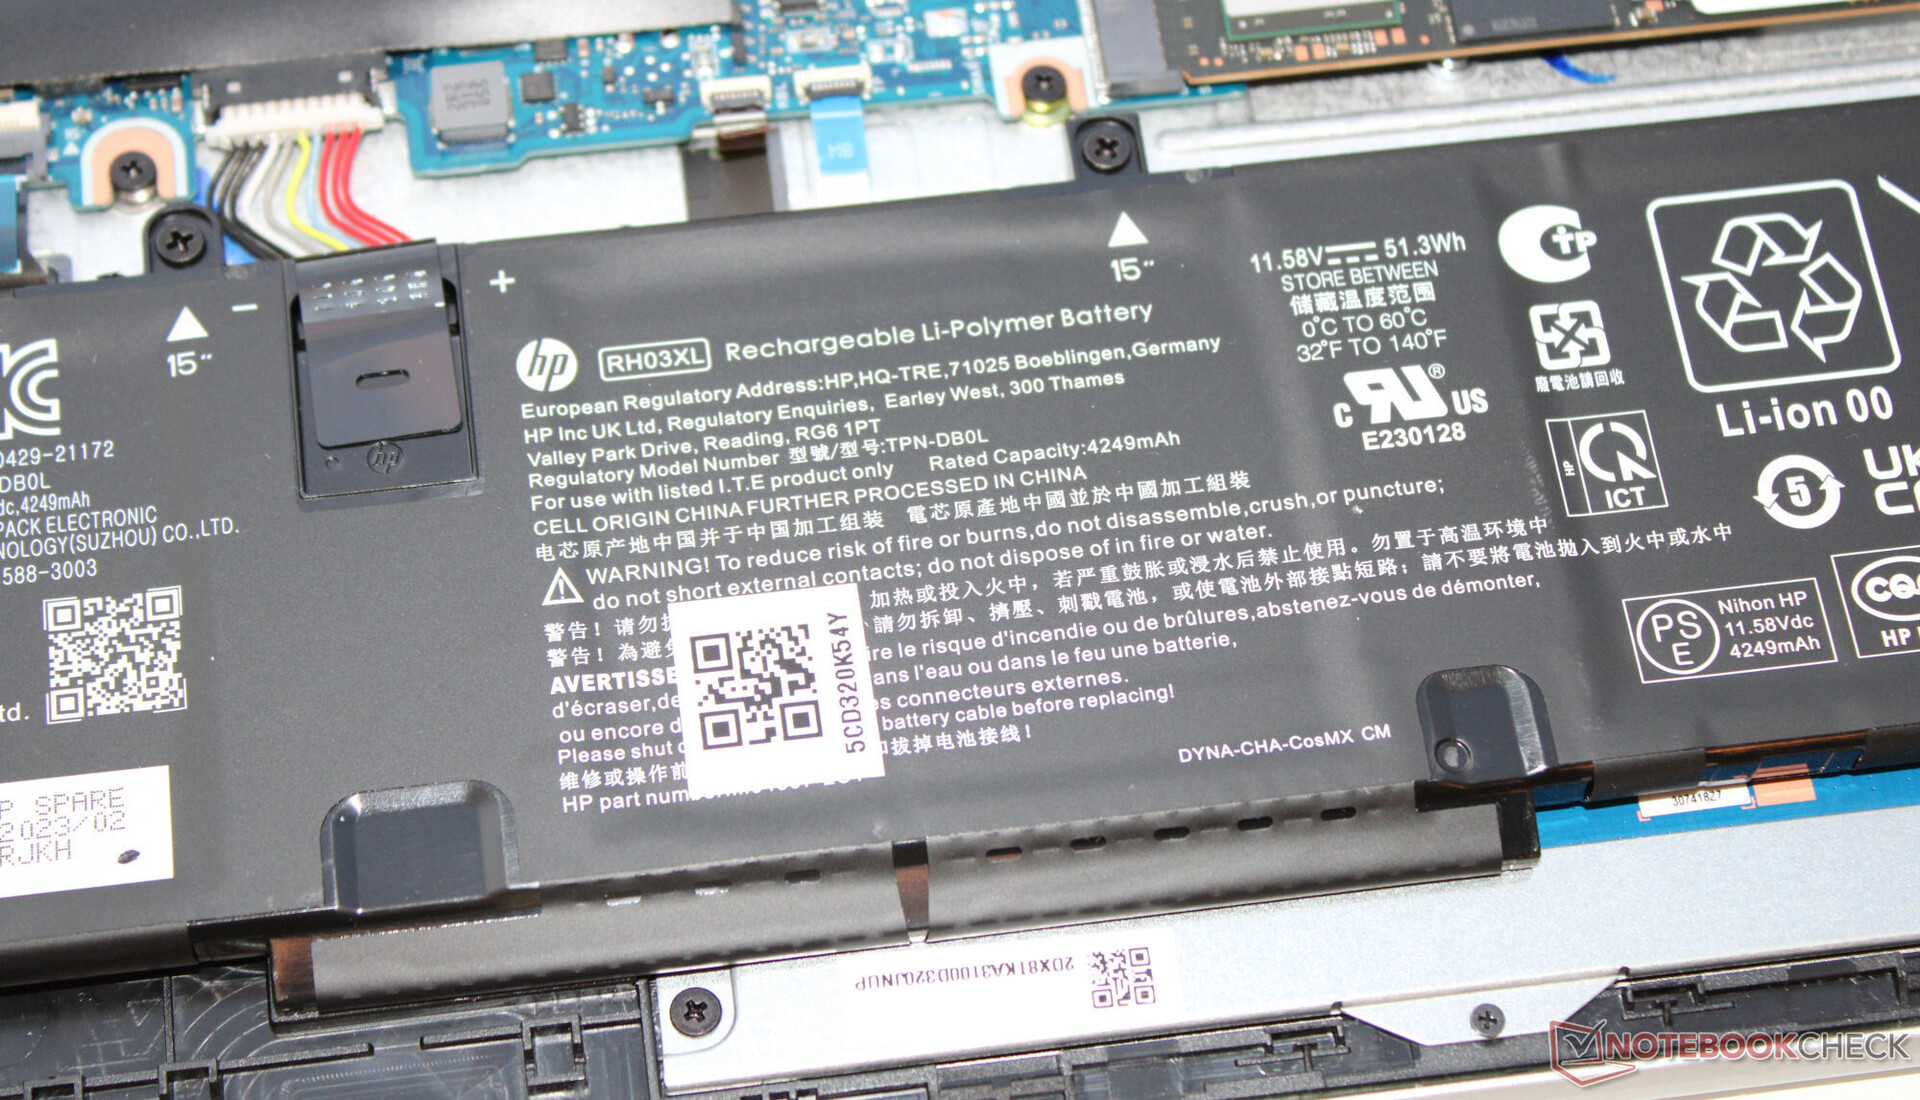
Visualmente, nada ha cambiado en comparación con el predecesor del portátil: HP confía en una carcasa gris plateada, elegante y sencilla (aluminio y plástico) conocida del 450 G9 que presenta superficies mate y lisas. El calor se disipa por la parte trasera de la carcasa. Si tiene la tapa cerrada (por ejemplo, si el portátil está acoplado), puede acumularse algo de calor. Para acceder a la batería (atornillada, no pegada) y al resto del hardware del portátil, tendrá que retirar la placa inferior.
Su construcción no muestra ningún motivo de crítica. No hay huecos ni excesos de material. La unidad base y la tapa pueden torcerse un poco demasiado. Se podría esperar más de un portátil que cuesta tanto. Al presionar la parte posterior de la tapa no se produce ningún cambio de imagen. Las bisagras mantienen la tapa firmemente en su posición hasta su ángulo máximo de apertura (180 grados). Es posible abrir la tapa con una sola mano.

Dentro del campo de comparación, el ProBook tiene un peso relativamente medio para un portátil (alrededor de 1,8 kg). En términos de dimensiones, los dispositivos de 15,6 pulgadas son todos bastante similares. Por supuesto, los competidores de 14 pulgadas son considerablemente más compactos y ligeros.
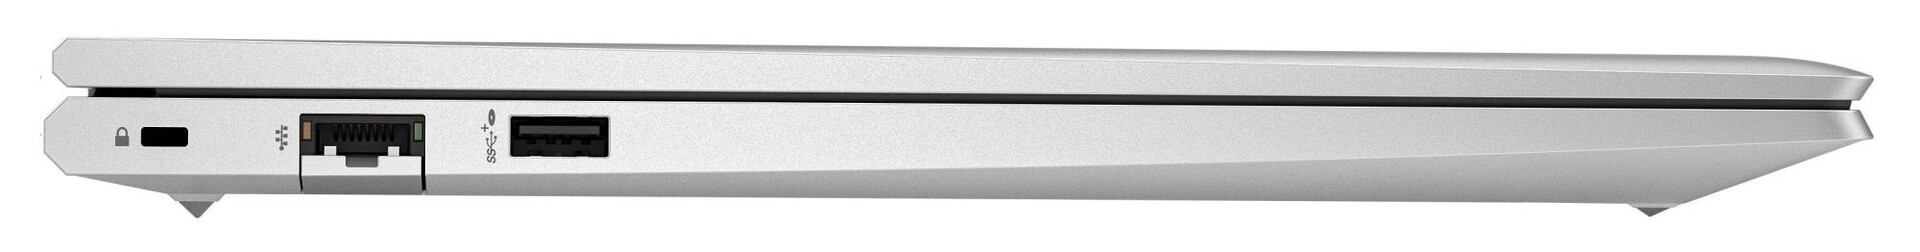
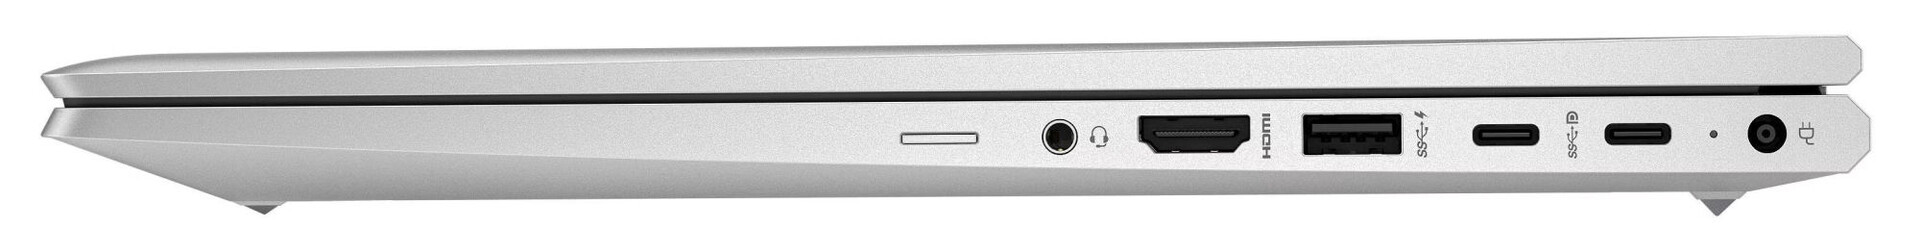
Conectividad - Sin Thunderbolt 4 en el ProBook 450
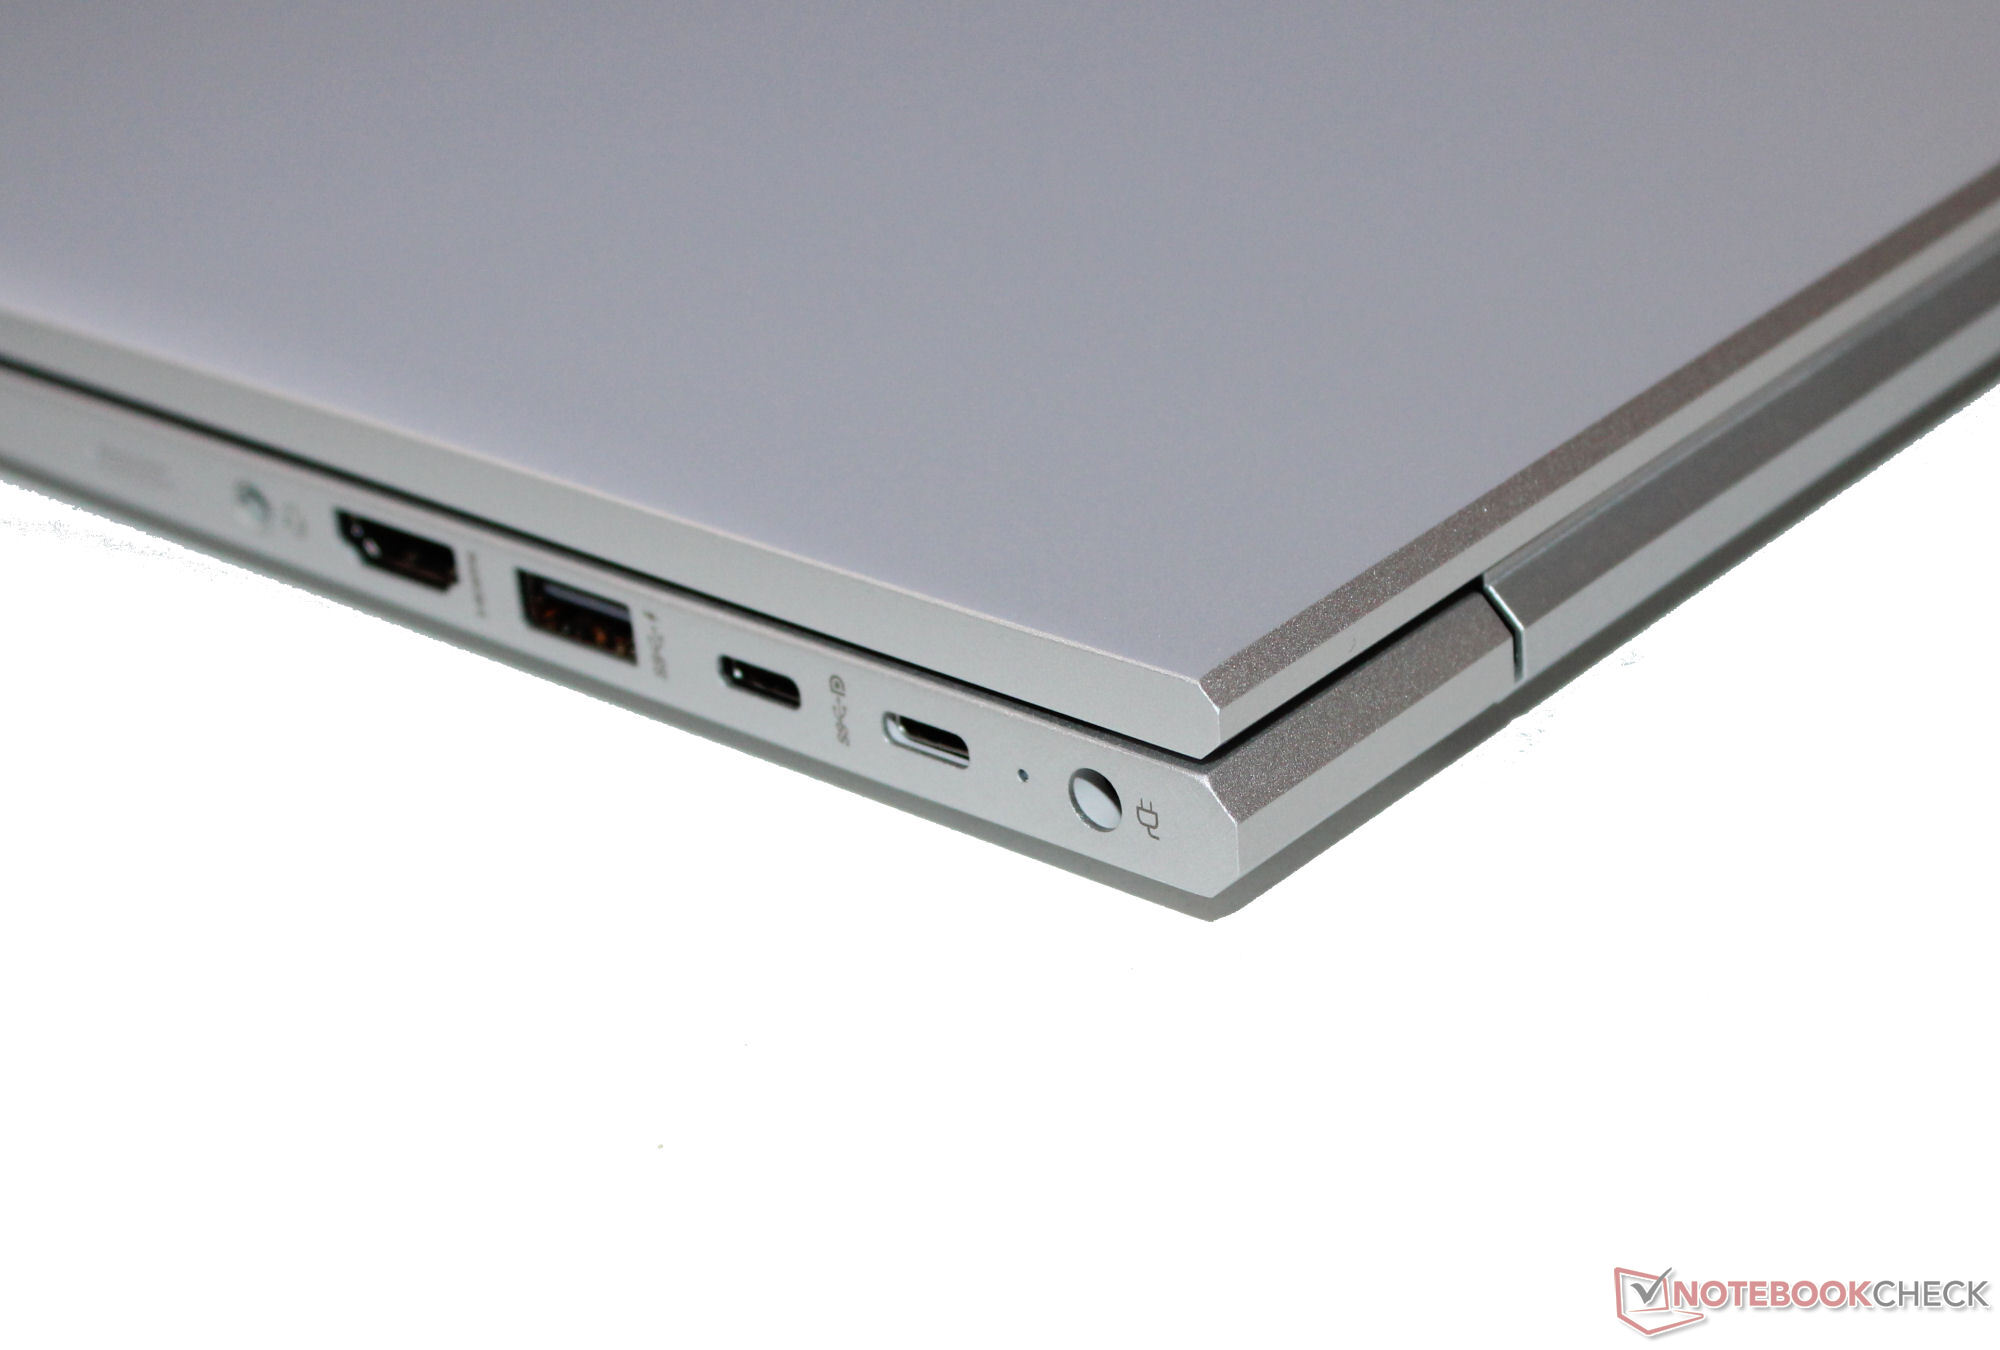
El ProBook cuenta con dos conexiones USB-A (USB 3.2 Gen 1) y dos puertos USB-C (USB 3.2 Gen 2; Power Delivery, DisplayPort). En total, el portátil tiene tres salidas de vídeo (2x DP, 1x HDMI). Una toma de audio combinada y un puerto Gigabit Ethernet completan la configuración. El dispositivo no tiene lector de tarjetas SD.
Comunicación
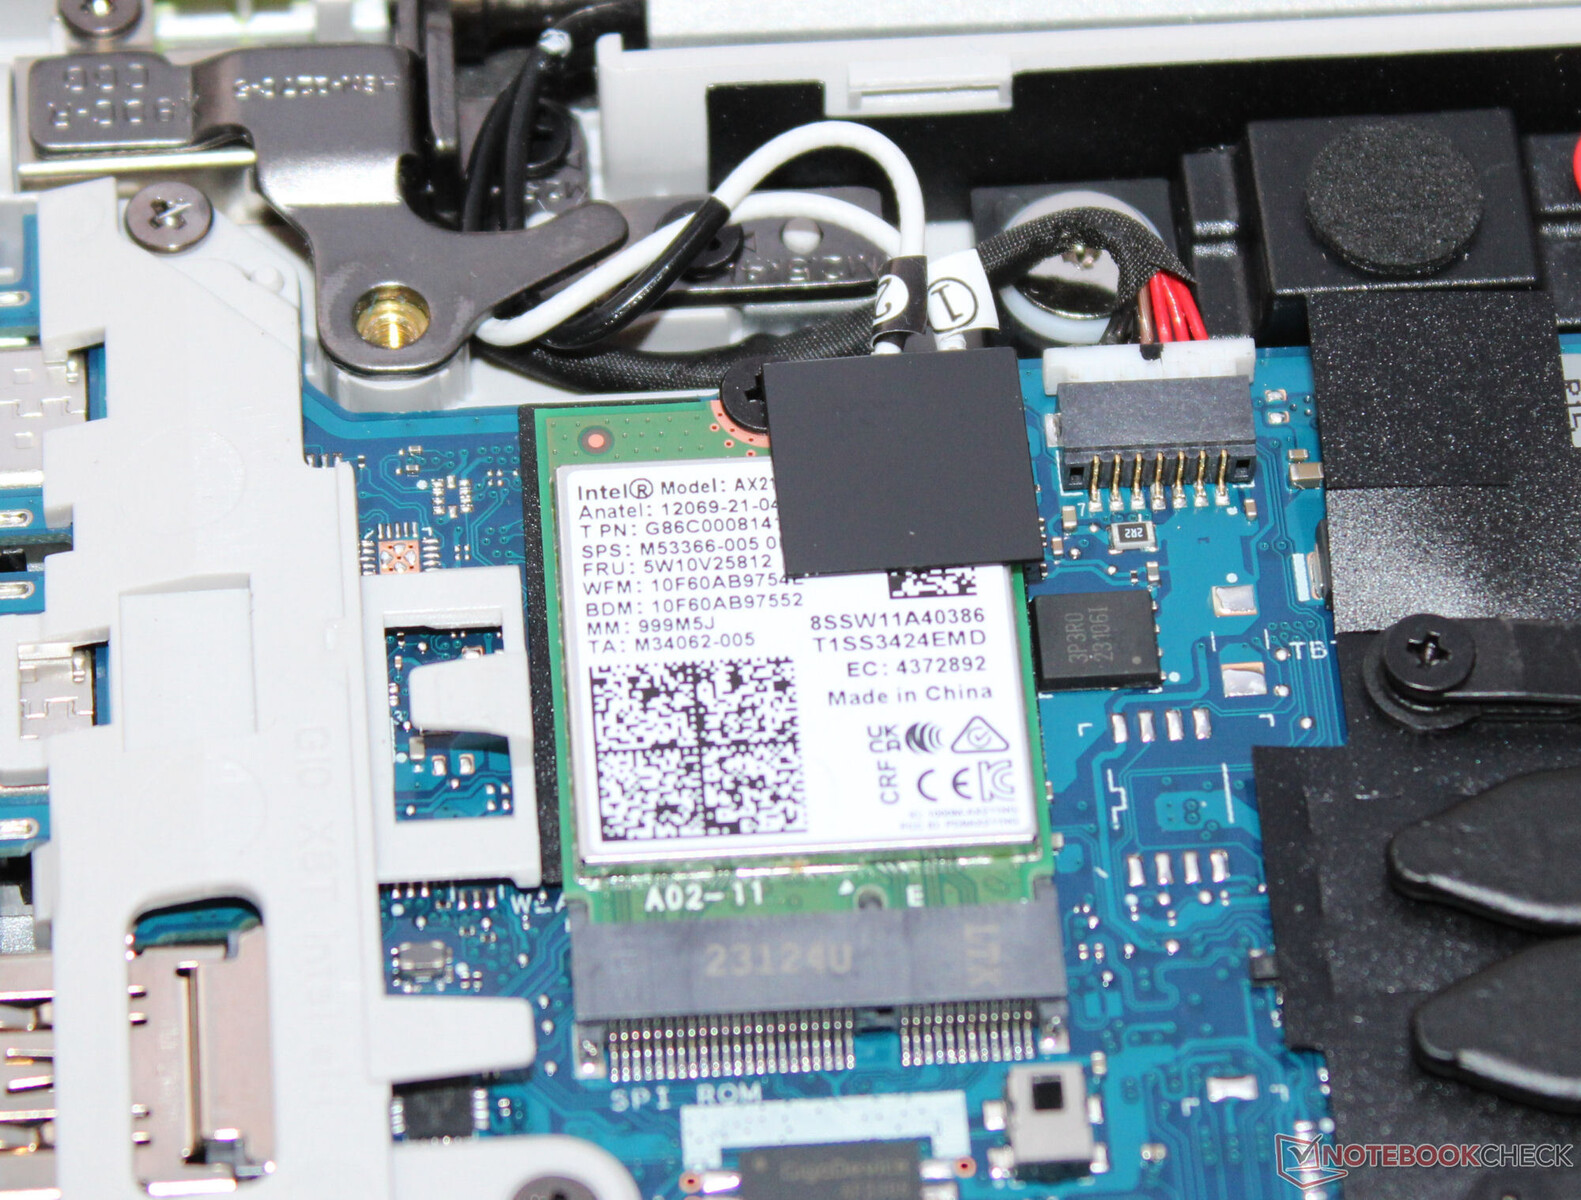
En condiciones óptimas (sin dispositivos WLAN cerca, corta distancia entre el portátil y el PC servidor), alcanza muy buenas velocidades de transmisión de datos WiFi. El 450 utiliza un chip WiFi 6E (Intel AX211). De las conexiones por cable se encarga un controlador (RTL8168/8111; 1 GBit/s) fabricado por Realtek.
El presente dispositivo de pruebas no cuenta con un módem LTE/5G, ni puede equiparse con uno. Tampoco tiene antena ni lector de tarjetas SIM. Si necesita esto, tendrá que optar por otro modelo del ProBook. En general, la serie ofrece soporte WWAN.
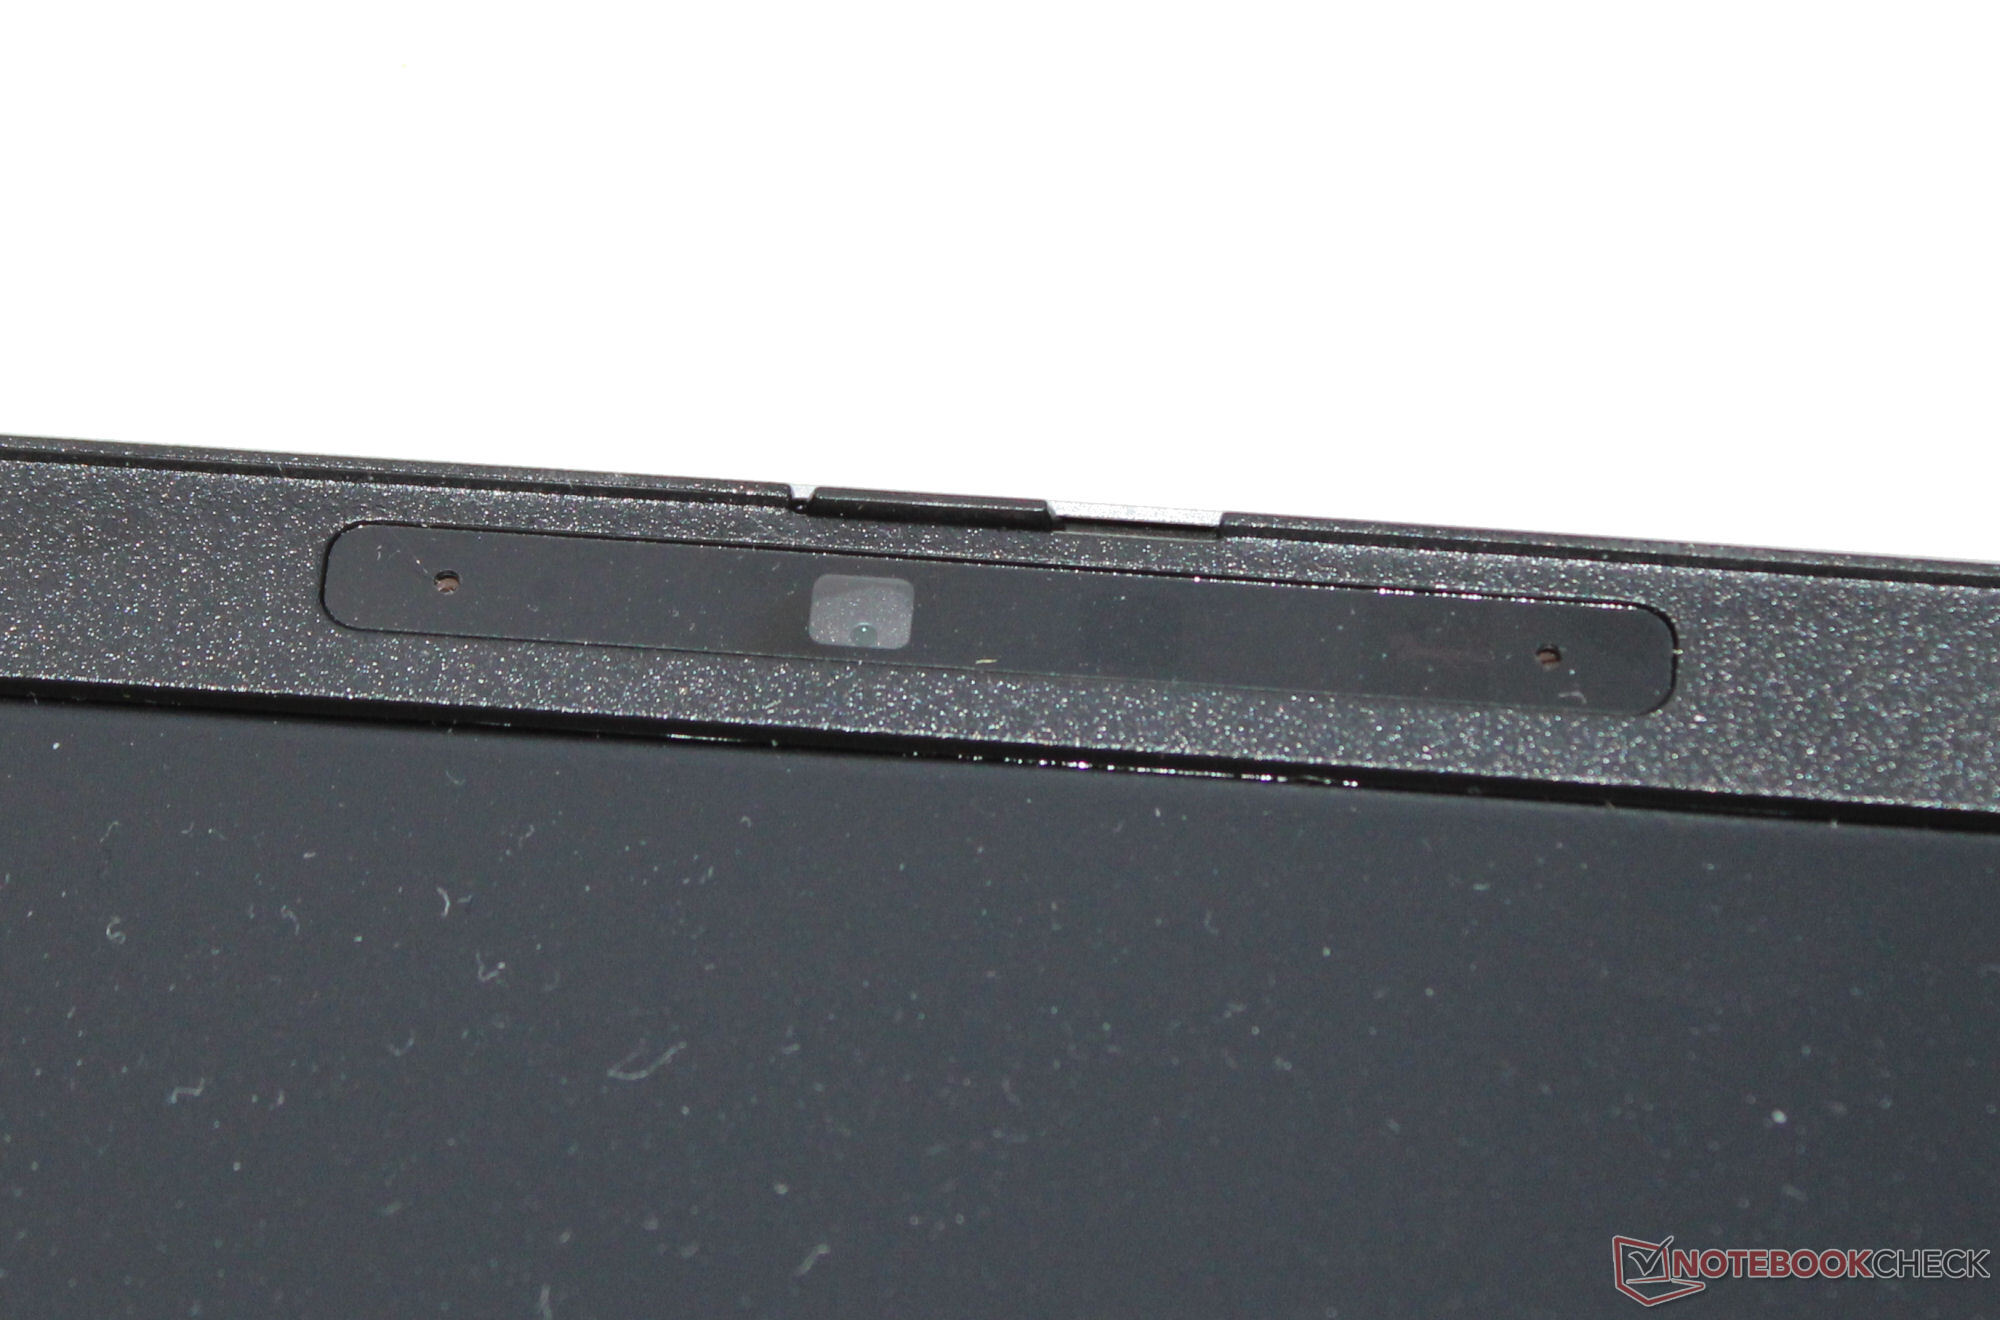
Cámara web
HP se adapta a la continua tendencia hacia las videoconferencias y las reuniones con Zoom con una webcam de 5 MP (máx. 2.560 x 1.440 píxeles, infrarrojos). No es probable que produzca ninguna obra de arte: la calidad de imagen es media en el mejor de los casos. Además: Con una desviación de color de casi 20, se pierde por mucho el objetivo (DeltaE < 3). Positivo: La cámara tiene una cubierta mecánica.


Seguridad
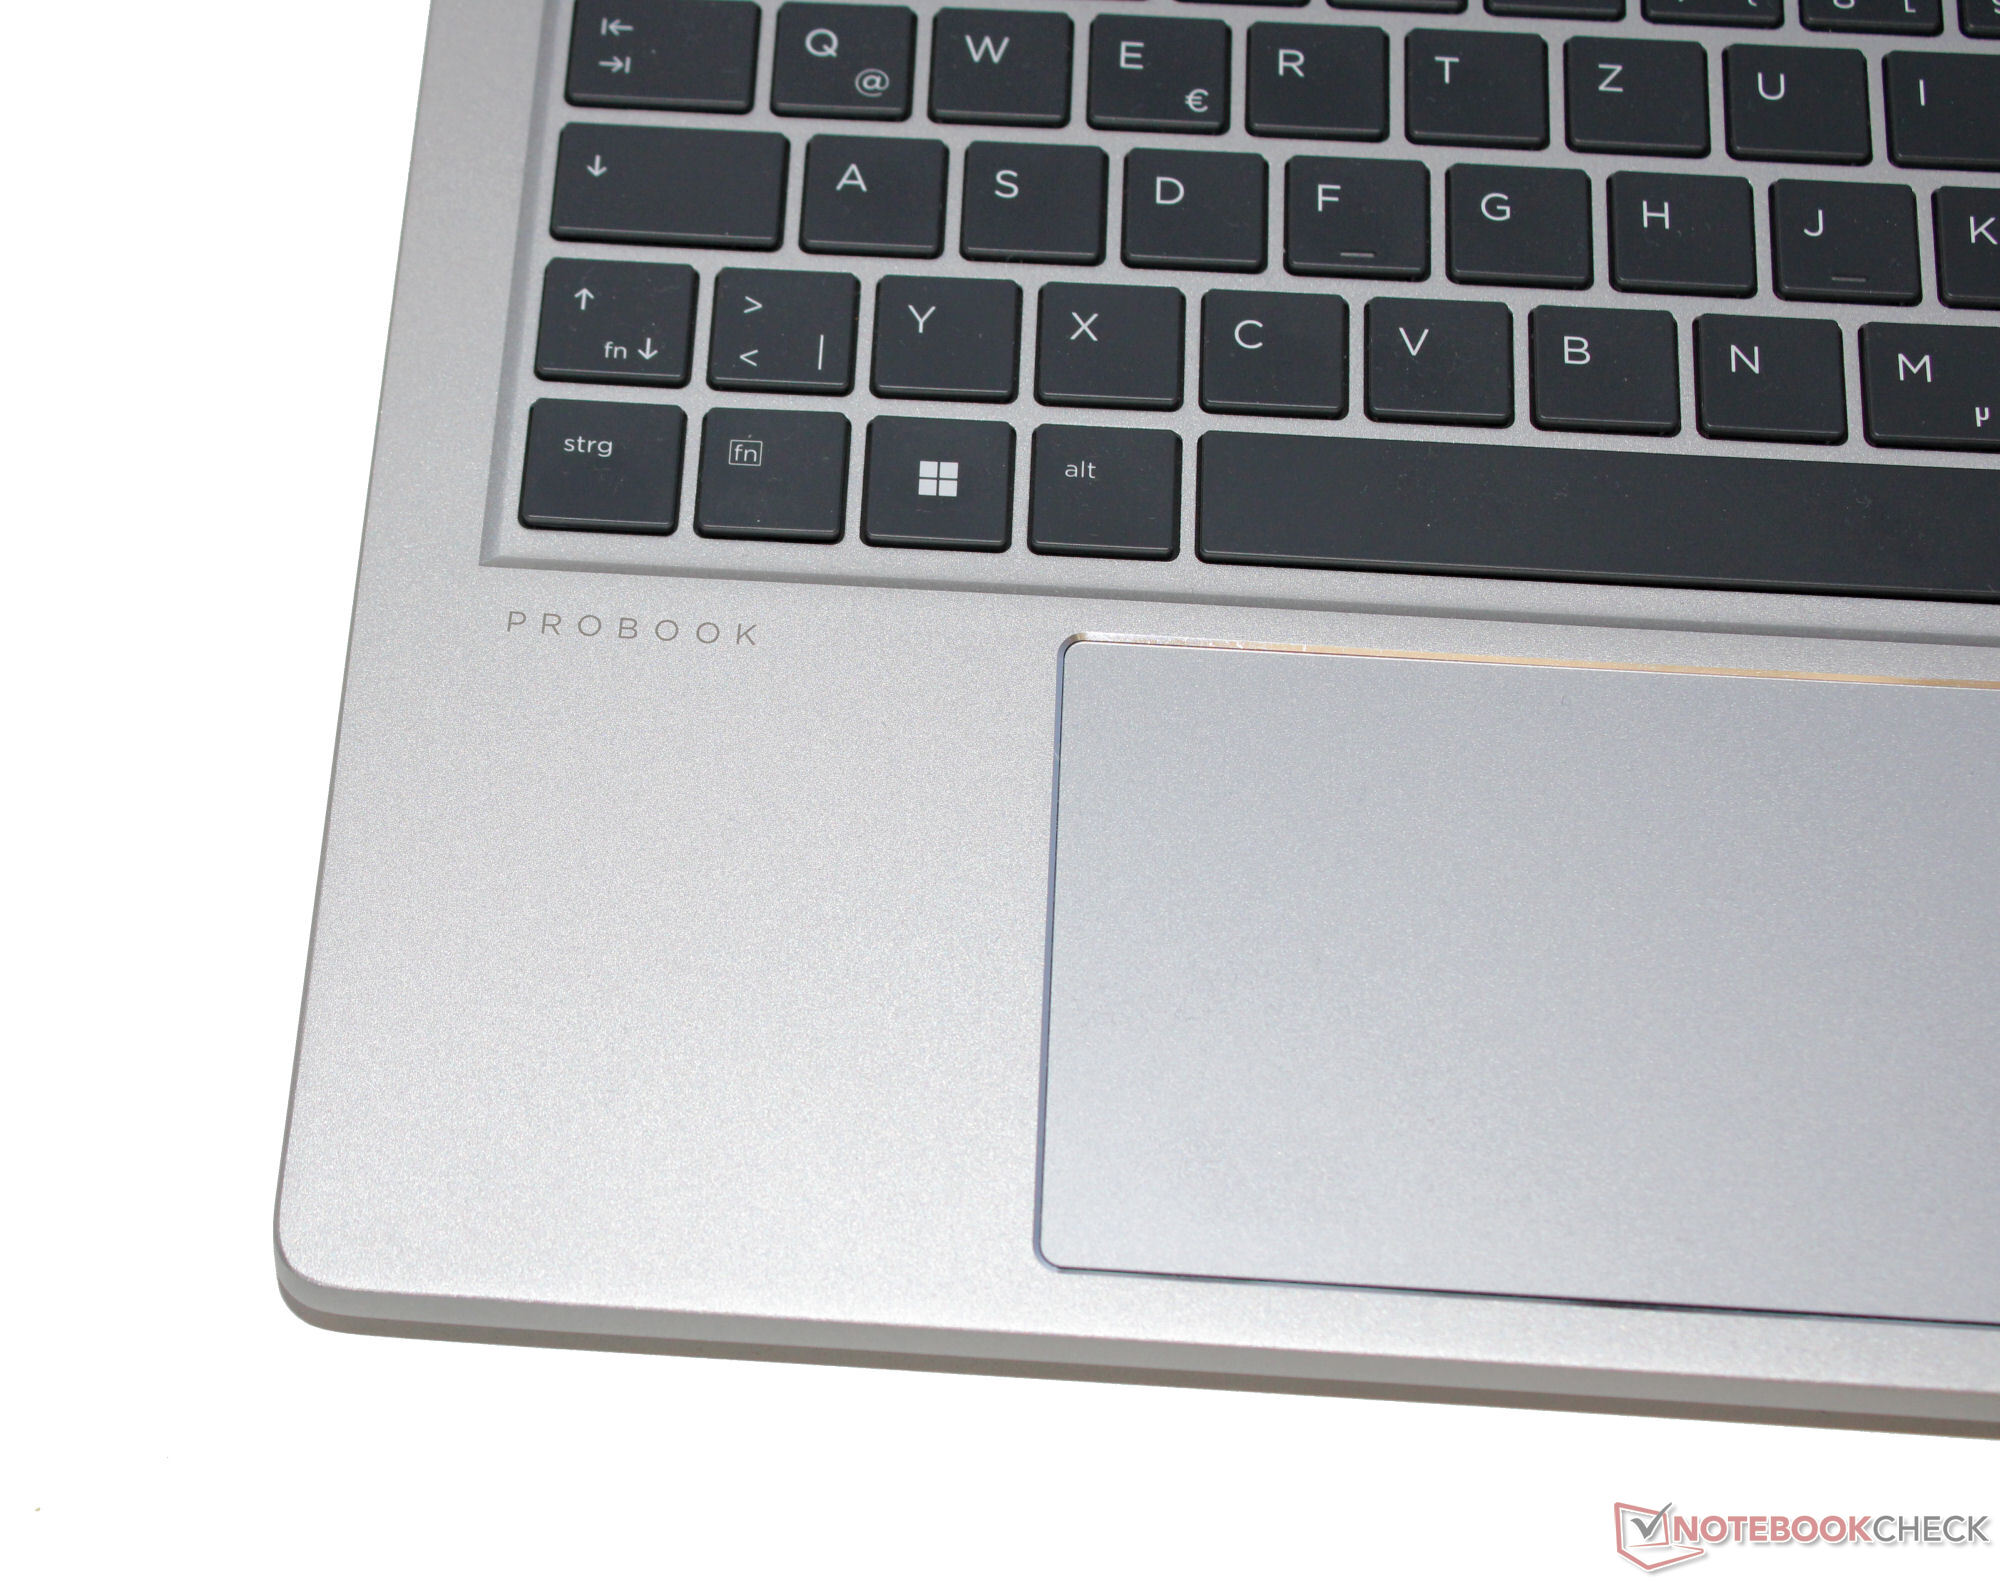
El portátil permite la seguridad de acceso mediante huella dactilar y Windows Hello. También hay un módulo de plataforma de confianza (2.0) a bordo. El dispositivo puede asegurarse físicamente mediante un candado de cable. En cuanto al software, existen varias aplicaciones propiedad de HP, como HP Sure Run (que supervisa las aplicaciones en busca de ataques) y HP Wolf Security for Business (que protege los dispositivos finales de los ataques).
Accesorios
Aparte de los documentos habituales (información sobre la garantía, póster de inicio rápido), la 450 no viene con ningún accesorio adicional.
Mantenimiento
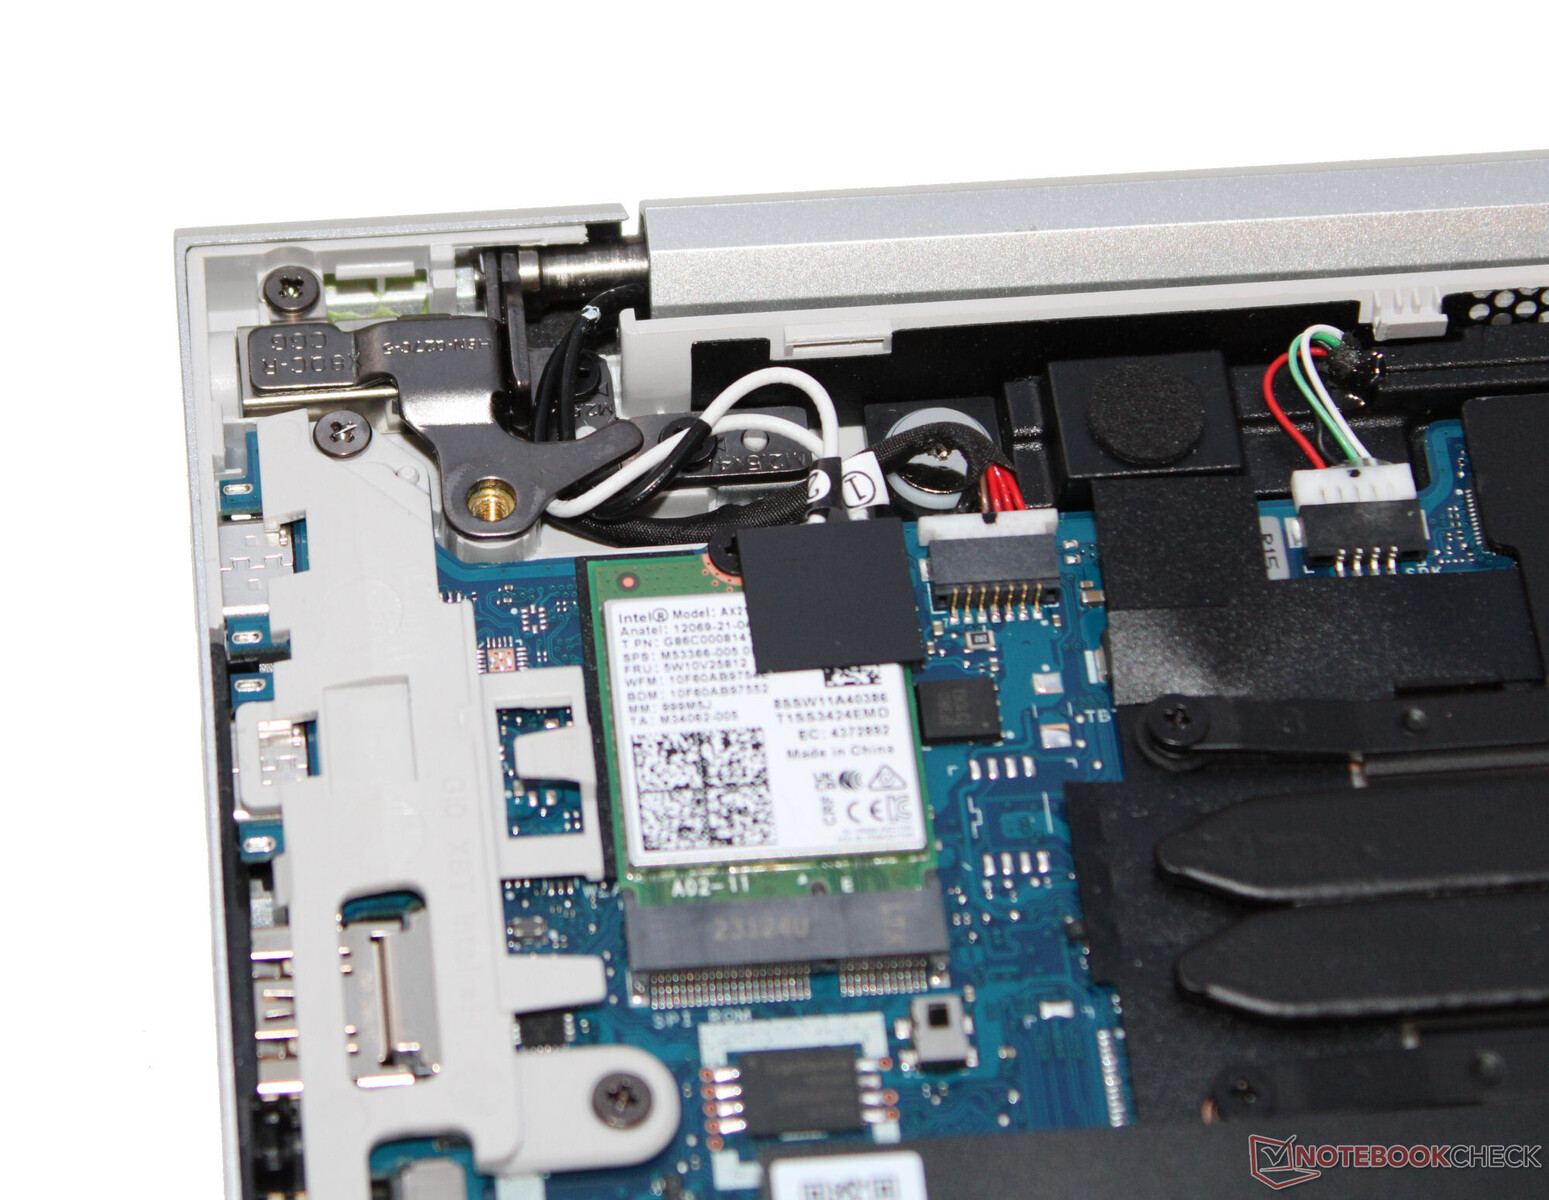
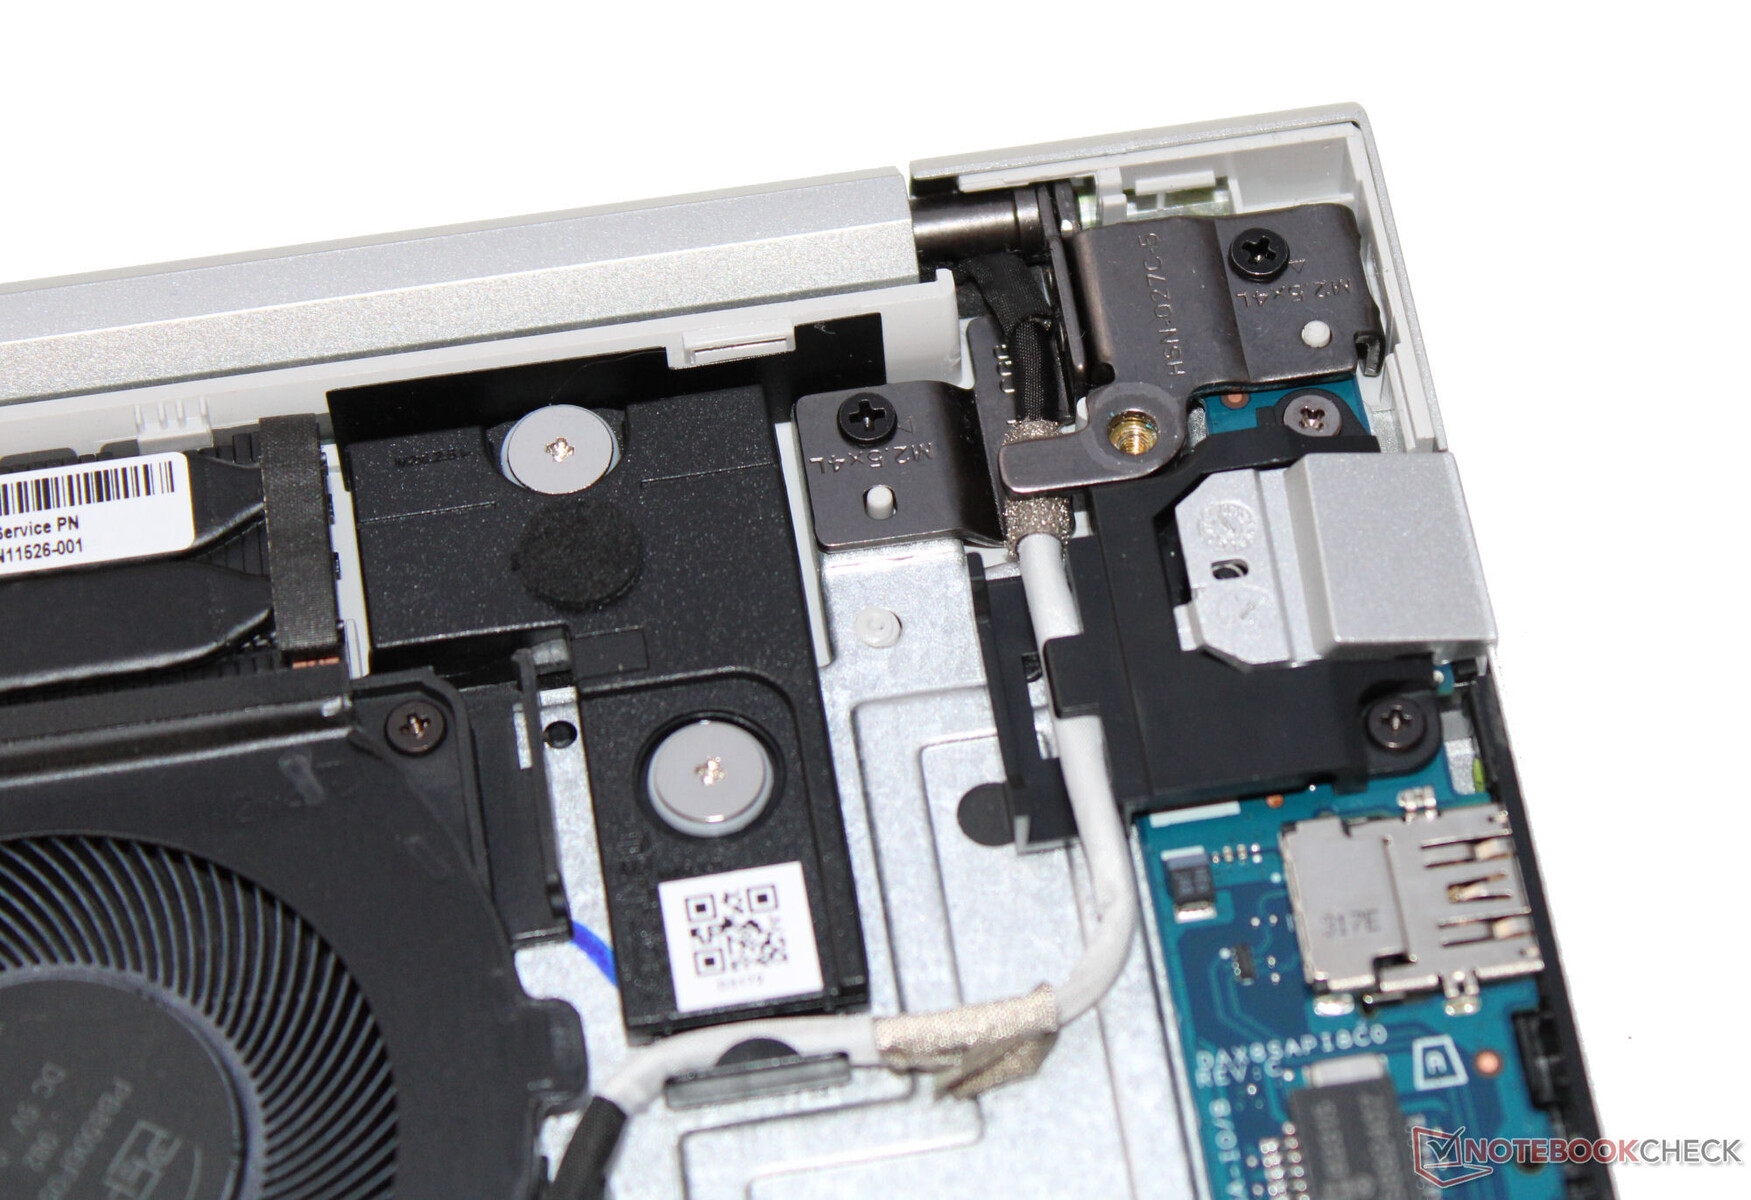
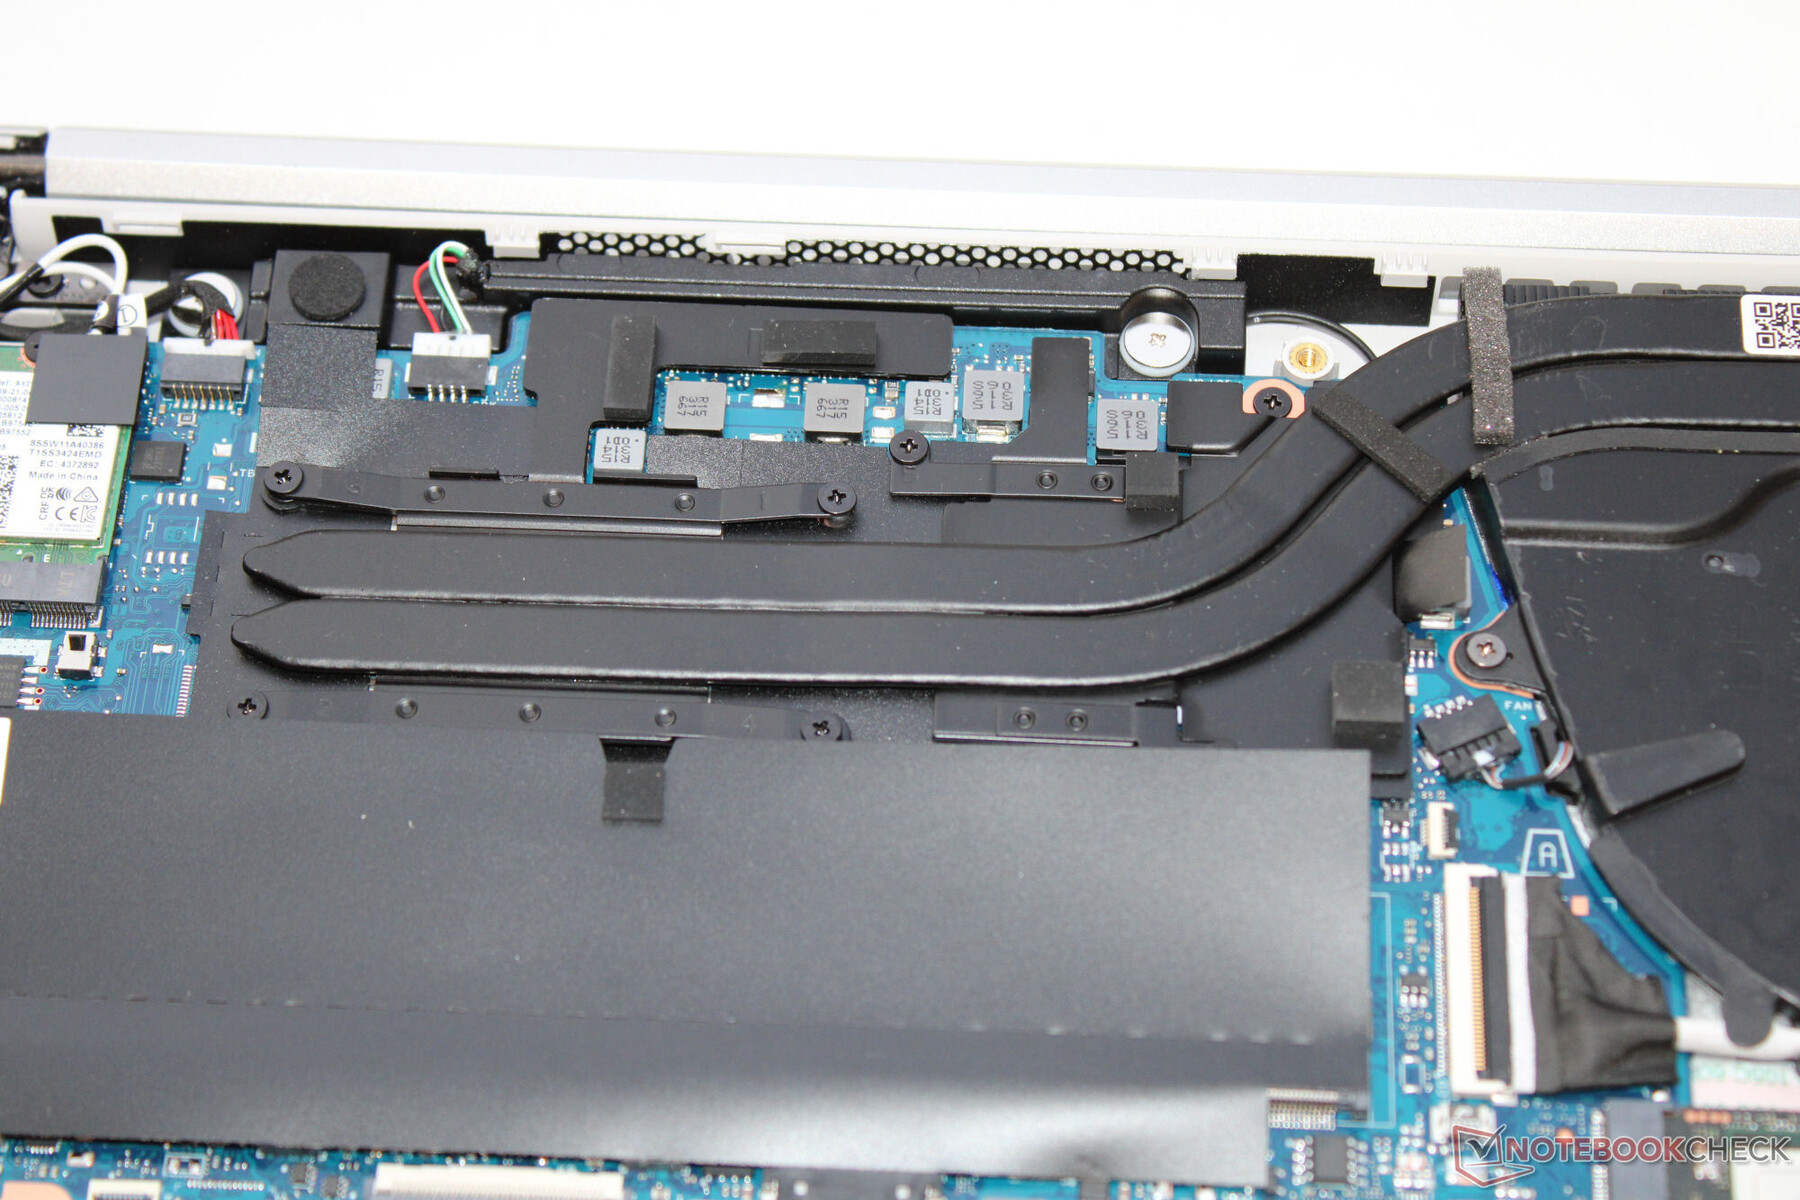
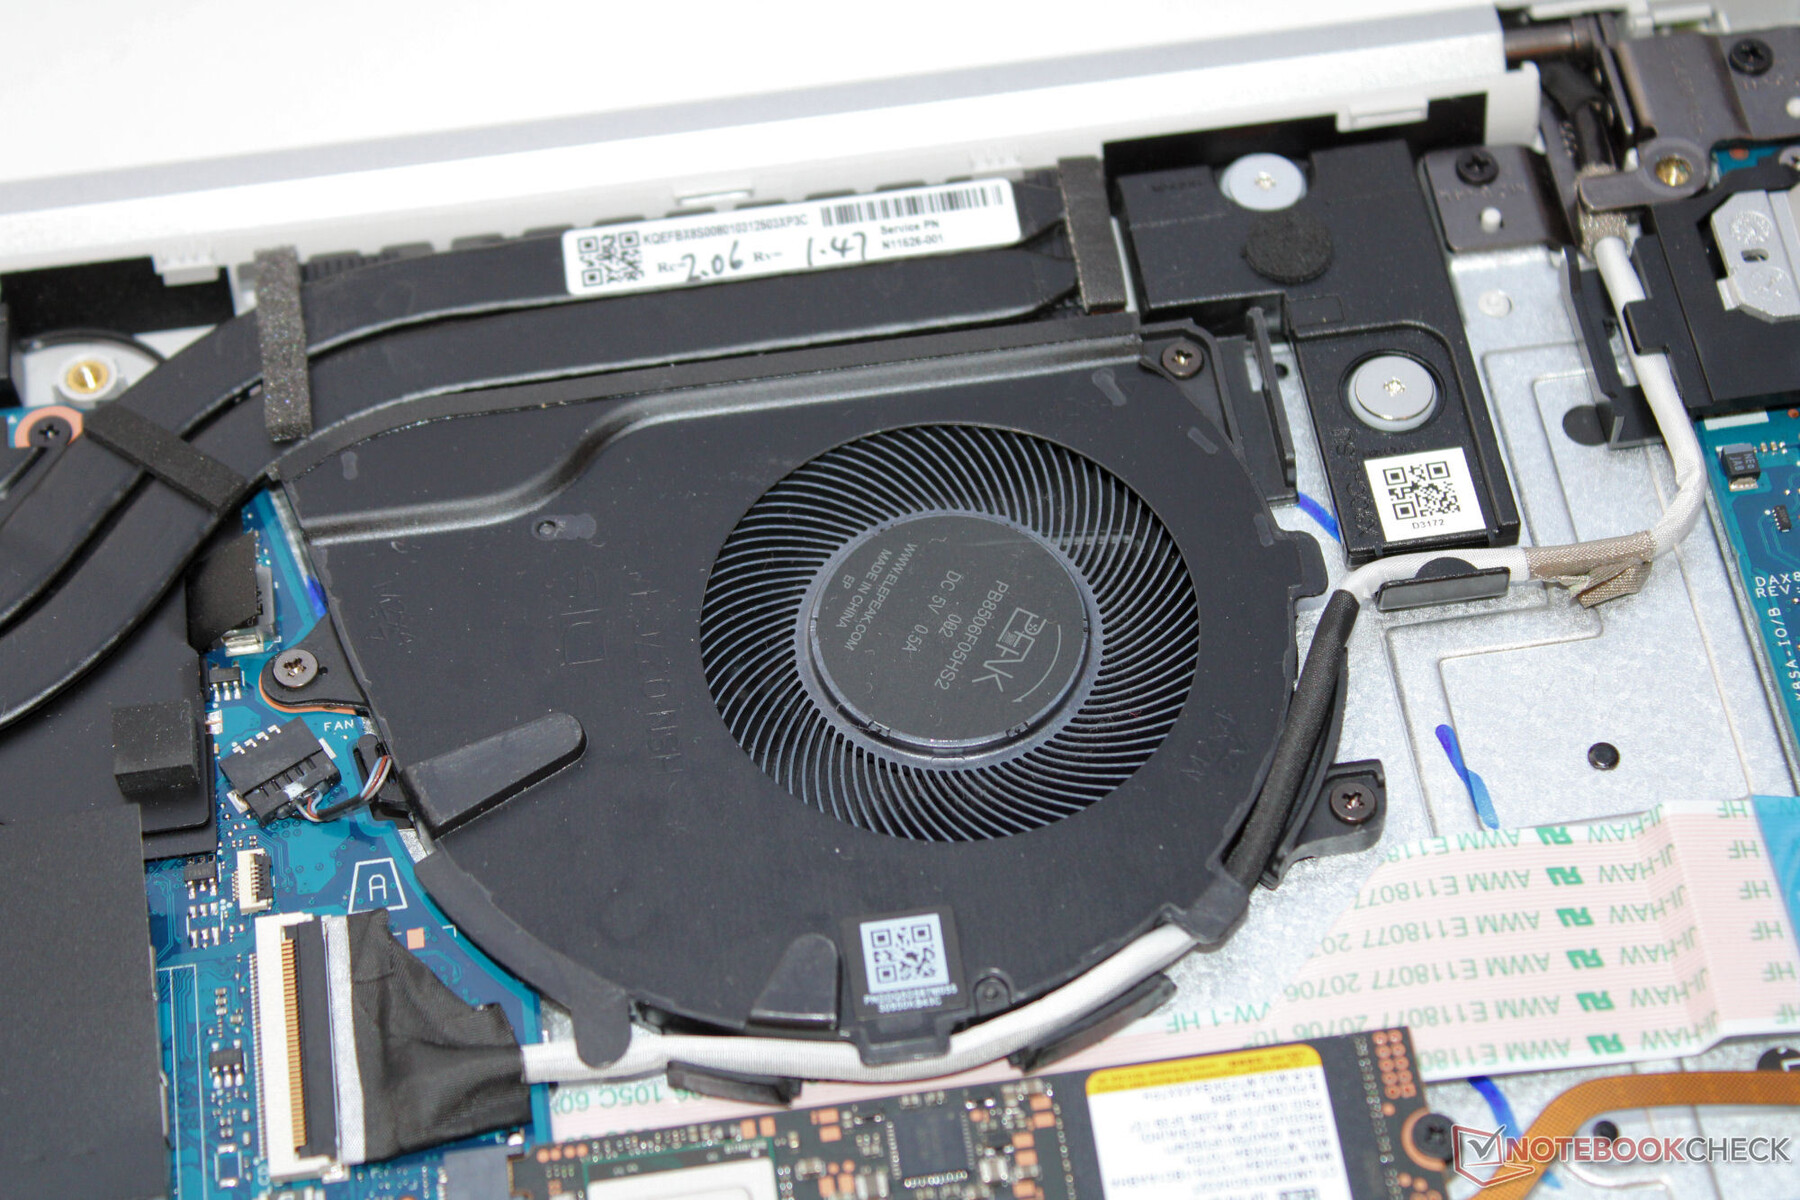
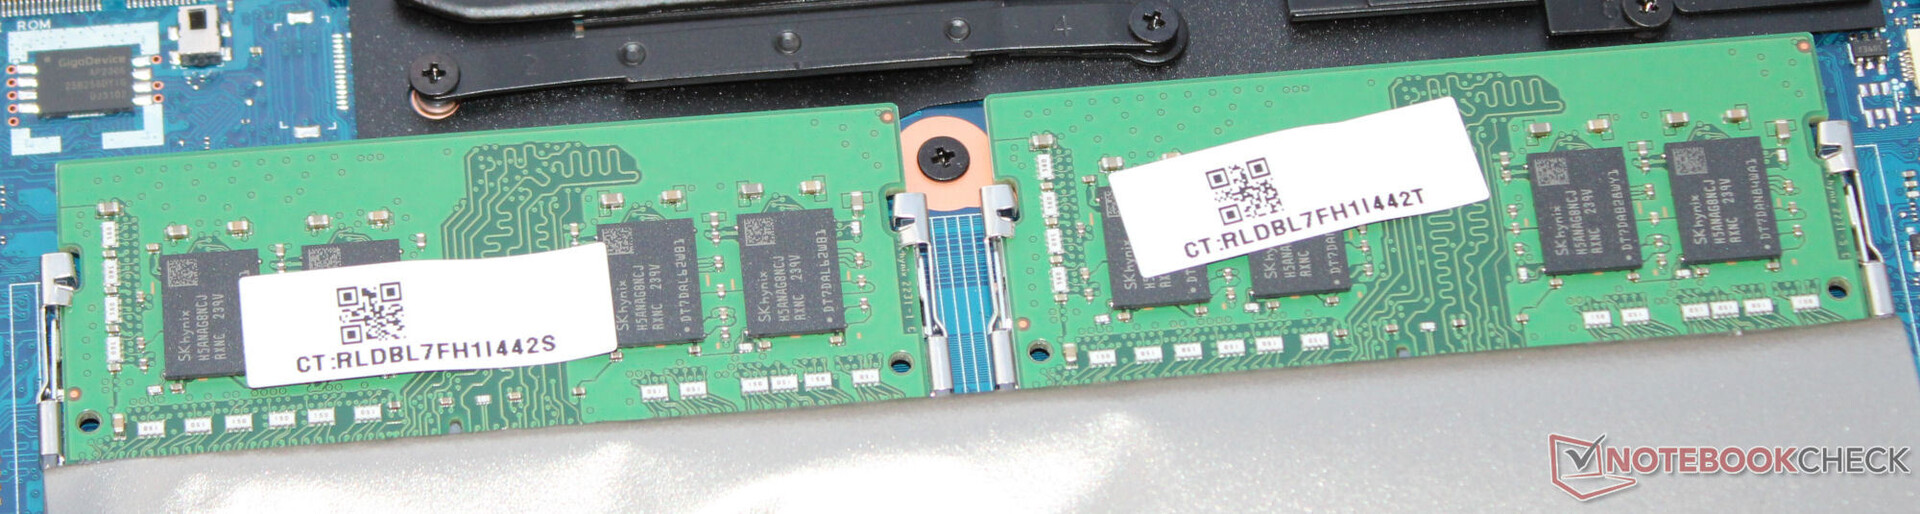
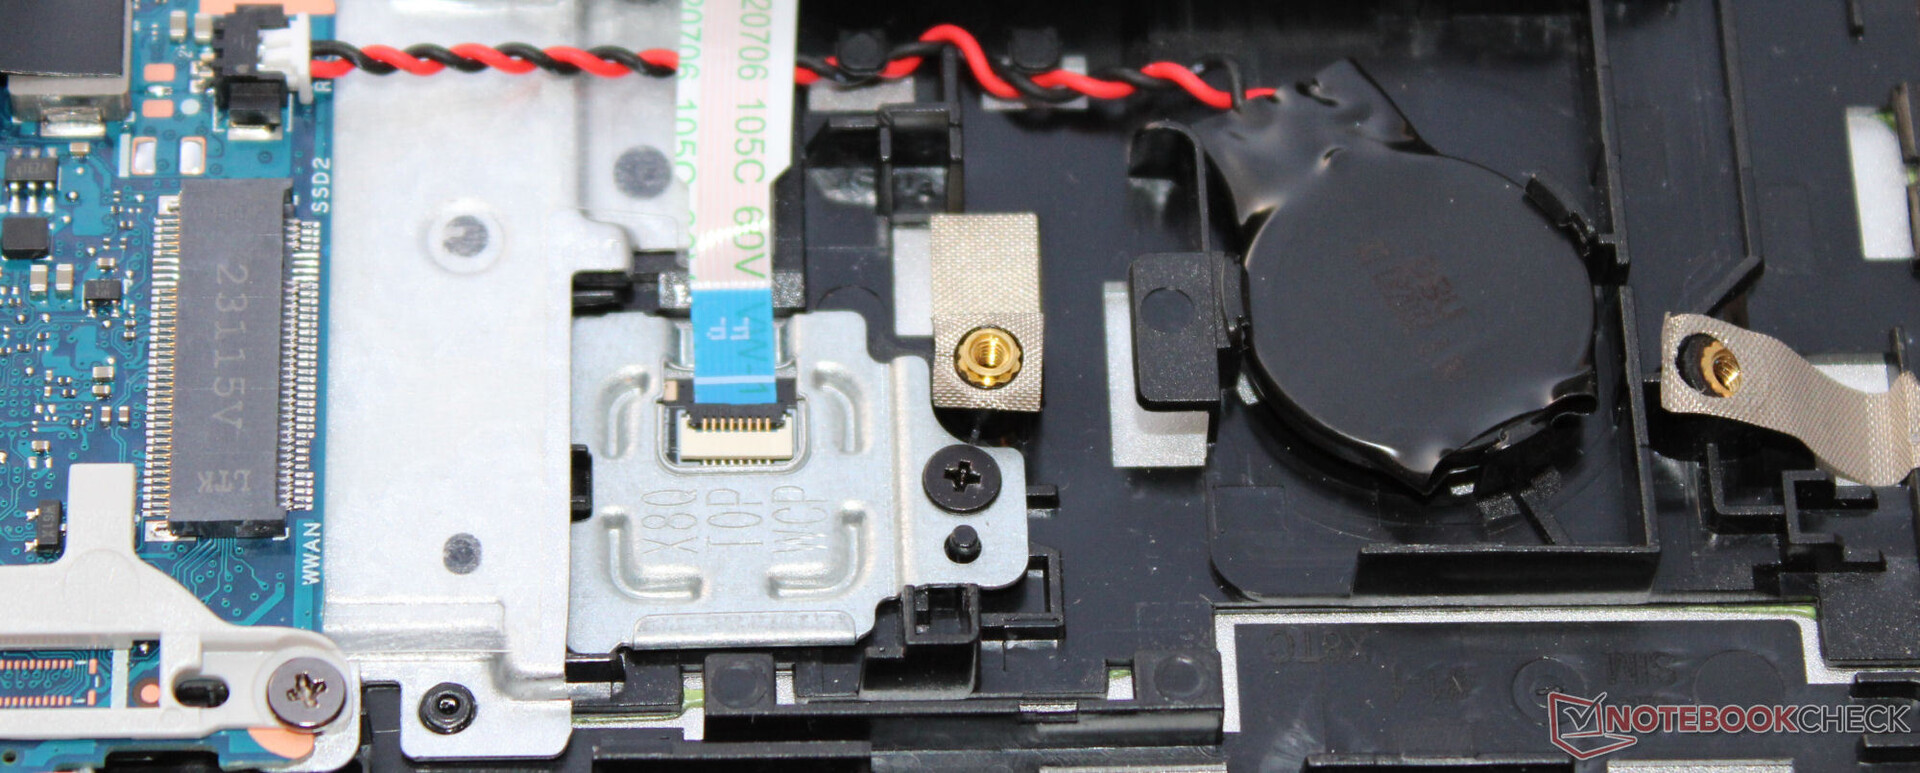
Tras retirar los cinco tornillos de la parte inferior (la tira de goma no oculta ningún tornillo adicional), puede retirar la placa inferior con la ayuda de una espátula o una púa. Entonces podrá acceder a la unidad SSD (PCIe 4), la segunda ranura SSD (M.2-2242 o M.2-2230 con la extensión correspondiente), el módulo WLAN, los bancos de memoria, la batería, los altavoces, los ventiladores y la batería de la BIOS.
A diferencia de los modelos ProBook anteriores Análisis del HP ProBook 450 G5 (i5-8250U, FHD) , el teclado del G10 no puede sustituirse sin más. Para ello, tendría que sustituir la parte superior de la carcasa, lo que requeriría desmontar todo el portátil.
Garantía
En EE.UU., el ProBook tiene una garantía limitada de un año. Existen opciones para ampliarla a través de la página web de HP por un recargo.
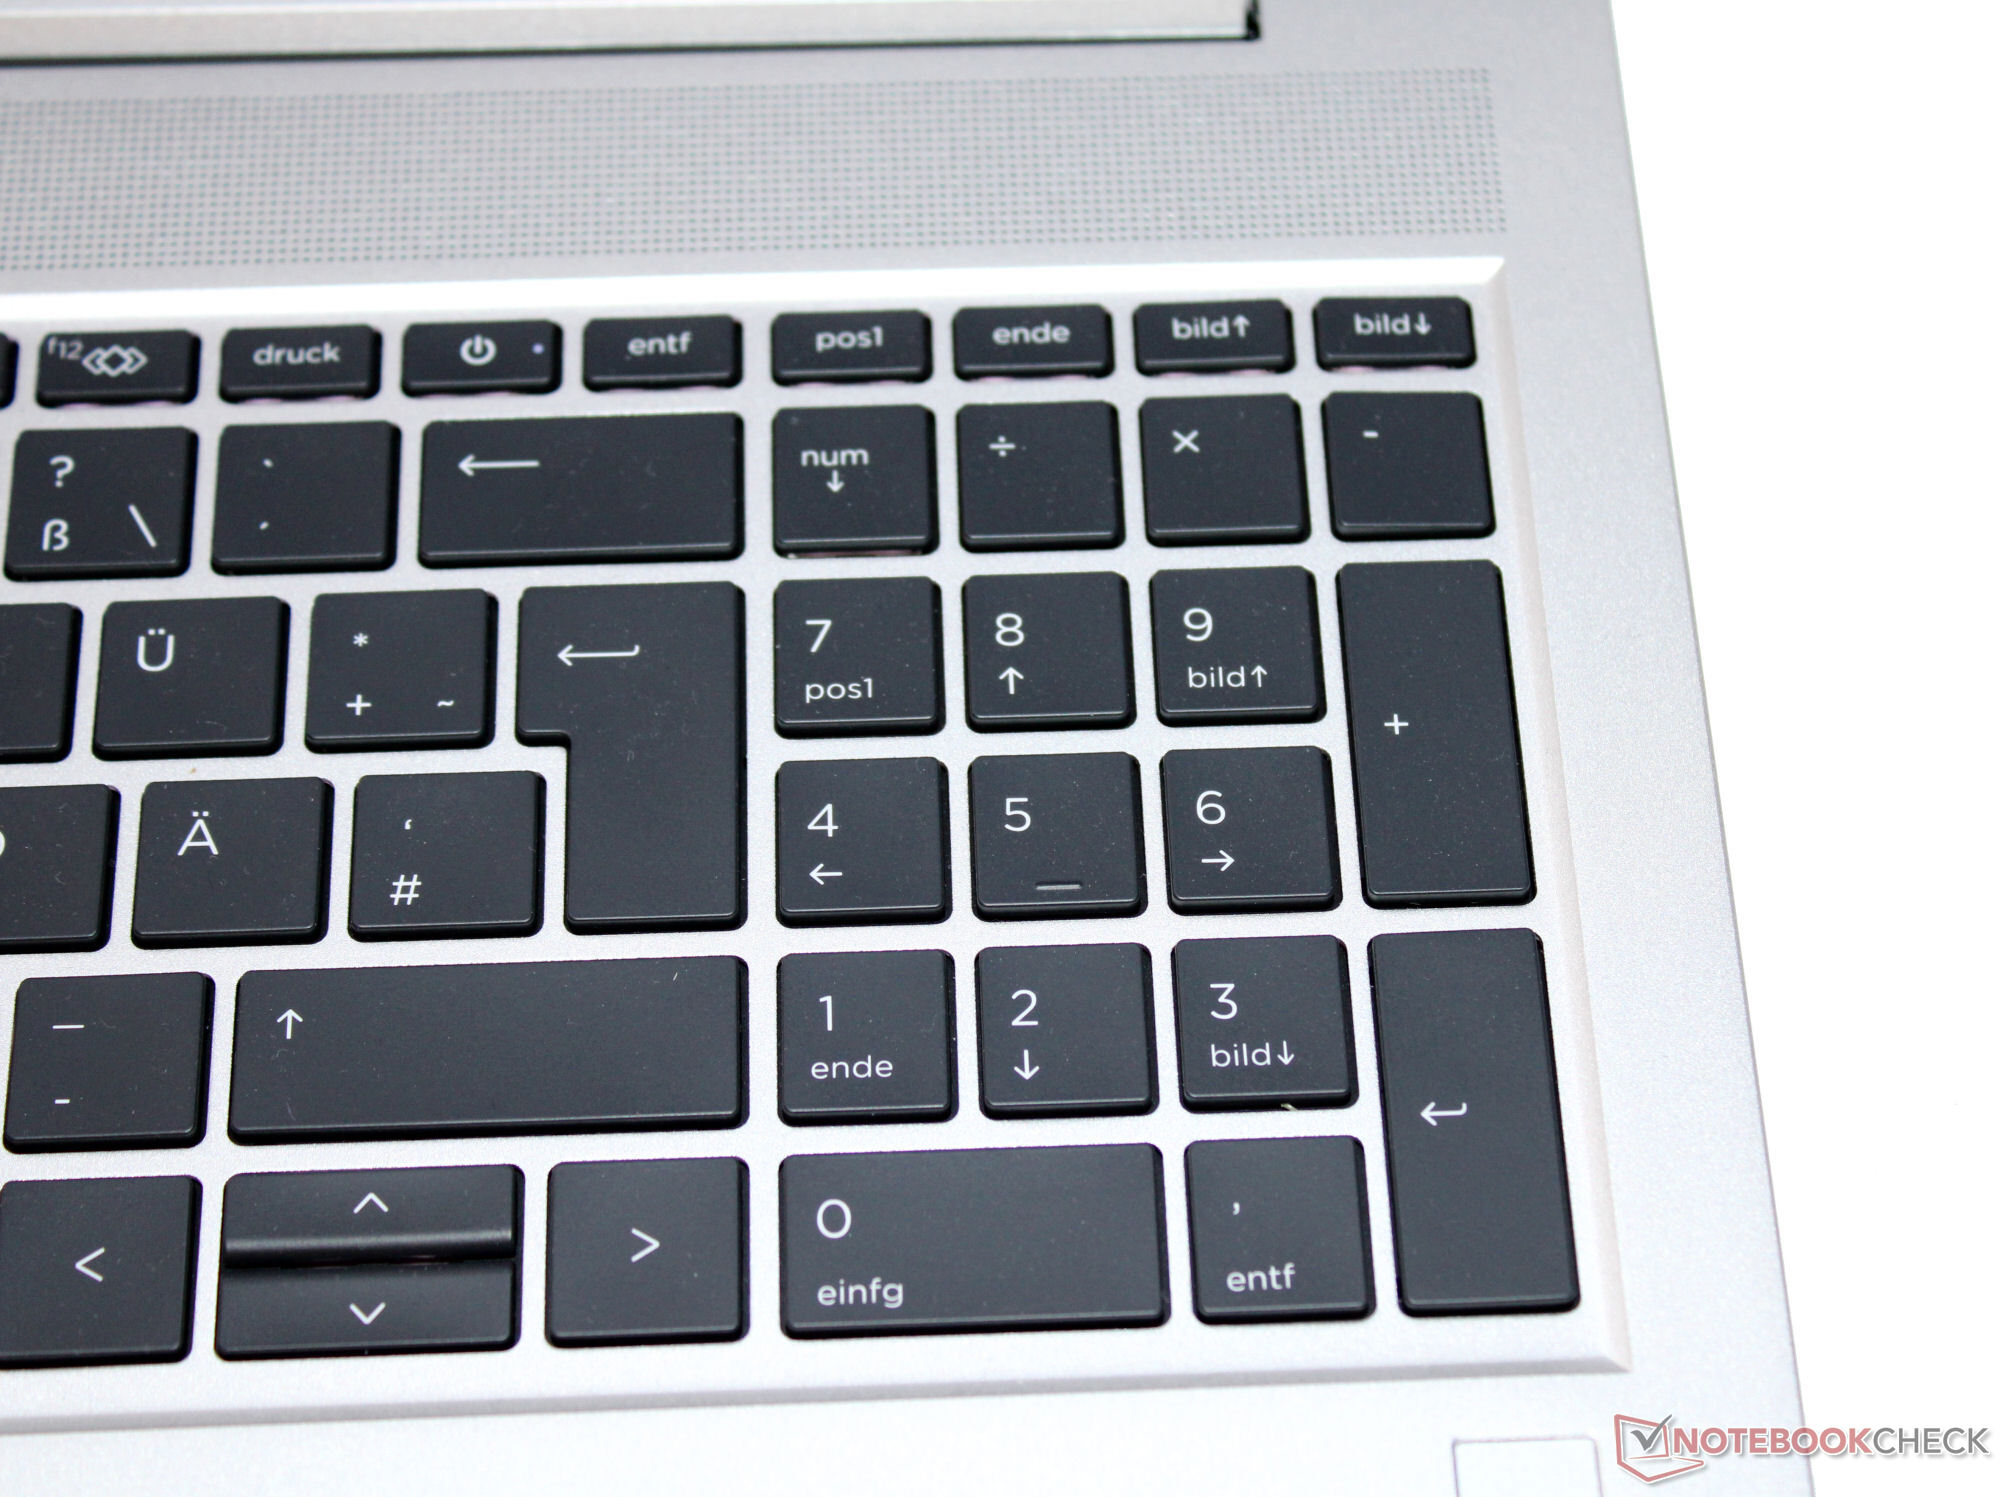
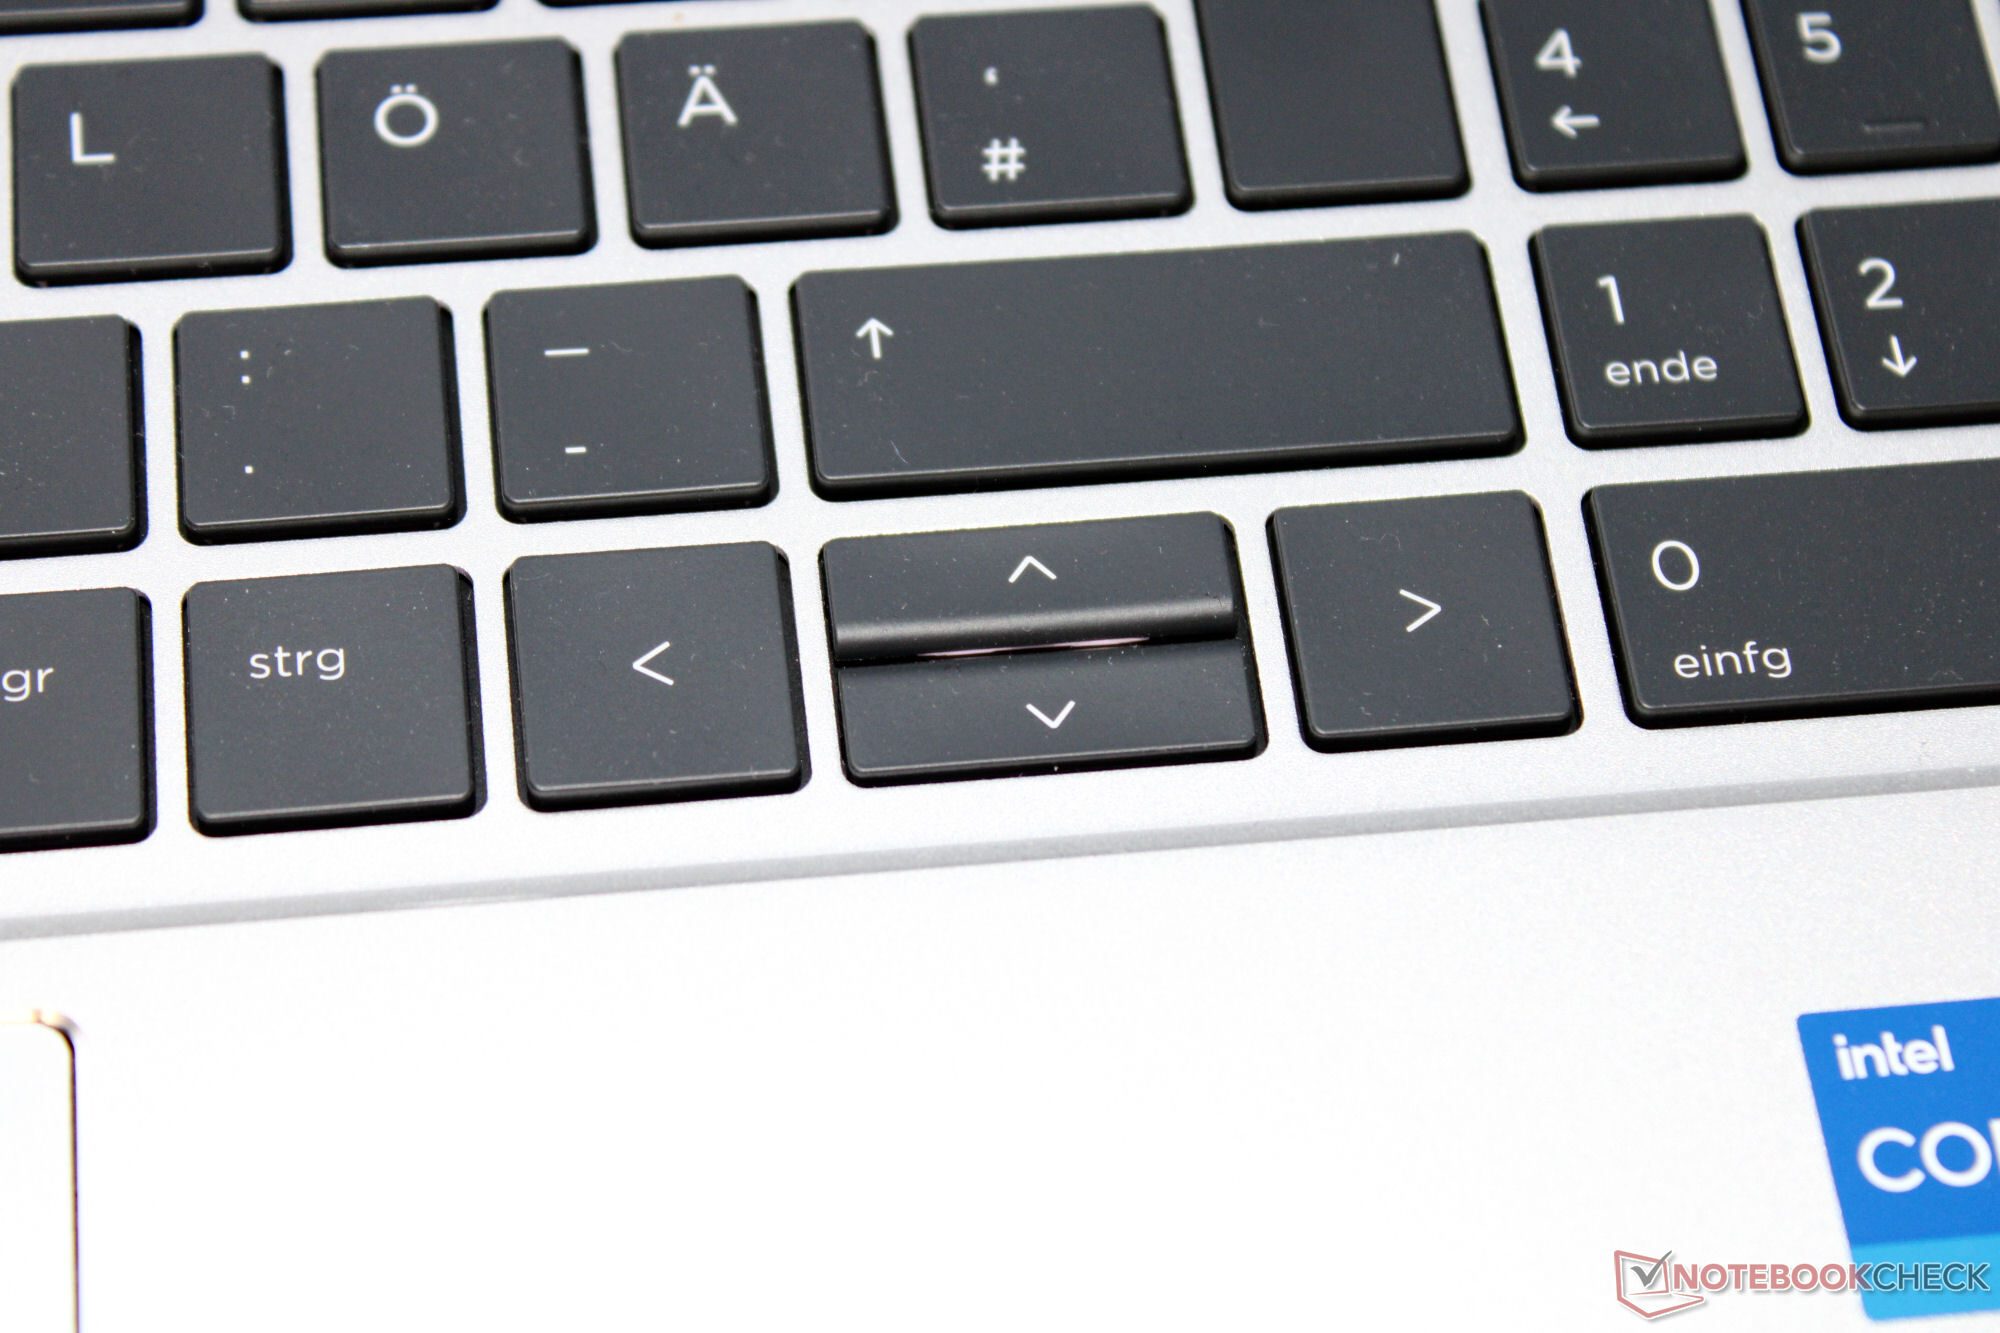
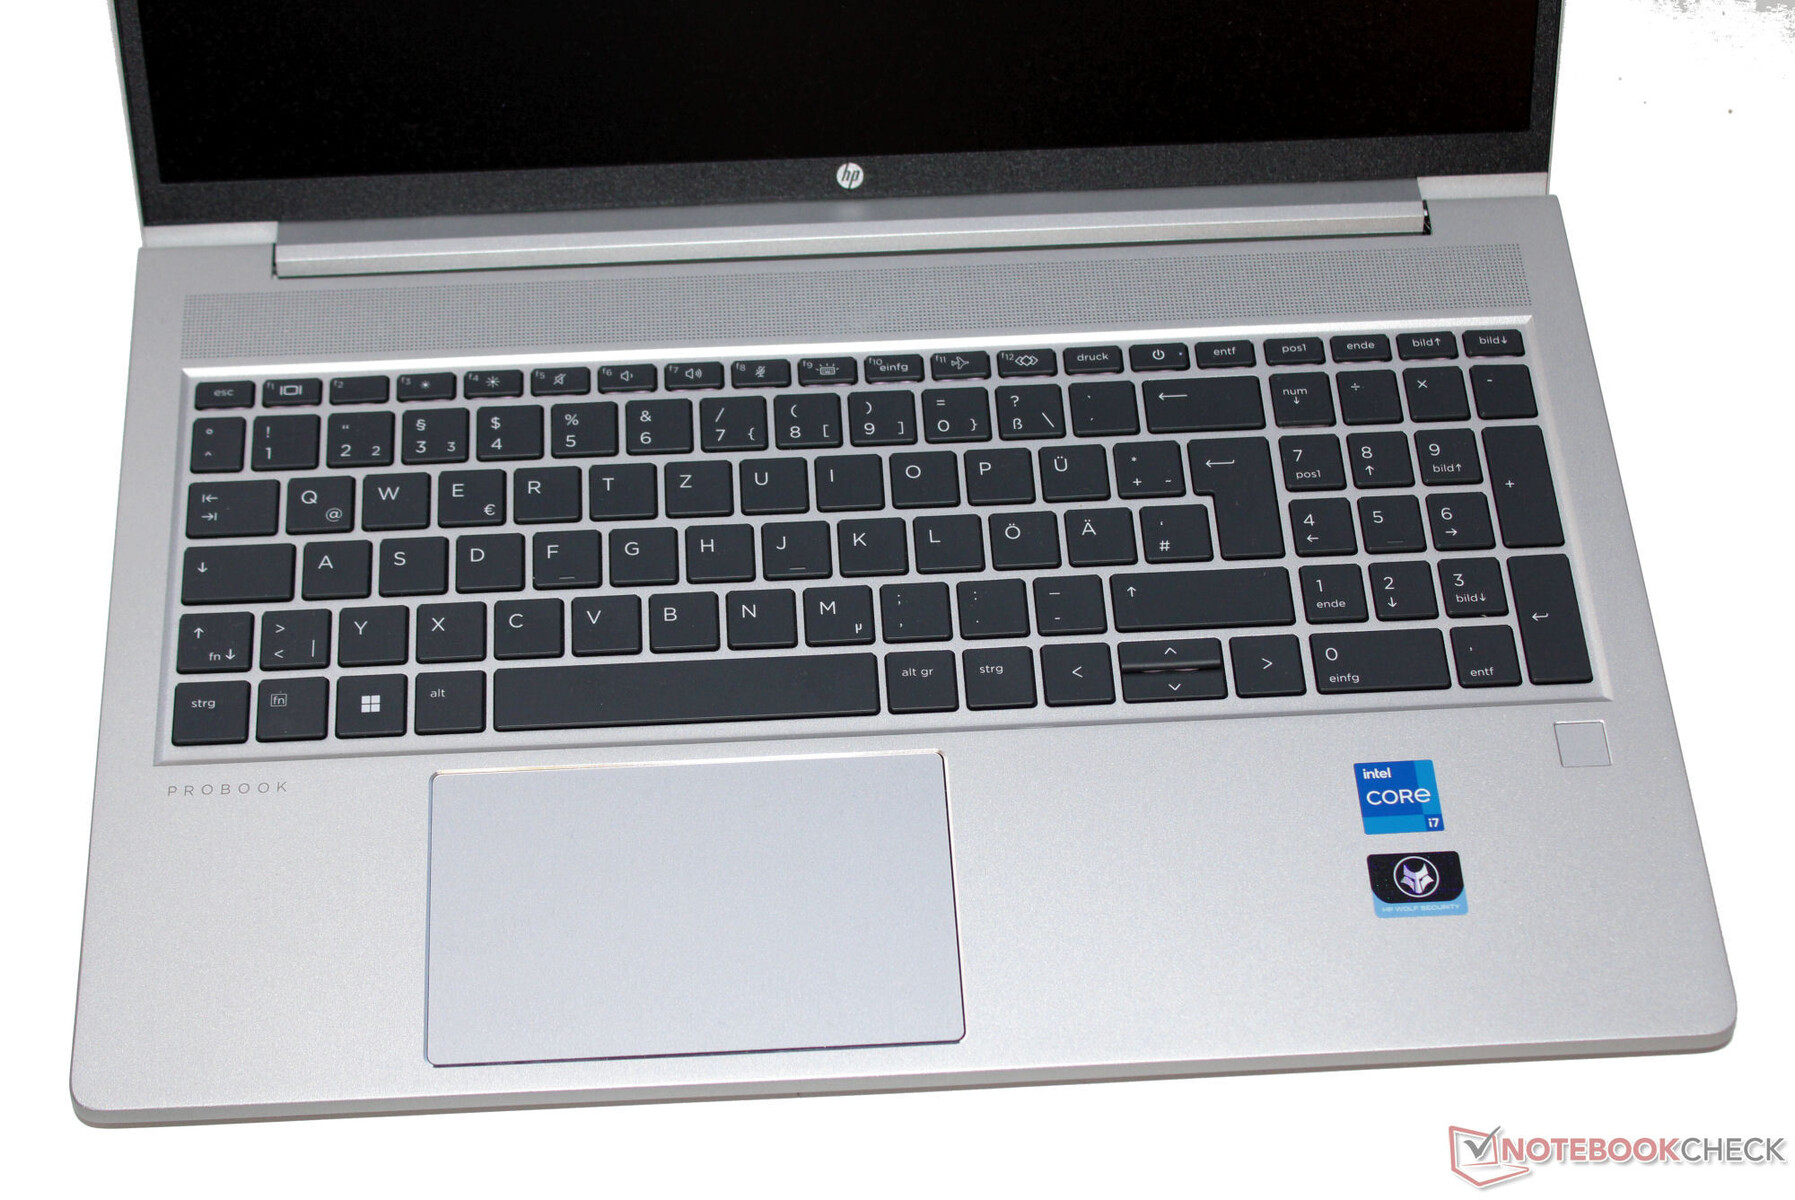
Dispositivos de entrada - El portátil HP con un teclado nítido
Teclado
El teclado chiclet instalado en el portátil cuenta con retroiluminación (dos niveles), teclado numérico y cierta protección contra el agua. Sus teclas cóncavas presentan una elevación corta y un punto de presión preciso. La nítida resistencia de las teclas merece algunos elogios. El teclado se balancea ligeramente mientras escribe, pero esto no resultó molesto durante nuestra prueba. El botón de encendido del portátil está alojado entre las teclas de función. Tocarlo accidentalmente no hace que el portátil se apague. En conjunto, HP ha proporcionado un teclado satisfactorio apto para el uso diario.
Panel táctil
Una almohadilla de clic (aprox. 11,5 x 7 cm) con un punto de presión de elevación corta y nítida sirve como sustituto del ratón.
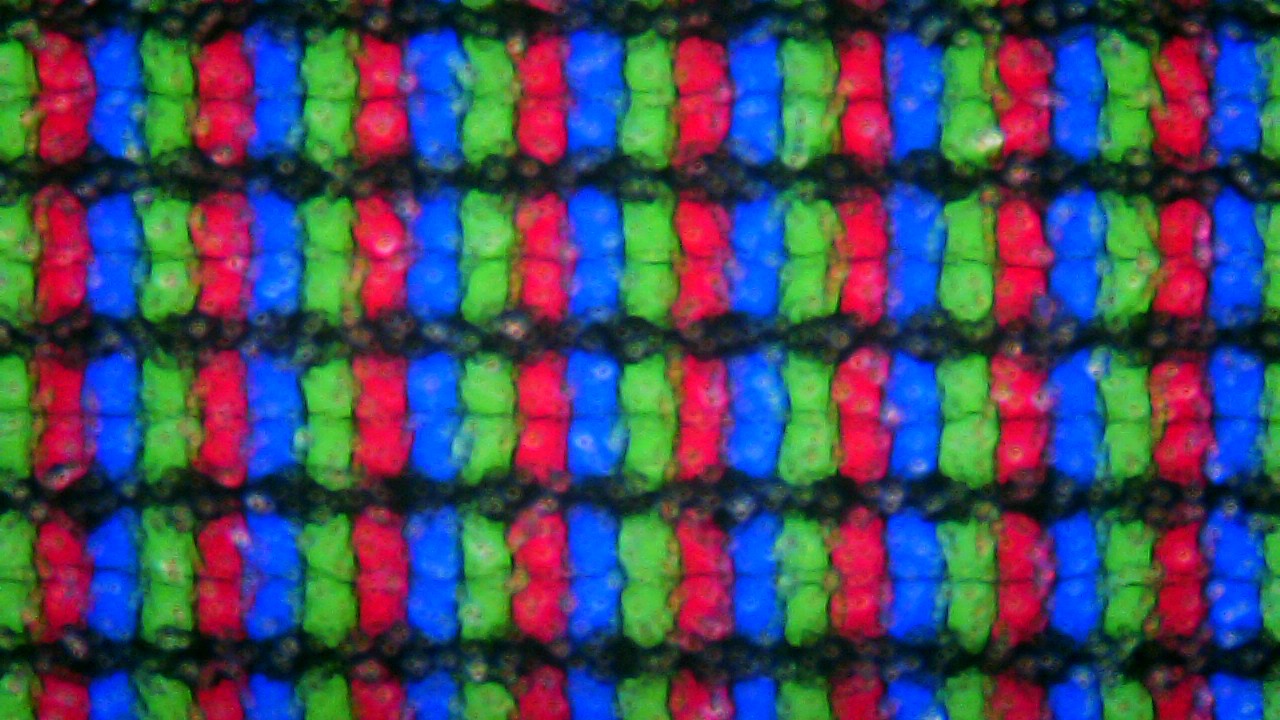
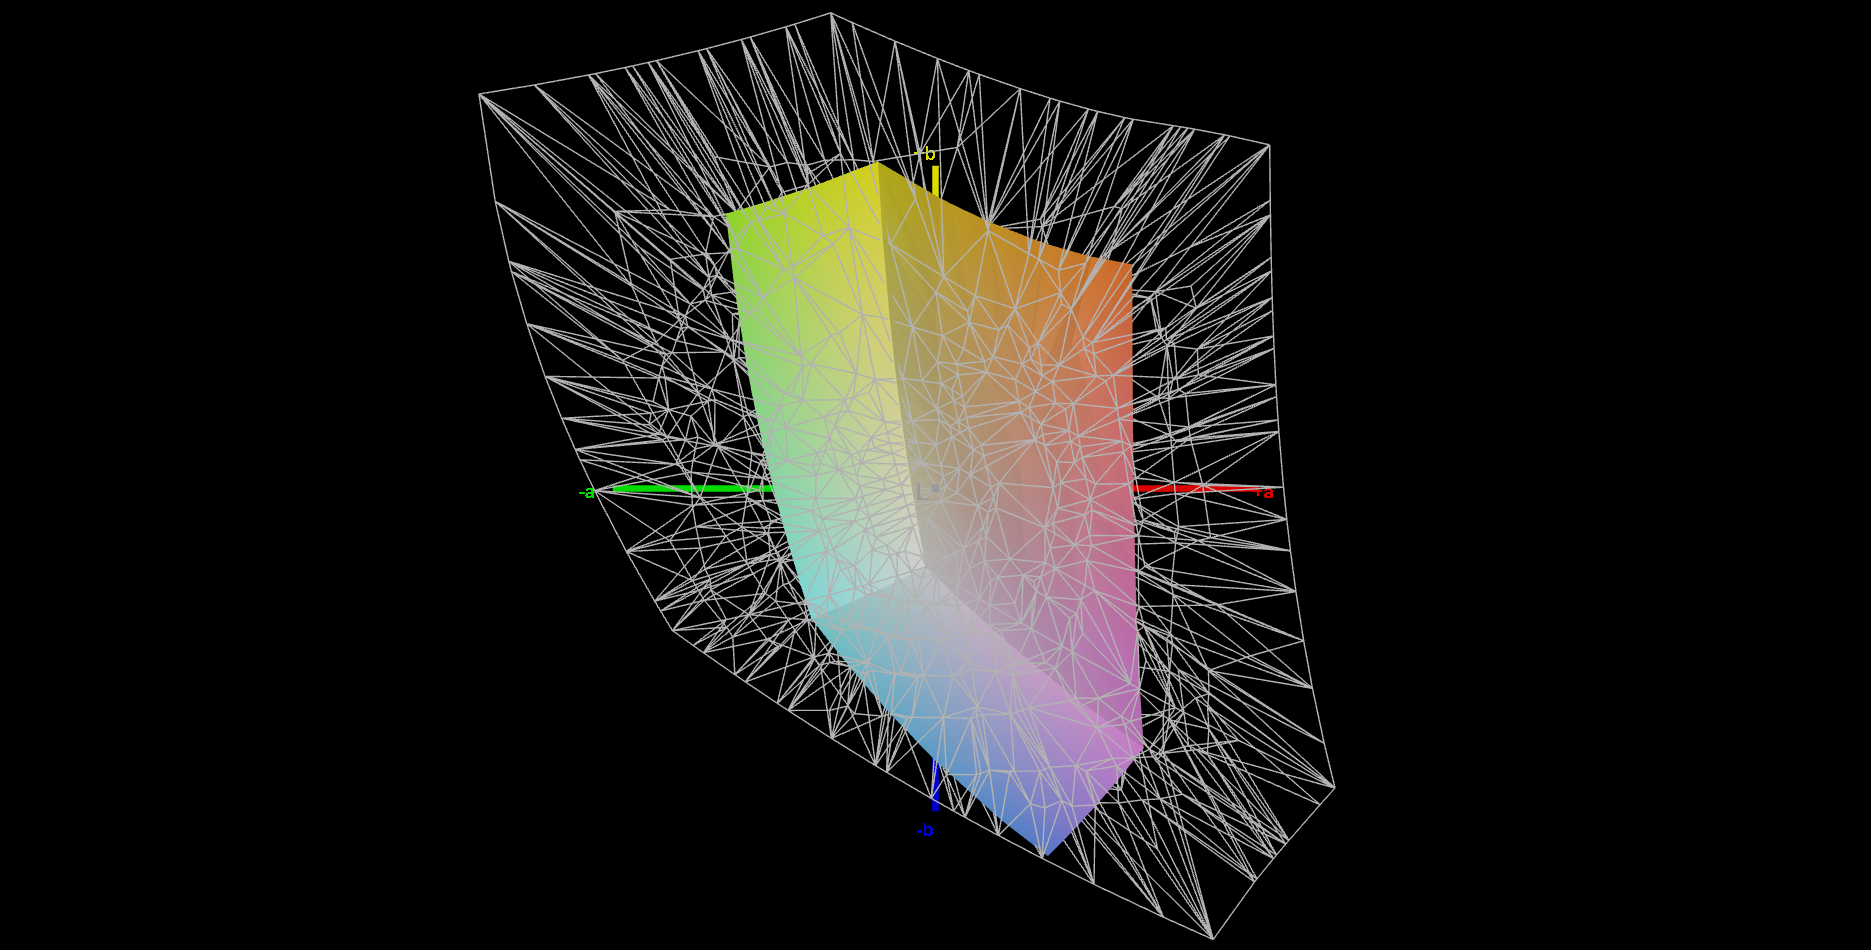
Pantalla - Panel FHD con escasa cobertura del espacio de color
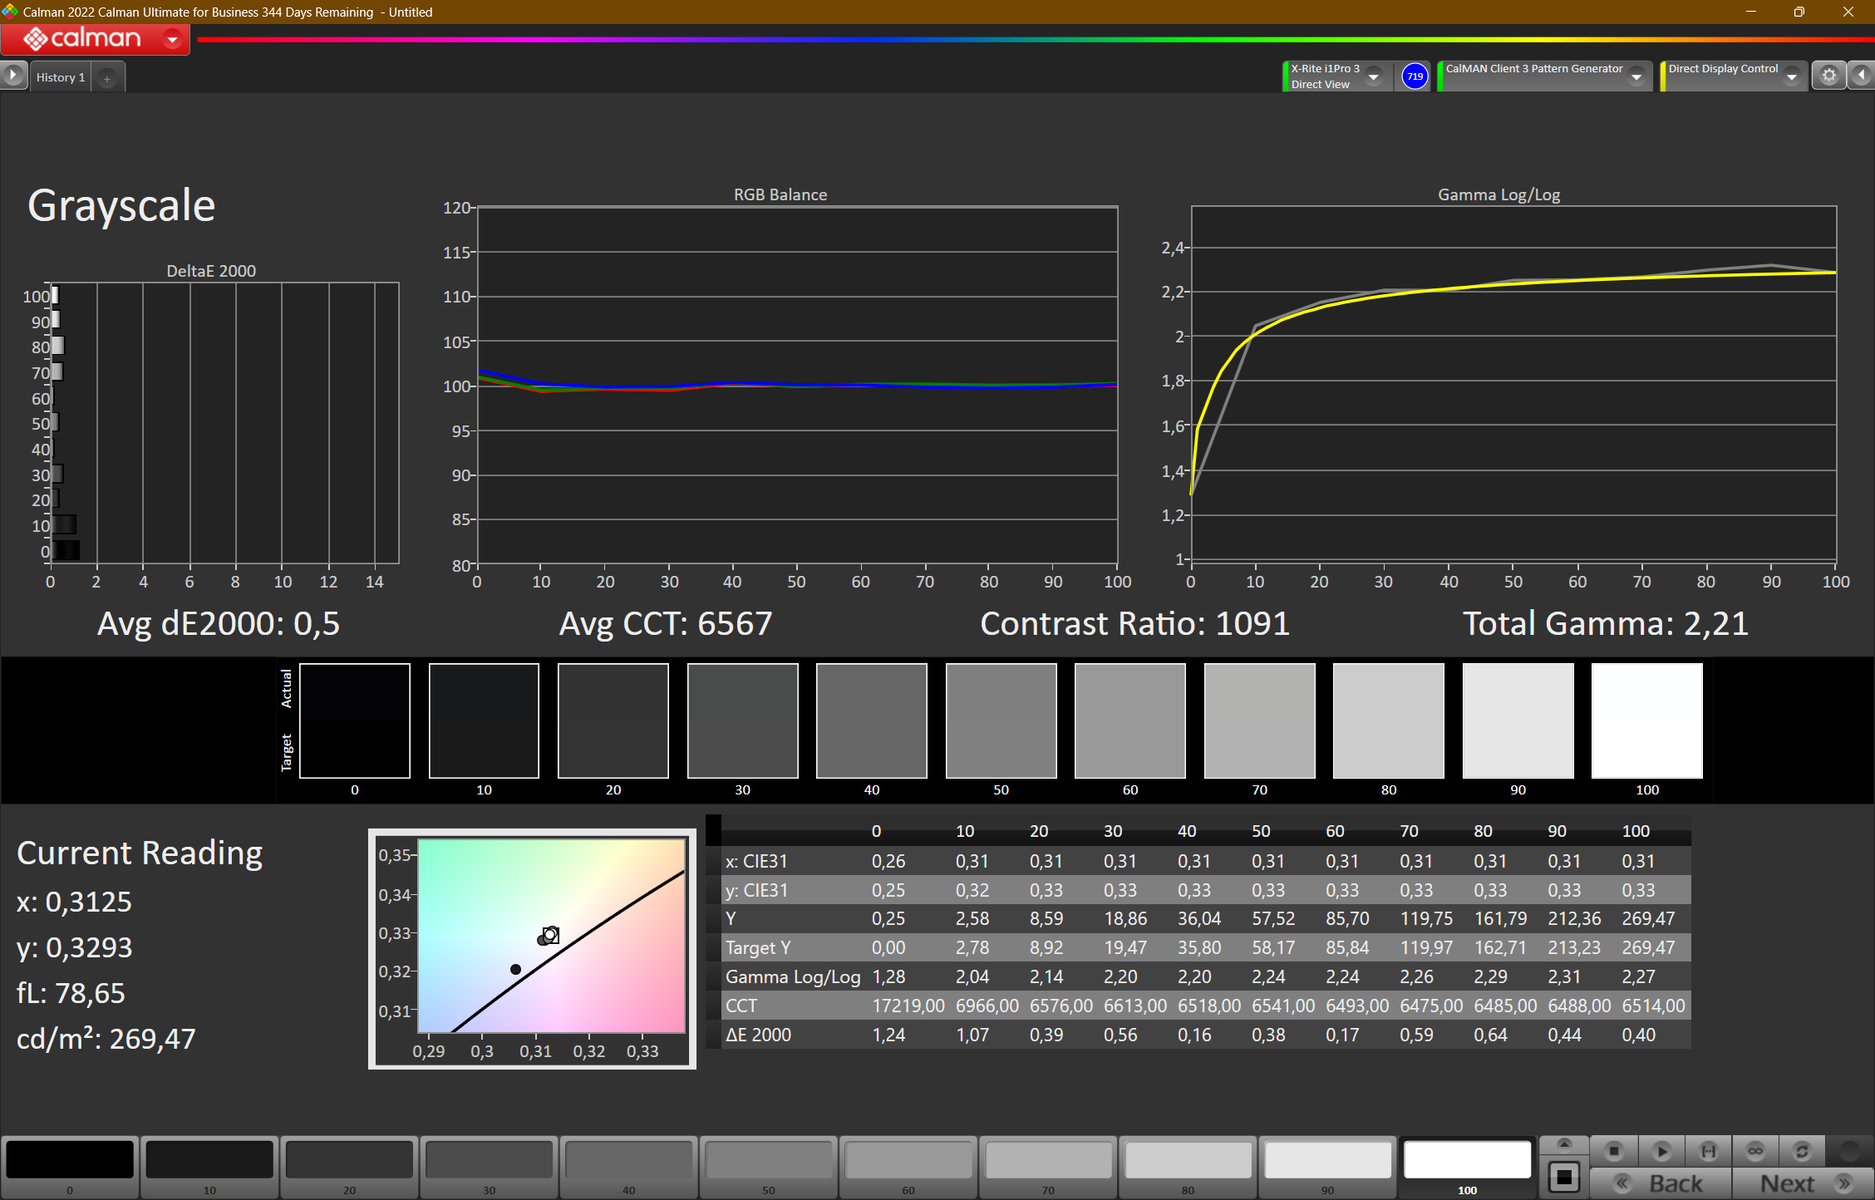
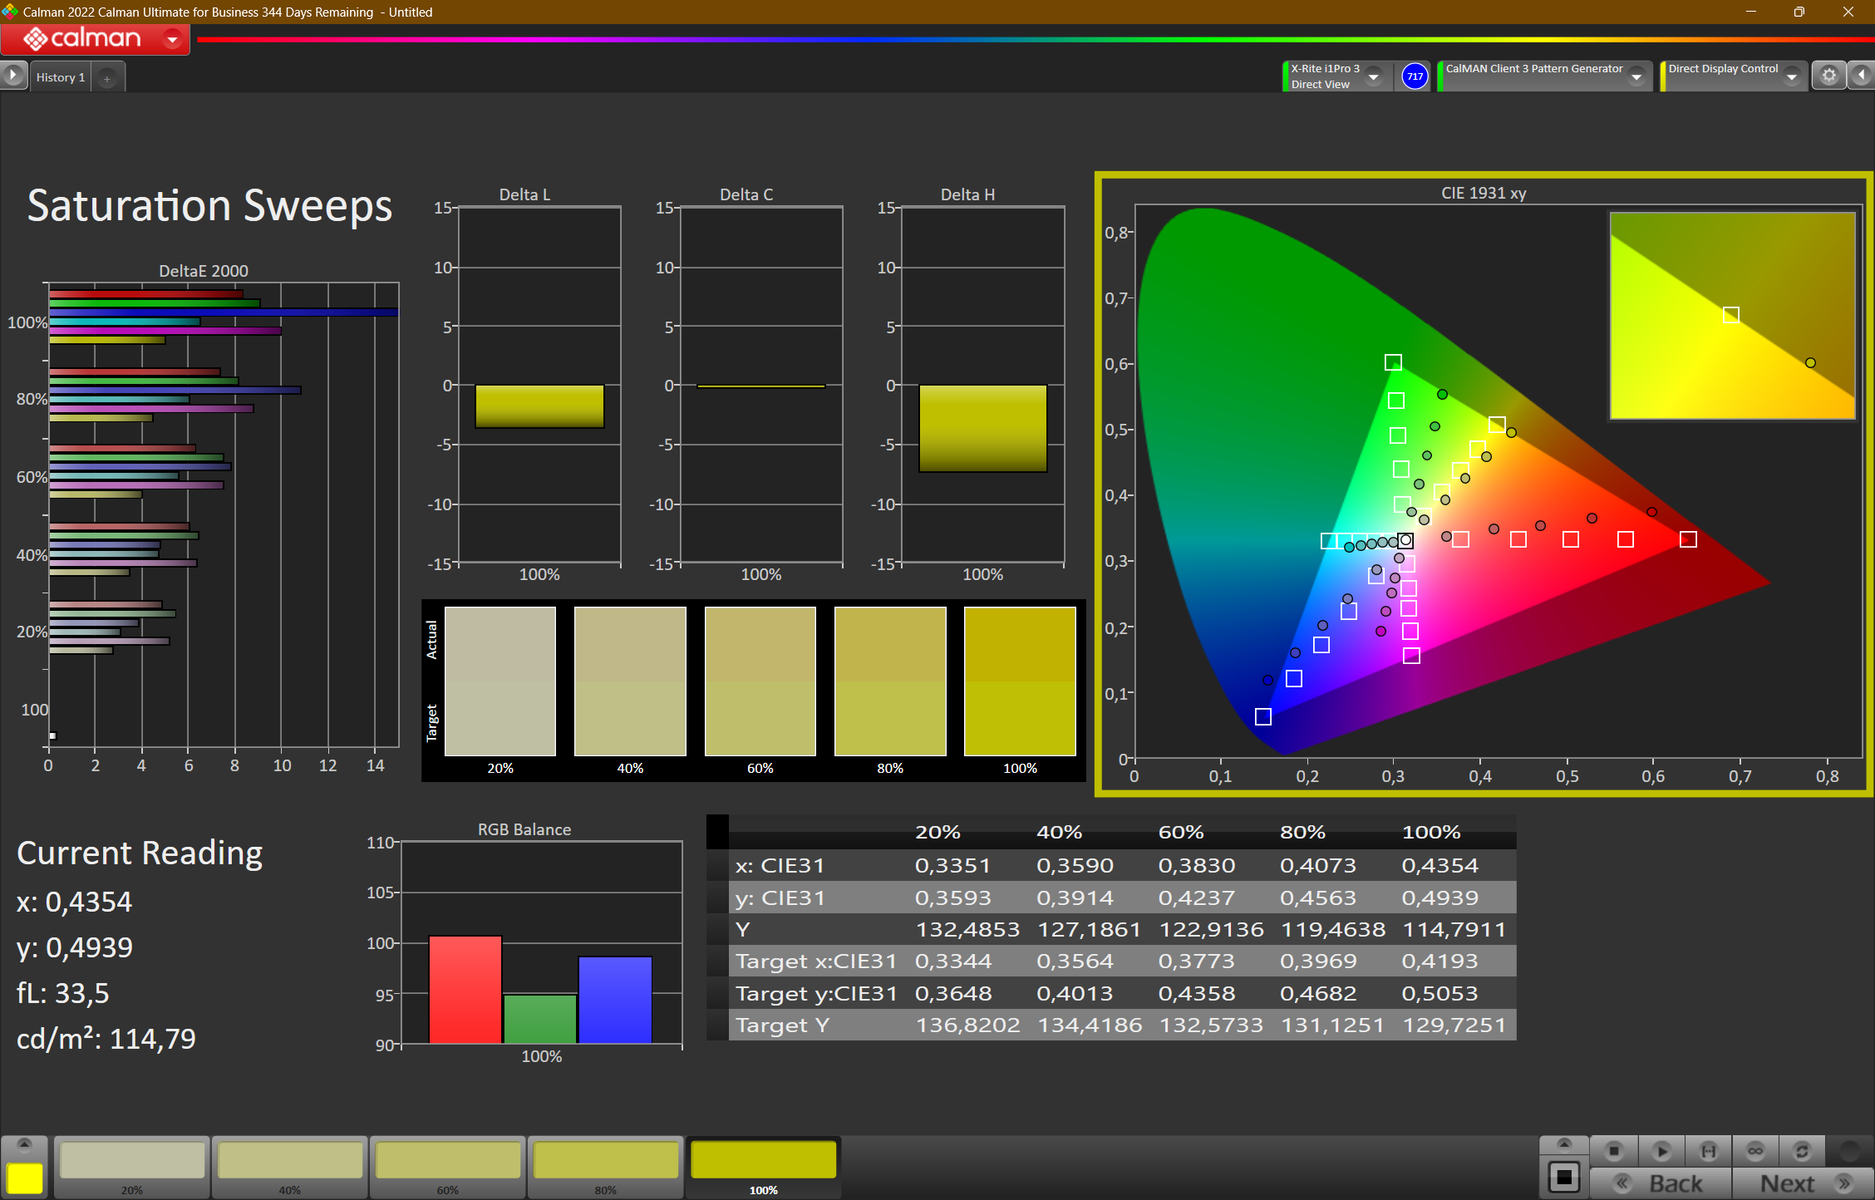
HP ha equipado el ProBook con una pantalla mate de 15,6 pulgadas y ángulo de visión estable (1.920 x 1.080 píxeles) que tiene una relación de aspecto de 16:9. Aunque sus niveles de contraste han alcanzado el valor objetivo (> 1.000:1), su brillo deja más que desear (objetivo: > 300 cd/m²). Positivo: No hemos notado ningún parpadeo PWM. Como alternativa, el 450 G10 puede adquirirse con un panel FHD más brillante (aprox. 400 cd/m²).

| |||||||||||||||||||||||||
iluminación: 88 %
Brillo con batería: 285 cd/m²
Contraste: 1096:1 (Negro: 0.26 cd/m²)
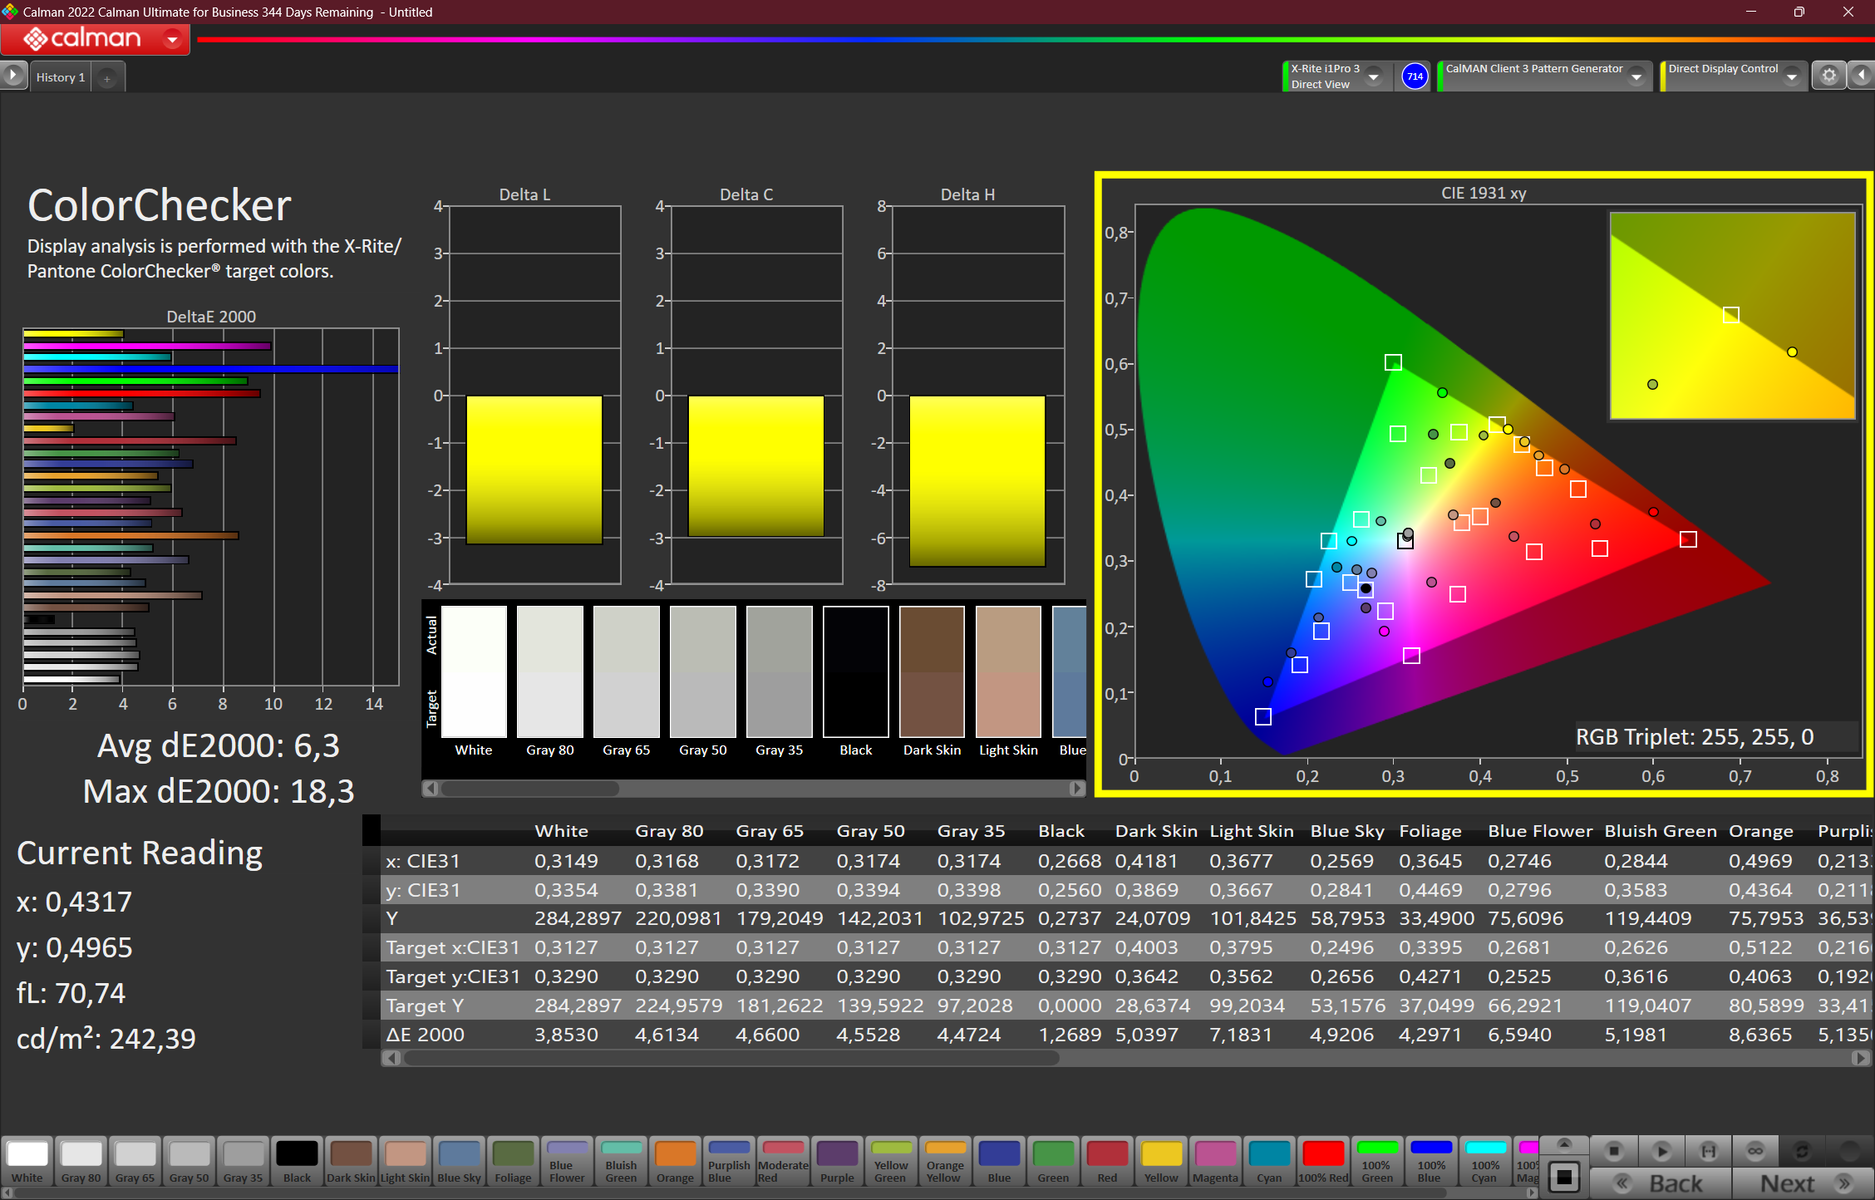
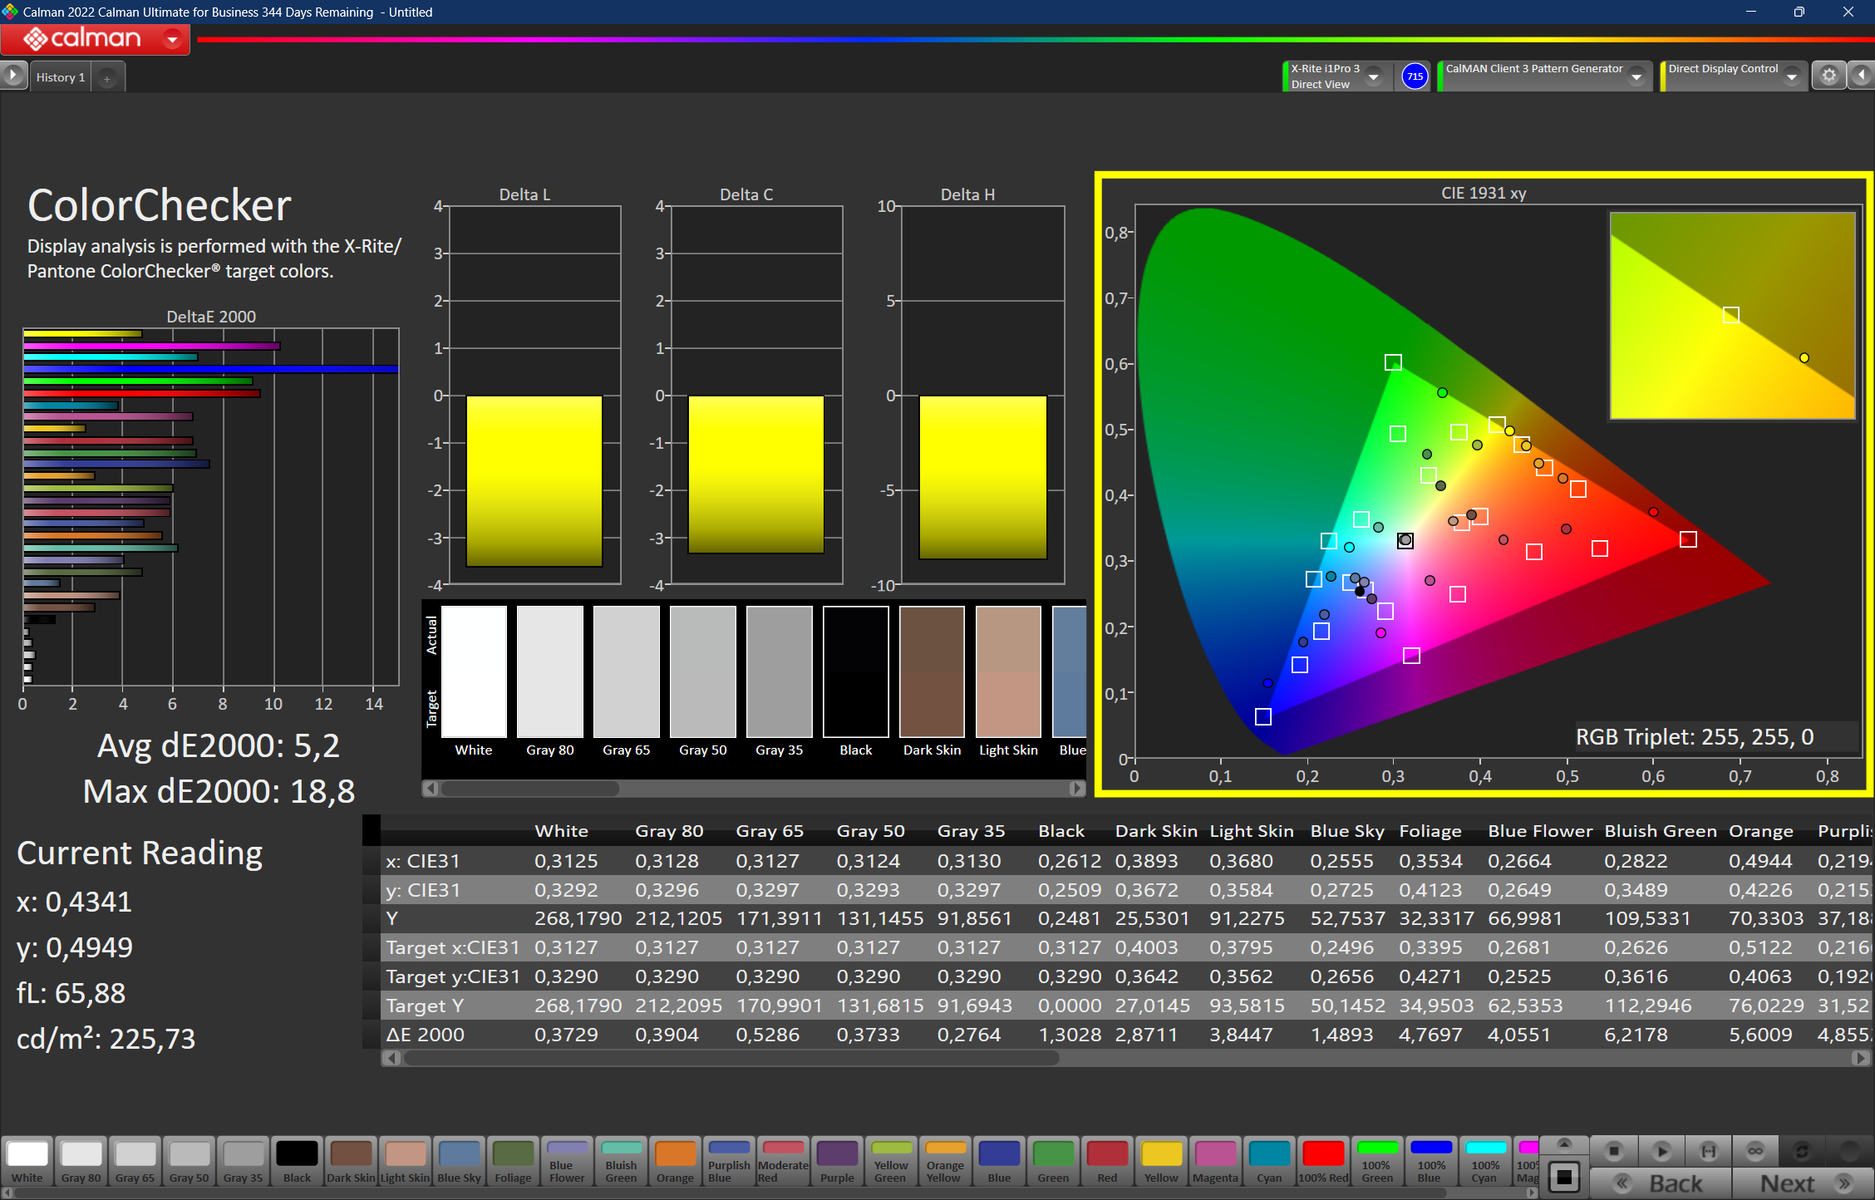
ΔE ColorChecker Calman: 6.3 | ∀{0.5-29.43 Ø4.71}
calibrated: 5.2
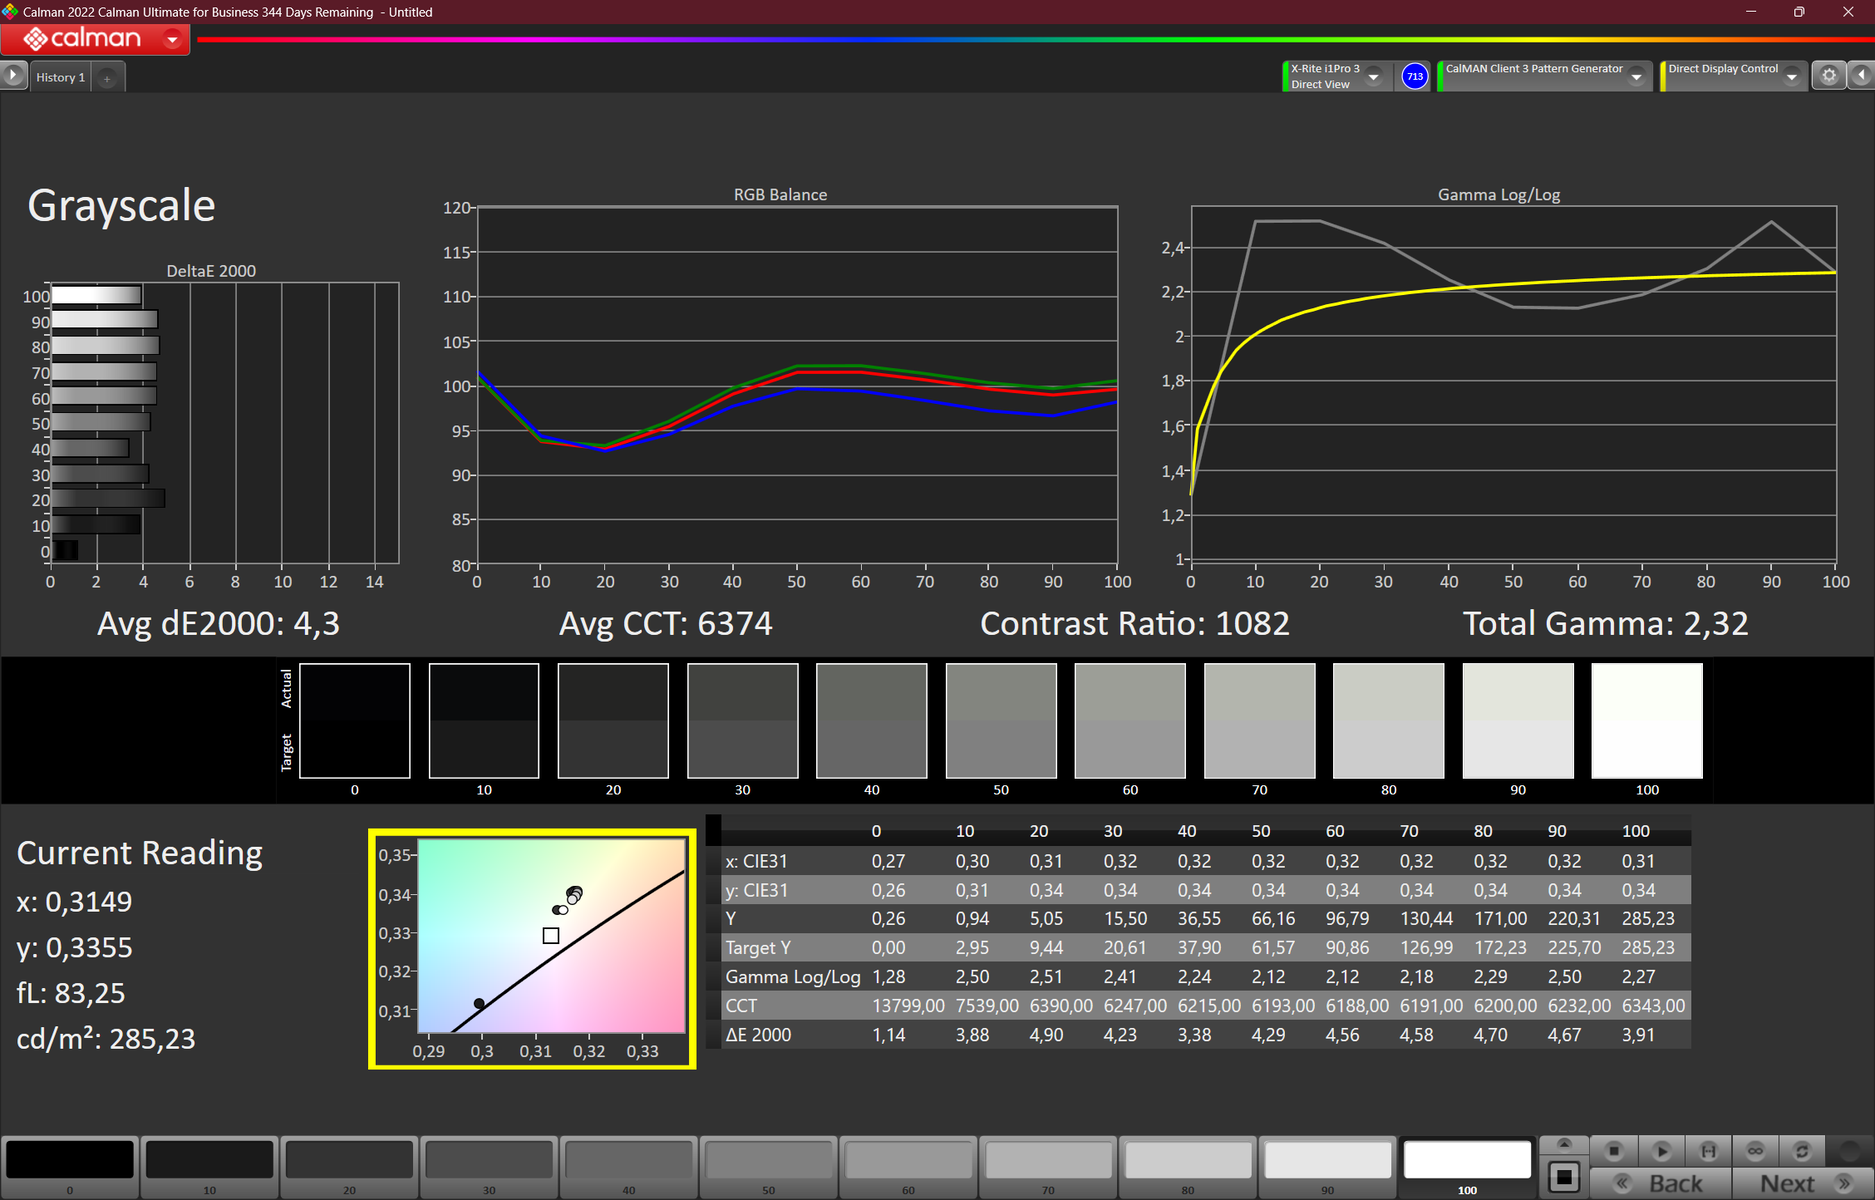
ΔE Greyscale Calman: 4.3 | ∀{0.09-98 Ø4.96}
39.7% AdobeRGB 1998 (Argyll 3D)
57.3% sRGB (Argyll 3D)
38.4% Display P3 (Argyll 3D)
Gamma: 2.32
CCT: 6374 K
| HP ProBook 450 G10 LG Philips LP156WFC-SPMD, IPS, 1920x1080, 15.6" | Acer Aspire 5 A515-58GM-76S8 LP156WFH-SPD5, IPS, 1920x1080, 15.6" | Schenker VIA 15 Pro M22 NE156QHM-NY2, IPS, 2560x1440, 15.6" | Lenovo ThinkPad L15 Gen 4 21H70021GE N156HCA-E5B, IPS, 1920x1080, 15.6" | Fujitsu LifeBook E5412A E542AMHAAMDE LP140WFH-SPD1, IPS, 1920x1080, 14" | Dell Latitude 3440 BOE NE140FH, IPS, 1920x1080, 14" | |
|---|---|---|---|---|---|---|
| Display | -0% | 73% | 9% | -2% | 5% | |
| Display P3 Coverage (%) | 38.4 | 38.11 -1% | 67.5 76% | 41.8 9% | 37.5 -2% | 40.4 5% |
| sRGB Coverage (%) | 57.3 | 57.7 1% | 97.1 69% | 62.5 9% | 56.1 -2% | 60.7 6% |
| AdobeRGB 1998 Coverage (%) | 39.7 | 39.41 -1% | 68.5 73% | 43.2 9% | 38.8 -2% | 41.8 5% |
| Response Times | -2% | 59% | 23% | -5% | -15% | |
| Response Time Grey 50% / Grey 80% * (ms) | 35.5 ? | 33.6 ? 5% | 13.8 ? 61% | 24.4 ? 31% | 35 ? 1% | 35.3 ? 1% |
| Response Time Black / White * (ms) | 23 ? | 24.8 ? -8% | 9.8 ? 57% | 19.7 ? 14% | 25.6 ? -11% | 29.8 ? -30% |
| PWM Frequency (Hz) | 60 ? | |||||
| Screen | -5% | 21% | 11% | -17% | 21% | |
| Brightness middle (cd/m²) | 285 | 257.4 -10% | 354 24% | 275 -4% | 231 -19% | 292.6 3% |
| Brightness (cd/m²) | 266 | 248 -7% | 331 24% | 252 -5% | 228 -14% | 270 2% |
| Brightness Distribution (%) | 88 | 88 0% | 80 -9% | 84 -5% | 77 -12% | 88 0% |
| Black Level * (cd/m²) | 0.26 | 0.3209 -23% | 0.41 -58% | 0.16 38% | 0.31 -19% | 0.19 27% |
| Contrast (:1) | 1096 | 802 -27% | 863 -21% | 1719 57% | 745 -32% | 1540 41% |
| Colorchecker dE 2000 * | 6.3 | 6.26 1% | 2.4 62% | 6.2 2% | 7.2 -14% | 4.63 27% |
| Colorchecker dE 2000 max. * | 18.3 | 18.28 -0% | 6.4 65% | 19.2 -5% | 20.8 -14% | 17.1 7% |
| Colorchecker dE 2000 calibrated * | 5.2 | 4.99 4% | 1.4 73% | 4.2 19% | 5.5 -6% | 2.13 59% |
| Greyscale dE 2000 * | 4.3 | 3.7 14% | 3.2 26% | 4.1 5% | 5.3 -23% | 3.2 26% |
| Gamma | 2.32 95% | 2.186 101% | 2.08 106% | 1.91 115% | 2.16 102% | 2.34 94% |
| CCT | 6374 102% | 6606 98% | 6786 96% | 6352 102% | 6407 101% | 7184 90% |
| Media total (Programa/Opciones) | -2% /
-4% | 51% /
37% | 14% /
12% | -8% /
-12% | 4% /
13% |
* ... más pequeño es mejor
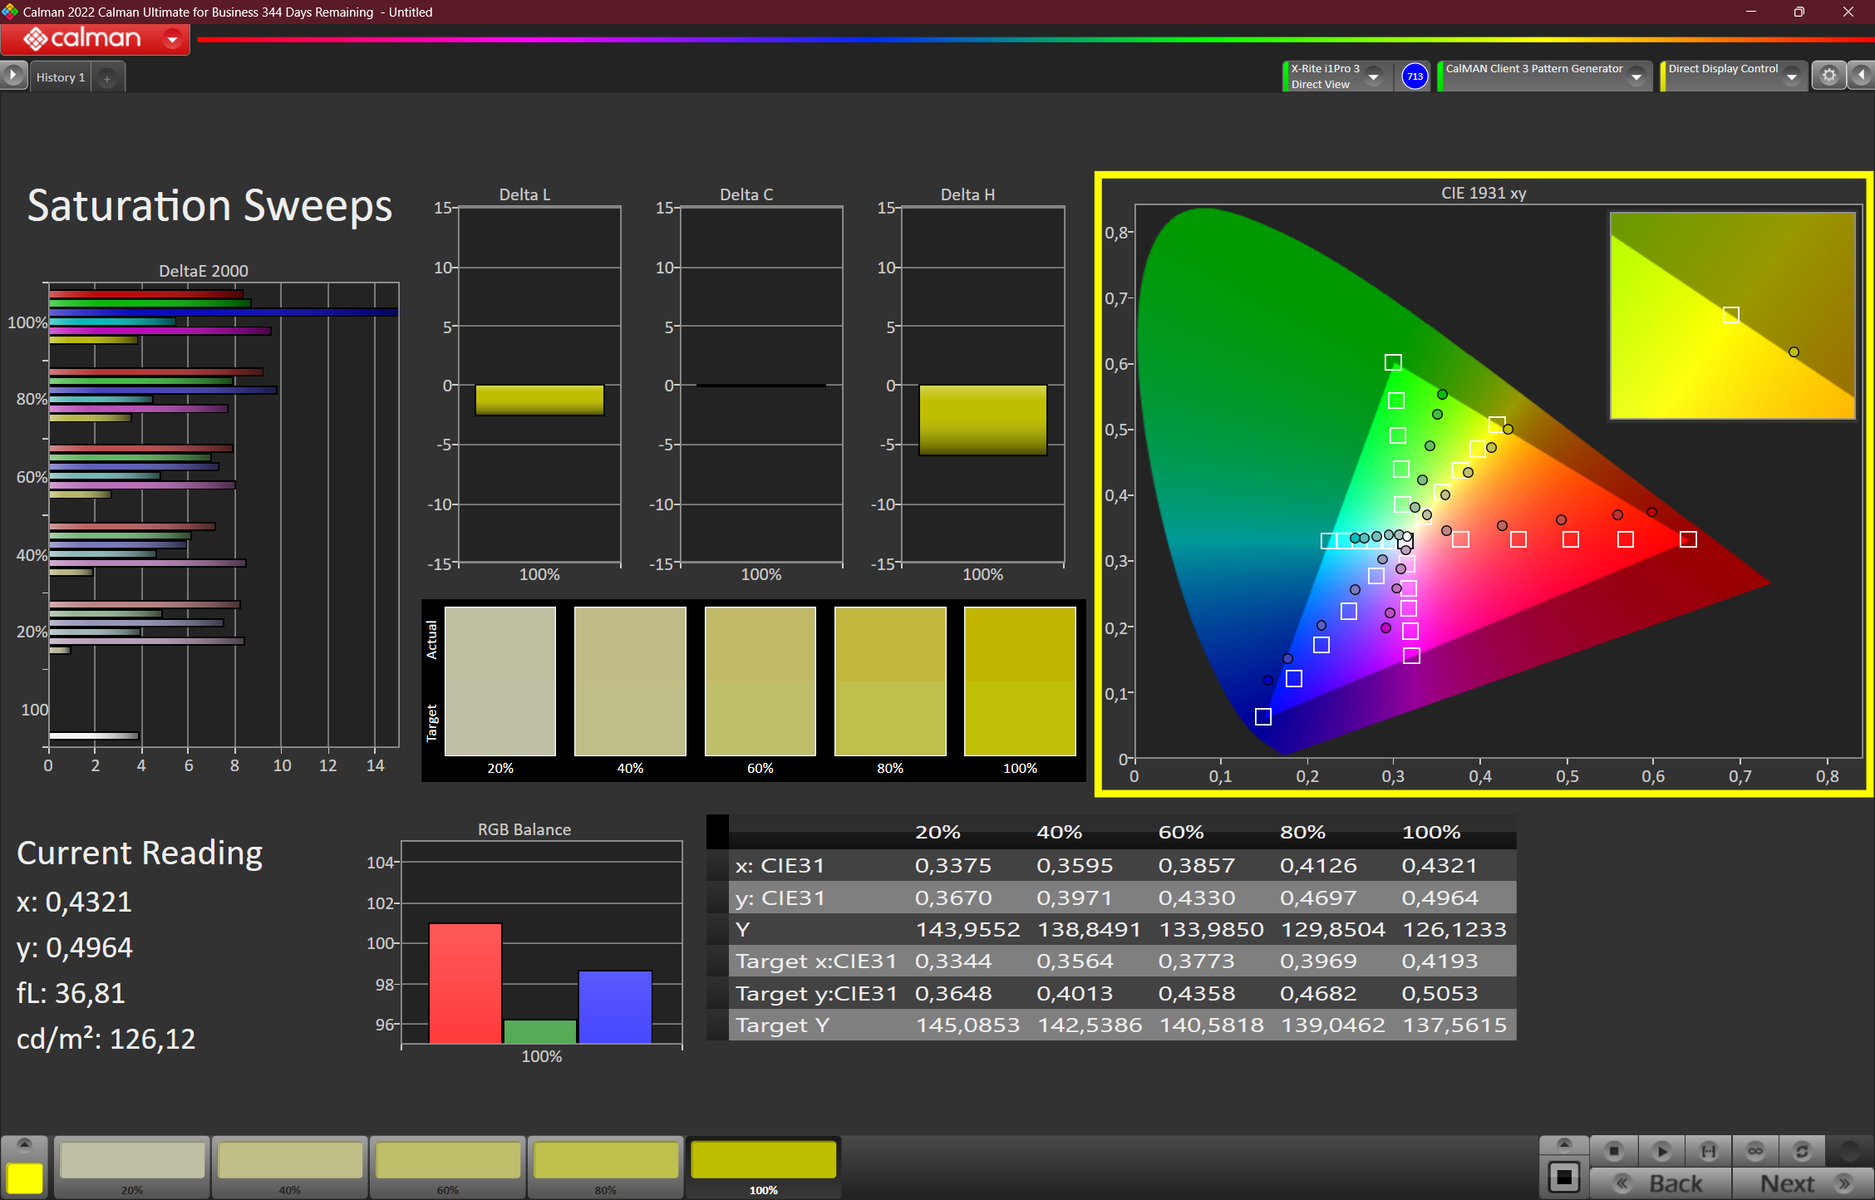
Ex funciona, la pantalla muestra una representación del color aceptable: Con una desviación de alrededor de 6,3, lamentablemente no ha alcanzado su valor objetivo (DeltaE < 3). La calibración reduce el valor a 5,2 y hace que los tonos grises parezcan más equilibrados. Los espacios de color DCI-P3, sRGB y AdobeRGB no pueden ser representados por el panel - lo mismo puede decirse de la mayoría de las pantallas de la competencia. El panel FHD, alternativamente disponible y más brillante, ofrece una mejor representación del color (sRGB).
Tiempos de respuesta del display
| ↔ Tiempo de respuesta de Negro a Blanco | ||
|---|---|---|
| 23 ms ... subida ↗ y bajada ↘ combinada | ↗ 13 ms subida | 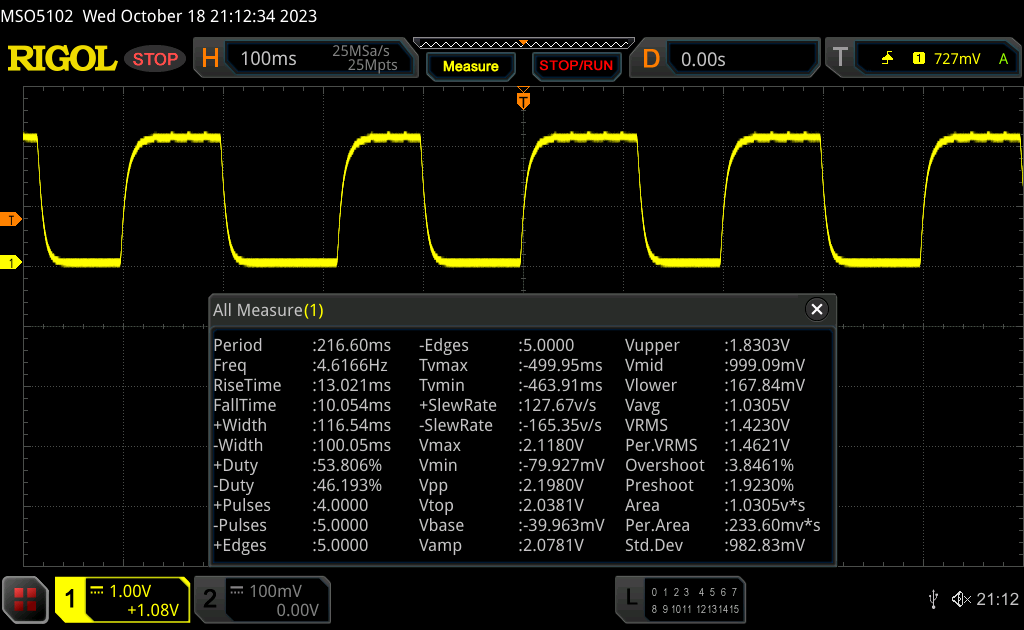 |
| ↘ 10 ms bajada | ||
| La pantalla mostró buenos tiempos de respuesta en nuestros tests pero podría ser demasiado lenta para los jugones competitivos. En comparación, todos los dispositivos de prueba van de ##min### (mínimo) a 240 (máximo) ms. » 52 % de todos los dispositivos son mejores. Eso quiere decir que el tiempo de respuesta es peor que la media (19.8 ms) de todos los dispositivos testados. | ||
| ↔ Tiempo de respuesta 50% Gris a 80% Gris | ||
| 35.5 ms ... subida ↗ y bajada ↘ combinada | ↗ 18.6 ms subida | 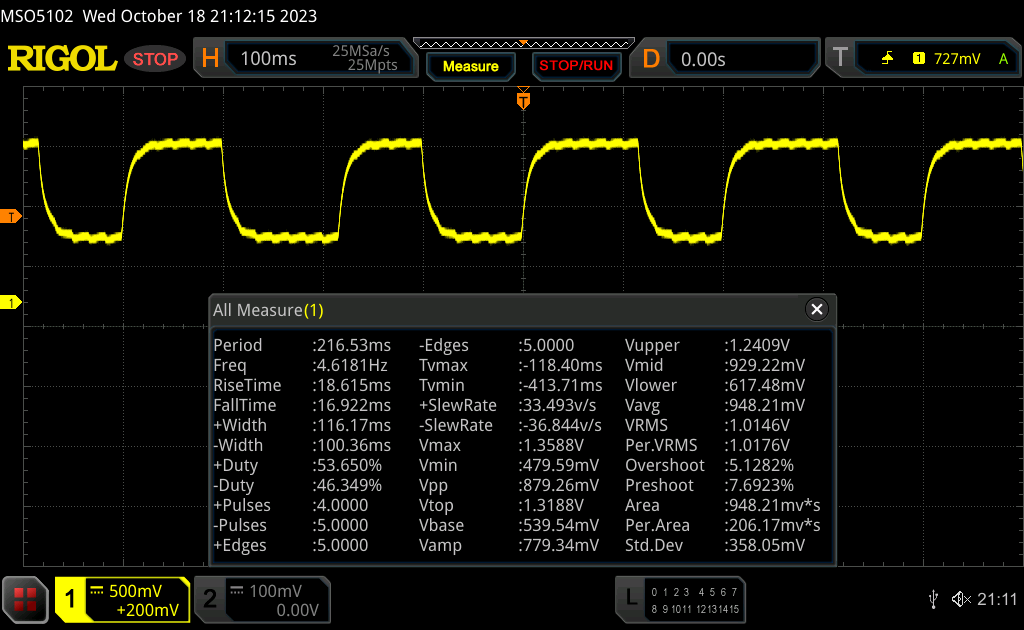 |
| ↘ 16.9 ms bajada | ||
| La pantalla mostró tiempos de respuesta lentos en nuestros tests y podría ser demasiado lenta para los jugones. En comparación, todos los dispositivos de prueba van de ##min### (mínimo) a 636 (máximo) ms. » 50 % de todos los dispositivos son mejores. Eso quiere decir que el tiempo de respuesta es peor que la media (31 ms) de todos los dispositivos testados. | ||
Parpadeo de Pantalla / PWM (Pulse-Width Modulation)
| Parpadeo de Pantalla / PWM no detectado |  | ||
Comparación: 52 % de todos los dispositivos testados no usaron PWM para atenuar el display. Si se usó, medimos una media de 7757 (mínimo: 5 - máxmo: 343500) Hz. | |||
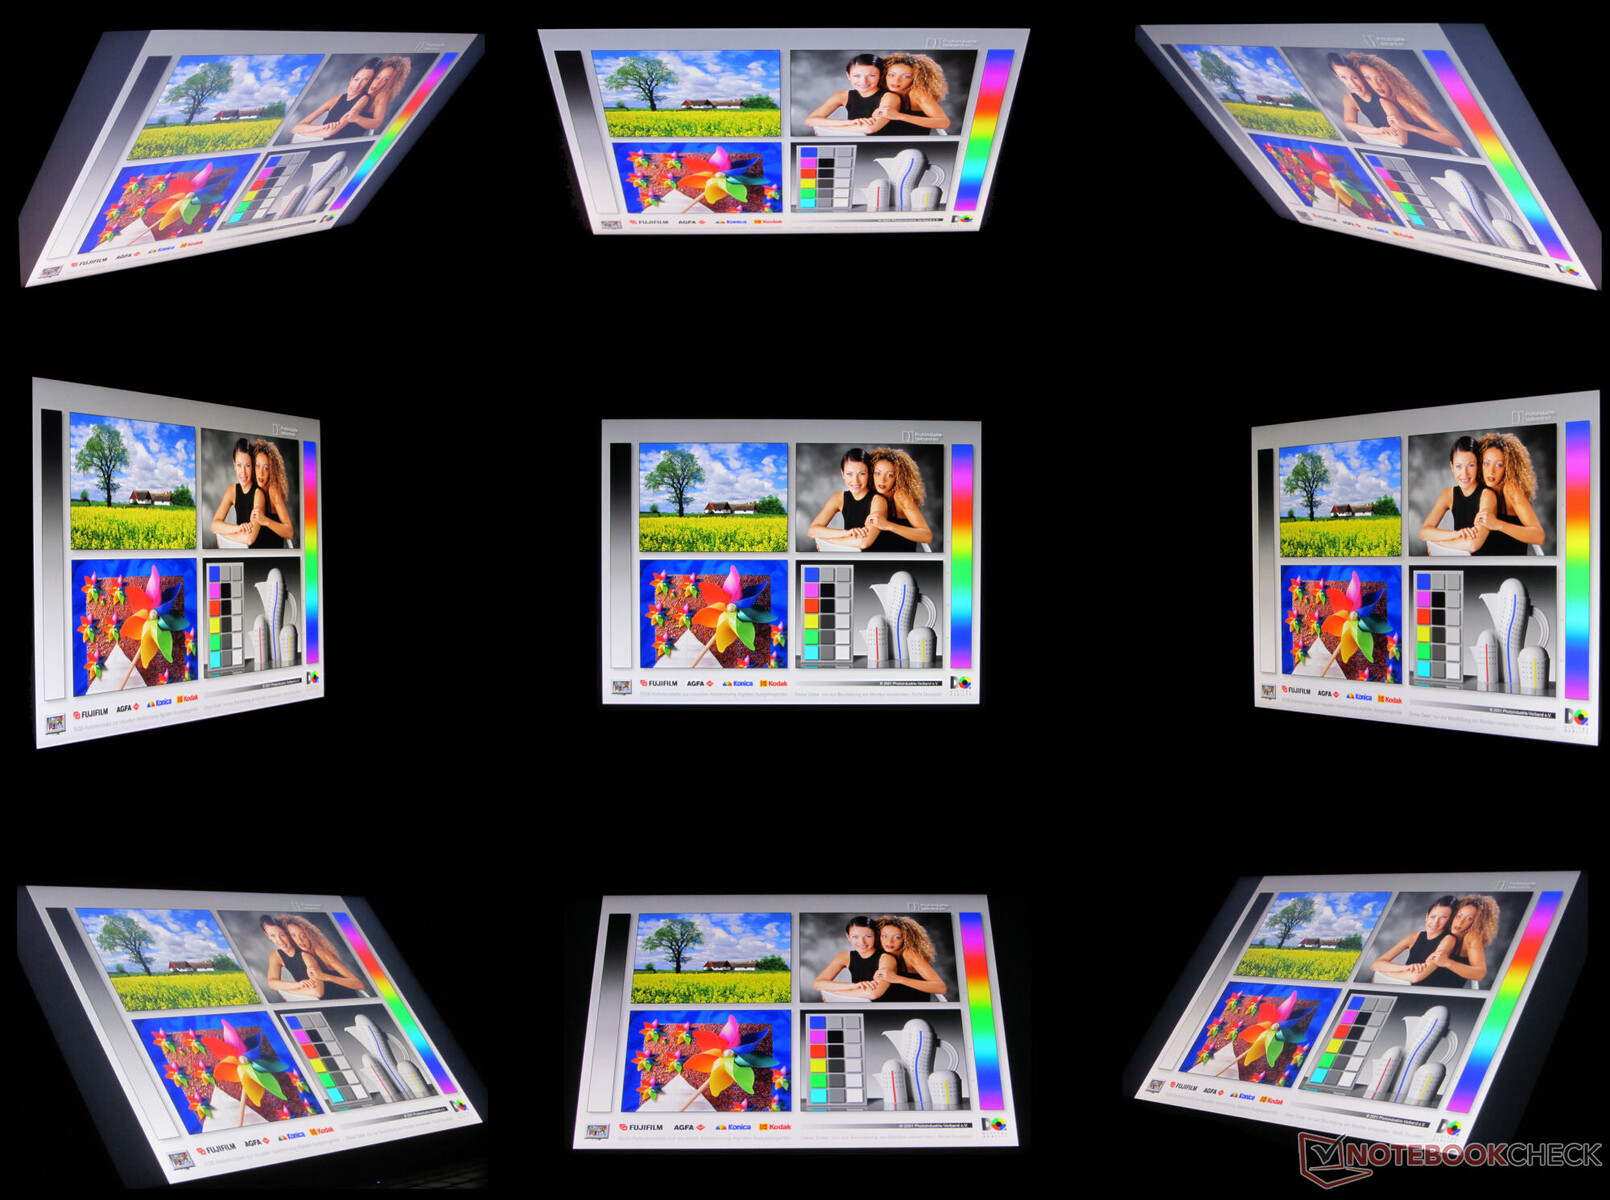
El panel IPS de ángulo de visión estable sigue siendo legible desde cualquier ángulo. En el exterior, es posible leer en la pantalla siempre que el sol no brille demasiado.
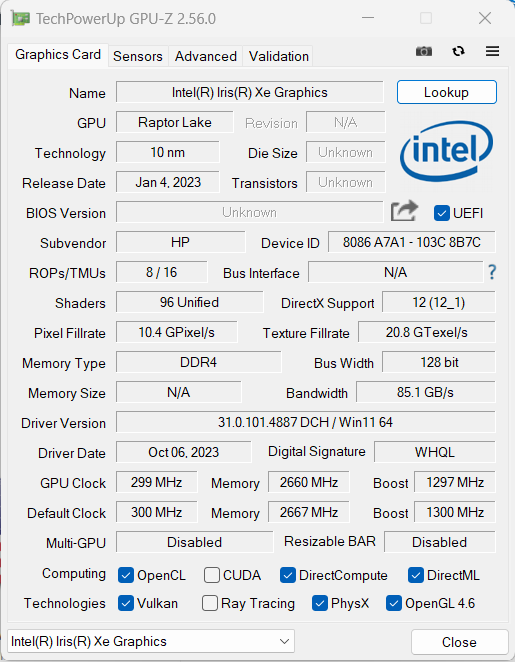
Rendimiento - Raptor Lake y Ampere potencian el portátil HP
Dentro de la serie ProBook 400 G10, HP apuesta por APU de AMD (ProBook 455) así como CPU de Intel (ProBook 450). Los modelos 450 G10 disponibles en el momento de las pruebas pueden encontrarse por entre 750 y 1.100 dólares. La variante actual se puede conseguir desde unos 1.000 dólares.
Condiciones de prueba
En lugar de utilizar su propio perfil energético, HP utiliza los de Windows, denominados Power Status (véase la tabla). Utilizamos los perfiles "mejor rendimiento" (pruebas de rendimiento, tiempos de ejecución de carga) y "equilibrado" (otras pruebas de tiempo de ejecución).
Como los límites de potencia son idénticos en los tres perfiles, apenas hay diferencias en lo que se refiere al rendimiento de la CPU. El rendimiento de la GPU, en cambio, varía en función del perfil.
| Mejor rendimiento | Equilibrado | Mejor ahorro de energía | |
|---|---|---|---|
| Límite de potencia 1 (HWInfo) | 24 vatios | 24 vatios | 24 vatios |
| Límite de potencia 2 (HWInfo) | 55 vatios | 55 vatios | 55 vatios |
Procesador
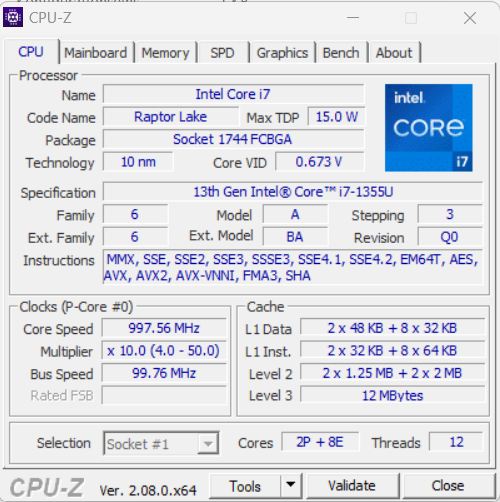
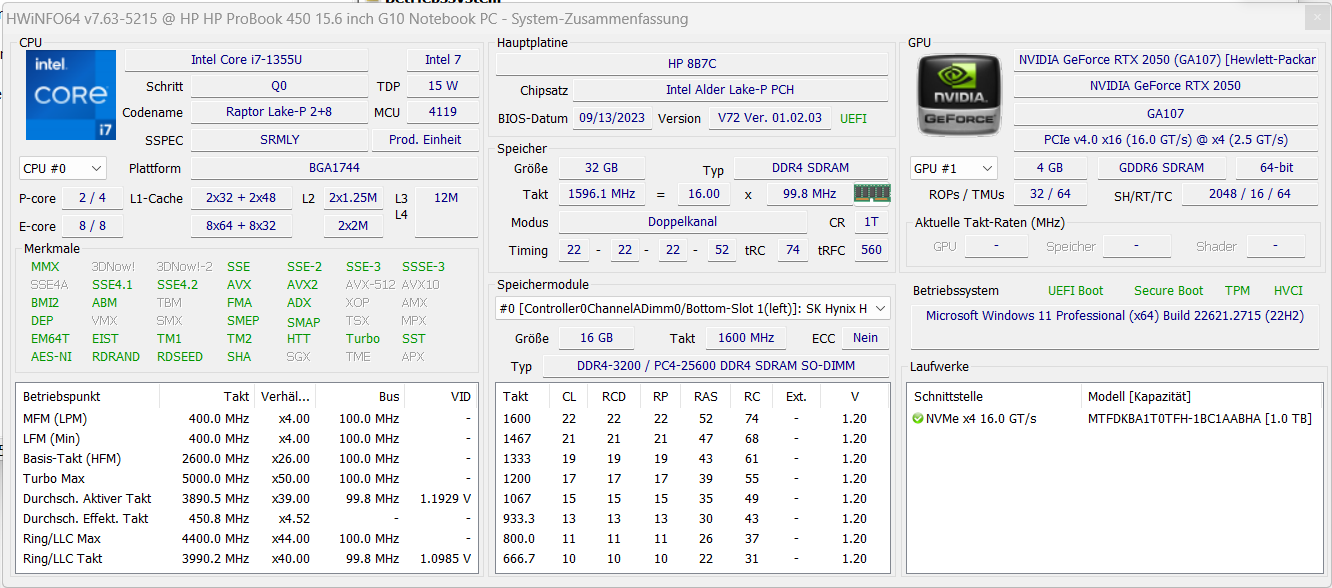
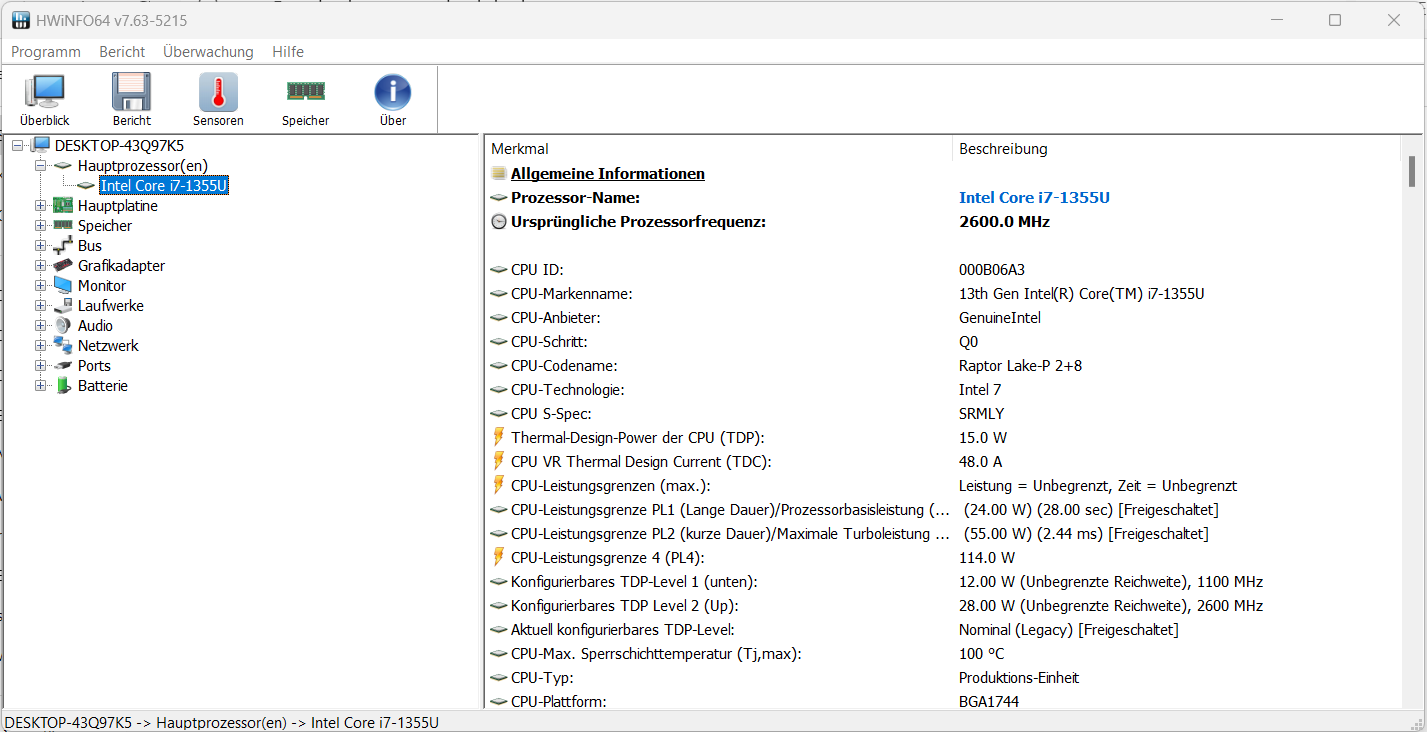
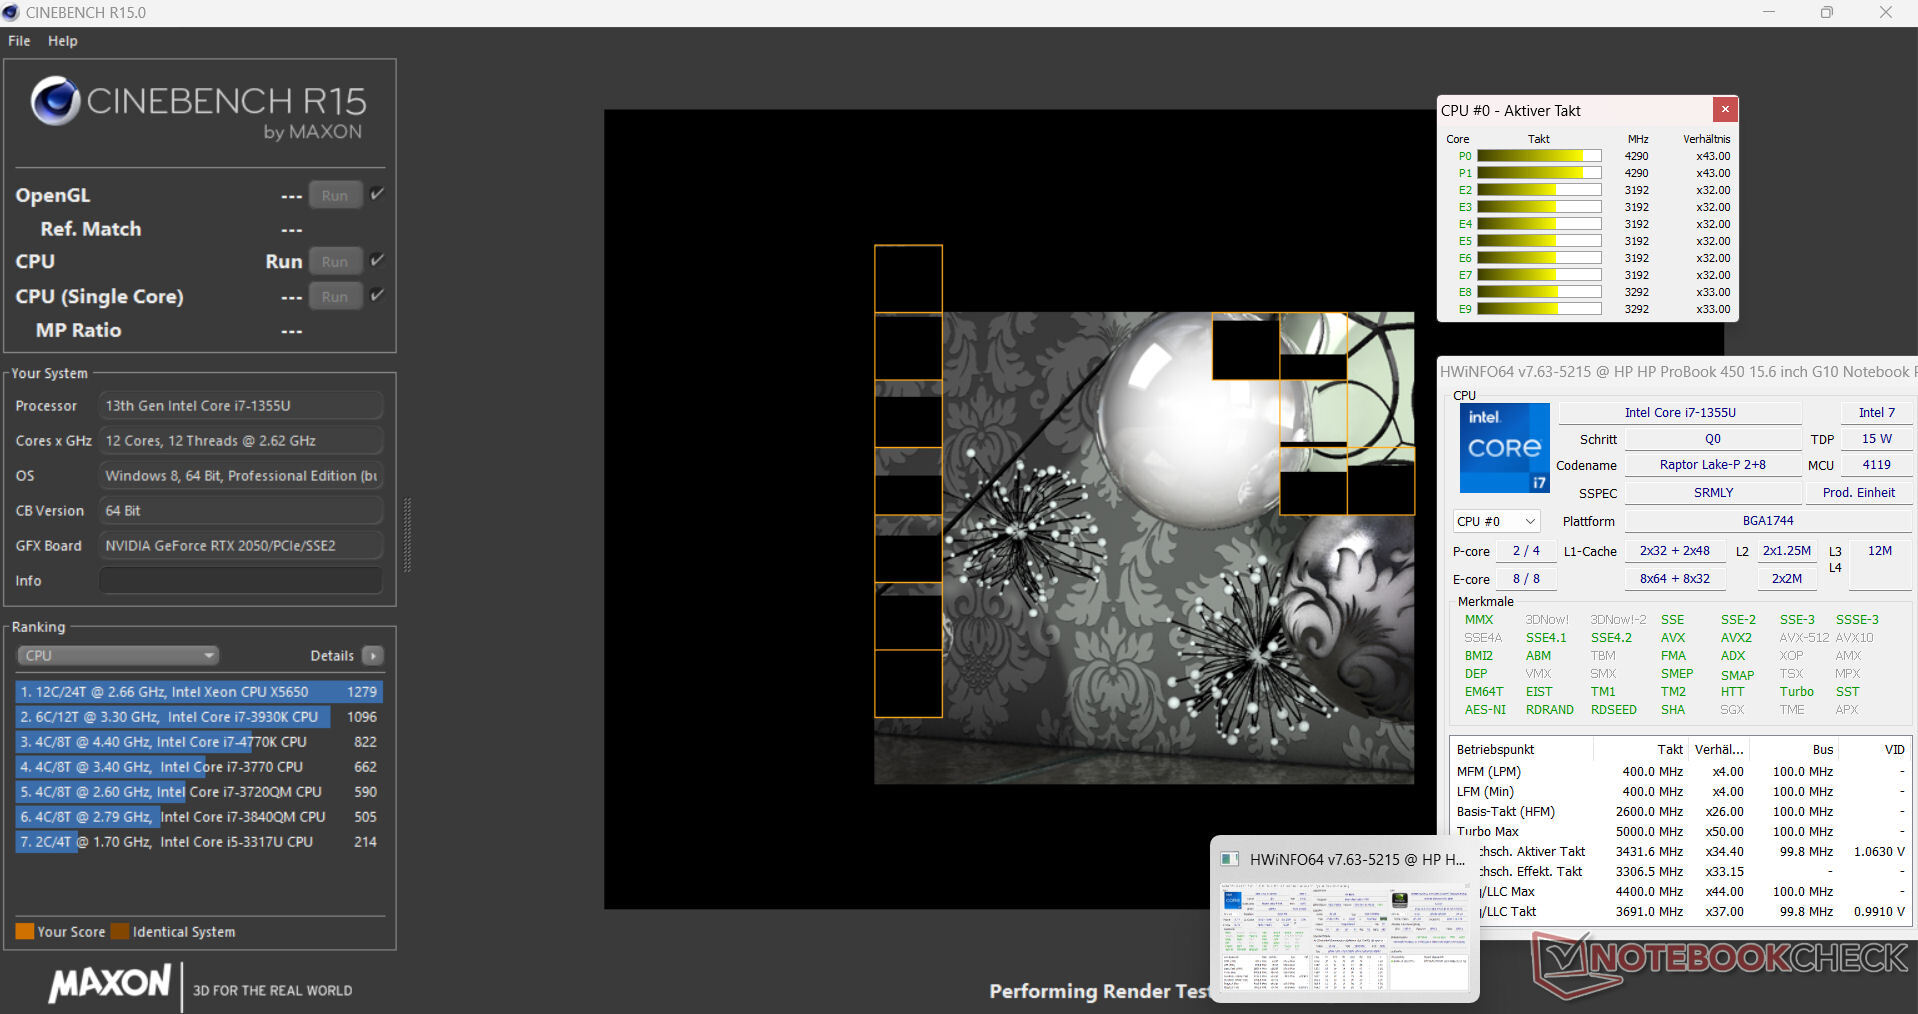
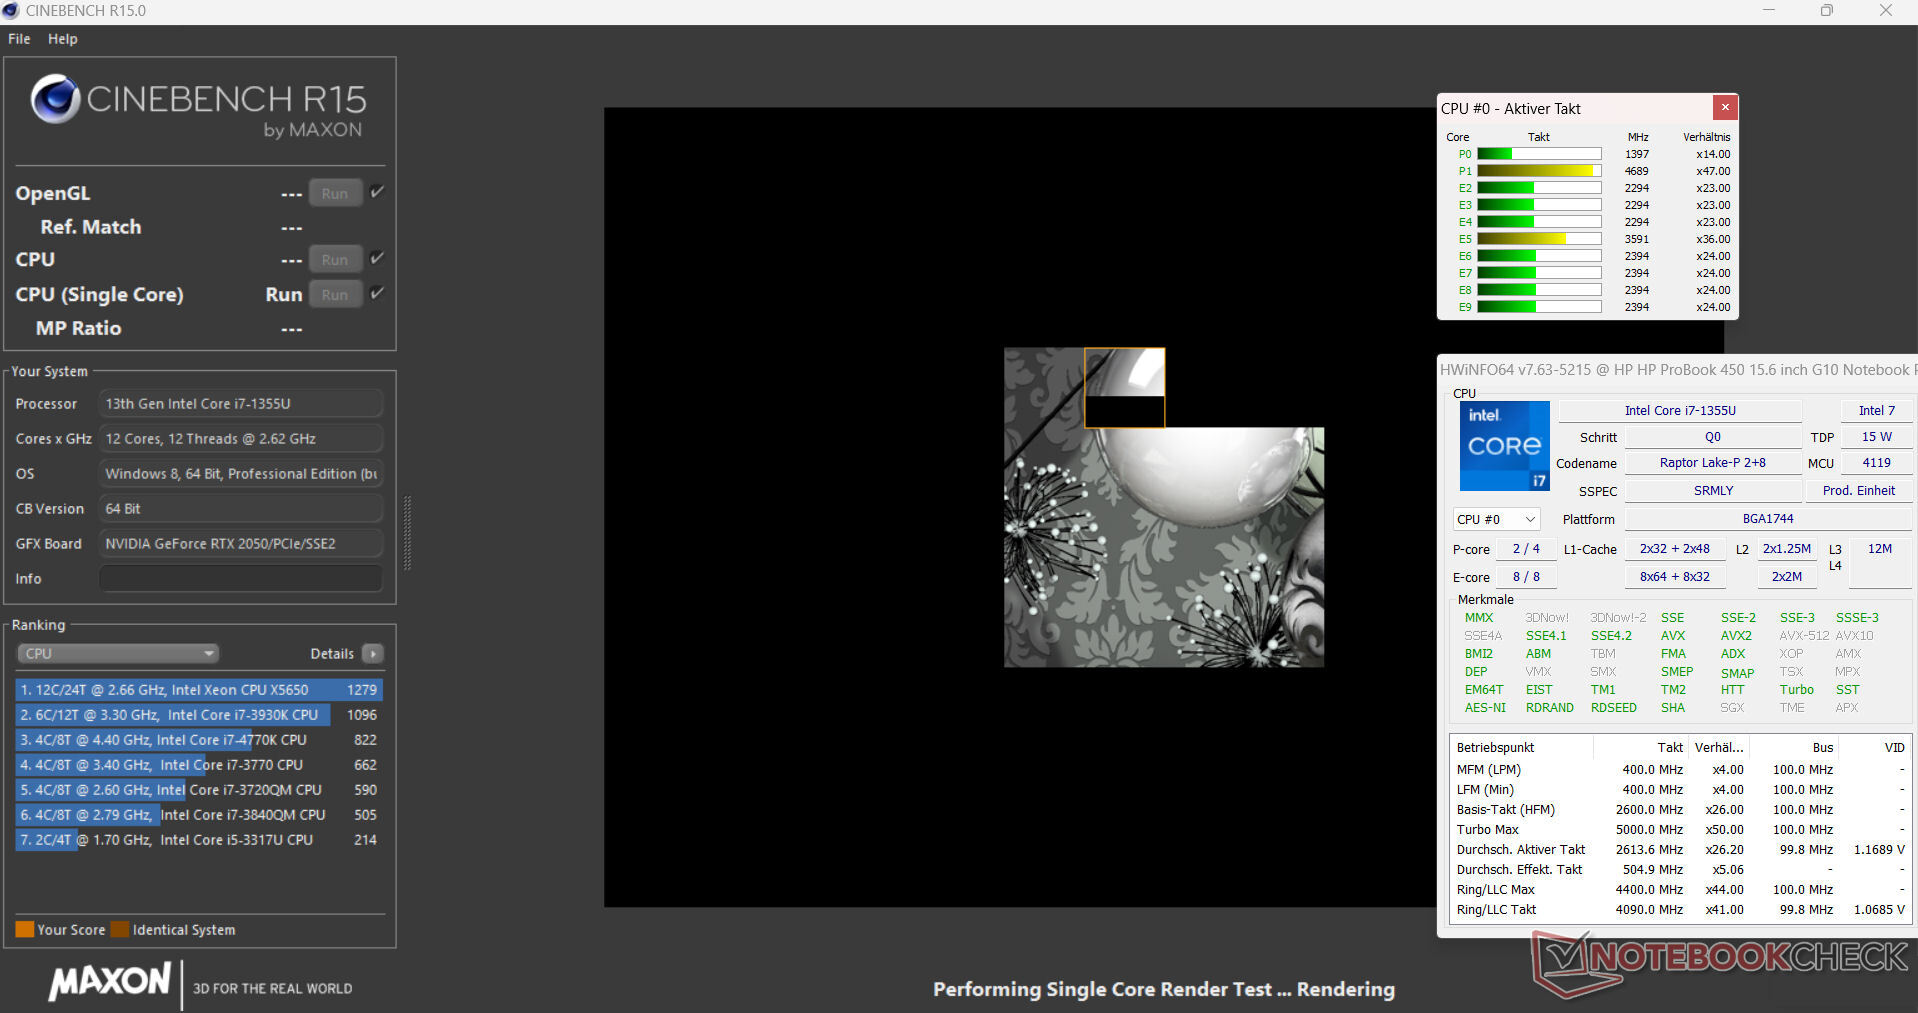
El Core i7-1355U's 10 núcleos de CPU (2P, 8E) alcanzan velocidades de reloj máximas de 5 GHz (P) y 3,7 GHz (E). La carga multihilo permanente (CB15 Loop) hace que la velocidad de reloj descienda un poco de la primera a la segunda ejecución. Después, se mantiene constante.
El Aspire equipado con la misma CPU obtuvo mejores resultados en el benchmark que el ProBook debido a su mayor Límite de Potencia 1 (28 vatios frente a 24 vatios). Este último ofreció unos resultados medios para la CPU instalada (cuando está conectado a la red eléctrica). En el uso en batería, su rendimiento más relevante en un solo subproceso (162 puntos; CB15) se hundió en menor medida que su rendimiento en varios subprocesos (673 puntos; CB15).
Cinebench R15 Multi continuous test
| CPU Performance rating - Percent | |
| Media de la clase Office | |
| Acer Aspire 5 A515-58GM-76S8 | |
| Medio Intel Core i7-1355U | |
| Lenovo ThinkPad L15 Gen 4 21H70021GE | |
| HP ProBook 450 G10 | |
| Schenker VIA 15 Pro M22 | |
| Dell Latitude 3440 | |
| Fujitsu LifeBook E5412A E542AMHAAMDE | |
| HWBOT x265 Benchmark v2.2 - 4k Preset | |
| Media de la clase Office (2.21 - 26, n=76, últimos 2 años) | |
| Schenker VIA 15 Pro M22 | |
| Lenovo ThinkPad L15 Gen 4 21H70021GE | |
| Acer Aspire 5 A515-58GM-76S8 | |
| Fujitsu LifeBook E5412A E542AMHAAMDE | |
| Medio Intel Core i7-1355U (7.83 - 11.4, n=18) | |
| HP ProBook 450 G10 | |
| Dell Latitude 3440 | |
| LibreOffice - 20 Documents To PDF | |
| Schenker VIA 15 Pro M22 | |
| Media de la clase Office (39.9 - 102.3, n=76, últimos 2 años) | |
| Fujitsu LifeBook E5412A E542AMHAAMDE | |
| HP ProBook 450 G10 | |
| Medio Intel Core i7-1355U (41.1 - 108.6, n=18) | |
| Lenovo ThinkPad L15 Gen 4 21H70021GE | |
| Dell Latitude 3440 | |
| Acer Aspire 5 A515-58GM-76S8 | |
| R Benchmark 2.5 - Overall mean | |
| Schenker VIA 15 Pro M22 | |
| Fujitsu LifeBook E5412A E542AMHAAMDE | |
| Lenovo ThinkPad L15 Gen 4 21H70021GE | |
| Media de la clase Office (0.393 - 0.888, n=76, últimos 2 años) | |
| Dell Latitude 3440 | |
| Medio Intel Core i7-1355U (0.4481 - 0.832, n=18) | |
| Acer Aspire 5 A515-58GM-76S8 | |
| HP ProBook 450 G10 | |
* ... más pequeño es mejor
AIDA64: FP32 Ray-Trace | FPU Julia | CPU SHA3 | CPU Queen | FPU SinJulia | FPU Mandel | CPU AES | CPU ZLib | FP64 Ray-Trace | CPU PhotoWorxx
| Performance rating | |
| Schenker VIA 15 Pro M22 | |
| Media de la clase Office | |
| Lenovo ThinkPad L15 Gen 4 21H70021GE | |
| Acer Aspire 5 A515-58GM-76S8 | |
| Fujitsu LifeBook E5412A E542AMHAAMDE | |
| Medio Intel Core i7-1355U | |
| HP ProBook 450 G10 | |
| Dell Latitude 3440 | |
| AIDA64 / FP32 Ray-Trace | |
| Media de la clase Office (2083 - 31245, n=83, últimos 2 años) | |
| Schenker VIA 15 Pro M22 | |
| Lenovo ThinkPad L15 Gen 4 21H70021GE | |
| Fujitsu LifeBook E5412A E542AMHAAMDE | |
| Acer Aspire 5 A515-58GM-76S8 | |
| HP ProBook 450 G10 | |
| Dell Latitude 3440 | |
| Medio Intel Core i7-1355U (5673 - 8424, n=18) | |
| AIDA64 / FPU Julia | |
| Lenovo ThinkPad L15 Gen 4 21H70021GE | |
| Schenker VIA 15 Pro M22 | |
| Media de la clase Office (8191 - 125394, n=83, últimos 2 años) | |
| Fujitsu LifeBook E5412A E542AMHAAMDE | |
| Acer Aspire 5 A515-58GM-76S8 | |
| Medio Intel Core i7-1355U (29580 - 42706, n=18) | |
| HP ProBook 450 G10 | |
| Dell Latitude 3440 | |
| AIDA64 / CPU SHA3 | |
| Media de la clase Office (433 - 5755, n=83, últimos 2 años) | |
| Lenovo ThinkPad L15 Gen 4 21H70021GE | |
| Schenker VIA 15 Pro M22 | |
| Acer Aspire 5 A515-58GM-76S8 | |
| Fujitsu LifeBook E5412A E542AMHAAMDE | |
| Medio Intel Core i7-1355U (1529 - 2200, n=18) | |
| Dell Latitude 3440 | |
| HP ProBook 450 G10 | |
| AIDA64 / CPU Queen | |
| Schenker VIA 15 Pro M22 | |
| Lenovo ThinkPad L15 Gen 4 21H70021GE | |
| Fujitsu LifeBook E5412A E542AMHAAMDE | |
| Acer Aspire 5 A515-58GM-76S8 | |
| HP ProBook 450 G10 | |
| Media de la clase Office (22784 - 115197, n=67, últimos 2 años) | |
| Medio Intel Core i7-1355U (21547 - 66907, n=18) | |
| Dell Latitude 3440 | |
| AIDA64 / FPU SinJulia | |
| Schenker VIA 15 Pro M22 | |
| Lenovo ThinkPad L15 Gen 4 21H70021GE | |
| Fujitsu LifeBook E5412A E542AMHAAMDE | |
| Media de la clase Office (1378 - 18321, n=83, últimos 2 años) | |
| Acer Aspire 5 A515-58GM-76S8 | |
| HP ProBook 450 G10 | |
| Medio Intel Core i7-1355U (4045 - 5426, n=18) | |
| Dell Latitude 3440 | |
| AIDA64 / FPU Mandel | |
| Lenovo ThinkPad L15 Gen 4 21H70021GE | |
| Schenker VIA 15 Pro M22 | |
| Media de la clase Office (4601 - 66922, n=83, últimos 2 años) | |
| Fujitsu LifeBook E5412A E542AMHAAMDE | |
| Acer Aspire 5 A515-58GM-76S8 | |
| Medio Intel Core i7-1355U (14596 - 21627, n=18) | |
| HP ProBook 450 G10 | |
| Dell Latitude 3440 | |
| AIDA64 / CPU AES | |
| Acer Aspire 5 A515-58GM-76S8 | |
| Media de la clase Office (4854 - 155900, n=83, últimos 2 años) | |
| Lenovo ThinkPad L15 Gen 4 21H70021GE | |
| Schenker VIA 15 Pro M22 | |
| Medio Intel Core i7-1355U (31432 - 75408, n=18) | |
| HP ProBook 450 G10 | |
| Dell Latitude 3440 | |
| Fujitsu LifeBook E5412A E542AMHAAMDE | |
| AIDA64 / CPU ZLib | |
| Schenker VIA 15 Pro M22 | |
| Media de la clase Office (114.6 - 1366, n=83, últimos 2 años) | |
| Lenovo ThinkPad L15 Gen 4 21H70021GE | |
| Acer Aspire 5 A515-58GM-76S8 | |
| Medio Intel Core i7-1355U (454 - 684, n=18) | |
| Dell Latitude 3440 | |
| HP ProBook 450 G10 | |
| Fujitsu LifeBook E5412A E542AMHAAMDE | |
| AIDA64 / FP64 Ray-Trace | |
| Media de la clase Office (1109 - 17834, n=83, últimos 2 años) | |
| Schenker VIA 15 Pro M22 | |
| Lenovo ThinkPad L15 Gen 4 21H70021GE | |
| Fujitsu LifeBook E5412A E542AMHAAMDE | |
| Acer Aspire 5 A515-58GM-76S8 | |
| Dell Latitude 3440 | |
| HP ProBook 450 G10 | |
| Medio Intel Core i7-1355U (2991 - 4453, n=18) | |
| AIDA64 / CPU PhotoWorxx | |
| Media de la clase Office (11090 - 65229, n=83, últimos 2 años) | |
| Medio Intel Core i7-1355U (21800 - 46154, n=18) | |
| HP ProBook 450 G10 | |
| Schenker VIA 15 Pro M22 | |
| Dell Latitude 3440 | |
| Acer Aspire 5 A515-58GM-76S8 | |
| Fujitsu LifeBook E5412A E542AMHAAMDE | |
| Lenovo ThinkPad L15 Gen 4 21H70021GE | |
Rendimiento del sistema
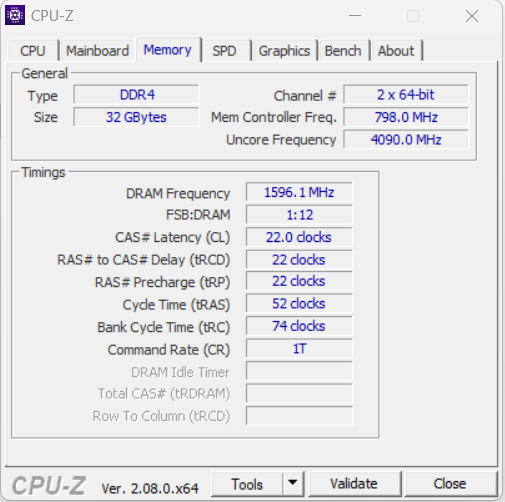
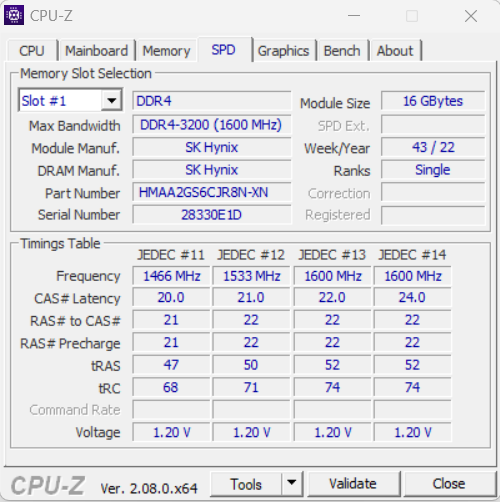
El sistema, que funciona sin problemas, domina los usos ofimáticos y de Internet, los programas que requieren un uso intensivo de la GPU, así como los juegos con requisitos moderados. Al igual que en su predecesor, HP confía en la memoria RAM DDR4-3200 para este portátil. Una DDR5 más moderna podría haber exprimido un poco más el rendimiento de la CPU. Las velocidades de datos de la RAM son normales para una RAM DDR4-3200. Sus resultados en PC Mark fueron buenos.
CrossMark: Overall | Productivity | Creativity | Responsiveness
| PCMark 10 / Score | |
| Media de la clase Office (2601 - 9298, n=68, últimos 2 años) | |
| Acer Aspire 5 A515-58GM-76S8 | |
| Medio Intel Core i7-1355U, NVIDIA GeForce RTX 2050 Mobile (6235 - 6540, n=3) | |
| HP ProBook 450 G10 | |
| Fujitsu LifeBook E5412A E542AMHAAMDE | |
| Lenovo ThinkPad L15 Gen 4 21H70021GE | |
| Dell Latitude 3440 | |
| Schenker VIA 15 Pro M22 | |
| PCMark 10 / Essentials | |
| Acer Aspire 5 A515-58GM-76S8 | |
| Medio Intel Core i7-1355U, NVIDIA GeForce RTX 2050 Mobile (10174 - 20841, n=3) | |
| Dell Latitude 3440 | |
| HP ProBook 450 G10 | |
| Media de la clase Office (3245 - 11594, n=68, últimos 2 años) | |
| Lenovo ThinkPad L15 Gen 4 21H70021GE | |
| Fujitsu LifeBook E5412A E542AMHAAMDE | |
| Schenker VIA 15 Pro M22 | |
| PCMark 10 / Productivity | |
| Media de la clase Office (5336 - 17243, n=68, últimos 2 años) | |
| Fujitsu LifeBook E5412A E542AMHAAMDE | |
| Lenovo ThinkPad L15 Gen 4 21H70021GE | |
| HP ProBook 450 G10 | |
| Acer Aspire 5 A515-58GM-76S8 | |
| Medio Intel Core i7-1355U, NVIDIA GeForce RTX 2050 Mobile (8449 - 8841, n=3) | |
| Schenker VIA 15 Pro M22 | |
| Dell Latitude 3440 | |
| PCMark 10 / Digital Content Creation | |
| Media de la clase Office (2049 - 13541, n=68, últimos 2 años) | |
| Acer Aspire 5 A515-58GM-76S8 | |
| Medio Intel Core i7-1355U, NVIDIA GeForce RTX 2050 Mobile (7278 - 7967, n=3) | |
| HP ProBook 450 G10 | |
| Schenker VIA 15 Pro M22 | |
| Dell Latitude 3440 | |
| Fujitsu LifeBook E5412A E542AMHAAMDE | |
| Lenovo ThinkPad L15 Gen 4 21H70021GE | |
| CrossMark / Overall | |
| Acer Aspire 5 A515-58GM-76S8 | |
| Medio Intel Core i7-1355U, NVIDIA GeForce RTX 2050 Mobile (1629 - 1794, n=3) | |
| HP ProBook 450 G10 | |
| Media de la clase Office (381 - 2010, n=75, últimos 2 años) | |
| Dell Latitude 3440 | |
| Fujitsu LifeBook E5412A E542AMHAAMDE | |
| Lenovo ThinkPad L15 Gen 4 21H70021GE | |
| Schenker VIA 15 Pro M22 | |
| CrossMark / Productivity | |
| Acer Aspire 5 A515-58GM-76S8 | |
| Medio Intel Core i7-1355U, NVIDIA GeForce RTX 2050 Mobile (1635 - 1870, n=3) | |
| HP ProBook 450 G10 | |
| Media de la clase Office (464 - 1880, n=75, últimos 2 años) | |
| Dell Latitude 3440 | |
| Fujitsu LifeBook E5412A E542AMHAAMDE | |
| Lenovo ThinkPad L15 Gen 4 21H70021GE | |
| Schenker VIA 15 Pro M22 | |
| CrossMark / Creativity | |
| Medio Intel Core i7-1355U, NVIDIA GeForce RTX 2050 Mobile (1655 - 1766, n=3) | |
| HP ProBook 450 G10 | |
| Media de la clase Office (319 - 2361, n=75, últimos 2 años) | |
| Acer Aspire 5 A515-58GM-76S8 | |
| Dell Latitude 3440 | |
| Fujitsu LifeBook E5412A E542AMHAAMDE | |
| Lenovo ThinkPad L15 Gen 4 21H70021GE | |
| Schenker VIA 15 Pro M22 | |
| CrossMark / Responsiveness | |
| Acer Aspire 5 A515-58GM-76S8 | |
| Medio Intel Core i7-1355U, NVIDIA GeForce RTX 2050 Mobile (1504 - 2017, n=3) | |
| HP ProBook 450 G10 | |
| Media de la clase Office (360 - 1820, n=75, últimos 2 años) | |
| Dell Latitude 3440 | |
| Schenker VIA 15 Pro M22 | |
| Lenovo ThinkPad L15 Gen 4 21H70021GE | |
| Fujitsu LifeBook E5412A E542AMHAAMDE | |
| PCMark 10 Score | 6235 puntos | |
ayuda | ||
| AIDA64 / Memory Copy | |
| Media de la clase Office (20075 - 110930, n=80, últimos 2 años) | |
| Medio Intel Core i7-1355U (35017 - 71600, n=18) | |
| HP ProBook 450 G10 | |
| Acer Aspire 5 A515-58GM-76S8 | |
| Dell Latitude 3440 | |
| Schenker VIA 15 Pro M22 | |
| Fujitsu LifeBook E5412A E542AMHAAMDE | |
| Lenovo ThinkPad L15 Gen 4 21H70021GE | |
| AIDA64 / Memory Read | |
| Media de la clase Office (10084 - 128030, n=81, últimos 2 años) | |
| Medio Intel Core i7-1355U (38551 - 73377, n=18) | |
| HP ProBook 450 G10 | |
| Schenker VIA 15 Pro M22 | |
| Acer Aspire 5 A515-58GM-76S8 | |
| Dell Latitude 3440 | |
| Fujitsu LifeBook E5412A E542AMHAAMDE | |
| Lenovo ThinkPad L15 Gen 4 21H70021GE | |
| AIDA64 / Memory Write | |
| Media de la clase Office (20073 - 119858, n=81, últimos 2 años) | |
| Medio Intel Core i7-1355U (35910 - 93342, n=18) | |
| HP ProBook 450 G10 | |
| Schenker VIA 15 Pro M22 | |
| Dell Latitude 3440 | |
| Acer Aspire 5 A515-58GM-76S8 | |
| Fujitsu LifeBook E5412A E542AMHAAMDE | |
| Lenovo ThinkPad L15 Gen 4 21H70021GE | |
| AIDA64 / Memory Latency | |
| Medio Intel Core i7-1355U (72.2 - 346, n=18) | |
| Media de la clase Office (7.6 - 162.9, n=76, últimos 2 años) | |
| Lenovo ThinkPad L15 Gen 4 21H70021GE | |
| Fujitsu LifeBook E5412A E542AMHAAMDE | |
| Schenker VIA 15 Pro M22 | |
| Dell Latitude 3440 | |
| Acer Aspire 5 A515-58GM-76S8 | |
| HP ProBook 450 G10 | |
* ... más pequeño es mejor
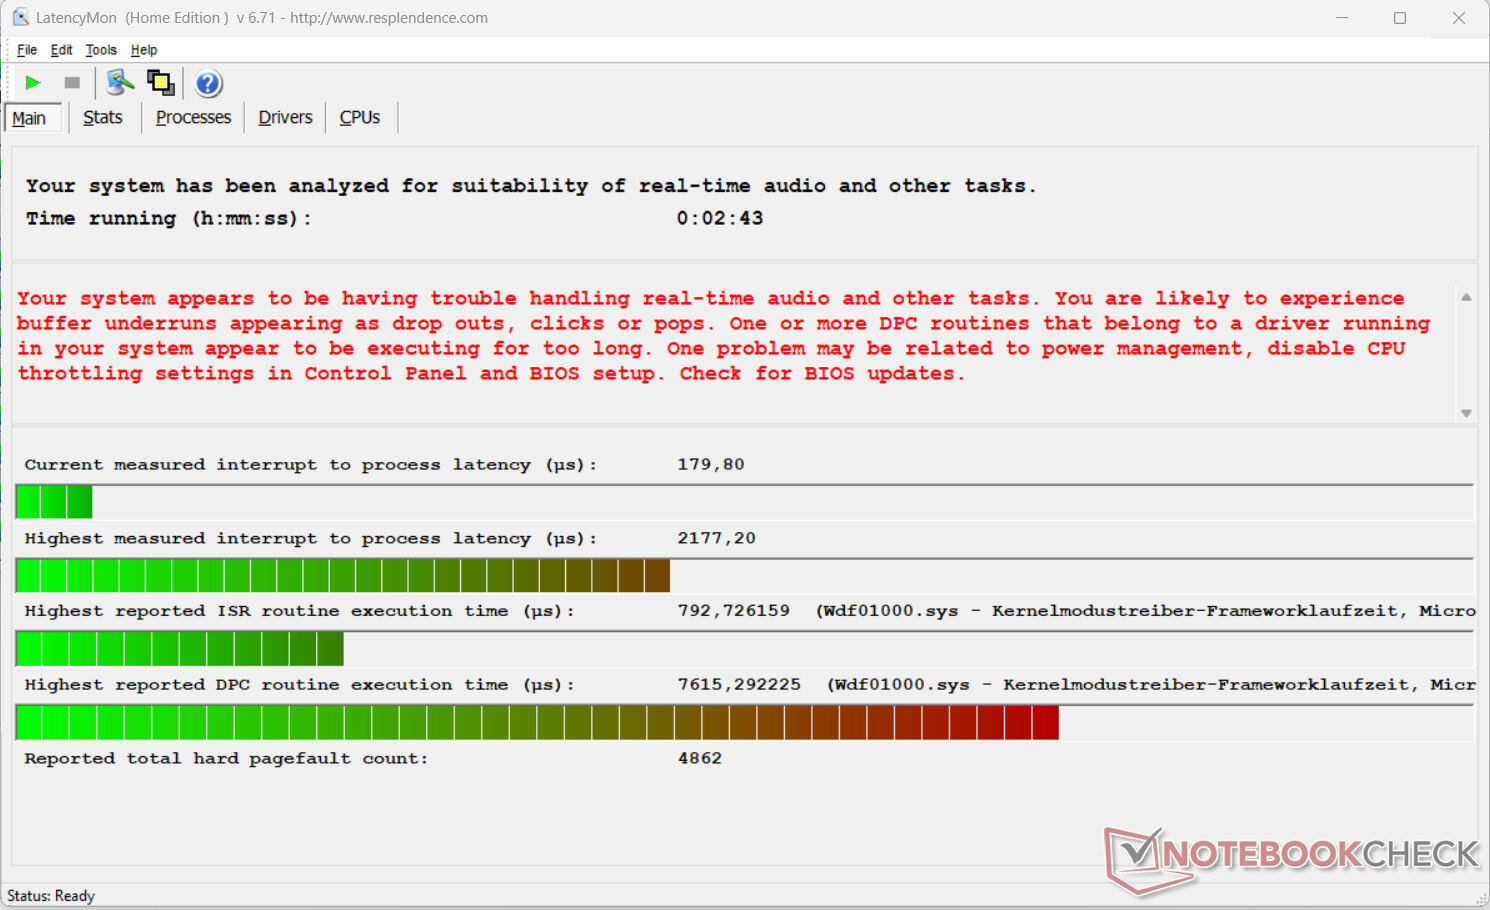
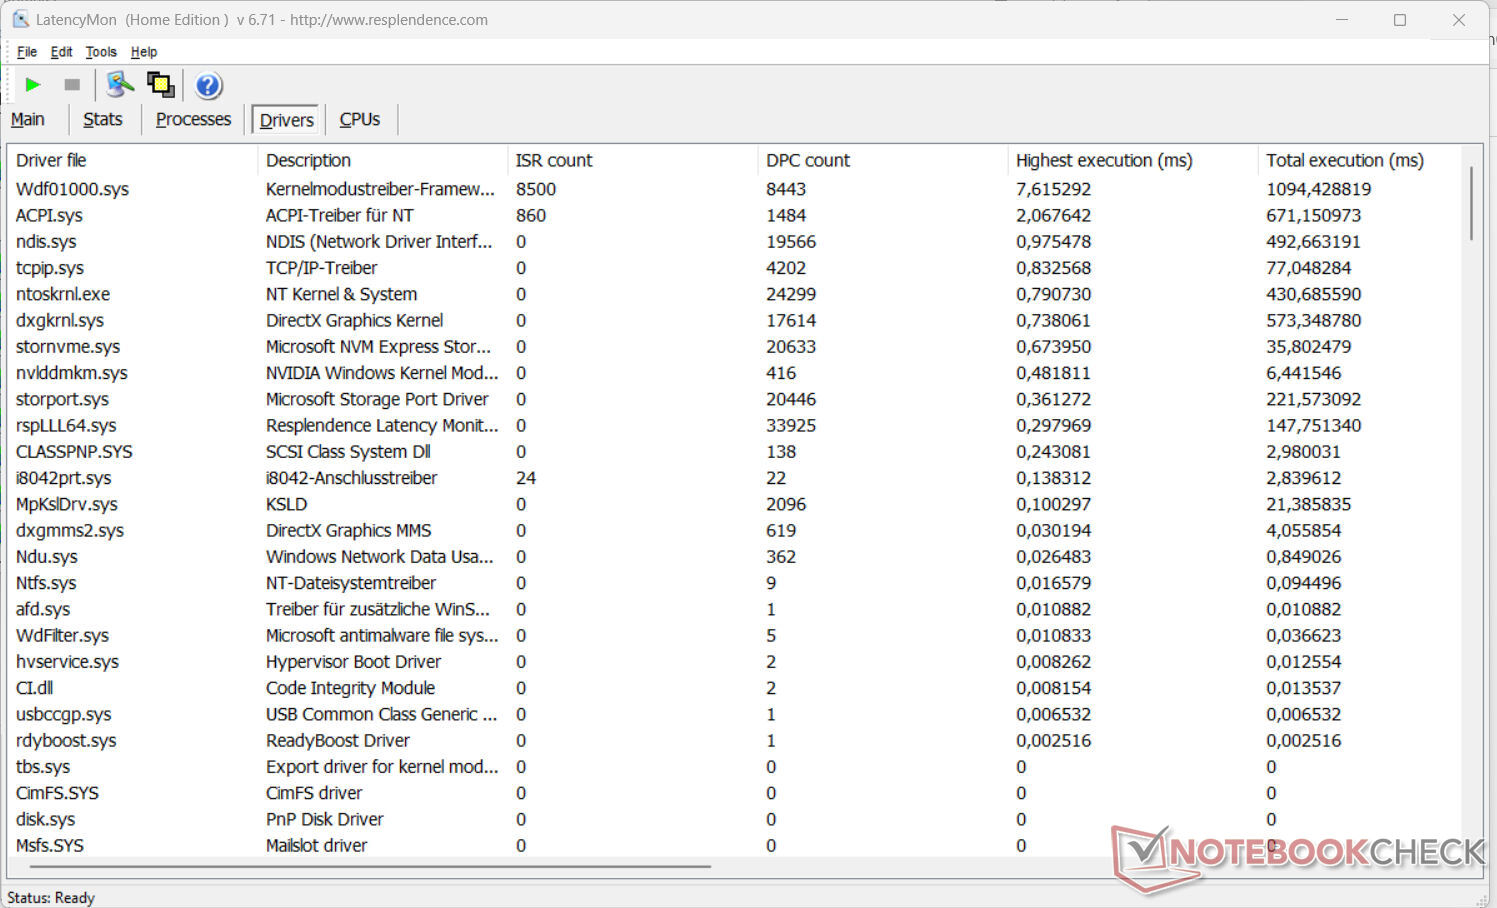
Latencia del CPD
La prueba de monitorización de latencia estandarizada (navegación web, reproducción de vídeo 4k, Prime95 de alta carga) reveló algunas anomalías. El sistema no parece adecuado para la edición de vídeo y audio en tiempo real. Futuras actualizaciones del software podrían suponer mejoras o incluso deterioros.
| DPC Latencies / LatencyMon - interrupt to process latency (max), Web, Youtube, Prime95 | |
| HP ProBook 450 G10 | |
| Schenker VIA 15 Pro M22 | |
| Dell Latitude 3440 | |
| Fujitsu LifeBook E5412A E542AMHAAMDE | |
| Lenovo ThinkPad L15 Gen 4 21H70021GE | |
| Acer Aspire 5 A515-58GM-76S8 | |
* ... más pequeño es mejor
Dispositivos de almacenamiento
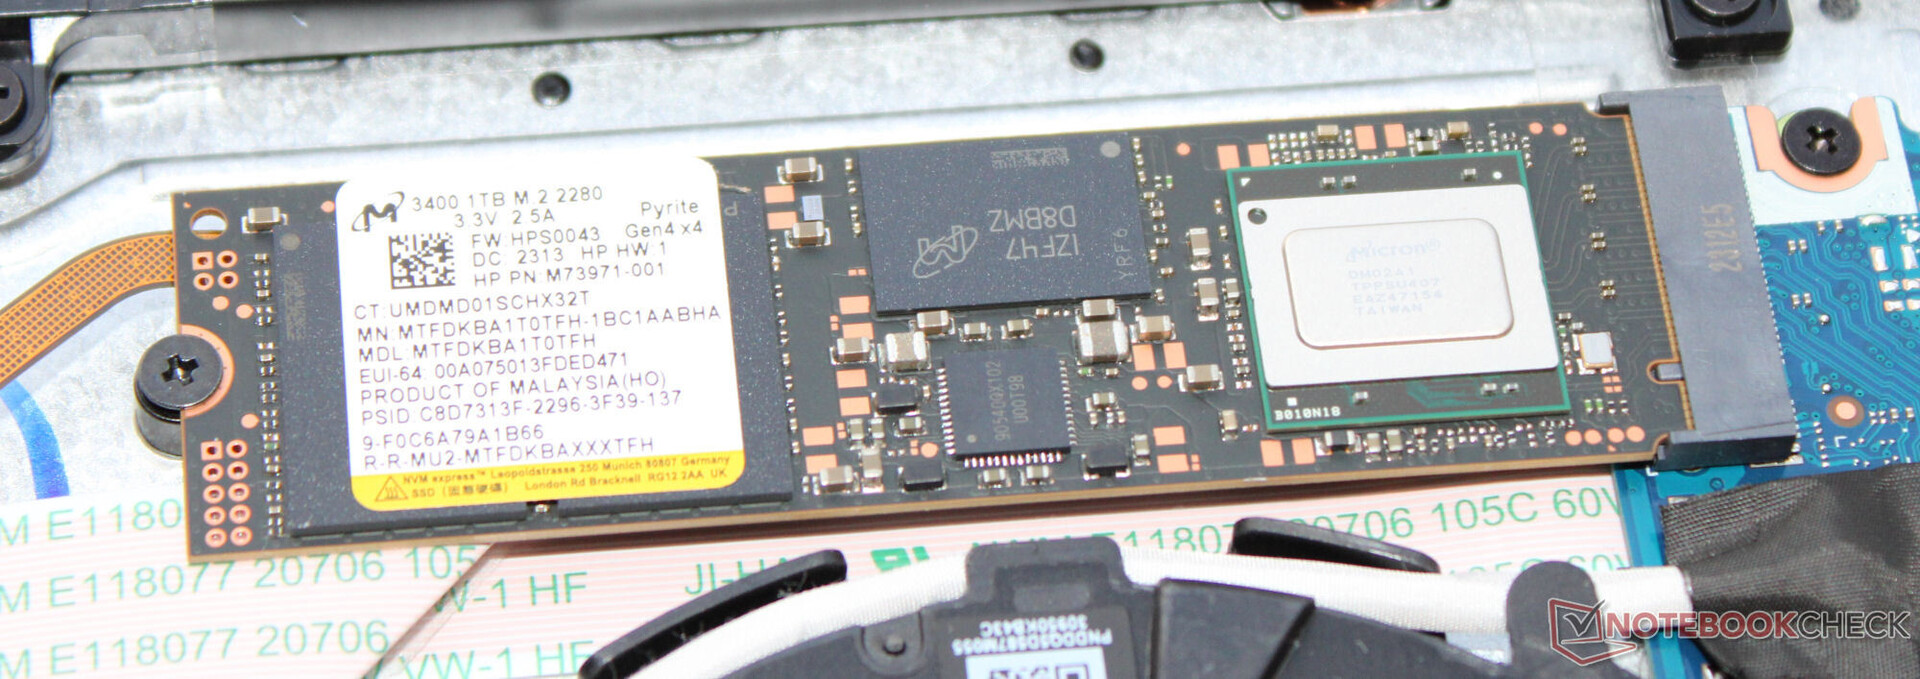
La unidad SSD PCIe 4 (M.2-2280) de Micron del dispositivo tiene una capacidad de 1 TB y ofreció una excelente velocidad de datos durante nuestra prueba. Una pena: Al cabo de poco tiempo, notamos cierta ralentización térmica. El portátil tiene espacio para una segunda SSD PCIe (sólo M.2-2242 o M.2-2230 con la placa de sujeción correspondiente).

| Drive Performance rating - Percent | |
| Acer Aspire 5 A515-58GM-76S8 | |
| HP ProBook 450 G10 | |
| Medio Micron 3400 1TB MTFDKBA1T0TFH | |
| Schenker VIA 15 Pro M22 | |
| Dell Latitude 3440 | |
| Media de la clase Office | |
| Lenovo ThinkPad L15 Gen 4 21H70021GE | |
| Fujitsu LifeBook E5412A E542AMHAAMDE | |
* ... más pequeño es mejor
Reading continuous performance: DiskSpd Read Loop, Queue Depth 8
Tarjeta gráfica
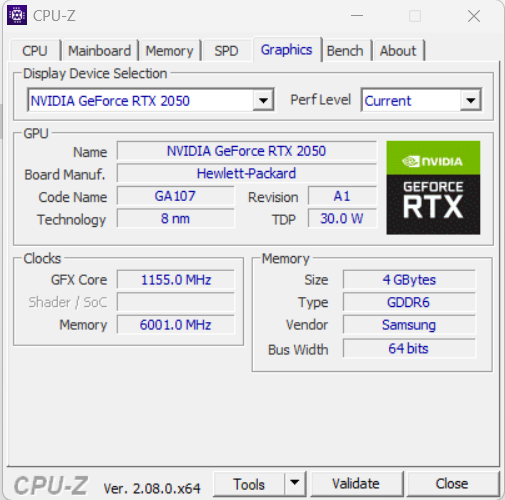
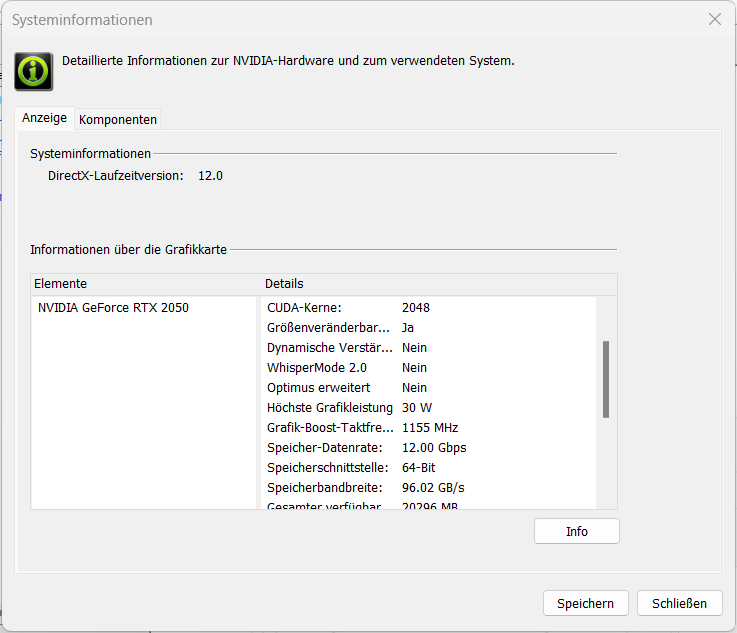
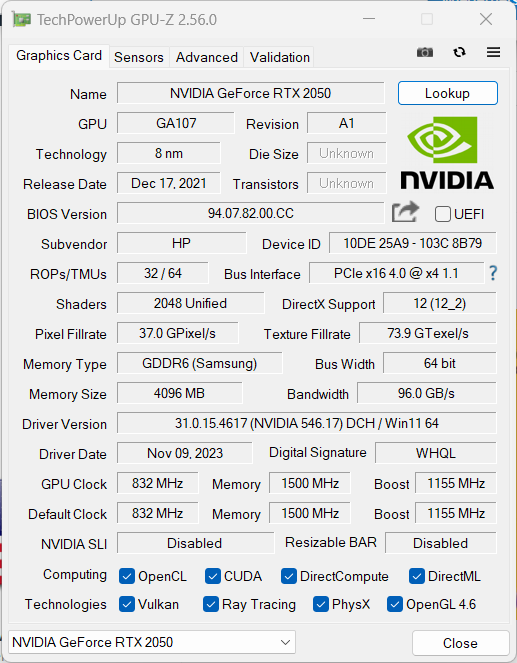
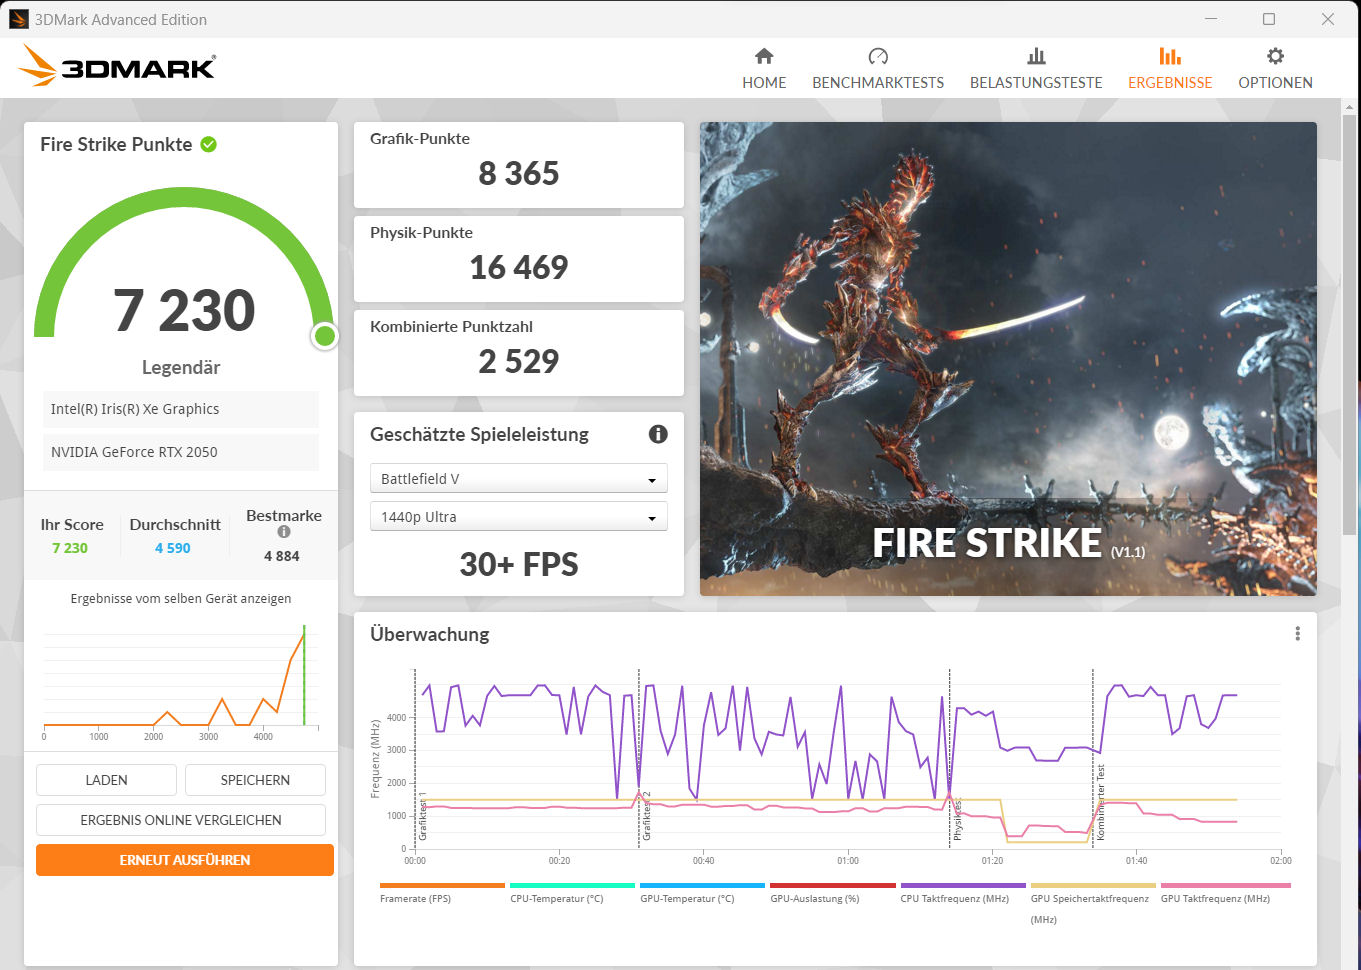
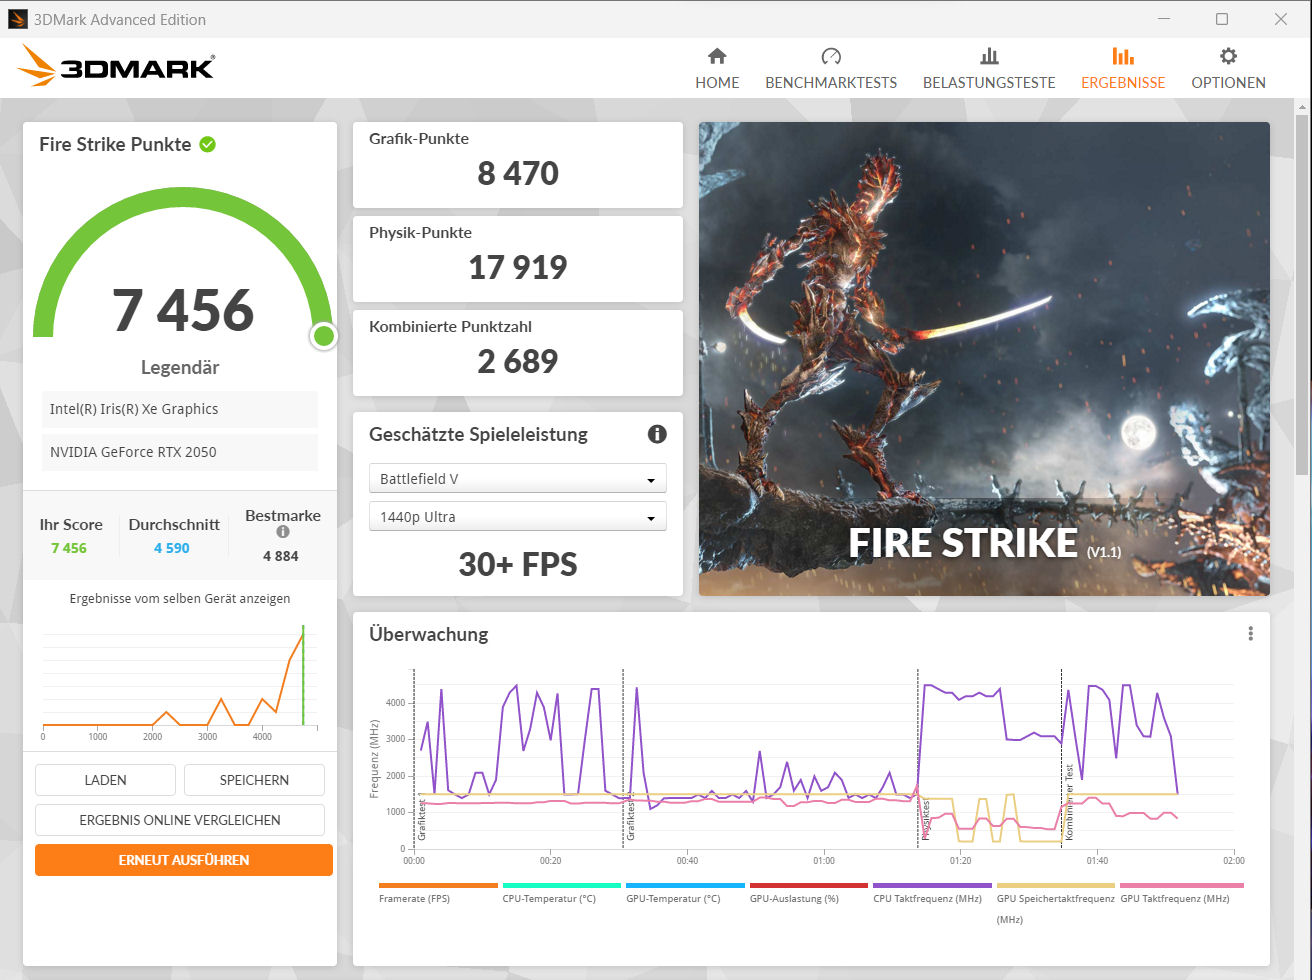
Dentro de la gama actual de GPUs RTX de Nvidia, la GeForce RTX 2050 es el modelo más débil. La GPU ofrece 2.048 sombreadores, un bus de 64 bits de ancho, memoria RAM GDDR6 rápida (4.096 MB), trazado de rayos y DLSS. HP le ha dado un TGP de 30 vatios, un valor en el margen inferior de lo posible. Como era de esperar, sus resultados en los bancos de pruebas quedaron por debajo de la media de la anterior RTX-2050.
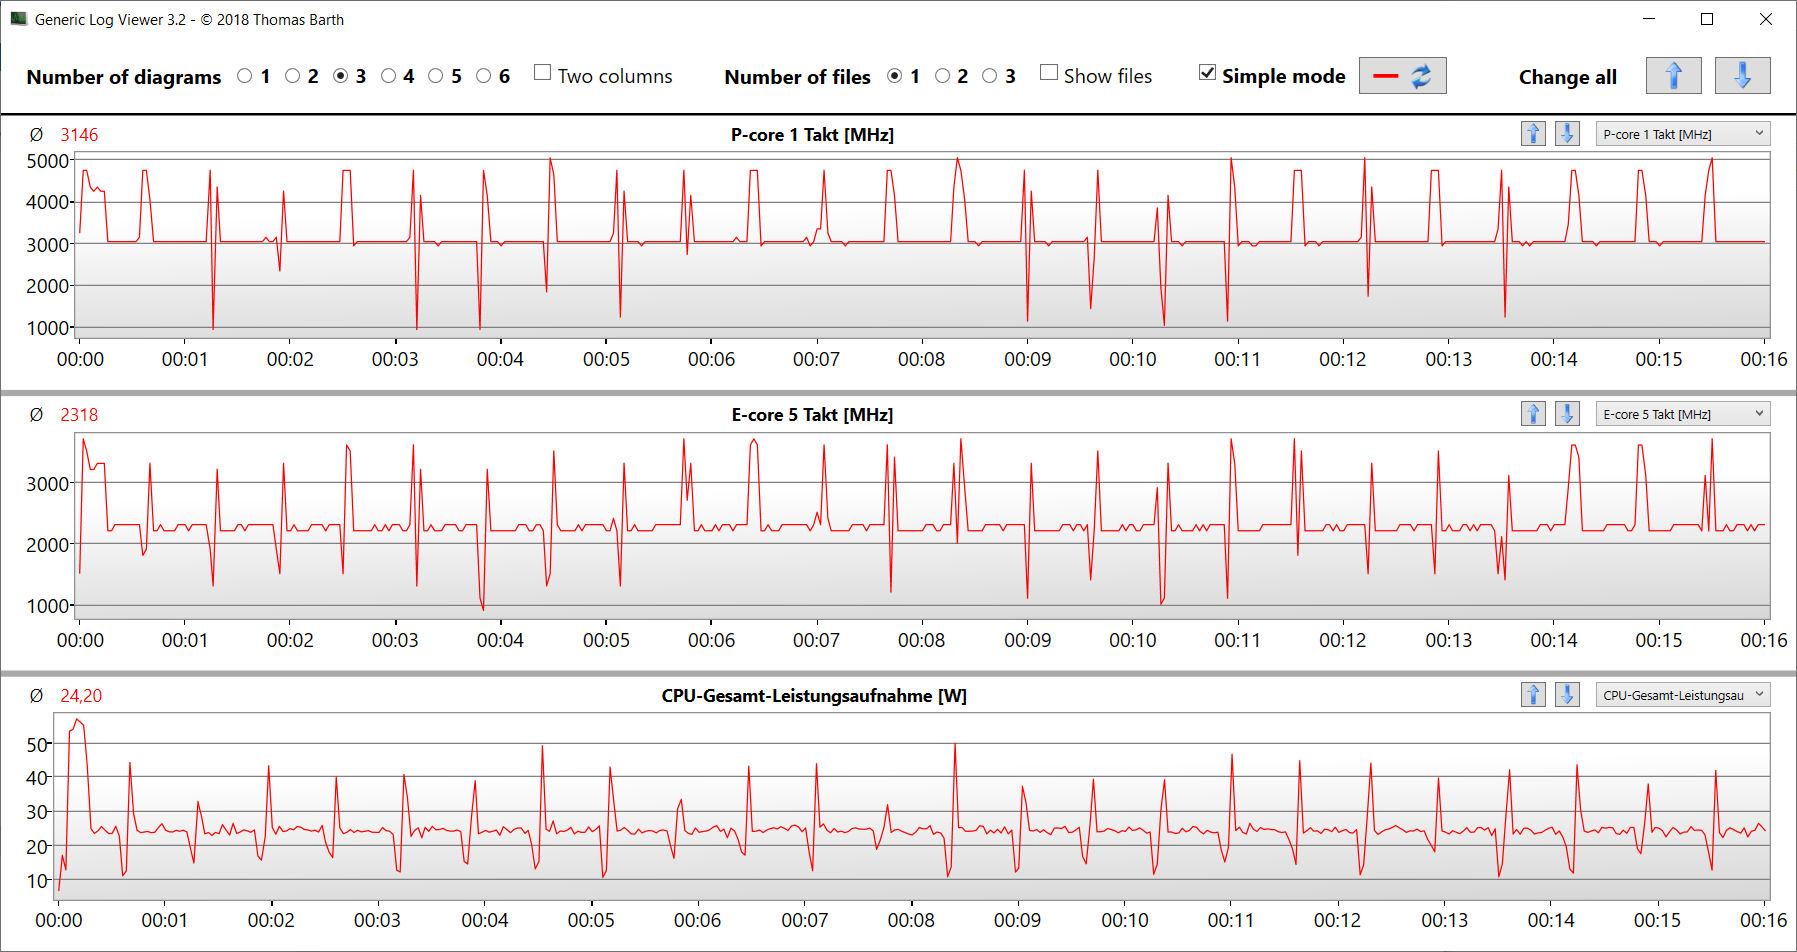
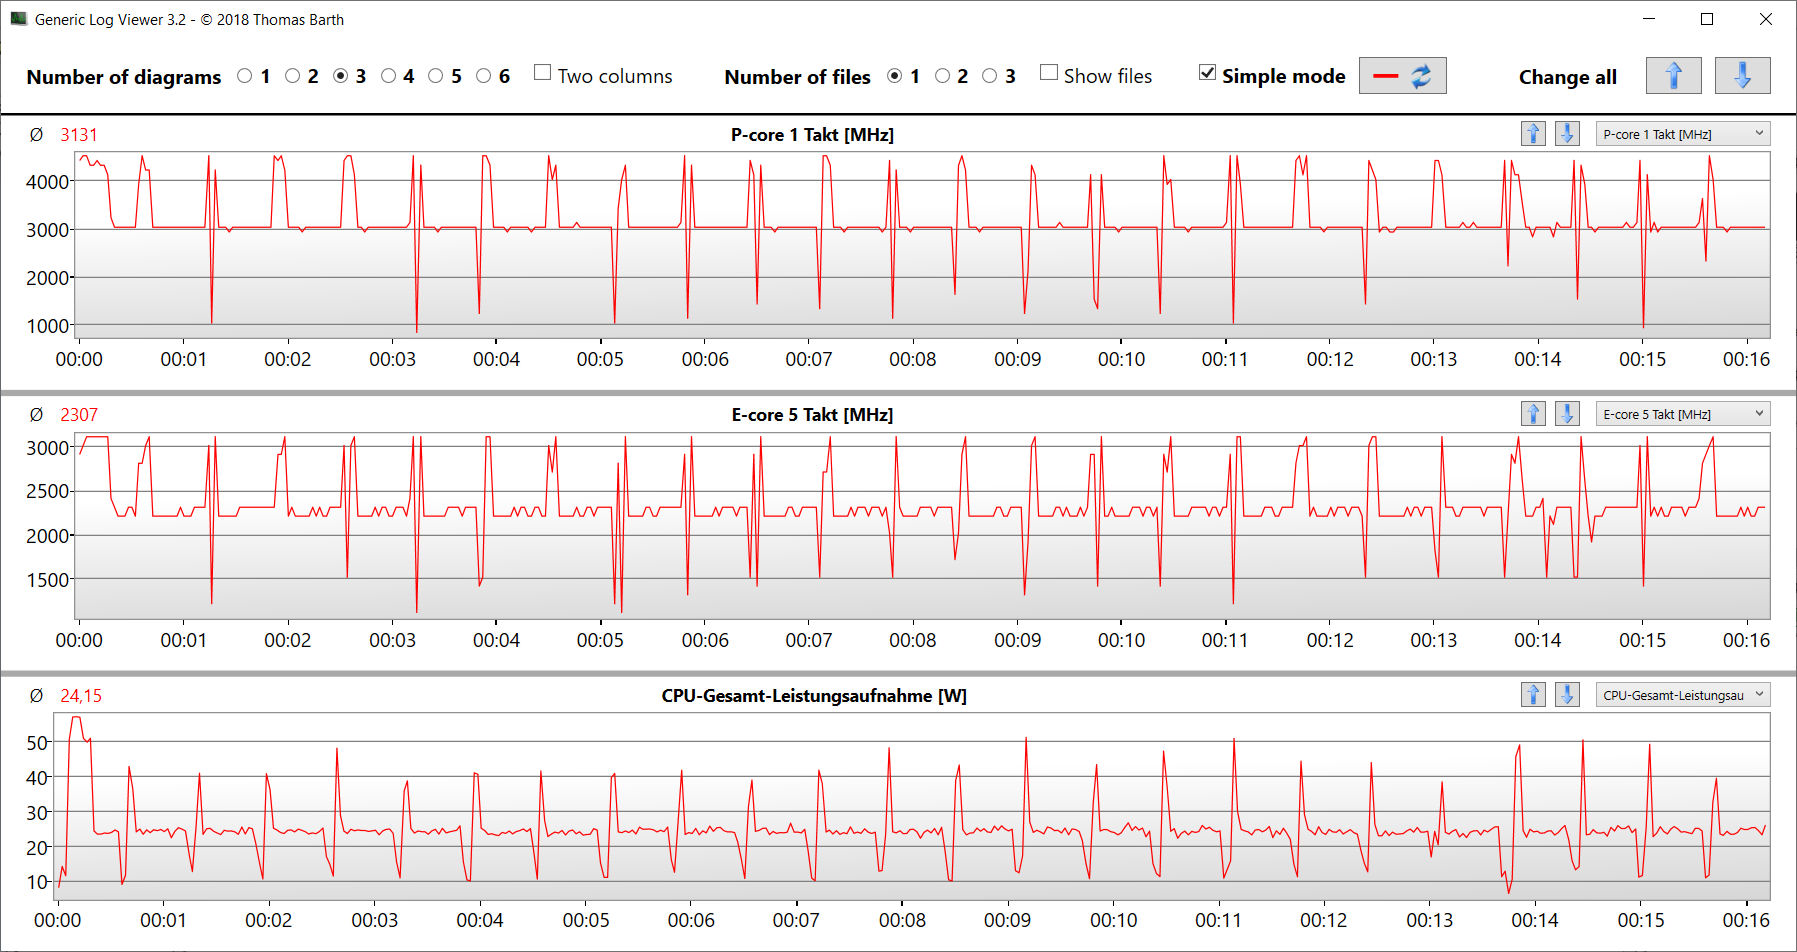
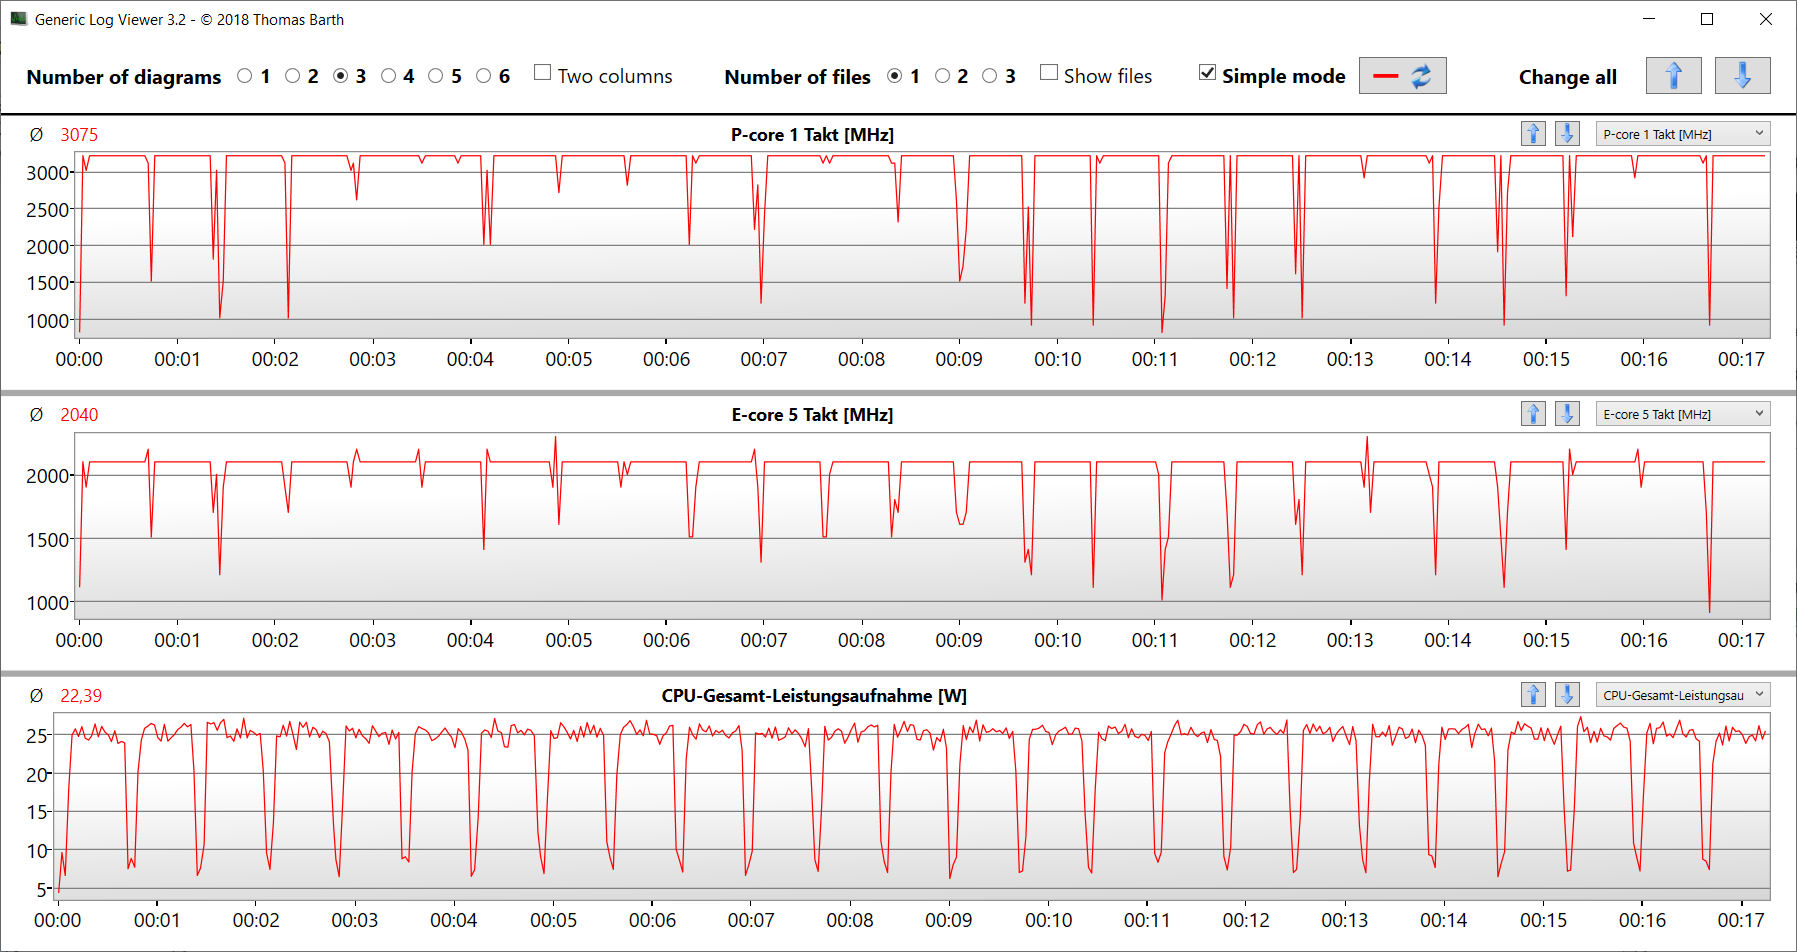
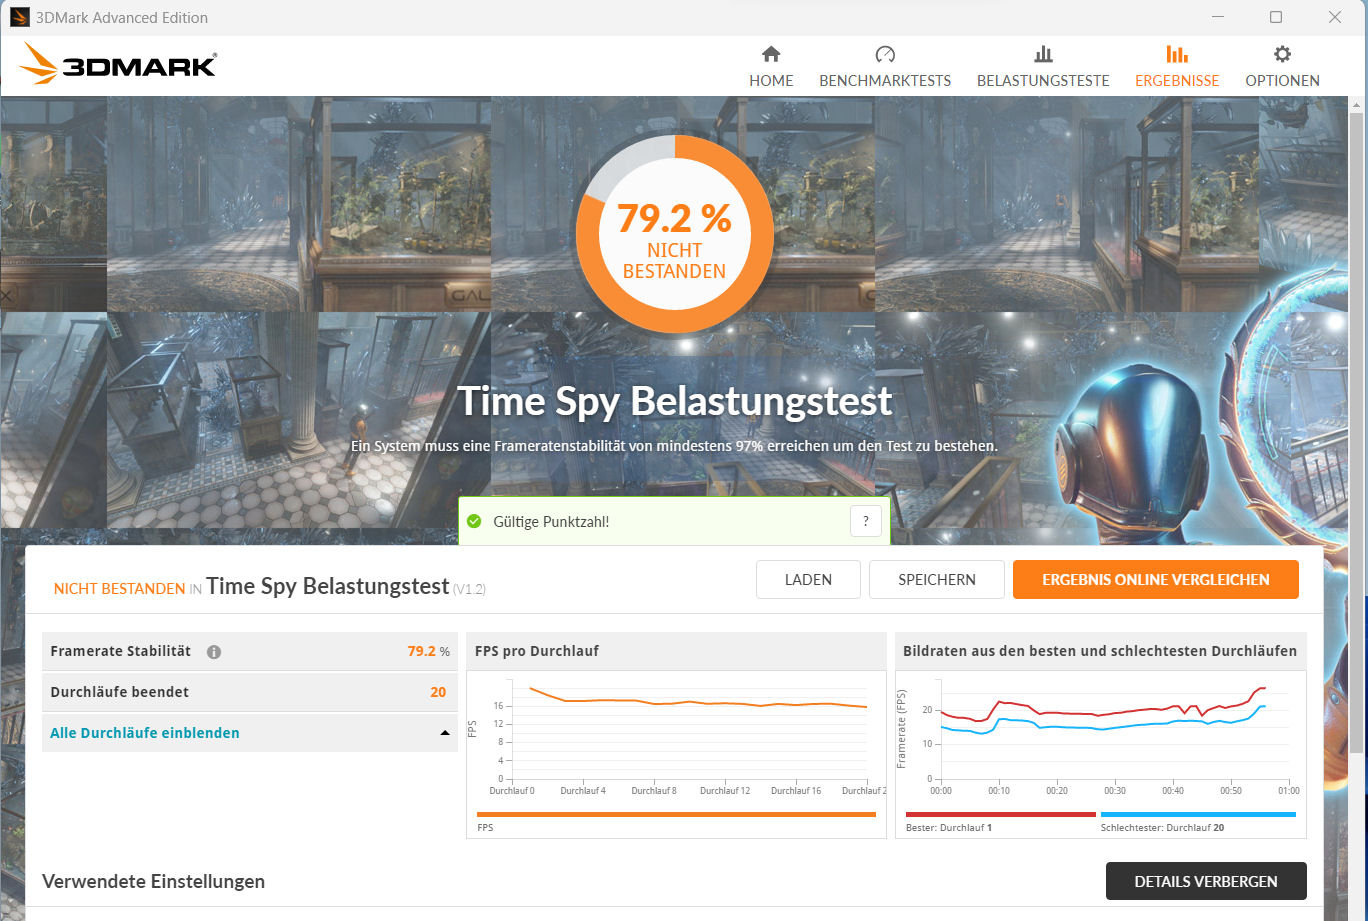
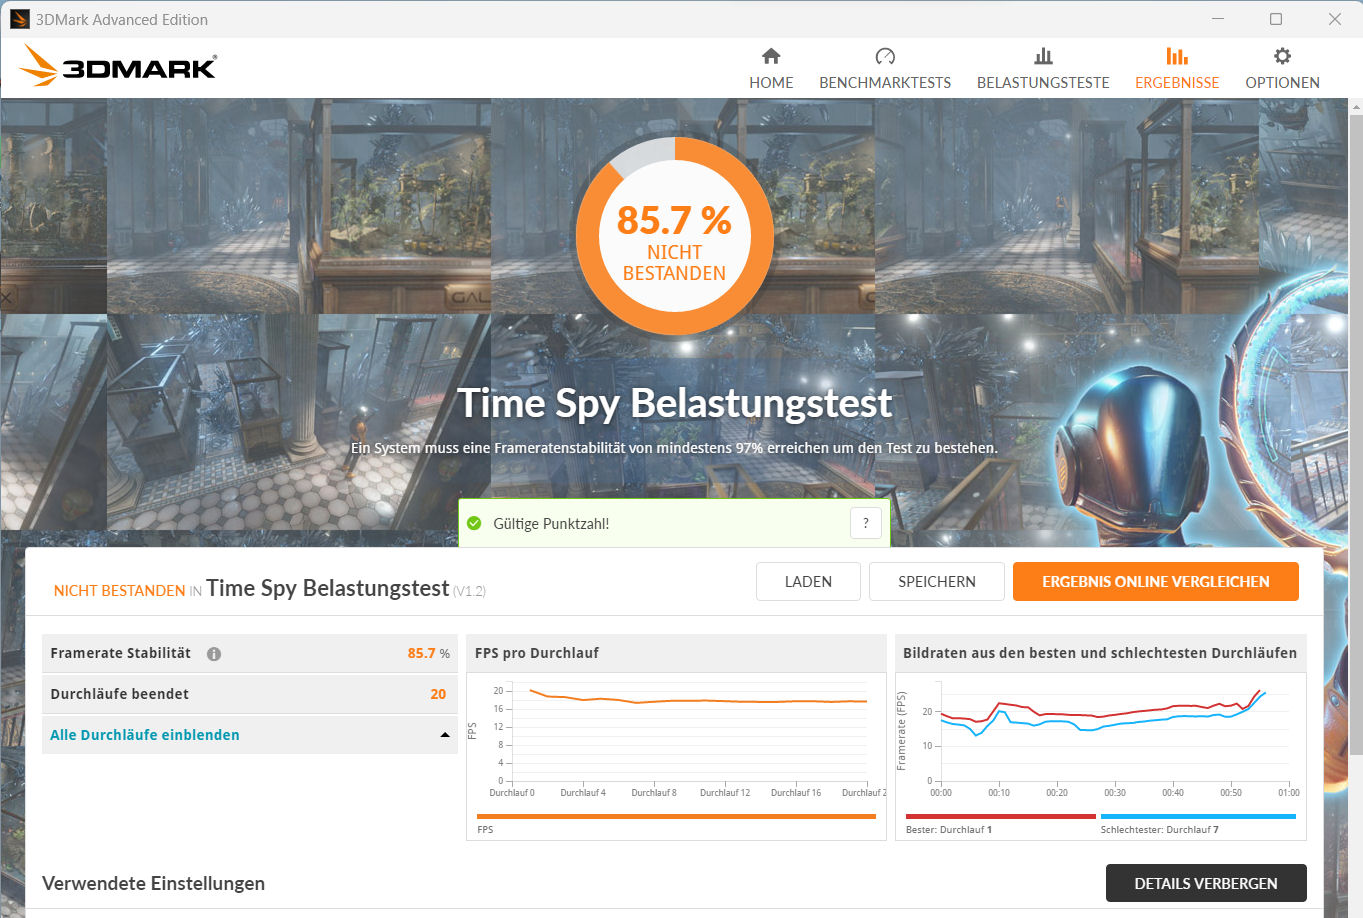
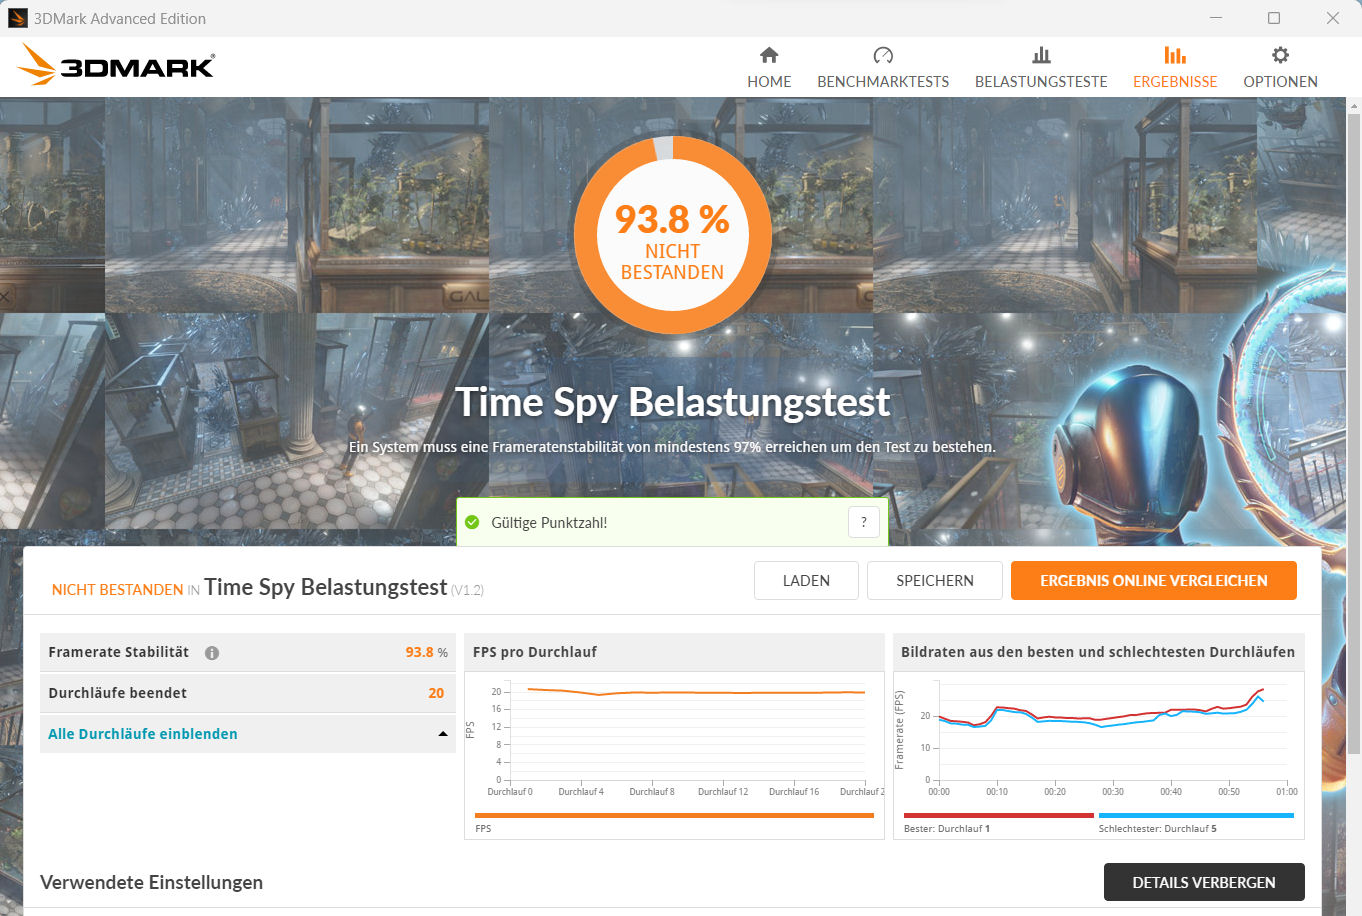
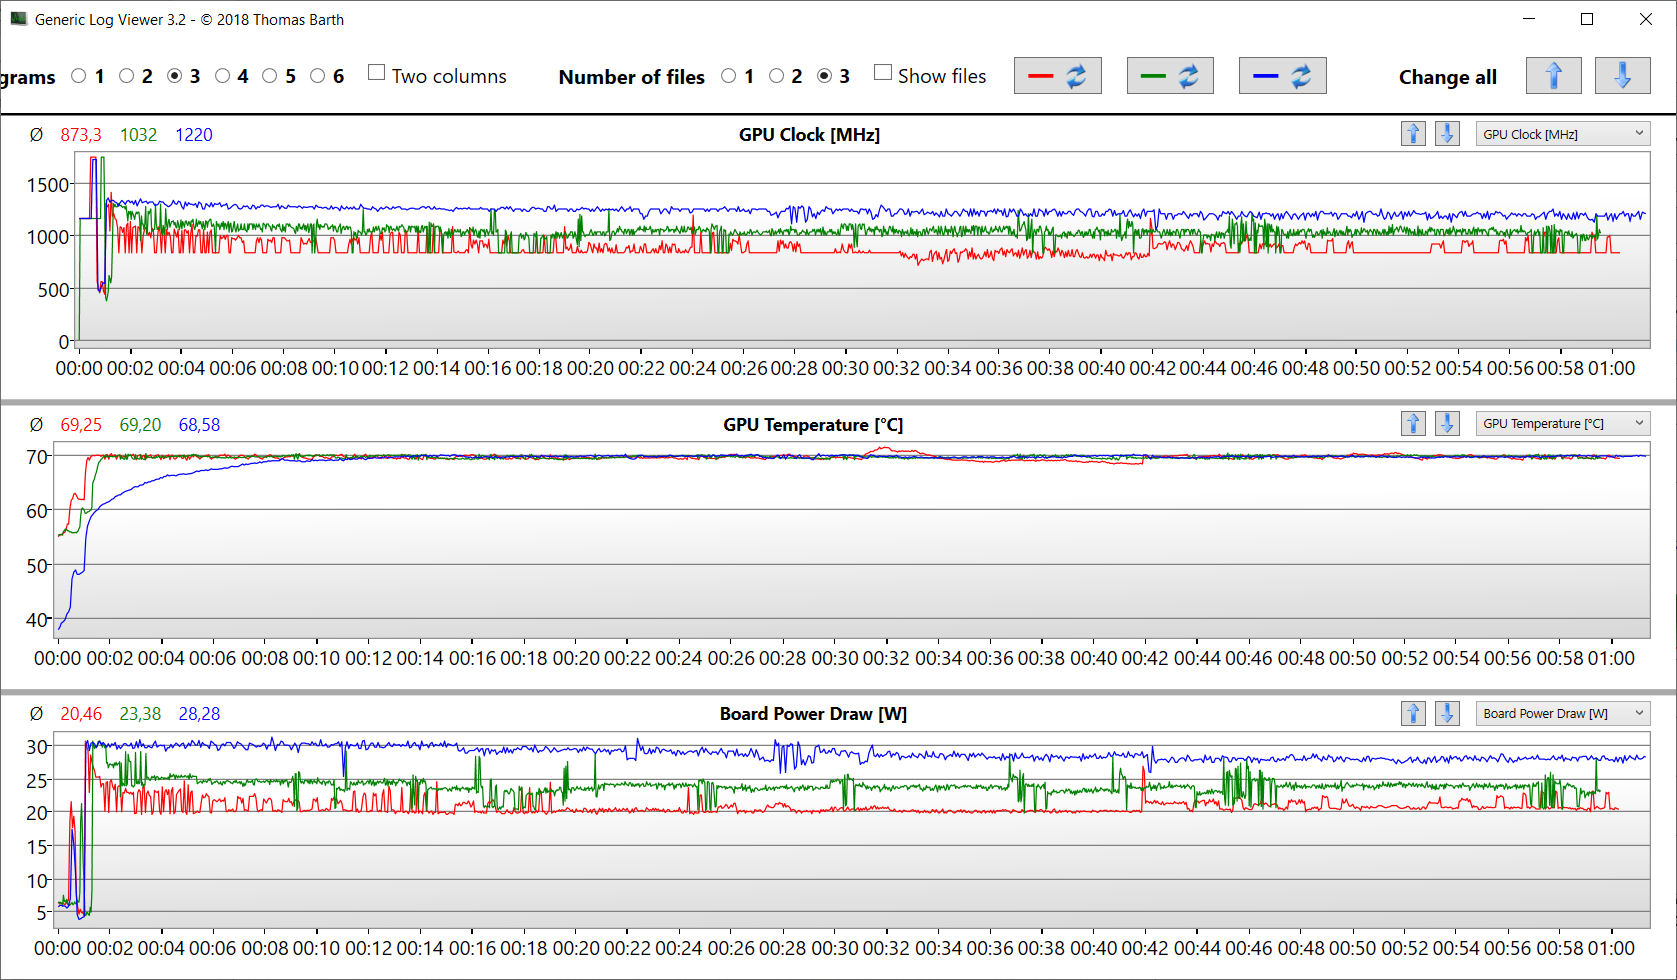
La GPU puede funcionar a plena potencia durante un breve periodo de tiempo y, a la larga, sus frecuencias de reloj se reducen. El alcance depende del perfil de energía seleccionado, aunque en contra de lo esperado: "Mejor rendimiento" tiene el mayor efecto, "Mejor ahorro de energía" provoca la menor caída. Los Witcher 3 datos del registro de pruebas muestran estas diferencias muy claramente (imagen más abajo). La prueba de estrés Time Spy evidencia aún más este comportamiento.
Nota: No podemos descartar un error en nuestro dispositivo de prueba. Si resulta ser un problema general, HP podría solucionarlo con la ayuda de una futura actualización de la BIOS.

| 3DMark Performance rating - Percent | |
| Medio NVIDIA GeForce RTX 2050 Mobile | |
| Acer Aspire 5 A515-58GM-76S8 | |
| HP ProBook 450 G10 | |
| Media de la clase Office | |
| Schenker VIA 15 Pro M22 -1! | |
| Dell Latitude 3440 -1! | |
| Fujitsu LifeBook E5412A E542AMHAAMDE | |
| Lenovo ThinkPad L15 Gen 4 21H70021GE | |
| 3DMark 11 - 1280x720 Performance GPU | |
| Medio NVIDIA GeForce RTX 2050 Mobile (10598 - 15411, n=10) | |
| Acer Aspire 5 A515-58GM-76S8 | |
| HP ProBook 450 G10 | |
| Media de la clase Office (2551 - 18313, n=72, últimos 2 años) | |
| Schenker VIA 15 Pro M22 | |
| Fujitsu LifeBook E5412A E542AMHAAMDE | |
| Dell Latitude 3440 | |
| Lenovo ThinkPad L15 Gen 4 21H70021GE | |
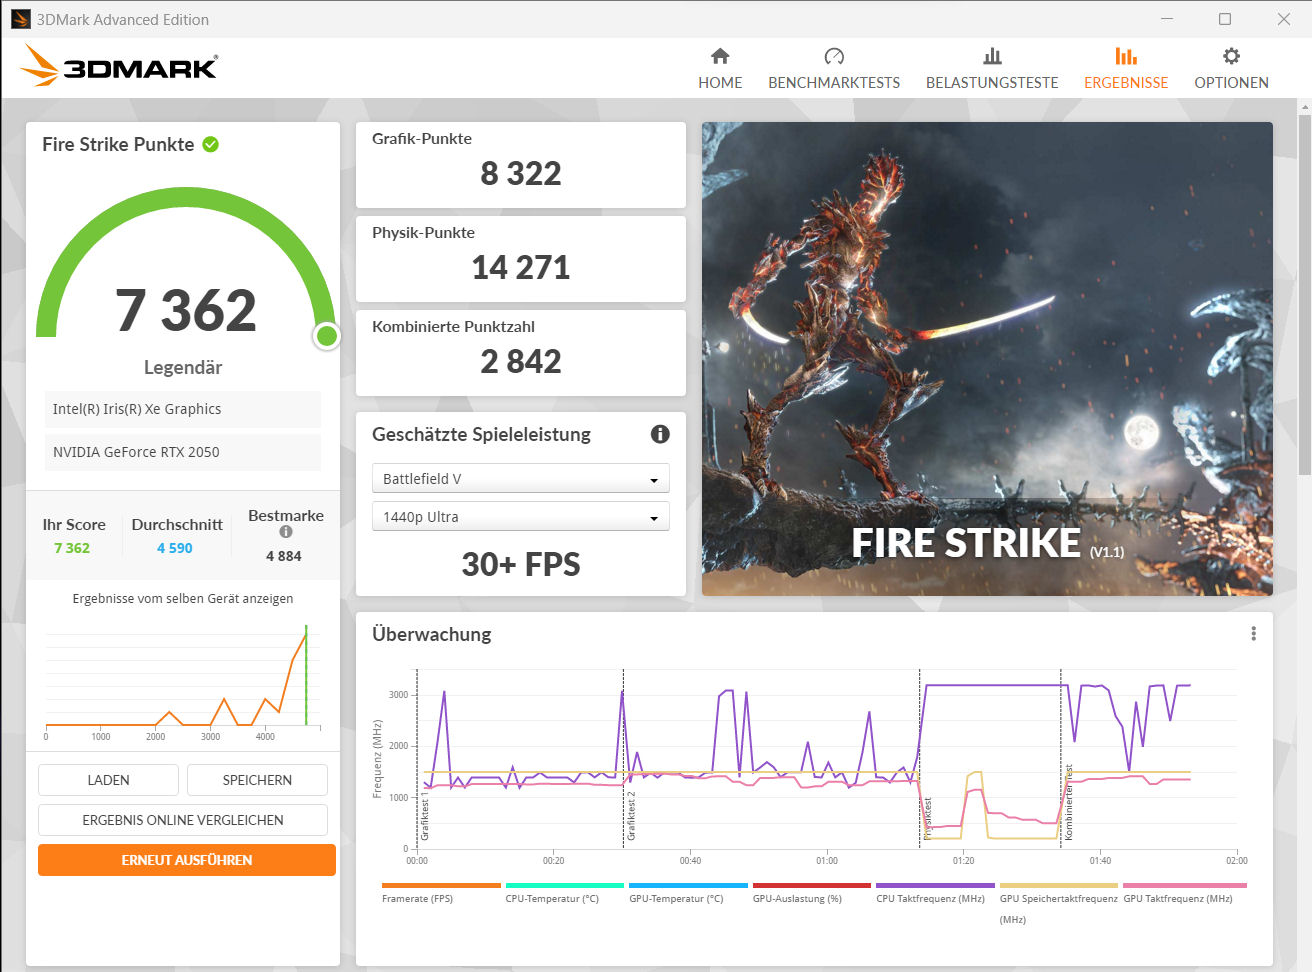
| 3DMark 06 Standard Score | 38036 puntos | |
| 3DMark 11 Performance | 10898 puntos | |
| 3DMark Cloud Gate Standard Score | 25686 puntos | |
| 3DMark Fire Strike Score | 7230 puntos | |
| 3DMark Time Spy Score | 3129 puntos | |
ayuda | ||
* ... más pequeño es mejor
Rendimiento en juegos
El ProBook no puede clasificarse como un portátil para juegos, sin embargo, gracias a su GPU GeForce, es capaz de ejecutar bastantes juegos. Debe utilizar el perfil de energía "mejor ahorro de energía". Sólo entonces la GPU funciona con velocidades de reloj relativamente constantes y elevadas.
El hardware permite jugar en FHD utilizando ajustes de bajos a altos. Los juegos actuales suelen requerir que baje los ajustes. Para conseguir frecuencias de cuadro suficientemente altas, debería elegir los ajustes de forma más conservadora.
| Performance rating - Percent | |
| Medio NVIDIA GeForce RTX 2050 Mobile | |
| Acer Aspire 5 A515-58GM-76S8 | |
| HP ProBook 450 G10 | |
| Media de la clase Office | |
| Schenker VIA 15 Pro M22 | |
| Fujitsu LifeBook E5412A E542AMHAAMDE | |
| Dell Latitude 3440 | |
| Lenovo ThinkPad L15 Gen 4 21H70021GE | |
| The Witcher 3 - 1920x1080 Ultra Graphics & Postprocessing (HBAO+) | |
| Acer Aspire 5 A515-58GM-76S8 | |
| Medio NVIDIA GeForce RTX 2050 Mobile (24.3 - 39.6, n=9) | |
| HP ProBook 450 G10 | |
| Media de la clase Office (14.8 - 28.1, n=3, últimos 2 años) | |
| Schenker VIA 15 Pro M22 | |
| Fujitsu LifeBook E5412A E542AMHAAMDE | |
| Dell Latitude 3440 | |
| Lenovo ThinkPad L15 Gen 4 21H70021GE | |
| GTA V - 1920x1080 Highest AA:4xMSAA + FX AF:16x | |
| Medio NVIDIA GeForce RTX 2050 Mobile (35.6 - 55.8, n=10) | |
| Acer Aspire 5 A515-58GM-76S8 | |
| HP ProBook 450 G10 | |
| Media de la clase Office (5.77 - 45.3, n=69, últimos 2 años) | |
| Schenker VIA 15 Pro M22 | |
| Fujitsu LifeBook E5412A E542AMHAAMDE | |
| Lenovo ThinkPad L15 Gen 4 21H70021GE | |
| Dell Latitude 3440 | |
| Final Fantasy XV Benchmark - 1920x1080 High Quality | |
| Acer Aspire 5 A515-58GM-76S8 | |
| Medio NVIDIA GeForce RTX 2050 Mobile (24.8 - 42.9, n=10) | |
| HP ProBook 450 G10 | |
| Media de la clase Office (8.09 - 79.5, n=71, últimos 2 años) | |
| Schenker VIA 15 Pro M22 | |
| Dell Latitude 3440 | |
| Fujitsu LifeBook E5412A E542AMHAAMDE | |
| Lenovo ThinkPad L15 Gen 4 21H70021GE | |
| Strange Brigade - 1920x1080 ultra AA:ultra AF:16 | |
| Medio NVIDIA GeForce RTX 2050 Mobile (46.2 - 65.3, n=9) | |
| Acer Aspire 5 A515-58GM-76S8 | |
| HP ProBook 450 G10 | |
| Media de la clase Office (12.9 - 142.1, n=53, últimos 2 años) | |
| Schenker VIA 15 Pro M22 | |
| Fujitsu LifeBook E5412A E542AMHAAMDE | |
| Dell Latitude 3440 | |
| Lenovo ThinkPad L15 Gen 4 21H70021GE | |
| Dota 2 Reborn - 1920x1080 ultra (3/3) best looking | |
| Medio NVIDIA GeForce RTX 2050 Mobile (66.1 - 130.1, n=10) | |
| Acer Aspire 5 A515-58GM-76S8 | |
| HP ProBook 450 G10 | |
| Media de la clase Office (14.6 - 135, n=77, últimos 2 años) | |
| Schenker VIA 15 Pro M22 | |
| Dell Latitude 3440 | |
| Fujitsu LifeBook E5412A E542AMHAAMDE | |
| Lenovo ThinkPad L15 Gen 4 21H70021GE | |
| X-Plane 11.11 - 1920x1080 high (fps_test=3) | |
| Medio NVIDIA GeForce RTX 2050 Mobile (59.4 - 92.6, n=11) | |
| Acer Aspire 5 A515-58GM-76S8 | |
| HP ProBook 450 G10 | |
| Media de la clase Office (12 - 82.4, n=69, últimos 2 años) | |
| Fujitsu LifeBook E5412A E542AMHAAMDE | |
| Schenker VIA 15 Pro M22 | |
| Dell Latitude 3440 | |
| Lenovo ThinkPad L15 Gen 4 21H70021GE | |
Para comprobar si las frecuencias de cuadro se mantienen estables durante un periodo de tiempo más largo, dejamos correr el juego The Witcher 3 durante unos 60 minutos en resolución Full HD y ajustes de máxima calidad. No movimos el personaje. El perfil "mejor rendimiento" dio lugar a tasas de fotogramas fluctuantes, mientras que el perfil "mejor ahorro de energía" permitió obtener tasas de fotogramas más acordes con nuestras expectativas.
Witcher 3 FPS diagram
| bajo | medio | alto | ultra | |
|---|---|---|---|---|
| GTA V (2015) | 156.4 | 153.1 | 74 | 35.6 |
| The Witcher 3 (2015) | 142.1 | 84.2 | 46.7 | 24.3 |
| Dota 2 Reborn (2015) | 149.1 | 123.5 | 108.2 | 98.6 |
| Final Fantasy XV Benchmark (2018) | 68.1 | 32.3 | 24.8 | |
| X-Plane 11.11 (2018) | 91 | 80.9 | 69.6 | |
| Far Cry 5 (2018) | 93 | 39 | 35 | 34 |
| Strange Brigade (2018) | 143.1 | 66.5 | 53.7 | 46.2 |
| Cyberpunk 2077 1.6 (2022) | 32.2 | 23.5 | 19.1 | 16.8 |
| F1 23 (2023) | 54.8 | 50.8 | 36.9 | 11.3 |
Emisiones - La HP G10 no produce mucho ruido ni calor
Emisiones sonoras
El ventilador sigue siendo muy silencioso en el uso diario y a menudo se queda completamente quieto. Se vuelve más ruidoso bajo carga media o completa: en nuestra prueba se alcanzaron niveles de presión sonora de 41,4 dB(A). Con todo, este ruido de fondo es perfectamente aceptable para un portátil de oficina con una GPU dedicada.
Ruido
| Ocioso |
| 23.5 / 23.5 / 23.5 dB(A) |
| Carga |
| 38 / 41.4 dB(A) |
 | ||
30 dB silencioso 40 dB(A) audible 50 dB(A) ruidosamente alto |
||
min: | ||
| HP ProBook 450 G10 GeForce RTX 2050 Mobile, i7-1355U, Micron 3400 1TB MTFDKBA1T0TFH | Acer Aspire 5 A515-58GM-76S8 GeForce RTX 2050 Mobile, i7-1355U, Micron 2450 1TB MTFDKBA1T0TFK | Schenker VIA 15 Pro M22 Vega 8, R7 5700U, Samsung SSD 970 EVO Plus 1TB | Lenovo ThinkPad L15 Gen 4 21H70021GE Vega 8, R7 PRO 7730U, SK hynix HFS512GEJ4X113N | Fujitsu LifeBook E5412A E542AMHAAMDE Vega 7, R5 PRO 5675U, WDC PC SN530 SDBQNPZ-512G | Dell Latitude 3440 Iris Xe G7 80EUs, i5-1345U, Samsung PM9A1 MZVL2512HCJQ | |
|---|---|---|---|---|---|---|
| Noise | -10% | -0% | 9% | -0% | -1% | |
| apagado / medio ambiente * (dB) | 23.5 | 25.04 -7% | 24 -2% | 23.5 -0% | 23.6 -0% | 23.9 -2% |
| Idle Minimum * (dB) | 23.5 | 26.3 -12% | 24 -2% | 23.5 -0% | 23.6 -0% | 24.4 -4% |
| Idle Average * (dB) | 23.5 | 26.3 -12% | 24 -2% | 23.5 -0% | 23.6 -0% | 24.4 -4% |
| Idle Maximum * (dB) | 23.5 | 26.3 -12% | 27.5 -17% | 23.5 -0% | 28.7 -22% | 24.4 -4% |
| Load Average * (dB) | 38 | 32.5 14% | 33.7 11% | 27.5 28% | 36.3 4% | 37.1 2% |
| Witcher 3 ultra * (dB) | 38.2 | 46.7 -22% | 33.7 12% | 32.7 14% | 36.3 5% | 38.2 -0% |
| Load Maximum * (dB) | 41.4 | 49 -18% | 42.4 -2% | 32.7 21% | 36.3 12% | 40.2 3% |
* ... más pequeño es mejor
Temperatura
El portátil no se calienta demasiado bajo carga (prueba de estrés, Witcher 3 test). En el uso cotidiano (oficina, internet), los valores se mantienen dentro de la zona verde.
(+) La temperatura máxima en la parte superior es de 39.9 °C / 104 F, frente a la media de 34.3 °C / 94 F, que oscila entre 21.2 y 62.5 °C para la clase Office.
(±) El fondo se calienta hasta un máximo de 43 °C / 109 F, frente a la media de 36.8 °C / 98 F
(+) En reposo, la temperatura media de la parte superior es de 23.5 °C / 74# F, frente a la media del dispositivo de 29.5 °C / 85 F.
(+) Jugando a The Witcher 3, la temperatura media de la parte superior es de 31.4 °C / 89 F, frente a la media del dispositivo de 29.5 °C / 85 F.
(+) El reposamanos y el panel táctil están a una temperatura inferior a la de la piel, con un máximo de 29.1 °C / 84.4 F y, por tanto, son fríos al tacto.
(±) La temperatura media de la zona del reposamanos de dispositivos similares fue de 27.5 °C / 81.5 F (-1.6 °C / -2.9 F).
| HP ProBook 450 G10 Intel Core i7-1355U, NVIDIA GeForce RTX 2050 Mobile | Acer Aspire 5 A515-58GM-76S8 Intel Core i7-1355U, NVIDIA GeForce RTX 2050 Mobile | Schenker VIA 15 Pro M22 AMD Ryzen 7 5700U, AMD Radeon RX Vega 8 (Ryzen 4000/5000) | Lenovo ThinkPad L15 Gen 4 21H70021GE AMD Ryzen 7 PRO 7730U, AMD Radeon RX Vega 8 (Ryzen 4000/5000) | Fujitsu LifeBook E5412A E542AMHAAMDE AMD Ryzen 5 PRO 5675U, AMD Radeon RX Vega 7 | Dell Latitude 3440 Intel Core i5-1345U, Intel Iris Xe Graphics G7 80EUs | |
|---|---|---|---|---|---|---|
| Heat | 6% | -2% | 10% | -14% | -2% | |
| Maximum Upper Side * (°C) | 39.9 | 35.7 11% | 41.2 -3% | 39.1 2% | 49.5 -24% | 35.2 12% |
| Maximum Bottom * (°C) | 43 | 36.8 14% | 43.5 -1% | 36.1 16% | 50.3 -17% | 41 5% |
| Idle Upper Side * (°C) | 26.4 | 27.9 -6% | 28.4 -8% | 23.1 12% | 29.6 -12% | 29.8 -13% |
| Idle Bottom * (°C) | 29 | 27.9 4% | 28.1 3% | 25.7 11% | 30 -3% | 32 -10% |
* ... más pequeño es mejor
Prueba de esfuerzo
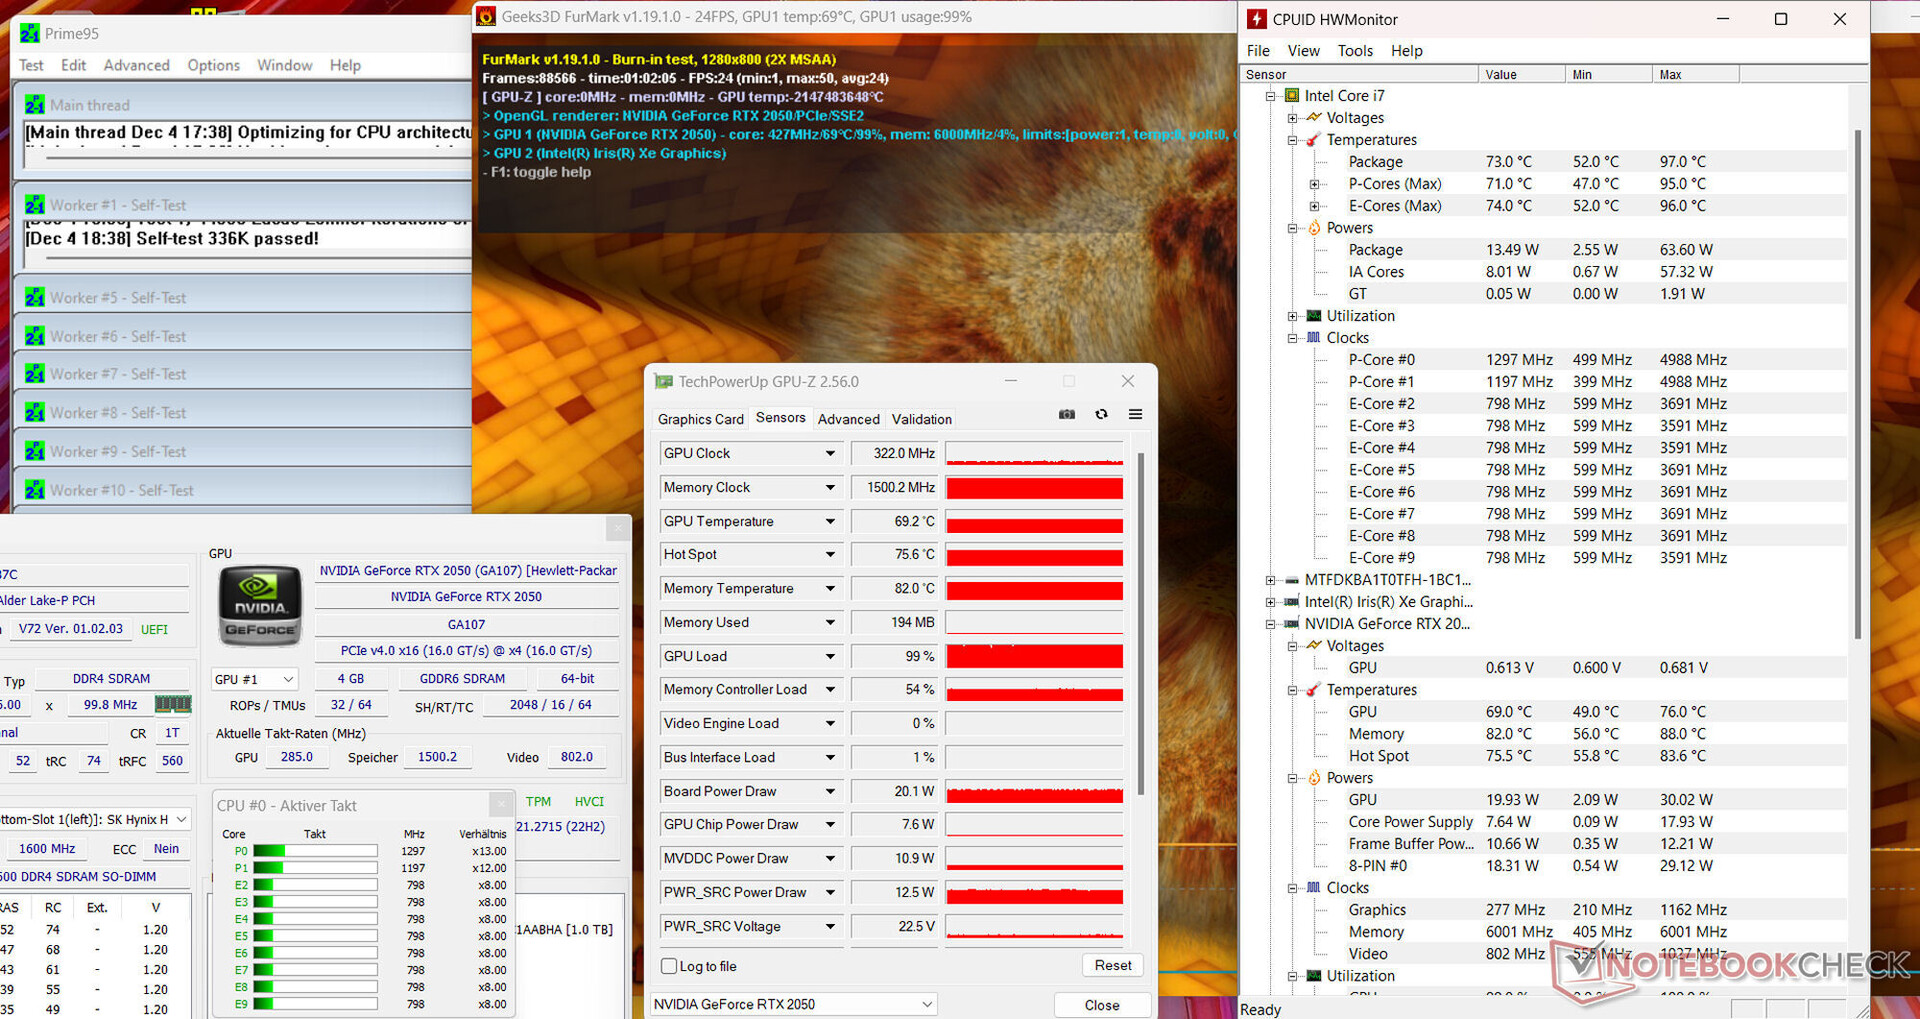
La prueba de estrés (Prime95 y Furmark en uso continuo) simula un escenario extremo para comprobar la estabilidad del sistema a plena carga. La CPU (P: 2,5 GHz, E: 1,9 GHz) y la GPU (832 MHz) comenzaron la prueba con velocidades de reloj relativamente bajas. a medida que el proceso continuaba, los valores caían en picado.
Altavoces
Los altavoces estéreo producen un sonido decente, pero sin apenas graves. Recomendamos utilizar auriculares o altavoces externos para disfrutar de una experiencia sonora más agradable.
HP ProBook 450 G10 análisis de audio
(±) | la sonoridad del altavoz es media pero buena (74.8 dB)
Graves 100 - 315 Hz
(-) | casi sin bajos - de media 28.4% inferior a la mediana
(±) | la linealidad de los graves es media (10.9% delta a frecuencia anterior)
Medios 400 - 2000 Hz
(+) | medios equilibrados - a sólo 2.9% de la mediana
(+) | los medios son lineales (5.8% delta a la frecuencia anterior)
Altos 2 - 16 kHz
(+) | máximos equilibrados - a sólo 3.6% de la mediana
(+) | los máximos son lineales (3.5% delta a la frecuencia anterior)
Total 100 - 16.000 Hz
(±) | la linealidad del sonido global es media (22.2% de diferencia con la mediana)
En comparación con la misma clase
» 58% de todos los dispositivos probados de esta clase eran mejores, 9% similares, 33% peores
» El mejor tuvo un delta de 7%, la media fue 21%, el peor fue ###max##%
En comparación con todos los dispositivos probados
» 65% de todos los dispositivos probados eran mejores, 6% similares, 29% peores
» El mejor tuvo un delta de 4%, la media fue 23%, el peor fue ###max##%
Acer Aspire 5 A515-58GM-76S8 análisis de audio
(±) | la sonoridad del altavoz es media pero buena (76 dB)
Graves 100 - 315 Hz
(-) | casi sin bajos - de media 23.8% inferior a la mediana
(±) | la linealidad de los graves es media (11.6% delta a frecuencia anterior)
Medios 400 - 2000 Hz
(+) | medios equilibrados - a sólo 1.9% de la mediana
(±) | la linealidad de los medios es media (8.7% delta respecto a la frecuencia anterior)
Altos 2 - 16 kHz
(+) | máximos equilibrados - a sólo 3.9% de la mediana
(+) | los máximos son lineales (5.6% delta a la frecuencia anterior)
Total 100 - 16.000 Hz
(±) | la linealidad del sonido global es media (19.9% de diferencia con la mediana)
En comparación con la misma clase
» 42% de todos los dispositivos probados de esta clase eran mejores, 9% similares, 49% peores
» El mejor tuvo un delta de 7%, la media fue 21%, el peor fue ###max##%
En comparación con todos los dispositivos probados
» 51% de todos los dispositivos probados eran mejores, 7% similares, 42% peores
» El mejor tuvo un delta de 4%, la media fue 23%, el peor fue ###max##%
Gestión de energía - El ordenador HP tiene tiempos de ejecución largos
Consumo de energía
Bajo carga, el ProBook se contenta con una cantidad de energía mucho menor que el Aspire 5 equipado con la misma combinación de CPU y GPU. No es de extrañar: A fin de cuentas, el hardware del portátil HP funciona con unos ajustes de rendimiento mucho más conservadores. Como resultado, el 450 G10 está bien con una fuente de alimentación de 65 vatios (Aspire: 90 vatios). Aunque la Witcher 3 prueba se completó con valores de consumo de energía fluctuantes, su consumo durante la prueba primero se hundió lentamente y luego, a partir de cierto punto, cayó en picado.
| Off / Standby | |
| Ocioso | |
| Carga |
|
Clave:
min: | |
| HP ProBook 450 G10 i7-1355U, GeForce RTX 2050 Mobile, Micron 3400 1TB MTFDKBA1T0TFH, IPS, 1920x1080, 15.6" | Acer Aspire 5 A515-58GM-76S8 i7-1355U, GeForce RTX 2050 Mobile, Micron 2450 1TB MTFDKBA1T0TFK, IPS, 1920x1080, 15.6" | Schenker VIA 15 Pro M22 R7 5700U, Vega 8, Samsung SSD 970 EVO Plus 1TB, IPS, 2560x1440, 15.6" | Lenovo ThinkPad L15 Gen 4 21H70021GE R7 PRO 7730U, Vega 8, SK hynix HFS512GEJ4X113N, IPS, 1920x1080, 15.6" | Fujitsu LifeBook E5412A E542AMHAAMDE R5 PRO 5675U, Vega 7, WDC PC SN530 SDBQNPZ-512G, IPS, 1920x1080, 14" | Dell Latitude 3440 i5-1345U, Iris Xe G7 80EUs, Samsung PM9A1 MZVL2512HCJQ, IPS, 1920x1080, 14" | Medio NVIDIA GeForce RTX 2050 Mobile | Media de la clase Office | |
|---|---|---|---|---|---|---|---|---|
| Power Consumption | -10% | -21% | 7% | 17% | 9% | -23% | 7% | |
| Idle Minimum * (Watt) | 4.6 | 4.31 6% | 6.9 -50% | 4.5 2% | 4.1 11% | 3.7 20% | 5.11 ? -11% | 4.26 ? 7% |
| Idle Average * (Watt) | 7.3 | 6.52 11% | 10.9 -49% | 8.5 -16% | 6.6 10% | 6.5 11% | 9.15 ? -25% | 7.31 ? -0% |
| Idle Maximum * (Watt) | 8.4 | 8.037 4% | 11.3 -35% | 10.5 -25% | 7.4 12% | 9.5 -13% | 11.2 ? -33% | 8.55 ? -2% |
| Load Average * (Watt) | 57.3 | 75.2 -31% | 54.2 5% | 35.6 38% | 43.1 25% | 46.9 18% | 70.6 ? -23% | 43.8 ? 24% |
| Witcher 3 ultra * (Watt) | 49.3 | 60.8 -23% | 47.3 4% | 37.4 24% | 42.6 14% | 42.1 15% | ||
| Load Maximum * (Watt) | 69.7 | 89.5 -28% | 69 1% | 57.9 17% | 50.9 27% | 67 4% | 87.4 ? -25% | 64.5 ? 7% |
* ... más pequeño es mejor
Power consumption Witcher 3 / stress test
Power consumption with external monitor
Tiempos de ejecución
Según la hoja de datos, HP ha proporcionado el ProBook con dos opciones de batería (42 Wh, 51 Wh) - nuestro dispositivo de prueba cuenta con el modelo más grande. Como resultado, el dispositivo de 15,6 pulgadas logró tiempos de ejecución prácticos de 9:19 h (WiFi; acceso a sitios web mediante un script) y 11:25 h (vídeo; cortometraje Big Buck Bunny (codificación H.264, FHD) - buenos valores.
| HP ProBook 450 G10 i7-1355U, GeForce RTX 2050 Mobile, 51.3 Wh | Acer Aspire 5 A515-58GM-76S8 i7-1355U, GeForce RTX 2050 Mobile, 48 Wh | Schenker VIA 15 Pro M22 R7 5700U, Vega 8, 91 Wh | Lenovo ThinkPad L15 Gen 4 21H70021GE R7 PRO 7730U, Vega 8, 57 Wh | Fujitsu LifeBook E5412A E542AMHAAMDE R5 PRO 5675U, Vega 7, 60 Wh | Dell Latitude 3440 i5-1345U, Iris Xe G7 80EUs, 54 Wh | Media de la clase Office | |
|---|---|---|---|---|---|---|---|
| Duración de Batería | -26% | 18% | 7% | -24% | -5% | 20% | |
| Reader / Idle (h) | 18.1 | 25.1 39% | 24.5 ? 35% | ||||
| H.264 (h) | 11.4 | 6.6 -42% | 9.5 -17% | 8.2 -28% | 15.5 ? 36% | ||
| WiFi v1.3 (h) | 9.3 | 8.7 -6% | 11 18% | 11.9 28% | 10.4 12% | 8.8 -5% | 13.2 ? 42% |
| Load (h) | 2.8 | 2 -29% | 2.2 -21% | 1.2 -57% | 1.808 ? -35% |
Pro
Contra
Veredicto - El portátil de oficina permite jugar ocasionalmente

Los usos de oficina e Internet son dominados por la combinación instalada que consiste en un Core i7-1355U y 32 GB de RAM (doble canal). Los usos intensivos de la GPU, como los juegos, se benefician de la GPU GeForce RTX 2050. Sin embargo: La GPU absorbe picos de carga cortos a plena potencia, pero tiene que tomarse las cosas con más calma bajo carga prolongada.
Sin experimentos. Al igual que su predecesor, el HP ProBook 450 G10 se ha revelado como un sólido portátil de oficina para organizaciones, empresas y usuarios privados.
Las emisiones de calor y ruido del dispositivo están bien. La portabilidad está garantizada gracias a su peso moderado (aprox. 1,8 kg), su carcasa compacta y su autonomía práctica (de 9 a 11 h). Dos puertos USB-C (USB 3.2 Gen 2) permiten una fácil integración en una configuración existente en el lugar de trabajo.
La alimentación se suministra a través de una fuente de alimentación propia de HP. Como alternativa, puede utilizar un cargador USB-C: ambos puertos USB-C admiten Power Delivery (y pueden emitir una señal DisplayPort). Por desgracia, son "sólo" puertos USB 3.2 Gen 2. Thunderbolt 4 no se encuentra en los ProBooks de HP. Otro aspecto positivo es su teclado nítido.
La pantalla FHD instalada (IPS, 15,6 pulgadas) sólo ofrece una cobertura limitada del espacio de color y no es capaz de alcanzar su brillo objetivo (> 300 cd/m²). Un modelo ProBook con un panel alternativo de 400 nits (FHD) que incluya cobertura sRGB podría ser potencialmente una solución mejor para muchos usuarios.
El rango de precios del portátil es justo. Ya se pueden encontrar modelos sin GPU GeForce muy por debajo de los 1.000 dólares y lo mismo puede decirse de la serie ProBook 455 G10 de idéntica construcción (Ryzen 7000).
Una alternativa al 450 G10 podría ser el Acer Aspire 5 A515-58GM. Ofrece un rendimiento ligeramente superior con la misma combinación de CPU/GPU, y también cuenta con un puerto Thunderbolt 4. El Aspire produce algo más de ruido en su pico que el portátil HP y, bajo carga, tiene una mayor necesidad de energía. Tendrá que desembolsar alrededor de 1.000 dólares en el dispositivo de Acer.
Precio y disponibilidad
La versión del HP ProBook 450 G10 que hemos probado se puede encontrar actualmente por 969 dólares en Amazon.
HP ProBook 450 G10
- 12/13/2023 v7 (old)
Sascha Mölck
Transparencia
La selección de los dispositivos que se van a reseñar corre a cargo de nuestro equipo editorial. La muestra de prueba fue proporcionada al autor en calidad de préstamo por el fabricante o el minorista a los efectos de esta reseña. El prestamista no tuvo ninguna influencia en esta reseña, ni el fabricante recibió una copia de la misma antes de su publicación. No había ninguna obligación de publicar esta reseña. Como empresa de medios independiente, Notebookcheck no está sujeta a la autoridad de fabricantes, minoristas o editores.
Así es como prueba Notebookcheck
Cada año, Notebookcheck revisa de forma independiente cientos de portátiles y smartphones utilizando procedimientos estandarizados para asegurar que todos los resultados son comparables. Hemos desarrollado continuamente nuestros métodos de prueba durante unos 20 años y hemos establecido los estándares de la industria en el proceso. En nuestros laboratorios de pruebas, técnicos y editores experimentados utilizan equipos de medición de alta calidad. Estas pruebas implican un proceso de validación en varias fases. Nuestro complejo sistema de clasificación se basa en cientos de mediciones y puntos de referencia bien fundamentados, lo que mantiene la objetividad.Price comparison

