Análises de portátiles con NVIDIA GeForce RTX 2050 Mobile tarjeta gráfica
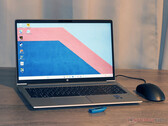
Análisis del portátil Acer Aspire 17 2024: Una dGPU débil y una pantalla decepcionante
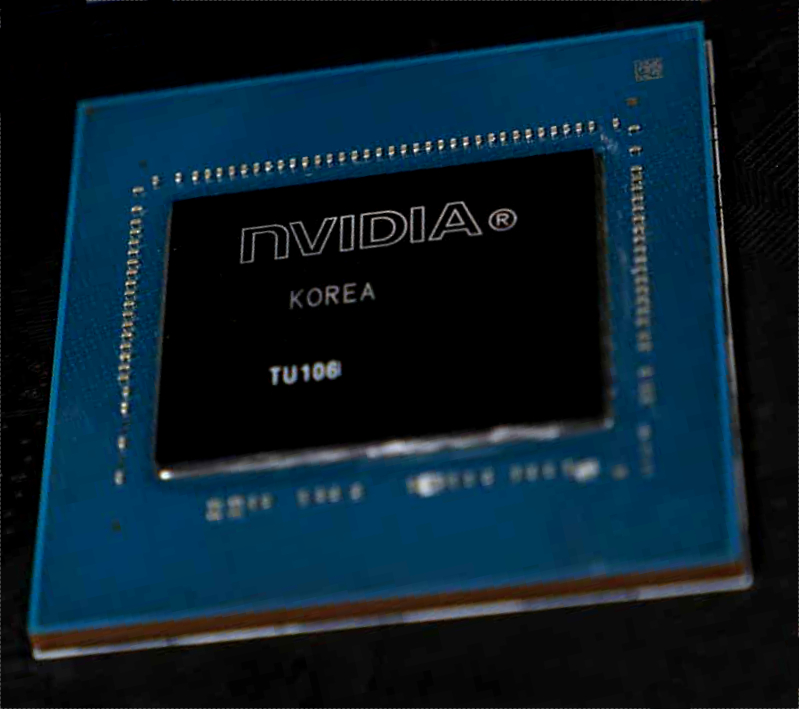
Hoy en día, las tarjetas gráficas dedicadas de gama básica y media se ven cada vez más desplazadas por los chips integrados. Hemos realizado una prueba práctica y hemos enfrentado la Nvidia GeForce RTX 2050 del Acer Aspire 17 a los modelos iGPU actuales de Intel y AMD.
Intel Core 7 150U, NVIDIA GeForce RTX 2050 Mobile, 17.3", 2.2 kgAnálisis del Acer Aspire 16 2024: Todoterreno multimedia sin una pantalla digna de multimedia
Con un precio de 899 euros, el Aspire 16 A16-51GM-77G2 empareja el Core 7 150U de baja potencia y generación actual con la RTX 2050. El portátil está pensado para ser un portátil multimedia todoterreno económico. En este análisis, analizaremos si Acer consigue alcanzar este objetivo.
Intel Core 7 150U, NVIDIA GeForce RTX 2050 Mobile, 16", 1.9 kgAnálisis del Asus ExpertBook B3: El potente portátil de oficina con 11 horas de autonomía
El ExpertBook B3 presume de emisiones moderadas, larga autonomía, dos ranuras de RAM, mucha potencia de cálculo y Thunderbolt 4. Gracias a su GeForce RTX 2050, el portátil de 14 pulgadas está bien equipado para tareas y juegos exigentes con la GPU. Aspectos positivos: Asus entrega este dispositivo con una garantía de tres años.
Intel Core i7-1355U, NVIDIA GeForce RTX 2050 Mobile, 14", 1.7 kgAnálisis del HP ProBook 450 G10: GeForce La potencia RTX dentro de un portátil de oficina
El portátil empresarial de HP presume de bajas emisiones, larga autonomía, dos ranuras de RAM y buenos dispositivos de entrada. Gracias a su GeForce RTX 2050, el dispositivo también está equipado para tareas exigentes con la GPU. Los precios comienzan a partir de unos 750 dólares.
Intel Core i7-1355U, NVIDIA GeForce RTX 2050 Mobile, 15.6", 1.8 kgAnálisis del Acer Aspire 5 A515-58GM: El portátil de oficina con una GPU aspirante a juego
El Acer Aspire 5 (2023) es un portátil de oficina que se vende a un precio mucho más alto debido a su GPU de juego RTX 2050 instalada. En este análisis detallado, puedes leer si esta receta resultó en un todoterreno digno. Puedes esperar dos bancos de RAM, Thunderbolt 4 y bastantes mejoras respecto a su predecesor.
Intel Core i7-1355U, NVIDIA GeForce RTX 2050 Mobile, 15.6", 1.8 kgHP Envy 17-cr0079ng: Intel Core i7-1255U, 17.30", 2.6 kg
análise » Análisis del portátil HP Envy 17: GeForce La GPU juega en la elegante pantalla 4K del portátil multimedia
LG Gram 17Z90Q-E.AD78G: Intel Core i7-1260P, 17.00", 1.4 kg
análise » Análisis del LG Gram 17 - Un portátil de 17 pulgadas superligero con una modesta dGPU
Acer Aspire 5 A515-57G-53N8: Intel Core i5-1240P, 15.60", 1.8 kg
análise » Análisis del portátil Acer Aspire 5 A515-57G: débil presentación de la RTX 2050
Lenovo ThinkBook 16 G4+ IAP: Intel Core i7-12700H, 16.00", 1.8 kg
análise » Análisis del Lenovo ThinkBook 16 G4+: Un buen portátil multimedia con mucha potencia
Honor MagicBook 14 2022: Intel Core i5-12500H, 14.00", 1.6 kg
análise » Honor Análisis del MagicBook 14 2022: Portátil multimedia con RTX 2050
Acer Aspire 17 A17-51GM-70LZ: Intel Core 7 150U, 17.30", 2.2 kg
análise externo » Acer Aspire 17 A17-51GM-70LZ
Asus TUF Gaming A15 FA507NFR: AMD Ryzen 7 7435HS, 15.60", 2.3 kg
análise externo » Asus TUF Gaming A15 FA507NFR
Acer Nitro Lite 16 NL16-71G, RTX 2050 : Intel Core i7-13620H, 16.00", 1.9 kg
análise externo » Acer Nitro Lite 16 NL16-71G, RTX 2050
Acer Nitro V 15 ANV15-51, RTX 2050: Intel Core i5-13420H, 15.60", 2.1 kg
análise externo » Acer Nitro V 15 ANV15-51, RTX 2050
Acer Nitro V15 ANV15-41, RTX 2050: AMD Ryzen 5 7535HS, 15.60", 2.1 kg
análise externo » Acer Nitro V15 ANV15-41, RTX 2050
Acer Aspire 16 A16-51GM-77G2: Intel Core 7 150U, 16.00", 1.9 kg
análise externo » Acer Aspire 16 A16-51GM-77G2
Asus Vivobook 14X K3405ZF: Intel Core i5-12500H, 14.50", 1.4 kg
análise externo » Asus Vivobook 14X K3405ZF
Asus ExpertBook B3 B3604CVF: Intel Core i7-1355U, 16.00", 2 kg
análise externo » Asus ExpertBook B3 B3604CVF
Asus ExpertBook B5 B5404CVF: Intel Core i7-1355U, 14.00", 1.7 kg
análise externo » Asus ExpertBook B5 B5404CVF
Asus VivoBook 16X K3605ZF, i5-12450H: Intel Core i5-12450H, 16.00", 1.8 kg
análise externo » Asus VivoBook 16X K3605ZF, i5-12450H
Dell Inspiron 16 5630: Intel Core i7-1360P, 16.00", 1.9 kg
análise externo » Dell Inspiron 16 5630
HP Victus 15-fb1000AX: AMD Ryzen 5 7535HS, 15.60", 2.3 kg
análise externo » HP Victus 15-fb1000AX
Lenovo Ideapad Gaming 3 15ACH16, R5 5500H RTX 2050: unknown, 15.60", 2.3 kg
análise externo » Lenovo Ideapad Gaming 3 15ACH16, R5 5500H RTX 2050
MSI GF63 Thin 12UCX: Intel Core i7-12650H, 15.60", 1.9 kg
análise externo » MSI GF63 Thin 12UCX
HP Victus 15-fa1100tx: Intel Core i5-12450H, 15.60", 2.3 kg
análise externo » HP Victus 15-fa1100tx
Asus VivoBook 16X K3605ZF: Intel Core i7-12650H, 16.00", 1.8 kg
análise externo » Asus VivoBook 16X K3605ZF
Medion Erazer Crawler E30e: Intel Core i5-12450H, 15.60", 2 kg
análise externo » Medion Erazer Crawler E30e
Acer Aspire 5 A515-58GM, i7-1355U: Intel Core i7-1355U, 15.60", 1.8 kg
análise externo » Acer Aspire 5 A515-58GM, i7-1355U
Acer Aspire 7 A715-76G, i5-12450H RTX 2050: Intel Core i5-12450H, 15.60", 2.1 kg
análise externo » Acer Aspire 7 A715-76G, i5-12450H RTX 2050
Acer Aspire 5 A515-58GM: Intel Core i5-13420H, 15.60", 1.7 kg
análise externo » Acer Aspire 5 A515-58GM
Asus TUF Gaming F17 FX706HF: Intel Core i5-11400H, 17.30", 2.6 kg
análise externo » Asus TUF Gaming F17 FX706HF
HP Pavilion Plus 14-eh1299nr: Intel Core i7-1355U, 14.50", 1.4 kg
análise externo » HP Pavilion Plus 14-eh1299nr
Asus TUF Gaming F15 FX506HF: Intel Core i5-11400H, 15.60", 2.3 kg
análise externo » Asus TUF Gaming FX506HF
LG Gram 17Z90Q-E.AD78G: Intel Core i7-1260P, 17.00", 1.4 kg
análise externo » LG Gram 17Z90Q-E.AD78G
HP Envy 17-cr0079ng: Intel Core i7-1255U, 17.30", 2.6 kg
análise externo » HP Envy 17-cr0079ng
HP Pavilion Plus 14-eh0032TX: Intel Core i7-1255U, 14.00", 1.4 kg
análise externo » HP Pavilion Plus 14-eh0032TX
HP Envy x360 15-ew0170nd: Intel Core i7-1255U, 15.60", 1.7 kg
análise externo » HP Envy x360 15-ew0170nd
Lenovo Ideapad 5 Pro 14IAP7, i7-1260P RTX 2050: Intel Core i7-1260P, 14.00", 1.4 kg
análise externo » Lenovo Ideapad 5 Pro 14IAP7, i7-1260P RTX 2050
HP Pavilion Plus 14-eh0001nf: Intel Core i7-1255U, 14.00", 1.4 kg
análise externo » HP Pavilion Plus 14-eh0001nf
Honor MagicBook 14 2022: Intel Core i5-12500H, 14.00", 1.6 kg
análise externo » Honor MagicBook 14 2022
Acer Aspire 5 A515-57G-705U: Intel Core i7-1260P, 15.60", 1.8 kg
análise externo » Acer Aspire 5 A515-57G-705U
Lenovo ThinkBook 16 G4+ IAP: Intel Core i7-12700H, 16.00", 1.8 kg
análise externo » Lenovo ThinkBook 16 G4+ IAP
Xiaomi RedmiBook Pro 15 2022, i7 RTX 2050: Intel Core i7-12650H, 15.60", 1.8 kg
análise externo » Xiaomi RedmiBook Pro 15 2022, i7 RTX 2050
LG Gram 17Z90Q-E.AD78G: Intel Core i7-1260P, 17.00", 1.4 kg
» Prueba a largo plazo del LG Gram 17: Dos años con el gigante ligero
Xiaomi RedmiBook Pro 15 2022, i7 RTX 2050: Intel Core i7-12650H, 15.60", 1.8 kg
» Xiaomi renueva el RedmiBook Pro 15 2022 con una CPU más potente y una rebaja de precio