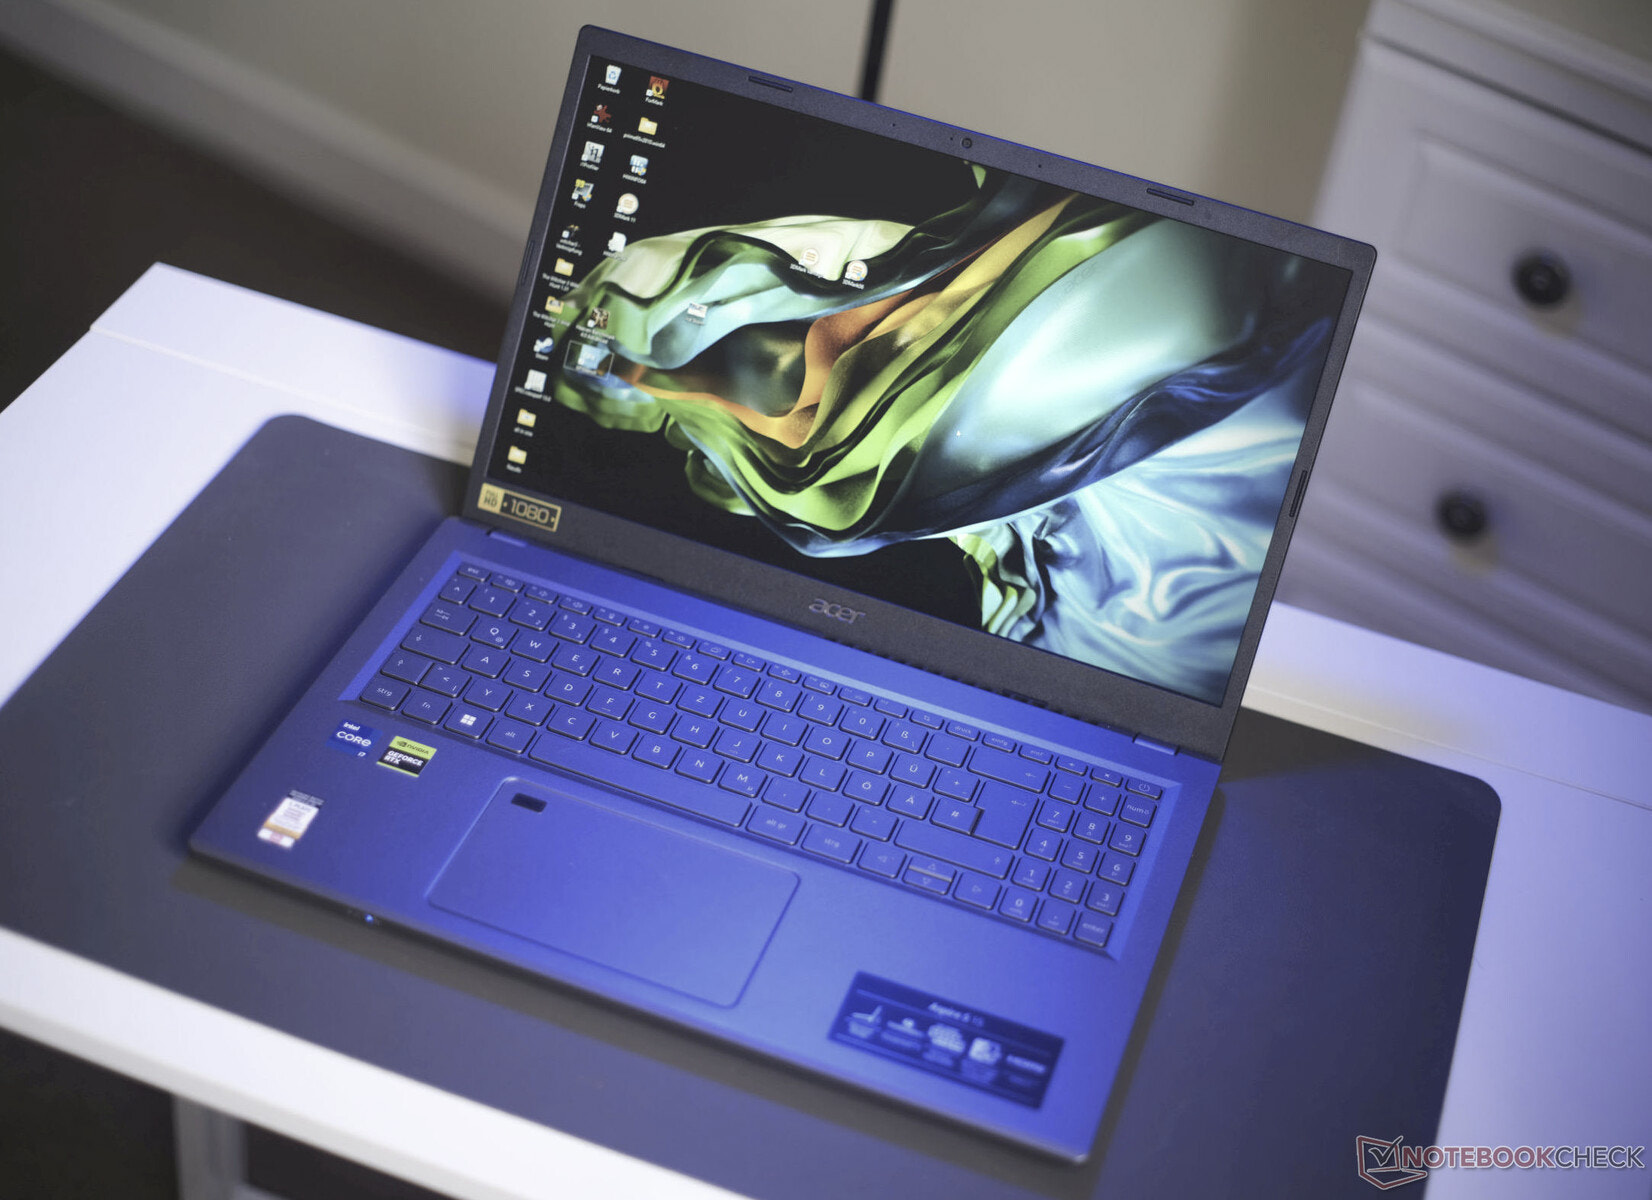
Análisis del Acer Aspire 5 A515-58GM: El portátil de oficina con una GPU aspirante a juego
La serie Aspire 5 cubre una amplia gama de la oferta de portátiles económicos de Acer. Debido a la tarjeta gráfica RTX instalada en este modelo, tenemos que probar si el concepto de presupuesto sigue en pie. Con un PVPR de unos 1.200 dólares, su tarjeta gráficaGeForce RTX 2050tiene que impresionarnos. El portátil de 15,6 pulgadas también cuenta con una CPU Raptor Lake (Core i7-1355U), una pantalla Full HD a 60 Hz con un 45 % NTSC, 16 GB de RAM DDR4 y un SSD de 1 TB.
Desde un punto de vista visual, no ha cambiado mucho el Aspire 5 AN515-58GM, mientras que su predecesor estaba equipado con la misma GPU Nvidia.sigue habiendo una versión Versión AMDcuyas ventajas y desventajas también analizaremos a lo largo de este análisis. La gamaGama Aspire 3es aún más barata que la Aspire 5 (sin dGPU), y la ecológicaAspire Veroacaba de salir al mercado.
El portátil no tiene muchos competidores directos, ya que los fabricantes suelen optar por una tarjeta gráfica GeForce MX más débil y frugal o se deciden por una potente RTX 3050 o RTX 4050 - pero mientras tanto, las soluciones de GPU integrada también pueden ofrecer suficiente potencia multimedia, como la Radeon 680M del Asus VivoBook S15.
Los portátiles económicos para juegos, como el LOQ 15 de Lenovo y el TUF Gaming A15 de Asus, que son más voluminosos pero ofrecen un rendimiento gráfico muy superior, están al alcance de la mano por el precio mencionado. La competencia clásica incluye portátiles de oficina de gama media pura como el IdeaPad 5 15 de Lenovo y el Inspiron 15 de Dell.
Posibles contendientes en la comparación
Valoración | Fecha | Modelo | Peso | Altura | Tamaño | Resolución | Precio |
|---|---|---|---|---|---|---|---|
| 82 % v7 (old) | 09/2023 | Acer Aspire 5 A515-58GM-76S8 i7-1355U, GeForce RTX 2050 Mobile | 1.8 kg | 19.7 mm | 15.60" | 1920x1080 | |
| 86.8 % v7 (old) | 09/2022 | HP Envy x360 15-ey0023dx R7 5825U, Vega 8 | 1.9 kg | 18.6 mm | 15.60" | 1920x1080 | |
| 86.3 % v7 (old) | 06/2023 | Asus TUF A15 FA507 R7 7735HS, GeForce RTX 4050 Laptop GPU | 2.2 kg | 24.9 mm | 15.60" | 1920x1080 | |
| 85.7 % v7 (old) | 07/2023 | Lenovo LOQ 15APH8 R7 7840HS, GeForce RTX 4050 Laptop GPU | 2.5 kg | 25.2 mm | 15.60" | 1920x1080 | |
| 84.7 % v7 (old) | 07/2022 | Dell Inspiron 15 5515-H8P8F R7 5700U, Vega 8 | 1.6 kg | 18 mm | 15.60" | 1920x1080 | |
| 83.5 % v7 (old) | 08/2021 | Lenovo IdeaPad 5 15ALC05 R5 5500U, Vega 7 | 1.7 kg | 19.1 mm | 15.60" | 1920x1080 | |
| 83.2 % v7 (old) | 02/2023 | Asus VivoBook S15 M3502RA-L1029W R7 6800H, Radeon 680M | 1.9 kg | 18.8 mm | 15.60" | 1920x1080 | |
| 82.6 % v7 (old) | 05/2022 | Huawei MateBook D 15 Ryzen 5 5500U R5 5500U, Vega 7 | 1.6 kg | 16.9 mm | 15.60" | 1920x1080 | |
| 80.7 % v7 (old) | 09/2022 | Acer Aspire 5 A515-57G-53N8 i5-1240P, GeForce RTX 2050 Mobile | 1.8 kg | 18 mm | 15.60" | 1920x1080 |
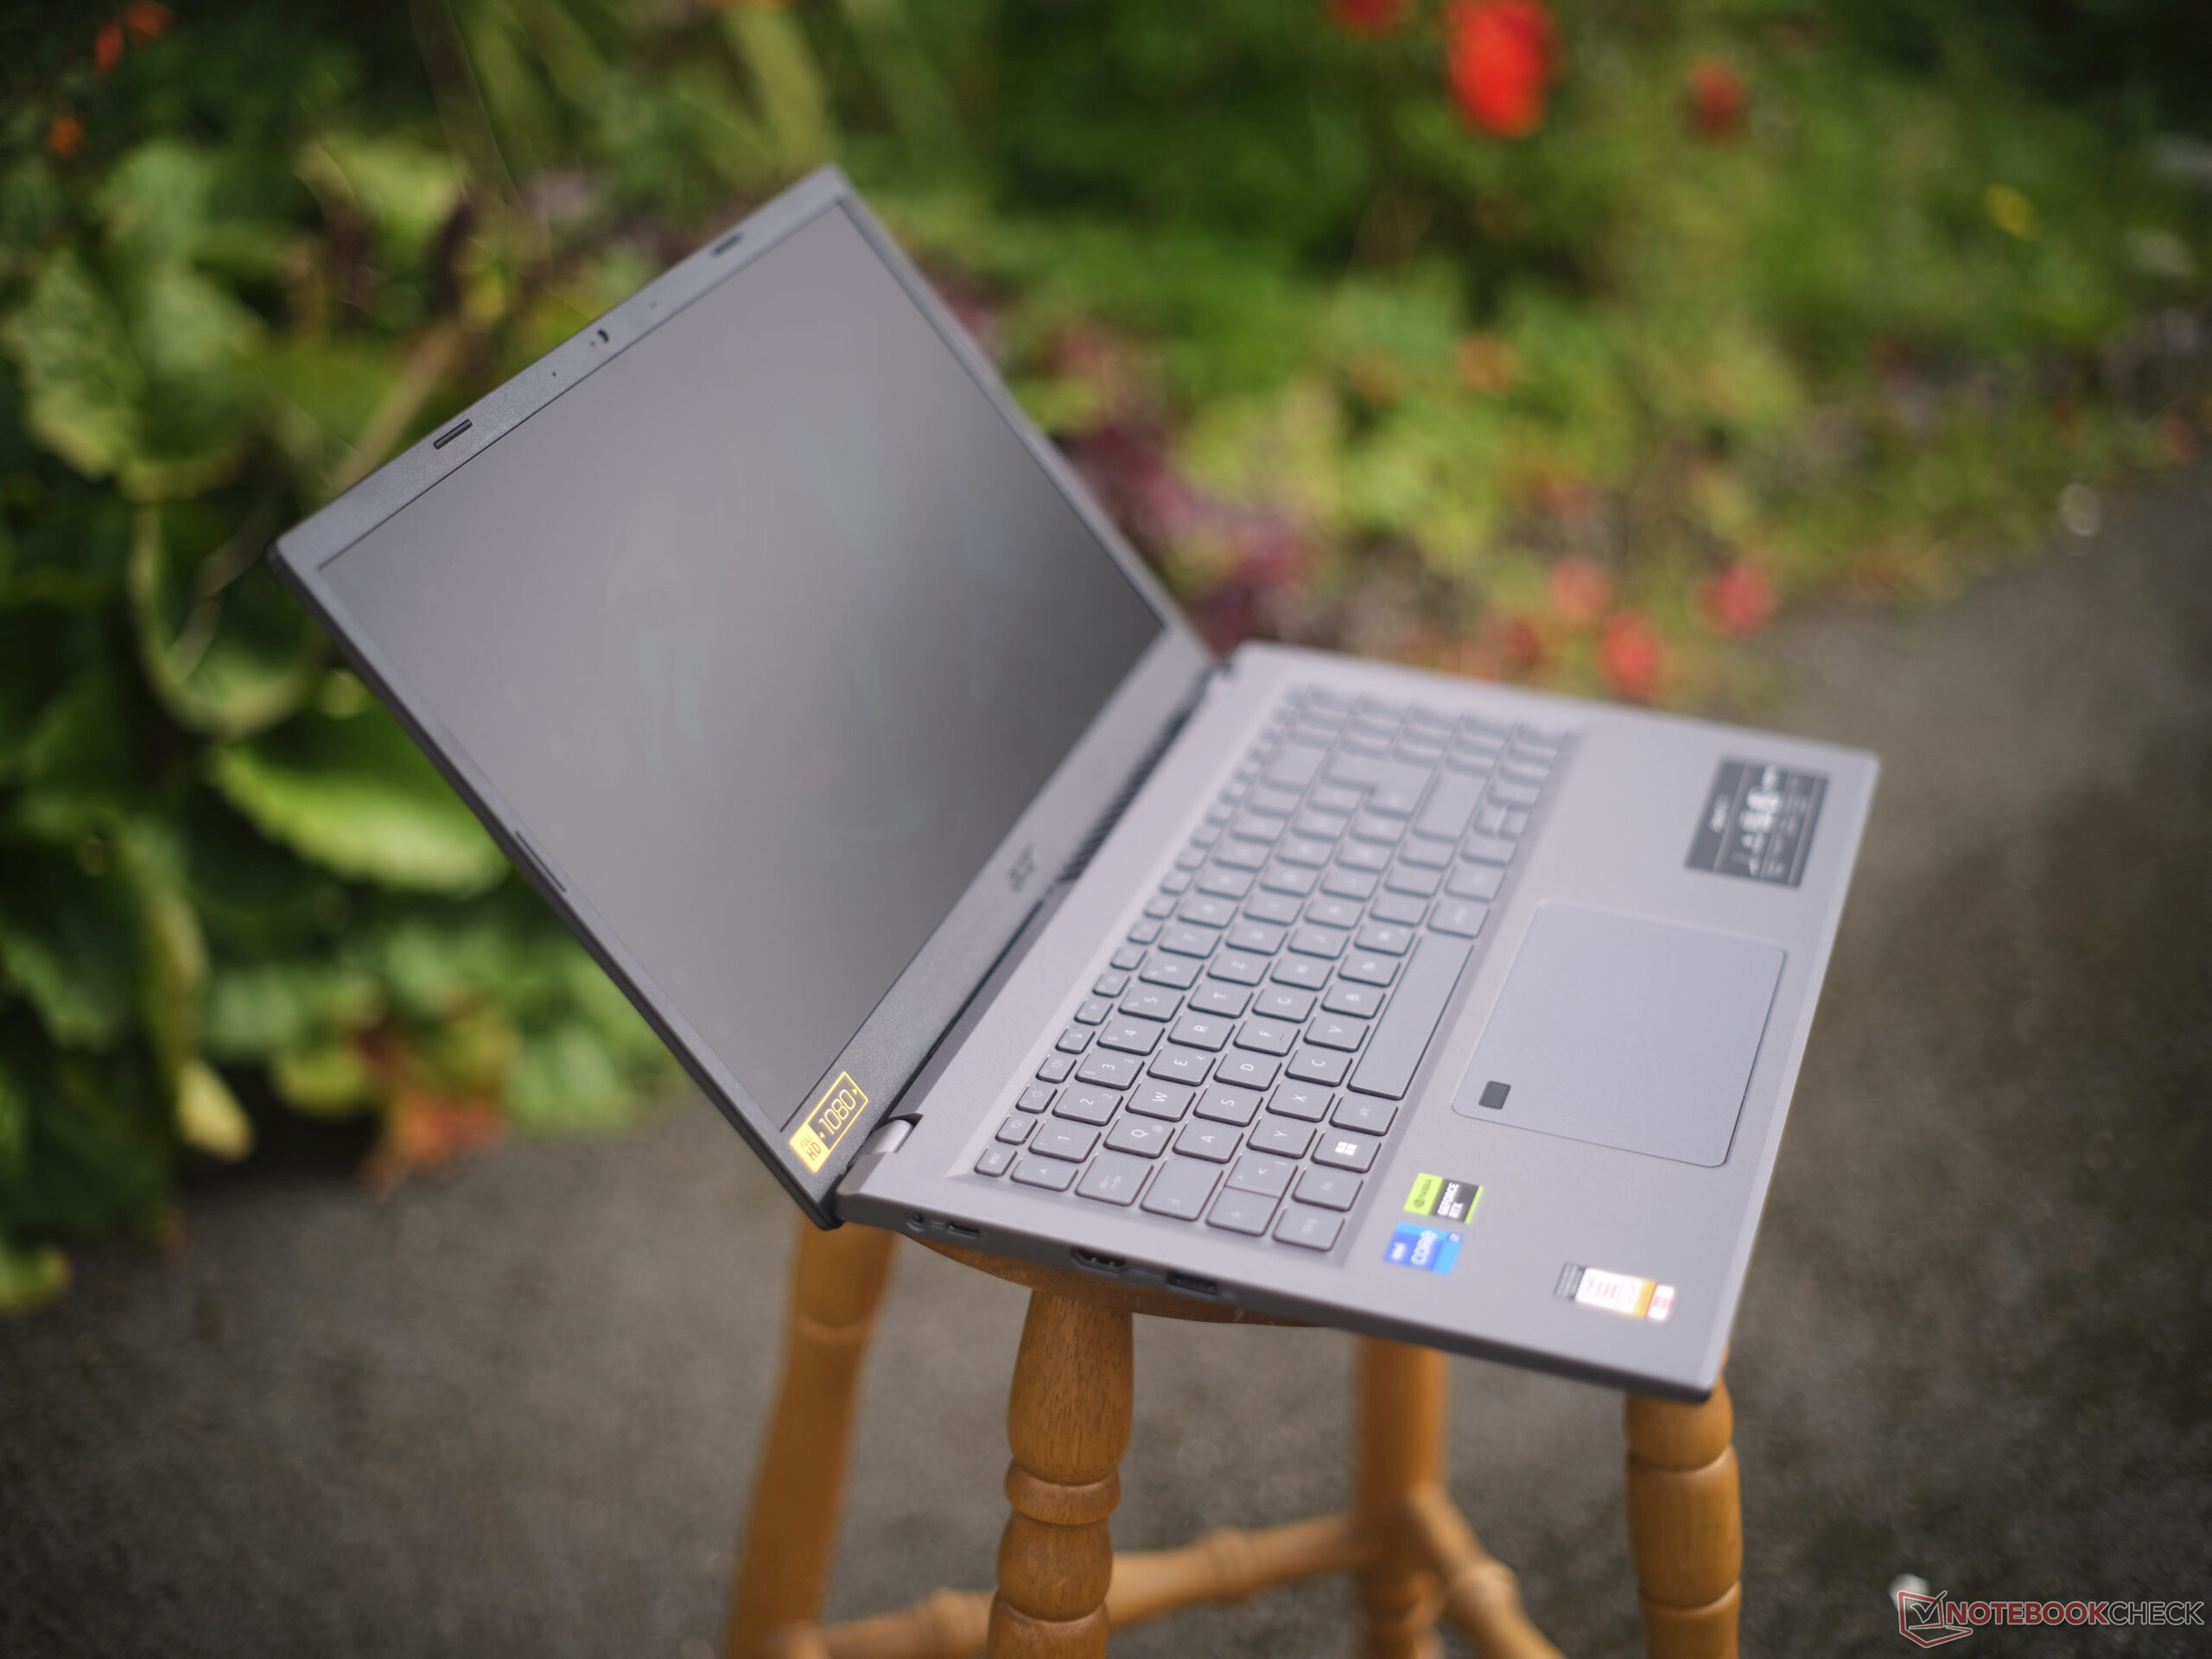
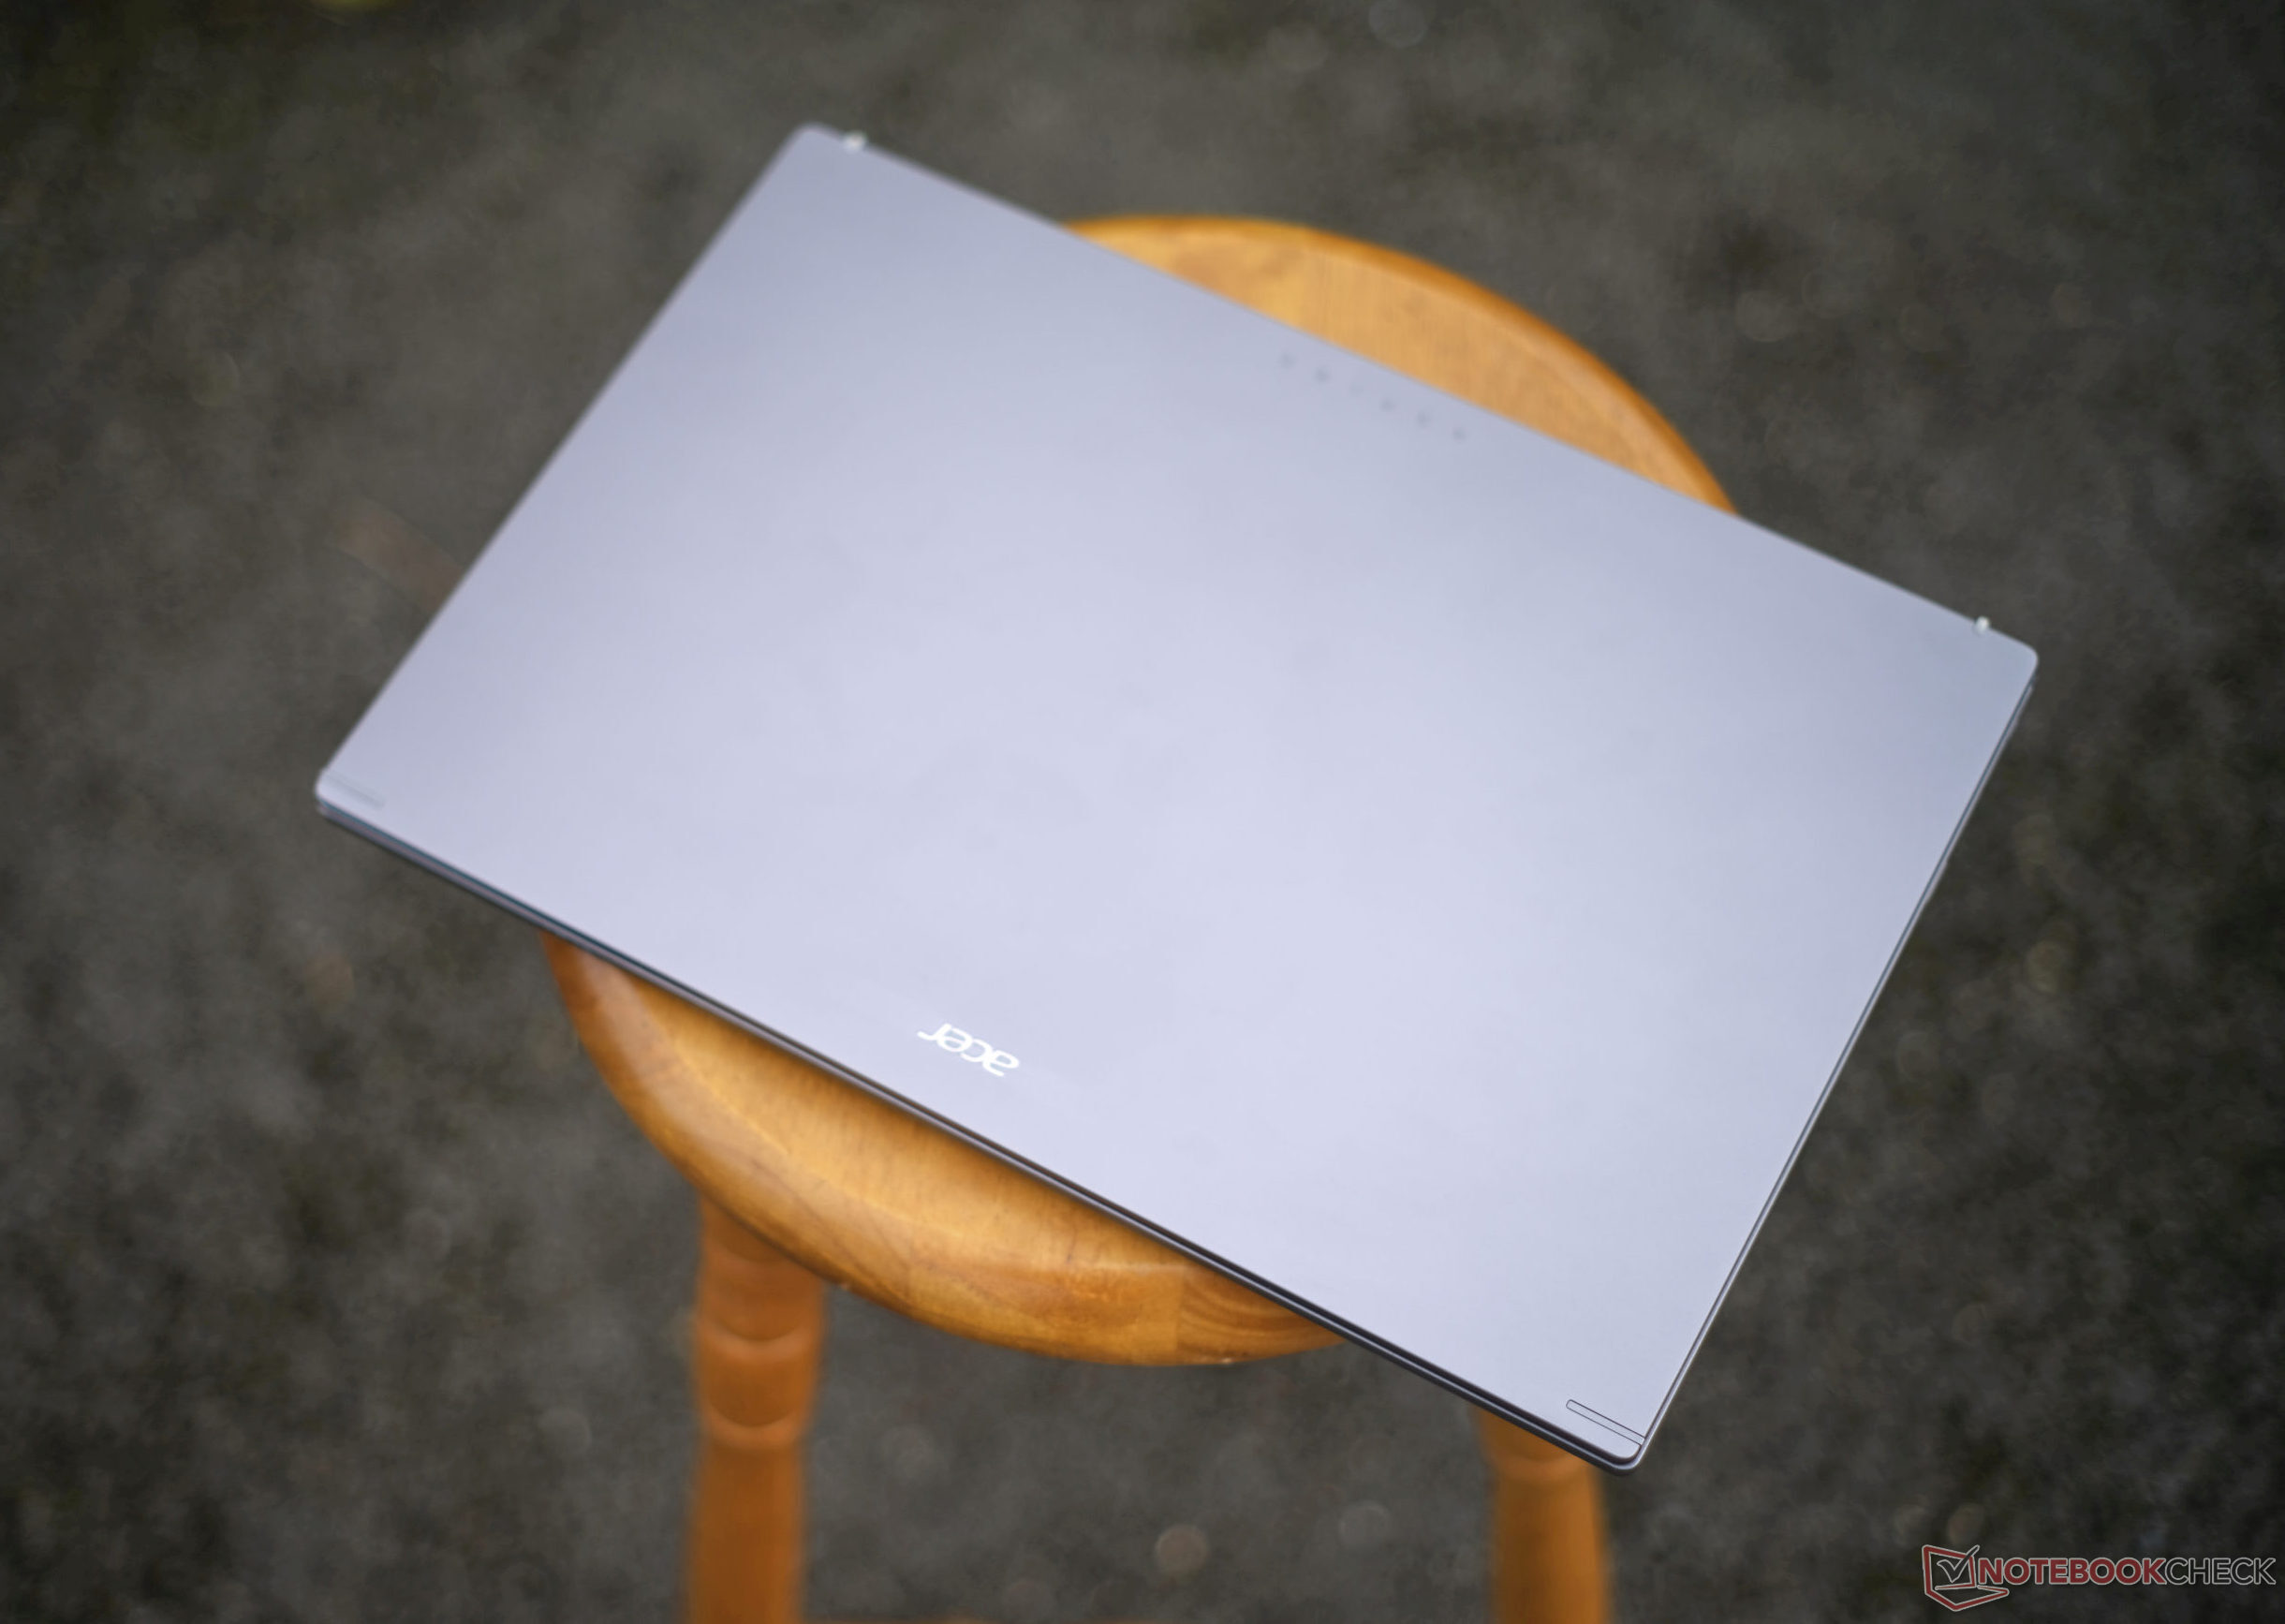
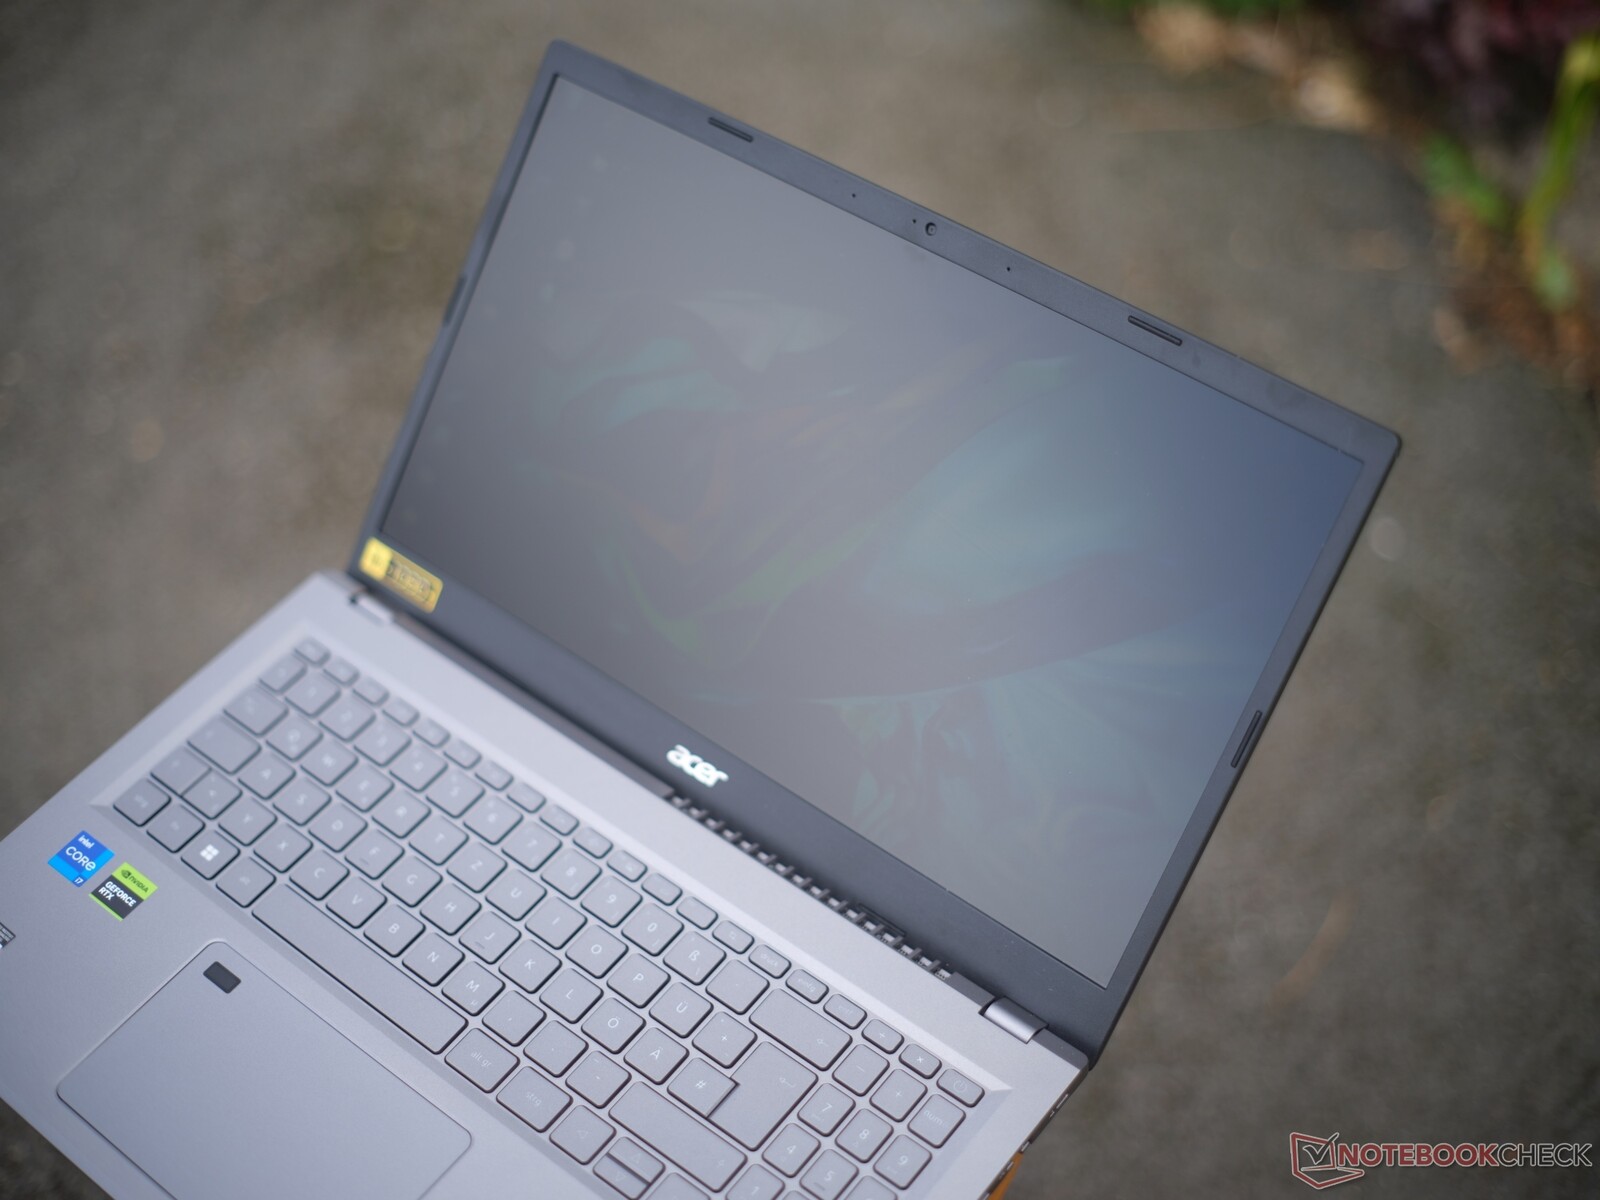
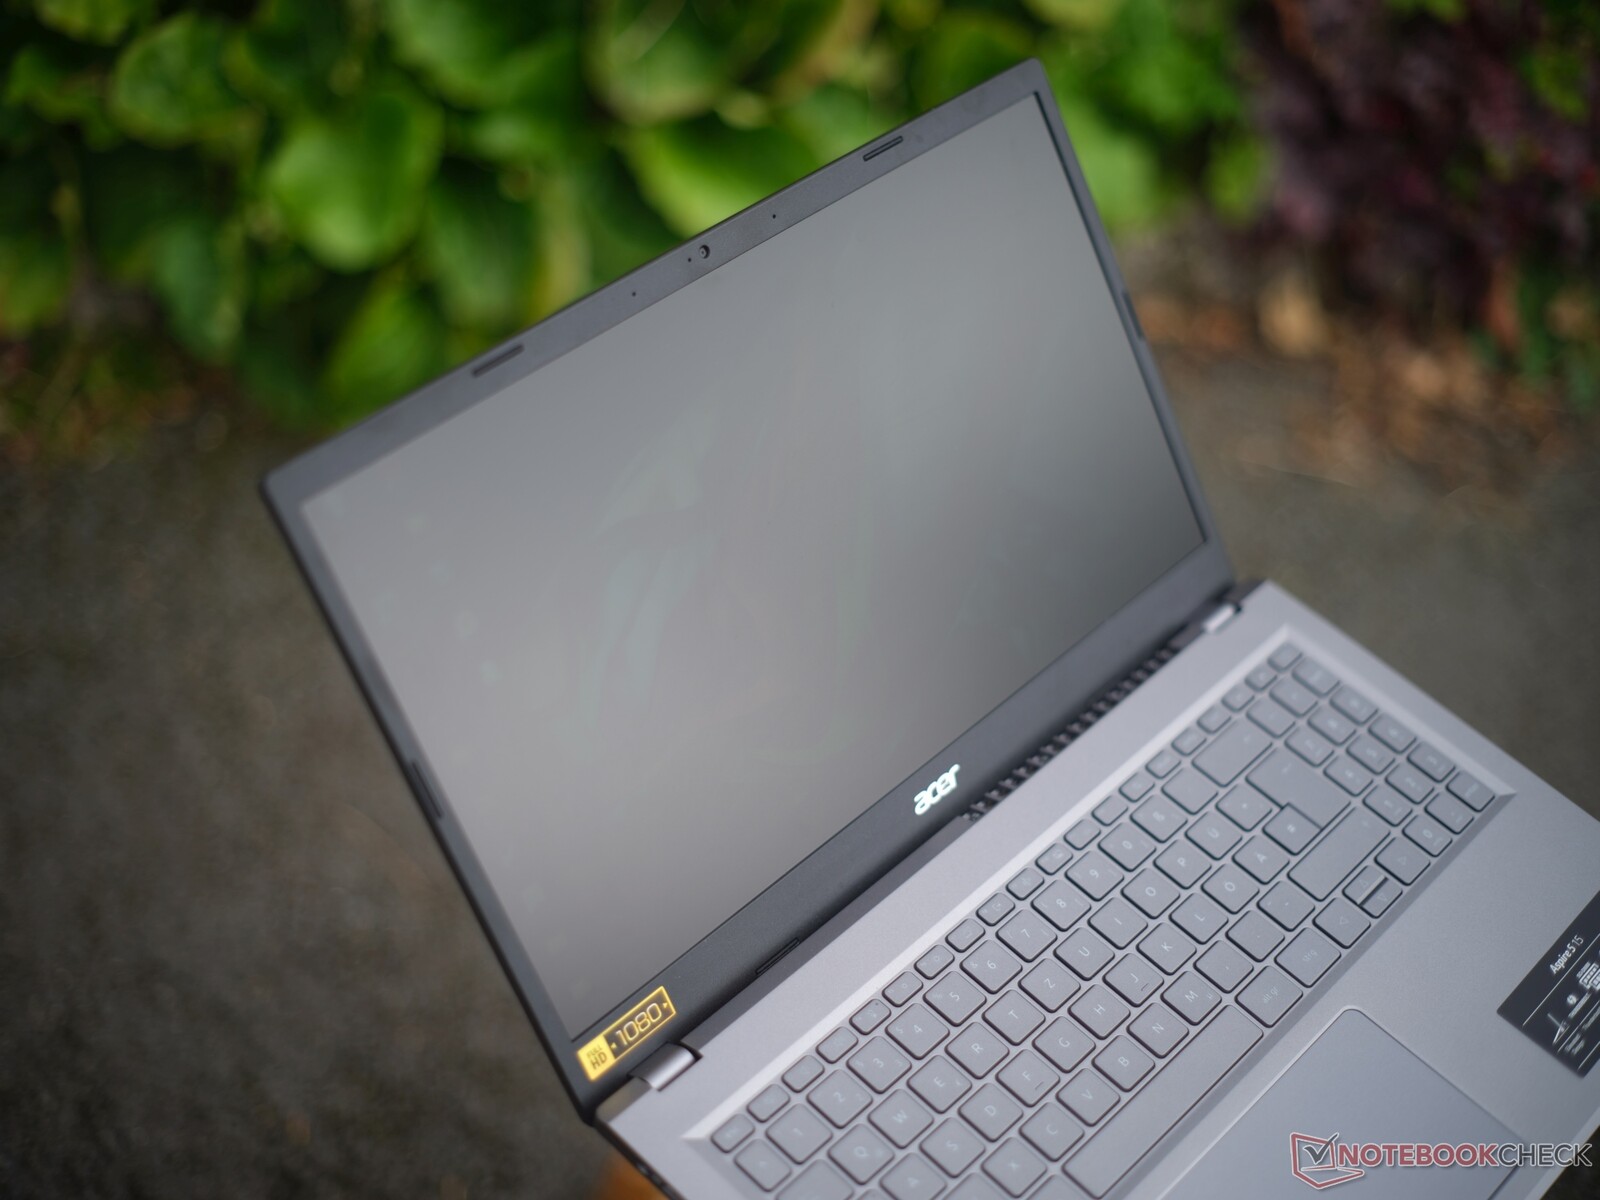
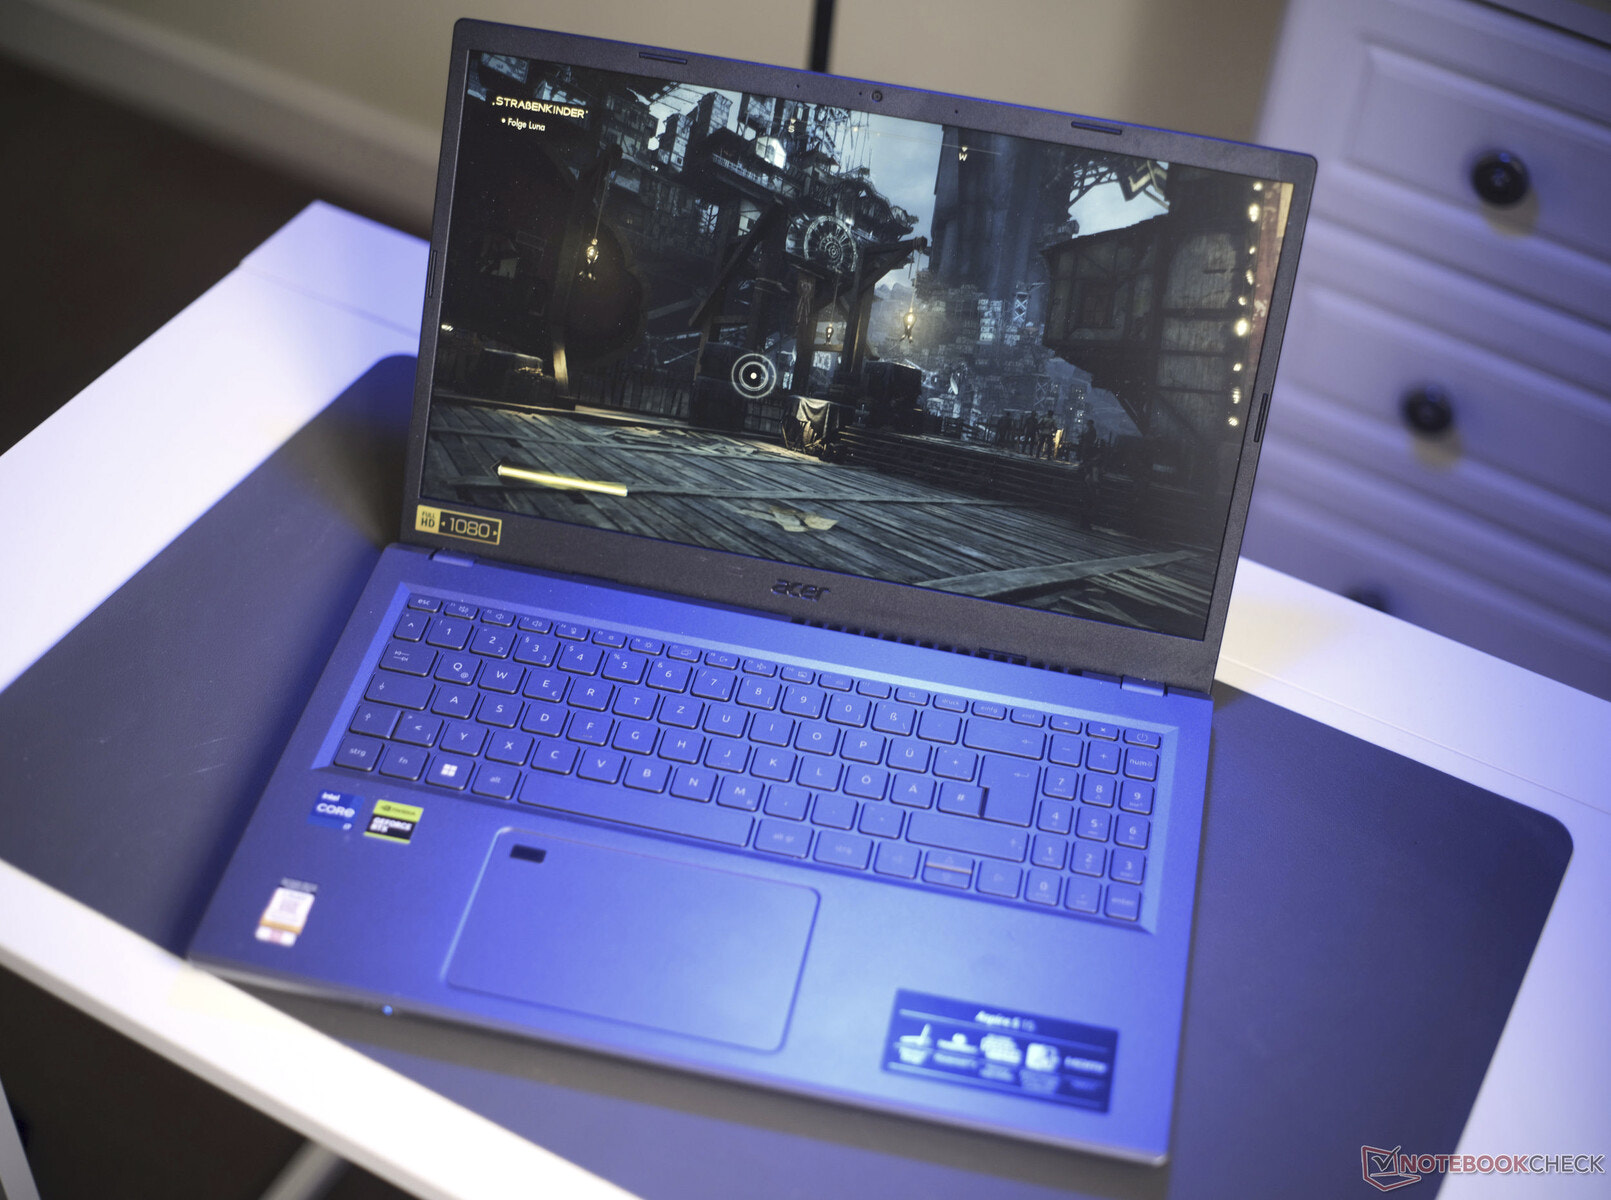
Funda: La sólida Aspire 5 con tapa metálica y ergo-lift
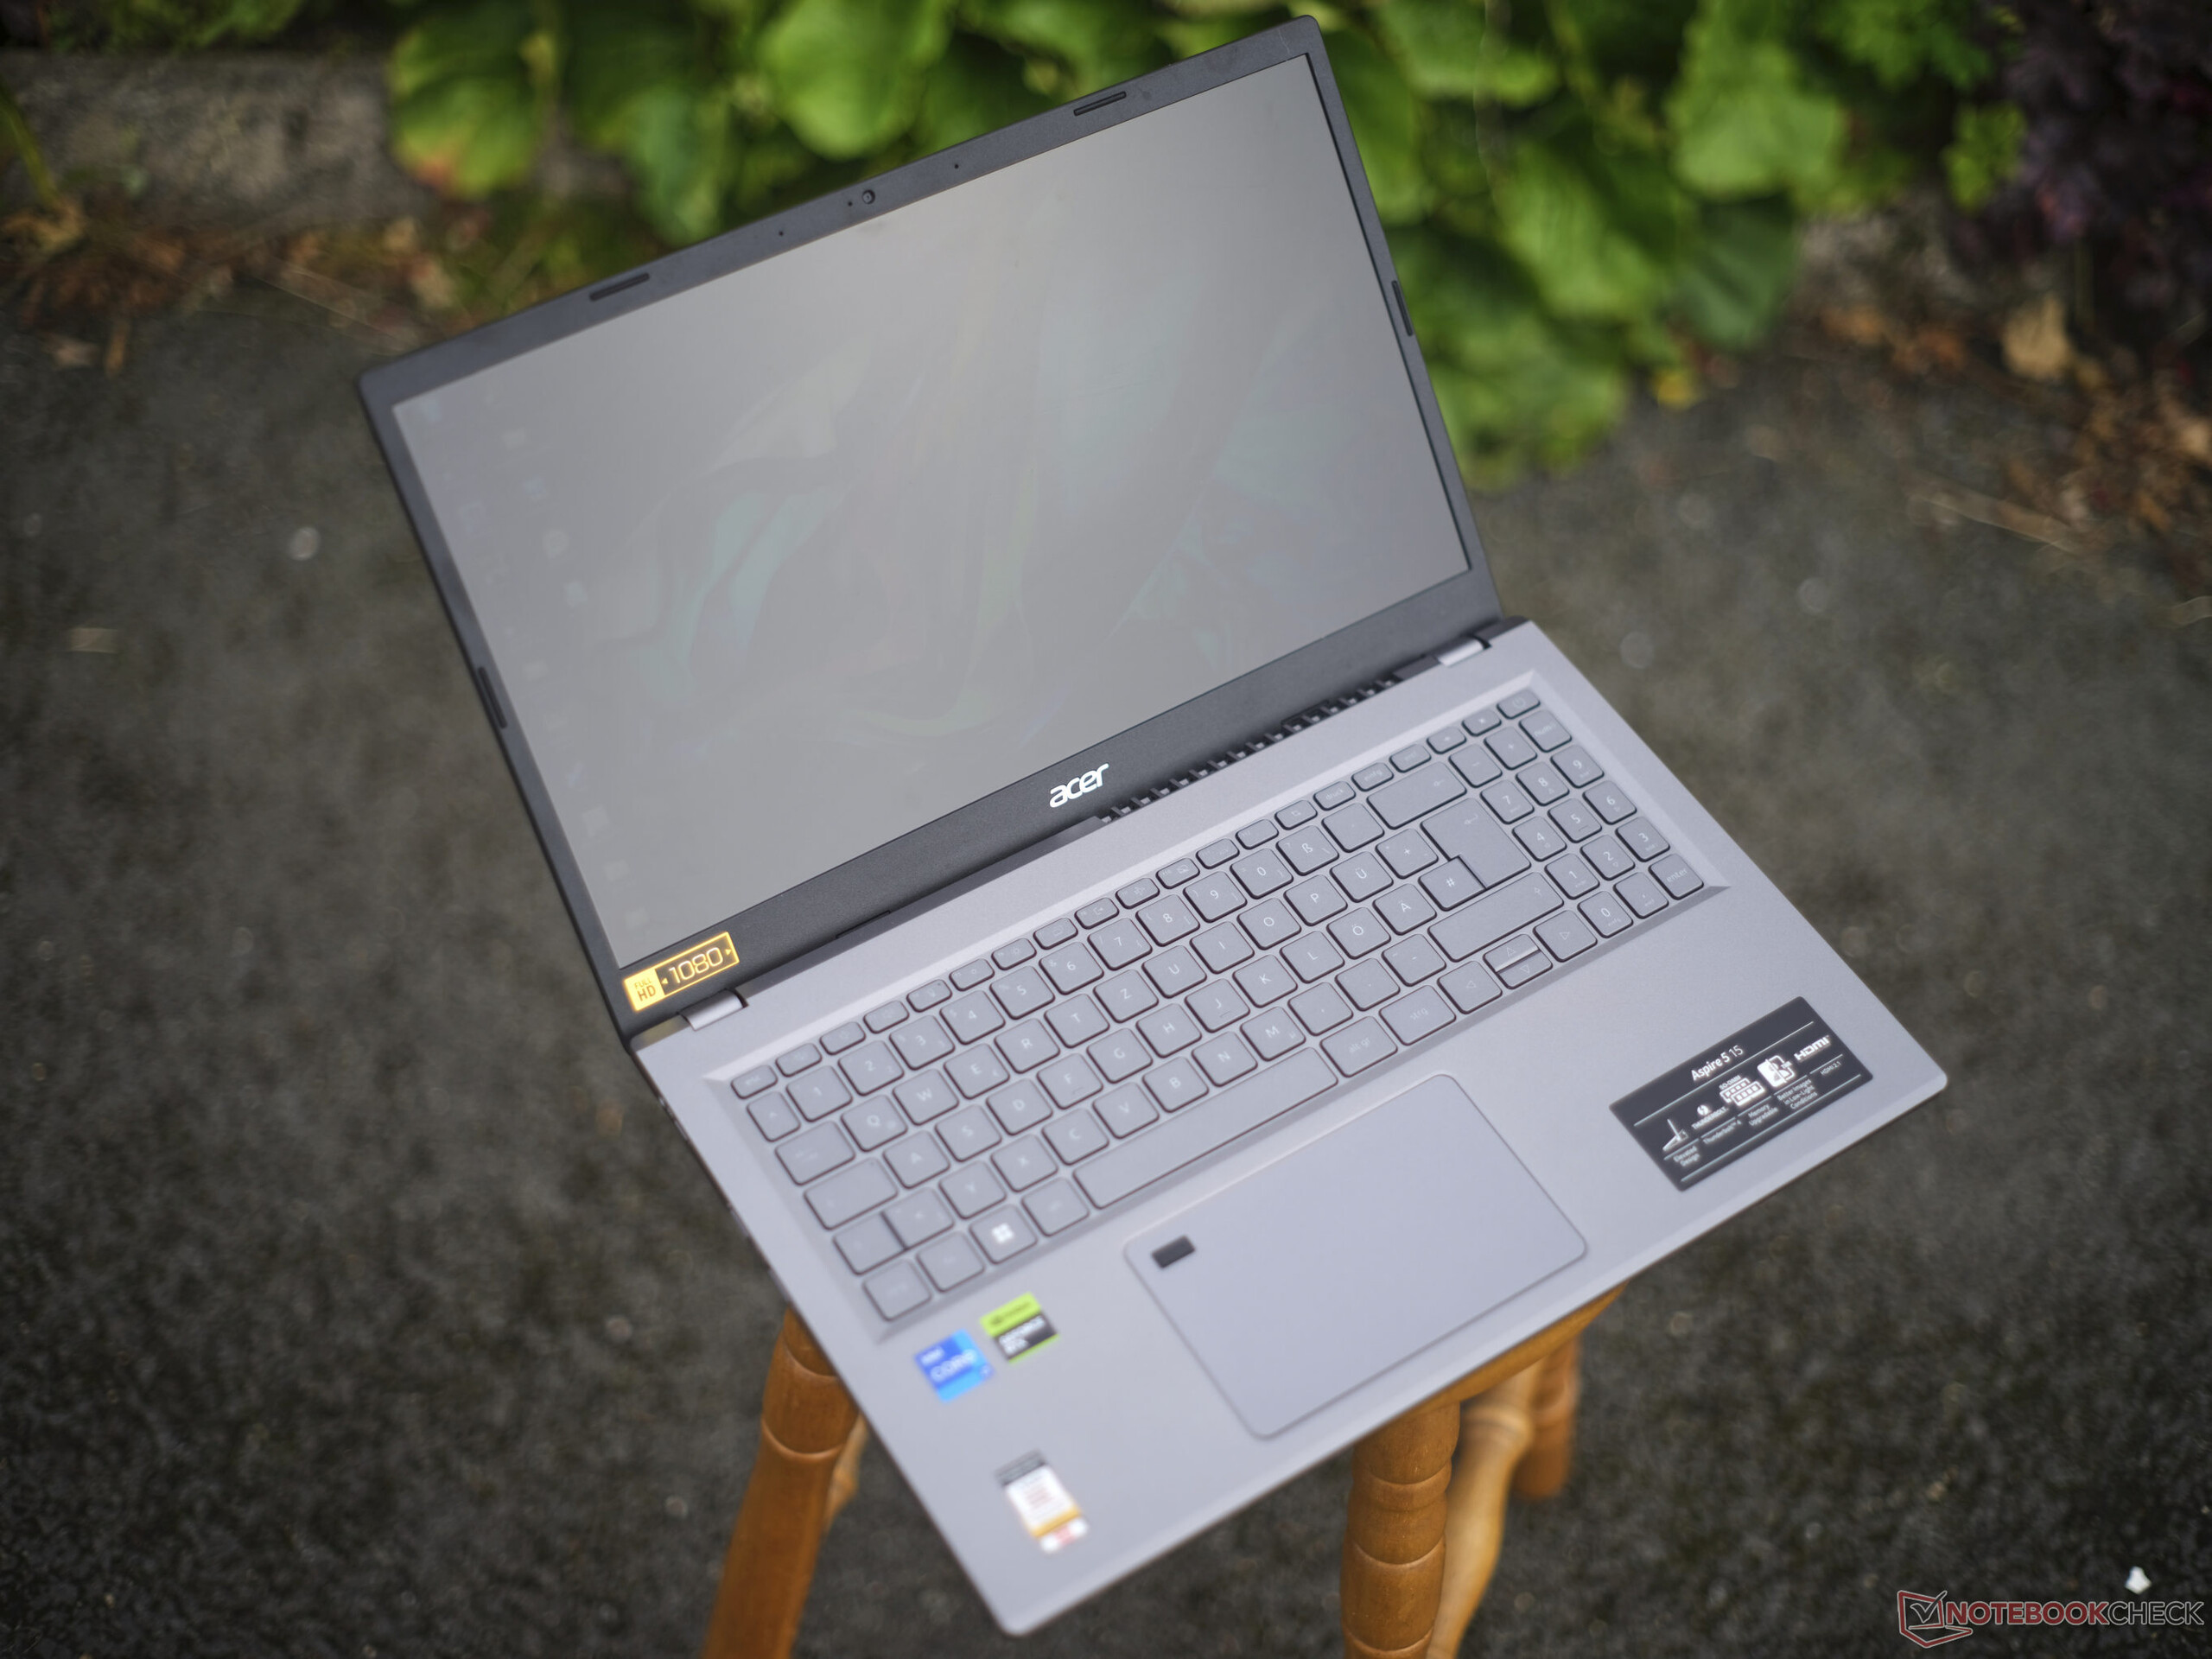
El Acer Aspire 5 (2023) se basa en una carcasa de plástico bastante resistente con aspecto de aluminio cepillado, mientras que la tapa es de metal. Sólo puede retorcerse ligeramente y no cede mucho cuando se aplica presión.
Su predecesor predecesortenía un color gris hierro más oscuro, mientras que elAspire 3se fabricó completamente en plástico como modelo de lanzamiento. El LenovoIdeaPad 5y el DellInspiron 16el HuaweiMateBook D 15así como la serieEnvy de HPestán todos hechos completamente de metal y con biseles delgados.
En general, el portátil causa una buena impresión - sus superficies son agradables, las marcas de huellas no son demasiado visibles - pero sus anchos biseles parecen un poco anticuados. Su ergo-lift resulta muy útil cuando abres el portátil ampliamente (máx. 135°), lo que resulta en una posición cómoda para teclear y una refrigeración más efectiva. La bisagra es estrecha, pero se puede abrir el portátil con una mano.

Tiene unas medidas y un peso medios para un portátil de 15,6 pulgadas: pesa 1,8 kg y tiene un grosor de unos 20 mm. La páginaLenovo LOQ 15yAsus TUF Gaming A15son, como era de esperar, un poco más voluminosos, con 2,2 kg/2,5 kg y un grosor de ~25 mm. Esto es para que puedan enfriar sus temperaturas más altas. El HuaweiMateBook D 15 AMDes el más ligero de nuestros dispositivos de comparación, con un peso de 1.61 kg.
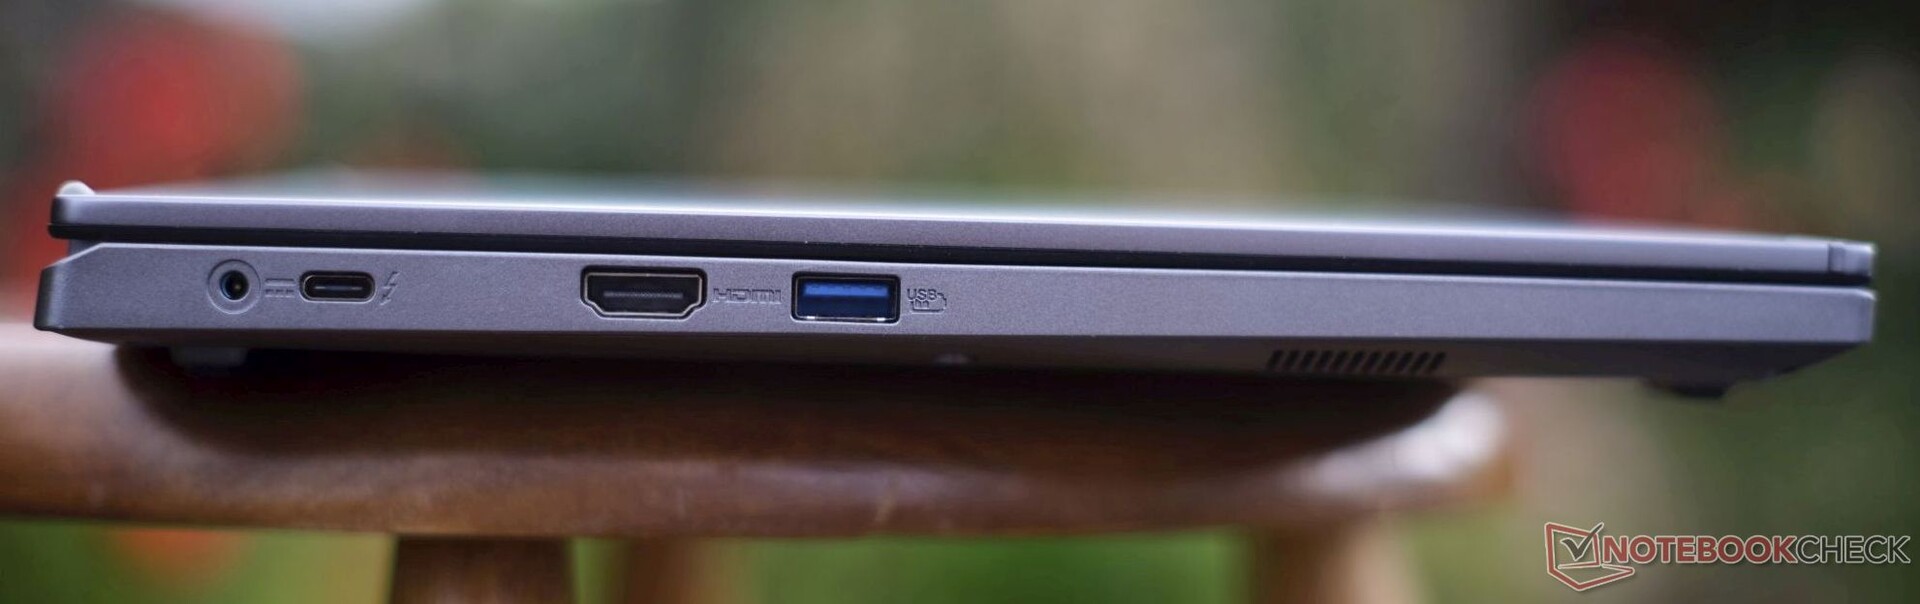
Conectividad: Thunderbolt 4, GBit-RJ45 y HDMI 2.1
Es agradable ver que el portátil cuenta con un puerto Thunderbolt 4 que incluye DisplayPort 1.4 y Power Delivery, algo que no siempre se da en los portátiles de oficina. Sólo elTUF Gaming A15y elAspire 5 del año pasadocuentan con este estándar USB-4 en nuestro campo de comparación. El actualIdeaPad Pro 5 16y elInspiron 16 (Intel)también lo incorporan.
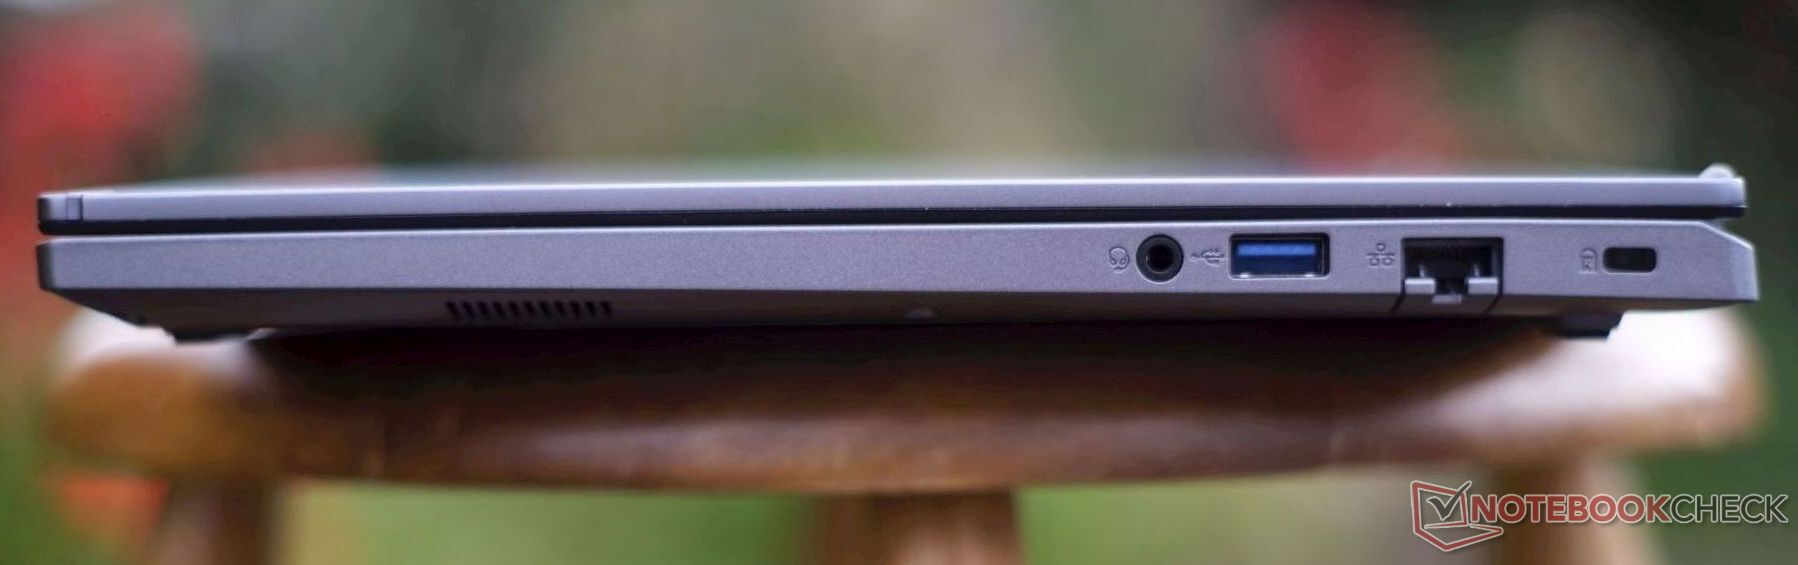
Su puerto HDMI 2.1 soporta 8K, pero sólo a 30 Hz o 4K a 60 Hz. Por lado, hay un USB-A 3.2 Gen1 (5 GBit/s), mientras que su predecesor traía tres puertos USB-A. En el lado derecho hay: GBit-RJ45, cierre Kensington y clavija de audio de 3,5 mm.
Comunicación
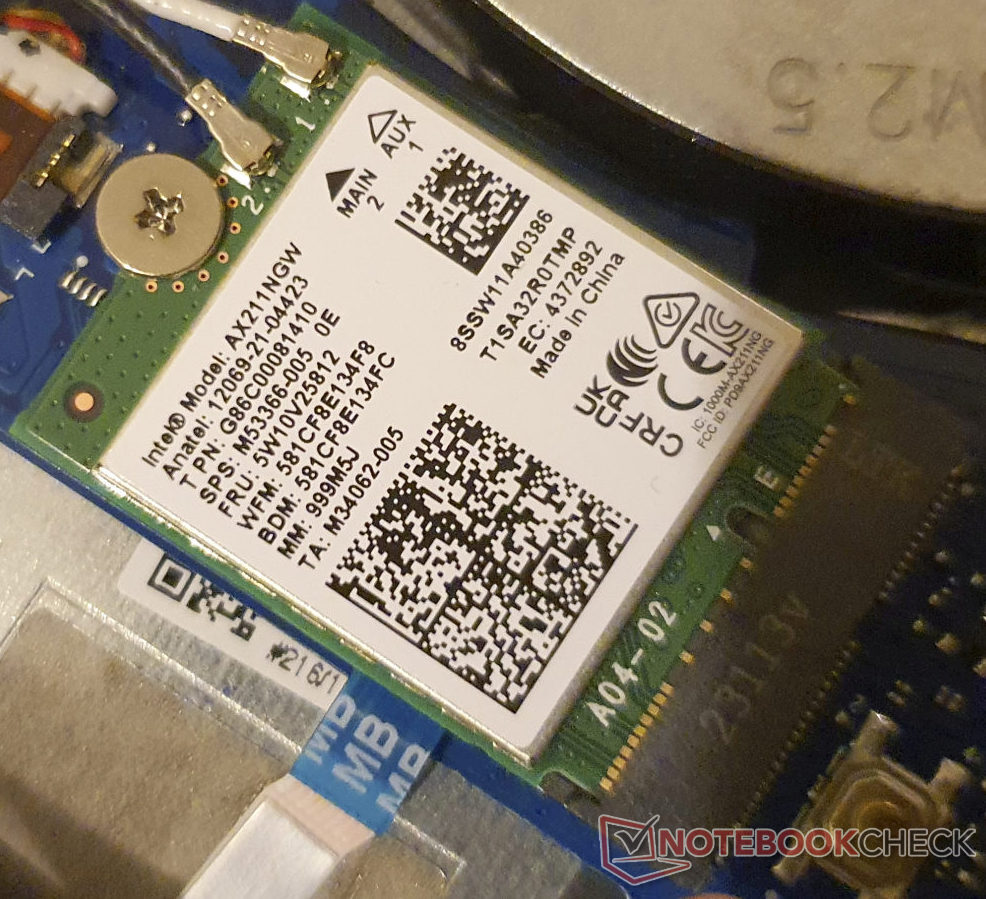
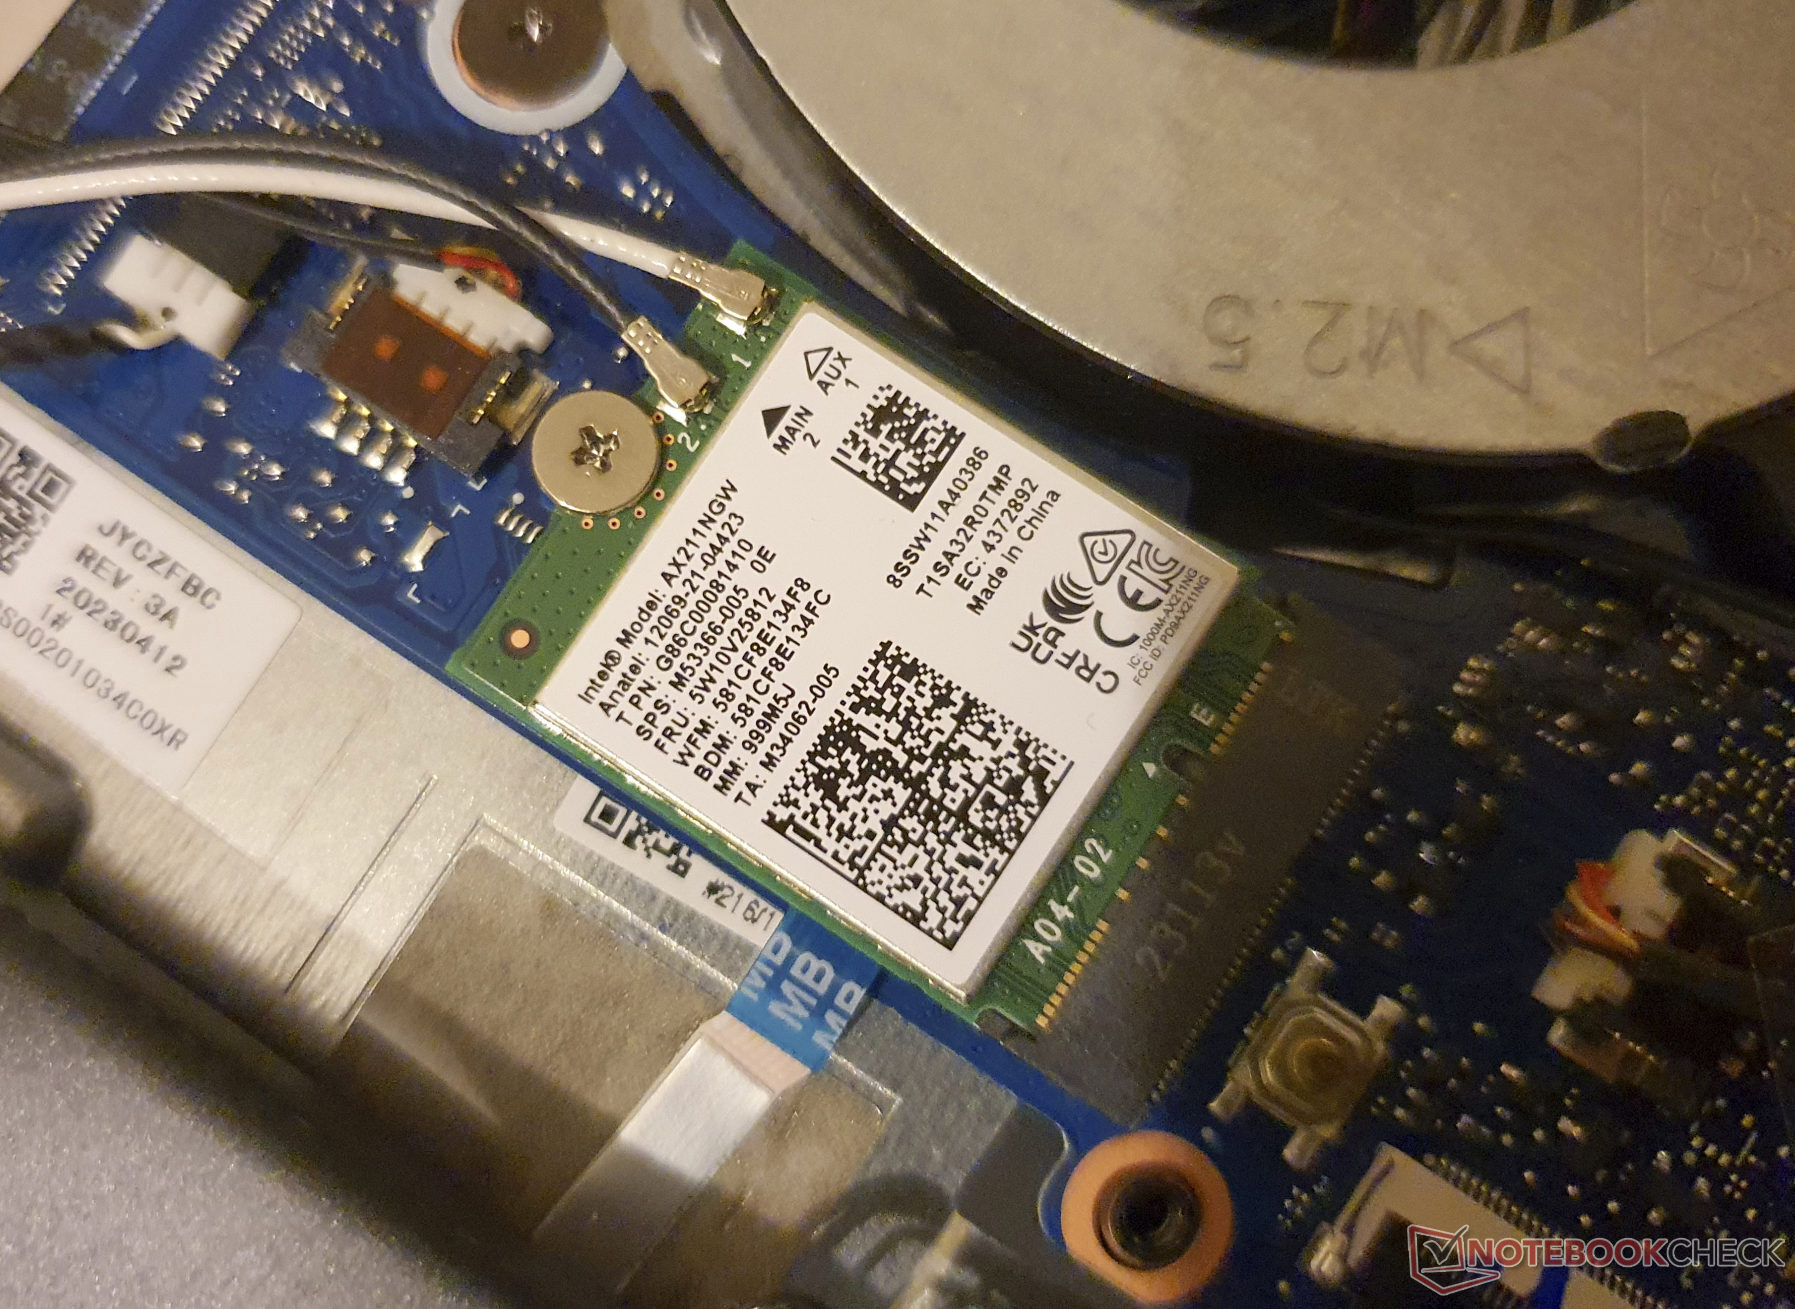
El módulo WLAN instalado, el Intel AX211, puede aprovechar todo su potencial usando la frecuencia de 6 GHz, con una velocidad de recepción de más de 1,6 Gbit/s.
Los chips Realtek dentro del IdeaPad 5 15 y el MateBook D 15 AMD son considerablemente más lentos. Soporta Bluetooth 5.1 pero no cuenta con opciones LTE.
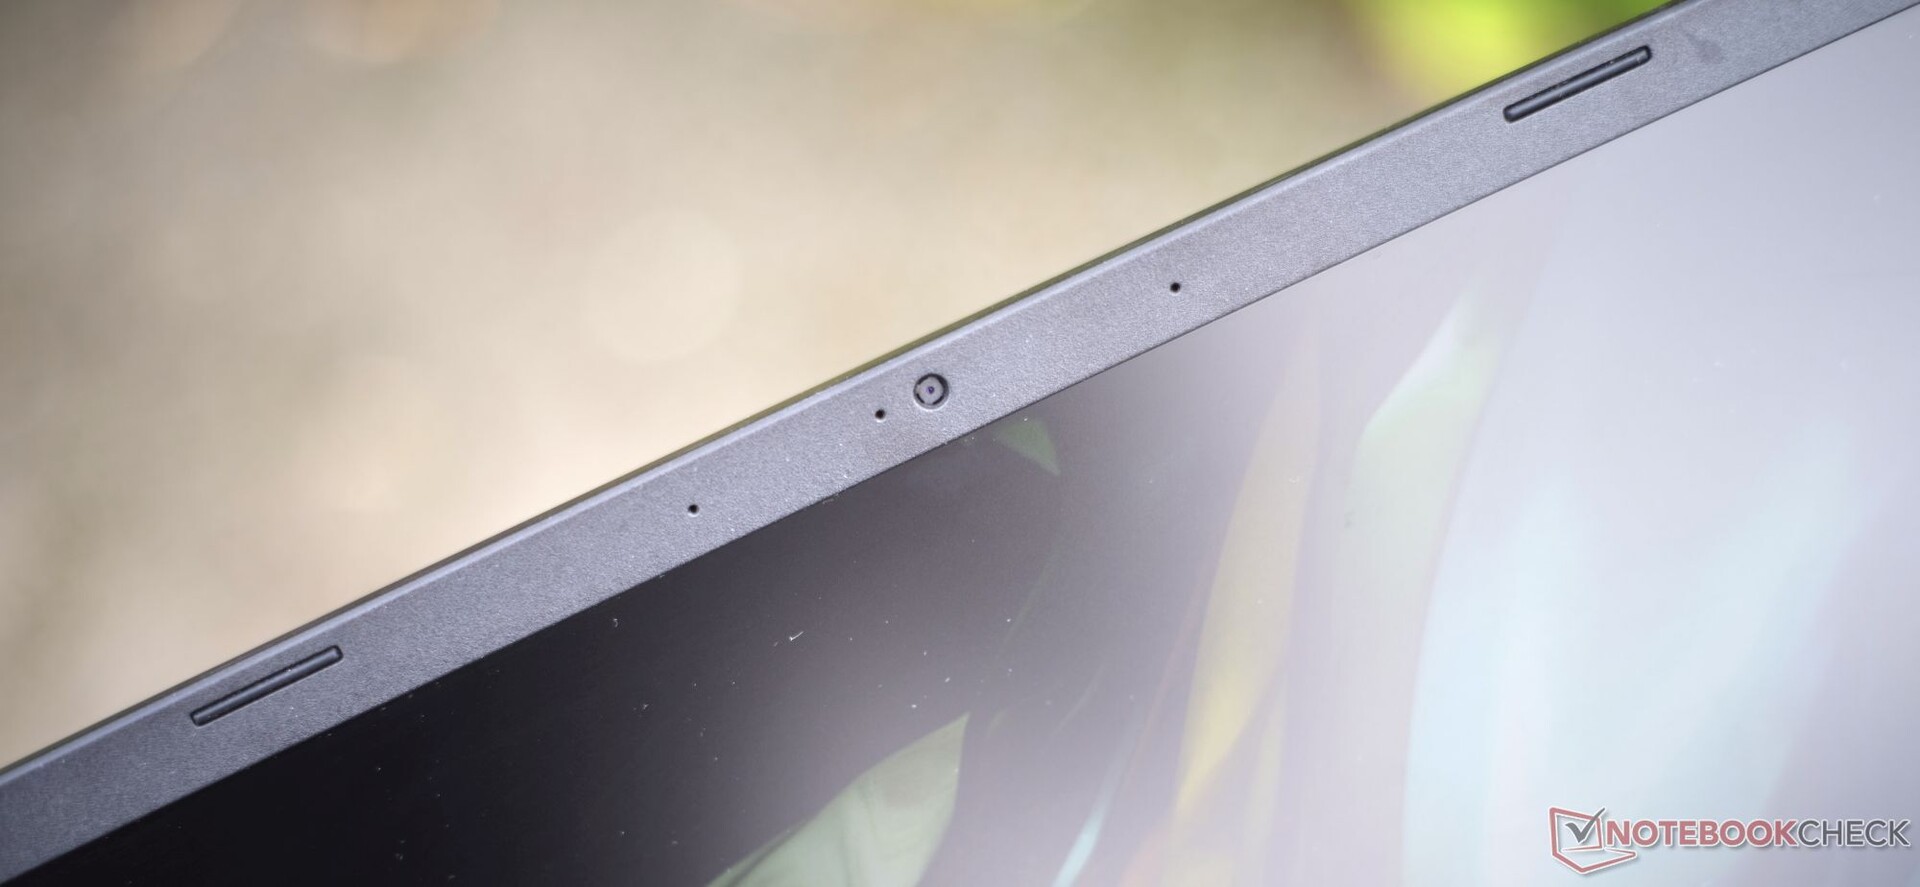
Cámara web
Como era de esperar, su webcam 1080p no ofrece imágenes sobresalientes, pero es mucho mejor que la de la mayoría de la competencia. Es compatible con Windows Hello y tiene un micrófono dual decente, pero no tiene tapa para el objetivo. Algunas funciones útiles son el encuadre automático, el desenfoque de fondo avanzado y la corrección ocular.


Volumen de suministro
Aparte de una fuente de alimentación compacta de 90 vatios, el portátil no viene con ningún accesorio adicional. El sitio web de Acer tampoco ofrece ningún accesorio especializado. Es agradable ver que el embalaje es respetuoso con el medio ambiente y que el dispositivo se entrega sin plástico y, en su lugar, con cartón reciclado y pasta de papel moldeada. Por otro lado, la gran cantidad de bloatware preinstalado es una molestia.
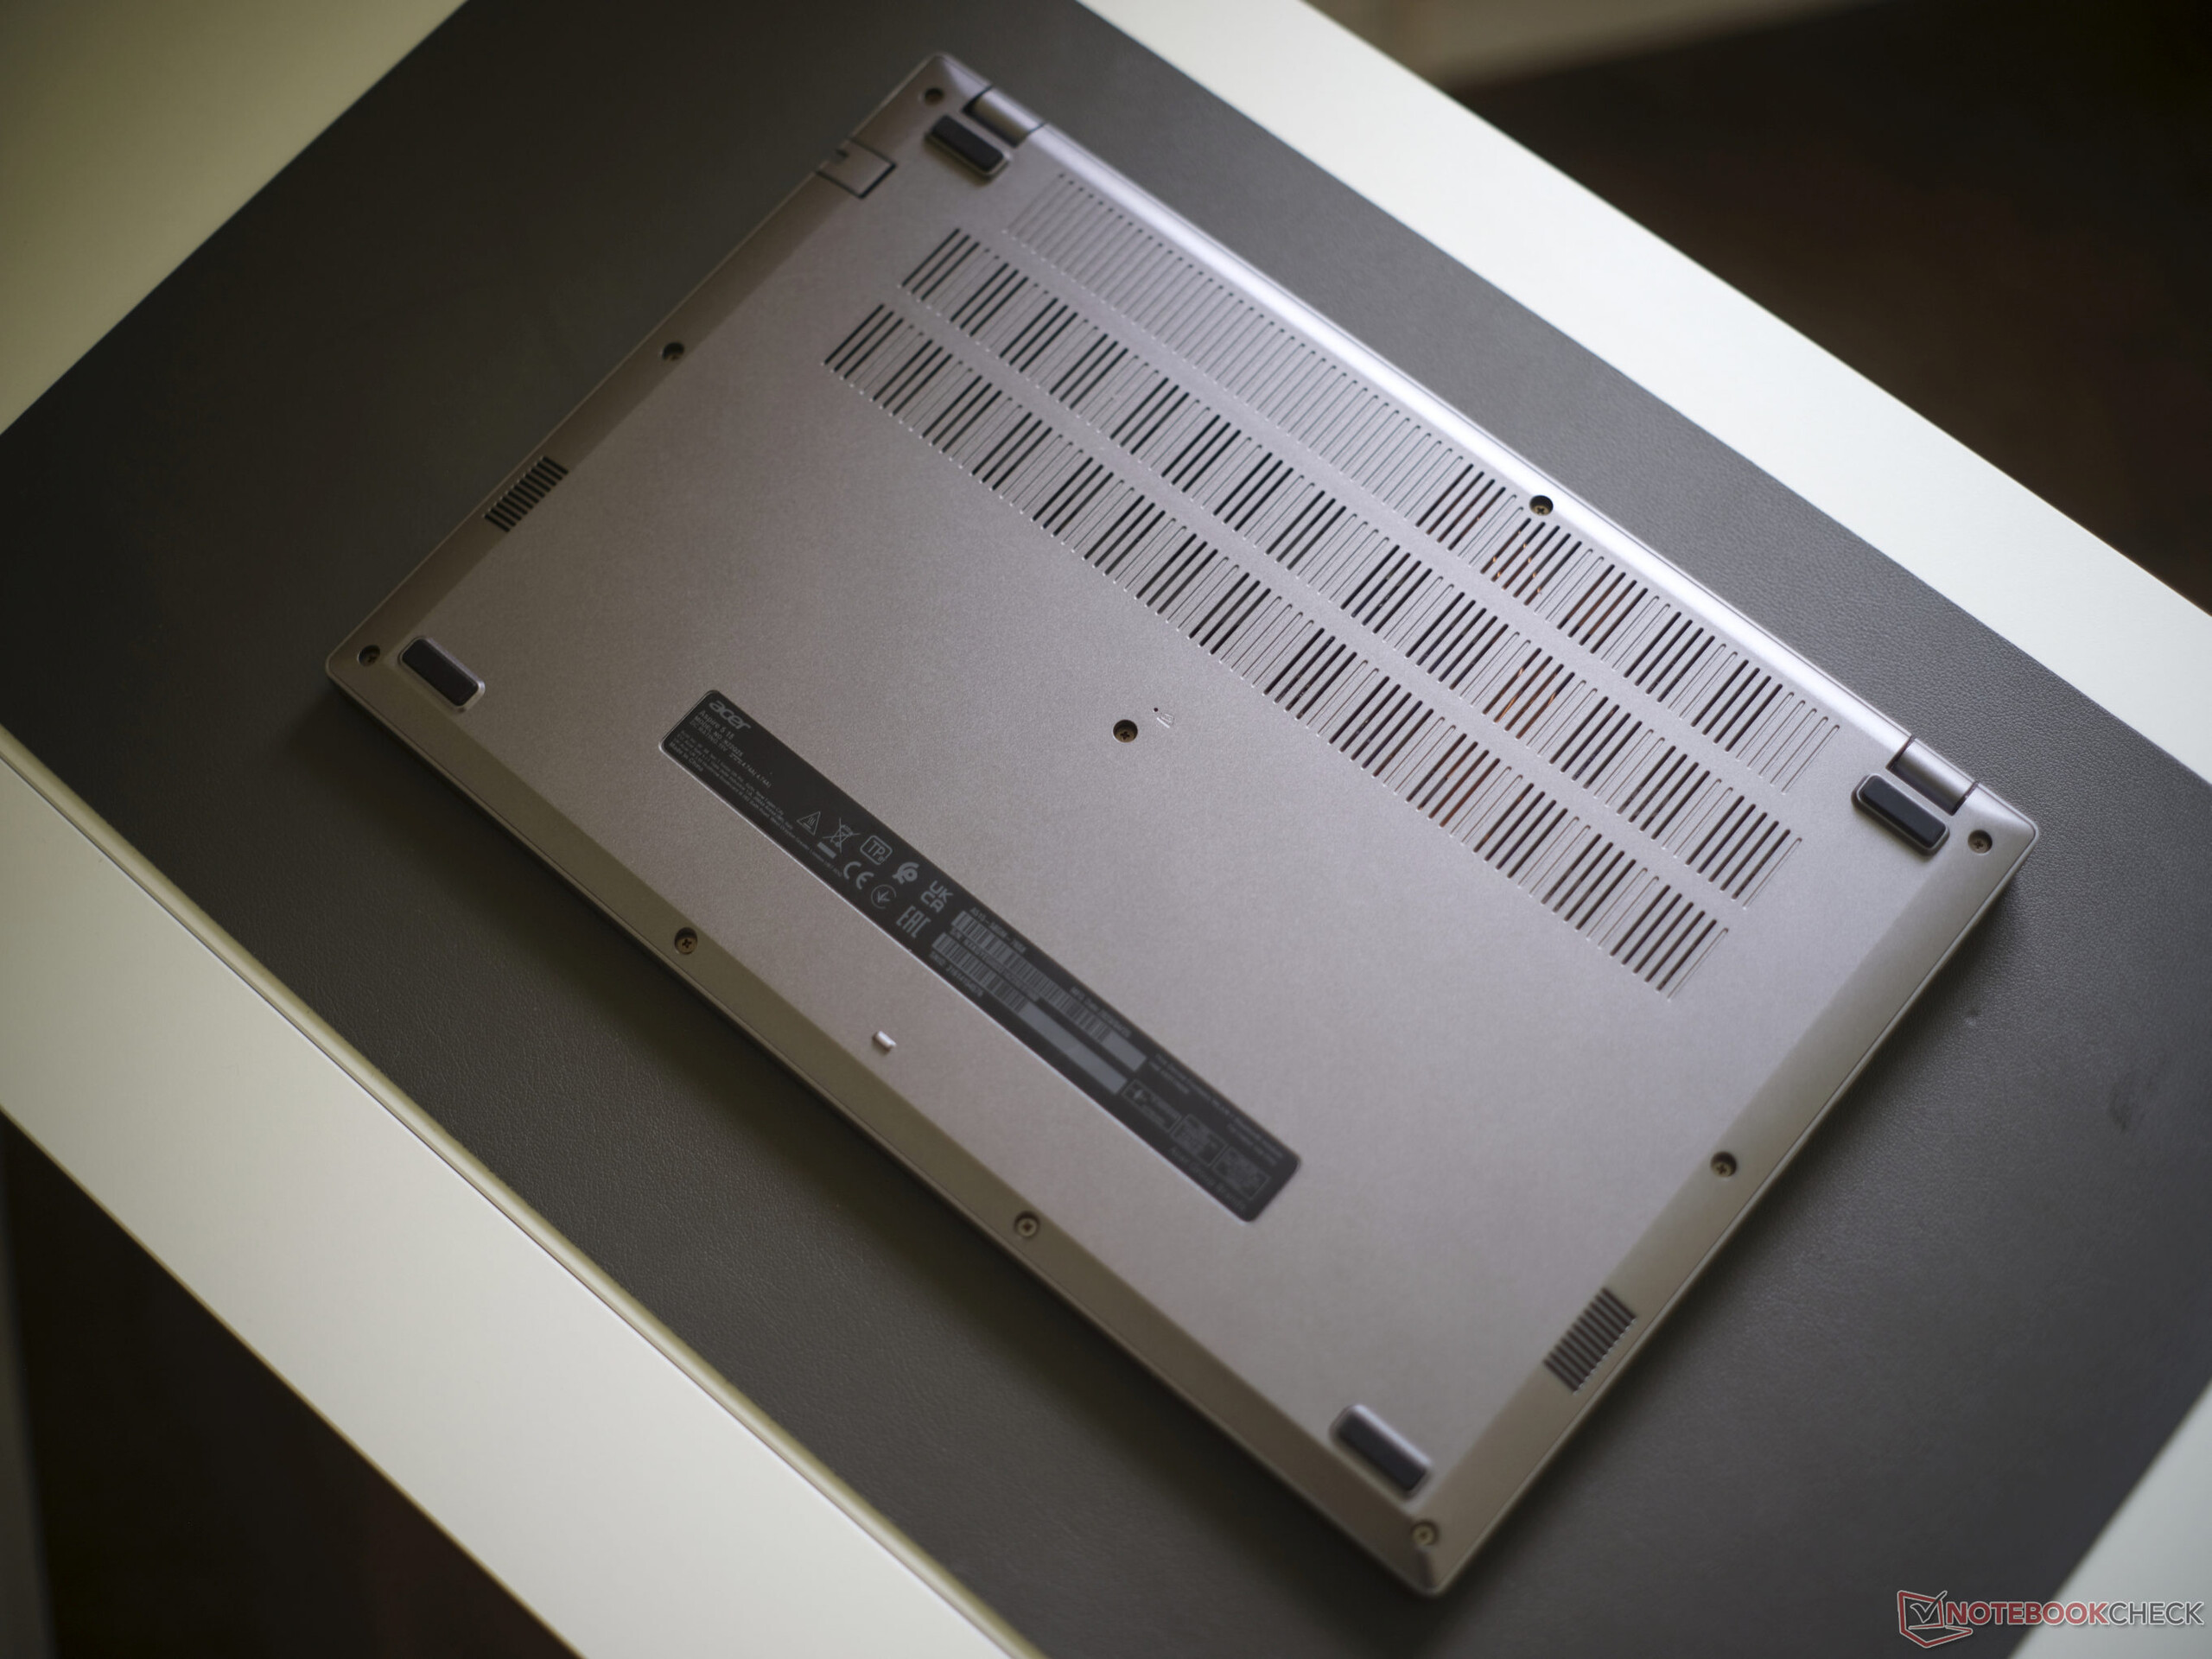
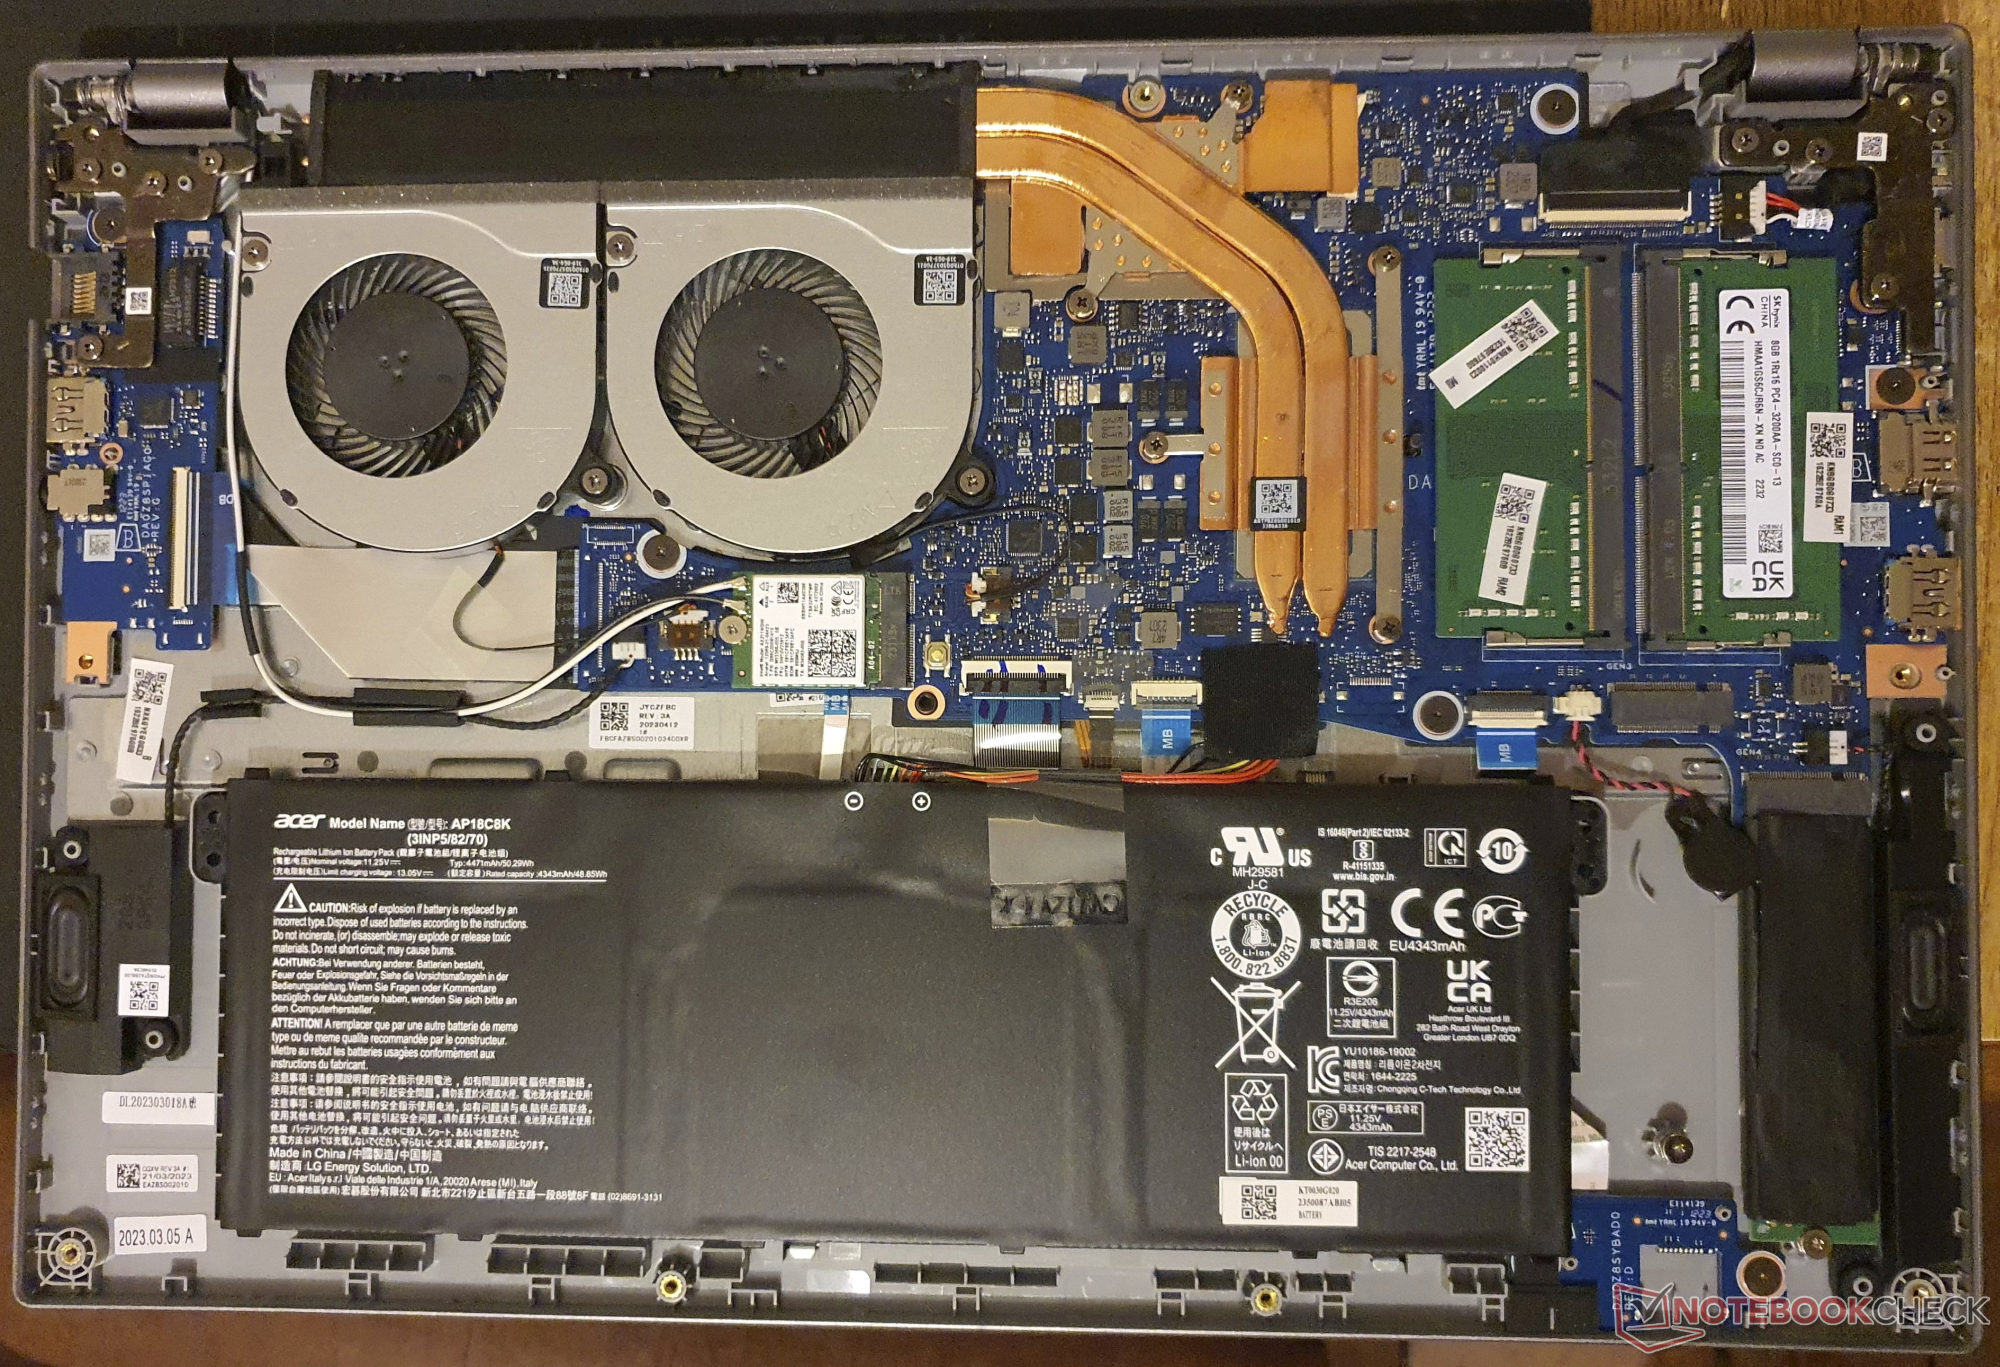
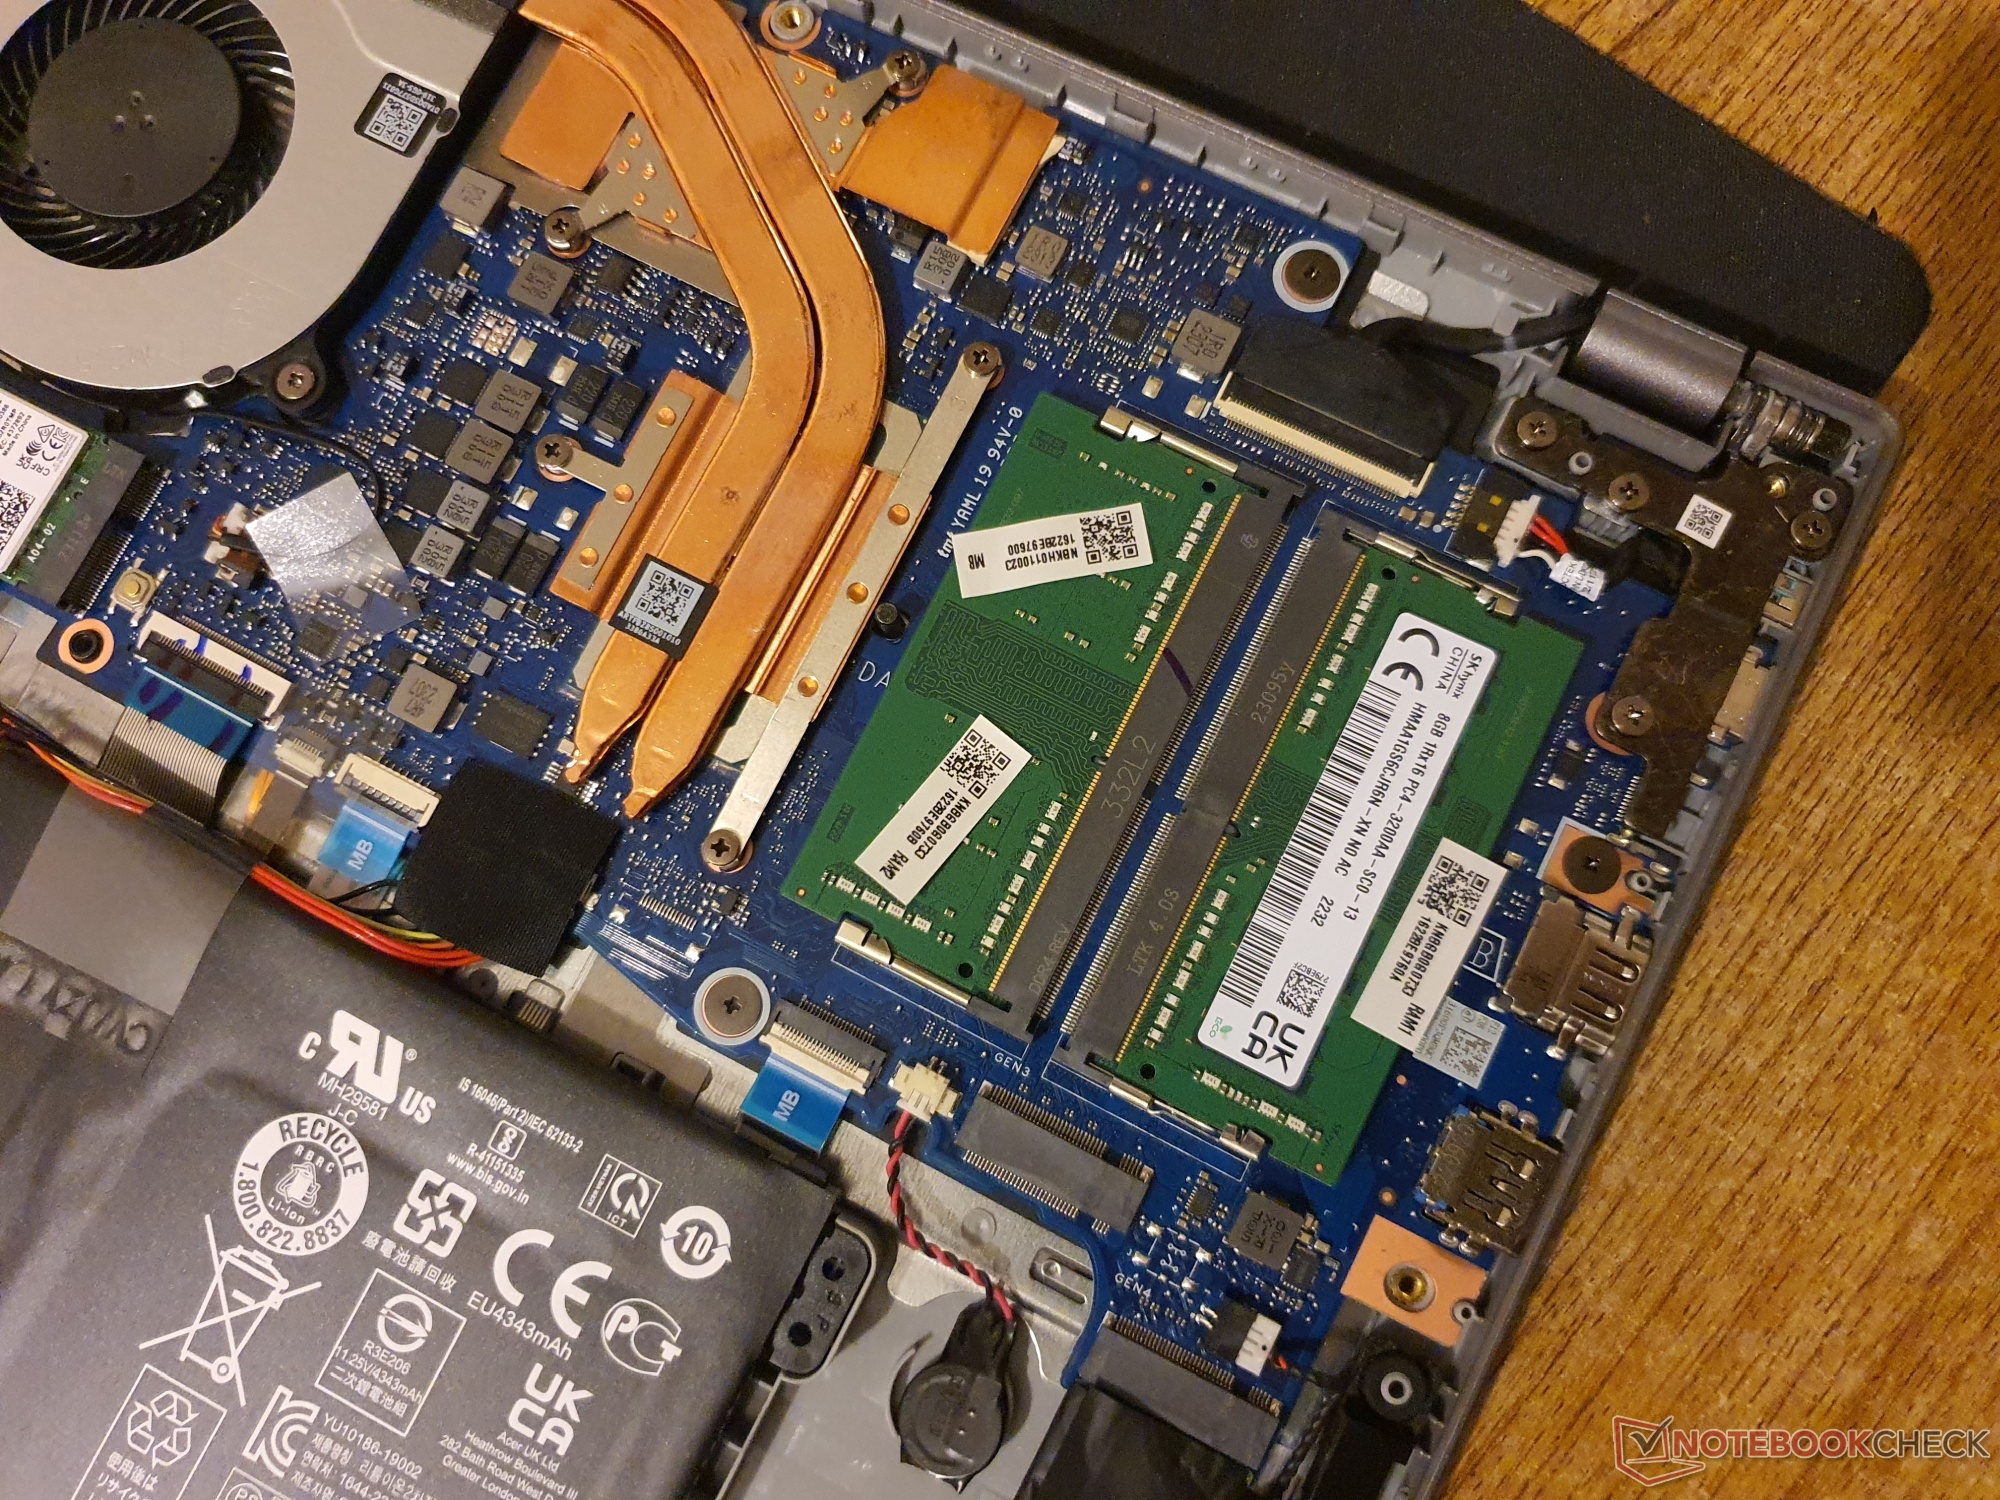
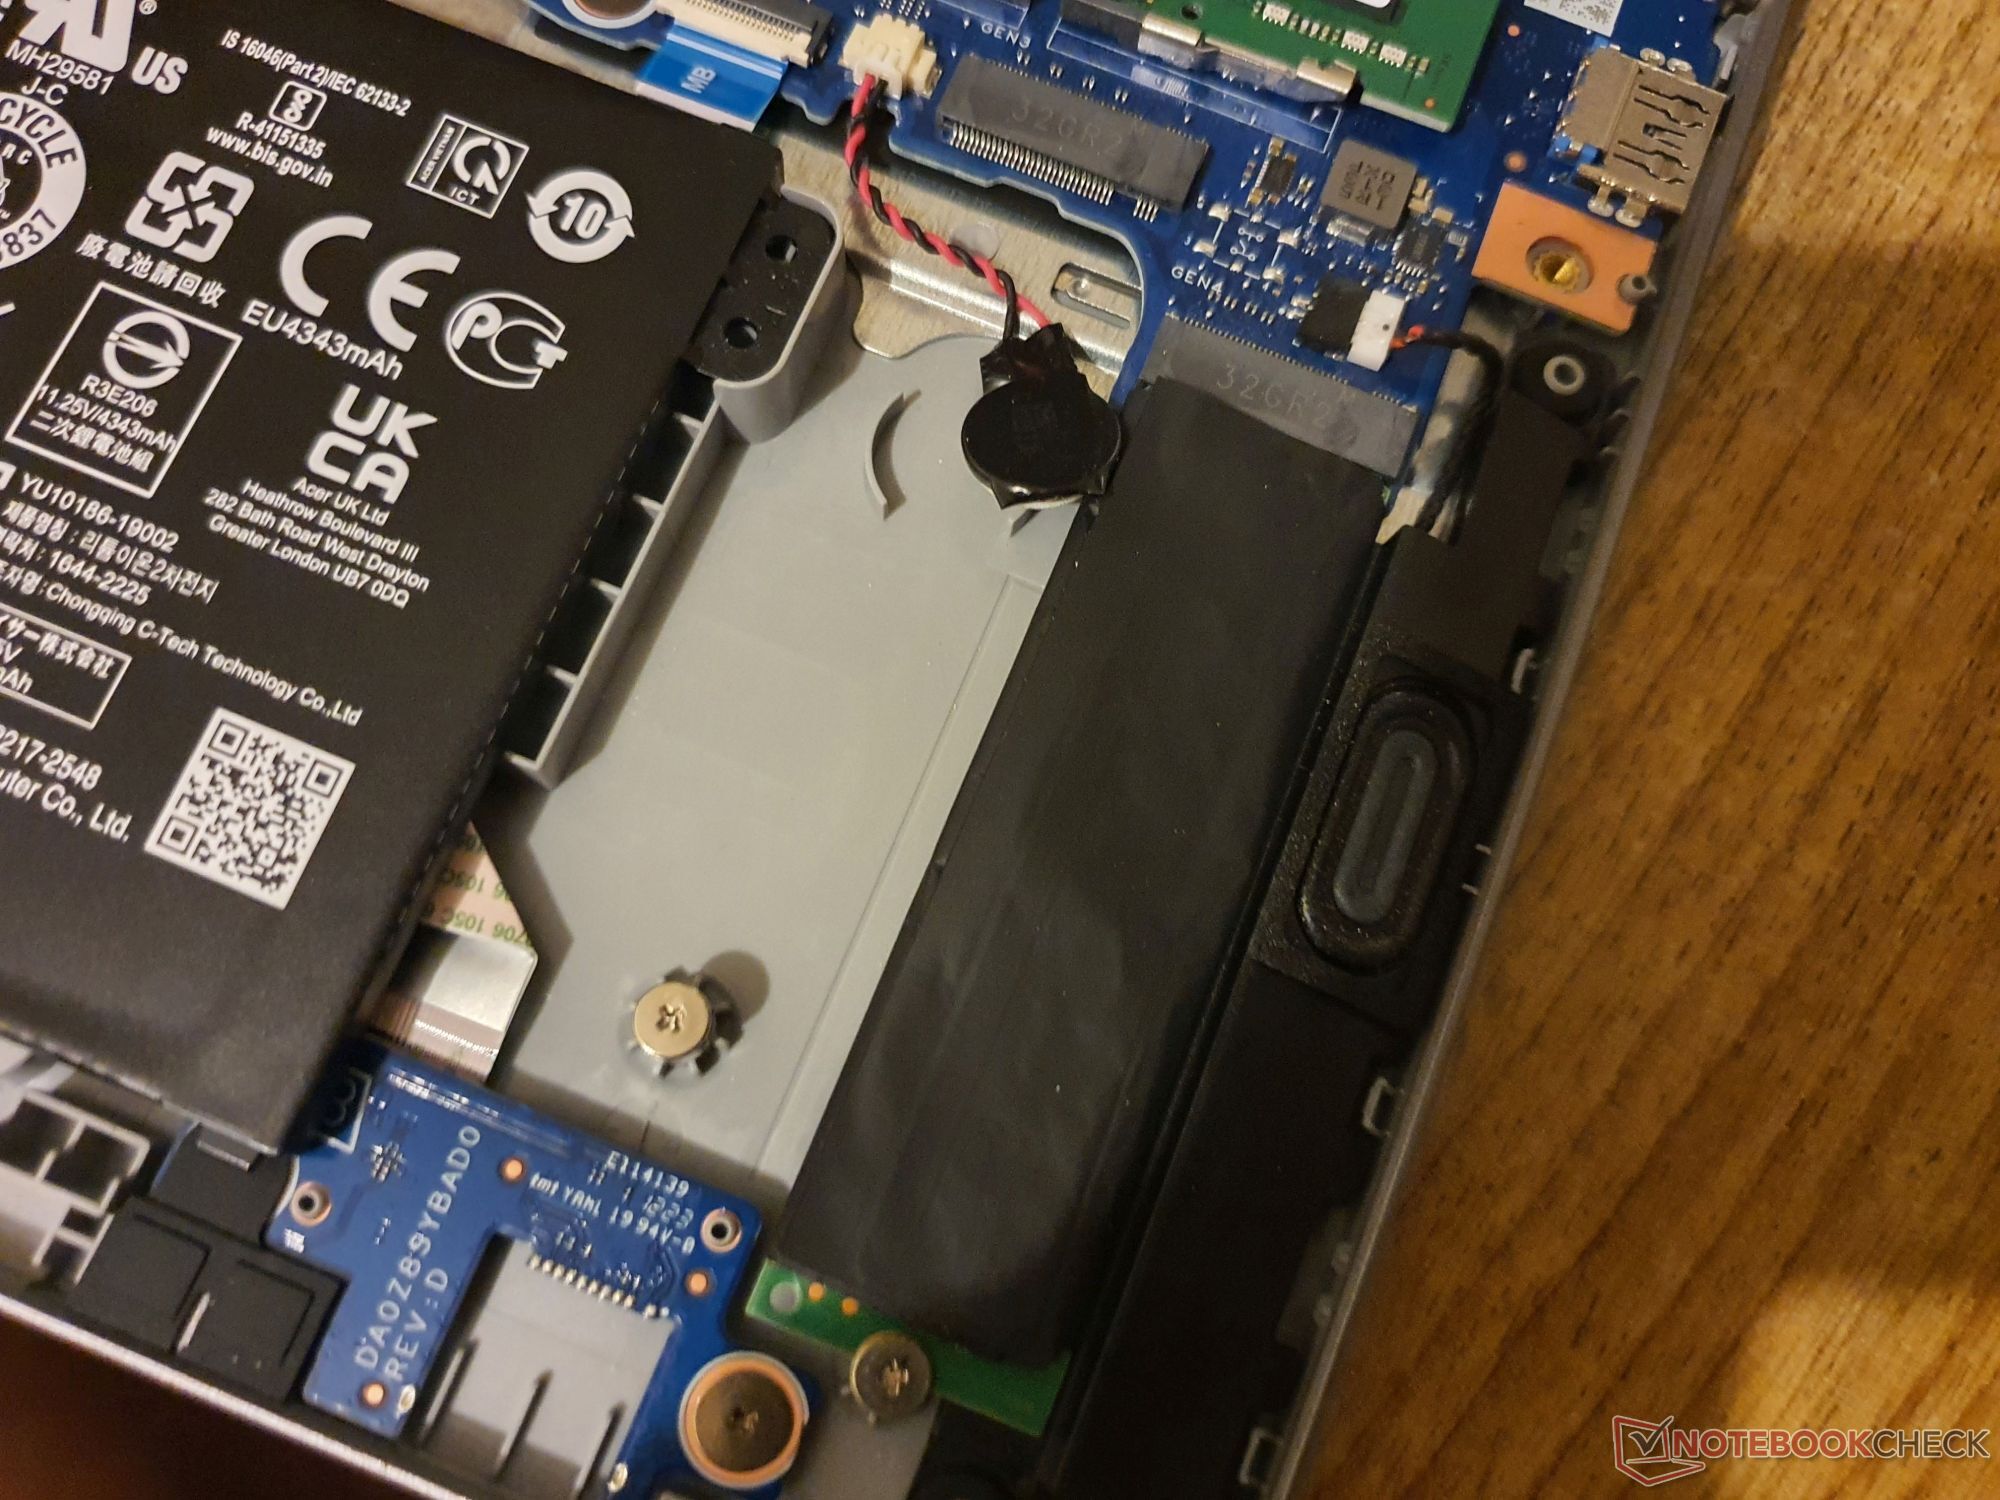
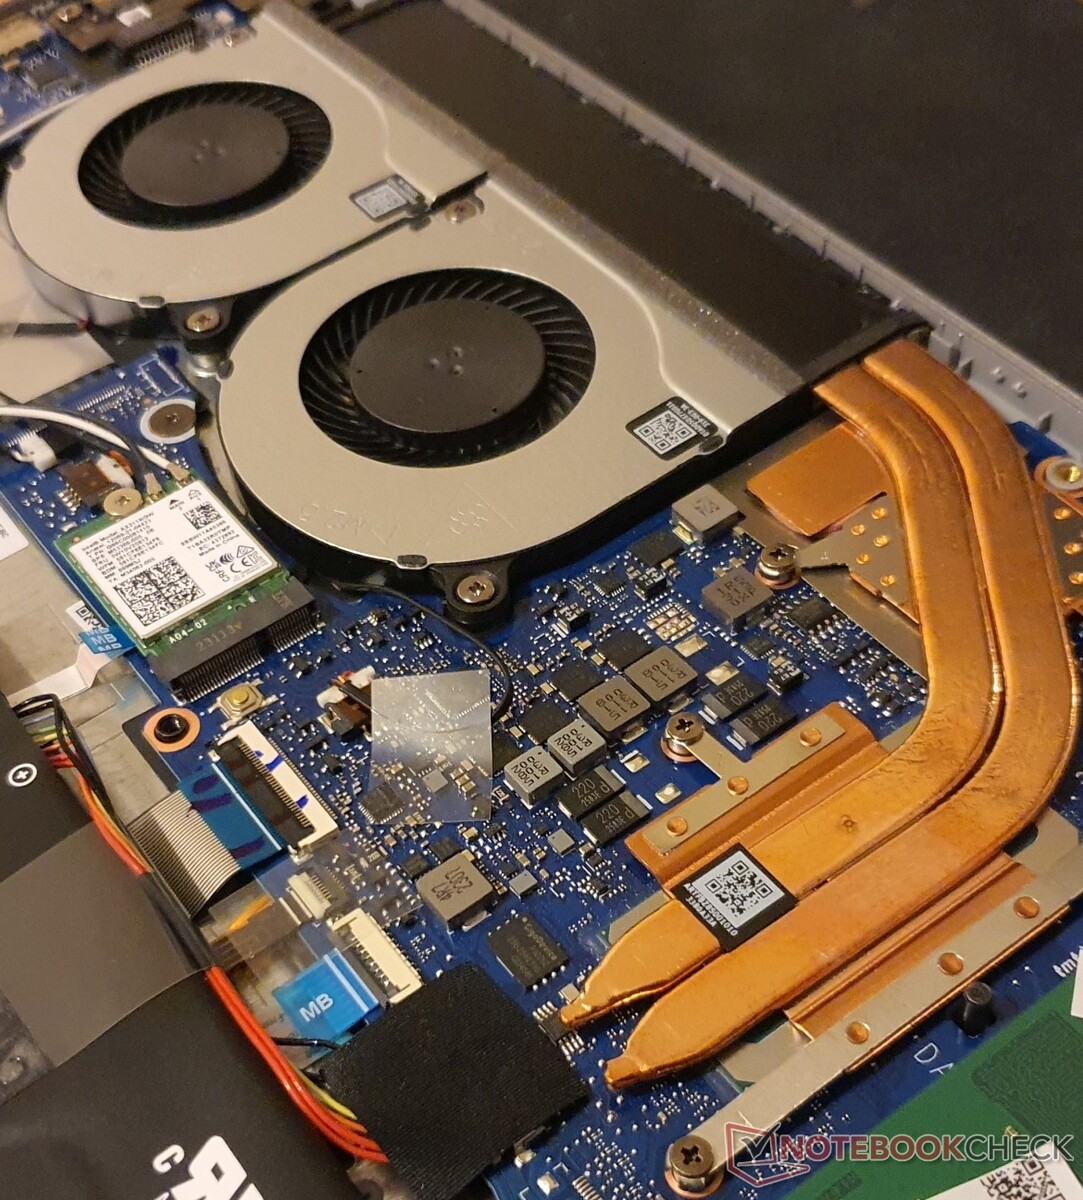
Mantenimiento
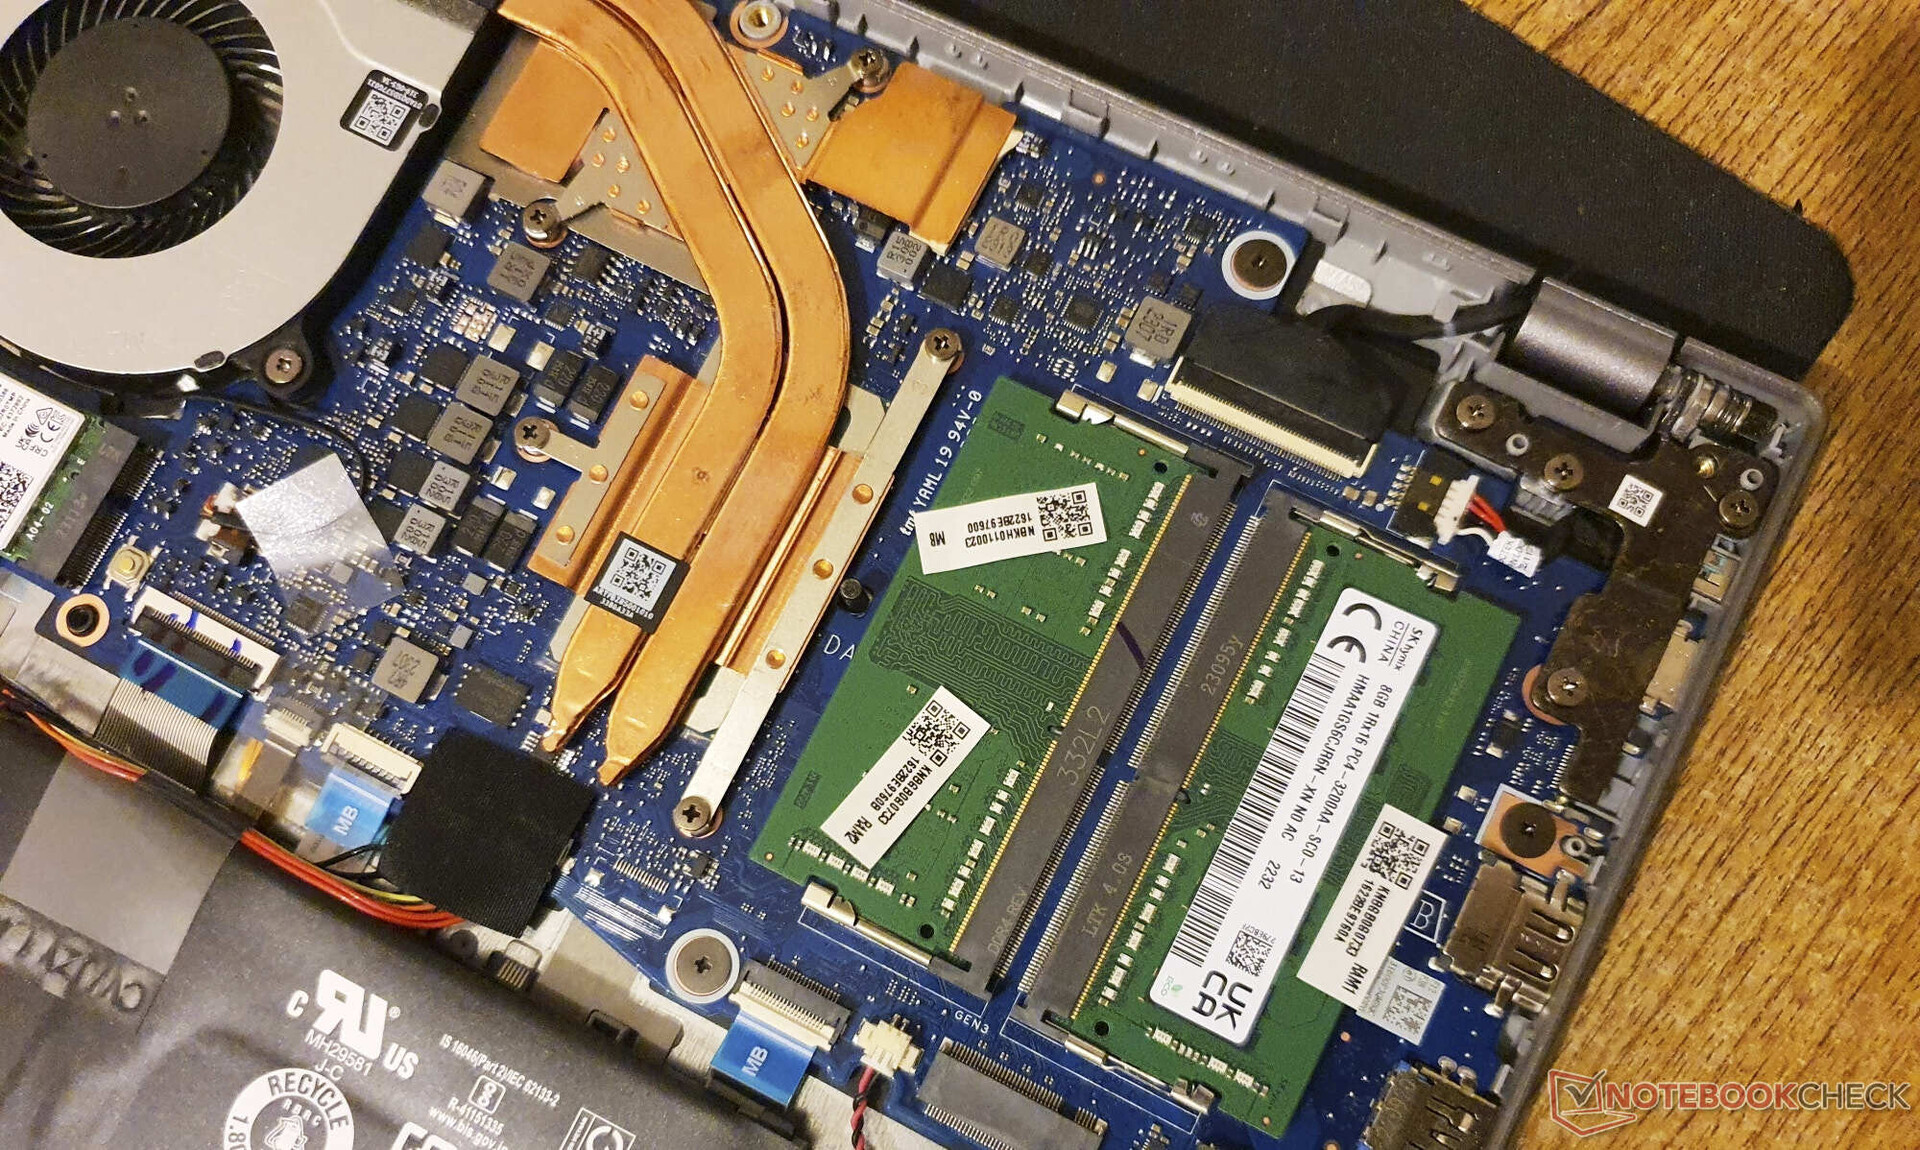
Después de quitar 10 tornillos en cruz, sólo tienes que utilizar una tarjeta de plástico o una herramienta spudger para quitar la tapa. Dentro, puedes encontrar dos bancos de RAM, dos ranuras M.2 2280, el módulo WLAN intercambiable así como la batería atornillada. También puedes desmontar el sistema de refrigeración con bastante facilidad en caso de que necesites realizar tareas de mantenimiento en él.
Garantía
Acer ofrece al Aspire 5 una garantía limitada de un año en Estados Unidos. Existen opciones para ampliarla, que se pueden consultar en el sitio web de Acer https://www.acer.com/us-en/support/warranty/limited-warranty.
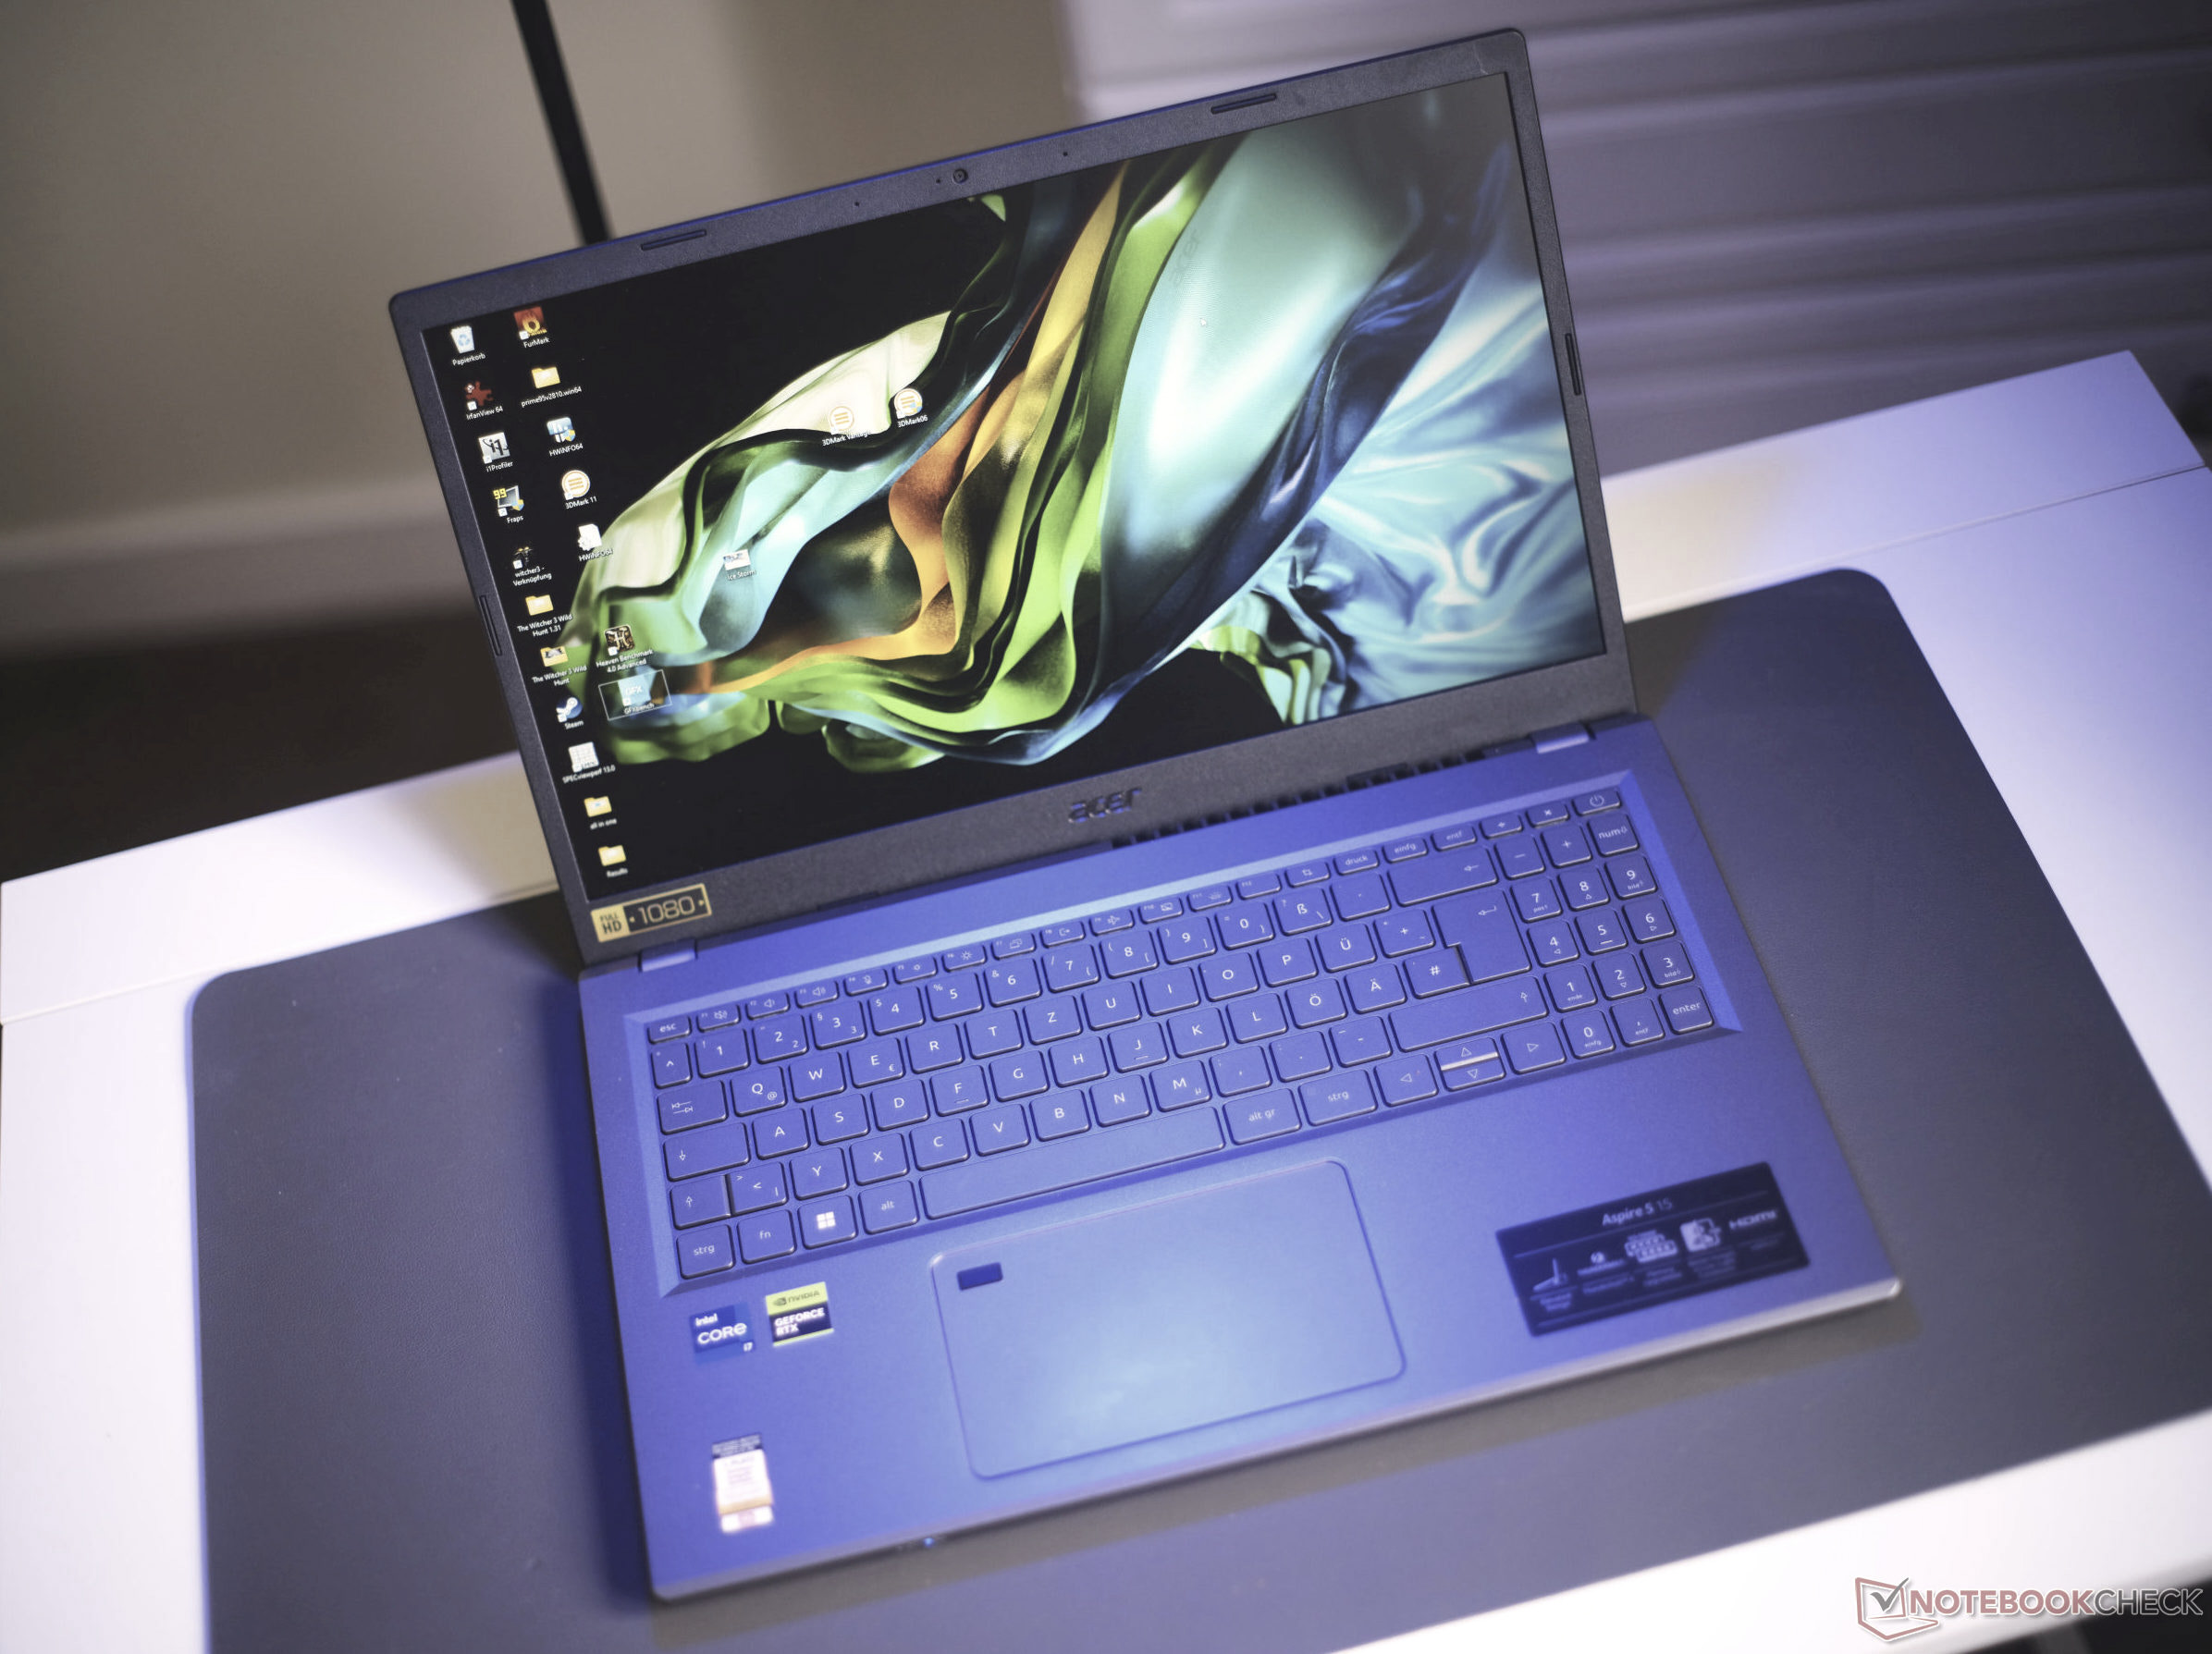
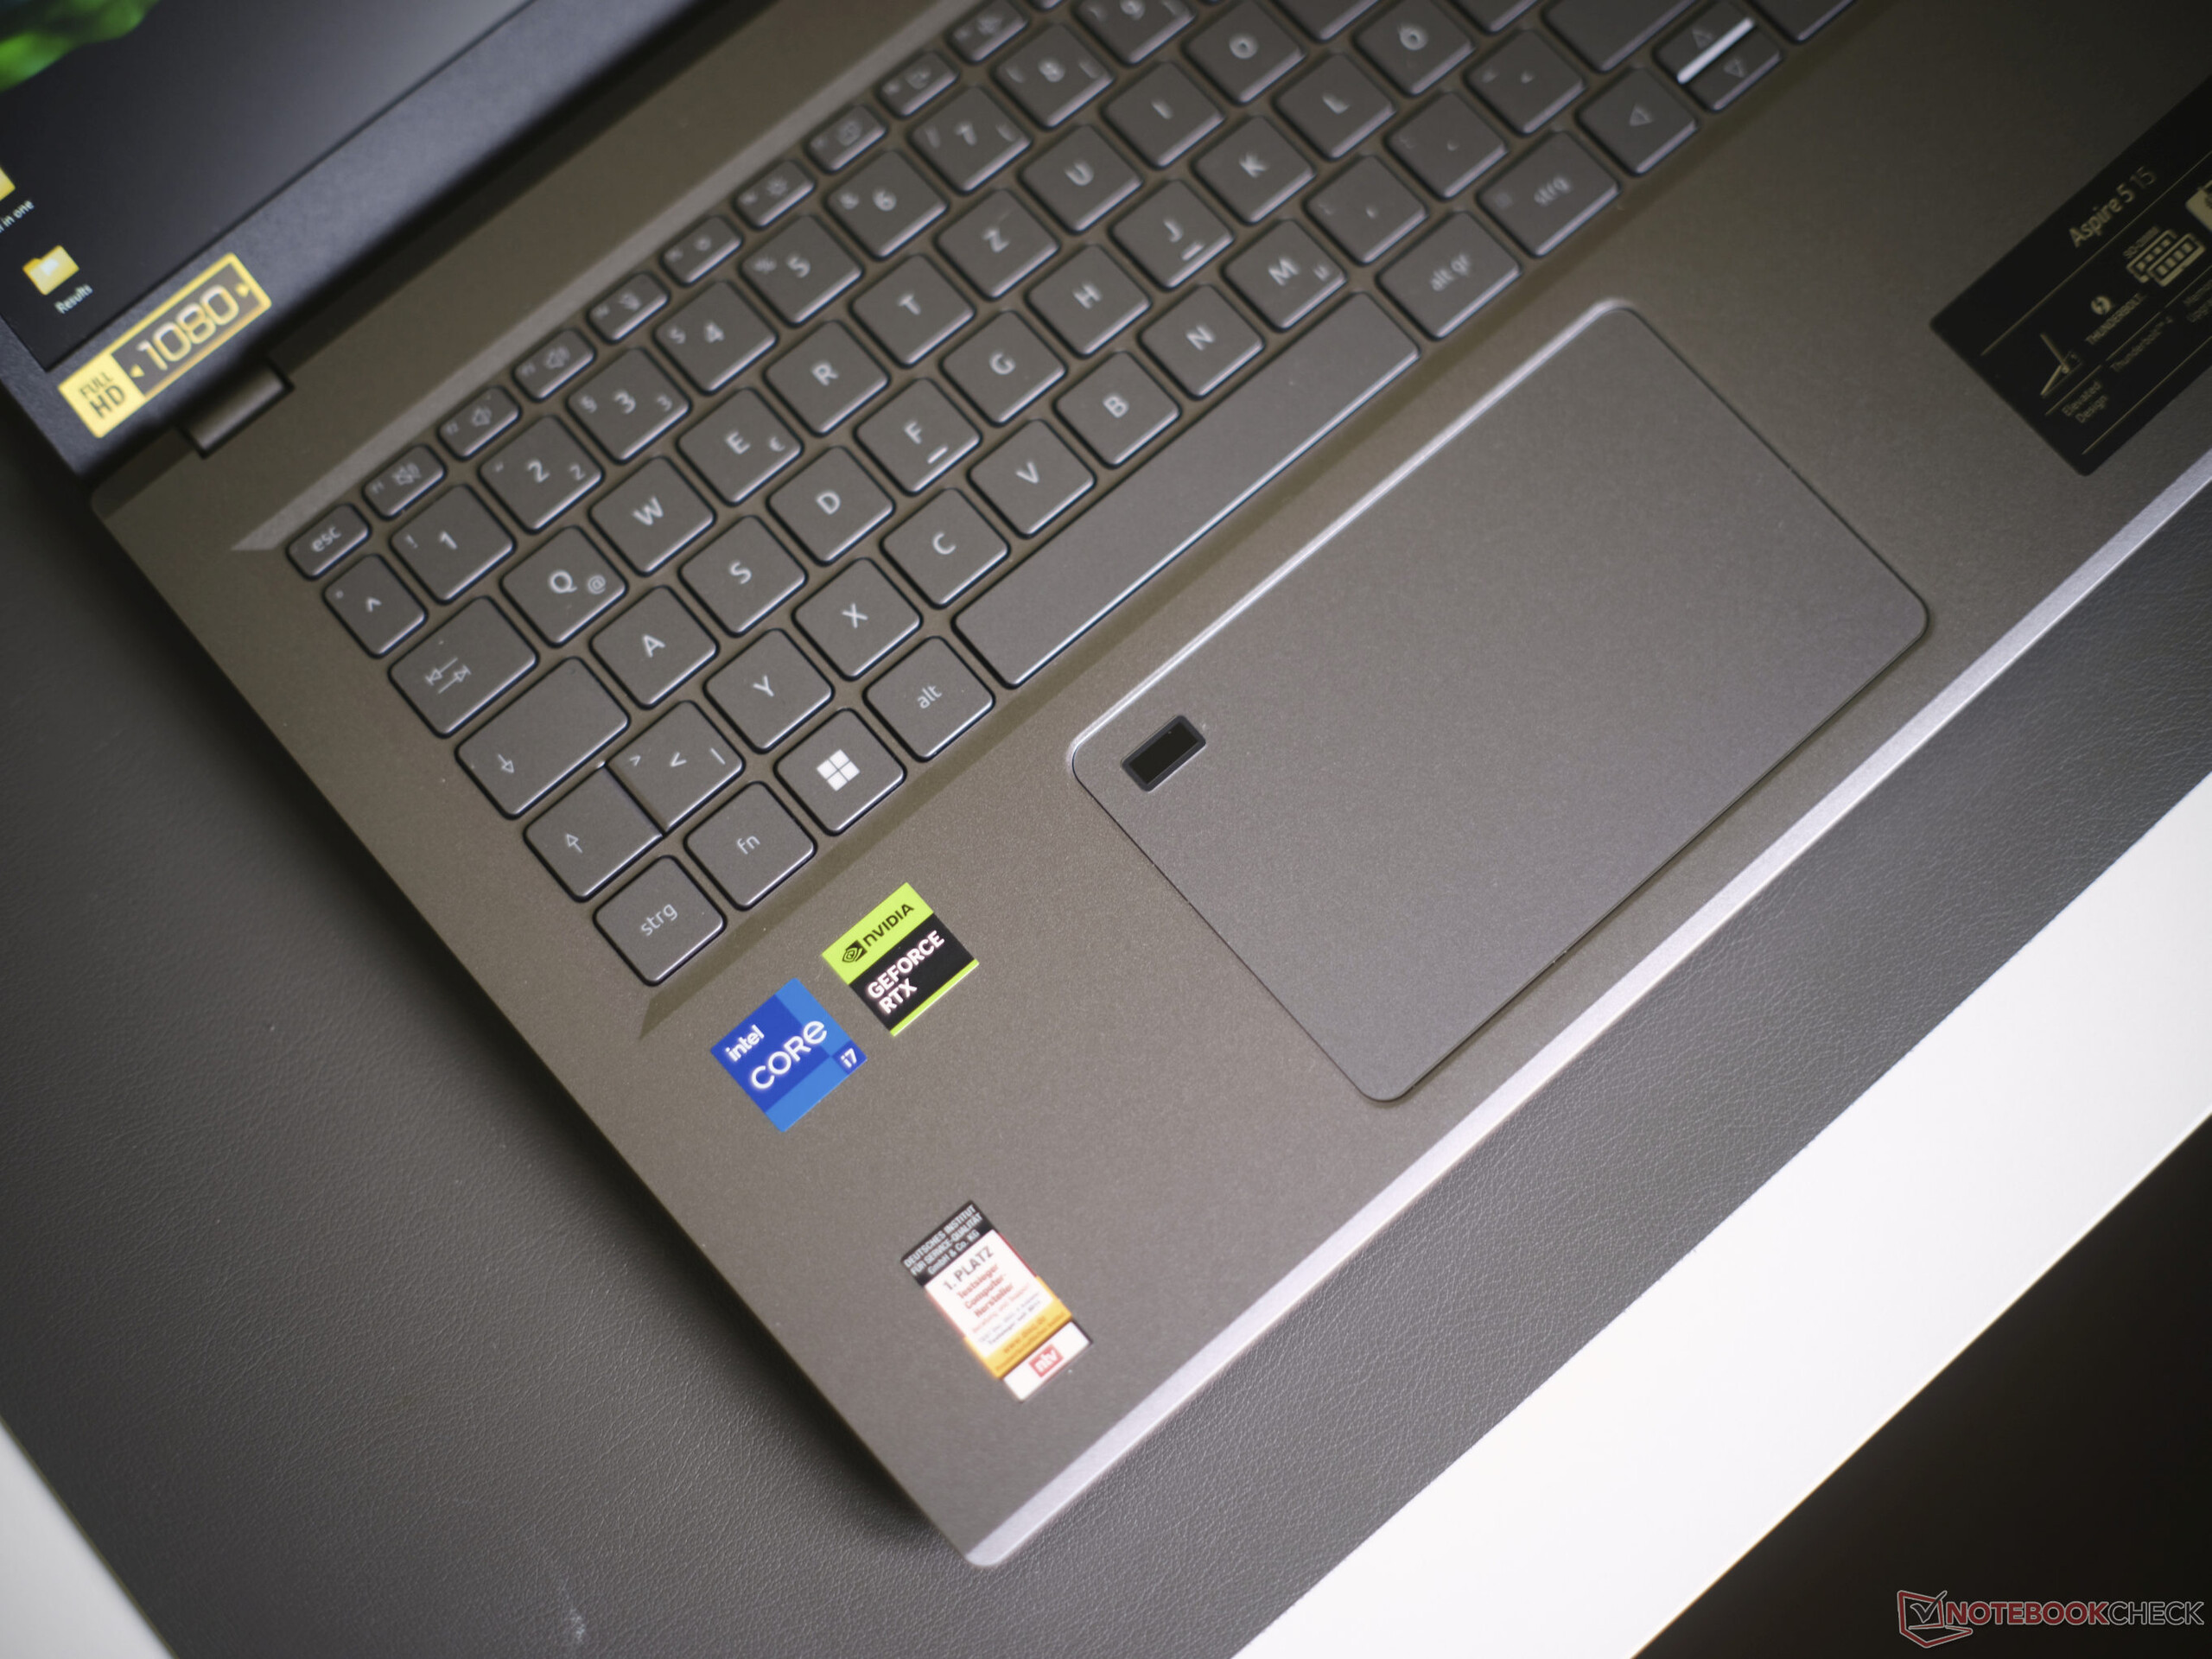
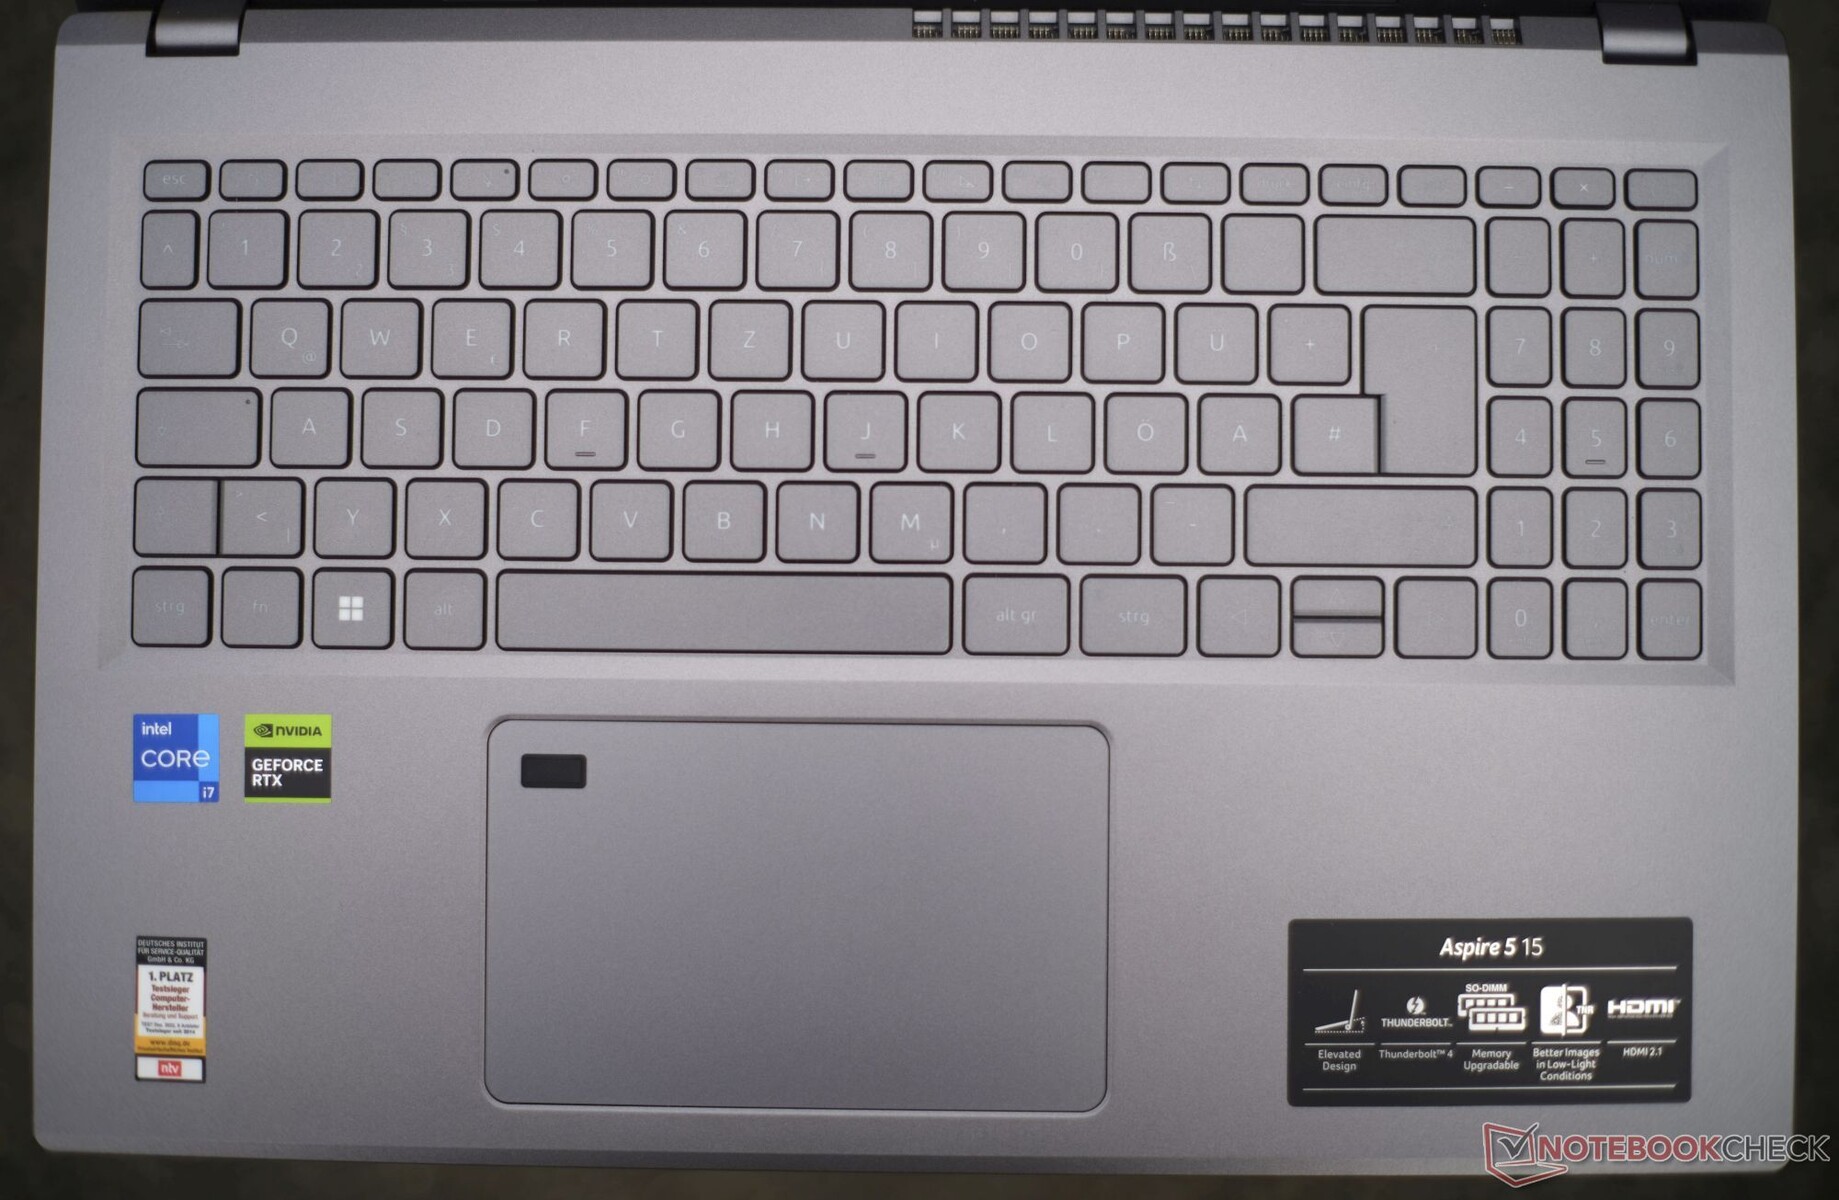
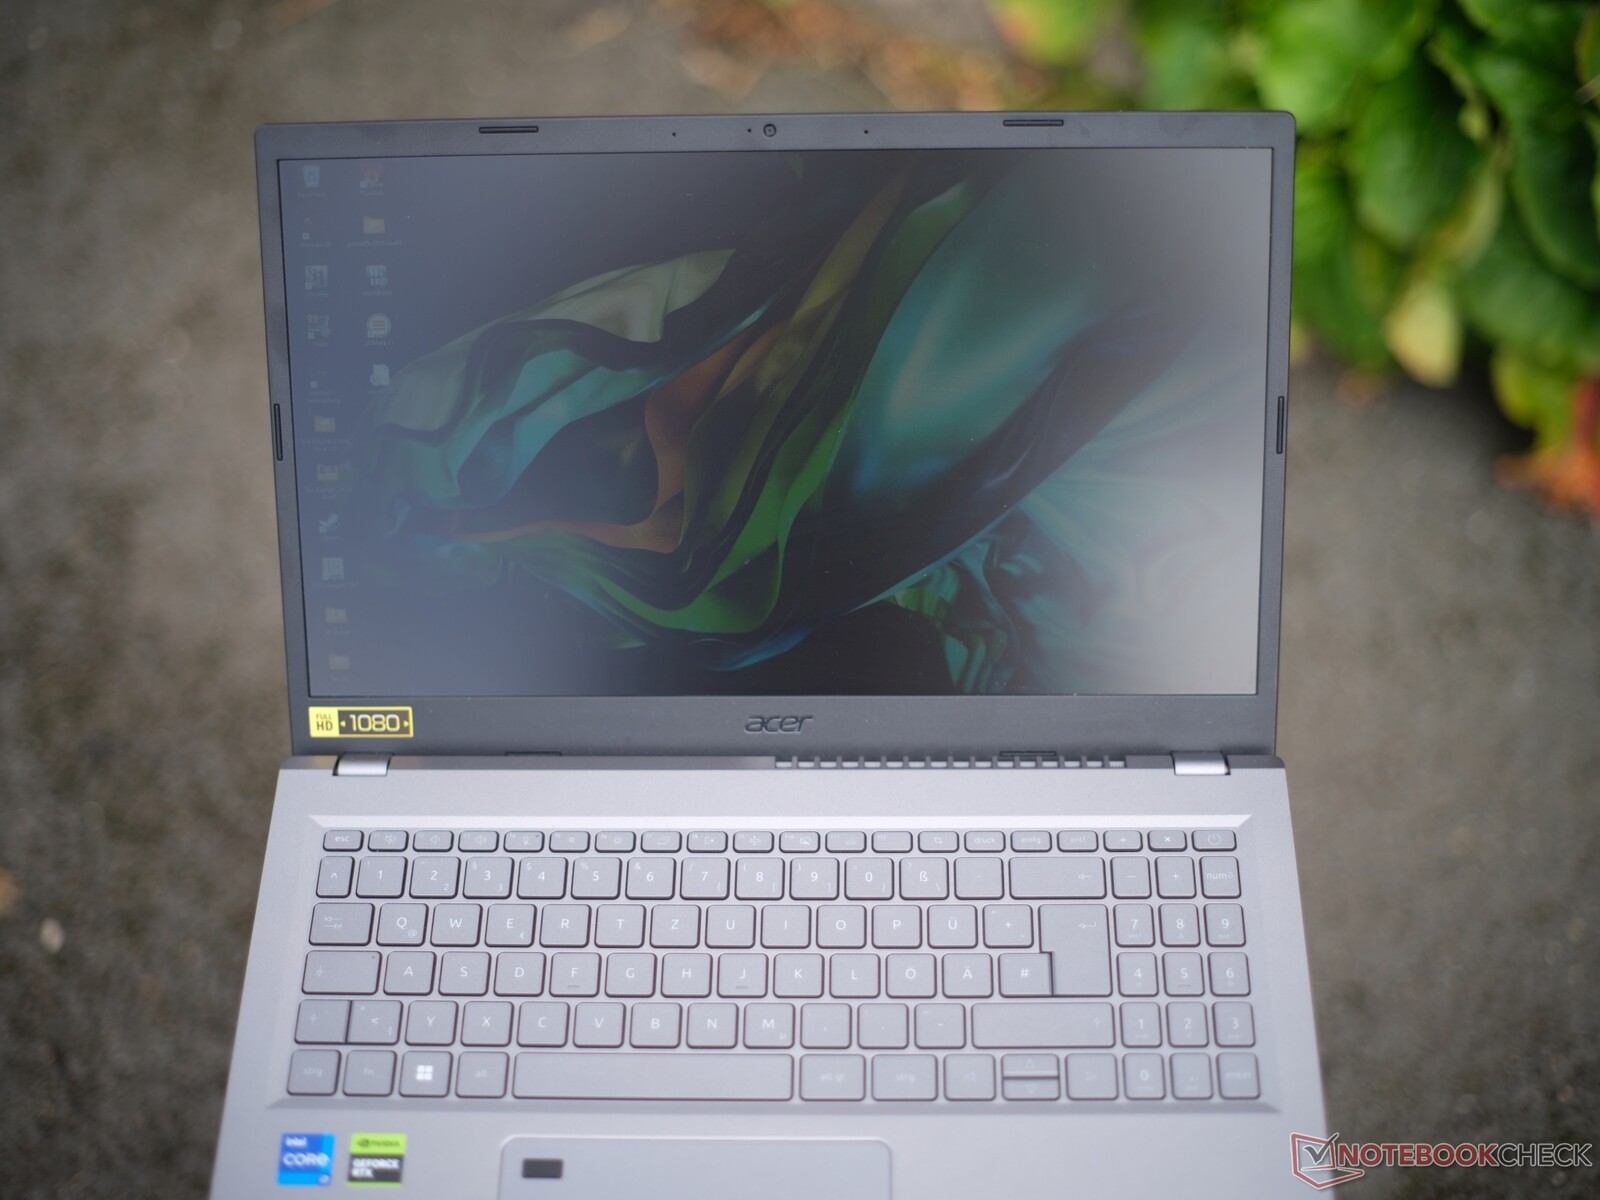
Dispositivos de entrada: El cómodo teclado Acer, con buena iluminación
Teclado
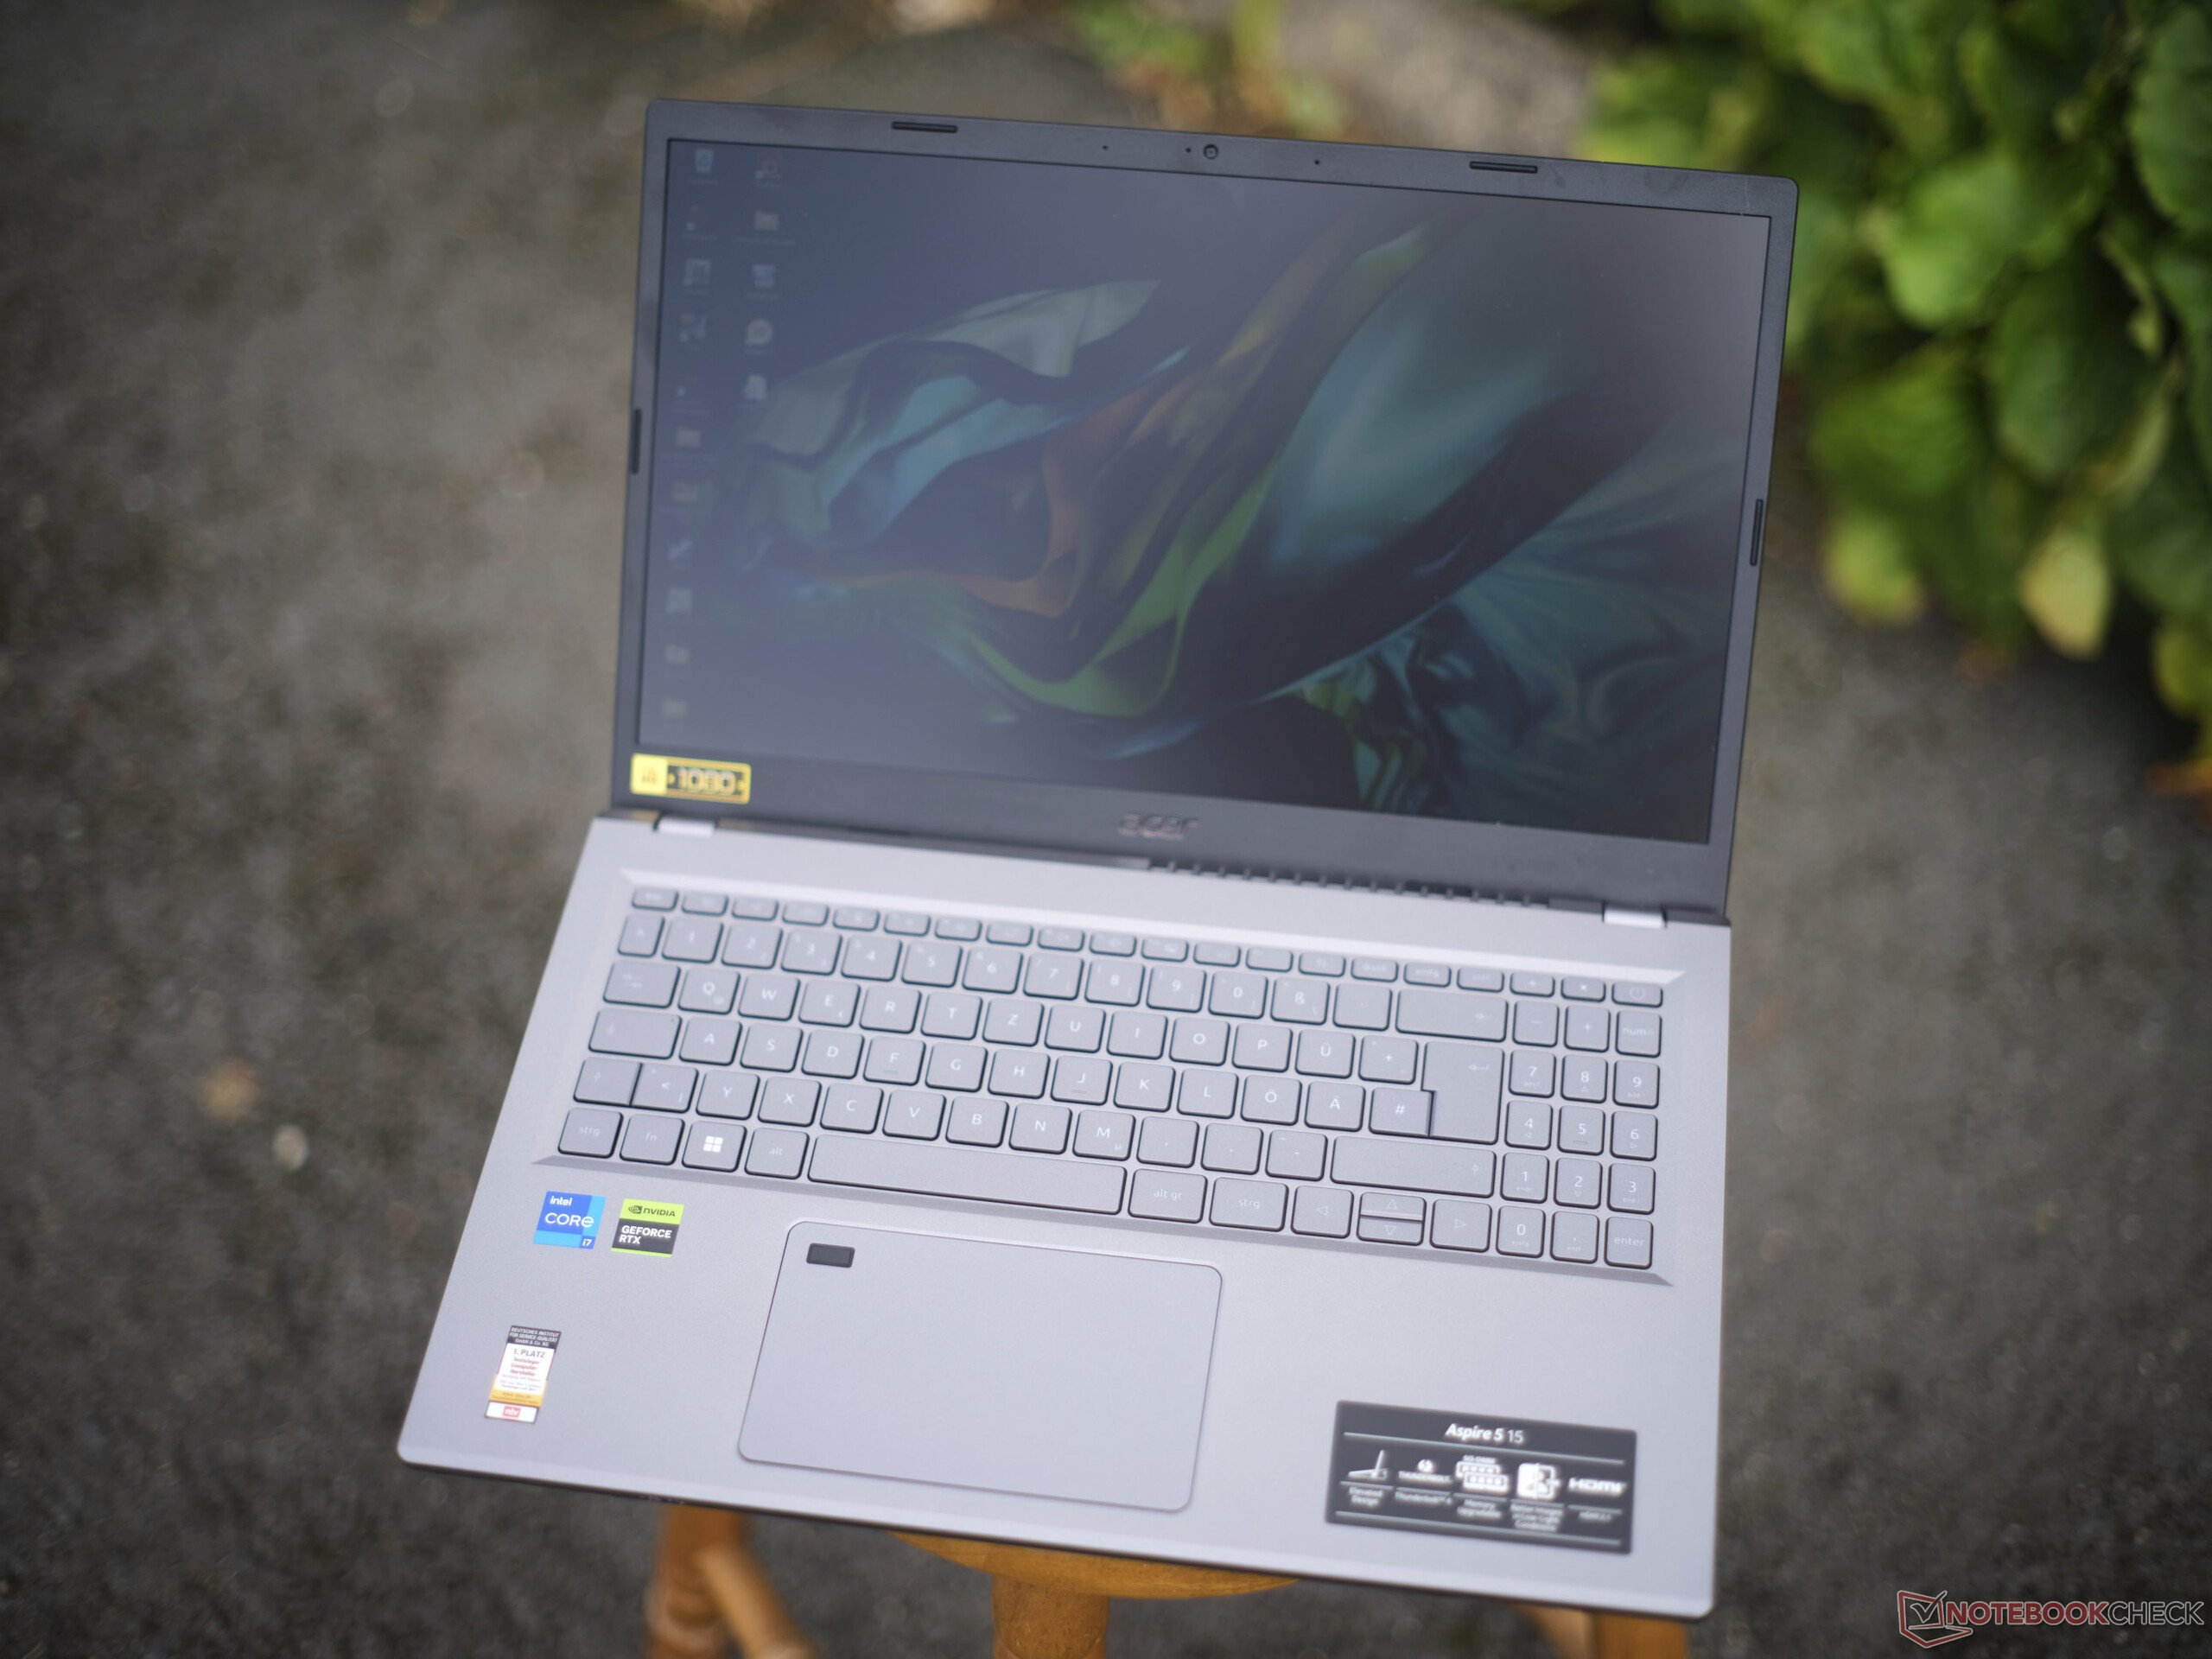
Escribir en el Acer Aspire 5 resulta muy cómodo, aunque elIdeaPad 5 tiene un punto de presión ligeramente más agradable pero menos elevación (1,3 mm frente a 1,4 mm). El centro del teclado se puede presionar con suficiente presión, pero al escribir, esto no parece ser un problema. El contraste entre el gris claro de las etiquetas y el gris medio de las teclas parece ser más problemático, sobre todo si hay mucha luz ambiente (ver comparación de imágenes más abajo).
La disposición del teclado es buena, aparte de la tecla de flecha vertical reducida a la mitad, el bloque numérico aplastado y las habituales teclas de doble asignación. La retroiluminación del teclado sólo tiene un nivel de brillo. Si tecleas mucho, entonces puede que te guste más el portátil para juegos Lenovo LOQ 15, que tiene una elevación de 1,5 mm y una mejor distribución - la serie Envy de HP
también tiene buenos teclados.<br>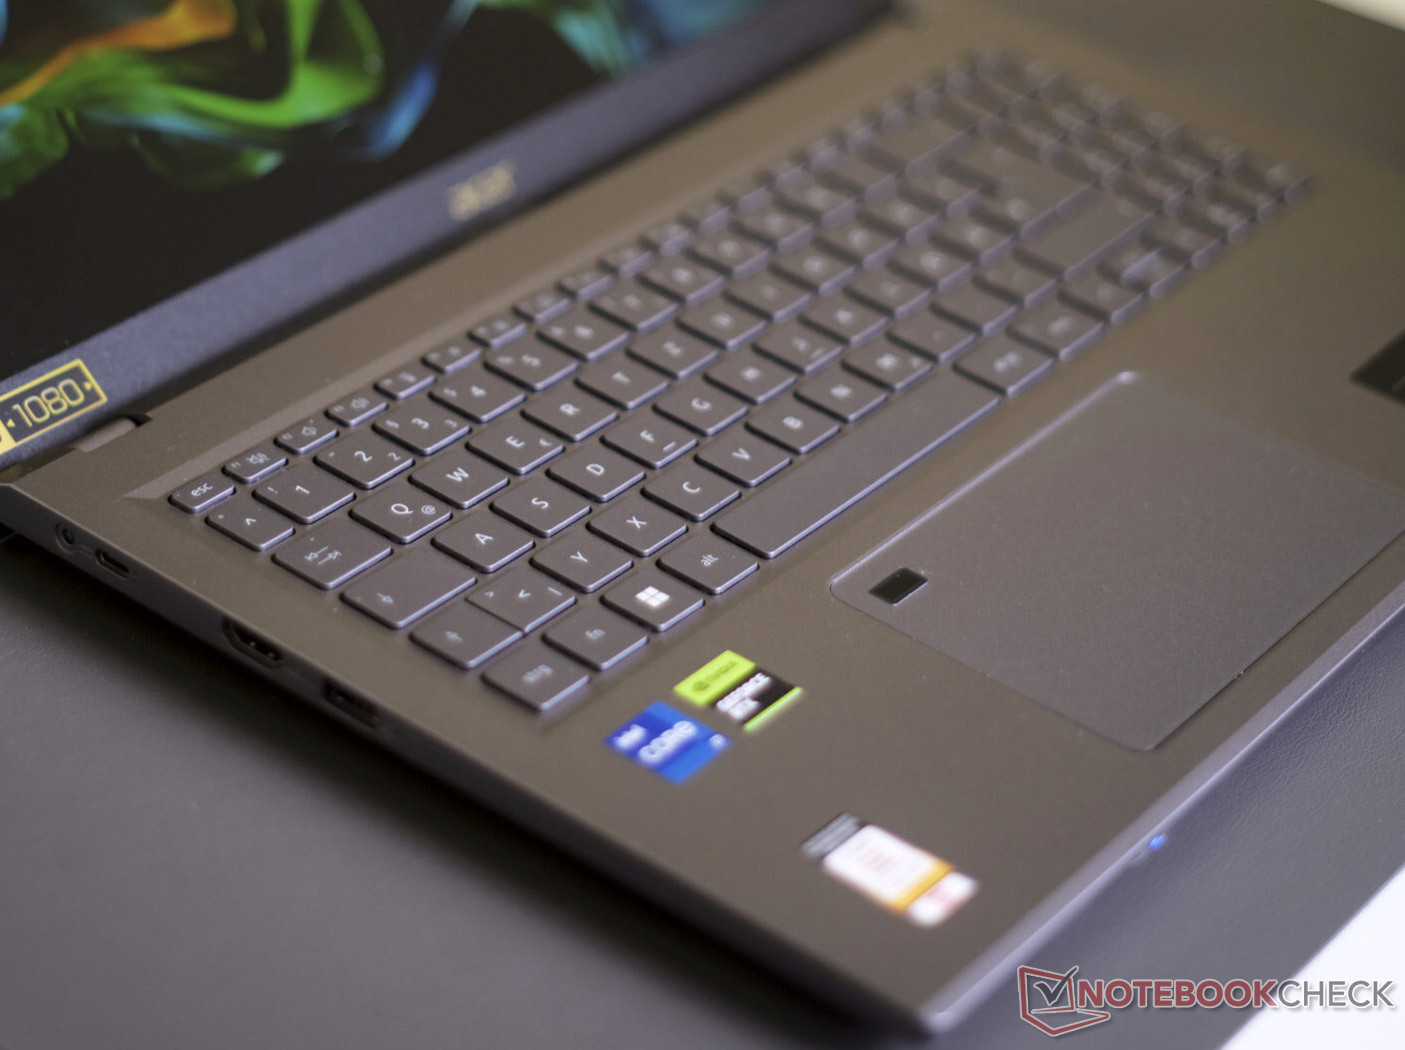
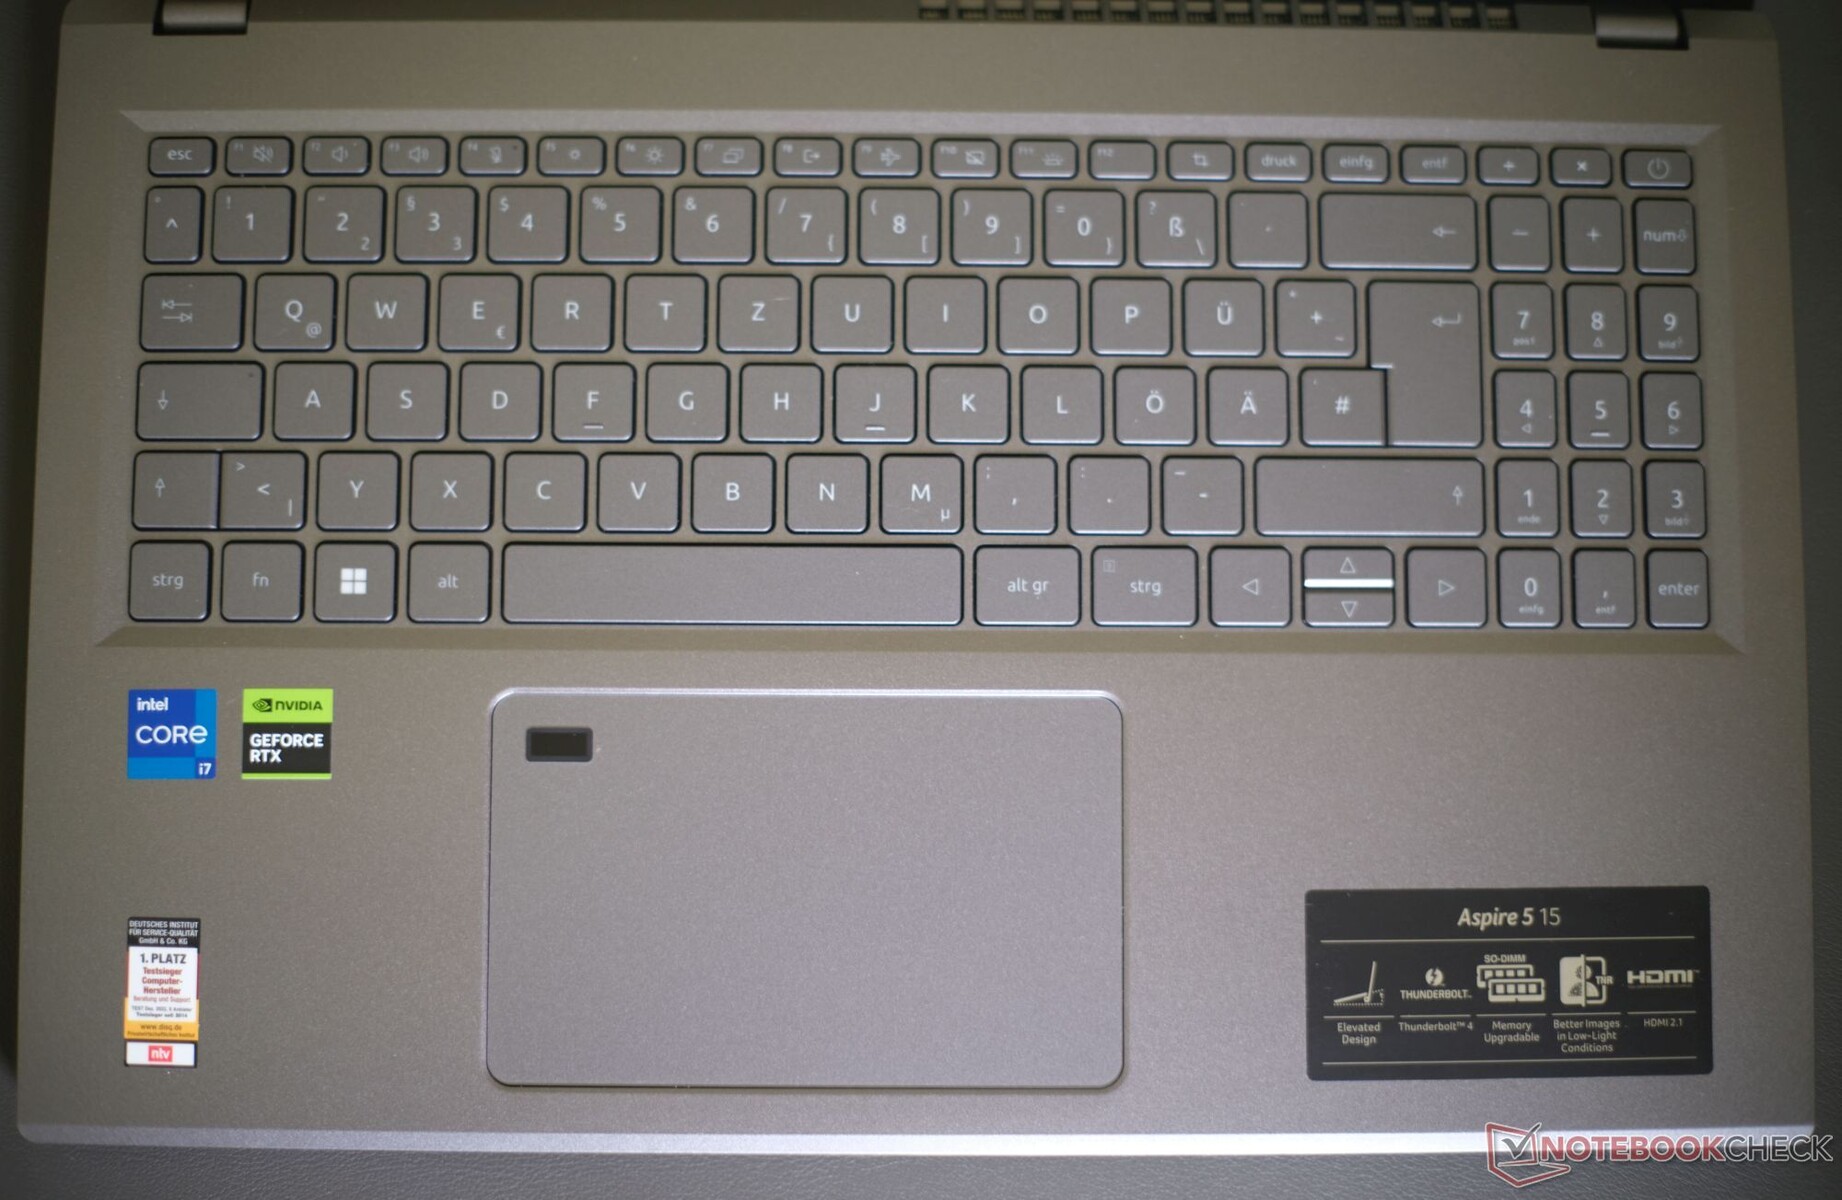
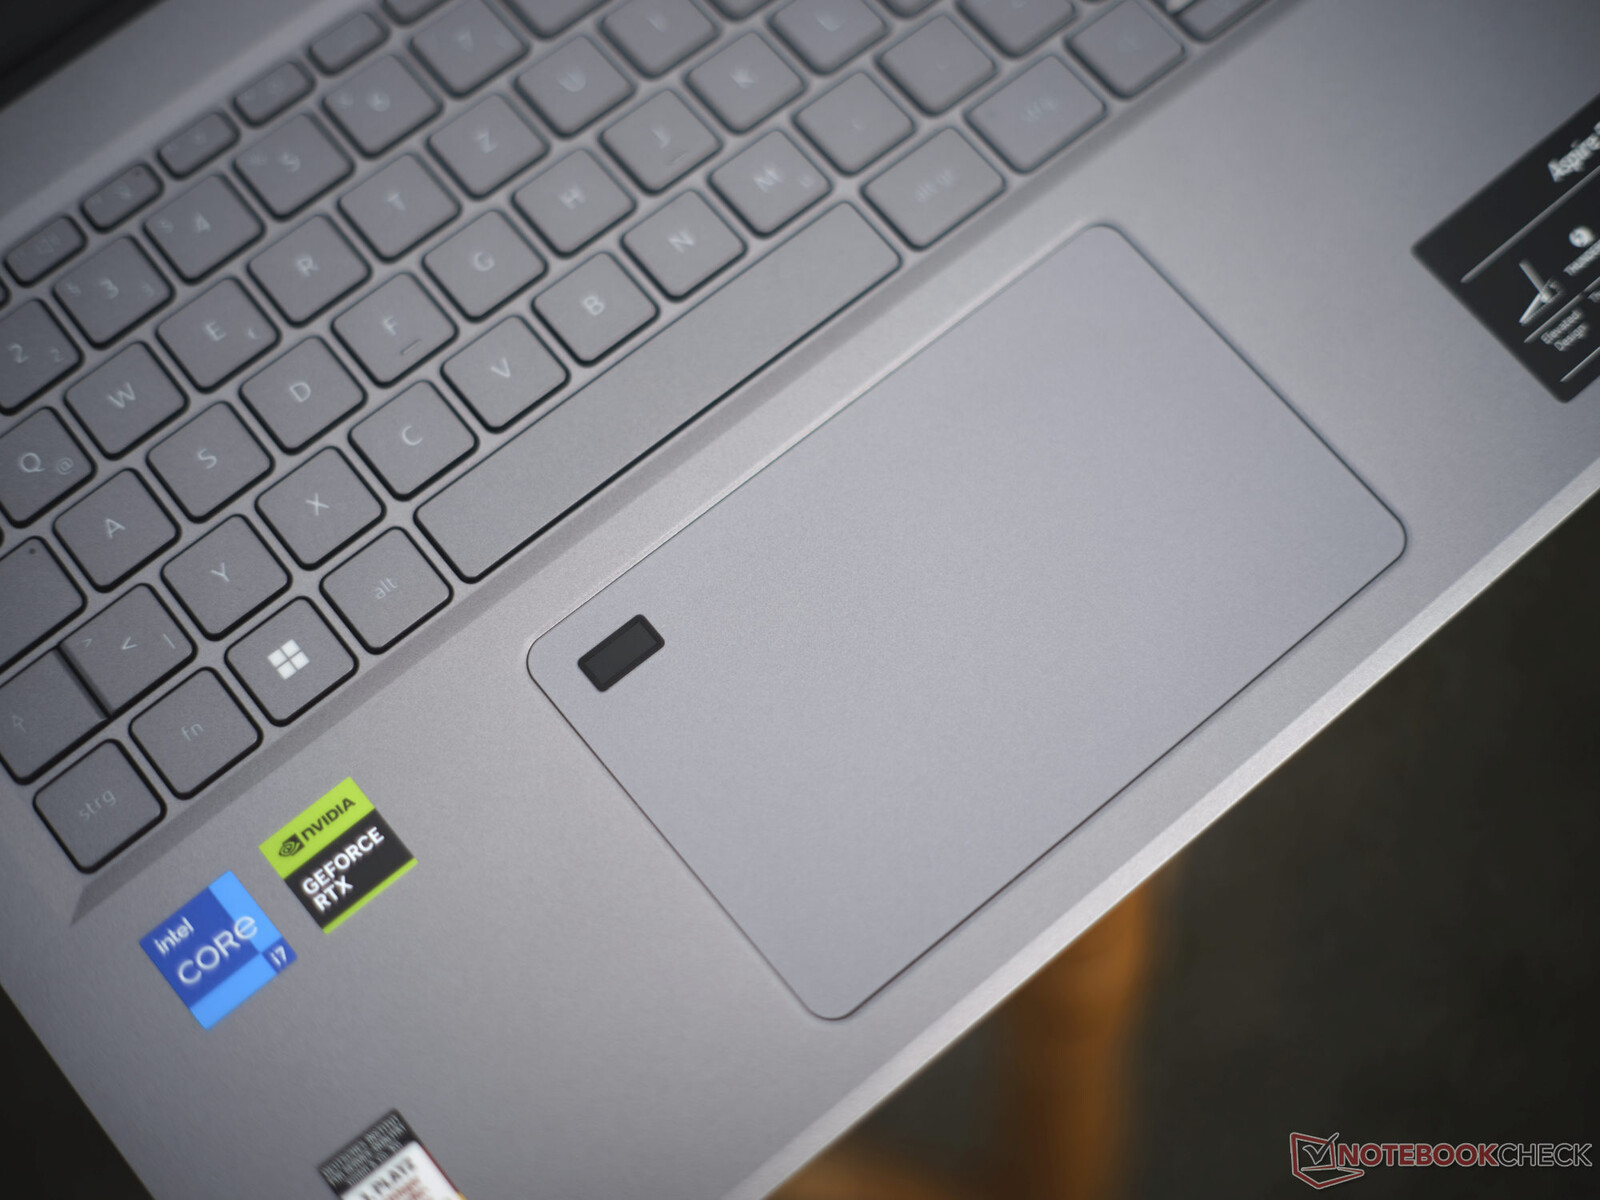
Panel táctil
Su touchpad también es mejor que el de su predecesor https://www.notebookcheck.com/Test-Acer-Aspire-5-A515-57G-Laptop-Verschenktes-Potenzial.653109.0.html#toc-3: Ya no traquetea, los botones integrados son todo menos esponjosos, ofrecen suficiente elevación y su superficie es agradable y suave - aunque, su precisión no es la mejor de las mejores.
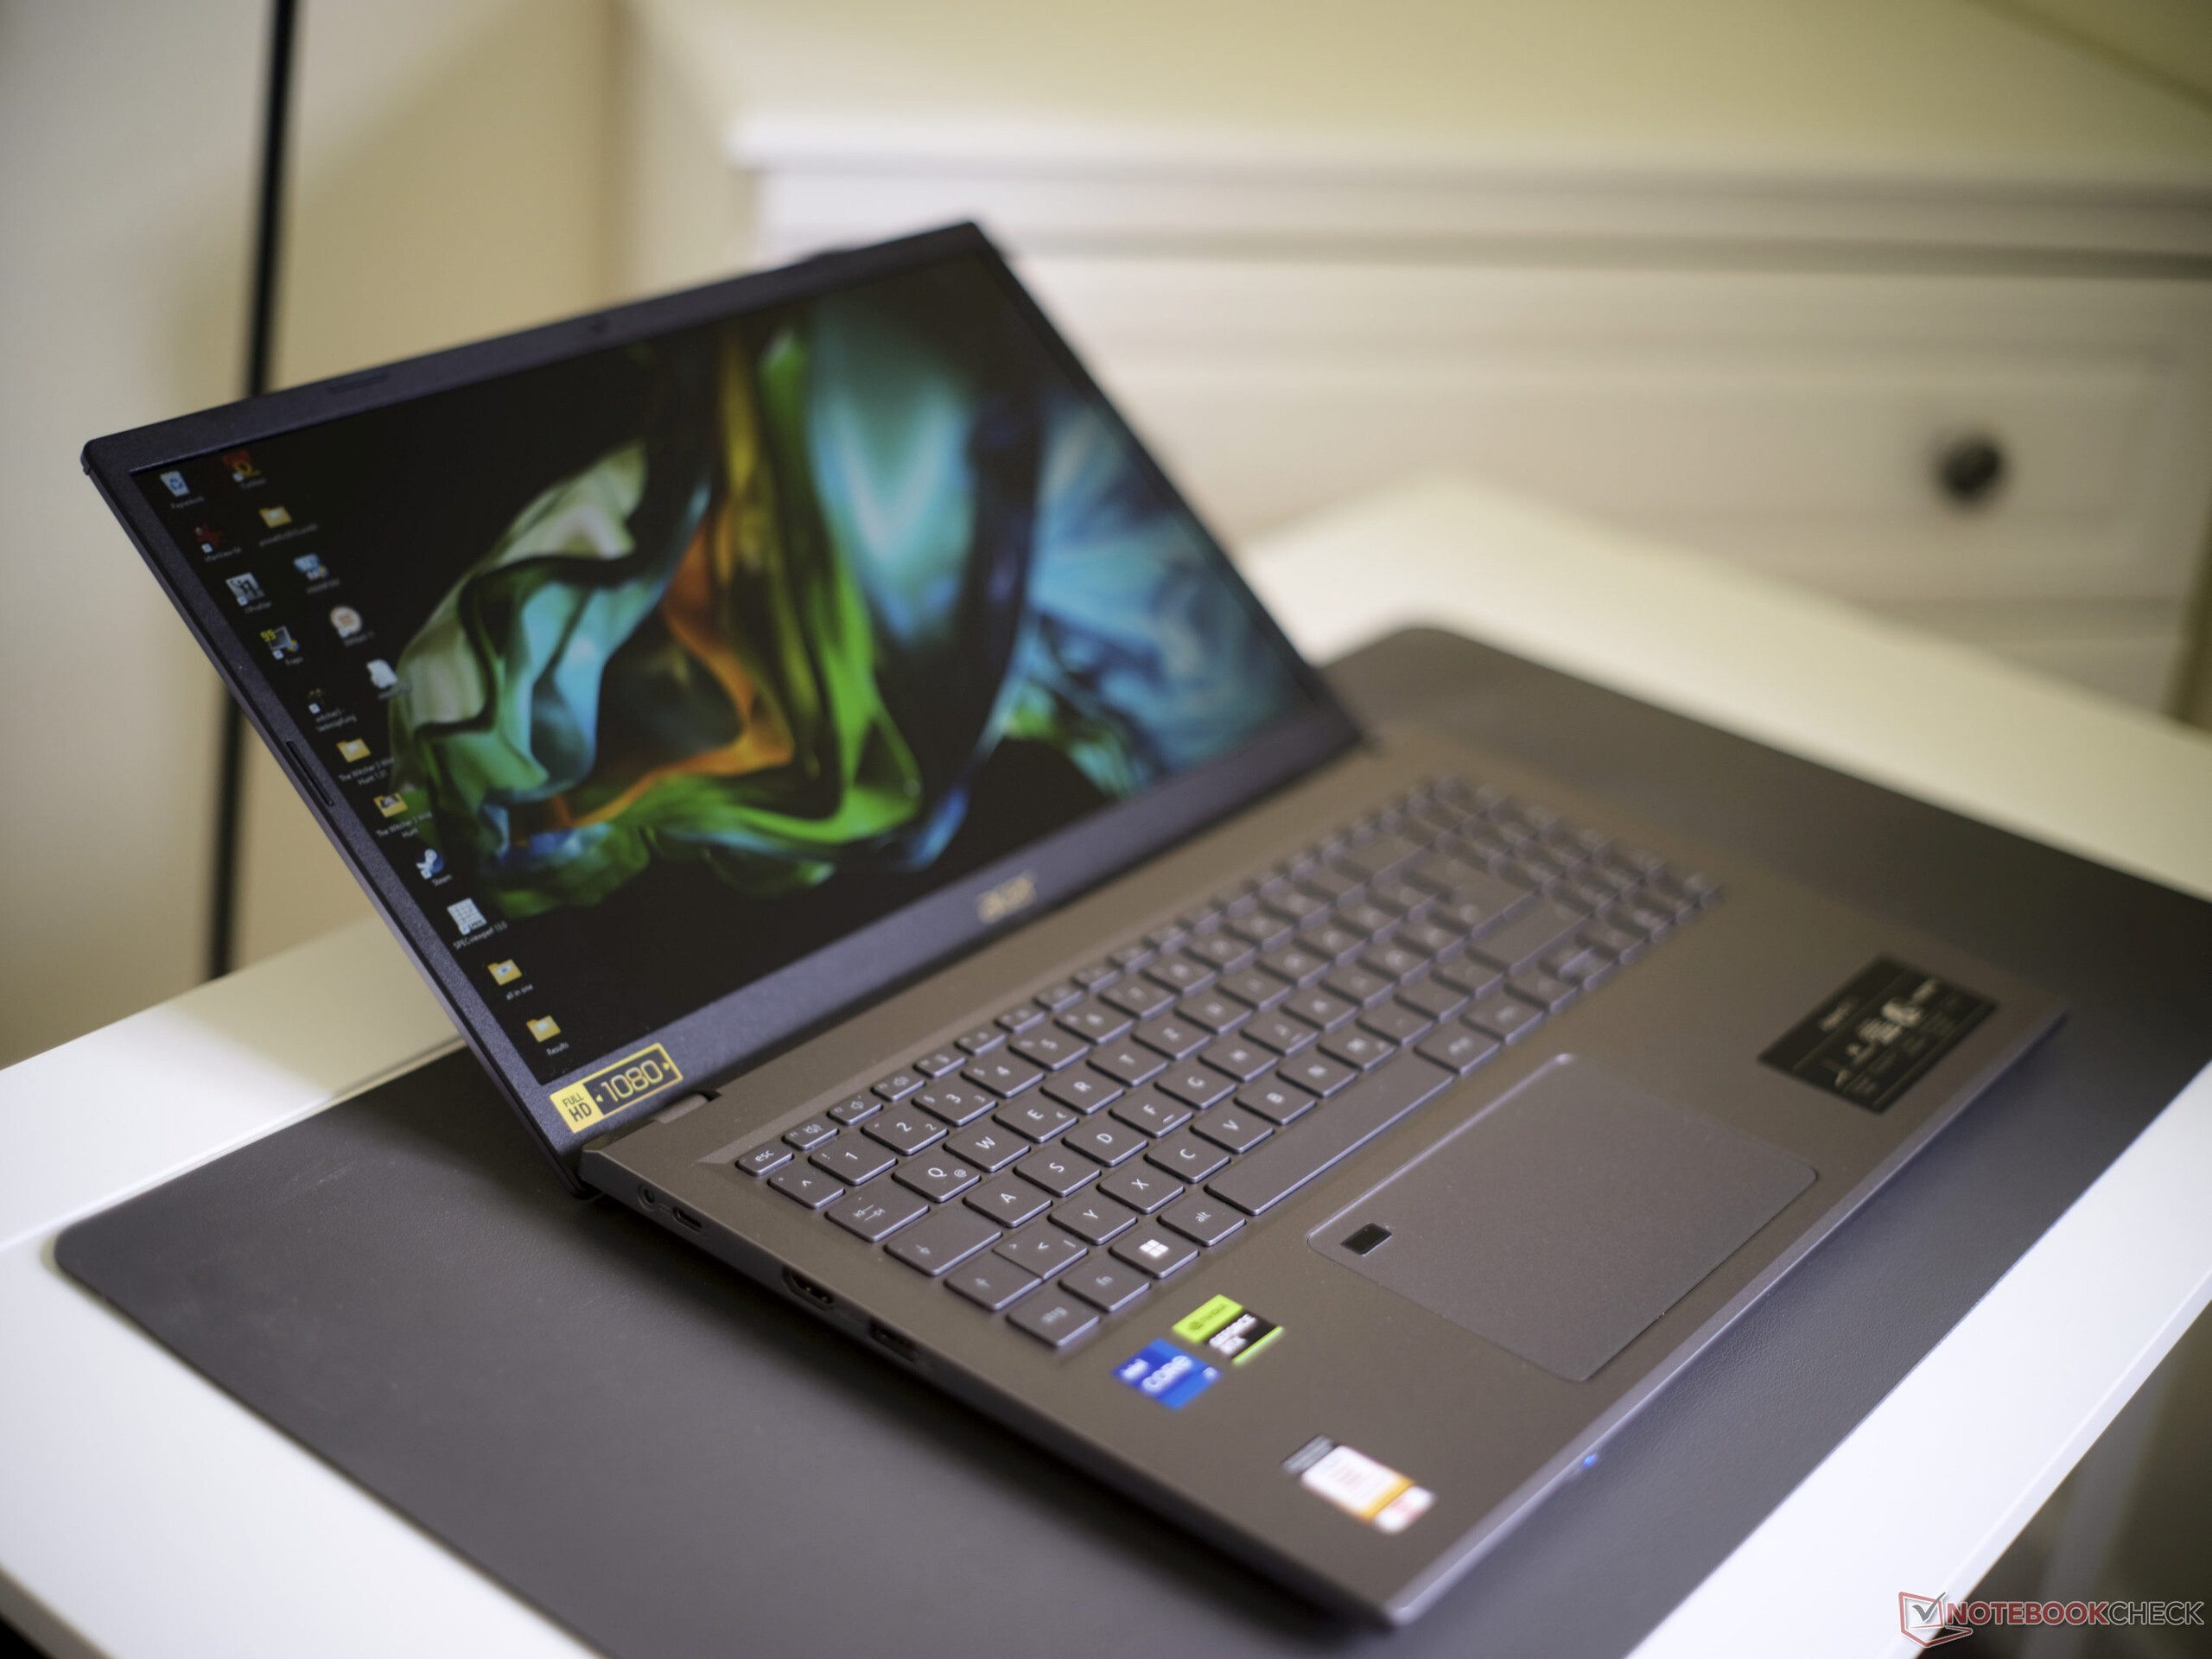
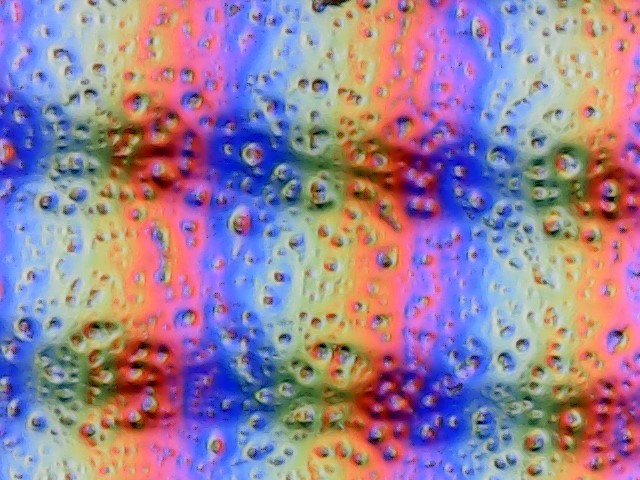
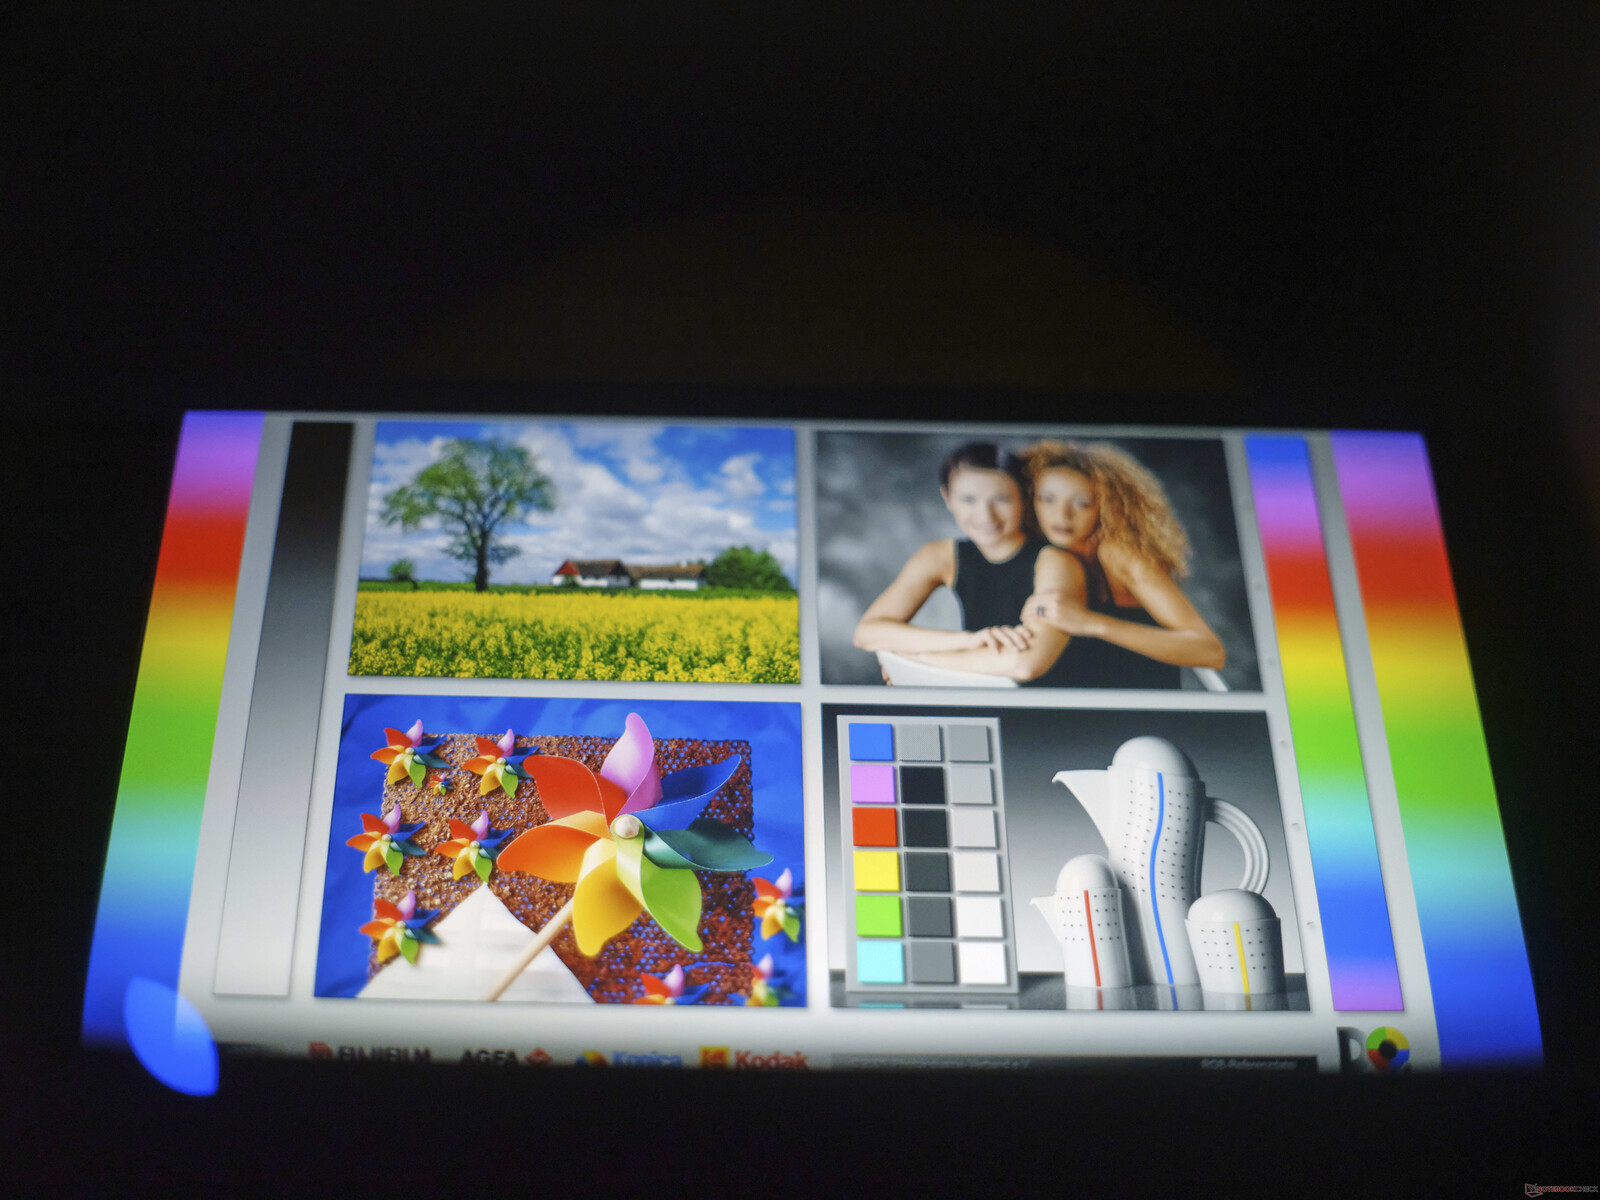
Pantalla: Al portátil de oficina de 15,6 pulgadas le gusta estar a oscuras

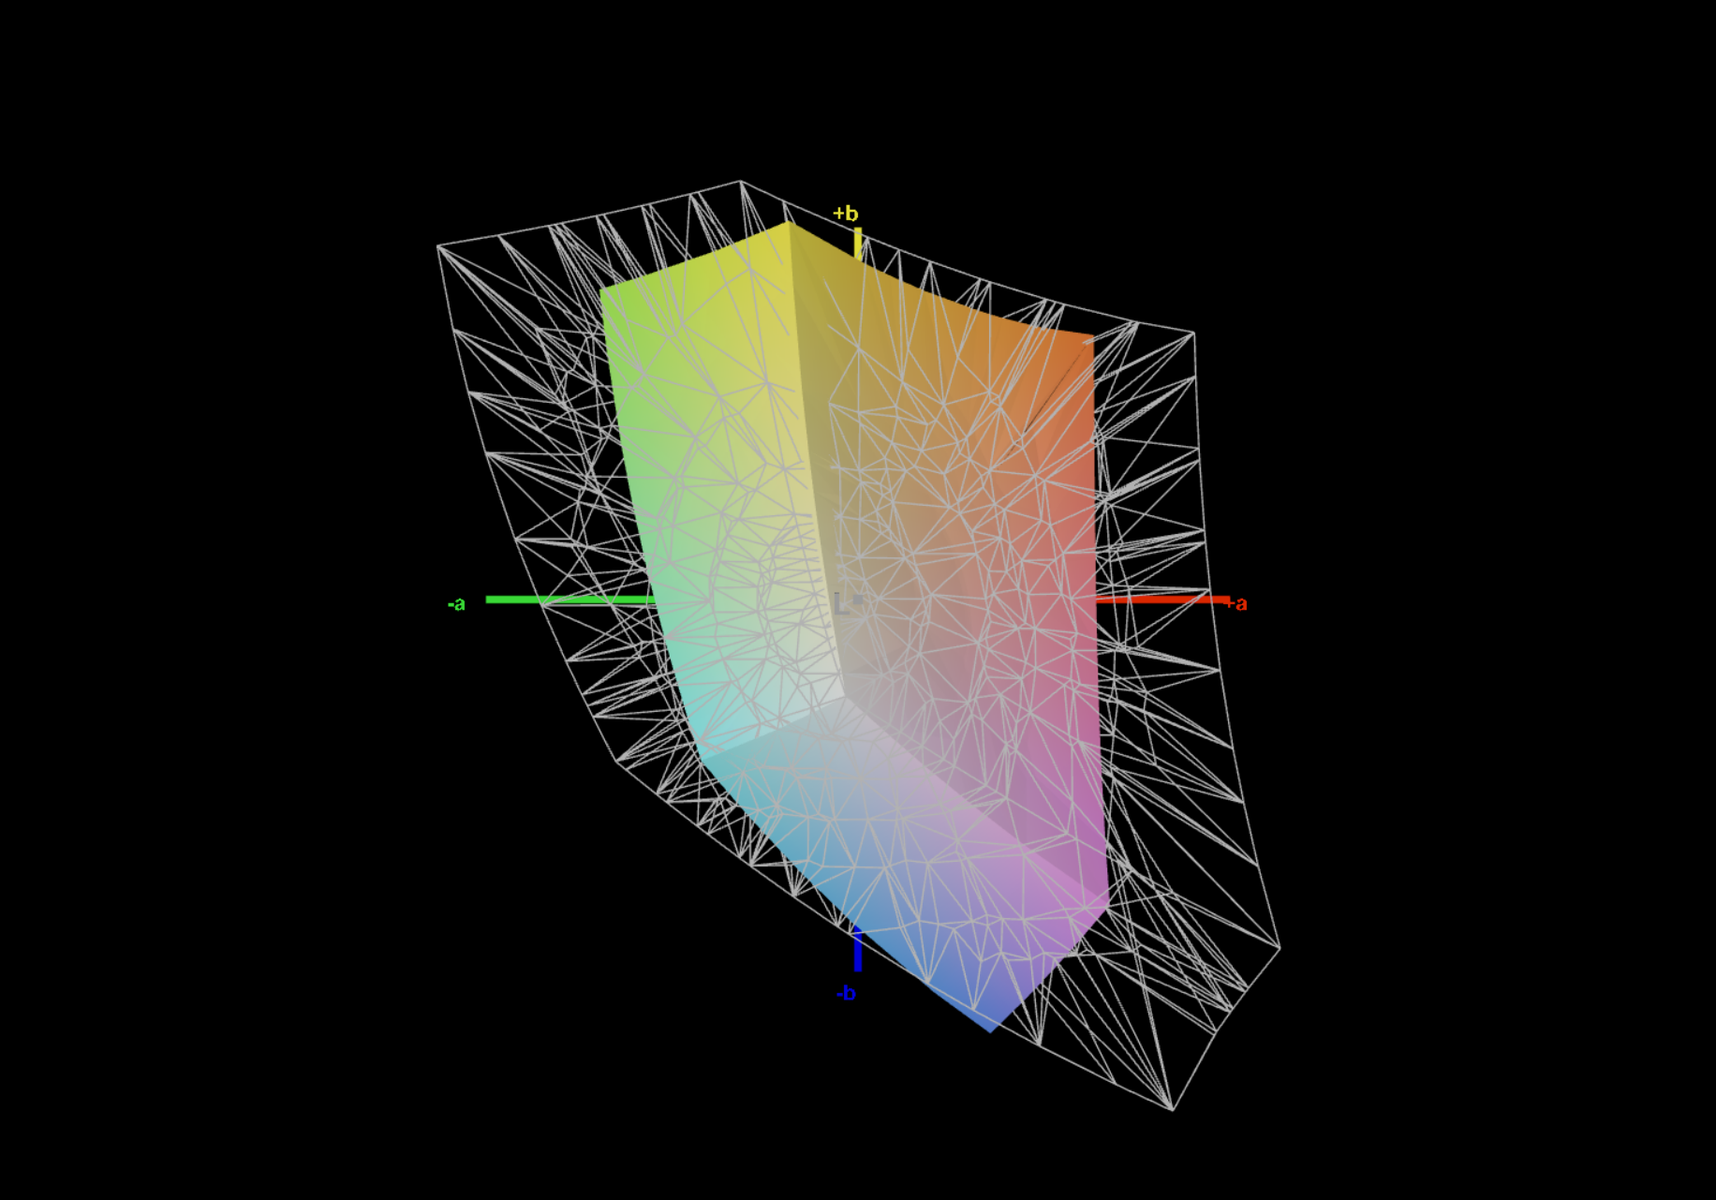
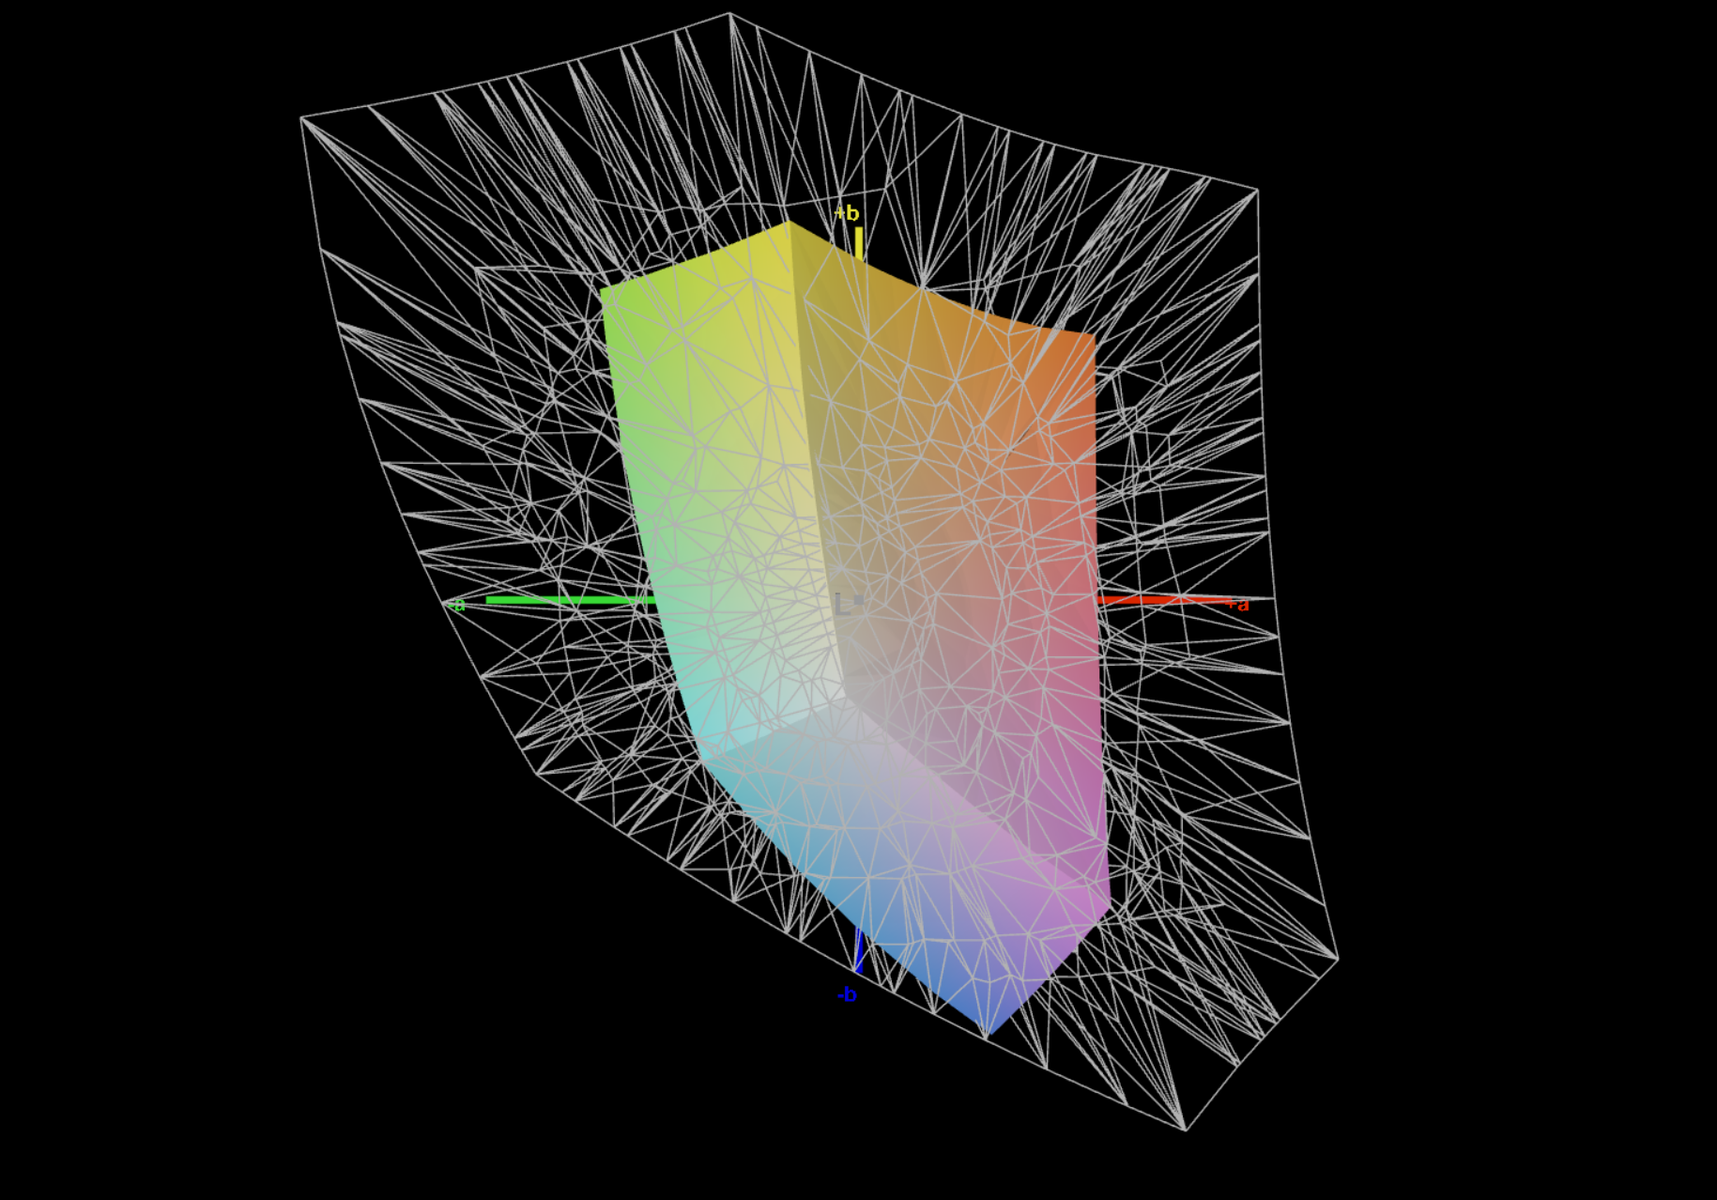
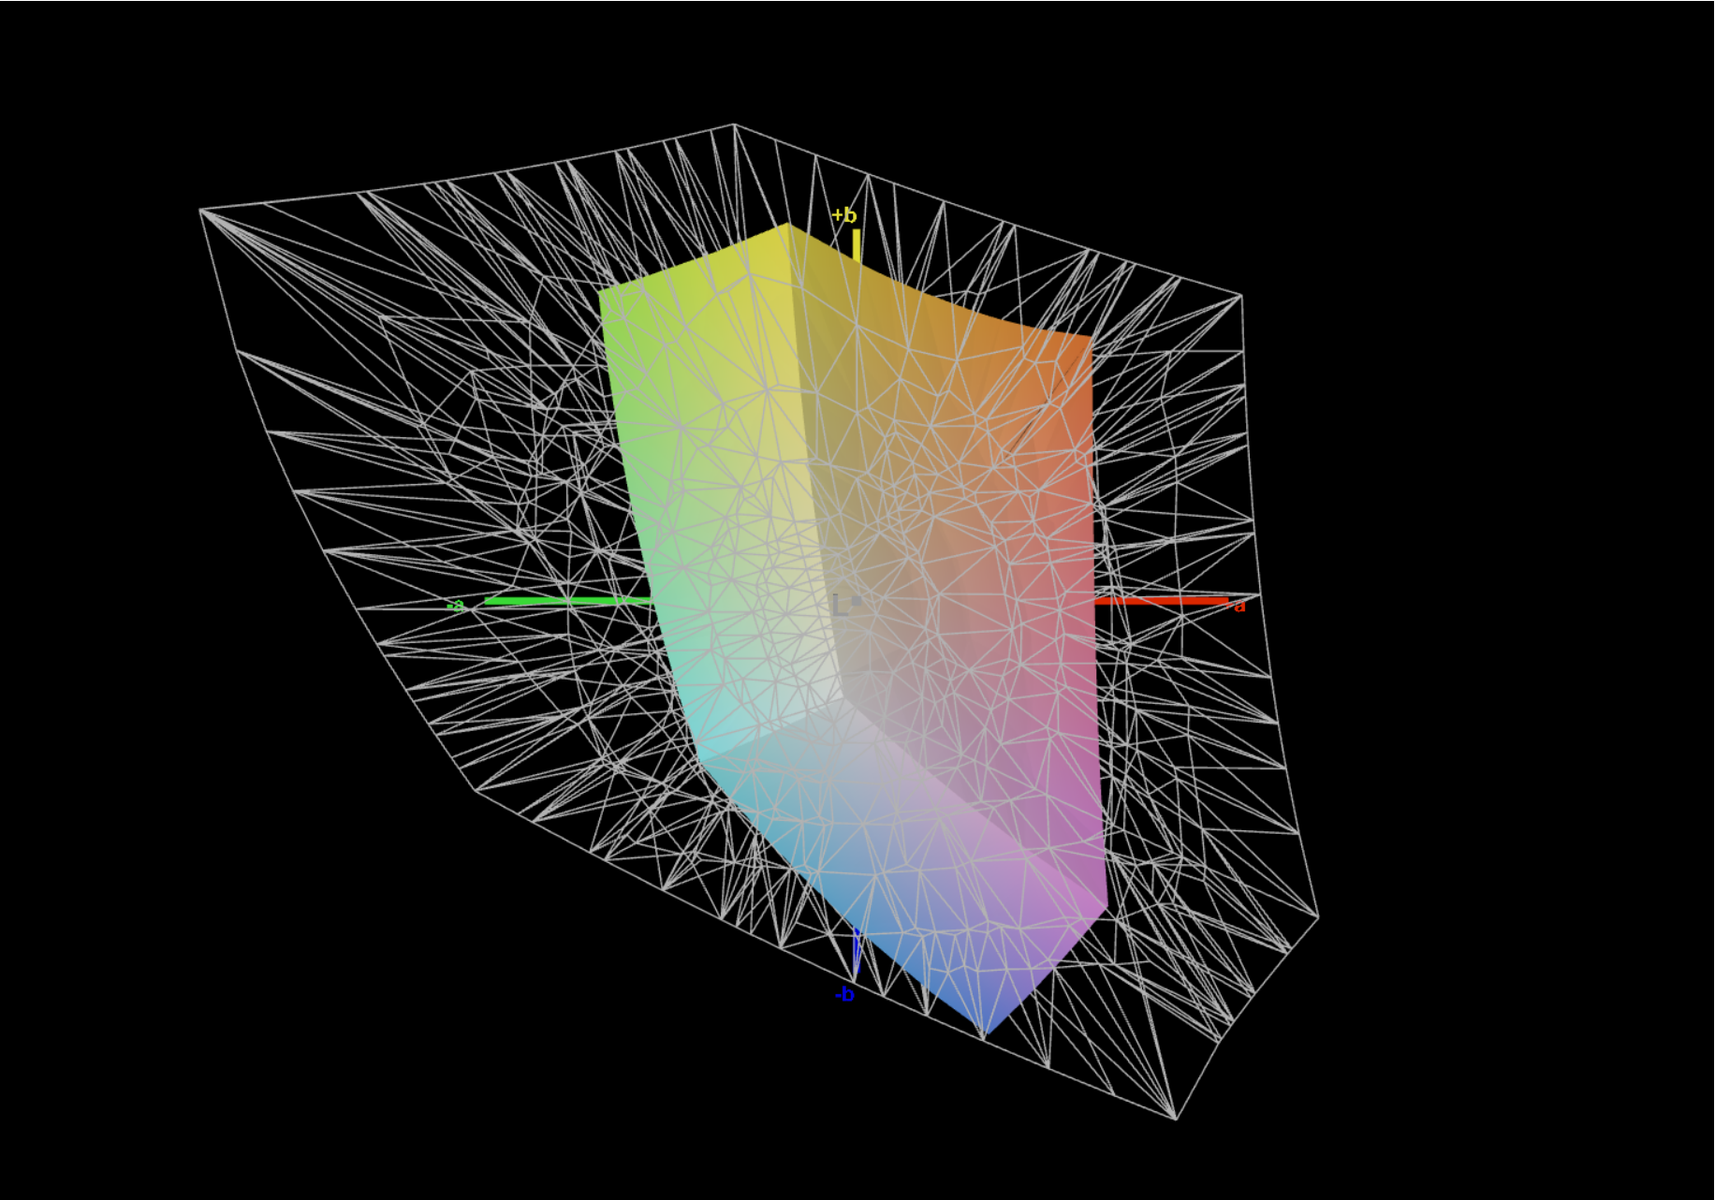
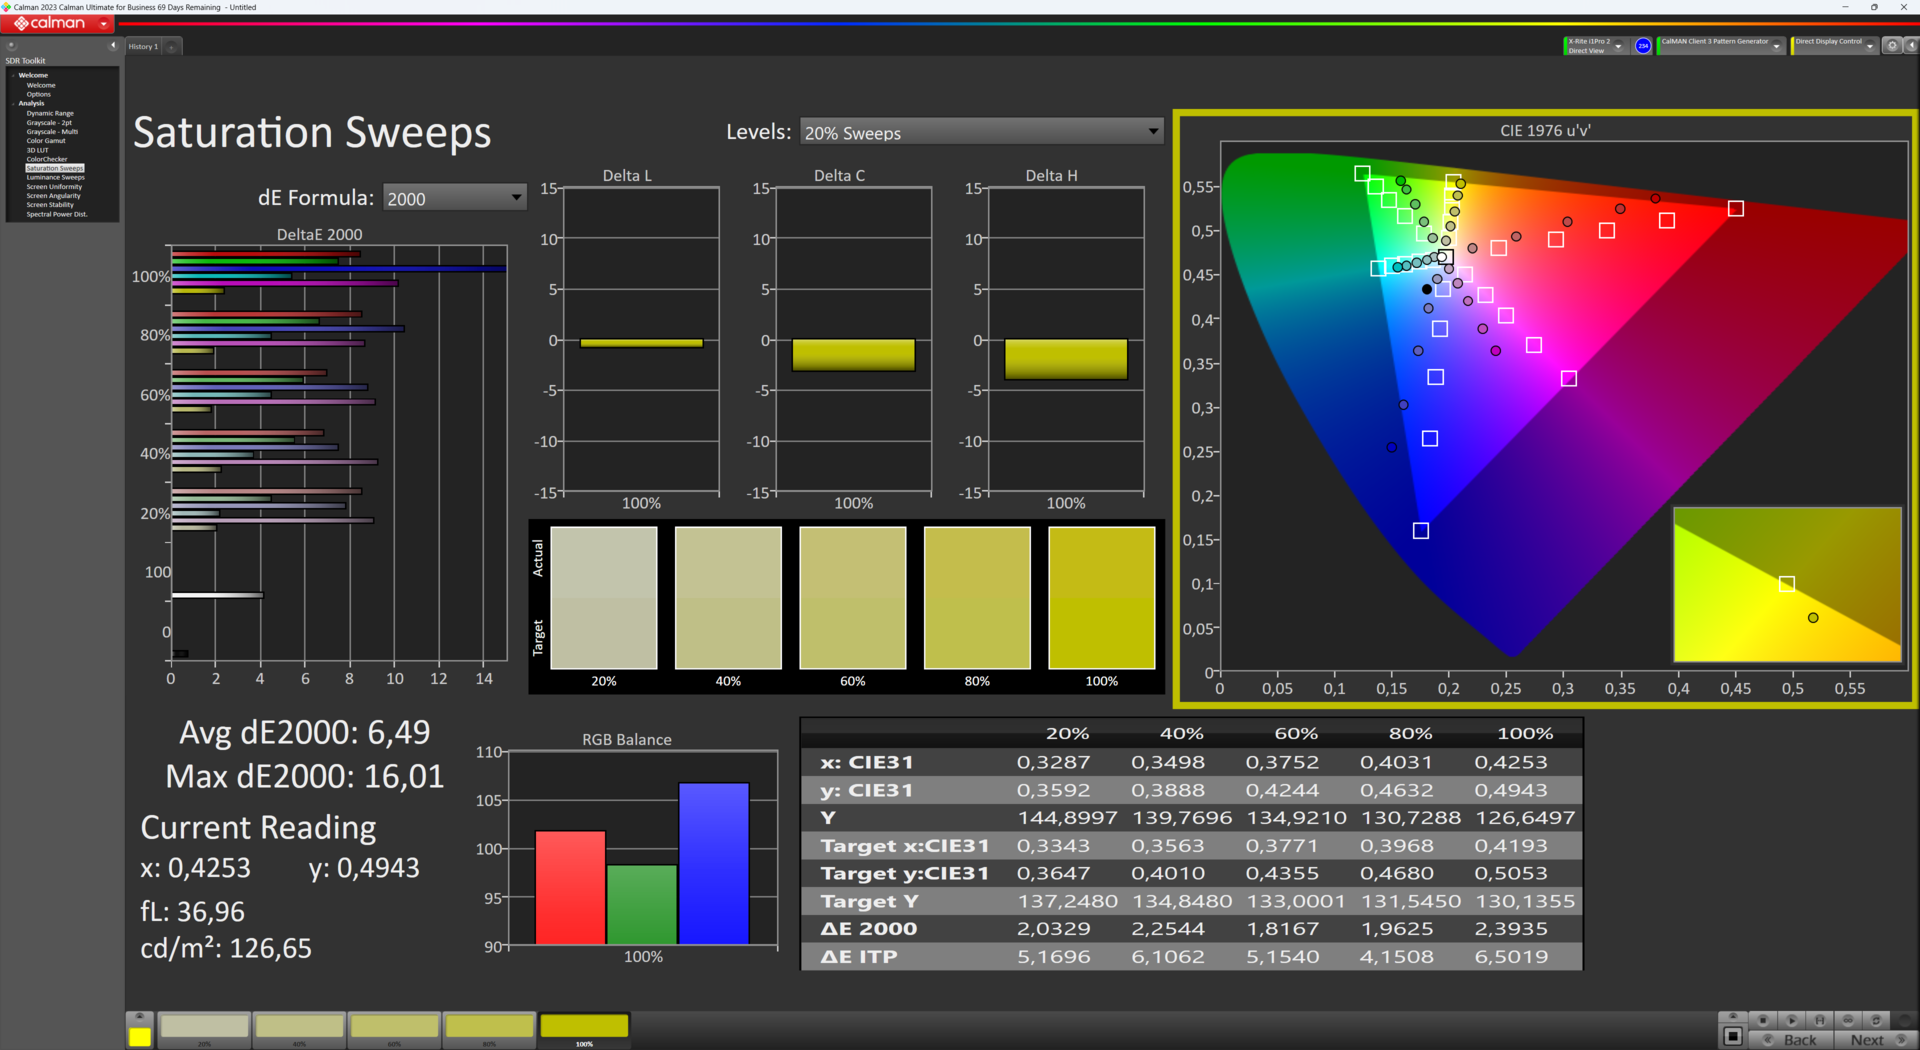
El portátil está equipado con una pantalla IPS estándar de 15,6 pulgadas con una resolución de 1.920 x 1.080 píxeles (16:9). Sus mayores defectos son su pobre cobertura del espacio de color de alrededor del 58 % sRGB y su bajo brillo de 248 cd/m². En uso de batería, incluso baja a 220 cd/m².
Para un portátil económico, esto sería un compromiso justificado - sin embargo, no a un precio de casi 1.200 US$ cuando ni siquiera tienes la opción de elegir una alternativa más vibrante y brillante. Aun así, puedes experimentar una experiencia de juego ligeramente menos vibrante a un máximo de 60 Hz.
Además, la calidad de imagen se ve aún más apagada debido a su superficie mate granulada, mientras que los niveles de contraste de su predecesor eran mucho más altos:1.317:1 frente a 802:1. Al menos, no notamos parpadeo PWM ni sangrado de retroiluminación.
En cambio, los verdaderos portátiles para juegos, como el LenovoLOQ 15lOQ 16 y el AsusTUF Gaming A15ofrecen una configuración base de 144 Hz, con una opción de actualización a 100% sRGB. En cuanto a portátiles puramente de oficina, el IdeaPad Pro 5 16 destaca por ser un dispositivo relativamente barato con una pantalla QHD de 120 Hz. El AsusVivoBook S15tiene la mejor pantalla de nuestro campo de comparación, ya que se basa en un panel OLED y puede cubrir ~99 % de AdobeRGB.
| |||||||||||||||||||||||||
iluminación: 88 %
Brillo con batería: 220 cd/m²
Contraste: 802:1 (Negro: 0.3209 cd/m²)
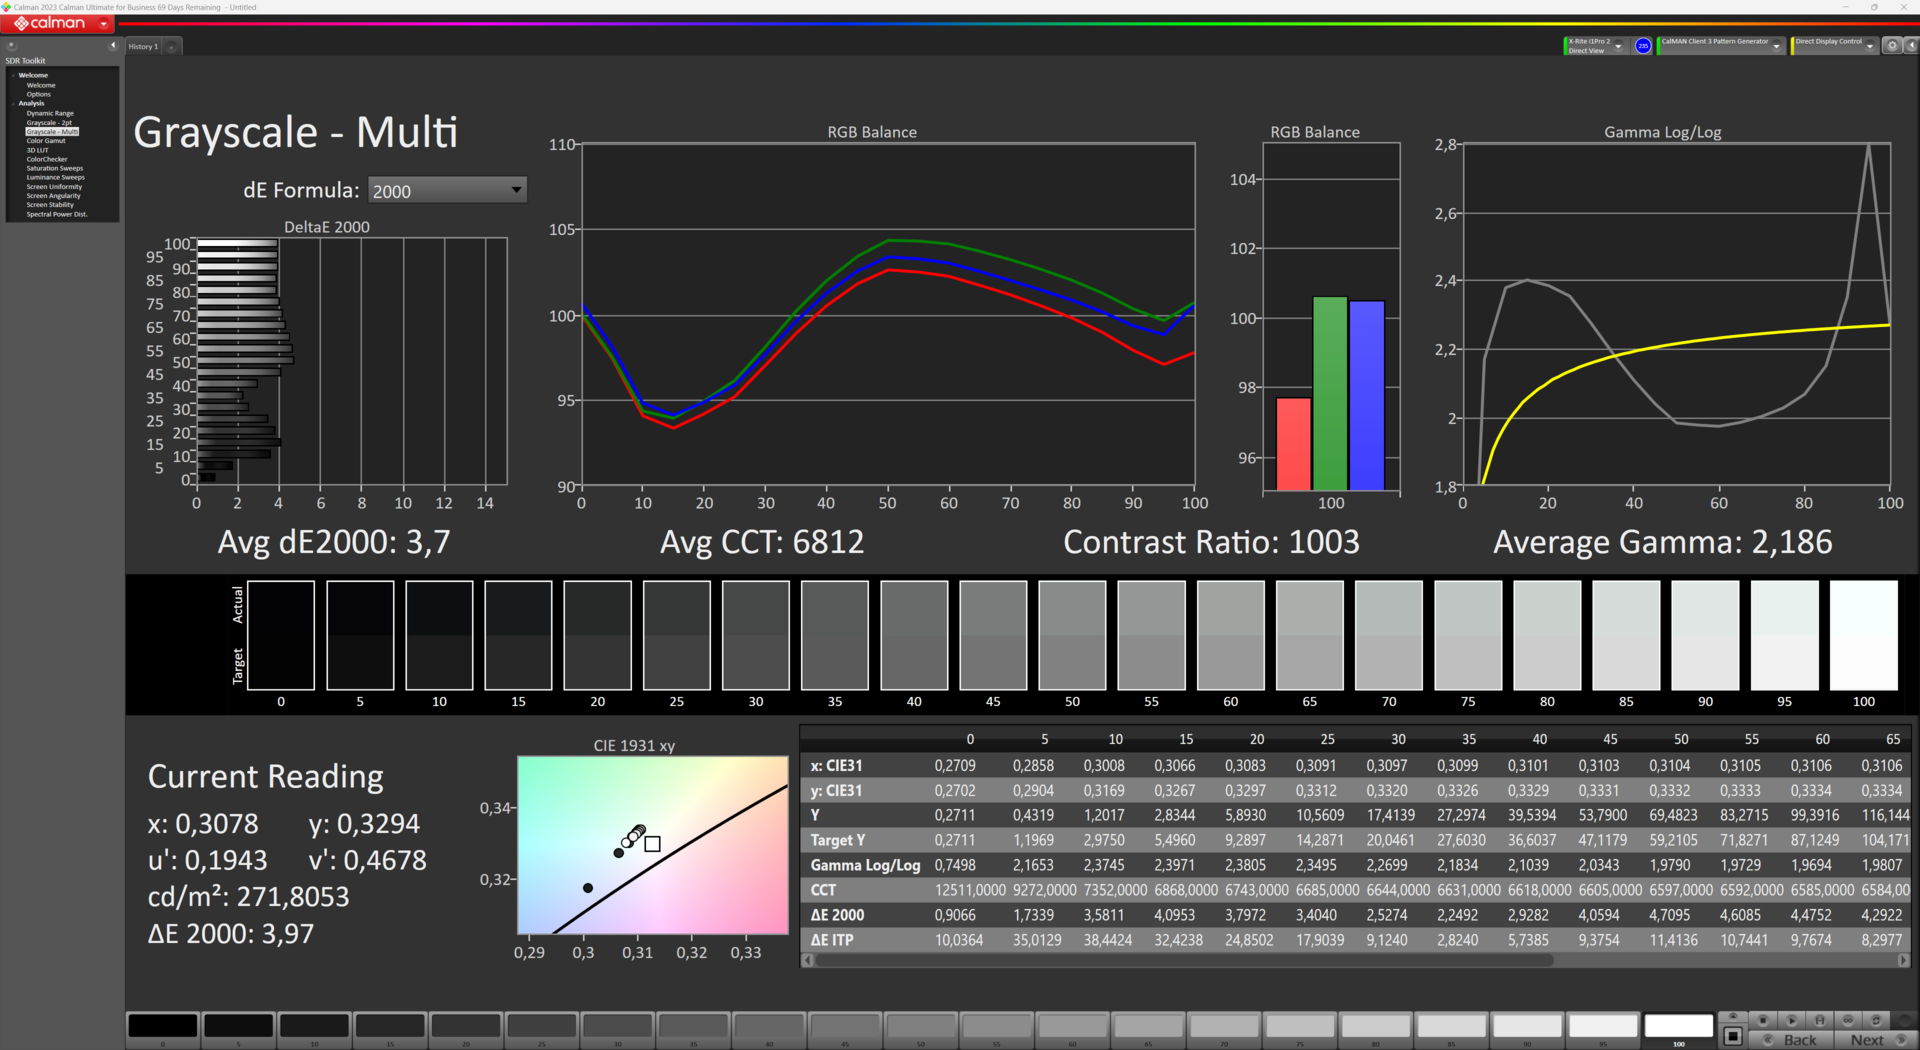
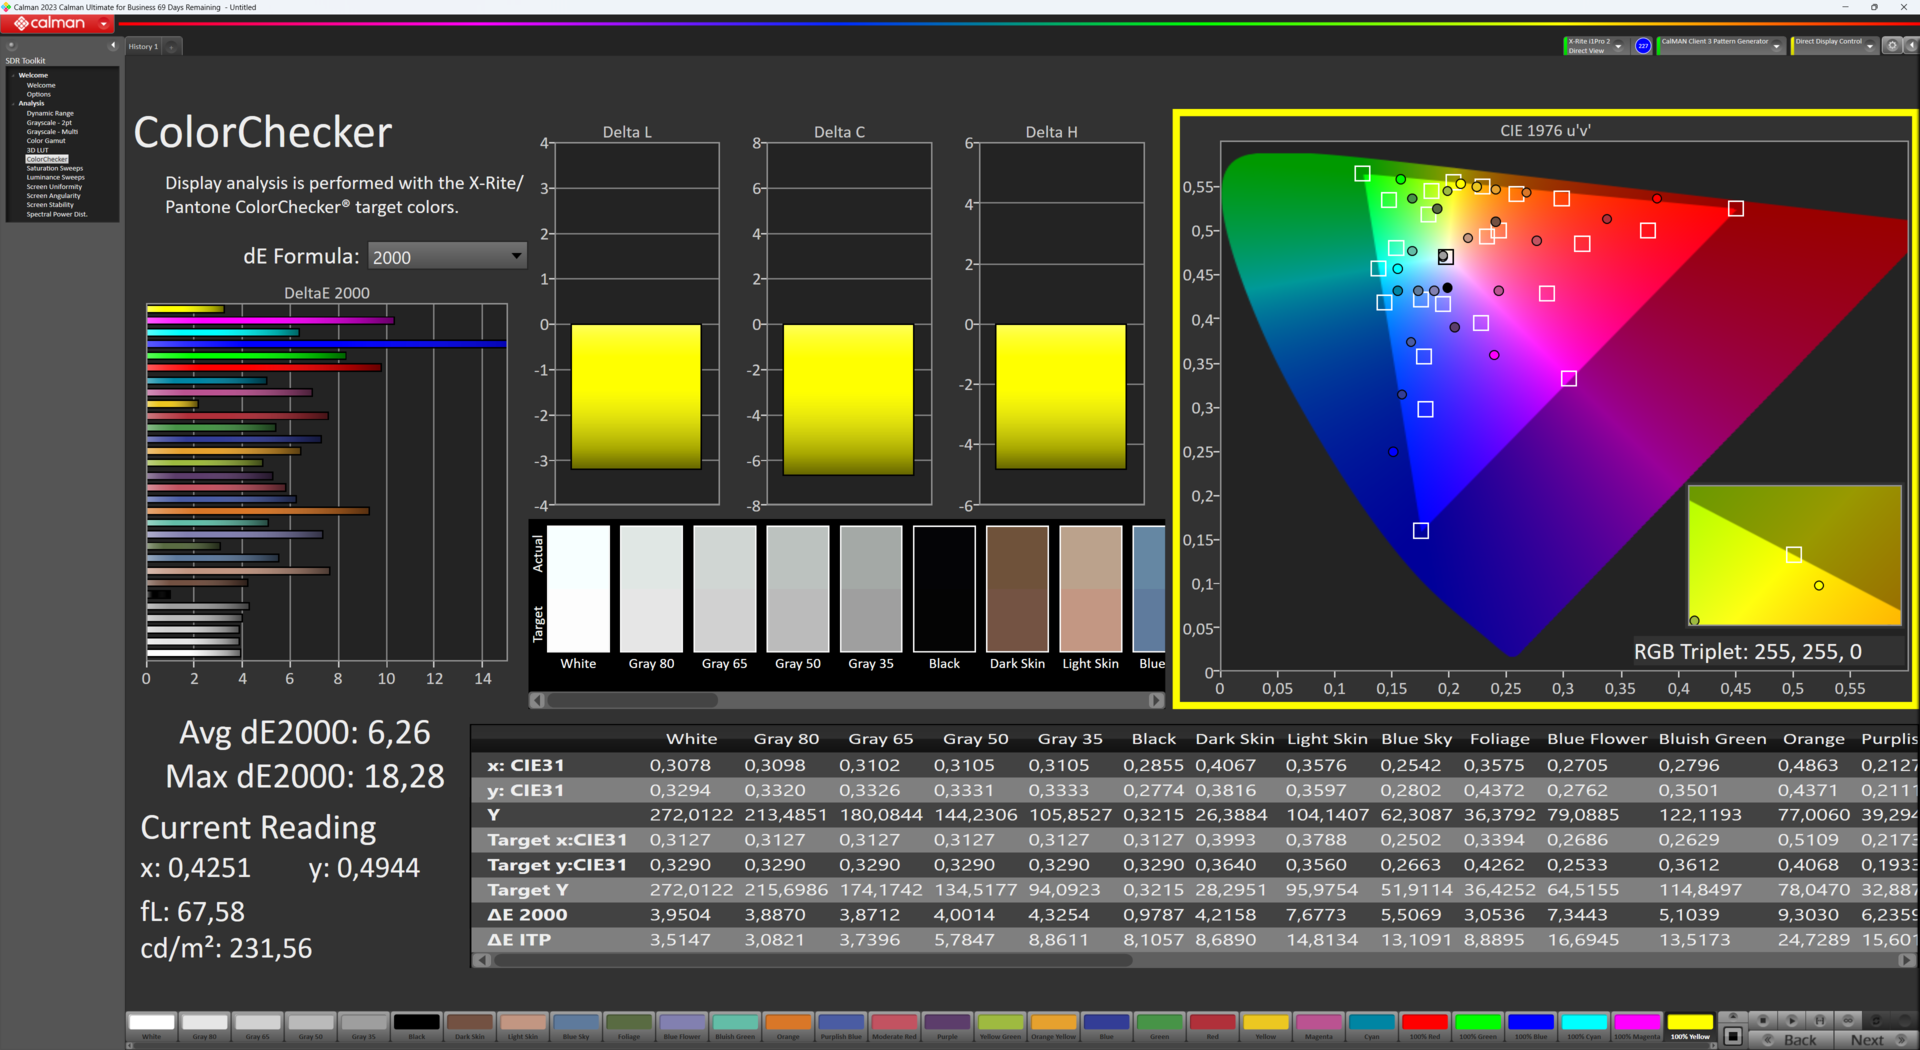
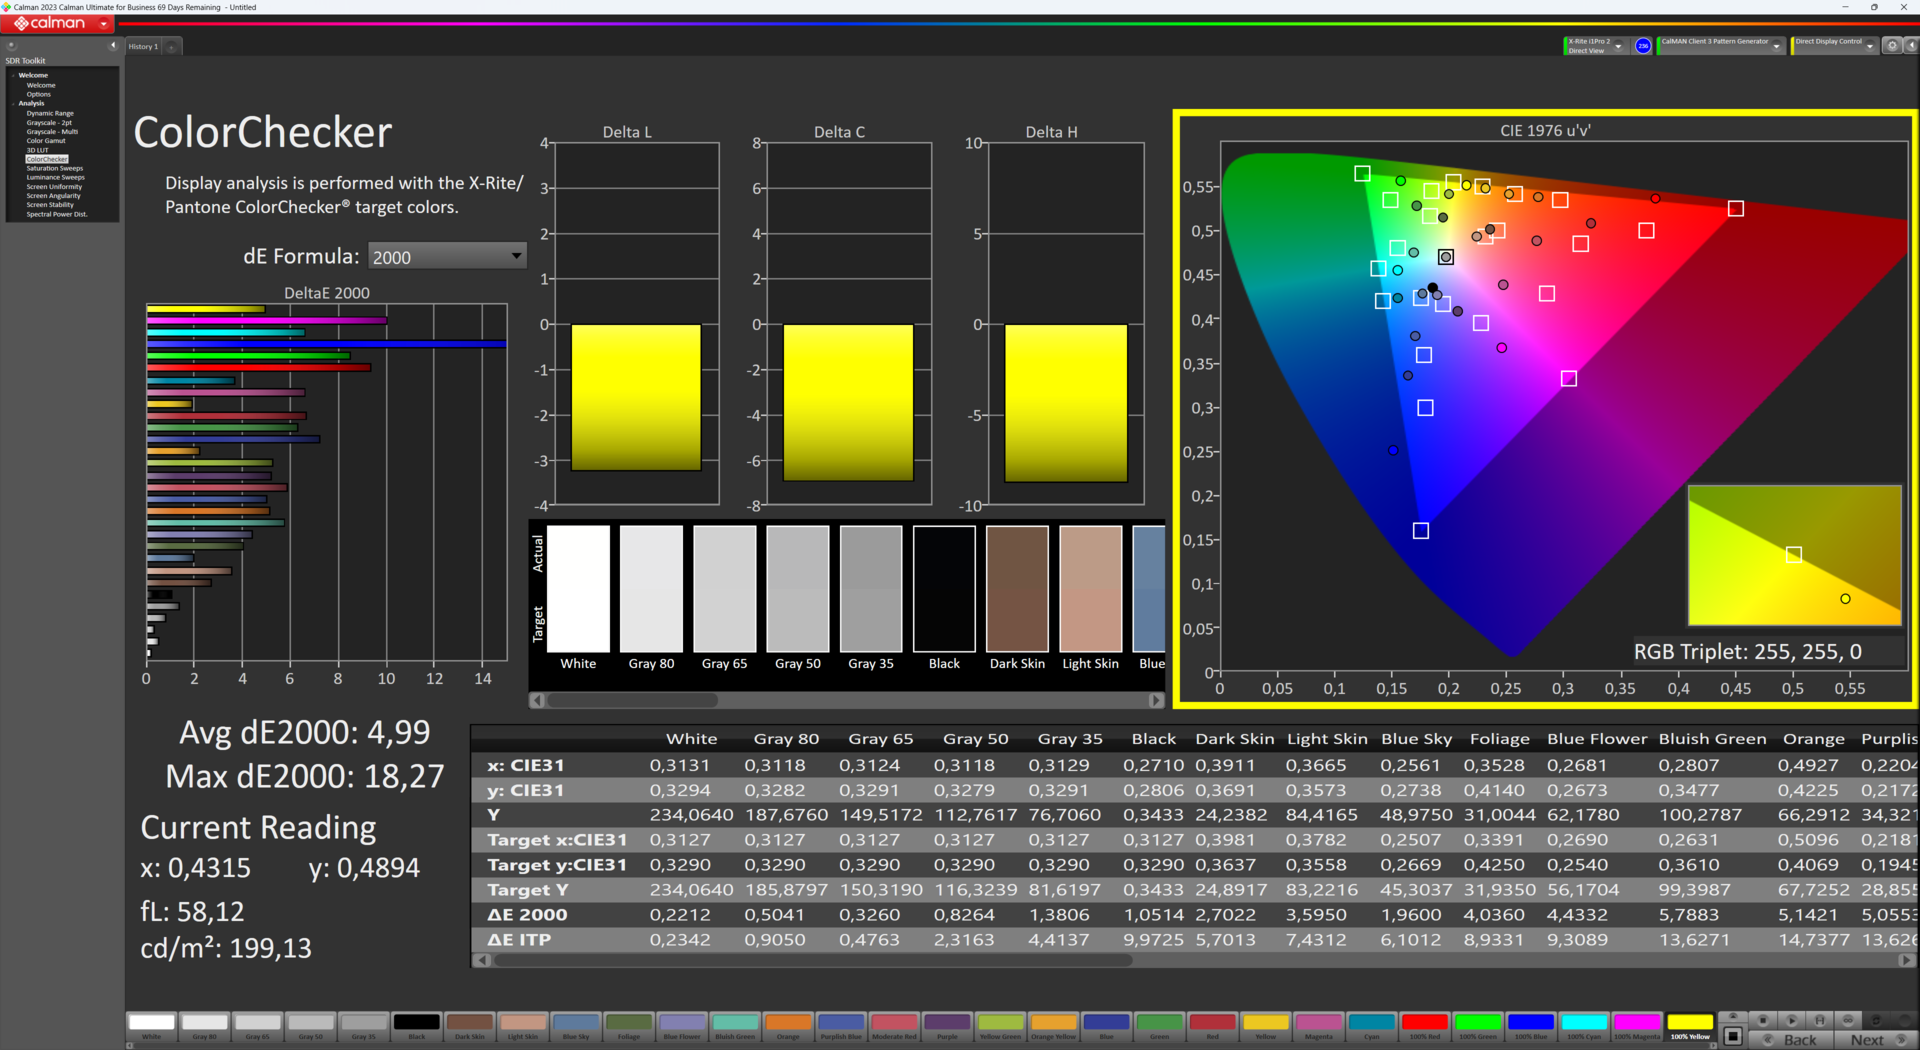
ΔE ColorChecker Calman: 6.26 | ∀{0.5-29.43 Ø4.71}
calibrated: 4.99
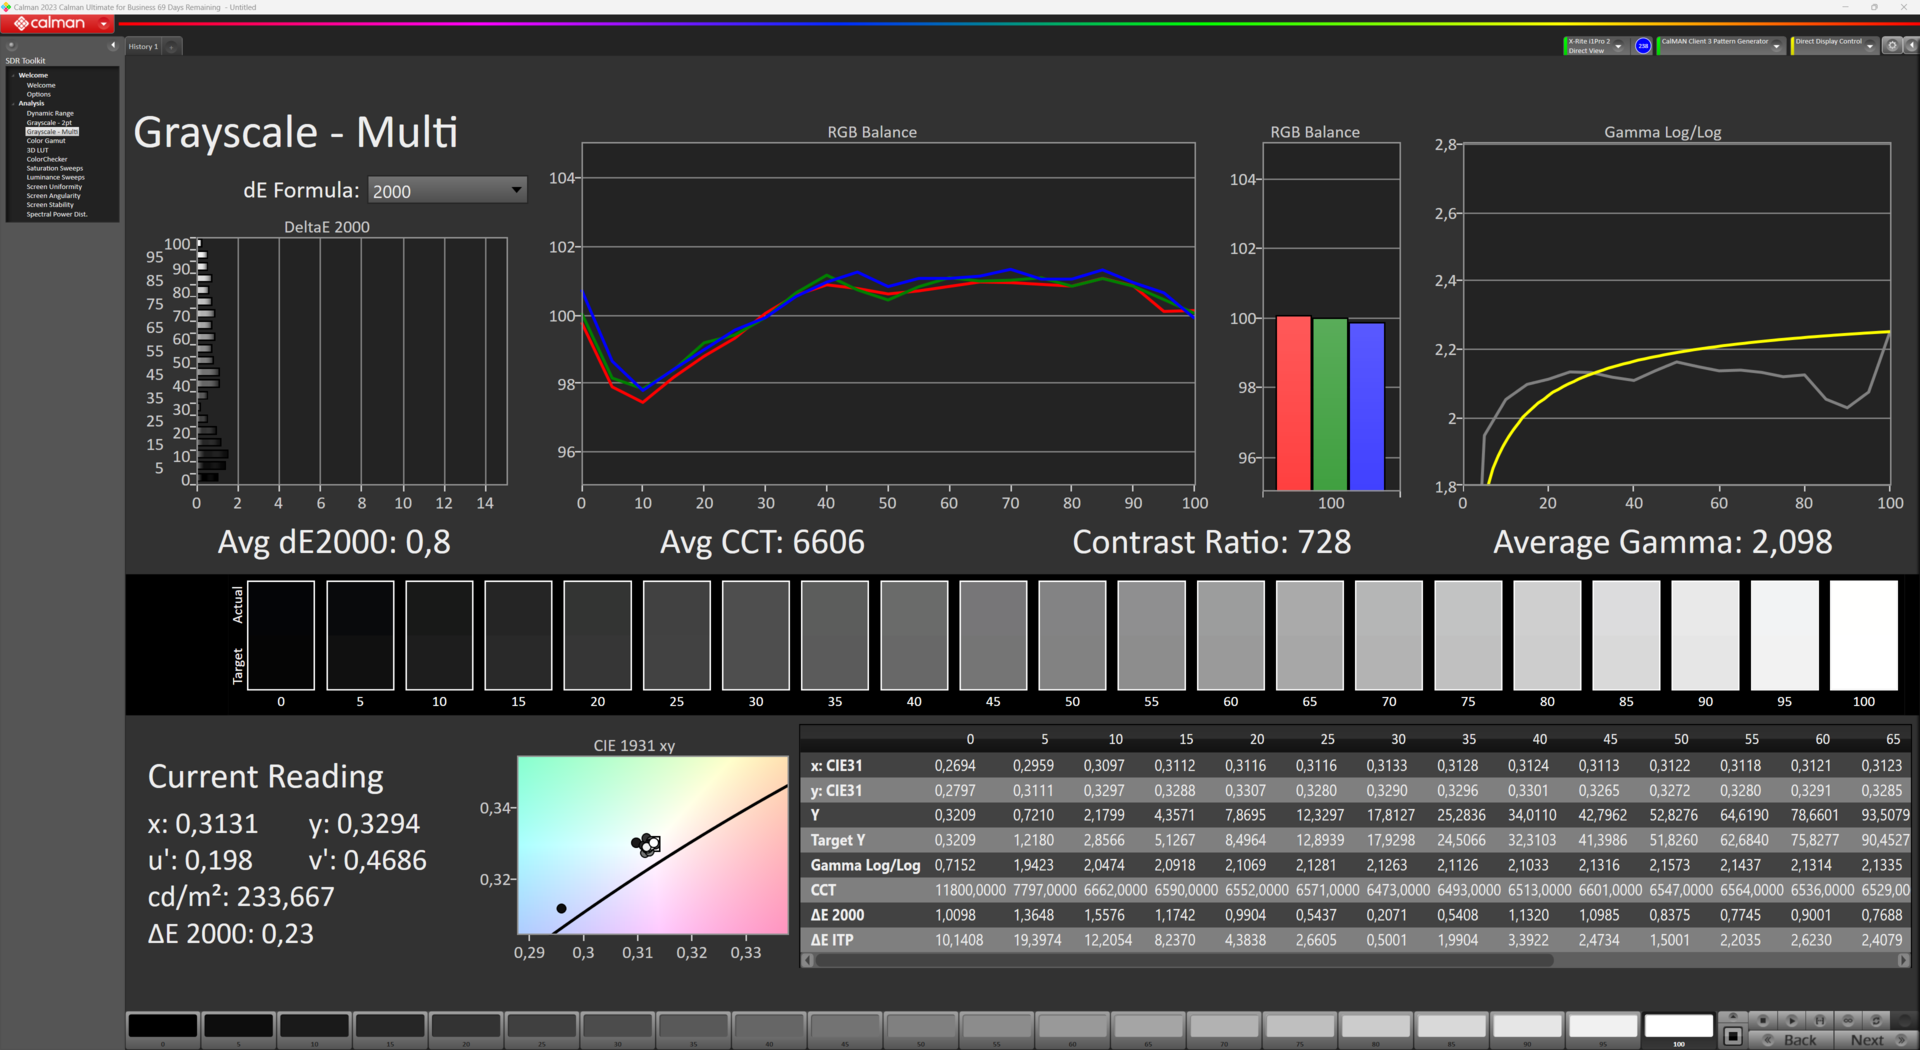
ΔE Greyscale Calman: 3.7 | ∀{0.09-98 Ø4.96}
39.41% AdobeRGB 1998 (Argyll 3D)
57.7% sRGB (Argyll 3D)
38.11% Display P3 (Argyll 3D)
Gamma: 2.186
CCT: 6606 K
| Acer Aspire 5 A515-58GM-76S8 LP156WFH-SPD5, IPS, 1920x1080, 15.6" | Acer Aspire 5 A515-57G-53N8 CMN N156HCA-EAB, IPS, 1920x1080, 15.6" | Lenovo IdeaPad 5 15ALC05 Lenovo LEN156FHD, IPS, 1920x1080, 15.6" | Asus VivoBook S15 M3502RA-L1029W Samsung SDC4161, OLED, 1920x1080, 15.6" | Dell Inspiron 15 5515-H8P8F BOE NV15N4V, IPS, 1920x1080, 15.6" | HP Envy x360 15-ey0023dx BOE08A8, IPS, 1920x1080, 15.6" | Huawei MateBook D 15 Ryzen 5 5500U B156HAN02.8, IPS, 1920x1080, 15.6" | Lenovo LOQ 15APH8 BOE NJ NE156FHM-NX3, IPS, 1920x1080, 15.6" | Asus TUF A15 FA507 N156HMA-GA1, IPS, 1920x1080, 15.6" | |
|---|---|---|---|---|---|---|---|---|---|
| Display | 14% | -1% | 128% | -5% | 3% | 11% | 5% | 69% | |
| Display P3 Coverage (%) | 38.11 | 43.3 14% | 99.9 162% | 36.58 -4% | 39.6 4% | 42.3 11% | 40.2 5% | 64.9 70% | |
| sRGB Coverage (%) | 57.7 | 65 13% | 59 2% | 100 73% | 54.37 -6% | 58.5 1% | 63.4 10% | 60.2 4% | 96.5 67% |
| AdobeRGB 1998 Coverage (%) | 39.41 | 44.8 14% | 38 -4% | 98.6 150% | 37.79 -4% | 40.9 4% | 43.7 11% | 41.5 5% | 66.6 69% |
| Response Times | -3% | 21% | 95% | -28% | -16% | -46% | -13% | 13% | |
| Response Time Grey 50% / Grey 80% * (ms) | 33.6 ? | 35.6 ? -6% | 29 ? 14% | 0.74 98% | 44 ? -31% | 43.6 ? -30% | 51.2 ? -52% | 42.7 ? -27% | 30.4 ? 10% |
| Response Time Black / White * (ms) | 24.8 ? | 24.5 ? 1% | 18 ? 27% | 2 ? 92% | 31 ? -25% | 25.2 ? -2% | 34.4 ? -39% | 24.5 ? 1% | 20.8 ? 16% |
| PWM Frequency (Hz) | 59 ? | 1250 ? | |||||||
| Screen | 19% | -13% | 51% | 18% | 13% | 18% | 25% | 49% | |
| Brightness middle (cd/m²) | 257.4 | 250 -3% | 376 46% | 378 47% | 251 -2% | 297.8 16% | 299 16% | 346.2 34% | 288 12% |
| Brightness (cd/m²) | 248 | 234 -6% | 341 38% | 378 52% | 241 -3% | 271 9% | 280 13% | 329 33% | 271 9% |
| Brightness Distribution (%) | 88 | 79 -10% | 78 -11% | 98 11% | 87 -1% | 81 -8% | 89 1% | 81 -8% | 91 3% |
| Black Level * (cd/m²) | 0.3209 | 0.19 41% | 0.66 -106% | 0.23 28% | 0.35 -9% | 0.2 38% | 0.31 3% | 0.17 47% | |
| Contrast (:1) | 802 | 1316 64% | 570 -29% | 1091 36% | 851 6% | 1495 86% | 1117 39% | 1694 111% | |
| Colorchecker dE 2000 * | 6.26 | 3.94 37% | 6.4 -2% | 2.2 65% | 5.14 18% | 5.16 18% | 5.2 17% | 4.19 33% | 1.9 70% |
| Colorchecker dE 2000 max. * | 18.28 | 16.73 8% | 20.45 -12% | 4.87 73% | 18.41 -1% | 19.76 -8% | 20.8 -14% | 19.19 -5% | 3.3 82% |
| Colorchecker dE 2000 calibrated * | 4.99 | 3.09 38% | 2.68 46% | 2.28 54% | 4.2 16% | 1.66 67% | 0.9 82% | ||
| Greyscale dE 2000 * | 3.7 | 3.6 3% | 4.59 -24% | 1.43 61% | 1.08 71% | 2.2 41% | 4.1 -11% | 2.6 30% | 2.7 27% |
| Gamma | 2.186 101% | 2.081 106% | 2.26 97% | 2.47 89% | 2.43 91% | 2.27 97% | 2.2 100% | 2.19 100% | 2.32 95% |
| CCT | 6606 98% | 6476 100% | 6819 95% | 6464 101% | 6534 99% | 6678 97% | 6548 99% | 6749 96% | 6535 99% |
| Color Space (Percent of AdobeRGB 1998) (%) | 38 | 37.79 | |||||||
| Color Space (Percent of sRGB) (%) | 59 | 54.37 | |||||||
| Media total (Programa/Opciones) | 10% /
15% | 2% /
-5% | 91% /
78% | -5% /
6% | 0% /
7% | -6% /
7% | 6% /
15% | 44% /
48% |
* ... más pequeño es mejor
Como sólo cubre el 57,7 % del espacio de color sRGB, no es posible utilizar este portátil para la edición profesional de imágenes y vídeo, que depende de una representación precisa del color.
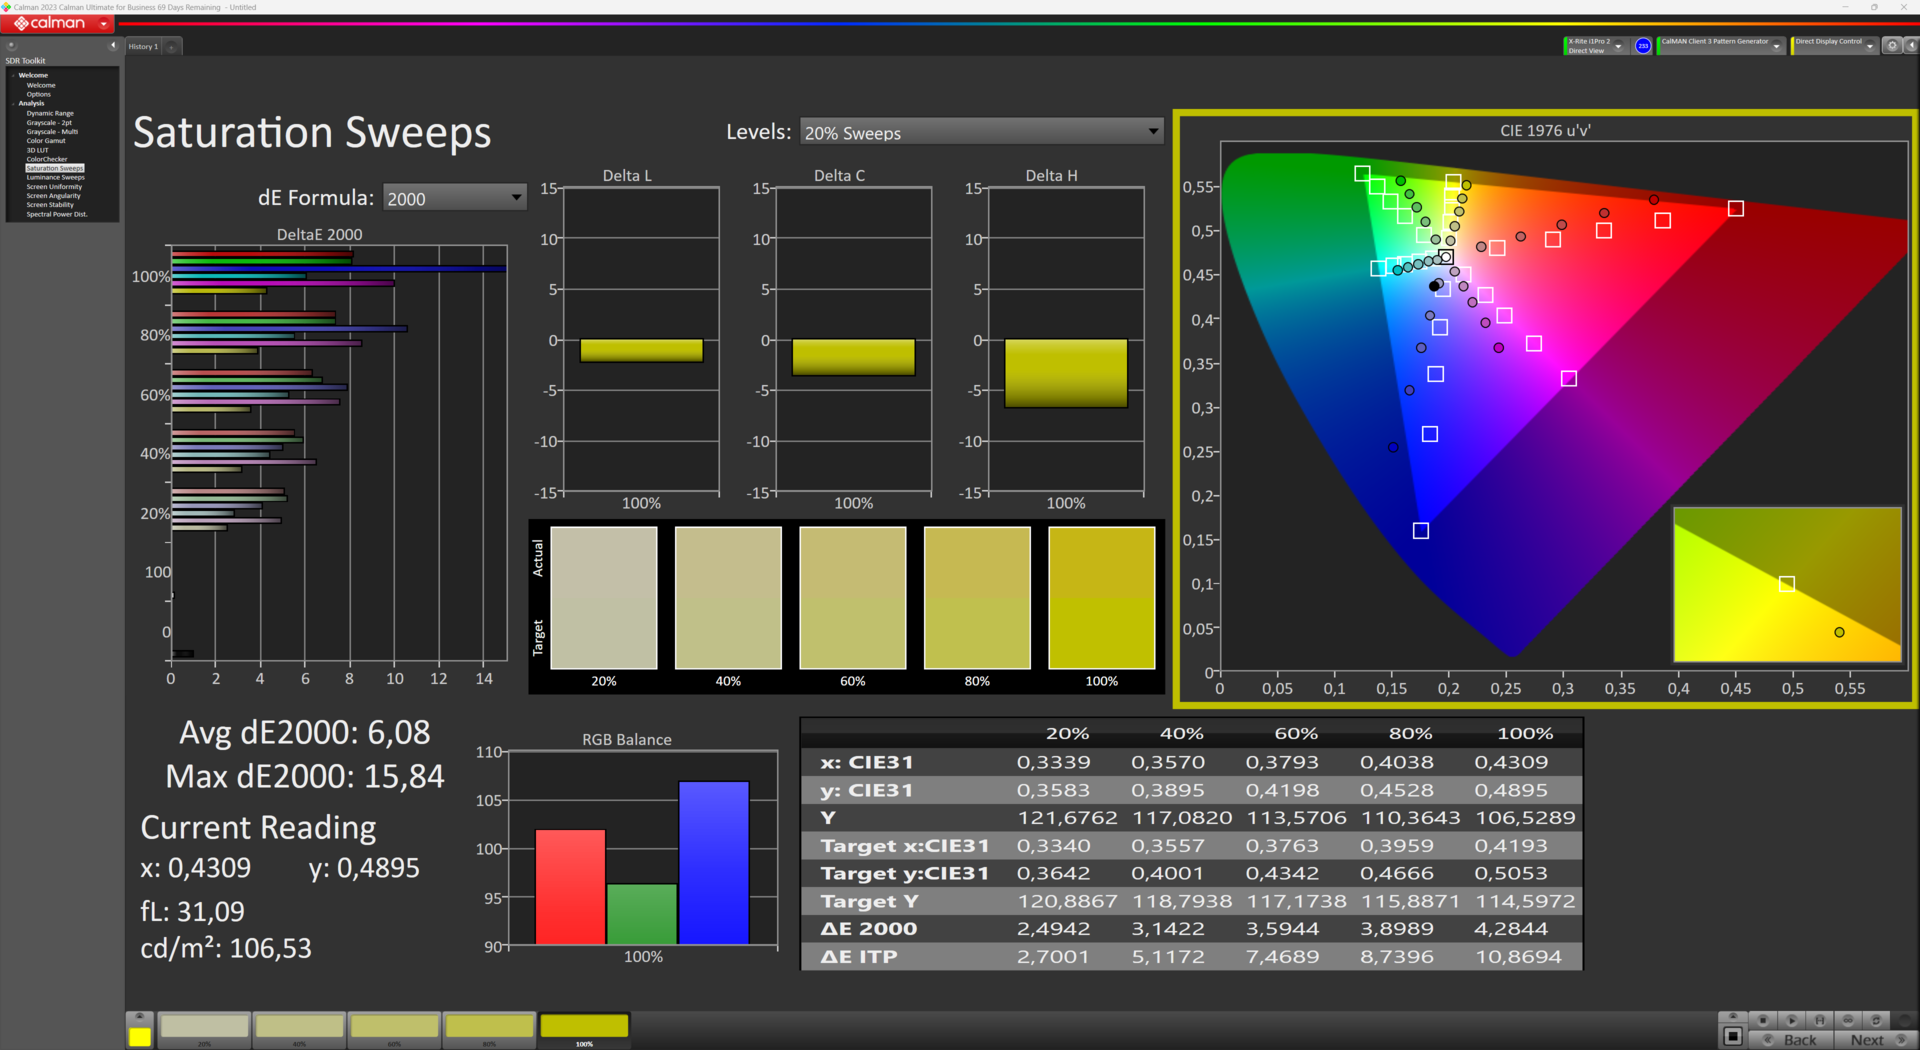
Los colores y la escala de grises superan claramente el límite de DeltaE 3, hasta el cual el ojo humano puede detectar desviaciones de color. Los valores no pudieron mejorarse con nuestra calibración. Al menos pudimos eliminar el ligero tinte cian. Nuestro perfil de color calibrado puede descargarse aquí.
Tiempos de respuesta del display
| ↔ Tiempo de respuesta de Negro a Blanco | ||
|---|---|---|
| 24.8 ms ... subida ↗ y bajada ↘ combinada | ↗ 14.2 ms subida | 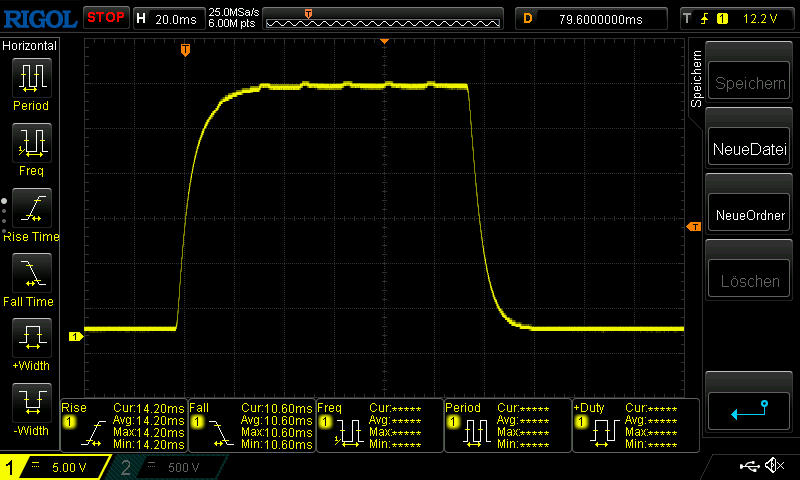 |
| ↘ 10.6 ms bajada | ||
| La pantalla mostró buenos tiempos de respuesta en nuestros tests pero podría ser demasiado lenta para los jugones competitivos. En comparación, todos los dispositivos de prueba van de ##min### (mínimo) a 240 (máximo) ms. » 58 % de todos los dispositivos son mejores. Eso quiere decir que el tiempo de respuesta es peor que la media (19.8 ms) de todos los dispositivos testados. | ||
| ↔ Tiempo de respuesta 50% Gris a 80% Gris | ||
| 33.6 ms ... subida ↗ y bajada ↘ combinada | ↗ 15.8 ms subida | 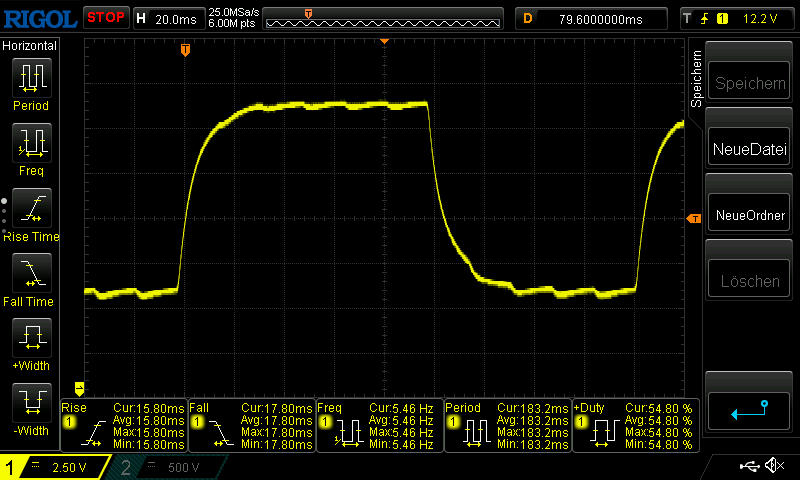 |
| ↘ 17.8 ms bajada | ||
| La pantalla mostró tiempos de respuesta lentos en nuestros tests y podría ser demasiado lenta para los jugones. En comparación, todos los dispositivos de prueba van de ##min### (mínimo) a 636 (máximo) ms. » 46 % de todos los dispositivos son mejores. Eso quiere decir que el tiempo de respuesta es similar al dispositivo testado medio (31 ms). | ||
Parpadeo de Pantalla / PWM (Pulse-Width Modulation)
| Parpadeo de Pantalla / PWM no detectado | 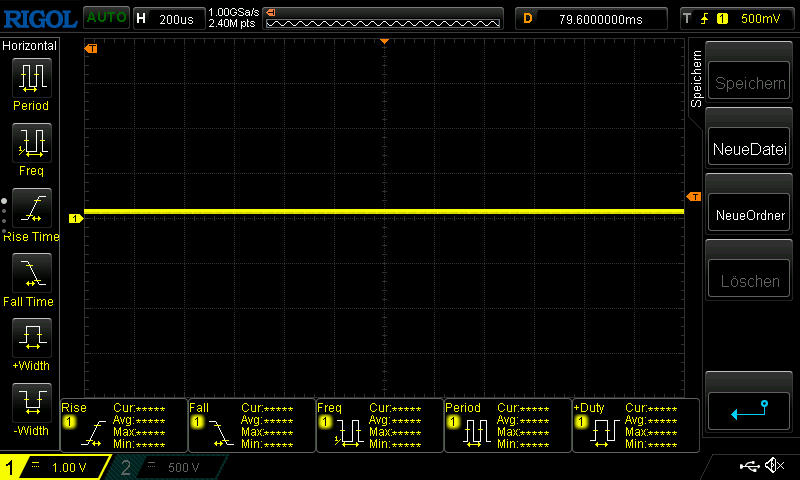 | ||
Comparación: 52 % de todos los dispositivos testados no usaron PWM para atenuar el display. Si se usó, medimos una media de 7754 (mínimo: 5 - máxmo: 343500) Hz. | |||
Su bajísimo brillo de 220 cd/m² en modo batería hace casi imposible leer la pantalla en el exterior, incluso a la sombra total.


Rendimiento: La CPU y la GPU del Aspire 5 se mantienen en el límite inferior
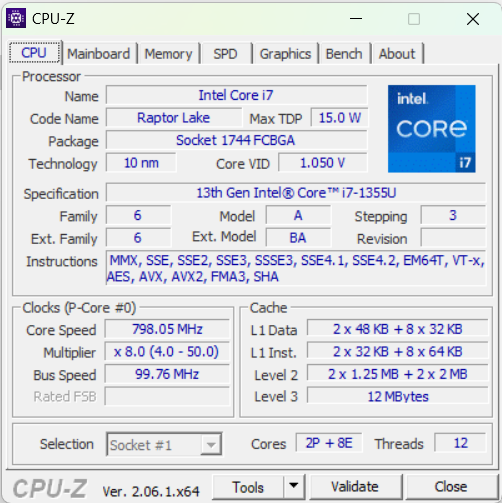
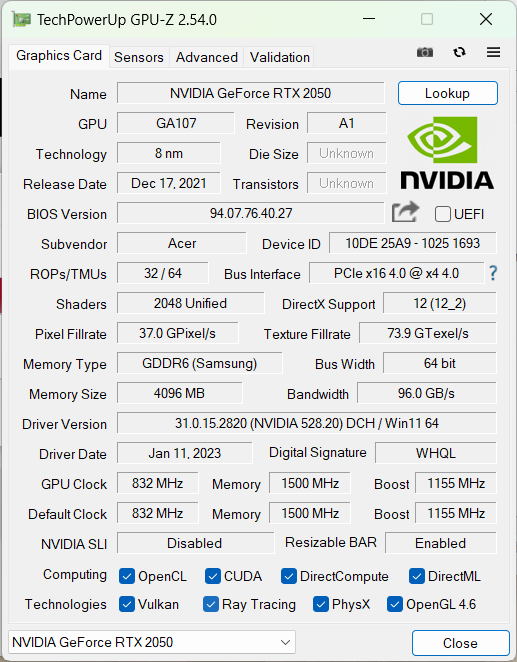
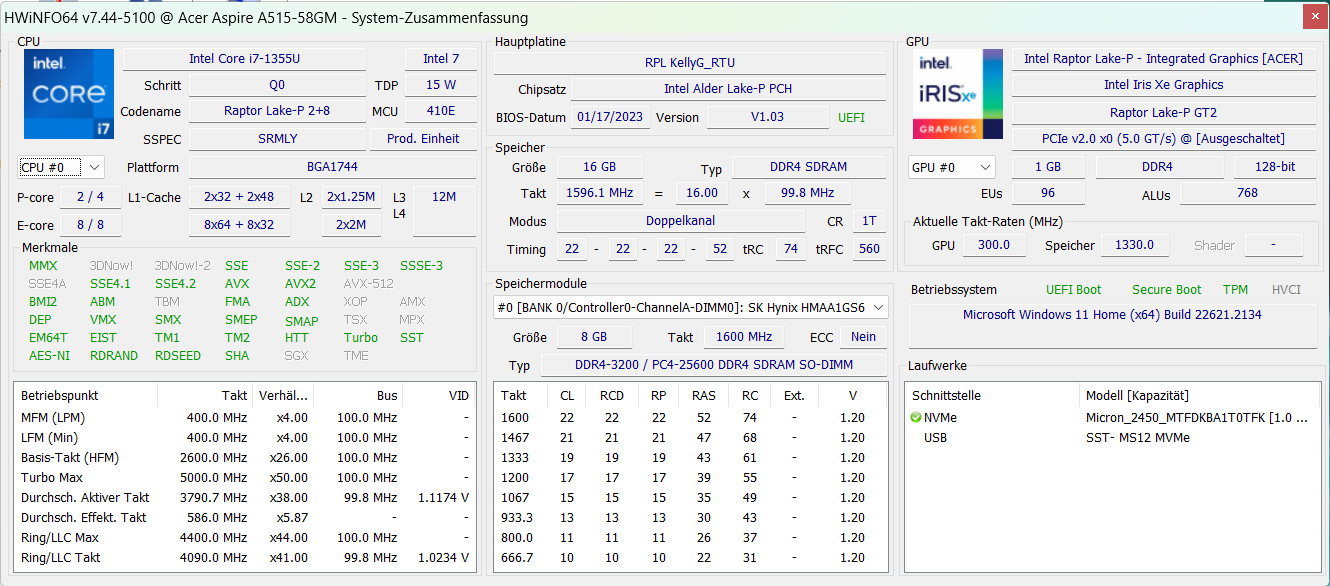
El Acer Aspire 5 A515-58GM está equipado con un procesador IntelCore i7-1355U(2 núcleos P + 8 núcleos E), 16 GB de RAM DDR4 ampliable, una unidad SSD de 1 TB (PCIe 3.0) y una tarjeta NvidiaGeForce RTX 2050con un TGP mínimo de 35 vatios. Hay SKU más baratas con una NvidiaGeForce RTX 2050y sin dGPU. También hay variantes AMD con una tarjeta gráfica RX Vega, pero vienen con una RAM completamente soldada. El modelo predecesor de construcción casi idénticapuede adquirirse con unaMX550o también con una RTX 2050.
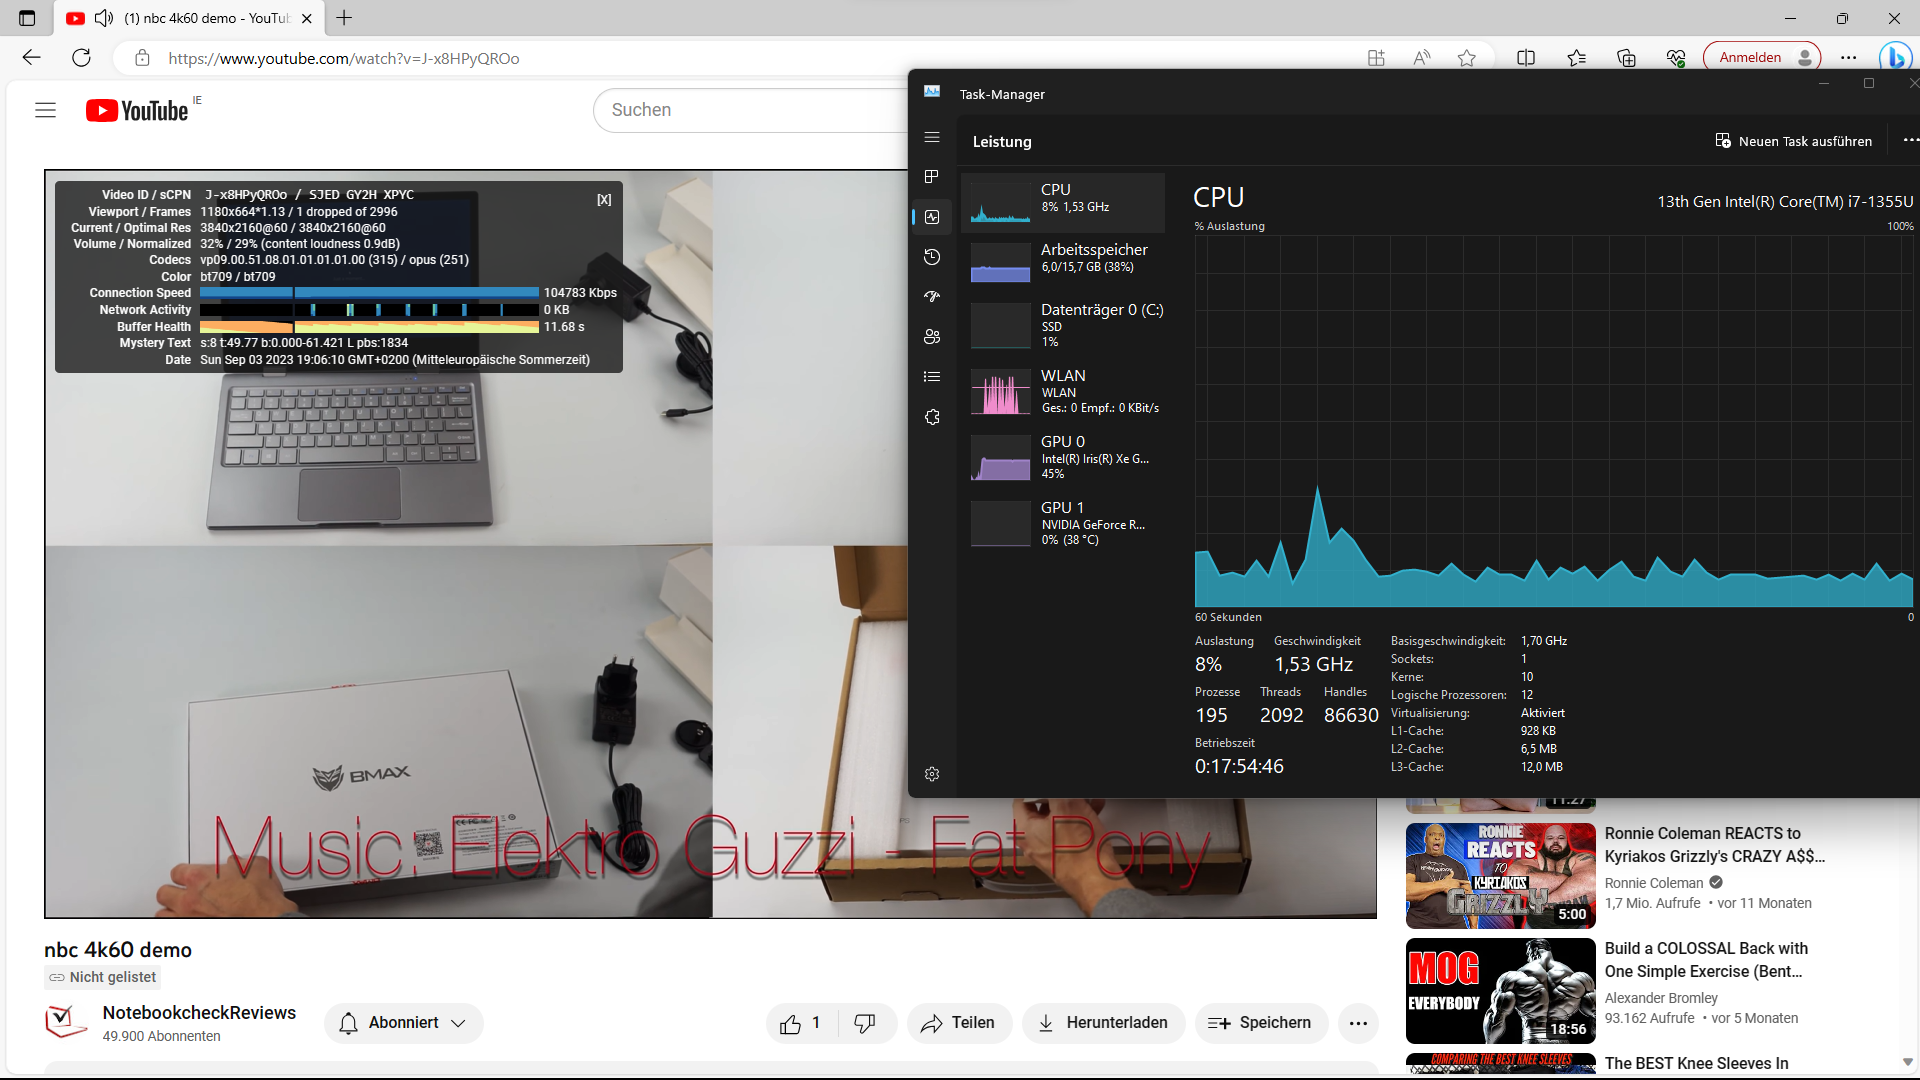
El Aspire está pensado como todoterreno, desde usos ofimáticos y multimedia hasta jugar a nuevos juegos (con detalles bajos). Para la edición de vídeo 4K, esta versión suele ser lo bastante rápida, aunque recomendaríamos conectar un monitor externo.
Condiciones de ensayo
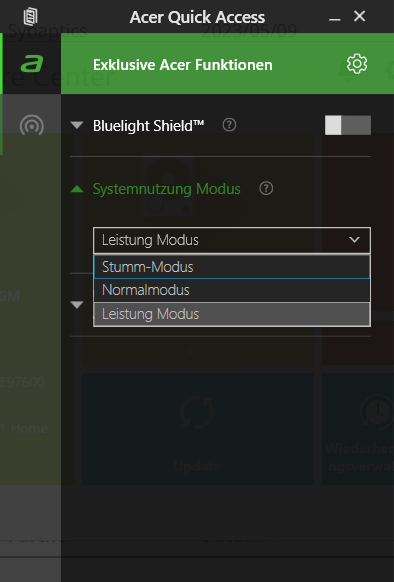
El fabricante ofrece tres modos de rendimiento diferentes en el Aspire 5 que pueden seleccionarse a través de Acer Quick Access o la combinación de teclas "Fn+F". Realizamos nuestras pruebas de rendimiento usando el modo "rendimiento" y para nuestras pruebas de batería, seleccionamos el modo normal.
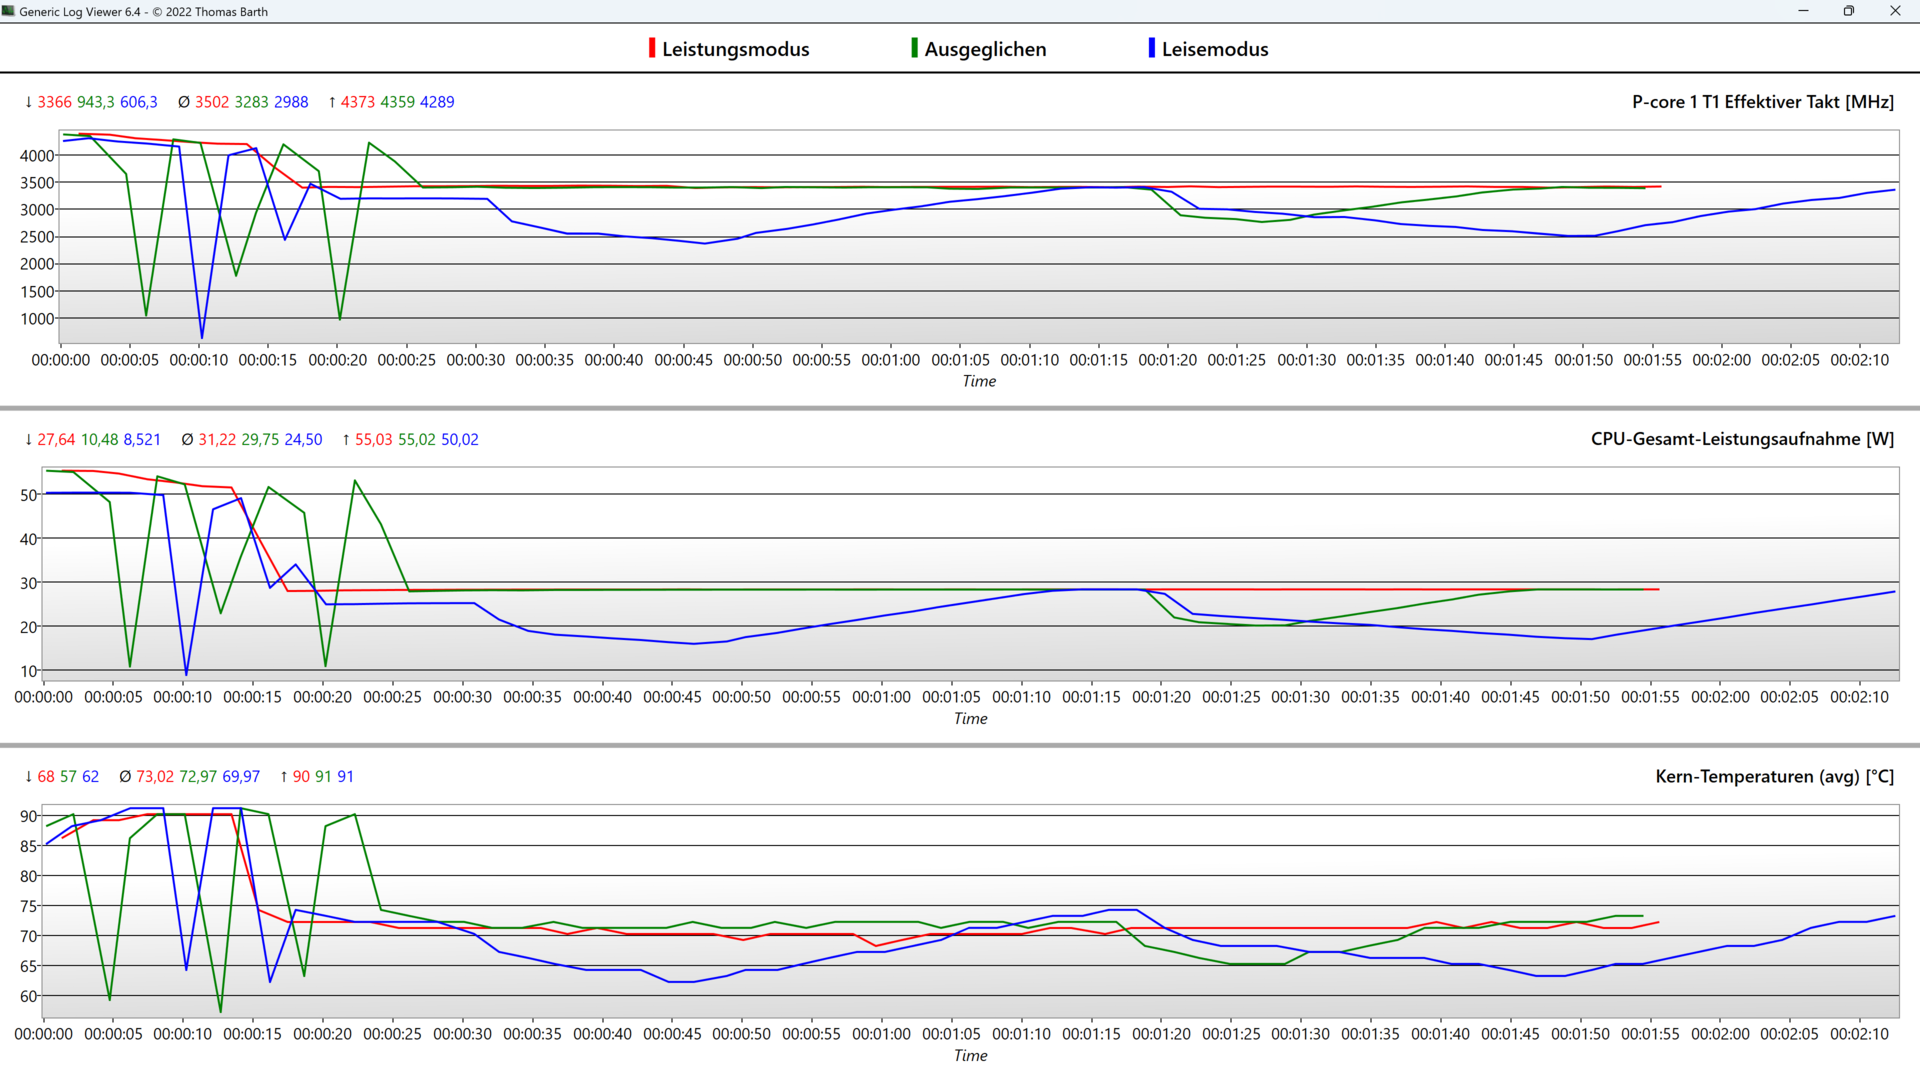
La lista y los gráficos siguientes muestran las diferencias en términos de límites de rendimiento de la CPU, mientras que el rendimiento de la GPU permanece siempre constante:
- Rendimiento: 55 vatios (PL2) > 28 vatios (PL1), tras 15 segundos.
- Normal: Fluctúa entre 10 y 55 vatios, se equilibra en 28 vatios (PL1) después de unos 25 segundos.
- Silencioso: Fluctúa más fuerte, 50 vatios durante 2 segundos, luego fluctúa continuamente entre 15 y 28 vatios en intervalos de 20 segundos - paralelo a esto es el comportamiento del ventilador.
- Batería: 19 vatios (PL2) > 15 vatios (PL1), después de 30 segundos.
Procesador
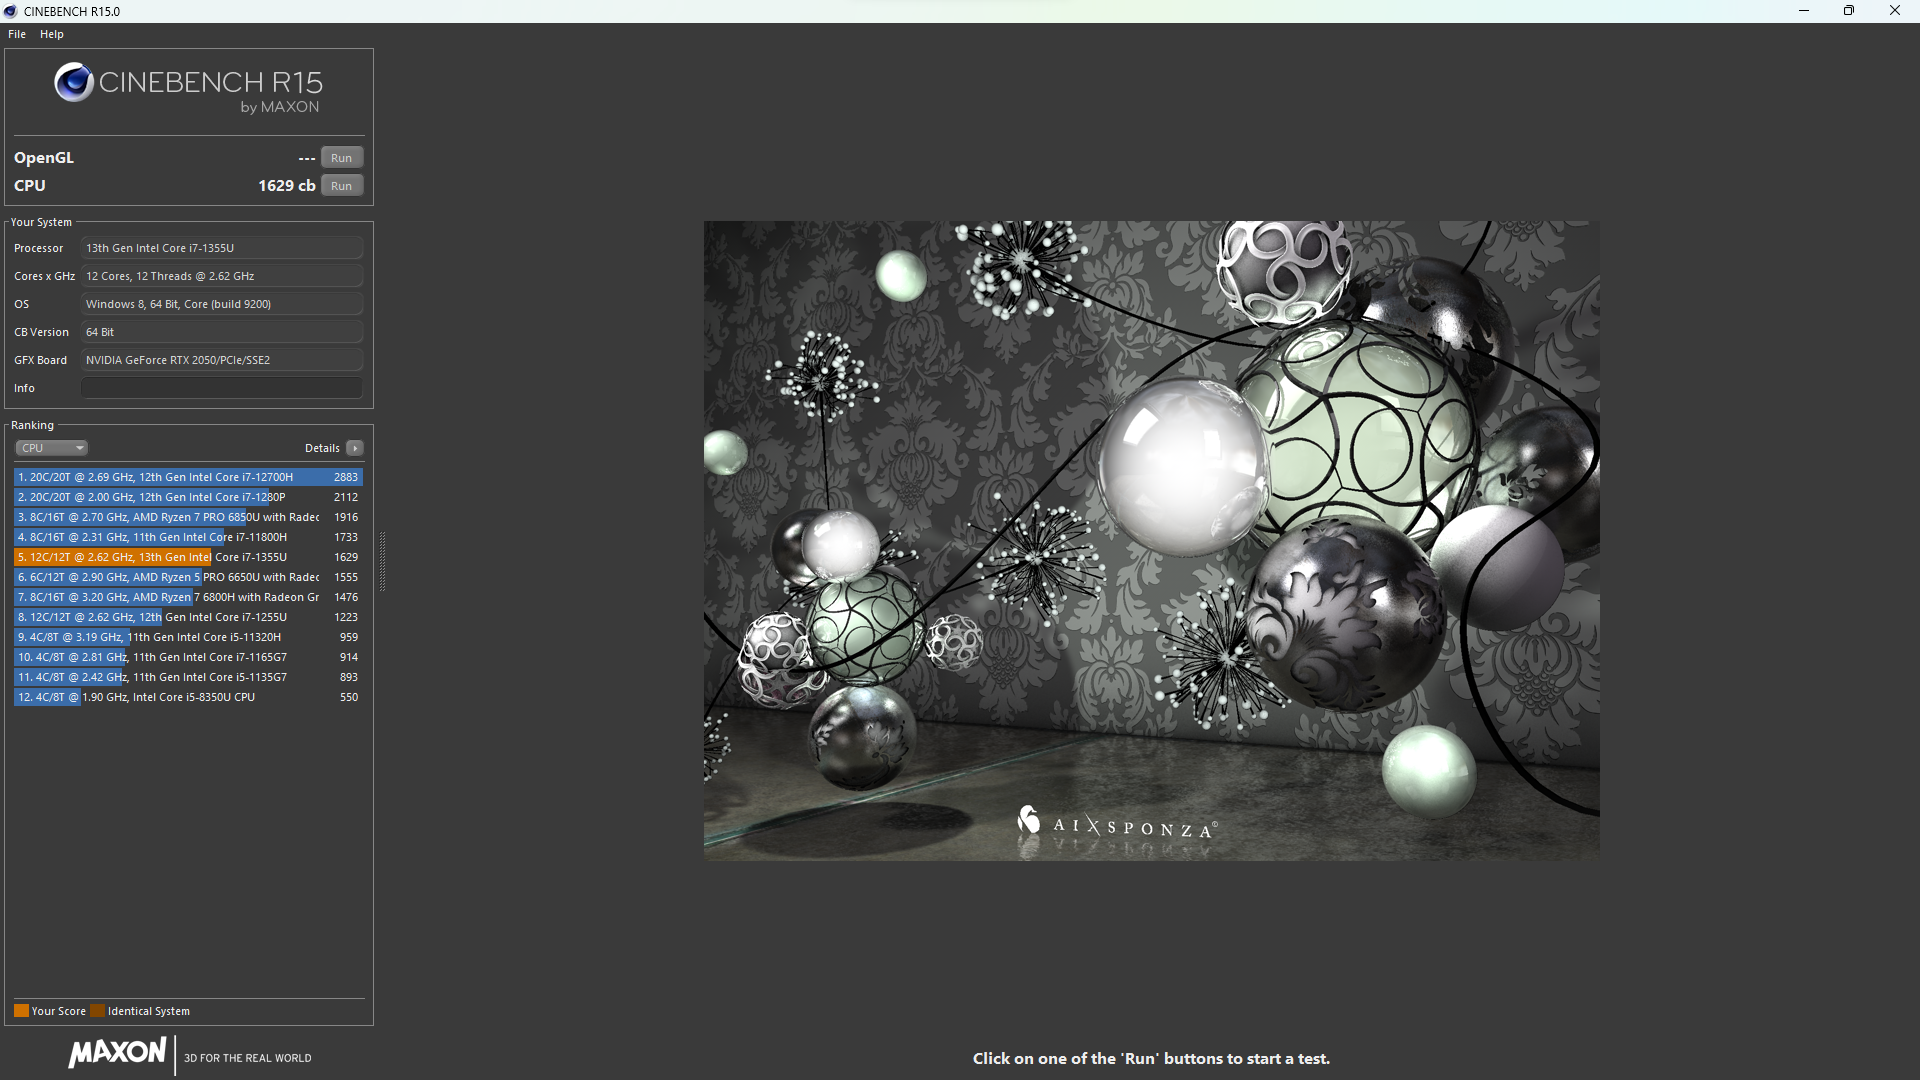
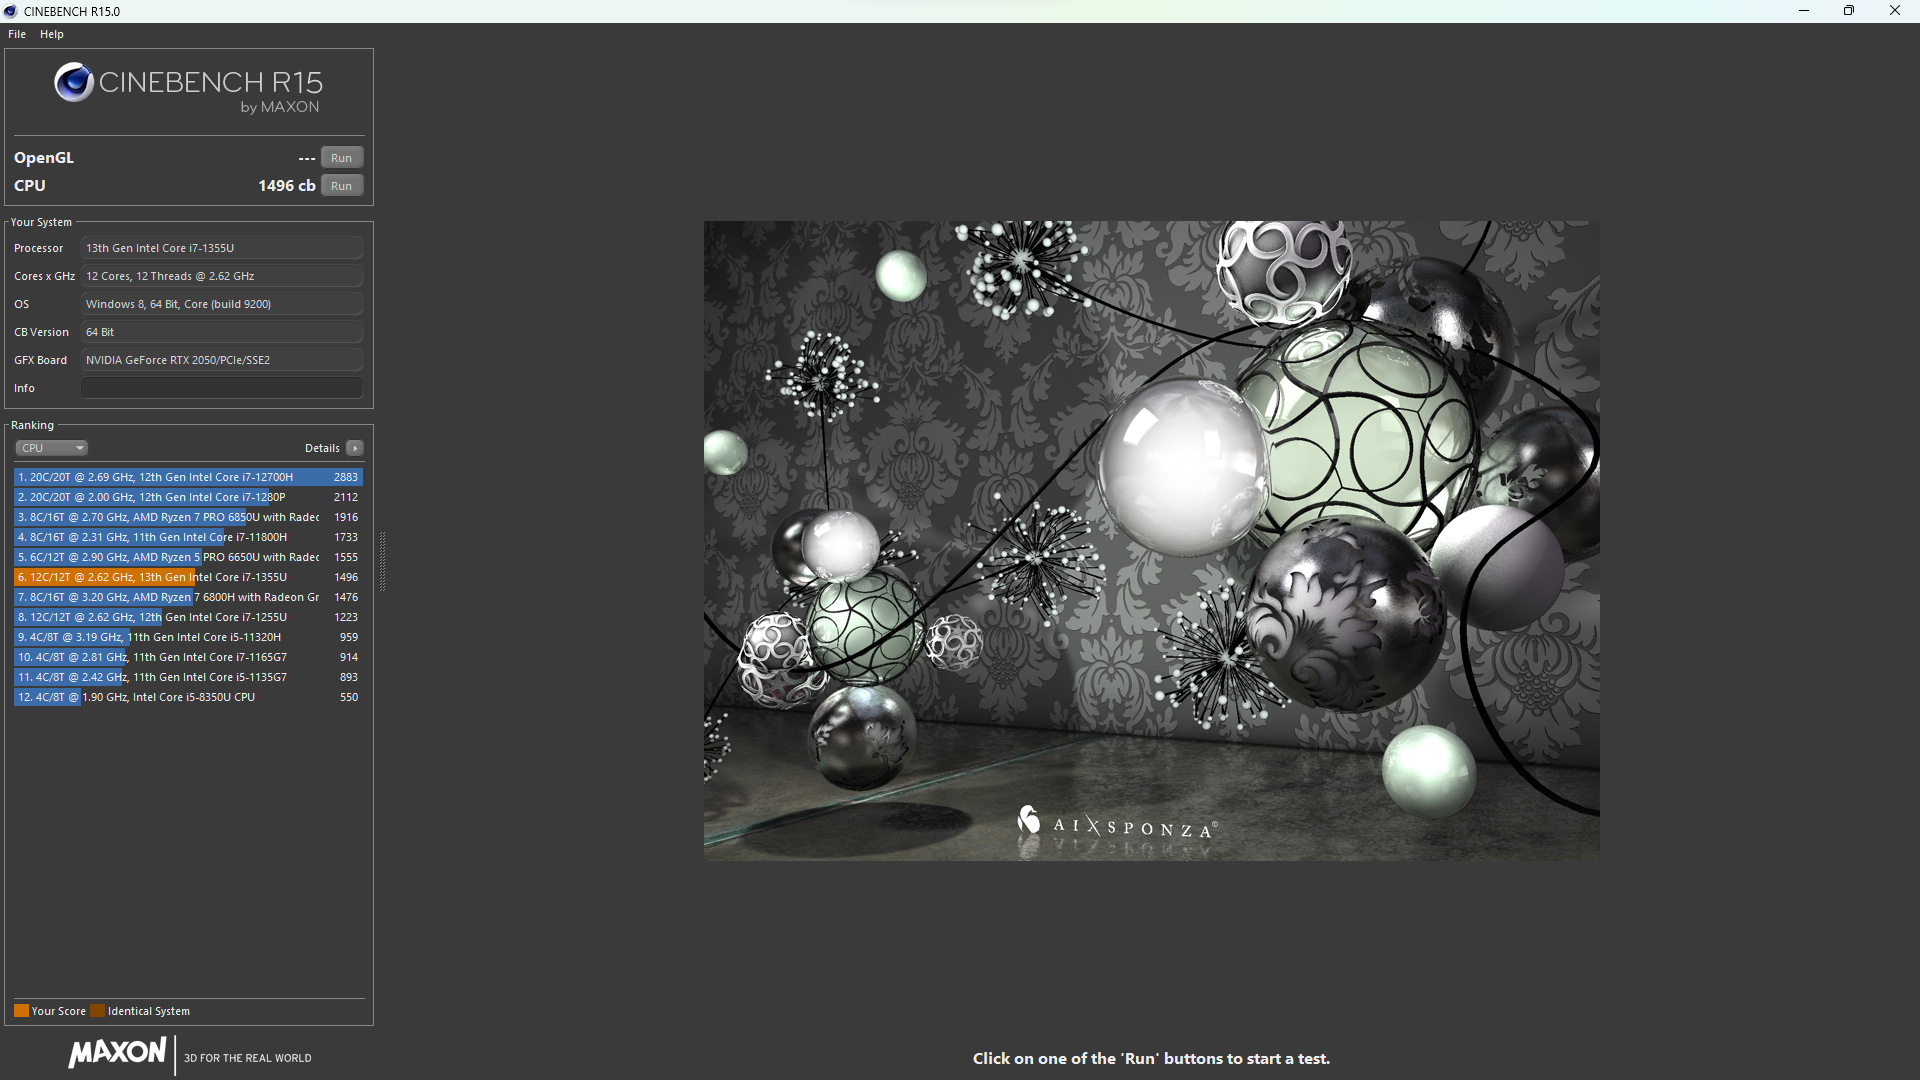
El procesador Intel instalado, el Core i7-1355U (2 núcleos P + 8 núcleos E) consume bastante energía, lo que quedó bien reflejado en nuestro bucle Cinebench R15:
Durante la primera ejecución, la CPU aún tenía acceso a 55 vatios, pero a partir de la segunda, el rendimiento ya cayó considerablemente. Esto llevó a que sólo alcanzara 930 puntos tras la tercera ronda en lugar de los 1.624 iniciales. Intel no es el único responsable de esto, ya que el normalmente potente sistema de refrigeración con dos ventiladores debería permitir que la CPU consumiera permanentemente 40 vatios o más. Su estrangulamiento a 28 vatios está fijado de forma bastante conservadora, ya que las temperaturas del núcleo sólo subieron a un máximo de 73 °C en nuestro bucle continuo.
Como resultado, su predecesor con un Intel Core i7-1260P fue un 40% más rápido bajo carga multi-core contínua - esto, por supuesto, no debería ser el caso. Sin embargo, nuestra valoración del rendimiento también mostró que ambos portátiles rindieron de forma similar cuando se trataba de tareas que no requerían una gran cantidad de tiempo para completarse.
Al final del día, los únicos portátiles que quedaron por delante del modelo de pruebas Aspire 5 fueron el Asus VivoBook S15 con su AMD Ryzen 7 6800H y los dos portátiles para juegos, el Asus TUF Gaming A15 y el Lenovo LOQ 15, ambos con CPU AMD HS AMD Ryzen 7 PRO 7840HS Processor - Benchmarks and Specs (TDP de 35 vatios). En términos de rendimiento mononúcleo puro, el Aspire 5 salió mejor parado en la mayoría de los casos.
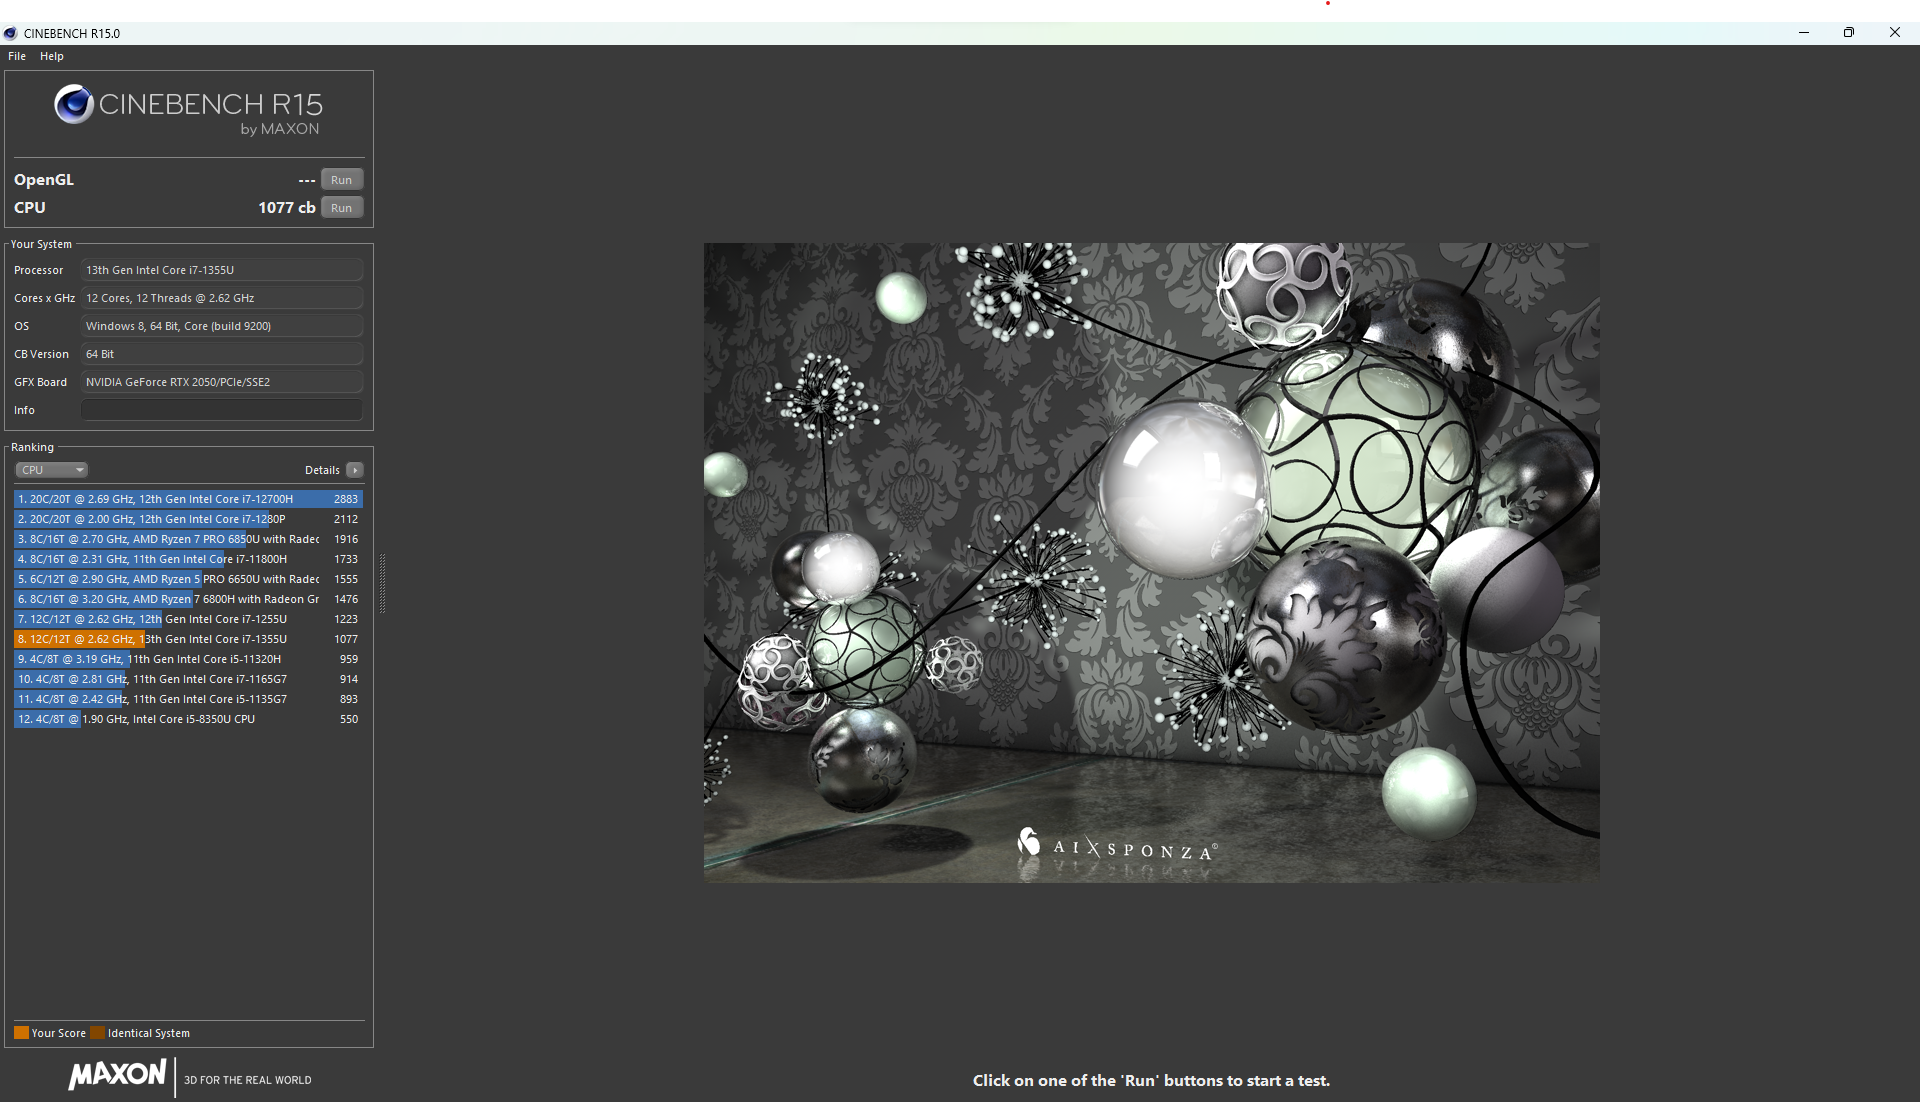
En modo batería, la CPU sólo tiene acceso a 15 vatios (PL1) y 19 vatios (PL2), lo que significa que su resultado se hundió hasta los 1.077 puntos.
Cinebench R15 Multi continuous test
Cinebench R23: Multi Core | Single Core
Cinebench R20: CPU (Multi Core) | CPU (Single Core)
Cinebench R15: CPU Multi 64Bit | CPU Single 64Bit
Blender: v2.79 BMW27 CPU
7-Zip 18.03: 7z b 4 | 7z b 4 -mmt1
Geekbench 5.5: Multi-Core | Single-Core
HWBOT x265 Benchmark v2.2: 4k Preset
LibreOffice : 20 Documents To PDF
R Benchmark 2.5: Overall mean
* ... más pequeño es mejor
AIDA64: FP32 Ray-Trace | FPU Julia | CPU SHA3 | CPU Queen | FPU SinJulia | FPU Mandel | CPU AES | CPU ZLib | FP64 Ray-Trace | CPU PhotoWorxx
| Performance rating | |
| Lenovo LOQ 15APH8 | |
| Asus VivoBook S15 M3502RA-L1029W | |
| Asus TUF A15 FA507 | |
| HP Envy x360 15-ey0023dx | |
| Media de la clase Office | |
| Dell Inspiron 15 5515-H8P8F | |
| Huawei MateBook D 15 Ryzen 5 5500U | |
| Lenovo IdeaPad 5 15ALC05 | |
| Acer Aspire 5 A515-58GM-76S8 | |
| Medio Intel Core i7-1355U | |
| Acer Aspire 5 A515-57G-53N8 | |
| AIDA64 / FP32 Ray-Trace | |
| Lenovo LOQ 15APH8 | |
| Asus TUF A15 FA507 | |
| Asus VivoBook S15 M3502RA-L1029W | |
| Media de la clase Office (2083 - 31245, n=83, últimos 2 años) | |
| HP Envy x360 15-ey0023dx | |
| Dell Inspiron 15 5515-H8P8F | |
| Huawei MateBook D 15 Ryzen 5 5500U | |
| Lenovo IdeaPad 5 15ALC05 | |
| Acer Aspire 5 A515-58GM-76S8 | |
| Medio Intel Core i7-1355U (5673 - 8424, n=18) | |
| Acer Aspire 5 A515-57G-53N8 | |
| AIDA64 / FPU Julia | |
| Lenovo LOQ 15APH8 | |
| Asus TUF A15 FA507 | |
| Asus VivoBook S15 M3502RA-L1029W | |
| HP Envy x360 15-ey0023dx | |
| Media de la clase Office (8191 - 125394, n=83, últimos 2 años) | |
| Dell Inspiron 15 5515-H8P8F | |
| Huawei MateBook D 15 Ryzen 5 5500U | |
| Lenovo IdeaPad 5 15ALC05 | |
| Acer Aspire 5 A515-58GM-76S8 | |
| Medio Intel Core i7-1355U (29580 - 42706, n=18) | |
| Acer Aspire 5 A515-57G-53N8 | |
| AIDA64 / CPU SHA3 | |
| Lenovo LOQ 15APH8 | |
| Asus TUF A15 FA507 | |
| Asus VivoBook S15 M3502RA-L1029W | |
| Media de la clase Office (433 - 5755, n=83, últimos 2 años) | |
| HP Envy x360 15-ey0023dx | |
| Acer Aspire 5 A515-58GM-76S8 | |
| Dell Inspiron 15 5515-H8P8F | |
| Medio Intel Core i7-1355U (1529 - 2200, n=18) | |
| Acer Aspire 5 A515-57G-53N8 | |
| Huawei MateBook D 15 Ryzen 5 5500U | |
| Lenovo IdeaPad 5 15ALC05 | |
| AIDA64 / CPU Queen | |
| Lenovo LOQ 15APH8 | |
| Asus TUF A15 FA507 | |
| Asus VivoBook S15 M3502RA-L1029W | |
| HP Envy x360 15-ey0023dx | |
| Dell Inspiron 15 5515-H8P8F | |
| Acer Aspire 5 A515-57G-53N8 | |
| Huawei MateBook D 15 Ryzen 5 5500U | |
| Lenovo IdeaPad 5 15ALC05 | |
| Acer Aspire 5 A515-58GM-76S8 | |
| Media de la clase Office (22784 - 115197, n=67, últimos 2 años) | |
| Medio Intel Core i7-1355U (21547 - 66907, n=18) | |
| AIDA64 / FPU SinJulia | |
| Lenovo LOQ 15APH8 | |
| Asus TUF A15 FA507 | |
| Asus VivoBook S15 M3502RA-L1029W | |
| Dell Inspiron 15 5515-H8P8F | |
| HP Envy x360 15-ey0023dx | |
| Huawei MateBook D 15 Ryzen 5 5500U | |
| Lenovo IdeaPad 5 15ALC05 | |
| Media de la clase Office (1378 - 18321, n=83, últimos 2 años) | |
| Acer Aspire 5 A515-57G-53N8 | |
| Acer Aspire 5 A515-58GM-76S8 | |
| Medio Intel Core i7-1355U (4045 - 5426, n=18) | |
| AIDA64 / FPU Mandel | |
| Lenovo LOQ 15APH8 | |
| Asus TUF A15 FA507 | |
| Asus VivoBook S15 M3502RA-L1029W | |
| HP Envy x360 15-ey0023dx | |
| Media de la clase Office (4601 - 66922, n=83, últimos 2 años) | |
| Dell Inspiron 15 5515-H8P8F | |
| Huawei MateBook D 15 Ryzen 5 5500U | |
| Lenovo IdeaPad 5 15ALC05 | |
| Acer Aspire 5 A515-58GM-76S8 | |
| Medio Intel Core i7-1355U (14596 - 21627, n=18) | |
| Acer Aspire 5 A515-57G-53N8 | |
| AIDA64 / CPU AES | |
| Asus VivoBook S15 M3502RA-L1029W | |
| HP Envy x360 15-ey0023dx | |
| Acer Aspire 5 A515-58GM-76S8 | |
| Lenovo LOQ 15APH8 | |
| Asus TUF A15 FA507 | |
| Dell Inspiron 15 5515-H8P8F | |
| Media de la clase Office (4854 - 155900, n=83, últimos 2 años) | |
| Huawei MateBook D 15 Ryzen 5 5500U | |
| Lenovo IdeaPad 5 15ALC05 | |
| Medio Intel Core i7-1355U (31432 - 75408, n=18) | |
| Acer Aspire 5 A515-57G-53N8 | |
| AIDA64 / CPU ZLib | |
| Lenovo LOQ 15APH8 | |
| Asus VivoBook S15 M3502RA-L1029W | |
| Media de la clase Office (114.6 - 1366, n=83, últimos 2 años) | |
| HP Envy x360 15-ey0023dx | |
| Acer Aspire 5 A515-57G-53N8 | |
| Asus TUF A15 FA507 | |
| Dell Inspiron 15 5515-H8P8F | |
| Acer Aspire 5 A515-58GM-76S8 | |
| Huawei MateBook D 15 Ryzen 5 5500U | |
| Medio Intel Core i7-1355U (454 - 684, n=18) | |
| Lenovo IdeaPad 5 15ALC05 | |
| AIDA64 / FP64 Ray-Trace | |
| Lenovo LOQ 15APH8 | |
| Asus TUF A15 FA507 | |
| Media de la clase Office (1109 - 17834, n=83, últimos 2 años) | |
| Asus VivoBook S15 M3502RA-L1029W | |
| HP Envy x360 15-ey0023dx | |
| Dell Inspiron 15 5515-H8P8F | |
| Huawei MateBook D 15 Ryzen 5 5500U | |
| Lenovo IdeaPad 5 15ALC05 | |
| Acer Aspire 5 A515-58GM-76S8 | |
| Medio Intel Core i7-1355U (2991 - 4453, n=18) | |
| Acer Aspire 5 A515-57G-53N8 | |
| AIDA64 / CPU PhotoWorxx | |
| Media de la clase Office (11090 - 65229, n=83, últimos 2 años) | |
| Medio Intel Core i7-1355U (21800 - 46154, n=18) | |
| Asus VivoBook S15 M3502RA-L1029W | |
| Asus TUF A15 FA507 | |
| Acer Aspire 5 A515-57G-53N8 | |
| Acer Aspire 5 A515-58GM-76S8 | |
| Lenovo LOQ 15APH8 | |
| Huawei MateBook D 15 Ryzen 5 5500U | |
| Lenovo IdeaPad 5 15ALC05 | |
| HP Envy x360 15-ey0023dx | |
| Dell Inspiron 15 5515-H8P8F | |
Rendimiento del sistema
En el uso diario, el portátil Acer es muy reactivo y superrápido. Especialmente su rendimiento mononúcleo así como su turbo boost de corta duración (hasta 55 vatios) contribuyen a ello.
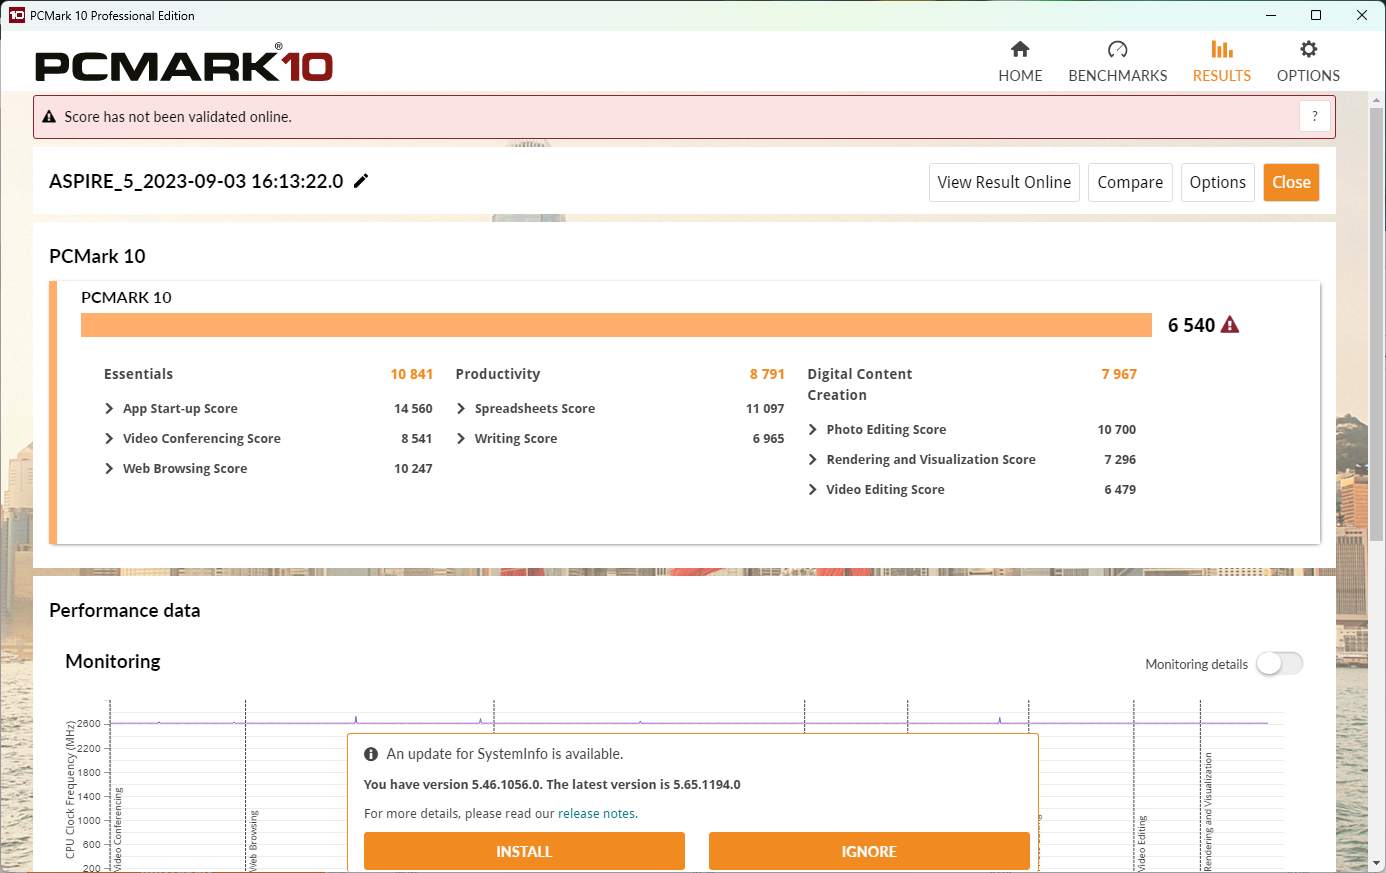
En consecuencia, sólo los dos portátiles para juegos y el Asus VivoBook S15 se situaron por encima del Aspire 5 en el benchmark PCMark 10, mientras que el mejor resultado se logró a menudo en benchmarks de navegación como WebXPRT 4.
CrossMark: Overall | Productivity | Creativity | Responsiveness
Mozilla Kraken 1.1: Total
Speedometer 2.0: Result 2.0
Jetstream 2: 2.0 Total
Octane V2: Total Score
WebXPRT 3: Overall
WebXPRT 4: Overall
| CrossMark / Overall | |
| Acer Aspire 5 A515-58GM-76S8 | |
| Asus VivoBook S15 M3502RA-L1029W | |
| Lenovo LOQ 15APH8 | |
| Asus TUF A15 FA507 | |
| Media de la clase Office (381 - 2010, n=75, últimos 2 años) | |
| HP Envy x360 15-ey0023dx | |
| Dell Inspiron 15 5515-H8P8F | |
| CrossMark / Productivity | |
| Acer Aspire 5 A515-58GM-76S8 | |
| Lenovo LOQ 15APH8 | |
| Asus VivoBook S15 M3502RA-L1029W | |
| Asus TUF A15 FA507 | |
| Media de la clase Office (464 - 1880, n=75, últimos 2 años) | |
| HP Envy x360 15-ey0023dx | |
| Dell Inspiron 15 5515-H8P8F | |
| CrossMark / Creativity | |
| Asus TUF A15 FA507 | |
| Asus VivoBook S15 M3502RA-L1029W | |
| Media de la clase Office (319 - 2361, n=75, últimos 2 años) | |
| Acer Aspire 5 A515-58GM-76S8 | |
| Lenovo LOQ 15APH8 | |
| HP Envy x360 15-ey0023dx | |
| Dell Inspiron 15 5515-H8P8F | |
| CrossMark / Responsiveness | |
| Acer Aspire 5 A515-58GM-76S8 | |
| Lenovo LOQ 15APH8 | |
| Asus VivoBook S15 M3502RA-L1029W | |
| Media de la clase Office (360 - 1820, n=75, últimos 2 años) | |
| Asus TUF A15 FA507 | |
| HP Envy x360 15-ey0023dx | |
| Dell Inspiron 15 5515-H8P8F | |
| Speedometer 2.0 / Result 2.0 | |
| Media de la clase Office (173 - 640, n=18, últimos 2 años) | |
| Acer Aspire 5 A515-58GM-76S8 | |
| Asus TUF A15 FA507 | |
| Jetstream 2 / 2.0 Total | |
| Media de la clase Office (126.6 - 483, n=21, últimos 2 años) | |
| Lenovo LOQ 15APH8 | |
| Acer Aspire 5 A515-58GM-76S8 | |
| Asus TUF A15 FA507 | |
| Asus VivoBook S15 M3502RA-L1029W | |
| HP Envy x360 15-ey0023dx | |
| Octane V2 / Total Score | |
| Media de la clase Office (49011 - 126830, n=20, últimos 2 años) | |
| Acer Aspire 5 A515-58GM-76S8 | |
| Asus TUF A15 FA507 | |
| Asus VivoBook S15 M3502RA-L1029W | |
| WebXPRT 4 / Overall | |
| Acer Aspire 5 A515-58GM-76S8 | |
| Lenovo LOQ 15APH8 | |
| Media de la clase Office (104.2 - 313, n=77, últimos 2 años) | |
| Asus VivoBook S15 M3502RA-L1029W | |
| Asus TUF A15 FA507 | |
| HP Envy x360 15-ey0023dx | |
* ... más pequeño es mejor
| PCMark 10 Score | 6540 puntos | |
ayuda | ||
| AIDA64 / Memory Latency | |
| Medio Intel Core i7-1355U (72.2 - 346, n=18) | |
| Media de la clase Office (7.6 - 162.9, n=76, últimos 2 años) | |
| Lenovo IdeaPad 5 15ALC05 | |
| Dell Inspiron 15 5515-H8P8F | |
| Huawei MateBook D 15 Ryzen 5 5500U | |
| HP Envy x360 15-ey0023dx | |
| Lenovo LOQ 15APH8 | |
| Asus VivoBook S15 M3502RA-L1029W | |
| Acer Aspire 5 A515-45-R4R1 | |
| Asus TUF A15 FA507 | |
| Acer Aspire 5 A515-58GM-76S8 | |
* ... más pequeño es mejor
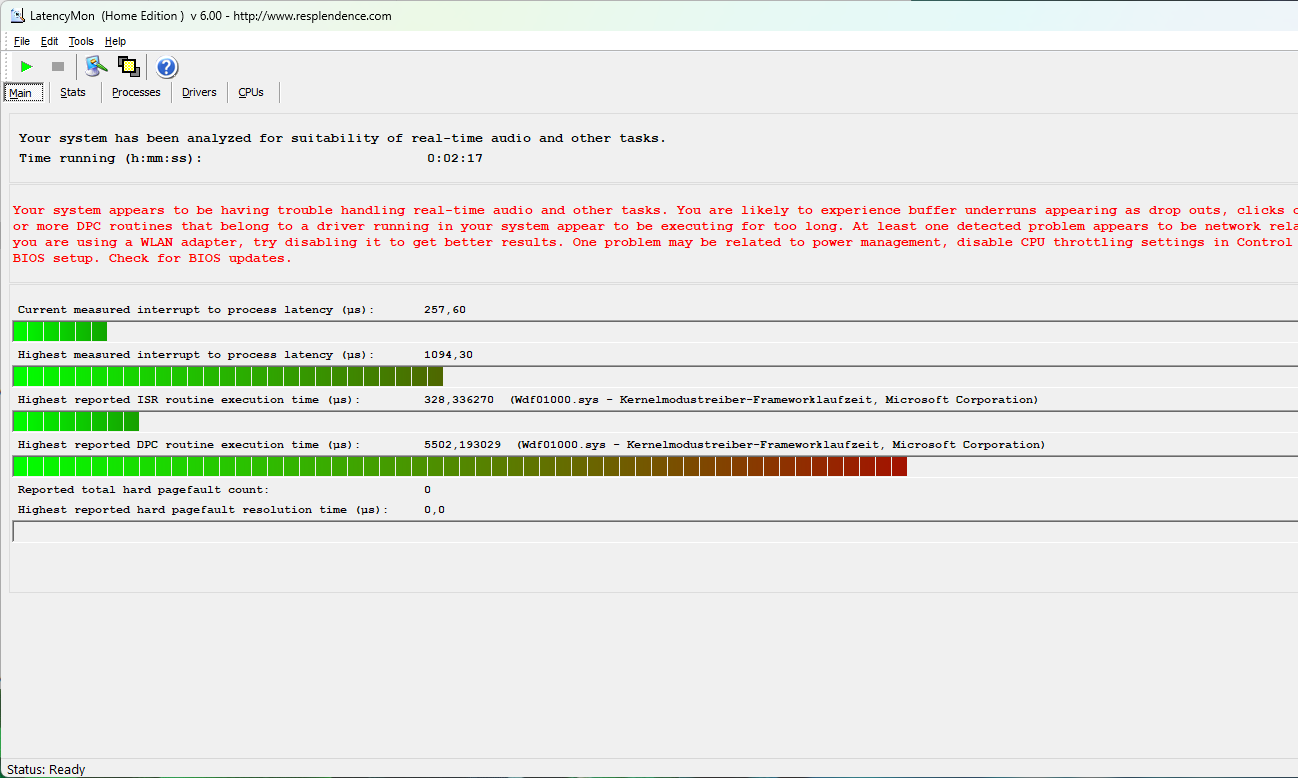
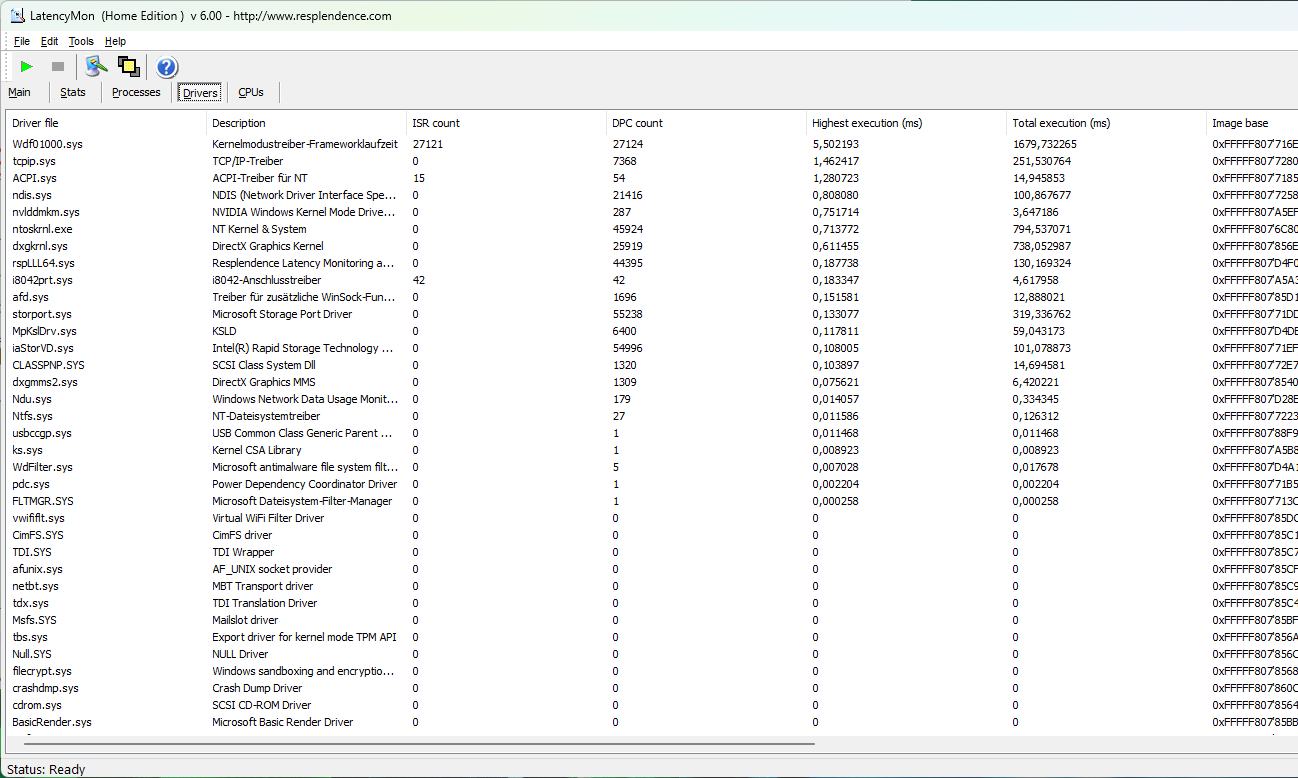
Latencia del CPD
Las altas latencias del CPD impiden el uso de software multimedia en tiempo real. Como ocurre con frecuencia, el controlador de módulos del kernel es el principal responsable de ellas. Las actualizaciones de la BIOS pueden mejorar o empeorar aún más el resultado.
| DPC Latencies / LatencyMon - interrupt to process latency (max), Web, Youtube, Prime95 | |
| Dell Inspiron 15 5515-H8P8F | |
| Acer Aspire 5 A515-57G-53N8 | |
| Lenovo LOQ 15APH8 | |
| Acer Aspire 5 A515-45-R4R1 | |
| HP Envy x360 15-ey0023dx | |
| Acer Aspire 5 A515-58GM-76S8 | |
| Huawei MateBook D 15 Ryzen 5 5500U | |
| Lenovo IdeaPad 5 15ALC05 | |
| Asus VivoBook S15 M3502RA-L1029W | |
* ... más pequeño es mejor
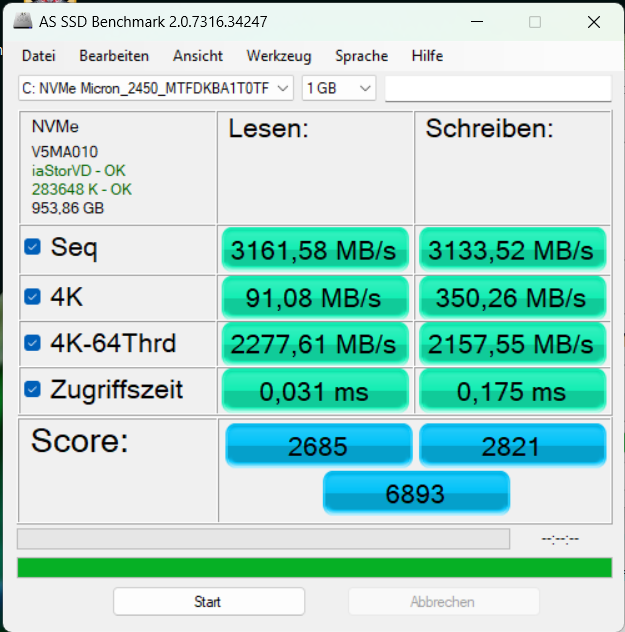
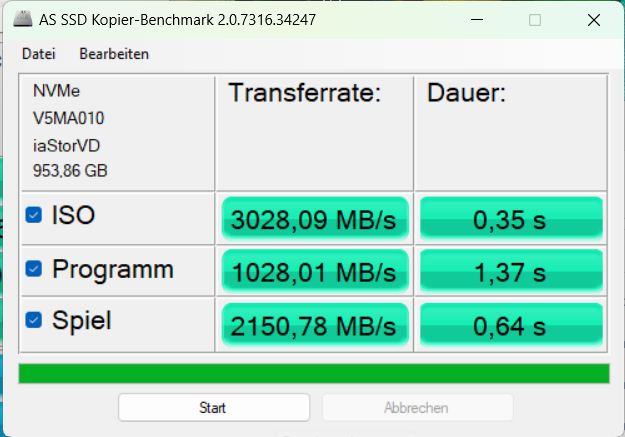
Dispositivos de almacenamiento
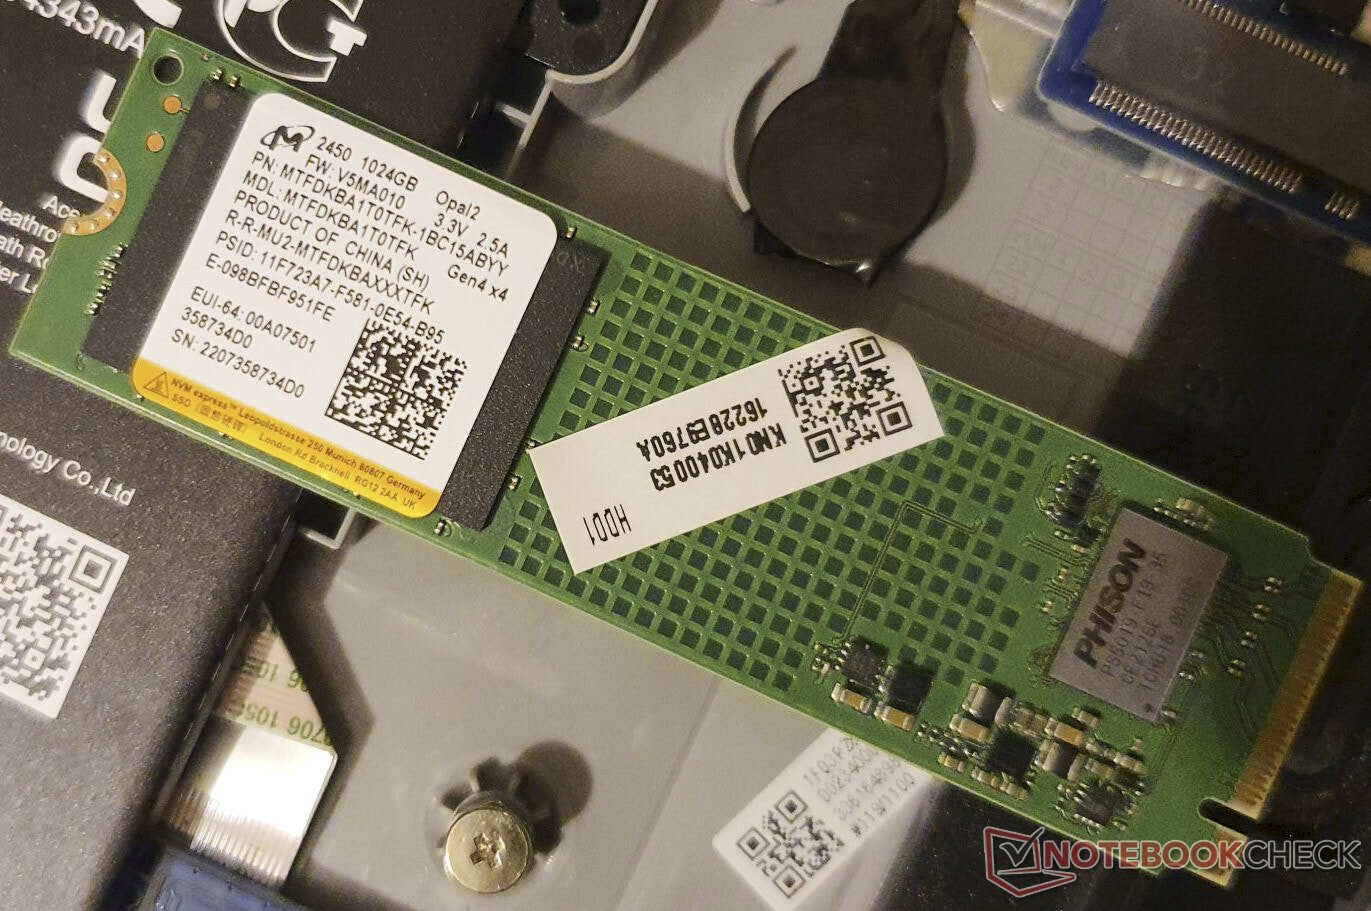
La unidad SSD M.2 2280 de 1 TB instalada, la Micron 2450, causa una impresión bastante buena en el portátil Acer: Alcanzó velocidades de transferencia ligeramente superiores a la media de hasta 3.161 MB/s durante la lectura secuencial en comparación con la media del estándar PCIe 3.0. Sus tasas de escritura de más de 3 GB/s también fueron mucho más rápidas que las de cualquiera de los competidores en nuestro campo de comparación. Además, sus valores 4K también fueron más que decentes.
Aunque el predecesor directo del portátil Análisis del portátil Acer Aspire 5 A515-57G: débil presentación de la RTX 2050 usa el mismo modelo de SSD, los resultados del modelo actual fueron muy superiores en muchas áreas - y eso incluso después de que el SSD del Aspire 5 más reciente se ralentizara térmicamente de forma periódica hacia el final de nuestro bucle de pruebas DiskSpd.
| Acer Aspire 5 A515-58GM-76S8 Micron 2450 1TB MTFDKBA1T0TFK | Acer Aspire 5 A515-57G-53N8 Micron 2450 512GB MTFDKBA512TFK | Lenovo IdeaPad 5 15ALC05 | Asus VivoBook S15 M3502RA-L1029W WD PC SN735 SDBPNHH-512G | Dell Inspiron 15 5515-H8P8F Toshiba KBG40ZNS512G NVMe | Lenovo LOQ 15APH8 Micron 2450 512GB MTFDKCD512TFK | |
|---|---|---|---|---|---|---|
| AS SSD | -39% | -57% | -53% | -94% | -100% | |
| Seq Read (MB/s) | 3161.58 | 3123.89 -1% | 2549 -19% | 2831 -10% | 1276 -60% | 2460.42 -22% |
| Seq Write (MB/s) | 3133.52 | 3008.29 -4% | 1571 -50% | 1092 -65% | 548.03 -83% | 721.73 -77% |
| 4K Read (MB/s) | 91.08 | 89.47 -2% | 41.92 -54% | 35.43 -61% | 33.31 -63% | 38.16 -58% |
| 4K Write (MB/s) | 350.26 | 277.46 -21% | 110.3 -69% | 115.95 -67% | 70.44 -80% | 203.12 -42% |
| 4K-64 Read (MB/s) | 2277.61 | 1360.83 -40% | 1086 -52% | 817 -64% | 662.17 -71% | 597.83 -74% |
| 4K-64 Write (MB/s) | 2157.55 | 1446.04 -33% | 1083 -50% | 1522 -29% | 608.11 -72% | 788.8 -63% |
| Access Time Read * (ms) | 0.031 | 0.106 -242% | 0.119 -284% | 0.083 -168% | 0.169 -445% | 0.083 -168% |
| Access Time Write * (ms) | 0.175 | 0.168 4% | 0.034 81% | 0.132 25% | 0.219 -25% | 1.028 -487% |
| Score Read (Points) | 2685 | 1763 -34% | 1383 -48% | 1136 -58% | 823 -69% | 882 -67% |
| Score Write (Points) | 2821 | 2024 -28% | 1351 -52% | 1747 -38% | 733 -74% | 1064 -62% |
| Score Total (Points) | 6893 | 4707 -32% | 3398 -51% | 3381 -51% | 1948 -72% | 2319 -66% |
| Copy ISO MB/s (MB/s) | 3028.09 | 1286 -58% | 662.31 -78% | 993.21 -67% | ||
| Copy Program MB/s (MB/s) | 1028.01 | 574 -44% | 448.05 -56% | 434.34 -58% | ||
| Copy Game MB/s (MB/s) | 2150.78 | 1133 -47% | 560.84 -74% | 342.01 -84% | ||
| DiskSpd | -70% | -46% | -37% | -58% | -45% | |
| seq read (MB/s) | 2253 | 756 -66% | 1684 -25% | 2220 -1% | 1536 -32% | 1773 -21% |
| seq write (MB/s) | 3392 | 830 -76% | 1498 -56% | 1923 -43% | 1331 -61% | 2177 -36% |
| seq q8 t1 read (MB/s) | 3538 | 1023 -71% | 2659 -25% | 3595 2% | 2181 -38% | 2594 -27% |
| seq q8 t1 write (MB/s) | 3410 | 934 -73% | 1603 -53% | 1956 -43% | 1409 -59% | 2404 -30% |
| 4k q1 t1 read (MB/s) | 70.3 | 18.6 -74% | 46 -35% | 47 -33% | 37.9 -46% | 42.6 -39% |
| 4k q1 t1 write (MB/s) | 429 | 221 -48% | 128 -70% | 174.7 -59% | 94.5 -78% | 166.4 -61% |
| 4k q32 t16 read (MB/s) | 1846 | 416 -77% | 1068 -42% | 1282 -31% | 701 -62% | 705 -62% |
| 4k q32 t16 write (MB/s) | 3254 | 923 -72% | 1174 -64% | 407 -87% | 306 -91% | 414 -87% |
| Media total (Programa/Opciones) | -55% /
-52% | -52% /
-53% | -45% /
-46% | -76% /
-81% | -73% /
-80% |
* ... más pequeño es mejor
* ... más pequeño es mejor
Reading continuous performance: DiskSpd Read Loop, Queue Depth 8
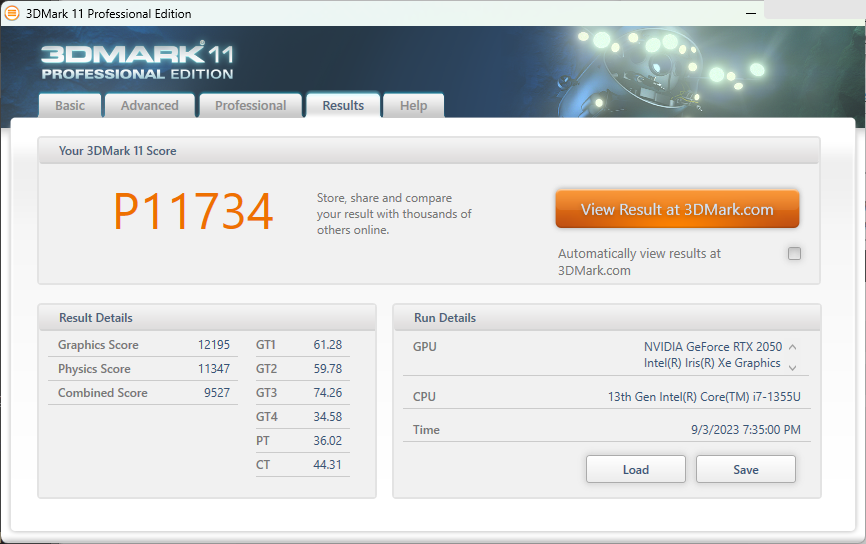
Tarjeta gráfica

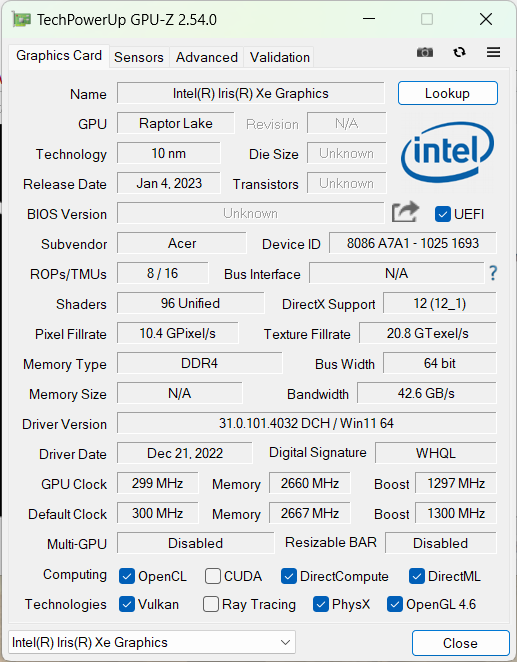
Acer ha dotado al Aspire 5 A515-58GM de una NvidiaRTX 2050 Mobile con 4 GB de VRAM GDDR6 que, a diferencia de laRTX 3050 Mobileestá limitada a 64 bits. El generalmente similarMX570sólo tiene 2 GB de VRAM. También es interesante que Acer limite el TGP a 35 vatios (frente a los 30 vatios que indica el fabricante, que sólo se refiere al uso de la batería).
Esta decisión hace que la RTX 2050 sea hasta un 20 % más lenta que en elThinkBook 16 G4+a 60 vatios y se hace casi imposible distinguirse de unaGTX 1650.
| 3DMark 06 Standard Score | 40490 puntos | |
| 3DMark Vantage P Result | 40973 puntos | |
| 3DMark 11 Performance | 11734 puntos | |
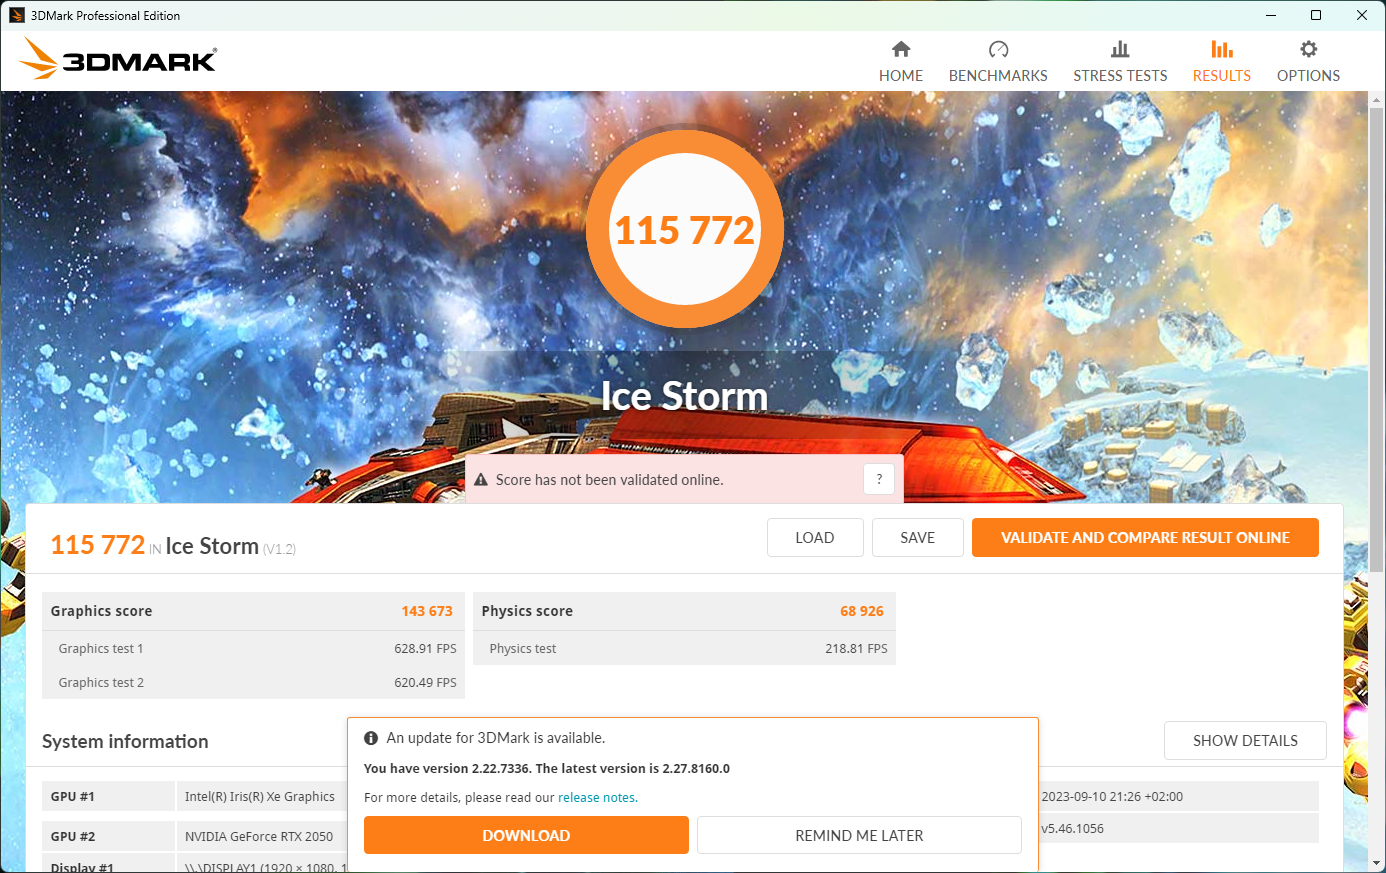
| 3DMark Ice Storm Standard Score | 115772 puntos | |
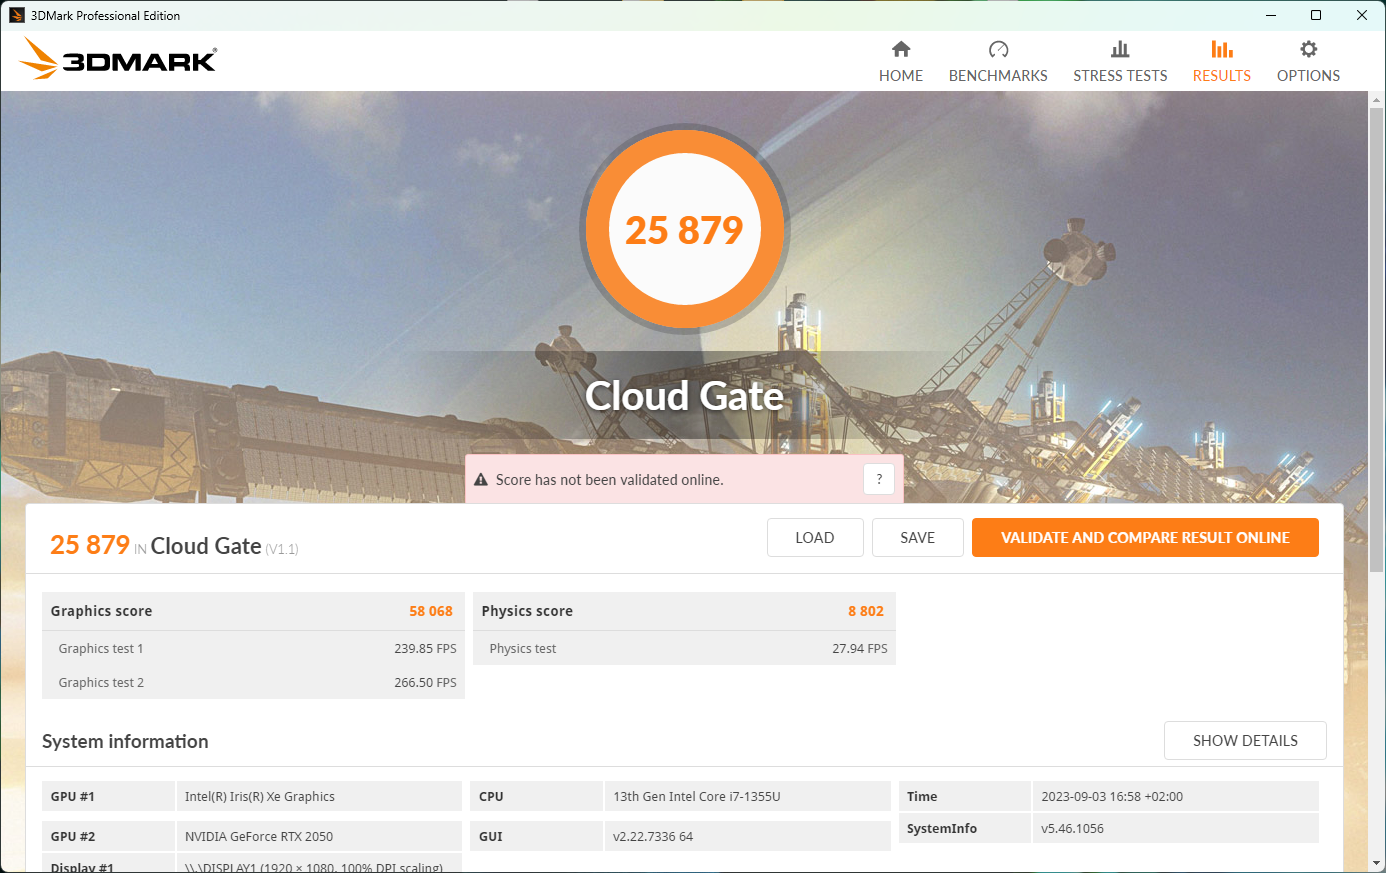
| 3DMark Cloud Gate Standard Score | 25879 puntos | |
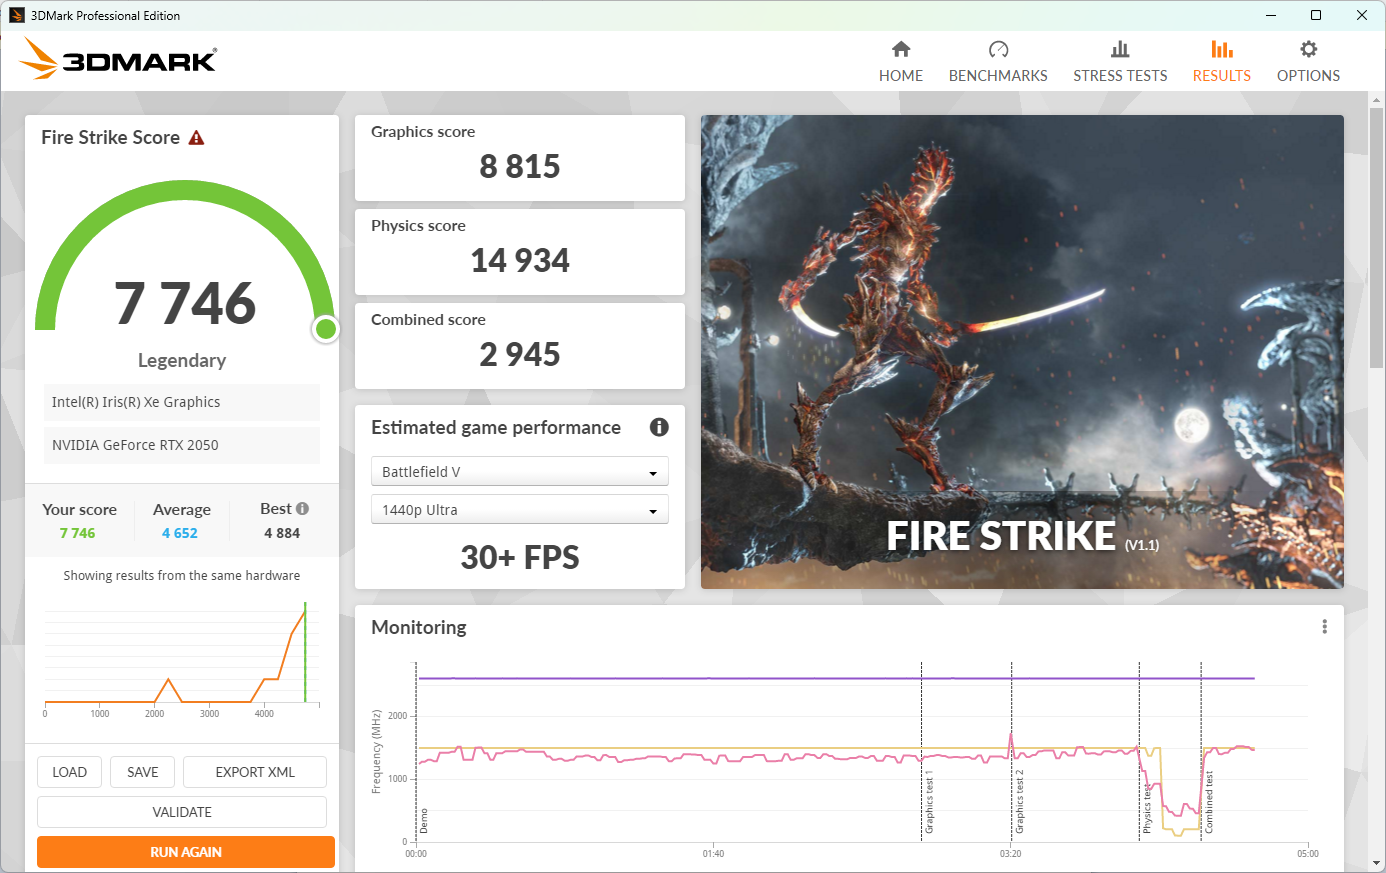
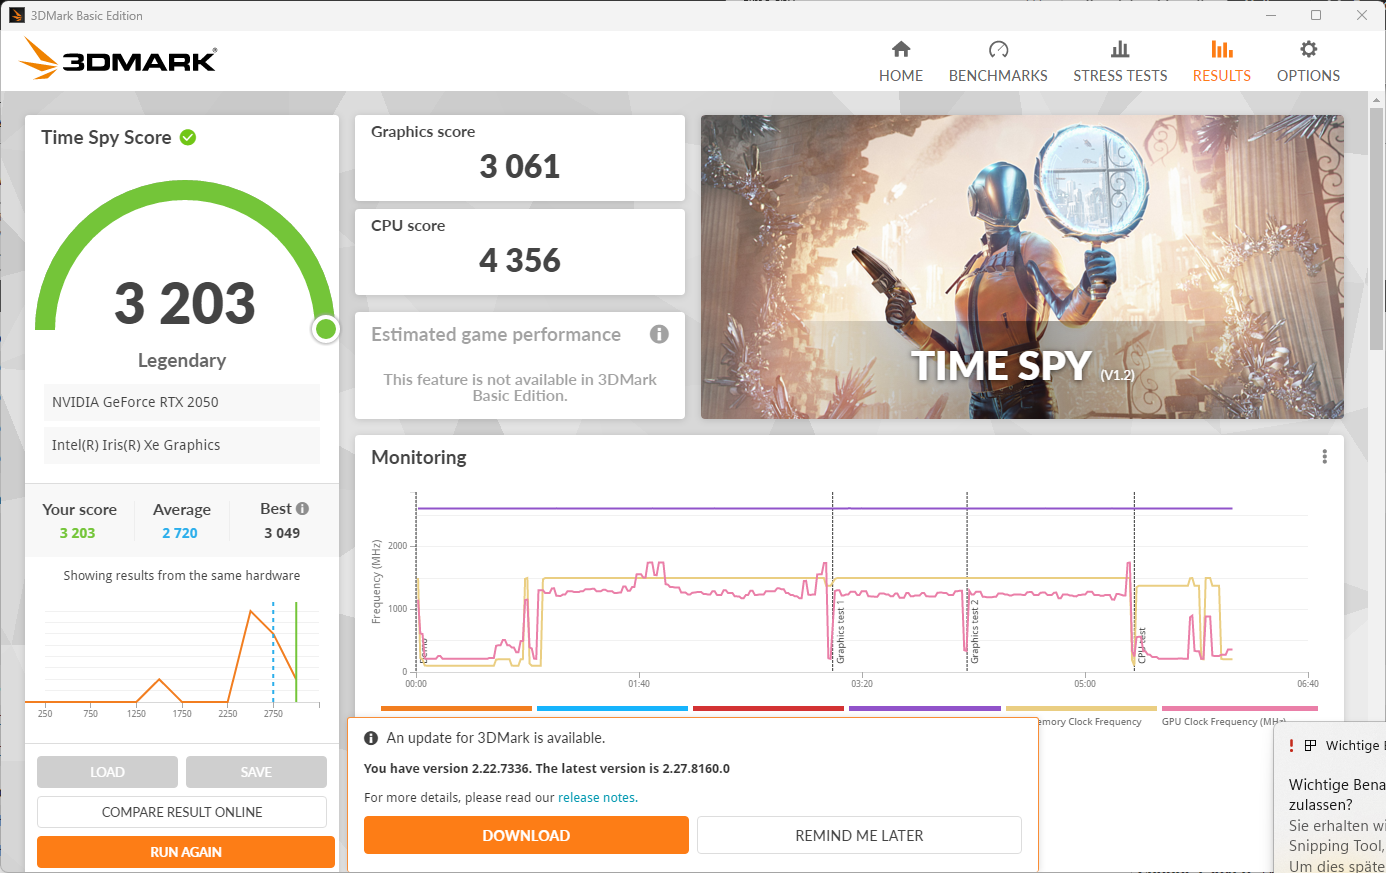
| 3DMark Fire Strike Score | 7746 puntos | |
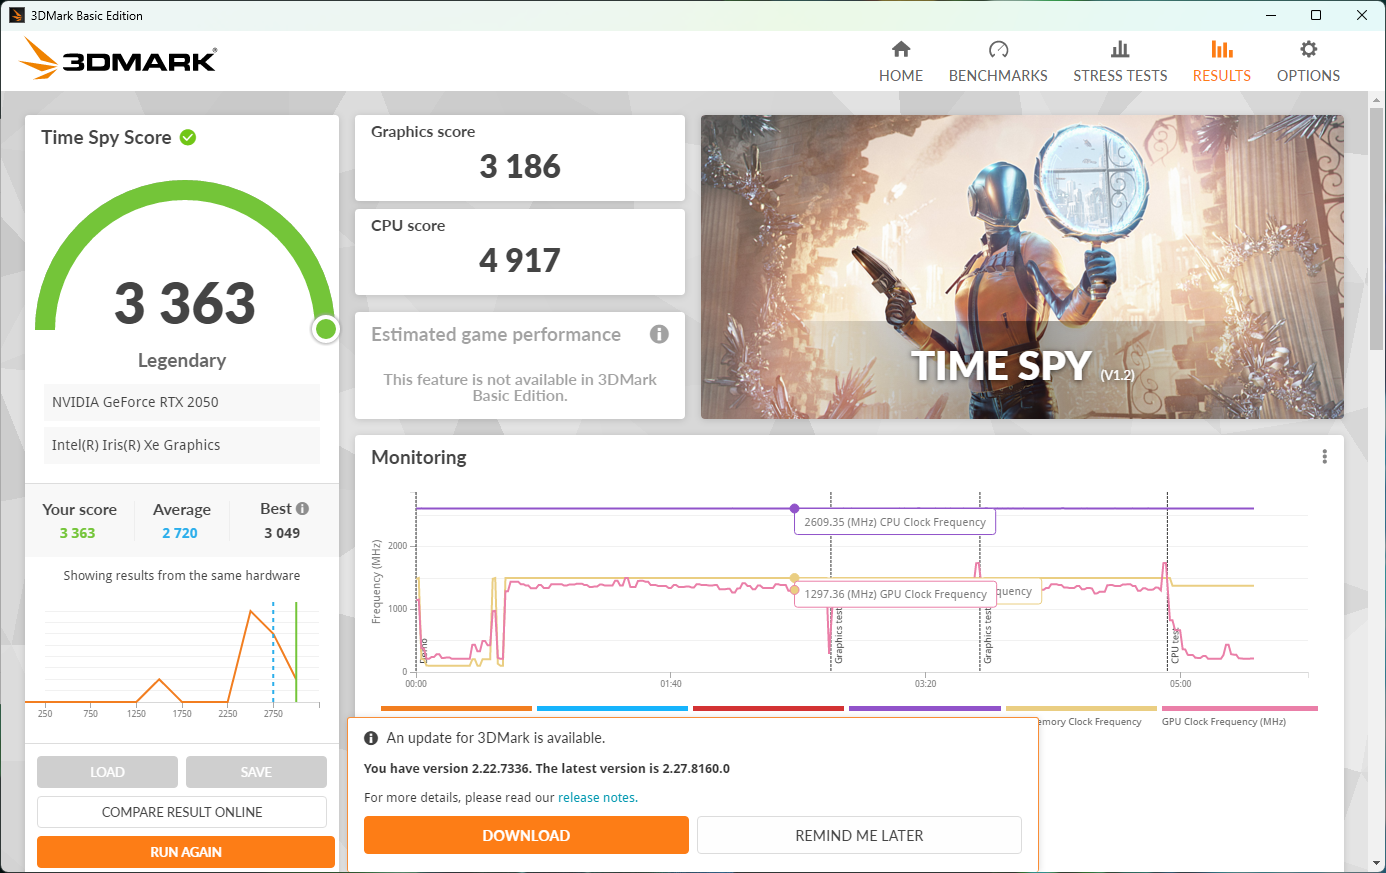
| 3DMark Time Spy Score | 3363 puntos | |
ayuda | ||
| Geekbench 6.0 | |
| GPU Vulkan 6.0 | |
| Asus ROG Zephyrus G14 GA402XY | |
| Acer Aspire 5 A515-58GM-76S8 | |
| GPU OpenCL 6.0 | |
| Acer Aspire 5 A515-58GM-76S8 | |
| Asus ROG Zephyrus G14 GA402XY | |
* ... más pequeño es mejor
Rendimiento de juego
La diferencia entre laRTX 3050 a 75 vatios y laRTX 2050 a 35 vatios que se encuentra en el Aspire 5 es del 50 %. Aunque la RTX 3050 no funciona más rápido a 40 vatios en Acer Swift X SFX16. En cambio, la GeForce MX550 yMX570 (2 GB de VRAM cada uno) son ligeramente más lentos con el mismo TGP, por lo que la decisión de no confiar en una GPU MX, como hacen muchos otros portátiles todoterreno, es comprensible.
Sin embargo, en vista del fuerte sobreprecio del Aspire 5, unaRTX 3050 Ti o incluso unaRTX 4050 con un TGP más alto habría tenido mucho más sentido, mientras que una variante más barata con unaRadeon 680M o780M habría sido sin duda más atractiva. Esta solución de GPU sería un 38 % más lenta, pero seguiría ofreciendo suficiente rendimiento multimedia con una relación precio-rendimiento mucho mejor.
En general, la RTX 2050 puede renderizar con fluidez juegos más recientes a niveles de detalle medios y resolución FHD nativa. Sin embargo, ya no es suficiente para juegos muy exigentes, lo que además se debe a la escasa VRAM. Puedes encontrar y comparar más pruebas de juego de la RTX 2050 en en nuestra sección de tecnología.
Witcher 3 FPS diagram
| bajo | medio | alto | ultra | |
|---|---|---|---|---|
| GTA V (2015) | 157.7 | 151.7 | 91.8 | 45.4 |
| The Witcher 3 (2015) | 72.1 | 59.1 | 34 | |
| Dota 2 Reborn (2015) | 150.3 | 113.9 | 109.9 | 104.2 |
| Final Fantasy XV Benchmark (2018) | 94 | 49.9 | 35.3 | |
| X-Plane 11.11 (2018) | 99 | 86.5 | 71.8 | |
| Strange Brigade (2018) | 173 | 75.7 | 62.6 | 54.6 |
| God of War (2022) | 59.5 | 44.6 | 26.5 | |
| F1 22 (2022) | 107.4 | 93.4 | 68.5 | 21.1 |
| Hogwarts Legacy (2023) | 34.5 | 25.9 | 18.6 | |
| Returnal (2023) | 34.6 | 30.8 | 24.1 | |
| Atomic Heart (2023) | 48.7 | 29.5 | 29.1 | |
| Sons of the Forest (2023) | 35.9 | 34.1 | 33 | |
| Star Wars Jedi Survivor (2023) | 21.8 | 20.1 | 19.1 | |
| Ratchet & Clank Rift Apart (2023) | 18.8 | 17.9 | 16.7 | |
| Atlas Fallen (2023) | 52.2 | 42.9 | 29.7 | |
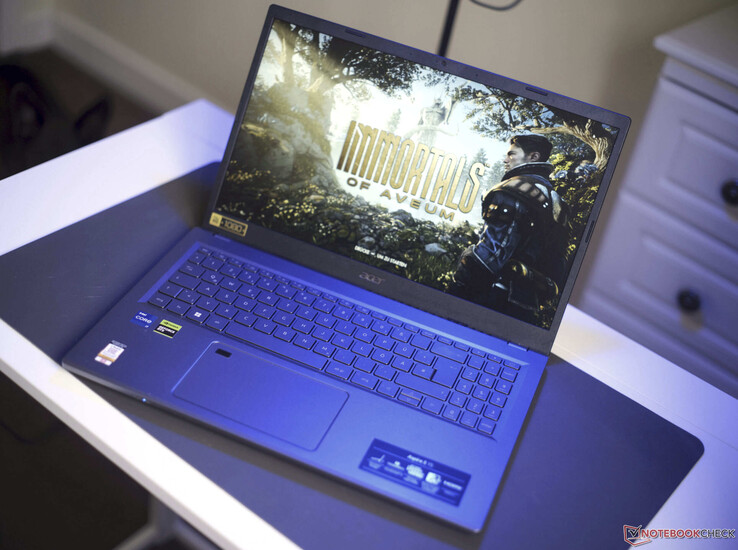
| Immortals of Aveum (2023) | 22.7 | 17 | 14.3 | |
| Armored Core 6 (2023) | 42.6 | 35.9 | 32 | 29.6 |
| Baldur's Gate 3 (2023) | 35.8 | 30 | 28 |
Emisiones: Los ventiladores del portátil Acer están casi siempre activos
Emisiones sonoras
Los ventiladores ya empiezan a girar en el uso de oficina o al cargar cualquier sitio web. Dependiendo del modo de rendimiento elegido, las emisiones de ruido pueden aumentar un poco o permanecer bastante silenciosas. En modo normal (equilibrado), medimos 32 dB(A) bajo carga media y 46.7 dB(A) jugando.
Esto hace que el Aspire 5 A515-58GM sea incluso más ruidoso que los portátiles para juegosLenovo LOQ 15y AsusTUF Gaming A15que incorporan GPUs más potentes, ya que cuentan con mejores sistemas de refrigeración. ElHP Envy x360 15sigue siendo el más silencioso de nuestra comparativa.
El Aspire 5 del año pasadocon la misma GPU fue un poco más silencioso al jugar (42 dB(A)) pero se volvió mucho más ruidoso bajo carga pura de CPU así como en modo inactivo. También notamos que la velocidad del ventilador fluctuaba mucho bajo carga permanente de CPU en modo silencioso (ver sección "condiciones de prueba"). El bajo tono de los ventiladores es bastante agradable y otro aspecto positivo es que no notamos ningún otro ruido electrónico en nuestro modelo de pruebas.
Ruido
| Ocioso |
| 26.3 / 26.3 / 26.3 dB(A) |
| Carga |
| 32.5 / 49 dB(A) |
 | ||
30 dB silencioso 40 dB(A) audible 50 dB(A) ruidosamente alto |
||
min: | ||
| Acer Aspire 5 A515-58GM-76S8 i7-1355U, GeForce RTX 2050 Mobile | Asus TUF A15 FA507 R7 7735HS, GeForce RTX 4050 Laptop GPU | Lenovo LOQ 15APH8 R7 7840HS, GeForce RTX 4050 Laptop GPU | HP Envy x360 15-ey0023dx R7 5825U, Vega 8 | Dell Inspiron 15 5515-H8P8F R7 5700U, Vega 8 | Lenovo IdeaPad 5 15ALC05 R5 5500U, Vega 7 | Asus VivoBook S15 M3502RA-L1029W R7 6800H, Radeon 680M | Acer Aspire 5 A515-57G-53N8 i5-1240P, GeForce RTX 2050 Mobile | |
|---|---|---|---|---|---|---|---|---|
| Noise | 10% | -1% | 14% | 4% | -1% | -19% | -7% | |
| apagado / medio ambiente * (dB) | 25.04 | 23.3 7% | 23.1 8% | 22.7 9% | 25.4 -1% | 26 -4% | 26 -4% | 25 -0% |
| Idle Minimum * (dB) | 26.3 | 23.3 11% | 23.1 12% | 22.7 14% | 25.4 3% | 26 1% | 26 1% | 25 5% |
| Idle Average * (dB) | 26.3 | 23.3 11% | 23.1 12% | 22.7 14% | 25.4 3% | 26 1% | 26 1% | 29 -10% |
| Idle Maximum * (dB) | 26.3 | 23.3 11% | 25.2 4% | 22.7 14% | 25.4 3% | 26 1% | 28.1 -7% | 31 -18% |
| Load Average * (dB) | 32.5 | 29.6 9% | 44.3 -36% | 23.3 28% | 34 -5% | 42.6 -31% | 56.9 -75% | 46 -42% |
| Witcher 3 ultra * (dB) | 46.7 | 43 8% | 45.8 2% | 43.4 7% | 42 10% | |||
| Load Maximum * (dB) | 49 | 43 12% | 52 -6% | 43.4 11% | 40 18% | 37.4 24% | 62.6 -28% | 47 4% |
* ... más pequeño es mejor
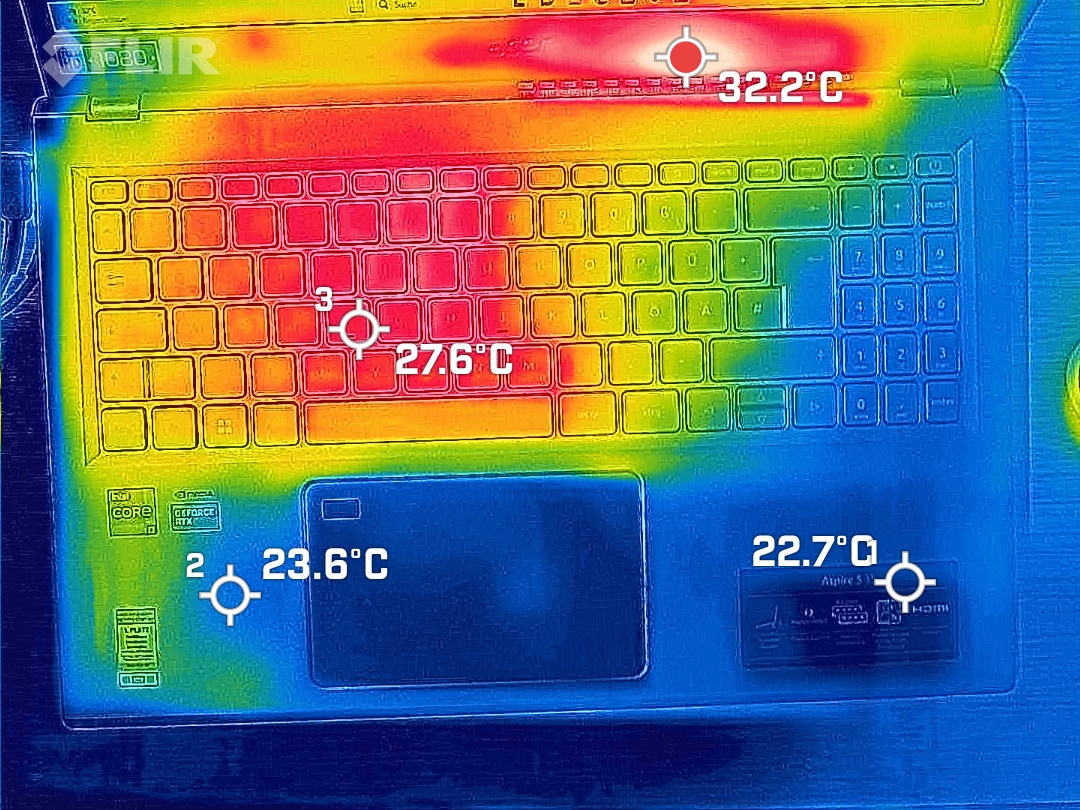
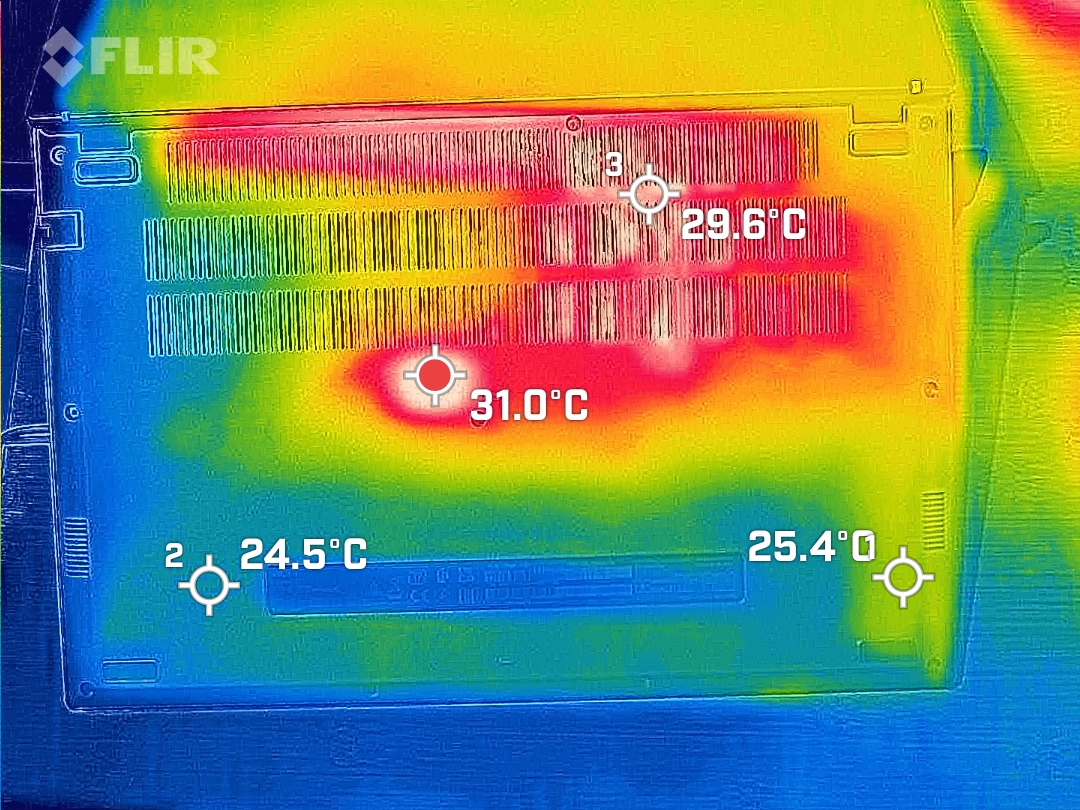
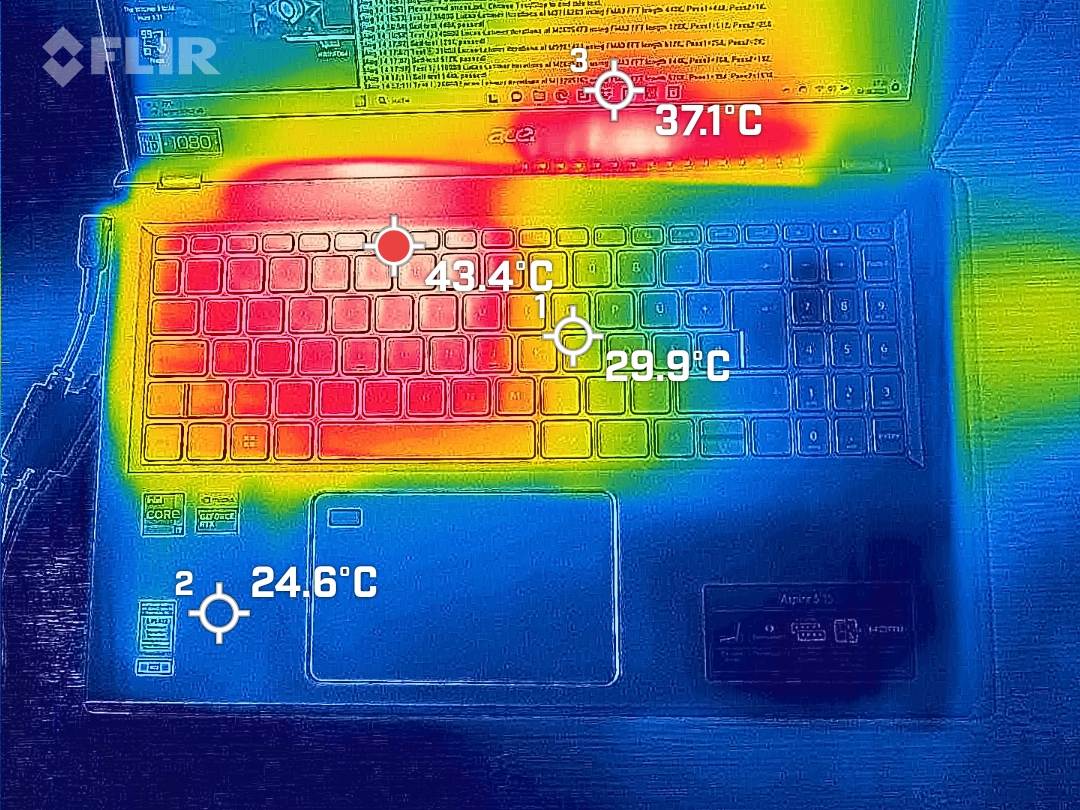
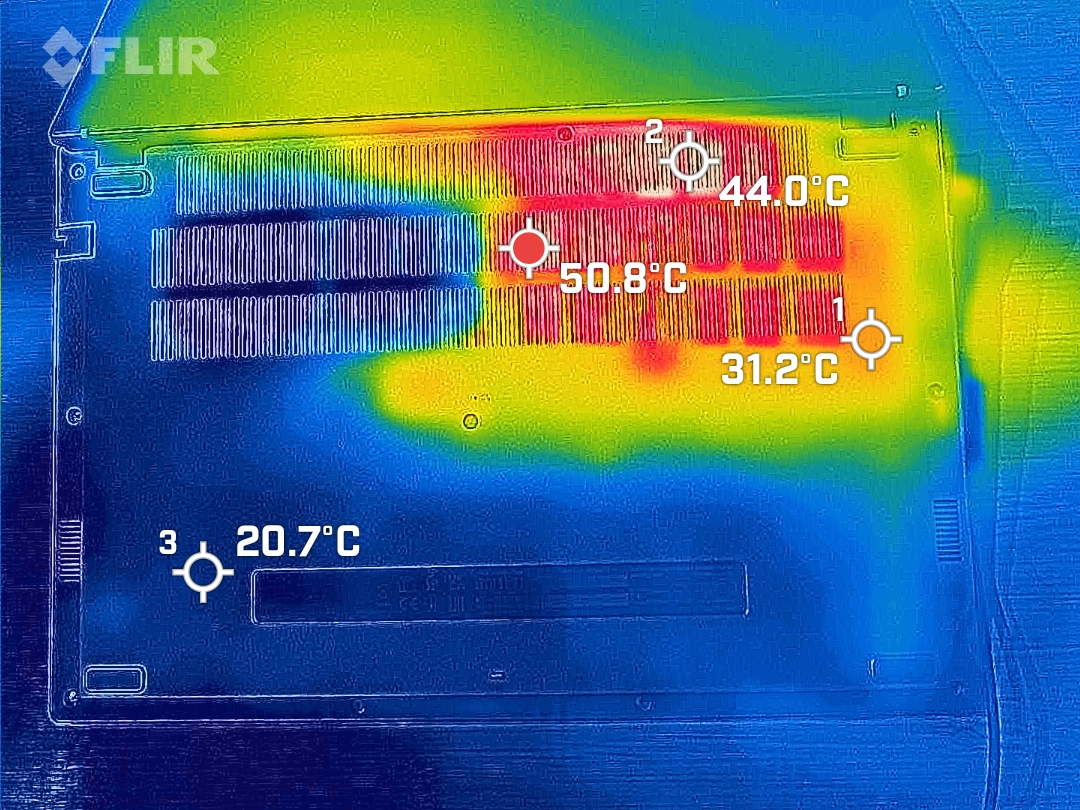
Temperatura
Una ventaja de los ventiladores giratorios son las bajas temperaturas superficiales, muy por debajo de los 40 °C bajo carga máxima, pero en parte son una consecuencia lógica del bajo rendimiento de la CPU y la GPU. Nuestras imágenes térmicas también muestran que el propio sistema de refrigeración no se calienta más de ~51 °C. La competencia rinde sistemáticamente peor en esta disciplina.
(+) La temperatura máxima en la parte superior es de 35.7 °C / 96 F, frente a la media de 34.3 °C / 94 F, que oscila entre 21.2 y 62.5 °C para la clase Office.
(+) El fondo se calienta hasta un máximo de 36.8 °C / 98 F, frente a la media de 36.8 °C / 98 F
(+) En reposo, la temperatura media de la parte superior es de 25.5 °C / 78# F, frente a la media del dispositivo de 29.5 °C / 85 F.
(+) El reposamanos y el panel táctil están a una temperatura inferior a la de la piel, con un máximo de 30.2 °C / 86.4 F y, por tanto, son fríos al tacto.
(-) La temperatura media de la zona del reposamanos de dispositivos similares fue de 27.5 °C / 81.5 F (-2.7 °C / -4.9 F).
| Acer Aspire 5 A515-58GM-76S8 Intel Core i7-1355U, NVIDIA GeForce RTX 2050 Mobile | Asus TUF A15 FA507 AMD Ryzen 7 7735HS, NVIDIA GeForce RTX 4050 Laptop GPU | Lenovo LOQ 15APH8 AMD Ryzen 7 7840HS, NVIDIA GeForce RTX 4050 Laptop GPU | HP Envy x360 15-ey0023dx AMD Ryzen 7 5825U, AMD Radeon RX Vega 8 (Ryzen 4000/5000) | Dell Inspiron 15 5515-H8P8F AMD Ryzen 7 5700U, AMD Radeon RX Vega 8 (Ryzen 4000/5000) | Lenovo IdeaPad 5 15ALC05 AMD Ryzen 5 5500U, AMD Radeon RX Vega 7 | Asus VivoBook S15 M3502RA-L1029W AMD Ryzen 7 6800H, AMD Radeon 680M | Acer Aspire 5 A515-57G-53N8 Intel Core i5-1240P, NVIDIA GeForce RTX 2050 Mobile | |
|---|---|---|---|---|---|---|---|---|
| Heat | -14% | -18% | 3% | -20% | -7% | -29% | -10% | |
| Maximum Upper Side * (°C) | 35.7 | 48.9 -37% | 44.4 -24% | 36.2 -1% | 39.4 -10% | 40.5 -13% | 50.2 -41% | 43 -20% |
| Maximum Bottom * (°C) | 36.8 | 44.6 -21% | 52 -41% | 37.8 -3% | 45.4 -23% | 42 -14% | 50.2 -36% | 48 -30% |
| Idle Upper Side * (°C) | 27.9 | 27.1 3% | 28 -0% | 25.4 9% | 33.2 -19% | 26.5 5% | 32.1 -15% | 26 7% |
| Idle Bottom * (°C) | 27.9 | 27.5 1% | 29.6 -6% | 26.6 5% | 35.1 -26% | 29 -4% | 34.6 -24% | 27 3% |
* ... más pequeño es mejor
Prueba de esfuerzo
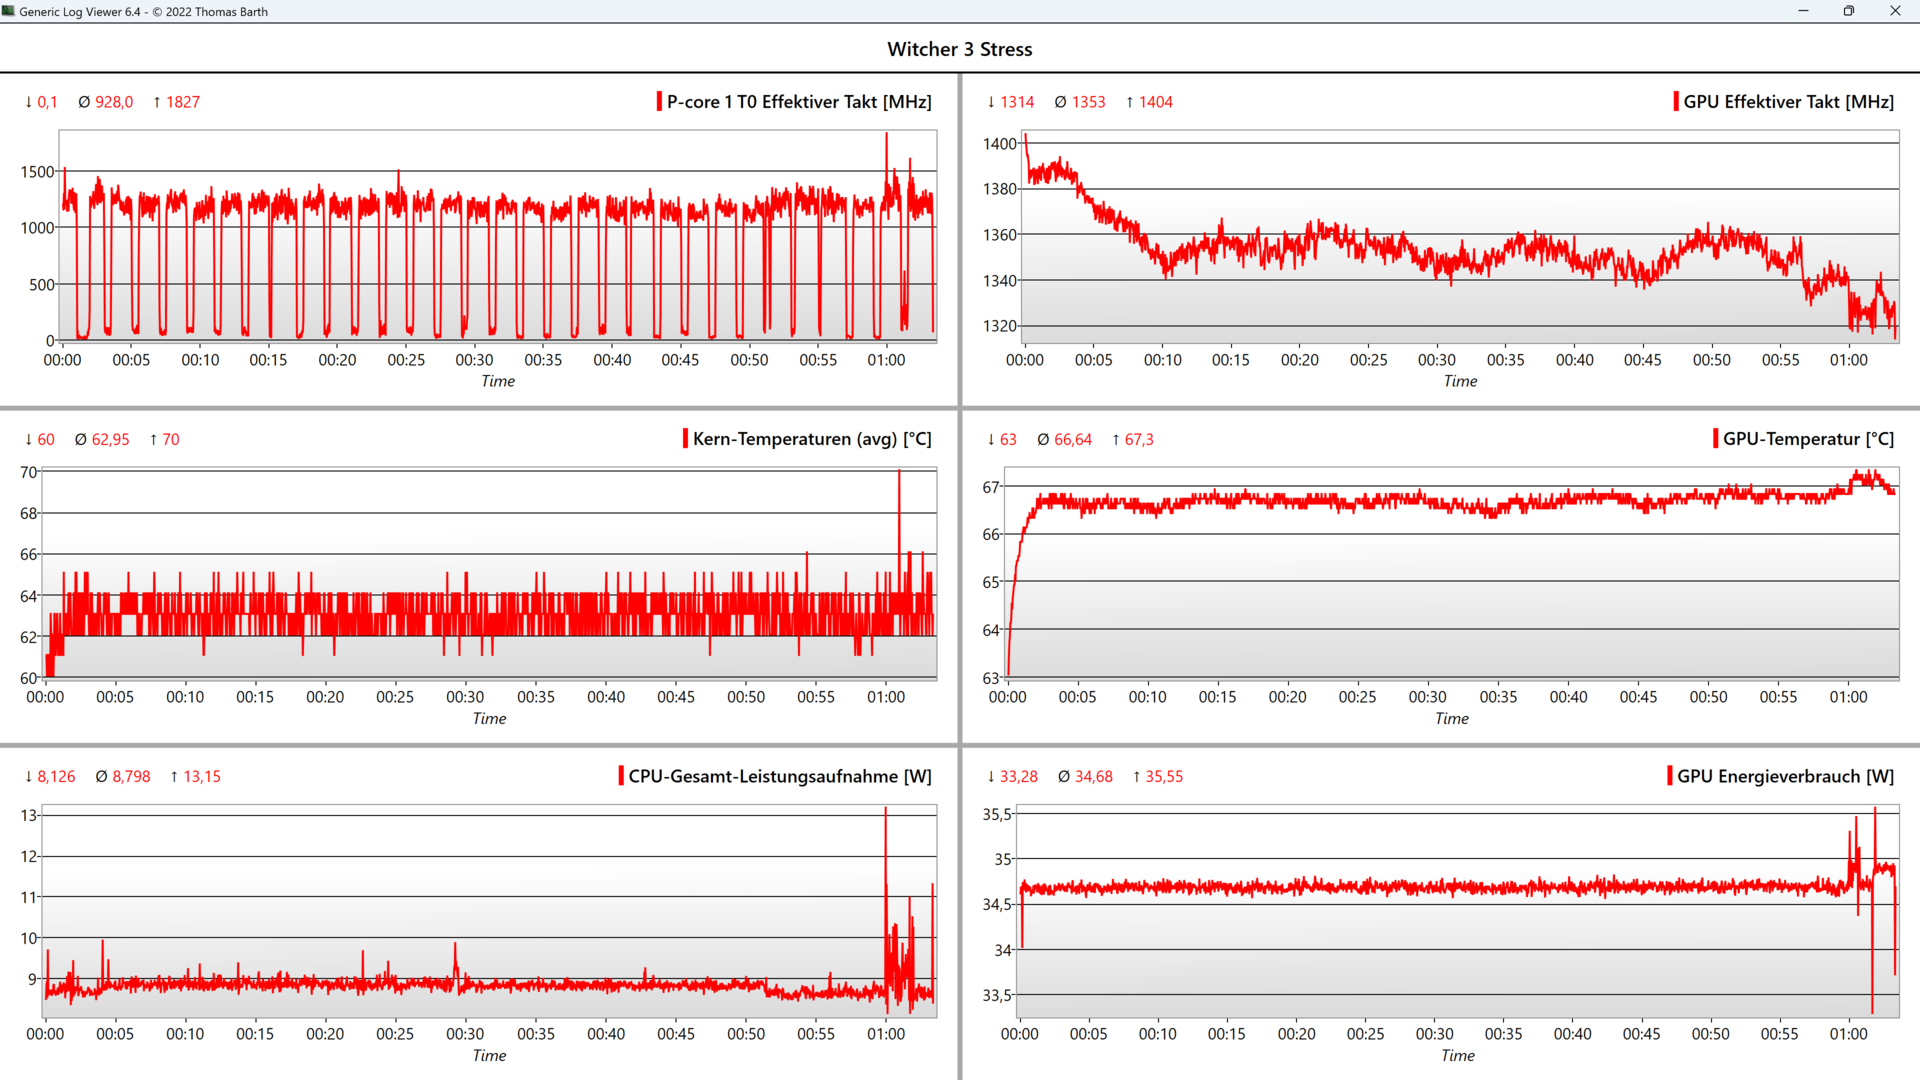
Tras unos pocos segundos, la CPU alcanzó los 92 °C en nuestra prueba de estrés combinada, lo que significa que se redujo permanentemente de 4,55 GHz a 2,2 GHz, que está considerablemente por encima del reloj base de 1,2 GHz. Entre medias, se aceleró a 3 GHz brevemente.
La GPU primero funcionó a 1 GHz y luego se equilibró a 864 MHz con una temperatura relativamente fresca de 71 °C. Durante la prueba de estrés de GPU pura, funcionó permanentemente a 1.115 MHz. Durante la prueba de Witcher 3 prueba de estrés, alcanzó un máximo de 1.400 MHz y un mínimo de 1.315 MHz. Al máximo TGP, unaRTX 2050es capaz de ofrecer permanentemente hasta ~1.500 MHz.
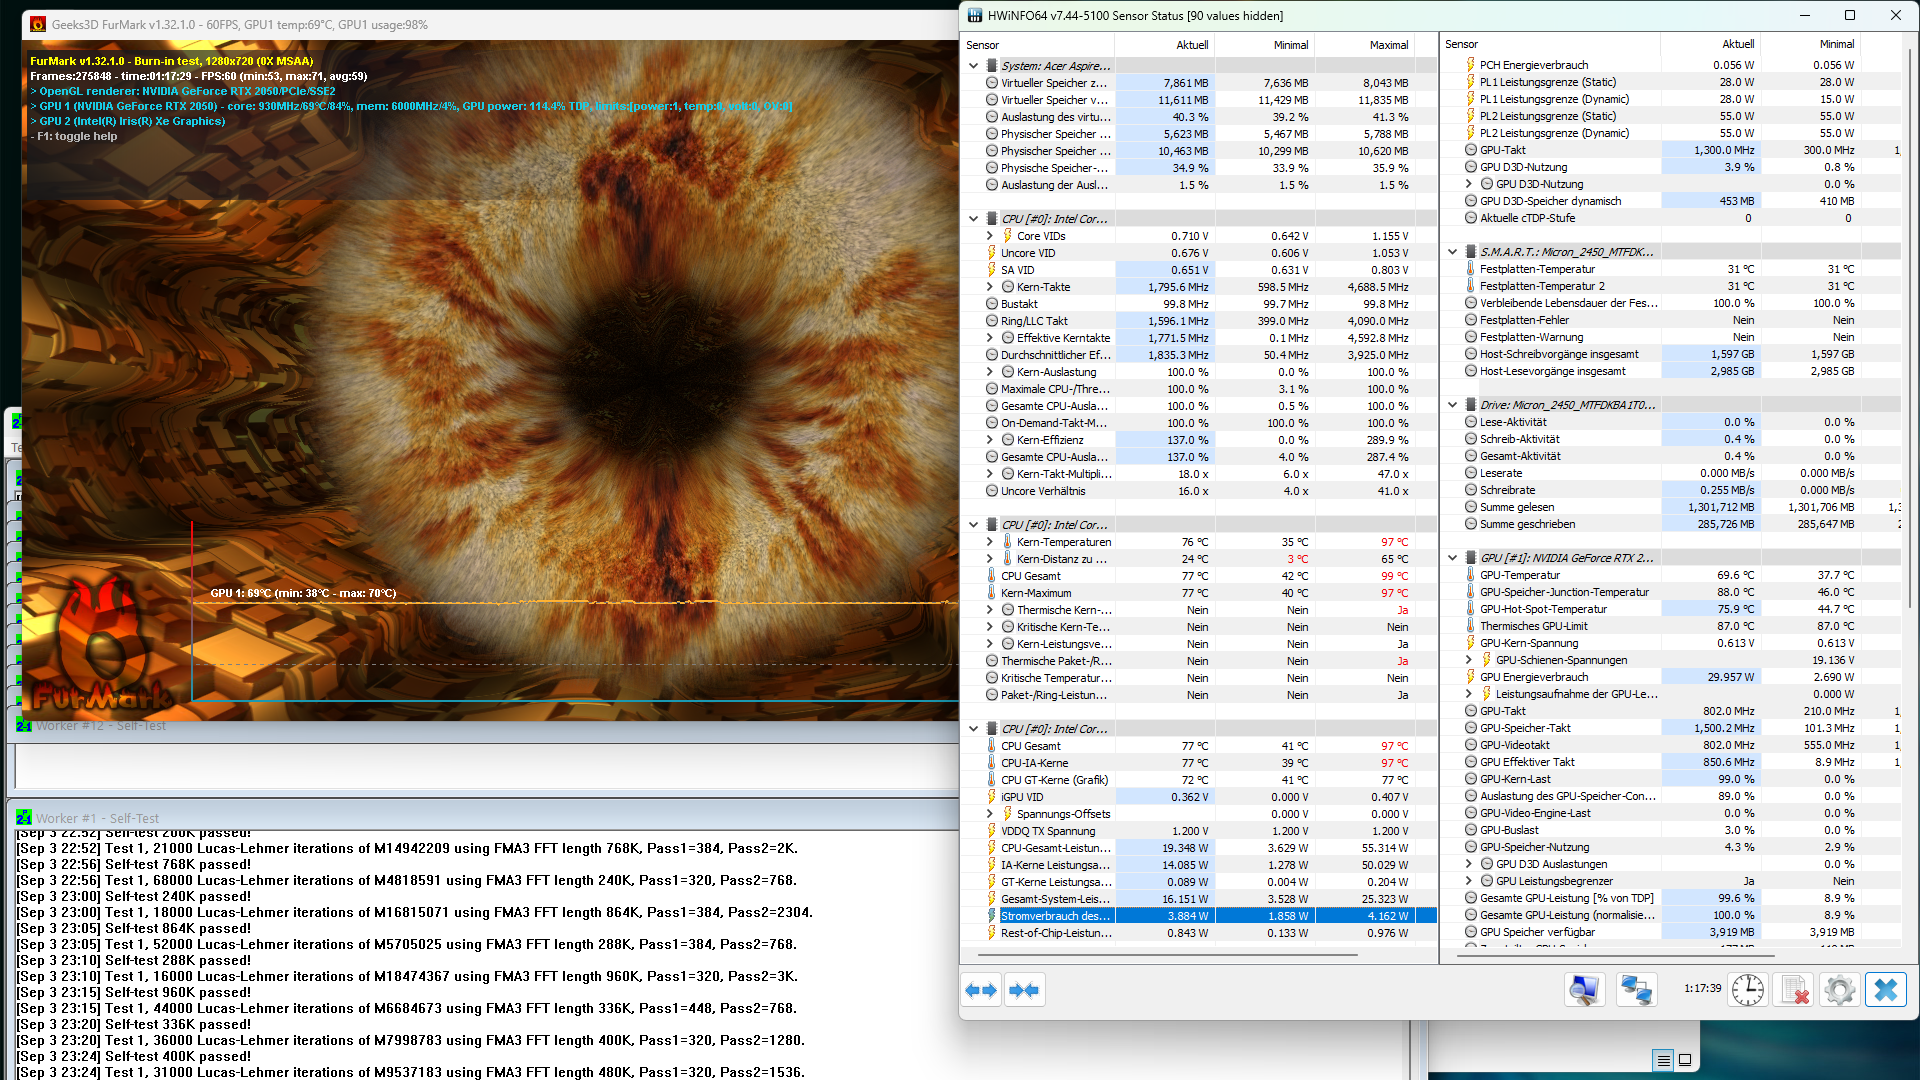
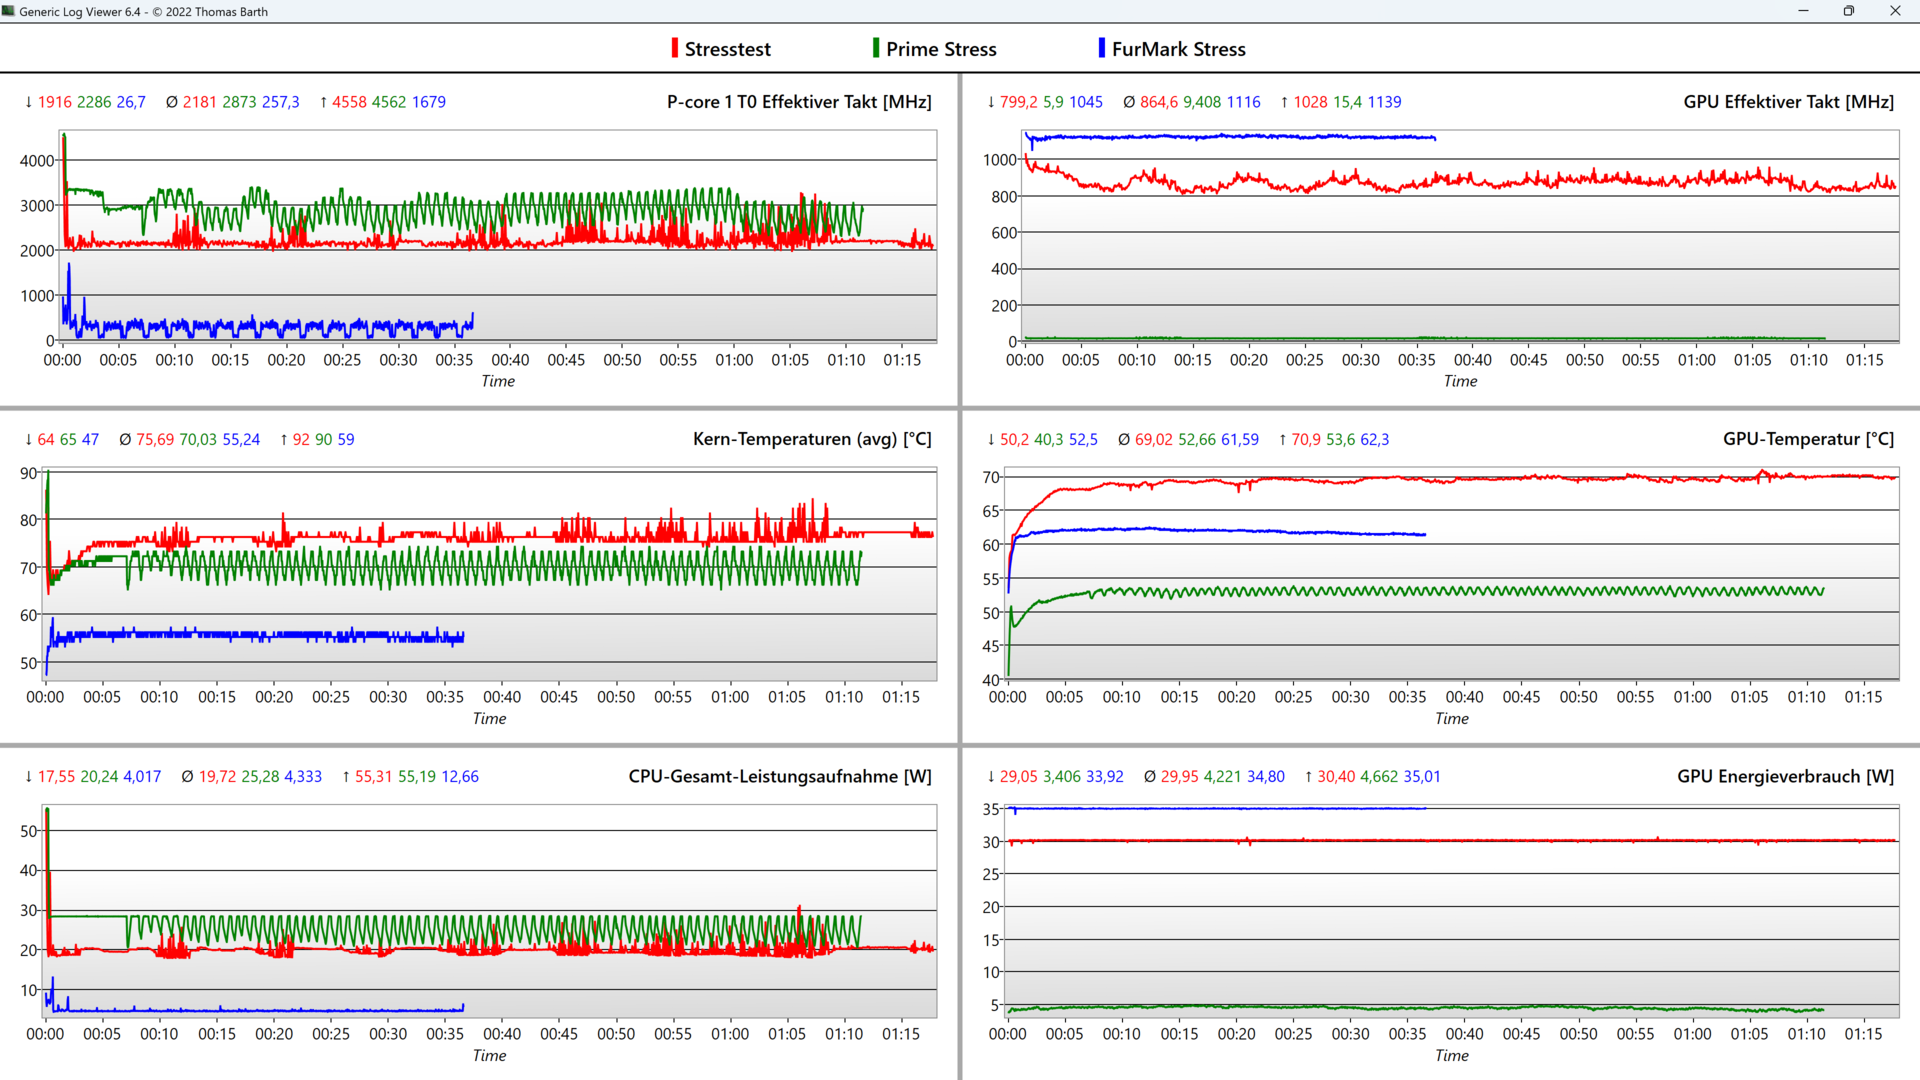
| Reloj de la CPU (GHz) | Reloj de la GPU (MHz) | Temperatura media dela CPU (°C) | Temperatura media de la GPU (°C) | |
| Sistema en reposo | 0,02 | - | 34 | 39 |
| Prime95estrés | 2,87 | - | 70 | 53 |
| Prime95+FurMark | 2,18 | 864 | 76 | 71 |
| Witcher 3 estrés | 0,93 | 1.350 | 63 | 67 |
| FurMark estrés | 0,26 | 1.115 | 55 | 62 |
Altavoces
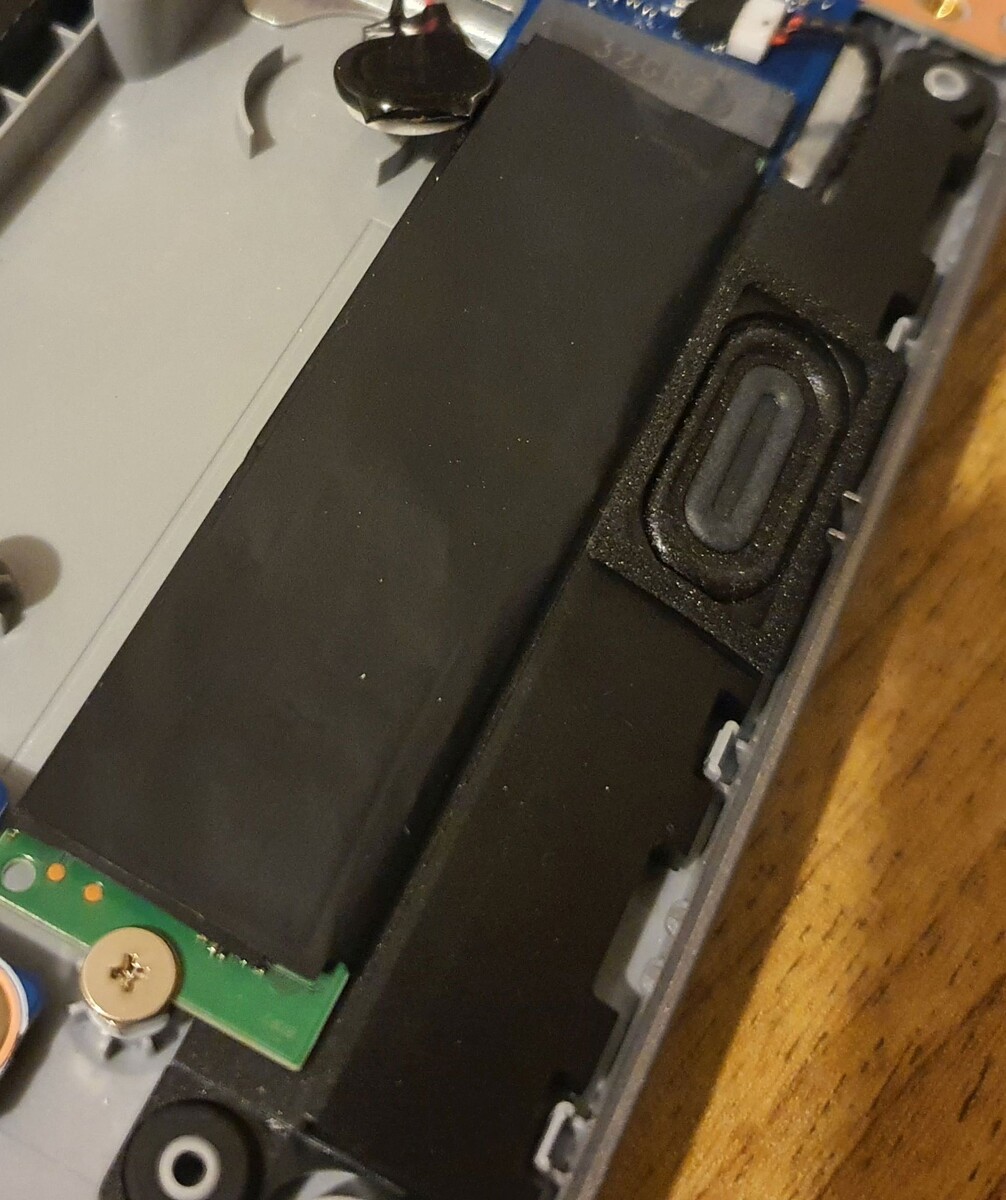
En nuestra opinión, sus 2 altavoces de 2 vatios junto con su pantalla por debajo de la media son la principal razón por la que el Aspire 5 no es un portátil multimedia. Como es típico para un portátil de oficina, producen un sonido pobre al que le faltan graves y no es particularmente alto con un máximo de 76 dB(A).
Los altavoces orientados hacia abajo también tienden a distorsionar a todo volumen. La serie Envy de HPlenovoLOQ 15 y la serieMateBook D de Huawei ofrecen una mejor experiencia de sonido.
Acer Aspire 5 A515-58GM-76S8 análisis de audio
(±) | la sonoridad del altavoz es media pero buena (76 dB)
Graves 100 - 315 Hz
(-) | casi sin bajos - de media 23.8% inferior a la mediana
(±) | la linealidad de los graves es media (11.6% delta a frecuencia anterior)
Medios 400 - 2000 Hz
(+) | medios equilibrados - a sólo 1.9% de la mediana
(±) | la linealidad de los medios es media (8.7% delta respecto a la frecuencia anterior)
Altos 2 - 16 kHz
(+) | máximos equilibrados - a sólo 3.9% de la mediana
(+) | los máximos son lineales (5.6% delta a la frecuencia anterior)
Total 100 - 16.000 Hz
(±) | la linealidad del sonido global es media (19.9% de diferencia con la mediana)
En comparación con la misma clase
» 42% de todos los dispositivos probados de esta clase eran mejores, 9% similares, 49% peores
» El mejor tuvo un delta de 7%, la media fue 21%, el peor fue ###max##%
En comparación con todos los dispositivos probados
» 51% de todos los dispositivos probados eran mejores, 7% similares, 42% peores
» El mejor tuvo un delta de 4%, la media fue 23%, el peor fue ###max##%
HP Envy x360 15-ey0023dx análisis de audio
(±) | la sonoridad del altavoz es media pero buena (78.2 dB)
Graves 100 - 315 Hz
(±) | lubina reducida - en promedio 9.1% inferior a la mediana
(±) | la linealidad de los graves es media (10.3% delta a frecuencia anterior)
Medios 400 - 2000 Hz
(+) | medios equilibrados - a sólo 2.4% de la mediana
(+) | los medios son lineales (5.1% delta a la frecuencia anterior)
Altos 2 - 16 kHz
(+) | máximos equilibrados - a sólo 3.6% de la mediana
(+) | los máximos son lineales (4% delta a la frecuencia anterior)
Total 100 - 16.000 Hz
(+) | el sonido global es lineal (11% de diferencia con la mediana)
En comparación con la misma clase
» 8% de todos los dispositivos probados de esta clase eran mejores, 2% similares, 90% peores
» El mejor tuvo un delta de 6%, la media fue 20%, el peor fue ###max##%
En comparación con todos los dispositivos probados
» 6% de todos los dispositivos probados eran mejores, 2% similares, 92% peores
» El mejor tuvo un delta de 4%, la media fue 23%, el peor fue ###max##%
Gestión de la energía: Aspire 5 con batería de mayor duración
Consumo de energía:
Su consumo medio en reposo de 6,5 vatios es inferior al de su predecesor predecesor(8 vatios). Cuando juega, el portátil usa una media de 61 vatios, mientras que el AsusTUF Gaming A15con unaRTX 4050consume nada menos que 136 vatios. El LenovoThinkBook 16 G4consume 83 vatios, ya que suRTX 2050tiene un TGP superior de 60 vatios.
Aunque se notó una clara y abrupta caída de rendimiento en la prueba Cinebench R23 de 83.7 vatios a ~47 vatios tras poco tiempo, esto no se debió a una fuente de alimentación demasiado débil, sino a la ralentización térmica de la CPU.
| Off / Standby | |
| Ocioso | |
| Carga |
|
Clave:
min: | |
| Acer Aspire 5 A515-58GM-76S8 i7-1355U, GeForce RTX 2050 Mobile, Micron 2450 1TB MTFDKBA1T0TFK, IPS, 1920x1080, 15.6" | Acer Aspire 5 A515-57G-53N8 i5-1240P, GeForce RTX 2050 Mobile, Micron 2450 512GB MTFDKBA512TFK, IPS, 1920x1080, 15.6" | Acer Aspire 5 A515-45-R4R1 R7 5700U, Vega 8, Micron 2210 MTFDHBA512QFD, IPS, 1920x1080, 15.6" | Asus ZenBook Flip 15 Q508U R7 5700U, GeForce MX450, Kingston OM8PDP3256B, IPS, 1920x1080, 15.6" | Asus TUF A15 FA507 R7 7735HS, GeForce RTX 4050 Laptop GPU, Micron 2400 MTFDKBA512QFM, IPS, 1920x1080, 15.6" | HP Envy x360 15-ey0023dx R7 5825U, Vega 8, Samsung PM991 MZVLQ512HBLU, IPS, 1920x1080, 15.6" | Dell Inspiron 15 5515-H8P8F R7 5700U, Vega 8, Toshiba KBG40ZNS512G NVMe, IPS, 1920x1080, 15.6" | Lenovo IdeaPad 5 15ALC05 R5 5500U, Vega 7, , IPS, 1920x1080, 15.6" | Asus VivoBook S15 M3502RA-L1029W R7 6800H, Radeon 680M, WD PC SN735 SDBPNHH-512G, OLED, 1920x1080, 15.6" | |
|---|---|---|---|---|---|---|---|---|---|
| Power Consumption | -6% | 35% | 7% | -77% | 18% | 25% | 16% | 0% | |
| Idle Minimum * (Watt) | 4.31 | 4 7% | 3 30% | 3.9 10% | 8 -86% | 3.9 10% | 3.8 12% | 3.7 14% | 4.4 -2% |
| Idle Average * (Watt) | 6.52 | 8 -23% | 5.5 16% | 7.6 -17% | 12.1 -86% | 7.2 -10% | 6.6 -1% | 7.9 -21% | 5.1 22% |
| Idle Maximum * (Watt) | 8.037 | 13 -62% | 8.2 -2% | 11 -37% | 12.5 -56% | 7.3 9% | 8 -0% | 9.3 -16% | 9.3 -16% |
| Load Average * (Watt) | 75.2 | 62 18% | 34.2 55% | 53.3 29% | 74.9 -0% | 46.7 38% | 33.4 56% | 41 45% | 67 11% |
| Witcher 3 ultra * (Watt) | 60.8 | 60 1% | 30.2 50% | 42.8 30% | 136.6 -125% | 41.1 32% | 33.6 45% | 41 33% | 66.4 -9% |
| Load Maximum * (Watt) | 89.5 | 70 22% | 38 58% | 64.9 27% | 185 -107% | 64.8 28% | 54 40% | 52.2 42% | 93.5 -4% |
* ... más pequeño es mejor
Power consumption Witcher 3 / stress test
Power consumption with external monitor
Tiempos de ejecución
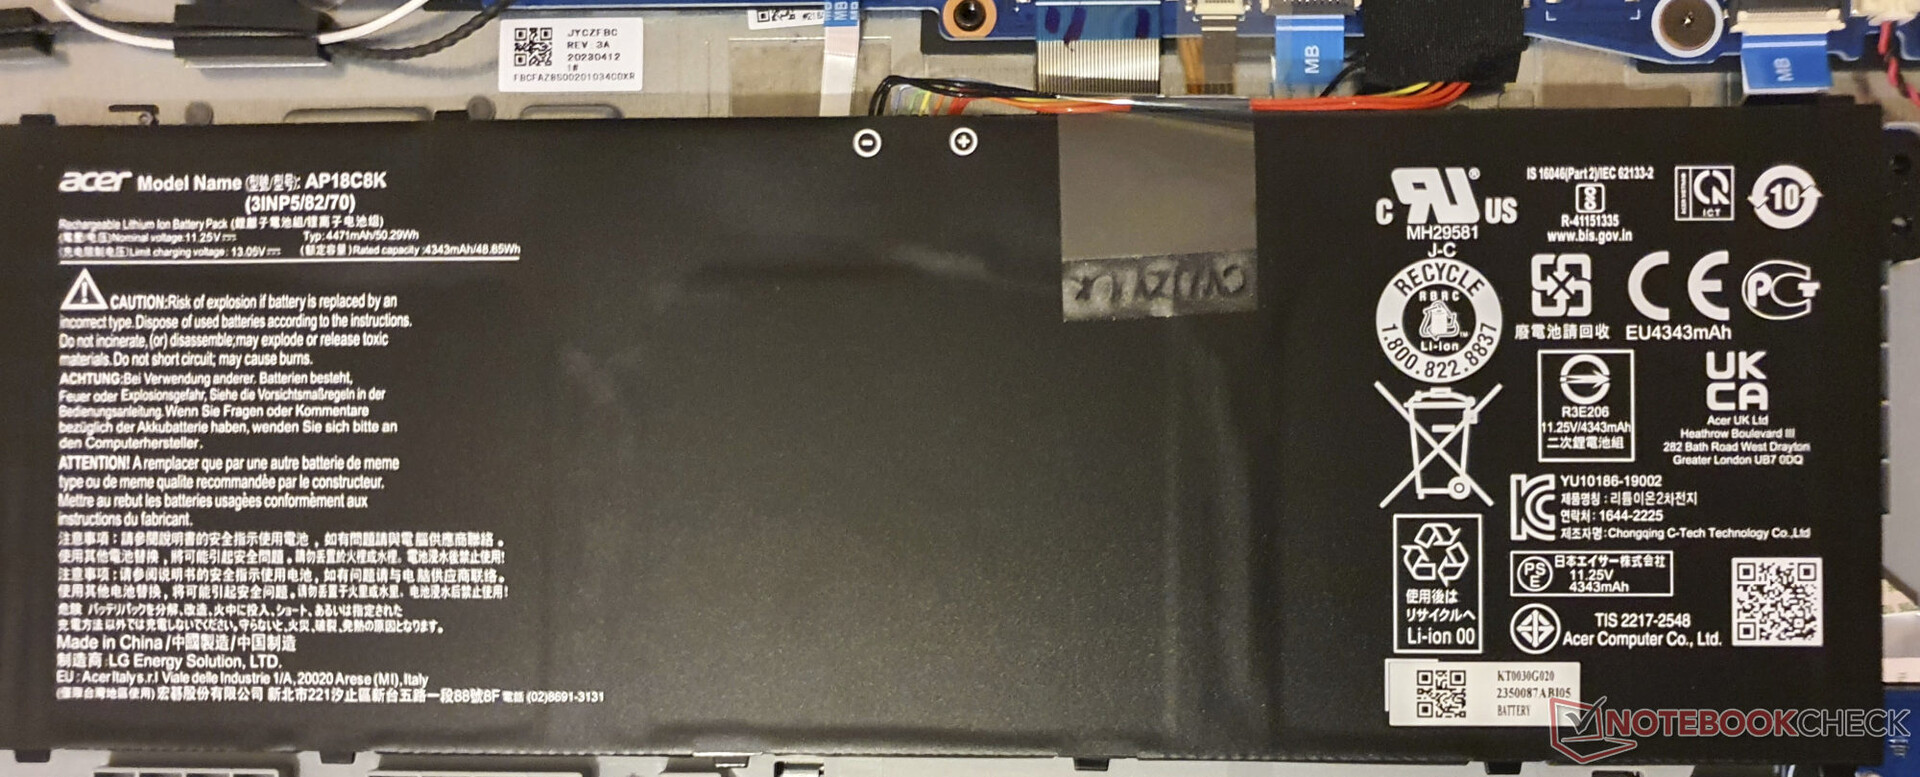
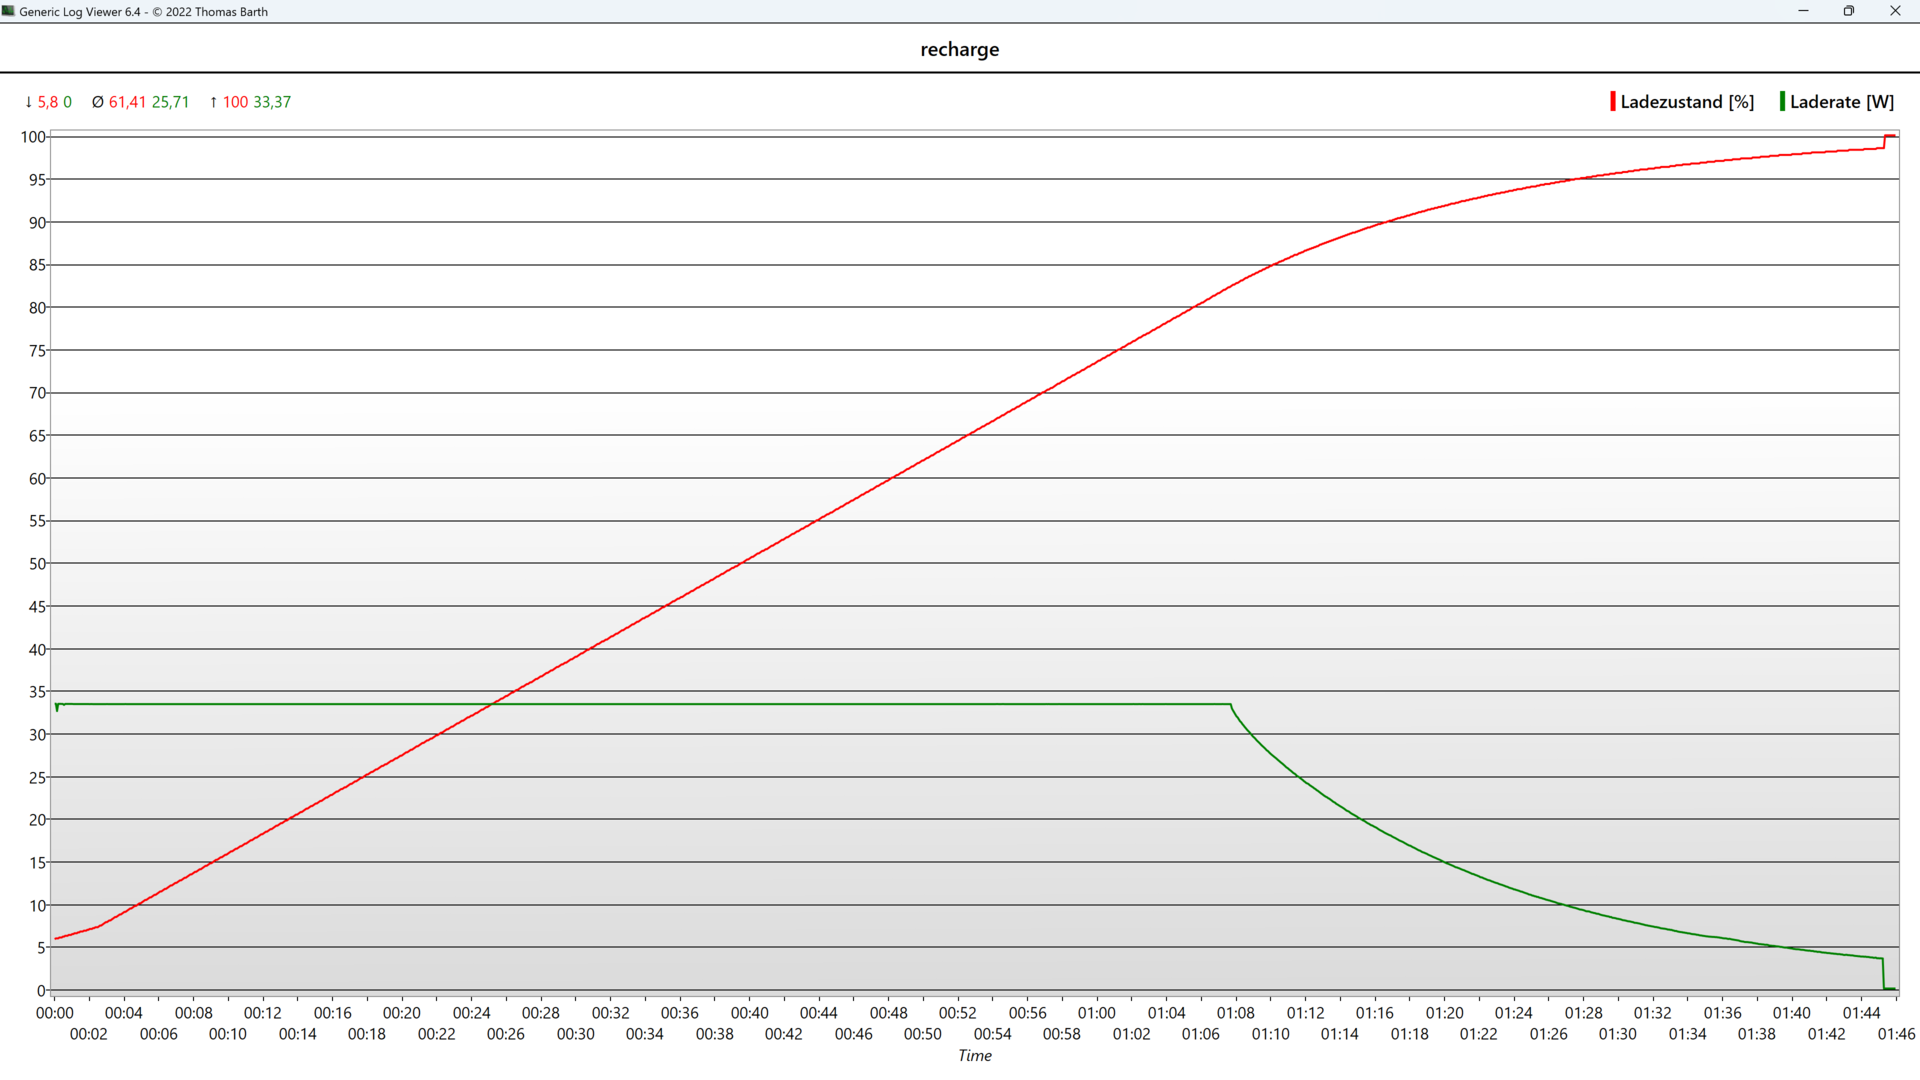
La batería de 48 Wh del Aspire 5 A515 (2023) dura un 25% más que la de su predecesor predecesor directolo que probablemente se deba también a la CPU serie U de Intel. El portátil de oficina quedó justo por debajo de la media de su clase con unos resultados de 8:42 horas.
La batería puede recargarse al 80% en poco más de una hora. Sin embargo, no se puede hablar de carga rápida en vista de su potencia máxima de carga de 33 vatios.
La competencia en nuestro campo de comparación confía enteramente en CPUs AMD y en su mayoría duran mucho más, por ejemplo elIdeaPad 5 15 con 14 horas e incluso elVivoBook S15 con su pantalla OLED sólo se queda sin batería tras 11.5 horas. Ambos rivales también tienen una batería significativamente mayor con una capacidad de 70 Wh.
| Acer Aspire 5 A515-58GM-76S8 i7-1355U, GeForce RTX 2050 Mobile, 48 Wh | Acer Aspire 5 A515-57G-53N8 i5-1240P, GeForce RTX 2050 Mobile, 50 Wh | Acer Aspire 5 A515-45-R4R1 R7 5700U, Vega 8, 48 Wh | Lenovo IdeaPad 5 15ALC05 R5 5500U, Vega 7, 70 Wh | Dell Inspiron 15 5515-H8P8F R7 5700U, Vega 8, 54 Wh | HP Envy x360 15-ey0023dx R7 5825U, Vega 8, 51 Wh | Asus VivoBook S15 M3502RA-L1029W R7 6800H, Radeon 680M, 70 Wh | Lenovo LOQ 15APH8 R7 7840HS, GeForce RTX 4050 Laptop GPU, 60 Wh | Asus TUF A15 FA507 R7 7735HS, GeForce RTX 4050 Laptop GPU, 90 Wh | Media de la clase Office | |
|---|---|---|---|---|---|---|---|---|---|---|
| Duración de Batería | -24% | 16% | 68% | 35% | 1% | 25% | -30% | 24% | 59% | |
| H.264 (h) | 6.6 | 8.8 33% | 15.4 133% | 10.8 64% | 12.8 94% | 12.5 89% | 15.5 ? 135% | |||
| WiFi v1.3 (h) | 8.7 | 7.1 -18% | 10.9 25% | 14 61% | 10.5 21% | 10.2 17% | 11.5 32% | 7.4 -15% | 11.7 34% | 13.2 ? 52% |
| Load (h) | 2 | 1.4 -30% | 1.8 -10% | 2.2 10% | 2.4 20% | 1.7 -15% | 1 -50% | 1.1 -45% | 1 -50% | 1.808 ? -10% |
| Witcher 3 ultra (h) | 1.8 |
Pro
Contra
Veredicto: Un portátil económico con tarjeta gráfica RTX por un precio premium
El Acer Aspire 5 es un producto un tanto paradójico, ya que se trata de un portátil económico equipado con un chip gráfico de gama básica, pero comercializado por el precio de un portátil para juegos de gama media. Por tanto, hay que tener muy claro qué se le pide a un portátil:
Si buscas un dispositivo de oficina sencillo pero sólido, entonces deberías optar por el Aspire 5 sin dGPU. Por otro lado, no sólo necesitas una GPU potente para un portátil multimedia. También necesita una buena pantalla e, idealmente, unos buenos altavoces, ninguna de las cuales ofrece el Aspire 5. O, ¿buscas jugar habitualmente a juegos con resolución y detalles moderados? Entonces deberías buscar un portátil de juegos económico como el LenovoLOQ 15el LOQ 16 o el AsusTUF Gaming A15.
Las ventajas del Aspire 5 incluyen sus dos bancos de RAM, su cómodo teclado (que, ojo, no es muy legible a plena luz) y su alto rendimiento de sistema, que es genial para navegar por internet - pero también se ralentiza considerablemente bajo carga continua. Además, el portátil cuenta con Thunderbolt 4, USB-C Power Delivery y su carcasa de plástico con tapa de metal es bastante robusta.
Otros aspectos positivos son su embalaje sostenible y su fiable lector de huellas. Además, su procesador instaladoRTX 2050puede hacer frente a bastantes juegos nuevos con ajustes de detalle medios y en Full HD. Este portátil todoterreno también puede usarse para edición de vídeo, siempre que se use un monitor externo que tenga una alta cobertura del espacio de color y una representación precisa del color. Aun así, unaRTX 3050(Ti) o unaRTX 4050con valores TGP más altos habrían sido necesarias, especialmente si tienes en cuenta el precio de venta del portátil.
Es importante pensar bien qué versión del Acer Aspire 5 compras: Una SKU con dGPU no tiene mucho sentido si tienes en cuenta todas las alternativas viables. Por otro lado, ofrece bastantes ventajas interesantes como portátil de oficina, como sus dos bancos de RAM, Thunderbolt 4 y su buen teclado.
El display FHD interno del portátil es demasiado tenue para usarlo fuera - aún más innecesario es que Acer haya reducido aún más el brillo a 220 cd/m² en modo batería y ni siquiera ofrezca paneles mejores. A esto se añade una tonelada de bloatware, un único puerto USB-C y ventiladores que casi siempre se oyen.
Además, su predecesor directo Análisis del portátil Acer Aspire 5 A515-57G: débil presentación de la RTX 2050 con la misma GPU y CPU sin ralentizar es 200 dólares más barato y el que tiene una GeForce MX550 es hasta 450 dólares más barato. Por el mismo precio que el Aspire 5 (2023), también se puede conseguir el Swift X SFX16 que cuenta con una pantalla más grande con una cobertura sRGB del 96 %, una RTX 3050 y un procesador de 11ª generación que funciona prácticamente igual de rápido bajo carga permanente.
Una alternativa bastante más barata es el LenovoIdeaPad Pro 5 16con una pantalla QHD a 120 Hz, un AMD Ryzen 7, una rápida iGPU (Radeon 680M) y RAM soldada. Otra alternativa podría ser el Dell Inspiron 16 Plus 7630 con unaRTX 3050. ElHP Envy 16es muy robusto y tiene un teclado excelente, y elMateBook D 16también podría ser una buena opción por una plétora de razones. ElThinkPad E15podría ser una buena alternativa para un portátil de oficina dedicado, con su teclado aún mejor, pantalla más brillante y precio atractivo.
Precio y disponibilidad
Acer Aspire 5 A515-58GM-76S8
- 09/19/2023 v7 (old)
Marvin Gollor
Transparencia
La selección de los dispositivos que se van a reseñar corre a cargo de nuestro equipo editorial. La muestra de prueba fue proporcionada al autor en calidad de préstamo por el fabricante o el minorista a los efectos de esta reseña. El prestamista no tuvo ninguna influencia en esta reseña, ni el fabricante recibió una copia de la misma antes de su publicación. No había ninguna obligación de publicar esta reseña. Como empresa de medios independiente, Notebookcheck no está sujeta a la autoridad de fabricantes, minoristas o editores.
Así es como prueba Notebookcheck
Cada año, Notebookcheck revisa de forma independiente cientos de portátiles y smartphones utilizando procedimientos estandarizados para asegurar que todos los resultados son comparables. Hemos desarrollado continuamente nuestros métodos de prueba durante unos 20 años y hemos establecido los estándares de la industria en el proceso. En nuestros laboratorios de pruebas, técnicos y editores experimentados utilizan equipos de medición de alta calidad. Estas pruebas implican un proceso de validación en varias fases. Nuestro complejo sistema de clasificación se basa en cientos de mediciones y puntos de referencia bien fundamentados, lo que mantiene la objetividad.Price comparison

