Breve análisis de Dell Vostro 15 5568 (i7-7500U, 940MX)
| SD Card Reader | |
| average JPG Copy Test (av. of 3 runs) | |
| HP Spectre x360 15-bl002xx (Toshiba Exceria Pro SDXC 64 GB UHS-II) | |
| Acer TravelMate P658-G2-MG-7327 (Toshiba Exceria Pro SDXC 64 GB UHS-II) | |
| Lenovo ThinkPad T570-20HAS01E00 (Toshiba Exceria Pro SDXC 64 GB UHS-II) | |
| Dell Vostro 15-5568 (Toshiba Exceria Pro SDXC 64 GB UHS-II) | |
| Dell Vostro 15-5568 (Toshiba Exceria Pro SDXC 64 GB UHS-II) | |
| maximum AS SSD Seq Read Test (1GB) | |
| HP Spectre x360 15-bl002xx (Toshiba Exceria Pro SDXC 64 GB UHS-II) | |
| Lenovo ThinkPad T570-20HAS01E00 (Toshiba Exceria Pro SDXC 64 GB UHS-II) | |
| Acer TravelMate P658-G2-MG-7327 (Toshiba Exceria Pro SDXC 64 GB UHS-II) | |
| Dell Vostro 15-5568 (Toshiba Exceria Pro SDXC 64 GB UHS-II) | |
| Dell Vostro 15-5568 (Toshiba Exceria Pro SDXC 64 GB UHS-II) | |
| |||||||||||||||||||||||||
iluminación: 86 %
Brillo con batería: 242 cd/m²
Contraste: 556:1 (Negro: 0.43 cd/m²)
ΔE ColorChecker Calman: 10.11 | ∀{0.5-29.43 Ø4.71}
ΔE Greyscale Calman: 10.88 | ∀{0.09-98 Ø4.96}
60% sRGB (Argyll 1.6.3 3D)
38% AdobeRGB 1998 (Argyll 1.6.3 3D)
41.5% AdobeRGB 1998 (Argyll 3D)
60% sRGB (Argyll 3D)
40.14% Display P3 (Argyll 3D)
Gamma: 2.33
CCT: 11924 K
| Dell Vostro 15-5568 Chi Mei CMN15C4, , 1920x1080, 15.6" | HP Spectre x360 15-bl002xx UHD UWVA eDP BrightView WLED-backlit , , 3840x2160, 15.6" | Acer TravelMate P658-G2-MG-7327 LG Philips LP156WF6-SPP1, , 1920x1080, 15.6" | Huawei MateBook D 15, i7-7500U 940MX BOE070C, , 1920x1080, 15.6" | Lenovo ThinkPad T570-20HAS01E00 BOE NV156QUM-N44, , 3840x2160, 15.6" | Dell Vostro 15-5568 Chi Mei CMN154C-8KV42 , , 1920x1080, 15.6" | |
|---|---|---|---|---|---|---|
| Display | 57% | 52% | 3% | 62% | ||
| Display P3 Coverage (%) | 40.14 | 67.9 69% | 64.9 62% | 41.79 4% | 70 74% | |
| sRGB Coverage (%) | 60 | 88.2 47% | 85.9 43% | 61.5 2% | 91.1 52% | |
| AdobeRGB 1998 Coverage (%) | 41.5 | 64.4 55% | 62.8 51% | 43.17 4% | 66.7 61% | |
| Response Times | -83% | -40% | -79% | -1% | -49% | |
| Response Time Grey 50% / Grey 80% * (ms) | 41 ? | 44 ? -7% | 38 ? 7% | 46.4 ? -13% | 41.6 ? -1% | 47.6 ? -16% |
| Response Time Black / White * (ms) | 15 ? | 38.8 ? -159% | 28 ? -87% | 36.8 ? -145% | 15.2 ? -1% | 27.2 ? -81% |
| PWM Frequency (Hz) | 26000 ? | 1000 ? | 21000 ? | 21190 | 926 ? | |
| Screen | 63% | 40% | 13% | 45% | -6% | |
| Brightness middle (cd/m²) | 239 | 351.5 47% | 284 19% | 268 12% | 339 42% | 229 -4% |
| Brightness (cd/m²) | 219 | 336 53% | 276 26% | 258 18% | 314 43% | 222 1% |
| Brightness Distribution (%) | 86 | 83 -3% | 82 -5% | 92 7% | 89 3% | 82 -5% |
| Black Level * (cd/m²) | 0.43 | 0.24 44% | 0.295 31% | 0.47 -9% | 0.36 16% | 0.56 -30% |
| Contrast (:1) | 556 | 1465 163% | 963 73% | 570 3% | 942 69% | 409 -26% |
| Colorchecker dE 2000 * | 10.11 | 3.3 67% | 4.07 60% | 5.7 44% | 4.2 58% | 10.36 -2% |
| Colorchecker dE 2000 max. * | 17.33 | 7.3 58% | 10.52 39% | 21.7 -25% | 7.8 55% | 14.95 14% |
| Greyscale dE 2000 * | 10.88 | 1.9 83% | 3.13 71% | 4.2 61% | 5.1 53% | 10.9 -0% |
| Gamma | 2.33 94% | 2.09 105% | 2.41 91% | 2.3 96% | 2.16 102% | 2.21 100% |
| CCT | 11924 55% | 6784 96% | 7082 92% | 6820 95% | 6569 99% | 10084 64% |
| Color Space (Percent of AdobeRGB 1998) (%) | 38 | 64.4 69% | 56 47% | 43.2 14% | 59.4 56% | 37.69 -1% |
| Color Space (Percent of sRGB) (%) | 60 | 88.2 47% | 86 43% | 61.5 2% | 91 52% | 57.92 -3% |
| Media total (Programa/Opciones) | 12% /
42% | 17% /
32% | -21% /
-1% | 35% /
42% | -28% /
-13% |
* ... más pequeño es mejor
Tiempos de respuesta del display
| ↔ Tiempo de respuesta de Negro a Blanco | ||
|---|---|---|
| 15 ms ... subida ↗ y bajada ↘ combinada | ↗ 11 ms subida | 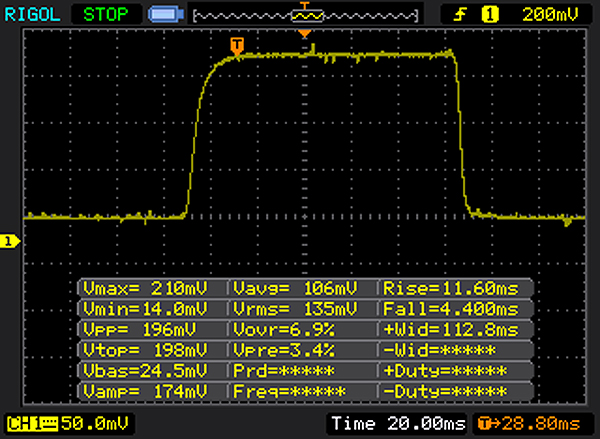 |
| ↘ 4 ms bajada | ||
| La pantalla mostró buenos tiempos de respuesta en nuestros tests pero podría ser demasiado lenta para los jugones competitivos. En comparación, todos los dispositivos de prueba van de ##min### (mínimo) a 240 (máximo) ms. » 36 % de todos los dispositivos son mejores. Esto quiere decir que el tiempo de respuesta medido es mejor que la media (19.8 ms) de todos los dispositivos testados. | ||
| ↔ Tiempo de respuesta 50% Gris a 80% Gris | ||
| 41 ms ... subida ↗ y bajada ↘ combinada | ↗ 24 ms subida | 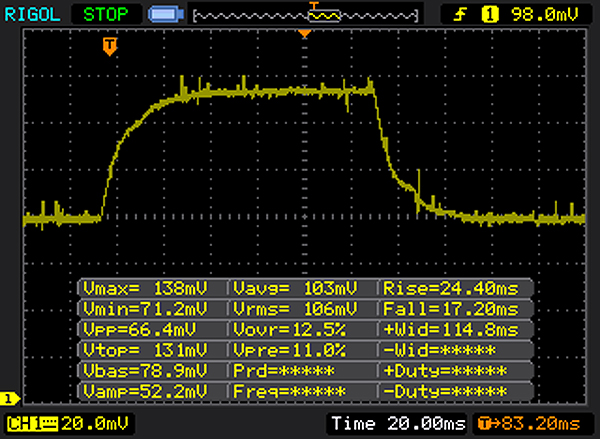 |
| ↘ 17 ms bajada | ||
| La pantalla mostró tiempos de respuesta lentos en nuestros tests y podría ser demasiado lenta para los jugones. En comparación, todos los dispositivos de prueba van de ##min### (mínimo) a 636 (máximo) ms. » 65 % de todos los dispositivos son mejores. Eso quiere decir que el tiempo de respuesta es peor que la media (30.9 ms) de todos los dispositivos testados. | ||
Parpadeo de Pantalla / PWM (Pulse-Width Modulation)
| Parpadeo de Pantalla / PWM detectado | 26000 Hz | ≤ 20 % de brillo | 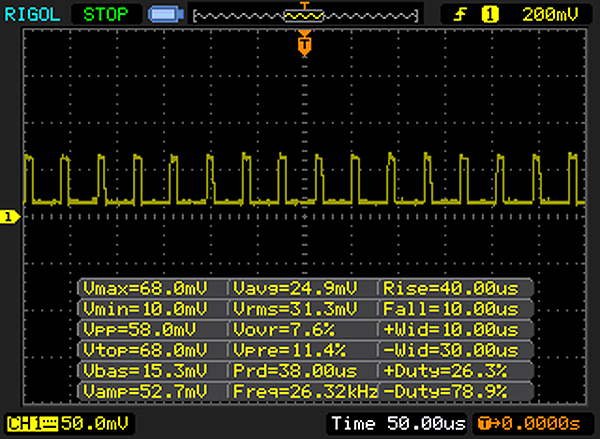 |
La retroiluminación del display parpadea a 26000 Hz (seguramente usa PWM - Pulse-Width Modulation) a un brillo del 20 % e inferior. Sobre este nivel de brillo no debería darse parpadeo / PWM. La frecuencia de 26000 Hz es bastante alta, por lo que la mayoría de gente sensible al parpadeo no debería ver parpadeo o tener fatiga visual. Comparación: 52 % de todos los dispositivos testados no usaron PWM para atenuar el display. Si se usó, medimos una media de 7744 (mínimo: 5 - máxmo: 343500) Hz. | |||
| PCMark 8 Home Score Accelerated v2 | 3672 puntos | |
| PCMark 8 Work Score Accelerated v2 | 4821 puntos | |
ayuda | ||
| Dell Vostro 15-5568 Micron SSD 1100 (MTFDDAV256TBN) | HP Spectre x360 15-bl002xx Toshiba XG4 NVMe (THNSN5512GPUK) | Acer TravelMate P658-G2-MG-7327 Liteonit CV3-8D512 | Huawei MateBook D 15, i7-7500U 940MX SanDisk SD8SN8U128G1027 | Lenovo ThinkPad T570-20HAS01E00 Samsung PM961 NVMe MZVLW512HMJP | Dell Vostro 15-5568 SanDisk X400 256GB, SATA (SD8SB8U-256G) | |
|---|---|---|---|---|---|---|
| CrystalDiskMark 3.0 | 184% | 24% | 24% | 222% | 44% | |
| Read Seq (MB/s) | 476.2 | 1266 166% | 526 10% | 478.4 0% | 1210 154% | 497.8 5% |
| Write Seq (MB/s) | 238.7 | 982 311% | 256.9 8% | 314.9 32% | 1134 375% | 466.8 96% |
| Read 512 (MB/s) | 312.9 | 834 167% | 227.1 -27% | 331.2 6% | 789 152% | 363.4 16% |
| Write 512 (MB/s) | 161.7 | 714 342% | 246.3 52% | 181.4 12% | 903 458% | 368.5 128% |
| Read 4k (MB/s) | 21.87 | 40.72 86% | 25.74 18% | 36.84 68% | 58.4 167% | 29.02 33% |
| Write 4k (MB/s) | 93.6 | 139.4 49% | 68.8 -26% | 82.7 -12% | 144.1 54% | 56 -40% |
| Read 4k QD32 (MB/s) | 172.8 | 527 205% | 354.8 105% | 368.5 113% | 559 223% | 296 71% |
| Write 4k QD32 (MB/s) | 161.2 | 395.2 145% | 248.8 54% | 123.2 -24% | 474.4 194% | 229.4 42% |

| 3DMark 11 - 1280x720 Performance GPU | |
| Huawei MateBook D 15, i7-7500U 940MX | |
| Lenovo ThinkPad T570-20HAS01E00 | |
| Dell Vostro 15-5568 | |
| HP Spectre x360 15-bl002xx | |
| Acer TravelMate P658-G2-MG-7327 | |
| Dell Vostro 15-5568 | |
| 3DMark | |
| 1280x720 Cloud Gate Standard Graphics | |
| Huawei MateBook D 15, i7-7500U 940MX | |
| Lenovo ThinkPad T570-20HAS01E00 | |
| HP Spectre x360 15-bl002xx | |
| Dell Vostro 15-5568 | |
| Dell Vostro 15-5568 | |
| 1920x1080 Fire Strike Graphics | |
| Huawei MateBook D 15, i7-7500U 940MX | |
| Lenovo ThinkPad T570-20HAS01E00 | |
| HP Spectre x360 15-bl002xx | |
| Dell Vostro 15-5568 | |
| Dell Vostro 15-5568 | |
| 3DMark 11 Performance | 2769 puntos | |
| 3DMark Cloud Gate Standard Score | 8208 puntos | |
| 3DMark Fire Strike Score | 1905 puntos | |
ayuda | ||
| bajo | medio | alto | ultra | |
|---|---|---|---|---|
| BioShock Infinite (2013) | 112.1 | 61.9 | 52.4 | 20.29 |
| Thief (2014) | 43.3 | 24.3 | 17.2 | 12.5 |
| Dragon Age: Inquisition (2014) | 61.8 | 42.1 | 9.6 |
Ruido
| Ocioso |
| 30.2 / 30.2 / 30.2 dB(A) |
| Carga |
| 40.4 / 40.6 dB(A) |
 | ||
30 dB silencioso 40 dB(A) audible 50 dB(A) ruidosamente alto |
||
min: | ||
(±) La temperatura máxima en la parte superior es de 43.5 °C / 110 F, frente a la media de 34.3 °C / 94 F, que oscila entre 21.2 y 62.5 °C para la clase Office.
(-) El fondo se calienta hasta un máximo de 56.2 °C / 133 F, frente a la media de 36.8 °C / 98 F
(+) En reposo, la temperatura media de la parte superior es de 25.2 °C / 77# F, frente a la media del dispositivo de 29.5 °C / 85 F.
(+) El reposamanos y el panel táctil están a una temperatura inferior a la de la piel, con un máximo de 28.4 °C / 83.1 F y, por tanto, son fríos al tacto.
(±) La temperatura media de la zona del reposamanos de dispositivos similares fue de 27.6 °C / 81.7 F (-0.8 °C / -1.4 F).
Dell Vostro 15-5568 análisis de audio
(-) | altavoces no muy altos (#67.5 dB)
Graves 100 - 315 Hz
(-) | casi sin bajos - de media 19.3% inferior a la mediana
(±) | la linealidad de los graves es media (12.6% delta a frecuencia anterior)
Medios 400 - 2000 Hz
(±) | medias más altas - de media 7.9% más altas que la mediana
(±) | la linealidad de los medios es media (8% delta respecto a la frecuencia anterior)
Altos 2 - 16 kHz
(+) | máximos equilibrados - a sólo 2.2% de la mediana
(±) | la linealidad de los máximos es media (7.5% delta a frecuencia anterior)
Total 100 - 16.000 Hz
(±) | la linealidad del sonido global es media (26.8% de diferencia con la mediana)
En comparación con la misma clase
» 82% de todos los dispositivos probados de esta clase eran mejores, 6% similares, 11% peores
» El mejor tuvo un delta de 7%, la media fue 21%, el peor fue ###max##%
En comparación con todos los dispositivos probados
» 82% de todos los dispositivos probados eran mejores, 4% similares, 14% peores
» El mejor tuvo un delta de 4%, la media fue 23%, el peor fue ###max##%
Apple MacBook 12 (Early 2016) 1.1 GHz análisis de audio
(+) | los altavoces pueden reproducir a un volumen relativamente alto (#83.6 dB)
Graves 100 - 315 Hz
(±) | lubina reducida - en promedio 11.3% inferior a la mediana
(±) | la linealidad de los graves es media (14.2% delta a frecuencia anterior)
Medios 400 - 2000 Hz
(+) | medios equilibrados - a sólo 2.4% de la mediana
(+) | los medios son lineales (5.5% delta a la frecuencia anterior)
Altos 2 - 16 kHz
(+) | máximos equilibrados - a sólo 2% de la mediana
(+) | los máximos son lineales (4.5% delta a la frecuencia anterior)
Total 100 - 16.000 Hz
(+) | el sonido global es lineal (10.2% de diferencia con la mediana)
En comparación con la misma clase
» 7% de todos los dispositivos probados de esta clase eran mejores, 2% similares, 90% peores
» El mejor tuvo un delta de 5%, la media fue 18%, el peor fue ###max##%
En comparación con todos los dispositivos probados
» 5% de todos los dispositivos probados eran mejores, 1% similares, 94% peores
» El mejor tuvo un delta de 4%, la media fue 23%, el peor fue ###max##%
| Off / Standby | |
| Ocioso | |
| Carga |
|
Clave:
min: | |
| Dell Vostro 15-5568 i7-7500U, GeForce 940MX, Micron SSD 1100 (MTFDDAV256TBN), TN LED, 1920x1080, 15.6" | HP Spectre x360 15-bl002xx i7-7500U, GeForce 940MX, Toshiba XG4 NVMe (THNSN5512GPUK), IPS, 3840x2160, 15.6" | Acer TravelMate P658-G2-MG-7327 i7-7500U, GeForce 940MX, Liteonit CV3-8D512, IPS, 1920x1080, 15.6" | Huawei MateBook D 15, i7-7500U 940MX i7-7500U, GeForce 940MX, SanDisk SD8SN8U128G1027, IPS, 1920x1080, 15.6" | Lenovo ThinkPad T570-20HAS01E00 i7-7500U, GeForce 940MX, Samsung PM961 NVMe MZVLW512HMJP, IPS, 3840x2160, 15.6" | Dell Vostro 15-5568 i5-7200U, HD Graphics 620, SanDisk X400 256GB, SATA (SD8SB8U-256G), TN LED, 1920x1080, 15.6" | |
|---|---|---|---|---|---|---|
| Power Consumption | -73% | -28% | -27% | -48% | 5% | |
| Idle Minimum * (Watt) | 3.1 | 8.14 -163% | 3.9 -26% | 5.14 -66% | 4.7 -52% | 3.3 -6% |
| Idle Average * (Watt) | 6.3 | 10.91 -73% | 7.9 -25% | 9.07 -44% | 9.9 -57% | 6.8 -8% |
| Idle Maximum * (Watt) | 6.5 | 12.26 -89% | 11.3 -74% | 9.33 -44% | 10.9 -68% | 7.7 -18% |
| Load Average * (Watt) | 46 | 45.67 1% | 47 -2% | 46.76 -2% | 56.1 -22% | 30.9 33% |
| Load Maximum * (Watt) | 54 | 74.94 -39% | 62 -15% | 42.59 21% | 75 -39% | 40.3 25% |
| Witcher 3 ultra * (Watt) | 40.18 |
* ... más pequeño es mejor
| Dell Vostro 15-5568 i7-7500U, GeForce 940MX, 42 Wh | HP Spectre x360 15-bl002xx i7-7500U, GeForce 940MX, 79.2 Wh | Acer TravelMate P658-G2-MG-7327 i7-7500U, GeForce 940MX, 55 Wh | Huawei MateBook D 15, i7-7500U 940MX i7-7500U, GeForce 940MX, 43.3 Wh | Lenovo ThinkPad T570-20HAS01E00 i7-7500U, GeForce 940MX, 56 Wh | Dell Vostro 15-5568 i5-7200U, HD Graphics 620, 42 Wh | |
|---|---|---|---|---|---|---|
| Duración de Batería | 69% | 95% | 38% | 61% | 35% | |
| Reader / Idle (h) | 13.3 | 14.4 8% | 15.9 20% | 13.3 0% | 16.9 27% | |
| WiFi v1.3 (h) | 4.3 | 8.9 107% | 8.4 95% | 7.4 72% | 6.9 60% | 6 40% |
| Load (h) | 1.3 | 2.5 92% | 1.6 23% | 2.9 123% | 1.8 38% | |
| H.264 (h) | 8.1 | 8.5 |
Pro
Contra
El Vostro 15 5568 sigue siendo un portátil business económico. El rendimiento ofrecido es adecuado para el bajo precio. El bajo rendimiento WLAN y el mal teclado en particular pueden echar atrás a compradores interesados. Si hay que tener en cuenta las características de seguridad minimalistas a la hora de decidir comprarlo es algo que debe decidir cada comprador.
Con el Vostro 15 5568, Dell ofrece un portátil business de bajo precio y visualmente agradable. El WLAN y las características de seguridad, empero, tienen algunos defectos.
Para los compradores interesados que busquen un portátil business económico, el Vostro 15 5568 es ciertamente adecuado. El dispositivo puede ejecutar aplicaciones ofimáticas estándar (presentaciones, hojas de cálculo, y e-mails) sin problemas. Sin embargo, hay que tener en cuenta el mal display, especialmente para aplicaciones 3D que requieran una dGPU. Si el ángulo de visión y la cobertura de espacio de color ofrecidos son suficientes, este portátil es una opción válida.
Ésta es una versión acortada del análisis original. Puedes leer el análisis completo en inglés aquí.
Dell Vostro 15-5568
- 12/04/2017 v6 (old)
Mike Wobker