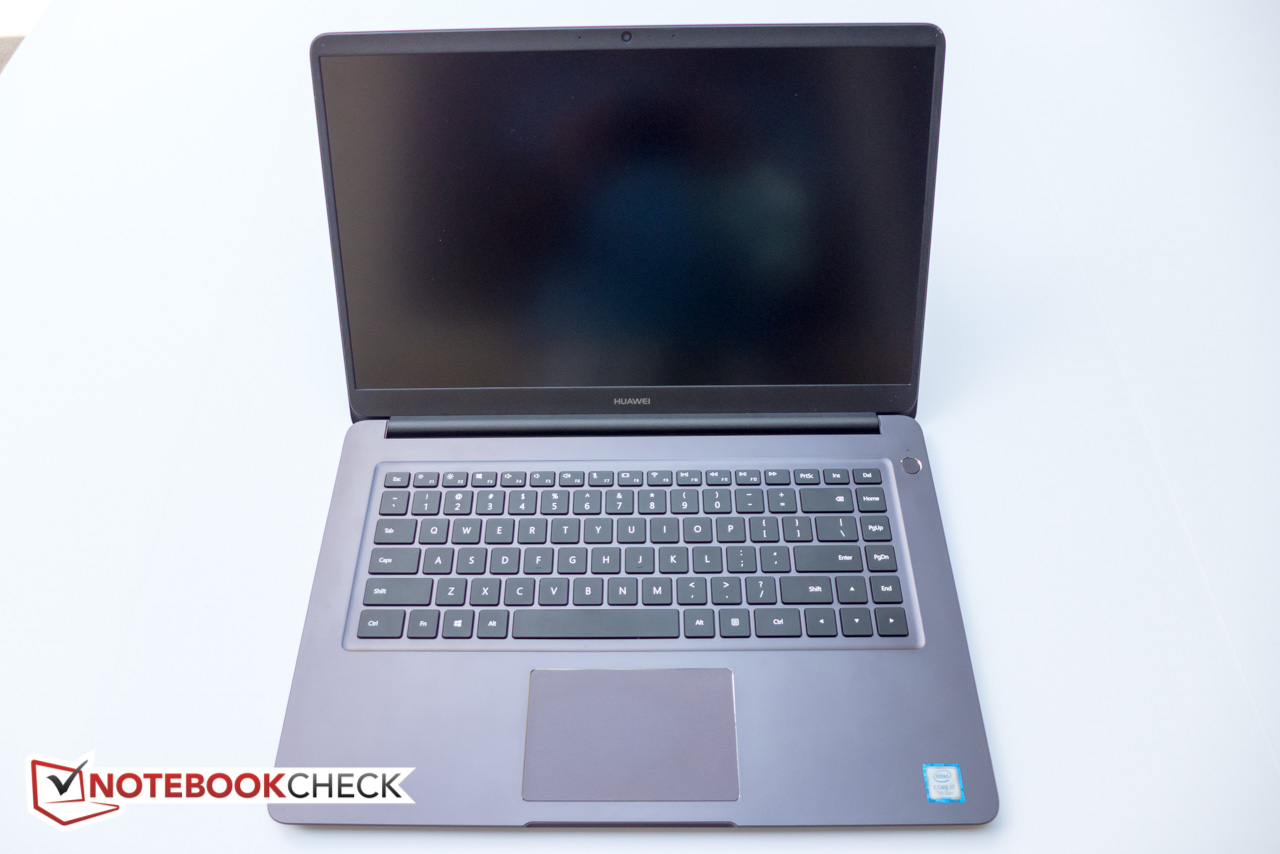
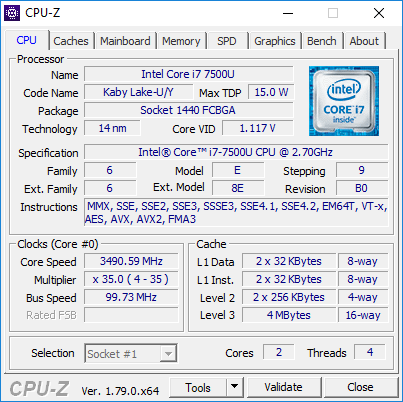
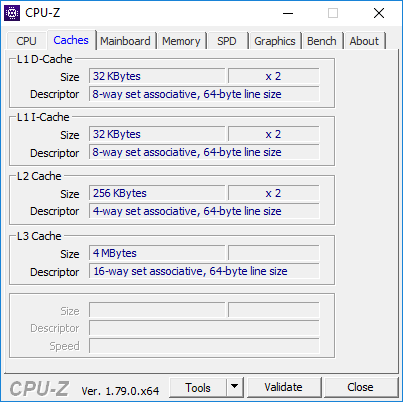
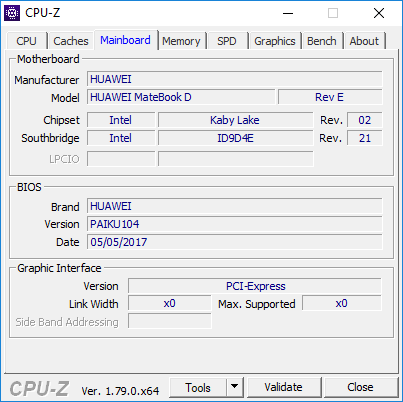
Breve análisis del portátil Huawei MateBook D (i7-7500U, GeForce 940MX)
| |||||||||||||||||||||||||
iluminación: 92 %
Brillo con batería: 268 cd/m²
Contraste: 570:1 (Negro: 0.47 cd/m²)
ΔE ColorChecker Calman: 5.7 | ∀{0.5-29.43 Ø4.71}
ΔE Greyscale Calman: 4.2 | ∀{0.09-98 Ø4.96}
61.5% sRGB (Argyll 1.6.3 3D)
43.2% AdobeRGB 1998 (Argyll 1.6.3 3D)
43.17% AdobeRGB 1998 (Argyll 3D)
61.5% sRGB (Argyll 3D)
41.79% Display P3 (Argyll 3D)
Gamma: 2.3
CCT: 6820 K
| Huawei MateBook D 15, i7-7500U 940MX BOE070C, IPS, 15.6", 1920x1080 | Asus VivoBook S15 S510UA ID: LGD0573, Name: LG Display LP156WF9-SPK2, IPS, 15.6", 1920x1080 | HP Envy 15-as133cl Chi Mei CMN15D8, IPS, 15.6", 1920x1080 | Dell XPS 15 9560 (i7-7700HQ, UHD) IGZO IPS, 15.6", 3840x2160 | Lenovo ThinkPad T570-20H90002GE N156HCA-EAA, IPS, 15.6", 1920x1080 | |
|---|---|---|---|---|---|
| Display | -4% | 4% | 103% | 6% | |
| Display P3 Coverage (%) | 41.79 | 39.9 -5% | 42.95 3% | 89.7 115% | 44.08 5% |
| sRGB Coverage (%) | 61.5 | 59.5 -3% | 64.3 5% | 100 63% | 65.6 7% |
| AdobeRGB 1998 Coverage (%) | 43.17 | 41.11 -5% | 44.41 3% | 100 132% | 45.66 6% |
| Response Times | 23% | 11% | -15% | 27% | |
| Response Time Grey 50% / Grey 80% * (ms) | 46.4 ? | 38.4 ? 17% | 44.4 ? 4% | 57.2 ? -23% | 41.6 ? 10% |
| Response Time Black / White * (ms) | 36.8 ? | 26.4 ? 28% | 30 ? 18% | 39.2 ? -7% | 20.8 ? 43% |
| PWM Frequency (Hz) | 21190 | 1000 ? | 962 | 26040 ? | |
| Screen | 13% | 16% | 39% | 22% | |
| Brightness middle (cd/m²) | 268 | 277.5 4% | 262.3 -2% | 370.1 38% | 262 -2% |
| Brightness (cd/m²) | 258 | 265 3% | 240 -7% | 356 38% | 245 -5% |
| Brightness Distribution (%) | 92 | 89 -3% | 83 -10% | 87 -5% | 89 -3% |
| Black Level * (cd/m²) | 0.47 | 0.35 26% | 0.24 49% | 0.37 21% | 0.24 49% |
| Contrast (:1) | 570 | 793 39% | 1093 92% | 1000 75% | 1092 92% |
| Colorchecker dE 2000 * | 5.7 | 4.8 16% | 5 12% | 5.3 7% | 4.5 21% |
| Colorchecker dE 2000 max. * | 21.7 | 17.8 18% | 20.6 5% | 9.9 54% | 10.5 52% |
| Greyscale dE 2000 * | 4.2 | 3 29% | 3.2 24% | 4.6 -10% | 3.5 17% |
| Gamma | 2.3 96% | 2.39 92% | 2.45 90% | 2.31 95% | 2.32 95% |
| CCT | 6820 95% | 6854 95% | 6817 95% | 6284 103% | 6524 100% |
| Color Space (Percent of AdobeRGB 1998) (%) | 43.2 | 37.7 -13% | 40.5 -6% | 88.3 104% | 42.04 -3% |
| Color Space (Percent of sRGB) (%) | 61.5 | 69.3 13% | 63.5 3% | 100 63% | 65.4 6% |
| Media total (Programa/Opciones) | 11% /
11% | 10% /
13% | 42% /
44% | 18% /
20% |
* ... más pequeño es mejor
Tiempos de respuesta del display
| ↔ Tiempo de respuesta de Negro a Blanco | ||
|---|---|---|
| 36.8 ms ... subida ↗ y bajada ↘ combinada | ↗ 22.4 ms subida | 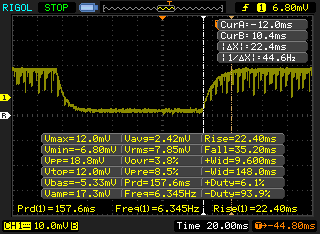 |
| ↘ 14.4 ms bajada | ||
| La pantalla mostró tiempos de respuesta lentos en nuestros tests y podría ser demasiado lenta para los jugones. En comparación, todos los dispositivos de prueba van de ##min### (mínimo) a 240 (máximo) ms. » 95 % de todos los dispositivos son mejores. Eso quiere decir que el tiempo de respuesta es peor que la media (19.8 ms) de todos los dispositivos testados. | ||
| ↔ Tiempo de respuesta 50% Gris a 80% Gris | ||
| 46.4 ms ... subida ↗ y bajada ↘ combinada | ↗ 23.2 ms subida | 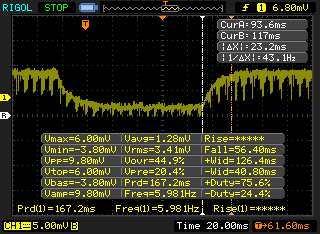 |
| ↘ 23.2 ms bajada | ||
| La pantalla mostró tiempos de respuesta lentos en nuestros tests y podría ser demasiado lenta para los jugones. En comparación, todos los dispositivos de prueba van de ##min### (mínimo) a 636 (máximo) ms. » 80 % de todos los dispositivos son mejores. Eso quiere decir que el tiempo de respuesta es peor que la media (31 ms) de todos los dispositivos testados. | ||
Parpadeo de Pantalla / PWM (Pulse-Width Modulation)
| Parpadeo de Pantalla / PWM detectado | 21190 Hz | 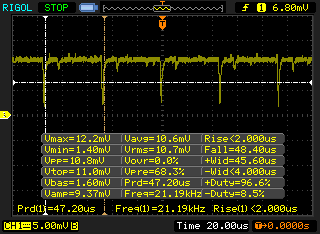 | |
La retroiluminación del display parpadea a 21190 Hz (seguramente usa PWM - Pulse-Width Modulation) . La frecuencia de 21190 Hz es bastante alta, por lo que la mayoría de gente sensible al parpadeo no debería ver parpadeo o tener fatiga visual. Comparación: 52 % de todos los dispositivos testados no usaron PWM para atenuar el display. Si se usó, medimos una media de 7754 (mínimo: 5 - máxmo: 343500) Hz. | |||
| wPrime 2.10 - 1024m | |
| Huawei MateBook D 15, i7-7500U 940MX | |
| Asus VivoBook S15 S510UA | |
| HP Envy 15-as133cl | |
| Dell XPS 15 9560 (i7-7700HQ, UHD) | |
* ... más pequeño es mejor
| PCMark 8 Home Score Accelerated v2 | 3721 puntos | |
| PCMark 8 Creative Score Accelerated v2 | 4615 puntos | |
| PCMark 8 Work Score Accelerated v2 | 4860 puntos | |
| PCMark 10 Score | 3081 puntos | |
ayuda | ||
| Huawei MateBook D 15, i7-7500U 940MX SanDisk SD8SN8U128G1027 | Asus VivoBook S15 S510UA Toshiba HG6 THNSNJ128G8NY | HP Envy 15-as133cl HGST Travelstar 5K1000 HTS541010A7E630 | Dell XPS 15 9560 (i7-7700HQ, UHD) Lite-On CX2-8B512-Q11 | Lenovo ThinkPad T570-20H90002GE Samsung PM961 MZVLW256HEHP | Acer TravelMate P658-G2-MG-7327 Liteonit CV3-8D512 | |
|---|---|---|---|---|---|---|
| CrystalDiskMark 3.0 | 3% | -88% | 195% | 175% | 6% | |
| Write 4k QD32 (MB/s) | 123.2 | 94.3 -23% | 1.015 -99% | 398.1 223% | 426.4 246% | 248.8 102% |
| Read 4k QD32 (MB/s) | 368.5 | 250.3 -32% | 0.828 -100% | 509 38% | 510 38% | 354.8 -4% |
| Write 4k (MB/s) | 82.7 | 64.6 -22% | 1.008 -99% | 134.1 62% | 130.6 58% | 68.8 -17% |
| Read 4k (MB/s) | 36.84 | 19.48 -47% | 0.366 -99% | 45.14 23% | 56.6 54% | 25.74 -30% |
| Write 512 (MB/s) | 181.4 | 342 89% | 46.3 -74% | 1119 517% | 860 374% | 246.3 36% |
| Read 512 (MB/s) | 331.2 | 417.7 26% | 31.46 -91% | 977 195% | 933 182% | 227.1 -31% |
| Write Seq (MB/s) | 314.9 | 396 26% | 102.6 -67% | 1106 251% | 1166 270% | 256.9 -18% |
| Read Seq (MB/s) | 478.4 | 503 5% | 103.2 -78% | 1684 252% | 1318 176% | 526 10% |

| 3DMark 11 Performance | 3072 puntos | |
| 3DMark Cloud Gate Standard Score | 8715 puntos | |
| 3DMark Fire Strike Score | 2189 puntos | |
ayuda | ||
| Rise of the Tomb Raider | |
| 1920x1080 Very High Preset AA:FX AF:16x (ordenar por valor) | |
| Huawei MateBook D 15, i7-7500U 940MX | |
| Dell XPS 15 9560 (i7-7700HQ, UHD) | |
| HP Spectre x360 15-bl002xx | |
| 1920x1080 High Preset AA:FX AF:4x (ordenar por valor) | |
| Huawei MateBook D 15, i7-7500U 940MX | |
| Dell XPS 15 9560 (i7-7700HQ, UHD) | |
| HP Spectre x360 15-bl002xx | |
| 1366x768 Medium Preset AF:2x (ordenar por valor) | |
| Huawei MateBook D 15, i7-7500U 940MX | |
| HP Envy 15-as133cl | |
| Dell XPS 15 9560 (i7-7700HQ, UHD) | |
| HP Spectre x360 15-bl002xx | |
| 1024x768 Lowest Preset (ordenar por valor) | |
| Huawei MateBook D 15, i7-7500U 940MX | |
| HP Envy 15-as133cl | |
| Lenovo ThinkPad T570-20H90002GE | |
| HP Spectre x360 15-bl002xx | |
| bajo | medio | alto | ultra | |
|---|---|---|---|---|
| Hitman: Absolution (2012) | 53 | 42 | 27.2 | 12.5 |
| BioShock Infinite (2013) | 101.6 | 64.5 | 54.4 | 23.4 |
| The Witcher 3 (2015) | 35.3 | 23.6 | 14 | 7.1 |
| Rise of the Tomb Raider (2016) | 29 | 26 | 13.9 | 11.6 |
Ruido
| Ocioso |
| 30 / 30.2 / 30.2 dB(A) |
| Carga |
| 39 / 39 dB(A) |
 | ||
30 dB silencioso 40 dB(A) audible 50 dB(A) ruidosamente alto |
||
min: | ||
| Huawei MateBook D 15, i7-7500U 940MX GeForce 940MX, i7-7500U, SanDisk SD8SN8U128G1027 | Asus VivoBook S15 S510UA HD Graphics 620, i5-7200U, Toshiba HG6 THNSNJ128G8NY | HP Envy 15-as133cl HD Graphics 620, i7-7500U, HGST Travelstar 5K1000 HTS541010A7E630 | Lenovo ThinkPad T570-20H90002GE HD Graphics 620, i5-7200U, Samsung PM961 MZVLW256HEHP | Acer TravelMate P658-G2-MG-7327 GeForce 940MX, i7-7500U, Liteonit CV3-8D512 | HP Spectre x360 15-bl002xx GeForce 940MX, i7-7500U, Toshiba XG4 NVMe (THNSN5512GPUK) | |
|---|---|---|---|---|---|---|
| Noise | 2% | -2% | 2% | 1% | -4% | |
| apagado / medio ambiente * (dB) | 28.8 | 28.2 2% | 30 -4% | 29.3 -2% | 30 -4% | 28.5 1% |
| Idle Minimum * (dB) | 30 | 30.2 -1% | 32.5 -8% | 29.3 2% | 30 -0% | 28.5 5% |
| Idle Average * (dB) | 30.2 | 30.2 -0% | 32.5 -8% | 29.3 3% | 30 1% | 28.5 6% |
| Idle Maximum * (dB) | 30.2 | 30.2 -0% | 32.5 -8% | 31.2 -3% | 30 1% | 36.3 -20% |
| Load Average * (dB) | 39 | 36.9 5% | 38.7 1% | 35.1 10% | 37.3 4% | 42.7 -9% |
| Witcher 3 ultra * (dB) | 38.7 | |||||
| Load Maximum * (dB) | 39 | 37 5% | 32.5 17% | 38.7 1% | 38 3% | 42.7 -9% |
* ... más pequeño es mejor
(±) La temperatura máxima en la parte superior es de 44.8 °C / 113 F, frente a la media de 34.3 °C / 94 F, que oscila entre 21.2 y 62.5 °C para la clase Office.
(-) El fondo se calienta hasta un máximo de 50.4 °C / 123 F, frente a la media de 36.8 °C / 98 F
(+) En reposo, la temperatura media de la parte superior es de 28 °C / 82# F, frente a la media del dispositivo de 29.5 °C / 85 F.
(±) Jugando a The Witcher 3, la temperatura media de la parte superior es de 35.2 °C / 95 F, frente a la media del dispositivo de 29.5 °C / 85 F.
(+) Los reposamanos y el panel táctil alcanzan como máximo la temperatura de la piel (34 °C / 93.2 F) y, por tanto, no están calientes.
(-) La temperatura media de la zona del reposamanos de dispositivos similares fue de 27.5 °C / 81.5 F (-6.5 °C / -11.7 F).
Huawei MateBook D 15, i7-7500U 940MX análisis de audio
(±) | la sonoridad del altavoz es media pero buena (76.3 dB)
Graves 100 - 315 Hz
(±) | lubina reducida - en promedio 11.9% inferior a la mediana
(±) | la linealidad de los graves es media (14.9% delta a frecuencia anterior)
Medios 400 - 2000 Hz
(±) | medias más altas - de media 8.9% más altas que la mediana
(±) | la linealidad de los medios es media (10.8% delta respecto a la frecuencia anterior)
Altos 2 - 16 kHz
(+) | máximos equilibrados - a sólo 1.3% de la mediana
(+) | los máximos son lineales (4.1% delta a la frecuencia anterior)
Total 100 - 16.000 Hz
(±) | la linealidad del sonido global es media (25.5% de diferencia con la mediana)
En comparación con la misma clase
» 78% de todos los dispositivos probados de esta clase eran mejores, 6% similares, 16% peores
» El mejor tuvo un delta de 7%, la media fue 21%, el peor fue ###max##%
En comparación con todos los dispositivos probados
» 78% de todos los dispositivos probados eran mejores, 4% similares, 17% peores
» El mejor tuvo un delta de 4%, la media fue 23%, el peor fue ###max##%
Apple MacBook 12 (Early 2016) 1.1 GHz análisis de audio
(+) | los altavoces pueden reproducir a un volumen relativamente alto (#83.6 dB)
Graves 100 - 315 Hz
(±) | lubina reducida - en promedio 11.3% inferior a la mediana
(±) | la linealidad de los graves es media (14.2% delta a frecuencia anterior)
Medios 400 - 2000 Hz
(+) | medios equilibrados - a sólo 2.4% de la mediana
(+) | los medios son lineales (5.5% delta a la frecuencia anterior)
Altos 2 - 16 kHz
(+) | máximos equilibrados - a sólo 2% de la mediana
(+) | los máximos son lineales (4.5% delta a la frecuencia anterior)
Total 100 - 16.000 Hz
(+) | el sonido global es lineal (10.2% de diferencia con la mediana)
En comparación con la misma clase
» 7% de todos los dispositivos probados de esta clase eran mejores, 2% similares, 90% peores
» El mejor tuvo un delta de 5%, la media fue 18%, el peor fue ###max##%
En comparación con todos los dispositivos probados
» 5% de todos los dispositivos probados eran mejores, 1% similares, 94% peores
» El mejor tuvo un delta de 4%, la media fue 23%, el peor fue ###max##%
| Off / Standby | |
| Ocioso | |
| Carga |
|
Clave:
min: | |
| Huawei MateBook D 15, i7-7500U 940MX i7-7500U, GeForce 940MX, SanDisk SD8SN8U128G1027, IPS, 1920x1080, 15.6" | Asus VivoBook S15 S510UA i5-7200U, HD Graphics 620, Toshiba HG6 THNSNJ128G8NY, IPS, 1920x1080, 15.6" | HP Envy 15-as133cl i7-7500U, HD Graphics 620, HGST Travelstar 5K1000 HTS541010A7E630, IPS, 1920x1080, 15.6" | Lenovo ThinkPad T570-20H90002GE i5-7200U, HD Graphics 620, Samsung PM961 MZVLW256HEHP, IPS, 1920x1080, 15.6" | Acer TravelMate P658-G2-MG-7327 i7-7500U, GeForce 940MX, Liteonit CV3-8D512, IPS, 1920x1080, 15.6" | HP Spectre x360 15-bl002xx i7-7500U, GeForce 940MX, Toshiba XG4 NVMe (THNSN5512GPUK), IPS, 3840x2160, 15.6" | |
|---|---|---|---|---|---|---|
| Power Consumption | 17% | 25% | 17% | -6% | -37% | |
| Idle Minimum * (Watt) | 5.14 | 4.6 11% | 4.6 11% | 3.6 30% | 3.9 24% | 8.14 -58% |
| Idle Average * (Watt) | 9.07 | 7.6 16% | 7.7 15% | 7.7 15% | 7.9 13% | 10.91 -20% |
| Idle Maximum * (Watt) | 9.33 | 7.7 17% | 7.8 16% | 8.2 12% | 11.3 -21% | 12.26 -31% |
| Load Average * (Watt) | 46.76 | 35.1 25% | 30.5 35% | 30.8 34% | 47 -1% | 45.67 2% |
| Witcher 3 ultra * (Watt) | 40.18 | |||||
| Load Maximum * (Watt) | 42.59 | 36.2 15% | 22.7 47% | 46.1 -8% | 62 -46% | 74.94 -76% |
* ... más pequeño es mejor
| Huawei MateBook D 15, i7-7500U 940MX i7-7500U, GeForce 940MX, 43.3 Wh | Asus VivoBook S15 S510UA i5-7200U, HD Graphics 620, 42 Wh | HP Envy 15-as133cl i7-7500U, HD Graphics 620, 52 Wh | Dell XPS 15 9560 (i7-7700HQ, UHD) i7-7700HQ, GeForce GTX 1050 Mobile, 97 Wh | Lenovo ThinkPad T570-20H90002GE i5-7200U, HD Graphics 620, 56 Wh | Acer TravelMate P658-G2-MG-7327 i7-7500U, GeForce 940MX, 55 Wh | HP Spectre x360 15-bl002xx i7-7500U, GeForce 940MX, 79.2 Wh | |
|---|---|---|---|---|---|---|---|
| Duración de Batería | -34% | -24% | -3% | 46% | 14% | 22% | |
| Reader / Idle (h) | 15.9 | 10.2 -36% | 9.6 -40% | 13.9 -13% | 19.5 23% | 14.4 -9% | |
| WiFi v1.3 (h) | 7.4 | 4.3 -42% | 6.8 -8% | 7.2 -3% | 7.6 3% | 8.4 14% | 8.9 20% |
| Load (h) | 1.6 | 1.2 -25% | 1.2 -25% | 1.7 6% | 3.4 113% | 2.5 56% |
Pro
Contra
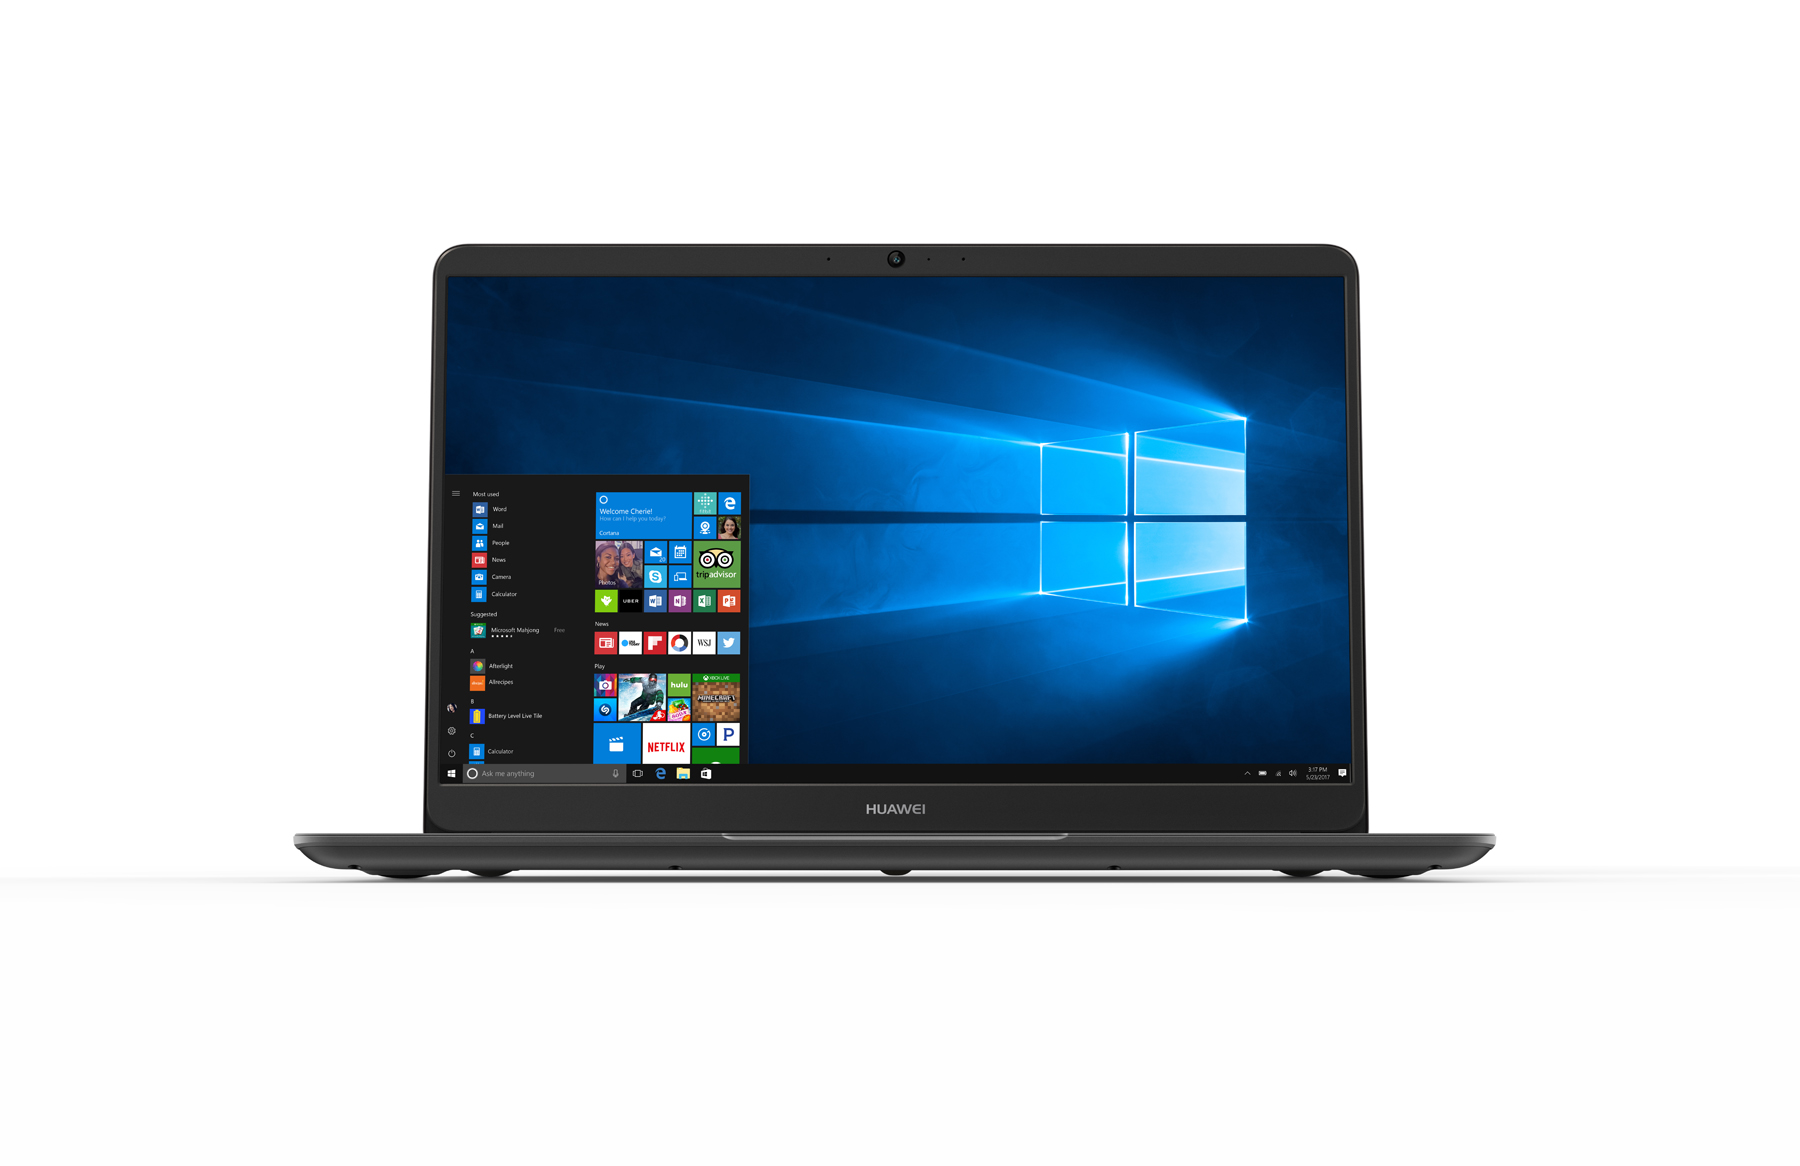
El MateBook D es un portátil convencional con pantalla táctil de 15,6" que está dirigido tanto a los usuarios domésticos como - si tomamos el lema de Huawei el en portátil al pie de la letra - como las empresas por igual. Debido al estrecho bisel, el diseño de aluminio cuenta con una pequeña huella y es funcional, robusto y también parece agradable. El rendimiento en el mundo real es bastante aceptable en su mayor parte gracias a la CPU i7, SSD primaria y la dedicada, aunque no particularmente potente tarjeta gráfica. La duración de la batería también es decente y la pantalla antideslumbrante es lo suficientemente brillante como para permitir al usuario aventurarse fuera al menos ocasionalmente.
El portátil tiene dos deficiencias importantes: las cargas más intensas y prolongadas conducen a una estricta regulación de la GPU, y a pesar de ello, las temperaturas de la superficie se elevan a niveles casi incómodos. Huawei necesita volver a la mesa de dibujo y rediseñar el sistema de refrigeración o modificar el mecanismo de control de ventilador subyacente. Como es ahora, los usuarios potentes es probable que vayan a estar muy decepcionados con el rendimiento y las características de temperatura de la MateBook D. El MateBook D de Huawei carece del factor wow de su hermano insignia MateBook X.
Como un portátil todoterreno de 15.6" en un mercado muy saturado, podría ser una opción bastante decente, pero es poco probable que proporcione a los compradores potenciales una experiencia de computación realmente satisfactoria.
Ésta es una versión acortada del análisis original. Puedes leer el análisis completo en inglés aquí.
Huawei MateBook D 15, i7-7500U 940MX
- 09/26/2017 v6 (old)
Bernie Pechlaner
Price comparison
