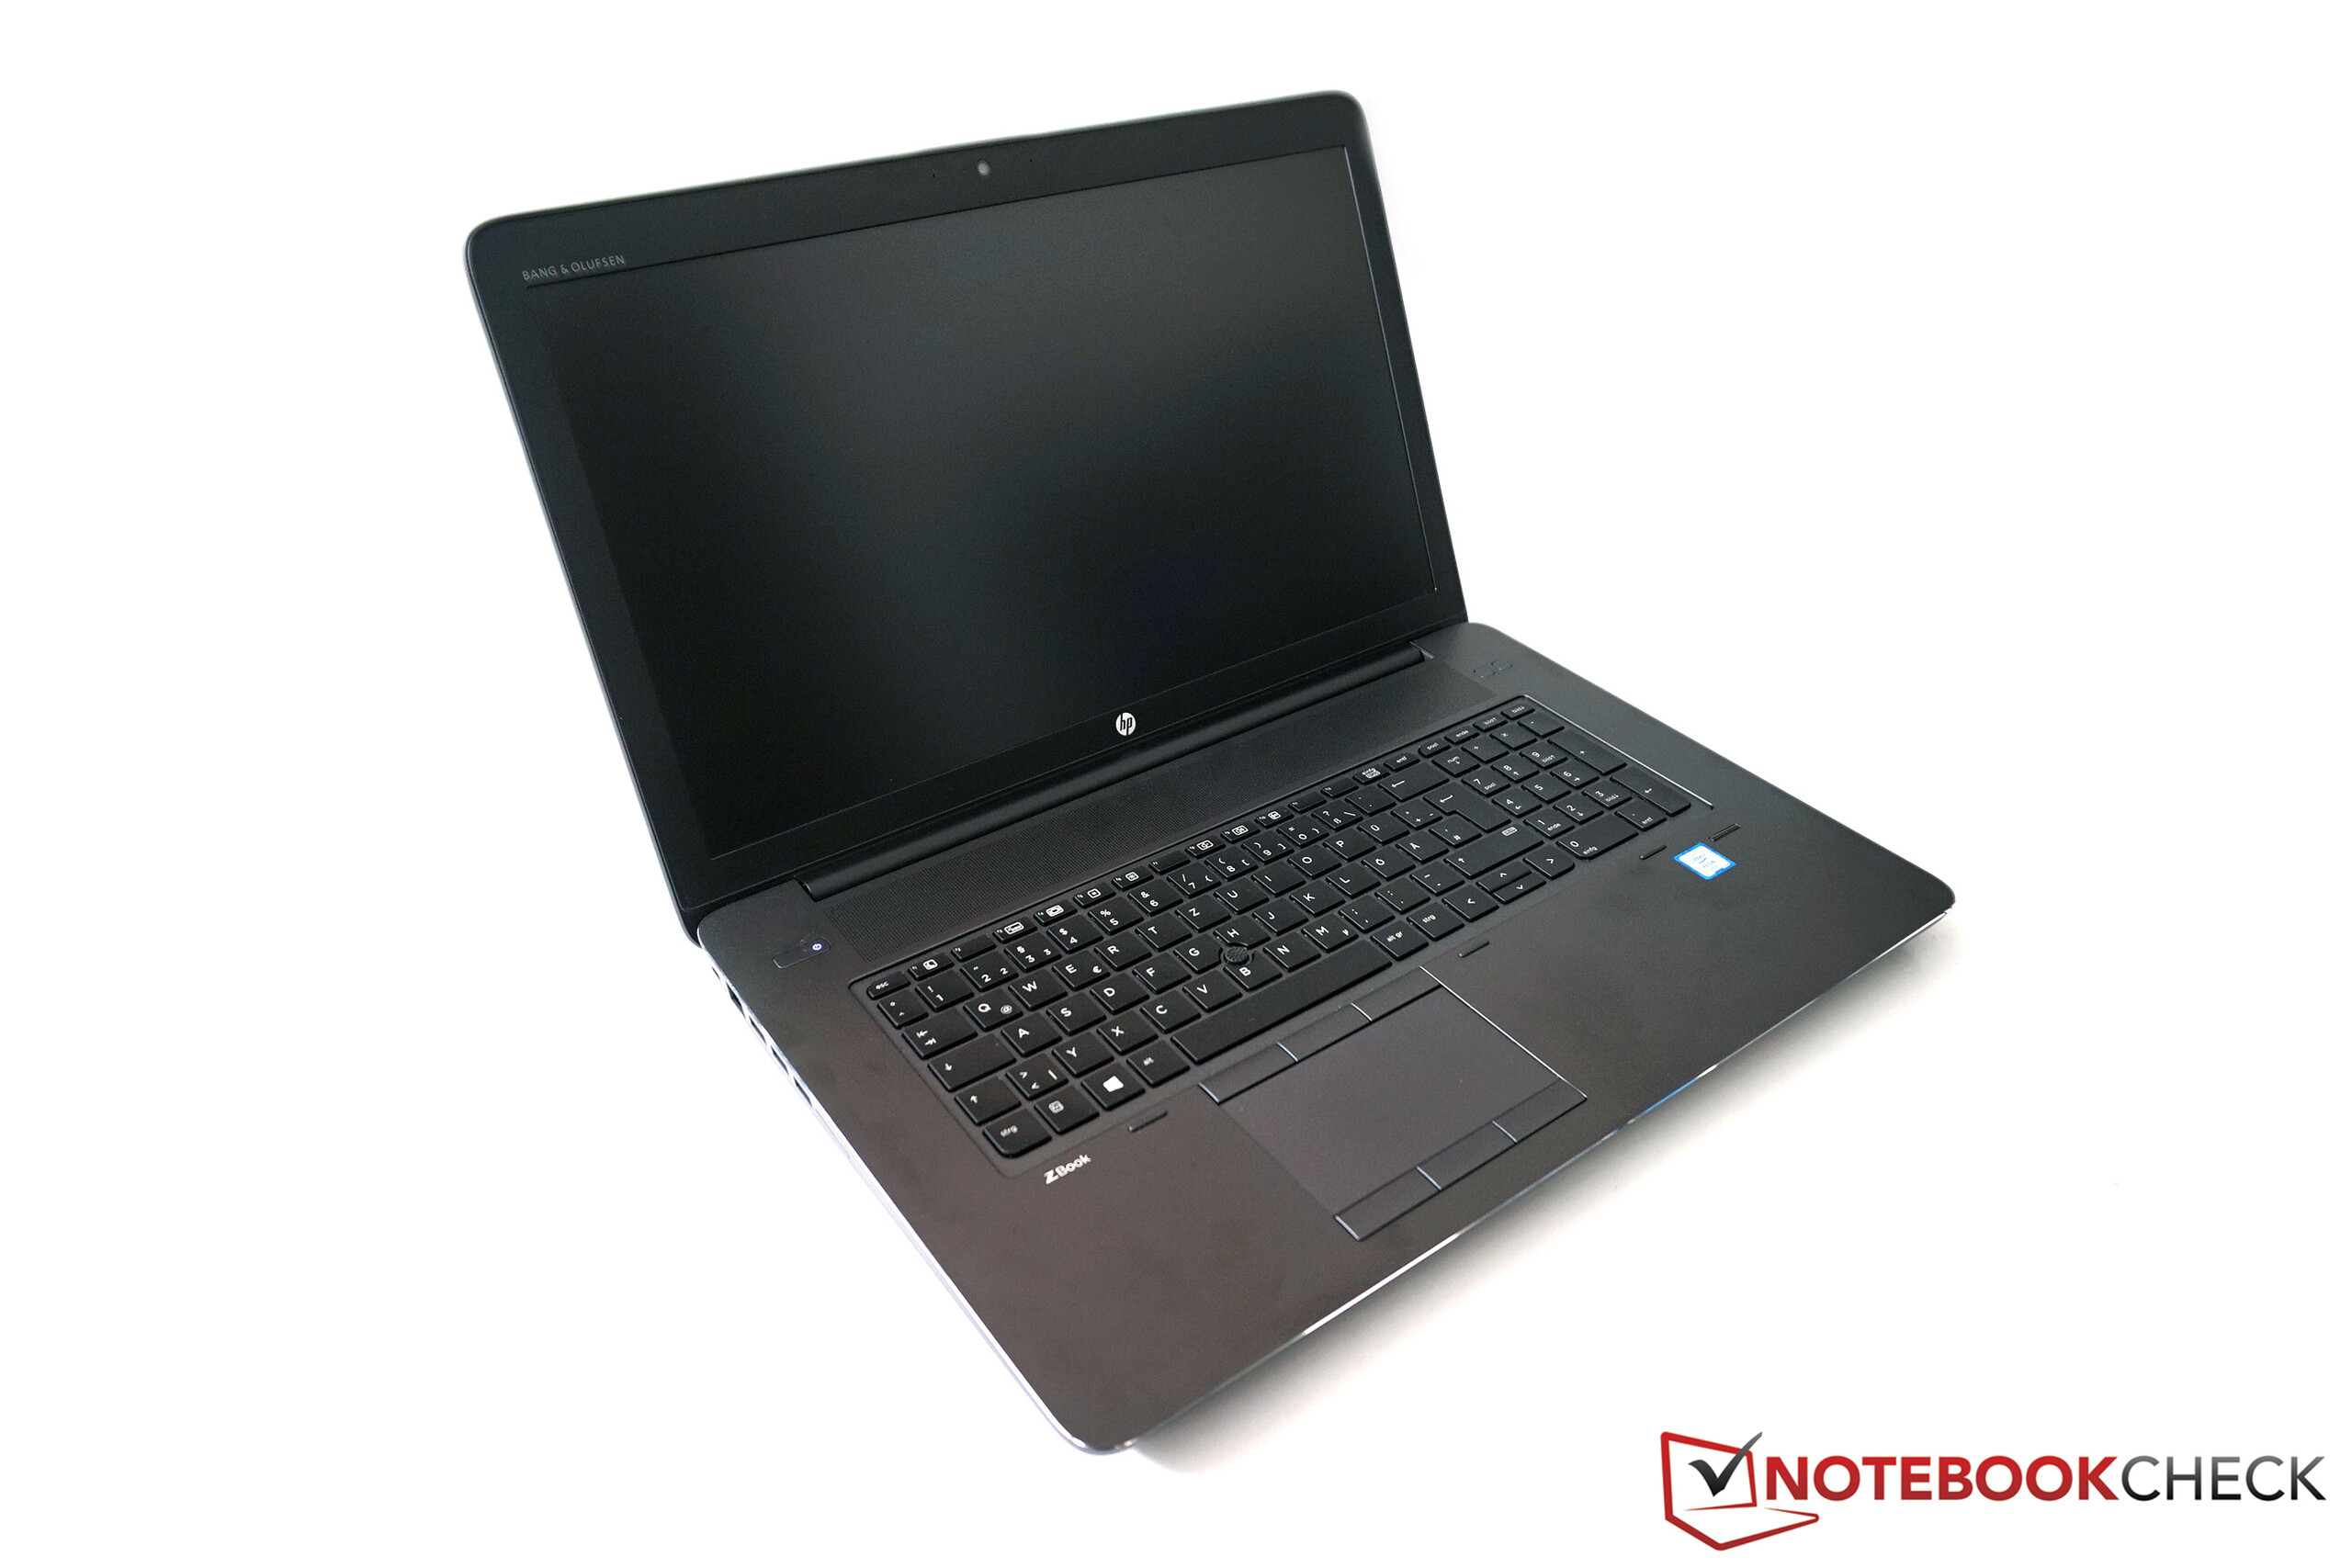
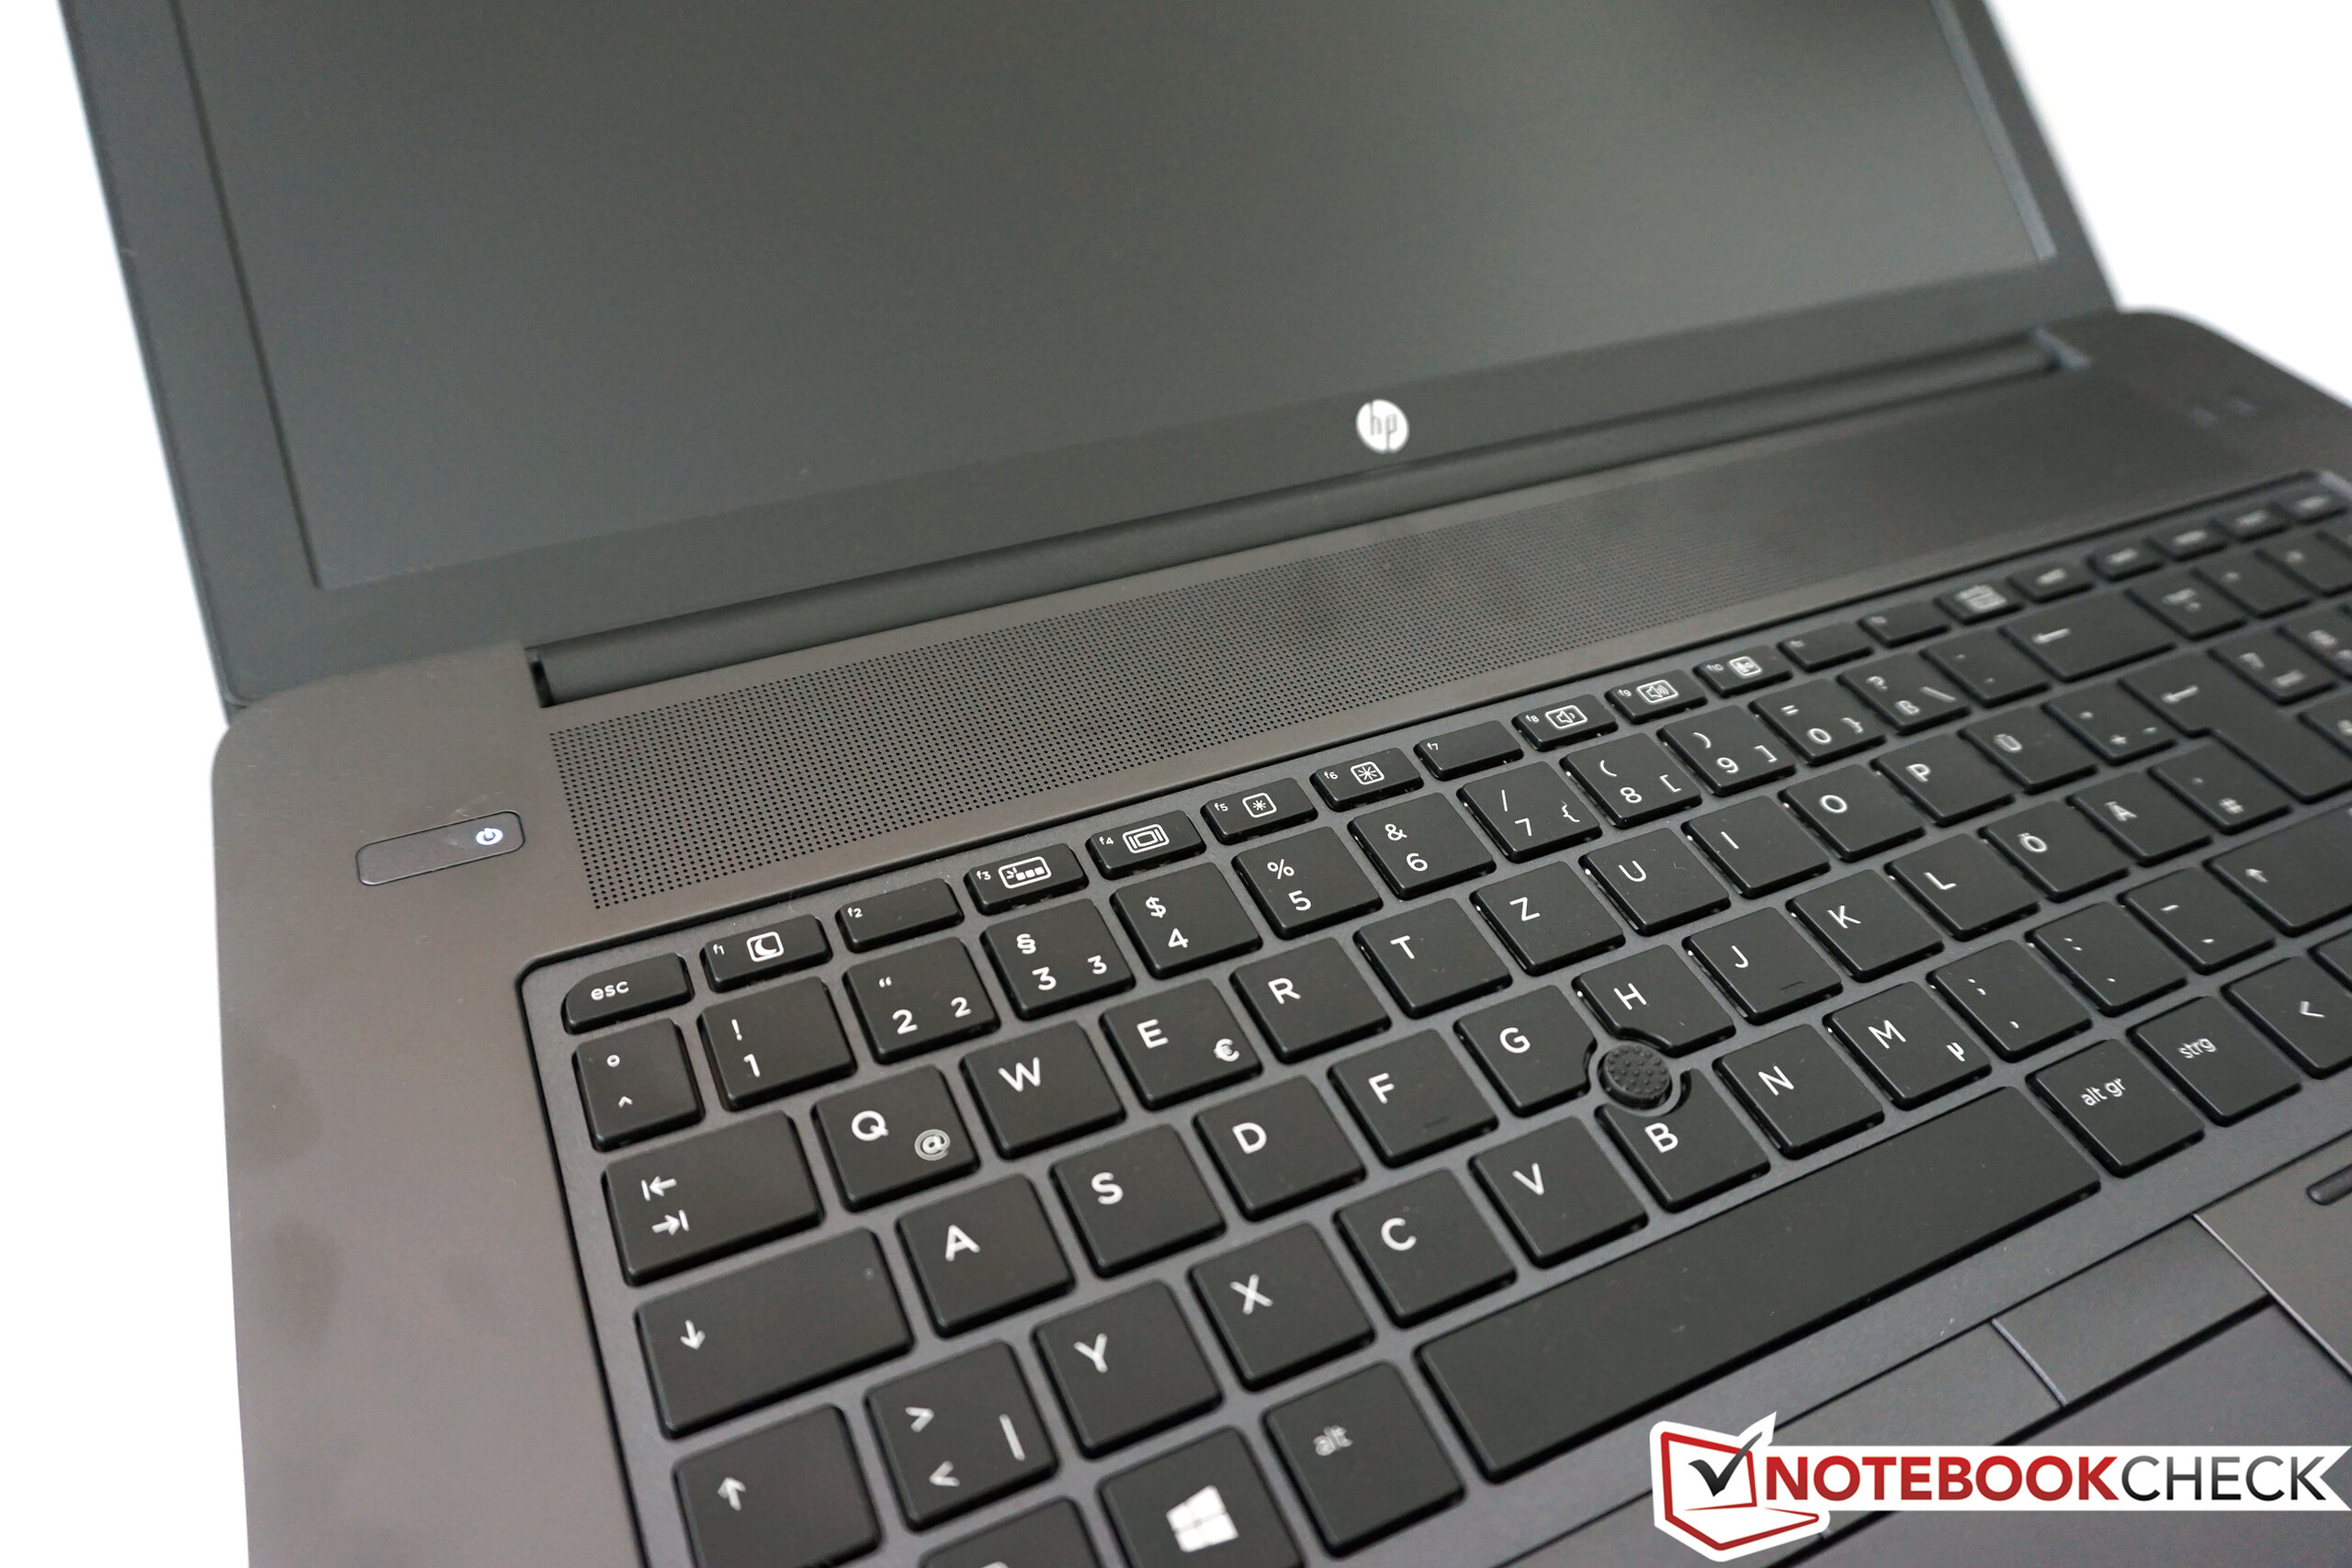
Breve análisis de la estación de trabajo HP ZBook 17 G3
Parpadeo de Pantalla / PWM (Pulse-Width Modulation)
| Parpadeo de Pantalla / PWM detectado | 200 Hz | ≤ 40 % de brillo | 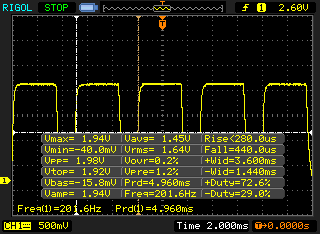 |
La retroiluminación del display parpadea a 200 Hz (seguramente usa PWM - Pulse-Width Modulation) a un brillo del 40 % e inferior. Sobre este nivel de brillo no debería darse parpadeo / PWM. La frecuencia de 200 Hz es relativamente baja, por lo que la gente sensible debería ver parpadeos y padecer fatiga visual por la pantalla (usado al brillo indicado a continuación). Comparación: 52 % de todos los dispositivos testados no usaron PWM para atenuar el display. Si se usó, medimos una media de 7784 (mínimo: 5 - máxmo: 343500) Hz. | |||
| |||||||||||||||||||||||||
iluminación: 86 %
Brillo con batería: 252 cd/m²
Contraste: 1200:1 (Negro: 0.21 cd/m²)
ΔE ColorChecker Calman: 2.2 | ∀{0.5-29.43 Ø4.73}
ΔE Greyscale Calman: 2.7 | ∀{0.09-98 Ø4.97}
97% sRGB (Calman 2D)
96% sRGB (Argyll 1.6.3 3D)
62% AdobeRGB 1998 (Argyll 1.6.3 3D)
69% AdobeRGB 1998 (Argyll 3D)
95.9% sRGB (Argyll 3D)
67.3% Display P3 (Argyll 3D)
Gamma: 2.28
CCT: 6686 K
| HP ZBook 17 G3 TZV66eA IPS, 1920x1080 | Dell Precision 7710 IPS LED, 1920x1080 | Lenovo ThinkPad P70 IPS, 3840x2160 | MSI WT72-6QM IPS, 1920x1080 | Bullman E-Klasse 5 AH-IPS WLED, 1920x1080 | HP ZBook 17 E9X11AA-ABA LED IPS, 1920x1080 | |
|---|---|---|---|---|---|---|
| Display | -0% | 21% | -7% | -8% | 25% | |
| Display P3 Coverage (%) | 67.3 | 66.6 -1% | 90.8 35% | 67.3 0% | 66.5 -1% | 85.7 27% |
| sRGB Coverage (%) | 95.9 | 96.9 1% | 100 4% | 85.4 -11% | 84.5 -12% | 100 4% |
| AdobeRGB 1998 Coverage (%) | 69 | 68.6 -1% | 85.4 24% | 62.5 -9% | 61.8 -10% | 99.2 44% |
| Response Times | -13% | 8% | 13% | |||
| Response Time Grey 50% / Grey 80% * (ms) | 50.4 ? | 50 ? 1% | 44 ? 13% | 42 ? 17% | ||
| Response Time Black / White * (ms) | 28.4 ? | 36 ? -27% | 27.6 ? 3% | 26 ? 8% | ||
| PWM Frequency (Hz) | 200 ? | 198 ? | 228 ? | 86 ? | ||
| Screen | -11% | -22% | -42% | -18% | 3% | |
| Brightness middle (cd/m²) | 252 | 332 32% | 365 45% | 303 20% | 355 41% | 320 27% |
| Brightness (cd/m²) | 243 | 307 26% | 341 40% | 298 23% | 335 38% | 311 28% |
| Brightness Distribution (%) | 86 | 83 -3% | 85 -1% | 94 9% | 89 3% | 88 2% |
| Black Level * (cd/m²) | 0.21 | 0.33 -57% | 0.4 -90% | 0.46 -119% | 0.44 -110% | 0.359 -71% |
| Contrast (:1) | 1200 | 1006 -16% | 913 -24% | 659 -45% | 807 -33% | 891 -26% |
| Colorchecker dE 2000 * | 2.2 | 3 -36% | 3.8 -73% | 5.77 -162% | 3.73 -70% | 2.04 7% |
| Colorchecker dE 2000 max. * | 3.8 | |||||
| Greyscale dE 2000 * | 2.7 | 4 -48% | 6.09 -126% | 4.87 -80% | 2.84 -5% | 2.45 9% |
| Gamma | 2.28 96% | 2 110% | 2.3 96% | 1.99 111% | 2.12 104% | 2.28 96% |
| CCT | 6686 97% | 7089 92% | 6332 103% | 7363 88% | 6457 101% | 6518 100% |
| Color Space (Percent of AdobeRGB 1998) (%) | 62 | 62 0% | 76.01 23% | 56.04 -10% | 55.45 -11% | 93 50% |
| Color Space (Percent of sRGB) (%) | 96 | 97 1% | 99.97 4% | 85.27 -11% | 84.39 -12% | 100 4% |
| Media total (Programa/Opciones) | -8% /
-9% | 2% /
-9% | -12% /
-26% | -13% /
-15% | 14% /
9% |
* ... más pequeño es mejor
Tiempos de respuesta del display
| ↔ Tiempo de respuesta de Negro a Blanco | ||
|---|---|---|
| 28.4 ms ... subida ↗ y bajada ↘ combinada | ↗ 7.2 ms subida | 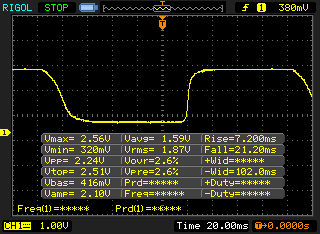 |
| ↘ 21.2 ms bajada | ||
| La pantalla mostró tiempos de respuesta relativamente lentos en nuestros tests pero podría ser demasiado lenta para los jugones. En comparación, todos los dispositivos de prueba van de ##min### (mínimo) a 240 (máximo) ms. » 75 % de todos los dispositivos son mejores. Eso quiere decir que el tiempo de respuesta es peor que la media (19.9 ms) de todos los dispositivos testados. | ||
| ↔ Tiempo de respuesta 50% Gris a 80% Gris | ||
| 50.4 ms ... subida ↗ y bajada ↘ combinada | ↗ 17.2 ms subida | 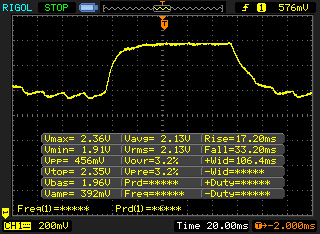 |
| ↘ 33.2 ms bajada | ||
| La pantalla mostró tiempos de respuesta lentos en nuestros tests y podría ser demasiado lenta para los jugones. En comparación, todos los dispositivos de prueba van de ##min### (mínimo) a 636 (máximo) ms. » 87 % de todos los dispositivos son mejores. Eso quiere decir que el tiempo de respuesta es peor que la media (31.1 ms) de todos los dispositivos testados. | ||
| Cinebench R15 | |
| CPU Multi 64Bit | |
| Bullman E-Klasse 5 | |
| Dell Precision 7710 | |
| HP ZBook 17 G3 TZV66eA | |
| MSI WT72-6QM | |
| Lenovo ThinkPad P70 | |
| HP ZBook 17 G2 J8Z55ET | |
| CPU Single 64Bit | |
| Bullman E-Klasse 5 | |
| Dell Precision 7710 | |
| MSI WT72-6QM | |
| HP ZBook 17 G3 TZV66eA | |
| Lenovo ThinkPad P70 | |
| HP ZBook 17 G2 J8Z55ET | |
| Cinebench R11.5 | |
| CPU Multi 64Bit | |
| Bullman E-Klasse 5 | |
| Dell Precision 7710 | |
| HP ZBook 17 G3 TZV66eA | |
| MSI WT72-6QM | |
| Lenovo ThinkPad P70 | |
| HP ZBook 17 G2 J8Z55ET | |
| CPU Single 64Bit | |
| Bullman E-Klasse 5 | |
| Dell Precision 7710 | |
| HP ZBook 17 G3 TZV66eA | |
| MSI WT72-6QM | |
| Lenovo ThinkPad P70 | |
| HP ZBook 17 G2 J8Z55ET | |
| Cinebench R10 | |
| Rendering Multiple CPUs 32Bit | |
| Bullman E-Klasse 5 | |
| Dell Precision 7710 | |
| HP ZBook 17 G3 TZV66eA | |
| MSI WT72-6QM | |
| Lenovo ThinkPad P70 | |
| HP ZBook 17 G2 J8Z55ET | |
| Rendering Single 32Bit | |
| Bullman E-Klasse 5 | |
| Dell Precision 7710 | |
| HP ZBook 17 G3 TZV66eA | |
| MSI WT72-6QM | |
| Lenovo ThinkPad P70 | |
| HP ZBook 17 G2 J8Z55ET | |
| Rendering Multiple CPUs 64Bit | |
| Bullman E-Klasse 5 | |
| HP ZBook 17 G3 TZV66eA | |
| Dell Precision 7710 | |
| MSI WT72-6QM | |
| Lenovo ThinkPad P70 | |
| HP ZBook 17 G2 J8Z55ET | |
| Rendering Single CPUs 64Bit | |
| Bullman E-Klasse 5 | |
| Dell Precision 7710 | |
| MSI WT72-6QM | |
| HP ZBook 17 G3 TZV66eA | |
| Lenovo ThinkPad P70 | |
| HP ZBook 17 G2 J8Z55ET | |
| PCMark 7 - Score | |
| MSI WT72-6QM | |
| Bullman E-Klasse 5 | |
| HP ZBook 17 G3 TZV66eA | |
| Dell Precision 7710 | |
| Lenovo ThinkPad P70 | |
| HP ZBook 17 G2 J8Z55ET | |
| PCMark 8 | |
| Work Score Accelerated v2 | |
| MSI WT72-6QM | |
| Dell Precision 7710 | |
| Bullman E-Klasse 5 | |
| HP ZBook 17 G3 TZV66eA | |
| HP ZBook 17 G2 J8Z55ET | |
| Lenovo ThinkPad P70 | |
| Creative Score Accelerated v2 | |
| Dell Precision 7710 | |
| HP ZBook 17 G2 J8Z55ET | |
| Bullman E-Klasse 5 | |
| HP ZBook 17 G3 TZV66eA | |
| Home Score Accelerated v2 | |
| Dell Precision 7710 | |
| MSI WT72-6QM | |
| HP ZBook 17 G2 J8Z55ET | |
| Bullman E-Klasse 5 | |
| HP ZBook 17 G3 TZV66eA | |
| Lenovo ThinkPad P70 | |
| PCMark 7 Score | 5487 puntos | |
| PCMark 8 Home Score Accelerated v2 | 4133 puntos | |
| PCMark 8 Creative Score Accelerated v2 | 4564 puntos | |
| PCMark 8 Work Score Accelerated v2 | 5271 puntos | |
ayuda | ||

| LuxMark v2.0 64Bit | |
| Room GPUs-only | |
| MSI WT72-6QM | |
| HP ZBook 17 G3 TZV66eA | |
| Lenovo ThinkPad P70 | |
| Dell Precision 7710 | |
| HP ZBook 17 G2 J8Z55ET | |
| Bullman E-Klasse 5 | |
| Sala GPUs-only | |
| HP ZBook 17 G3 TZV66eA | |
| Lenovo ThinkPad P70 | |
| MSI WT72-6QM | |
| Dell Precision 7710 | |
| HP ZBook 17 G2 J8Z55ET | |
| Bullman E-Klasse 5 | |
| SiSoft Sandra 2016 | |
| Image Processing | |
| Dell Precision 7710 | |
| Lenovo ThinkPad P70 | |
| HP ZBook 17 G3 TZV66eA | |
| GP Cryptography (Higher Security AES256+SHA2-512) | |
| HP ZBook 17 G3 TZV66eA | |
| Dell Precision 7710 | |
| Lenovo ThinkPad P70 | |
| GP Financial Analysis (FP High/Double Precision) | |
| Dell Precision 7710 | |
| Lenovo ThinkPad P70 | |
| HP ZBook 17 G3 TZV66eA | |
| Unigine Heaven 3.0 | |
| 1920x1080 DX 11, Normal Tessellation, High Shaders AA:Off AF:Off | |
| MSI WT72-6QM | |
| HP ZBook 17 G3 TZV66eA | |
| Lenovo ThinkPad P70 | |
| Dell Precision 7710 | |
| HP ZBook 17 G2 J8Z55ET | |
| Bullman E-Klasse 5 | |
| 1920x1080 OpenGL, Normal Tessellation, High Shaders AA:Off AF:Off | |
| MSI WT72-6QM | |
| HP ZBook 17 G3 TZV66eA | |
| Dell Precision 7710 | |
| HP ZBook 17 G2 J8Z55ET | |
| Lenovo ThinkPad P70 | |
| Bullman E-Klasse 5 | |
| Unigine Valley 1.0 | |
| 1920x1080 Extreme HD DirectX AA:x8 | |
| MSI WT72-6QM | |
| HP ZBook 17 G3 TZV66eA | |
| Lenovo ThinkPad P70 | |
| Dell Precision 7710 | |
| 1920x1080 Extreme HD Preset OpenGL AA:x8 | |
| HP ZBook 17 G3 TZV66eA | |
| Dell Precision 7710 | |
| Lenovo ThinkPad P70 | |
| 3DMark | |
| 1920x1080 Fire Strike Score | |
| MSI WT72-6QM | |
| Acer Predator 15 G9-592-7925 | |
| Dell Precision 7710 | |
| HP ZBook 17 G3 TZV66eA | |
| Lenovo ThinkPad P70 | |
| Schenker XMG A726 | |
| MSI GE62-6QD16H11 | |
| HP ZBook 17 G2 J8Z55ET | |
| Bullman E-Klasse 5 | |
| 1920x1080 Fire Strike Graphics | |
| MSI WT72-6QM | |
| Acer Predator 15 G9-592-7925 | |
| Dell Precision 7710 | |
| HP ZBook 17 G3 TZV66eA | |
| Lenovo ThinkPad P70 | |
| Schenker XMG A726 | |
| MSI GE62-6QD16H11 | |
| HP ZBook 17 G2 J8Z55ET | |
| Bullman E-Klasse 5 | |
| 3DMark 06 Standard Score | 27895 puntos | |
| 3DMark 11 Performance | 8586 puntos | |
| 3DMark Ice Storm Standard Score | 91685 puntos | |
| 3DMark Cloud Gate Standard Score | 23083 puntos | |
| 3DMark Fire Strike Score | 6108 puntos | |
ayuda | ||
| bajo | medio | alto | ultra | |
|---|---|---|---|---|
| BioShock Infinite (2013) | 226.3 | 182.7 | 166.7 | 69.8 |
| The Witcher 3 (2015) | 122.7 | 74.6 | 42.4 | 22.5 |
| Rise of the Tomb Raider (2016) | 114.9 | 69.9 | 40.2 | 33.4 |
Ruido
| Ocioso |
| 30 / 30 / 30 dB(A) |
| Carga |
| 48.9 / 48.9 dB(A) |
 | ||
30 dB silencioso 40 dB(A) audible 50 dB(A) ruidosamente alto |
||
min: | ||
| HP ZBook 17 G3 TZV66eA Quadro M3000M | Dell Precision 7710 FirePro W7170M | Lenovo ThinkPad P70 Quadro M3000M | MSI WT72-6QM Quadro M5000M | Bullman E-Klasse 5 Quadro K3100M | HP ZBook 17 G2 J8Z55ET FirePro M6100 | |
|---|---|---|---|---|---|---|
| Noise | 3% | 7% | 1% | 3% | 2% | |
| apagado / medio ambiente * (dB) | 30 | 30 -0% | 30 -0% | |||
| Idle Minimum * (dB) | 30 | 30 -0% | 30 -0% | 33.3 -11% | 28.5 5% | 29.2 3% |
| Idle Average * (dB) | 30 | 30 -0% | 30 -0% | 33.4 -11% | 28.5 5% | 29.9 -0% |
| Idle Maximum * (dB) | 30 | 30 -0% | 30 -0% | 33.5 -12% | 28.5 5% | 29.9 -0% |
| Load Average * (dB) | 48.9 | 43.2 12% | 36.5 25% | 38.8 21% | 47.8 2% | 46.8 4% |
| Load Maximum * (dB) | 48.9 | 47.13 4% | 40.8 17% | 40.2 18% | 50.8 -4% | 46.8 4% |
* ... más pequeño es mejor
(-) La temperatura máxima en la parte superior es de 55.5 °C / 132 F, frente a la media de 38.2 °C / 101 F, que oscila entre 22.2 y 69.8 °C para la clase Workstation.
(-) El fondo se calienta hasta un máximo de 55.8 °C / 132 F, frente a la media de 41.1 °C / 106 F
(+) En reposo, la temperatura media de la parte superior es de 26.4 °C / 80# F, frente a la media del dispositivo de 32 °C / 90 F.
(+) El reposamanos y el panel táctil están a una temperatura inferior a la de la piel, con un máximo de 29.4 °C / 84.9 F y, por tanto, son fríos al tacto.
(±) La temperatura media de la zona del reposamanos de dispositivos similares fue de 27.8 °C / 82 F (-1.6 °C / -2.9 F).
| HP ZBook 17 G3 TZV66eA E3-1535M v5, Quadro M3000M | Dell Precision 7710 E3-1535M v5, FirePro W7170M | Lenovo ThinkPad P70 6820HQ, Quadro M3000M | MSI WT72-6QM E3-1505M v5, Quadro M5000M | Bullman E-Klasse 5 4790K, Quadro K3100M | HP ZBook 17 G2 J8Z55ET 4710MQ, FirePro M6100 | |
|---|---|---|---|---|---|---|
| Heat | 6% | 12% | 5% | -12% | 12% | |
| Maximum Upper Side * (°C) | 55.5 | 35.6 36% | 39 30% | 40.6 27% | 42.3 24% | 39.2 29% |
| Maximum Bottom * (°C) | 55.8 | 55 1% | 35.4 37% | 42.6 24% | 44.2 21% | 37.2 33% |
| Idle Upper Side * (°C) | 29.1 | 29.3 -1% | 30.8 -6% | 28.2 3% | 41.6 -43% | 28.9 1% |
| Idle Bottom * (°C) | 29 | 32.8 -13% | 33.1 -14% | 38.6 -33% | 43.9 -51% | 33 -14% |
* ... más pequeño es mejor
| Off / Standby | |
| Ocioso | |
| Carga |
|
Clave:
min: | |
| HP ZBook 17 G3 TZV66eA E3-1535M v5, Quadro M3000M, 1920x1080 | Dell Precision 7710 E3-1535M v5, FirePro W7170M, 1920x1080 | Lenovo ThinkPad P70 6820HQ, Quadro M3000M, 3840x2160 | MSI WT72-6QM E3-1505M v5, Quadro M5000M, 1920x1080 | Bullman E-Klasse 5 4790K, Quadro K3100M, 1920x1080 | HP ZBook 17 G2 J8Z55ET 4710MQ, FirePro M6100, 1920x1080 | |
|---|---|---|---|---|---|---|
| Power Consumption | -47% | -31% | -108% | -175% | -164% | |
| Idle Minimum * (Watt) | 6.7 | 6.04 10% | 12.1 -81% | 24.8 -270% | 33.7 -403% | 29.7 -343% |
| Idle Average * (Watt) | 12.5 | 15.2 -22% | 19.7 -58% | 29.7 -138% | 39.3 -214% | 41.6 -233% |
| Idle Maximum * (Watt) | 13.2 | 42.3 -220% | 20.5 -55% | 30.1 -128% | 40.2 -205% | 42.3 -220% |
| Load Average * (Watt) | 128.2 | 112.8 12% | 94.3 26% | 105.2 18% | 148 -15% | 136.1 -6% |
| Load Maximum * (Watt) | 158.9 | 182.2 -15% | 139.6 12% | 192.2 -21% | 221 -39% | 184 -16% |
* ... más pequeño es mejor
| HP ZBook 17 G3 TZV66eA 96 Wh, mAh | Dell Precision 7710 72 Wh, mAh | Lenovo ThinkPad P70 96 Wh, mAh | MSI WT72-6QM Wh, 86580 mAh | Bullman E-Klasse 5 82 Wh, mAh | HP ZBook 17 G2 J8Z55ET 75 Wh, mAh | |
|---|---|---|---|---|---|---|
| Duración de Batería | -5% | -4% | -33% | -53% | -64% | |
| Reader / Idle (h) | 15.9 | 12.9 -19% | 7.7 -52% | 6.9 -57% | 2.8 -82% | 2.7 -83% |
| H.264 (h) | 5 | 4.7 -6% | 7.5 50% | 2.1 -58% | 2.4 -52% | |
| WiFi v1.3 (h) | 4.8 | 6.1 27% | 6 25% | 4.1 -15% | 2.4 -50% | |
| Load (h) | 1.8 | 1.4 -22% | 1.1 -39% | 1.3 -28% | 1.4 -22% | 0.8 -56% |
| WiFi (h) | 2.5 |
Pro
Contra
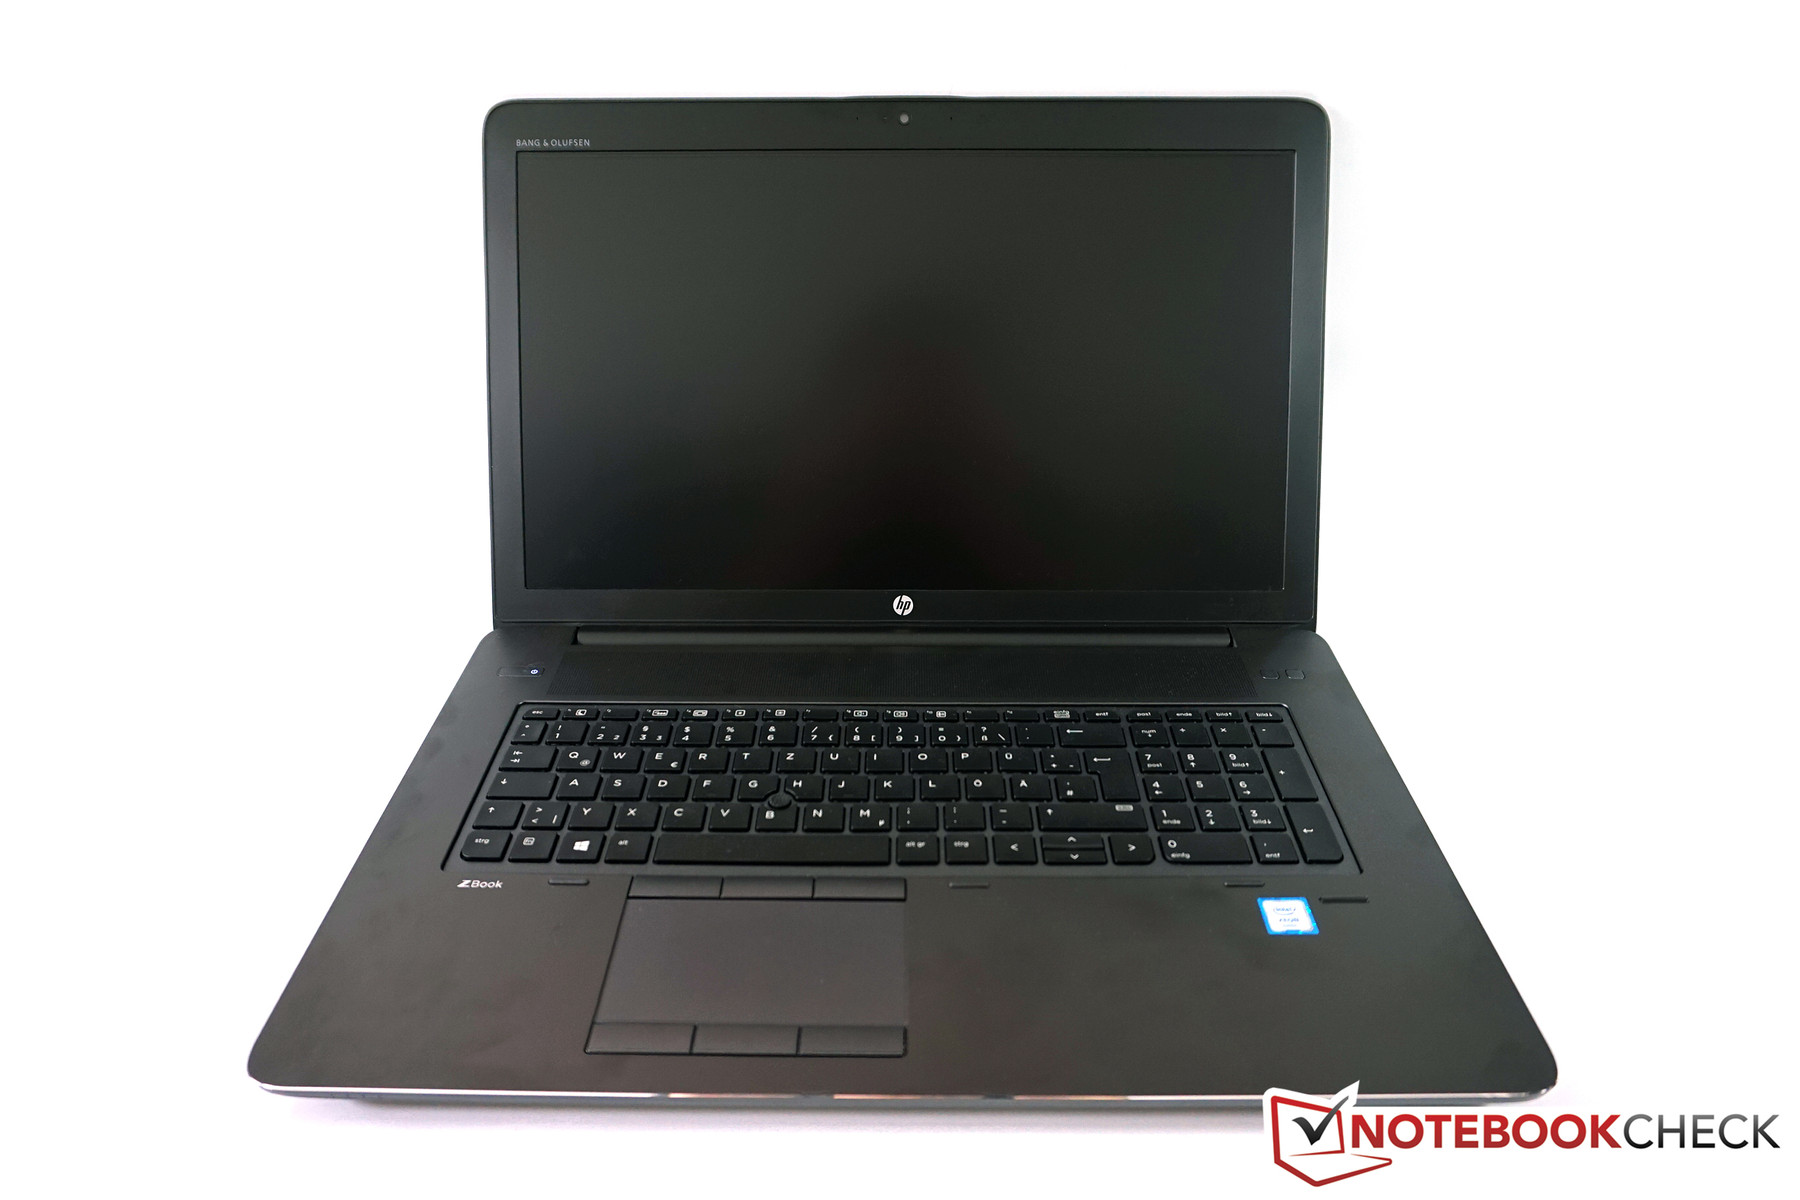
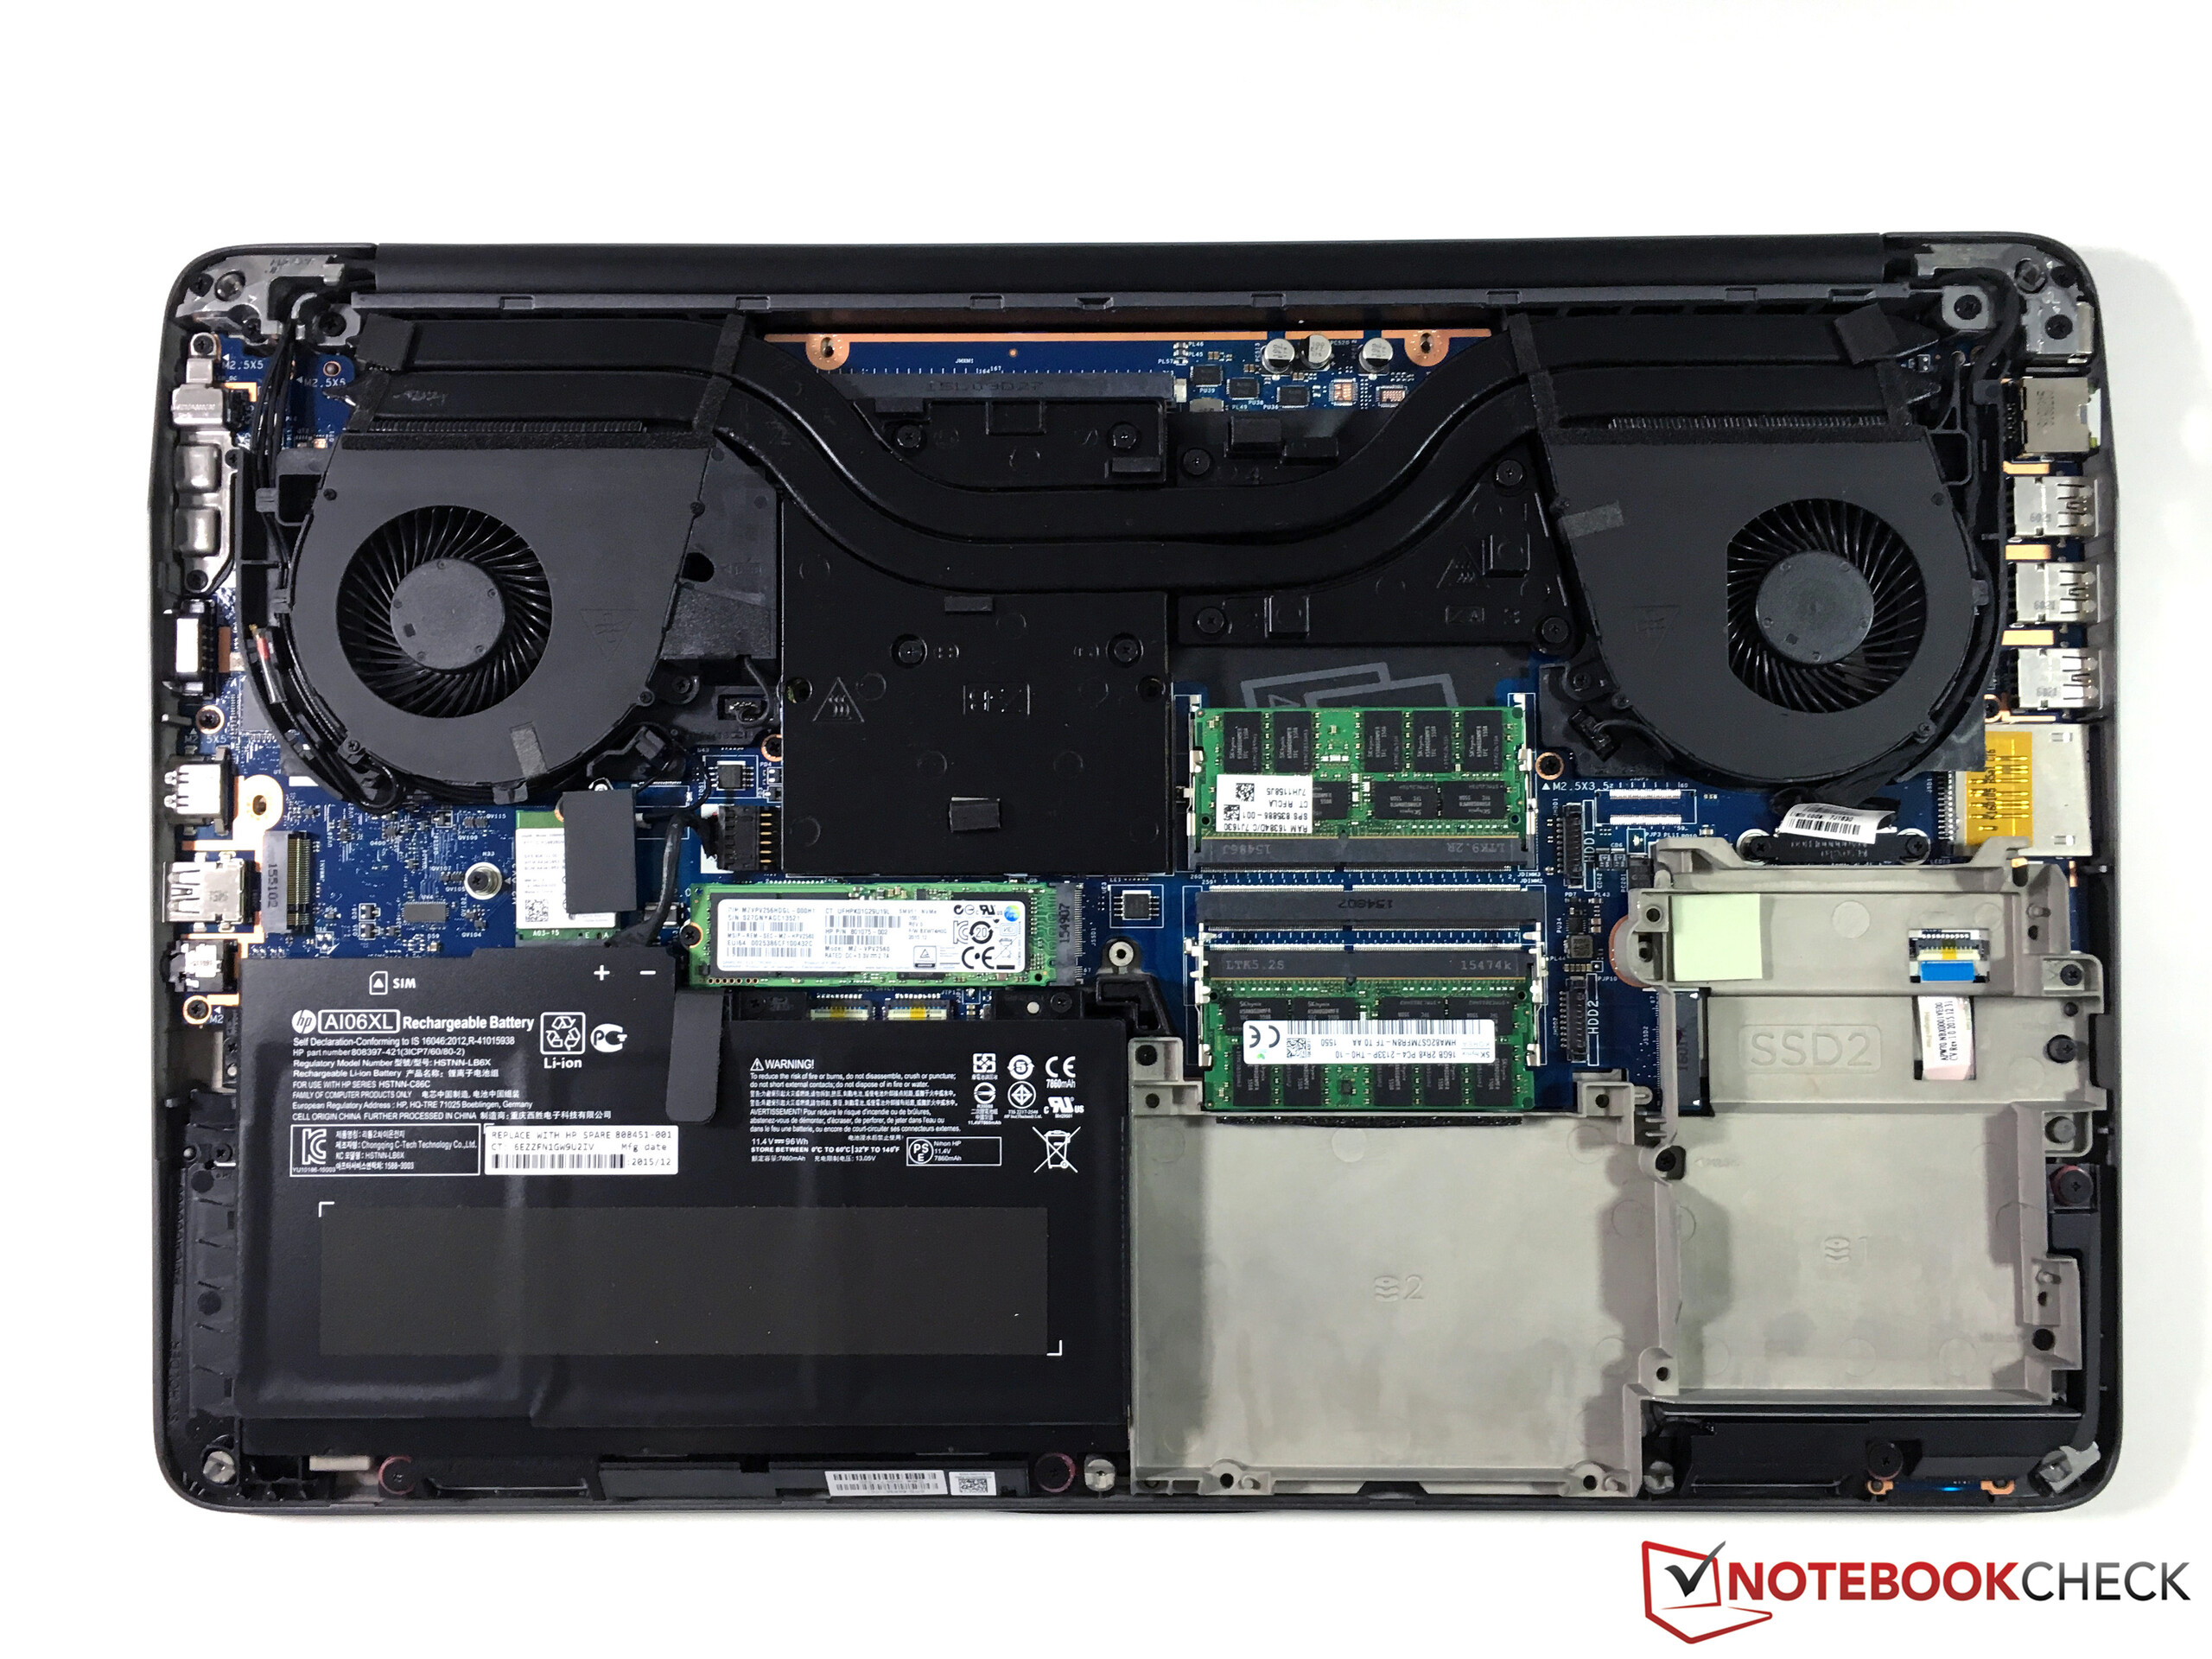
¿Es el HP ZBook 17 G3 la estación de trabajo perfecta? La respuesta es no, pero HP ofrece un dispositivo muy bueno. Nos gusta en particular el actual diseño de carcasa de la serie G3, que es de lo mejor que hay en términos de calidad. Tiene puertos modernos, un amplio abanico de componentes y la mantenibilidad es excelente.
Un defecto importante está en las emisiones, ya que algunos rivales rinden mucho mejor, a pesar de tener componentes de potencia similar. El display Full HD tampoco nos terminó de convencer de fábrica, y el contraste es muy alto, pero la iluminación es muy inferior respecto a los rivales, incluyendo el predecesor. El display opcional 4K DreamColor debería rendir mejor en este aspecto, pero todavía no hay configuraciones correspondientes. Otro problema de nuestro modelo de pruebas es la bisagra chirriante, pero lo consideramos un incidente aislado.
El HP ZBook 17 G3 es una estación de trabajo buenísima con interfaces modernas y un chasis excelente. La configuración testada, empero, es también uno de los dispositivos más caros de lejos, pero aún así los rivales le vencen en ciertas secciones.
Otro aspecto importante es obviamente el precio, y nuestro modelo de pruebas es extremadamente caro costando más de 4,500 Euros. Ciertamente merecerá la pena echar un vistazo a configuraciones de menos especificaciones, las cuales arrancan en unos 2,100 Euros. Hemos analizado todas las estaciones de trabajo actuales de los grandes fabricantes, y no es fácil decidir un claro ganador. El ZBook 17 G3 logra una valoración ligeramente superior, pero cada dispositivo tiene sus propias ventajas y defectos, por lo que las preferencias personales y el escenario de uso planeado serán también importantes. Las emisiones del ZBook 17 G3 en particular siguen siendo mejorables.
Ésta es una versión acortada del análisis original. Puedes leer el análisis completo en inglés aquí.
HP ZBook 17 G3 TZV66eA
- 05/24/2016 v5.1 (old)
Andreas Osthoff
Price comparison
