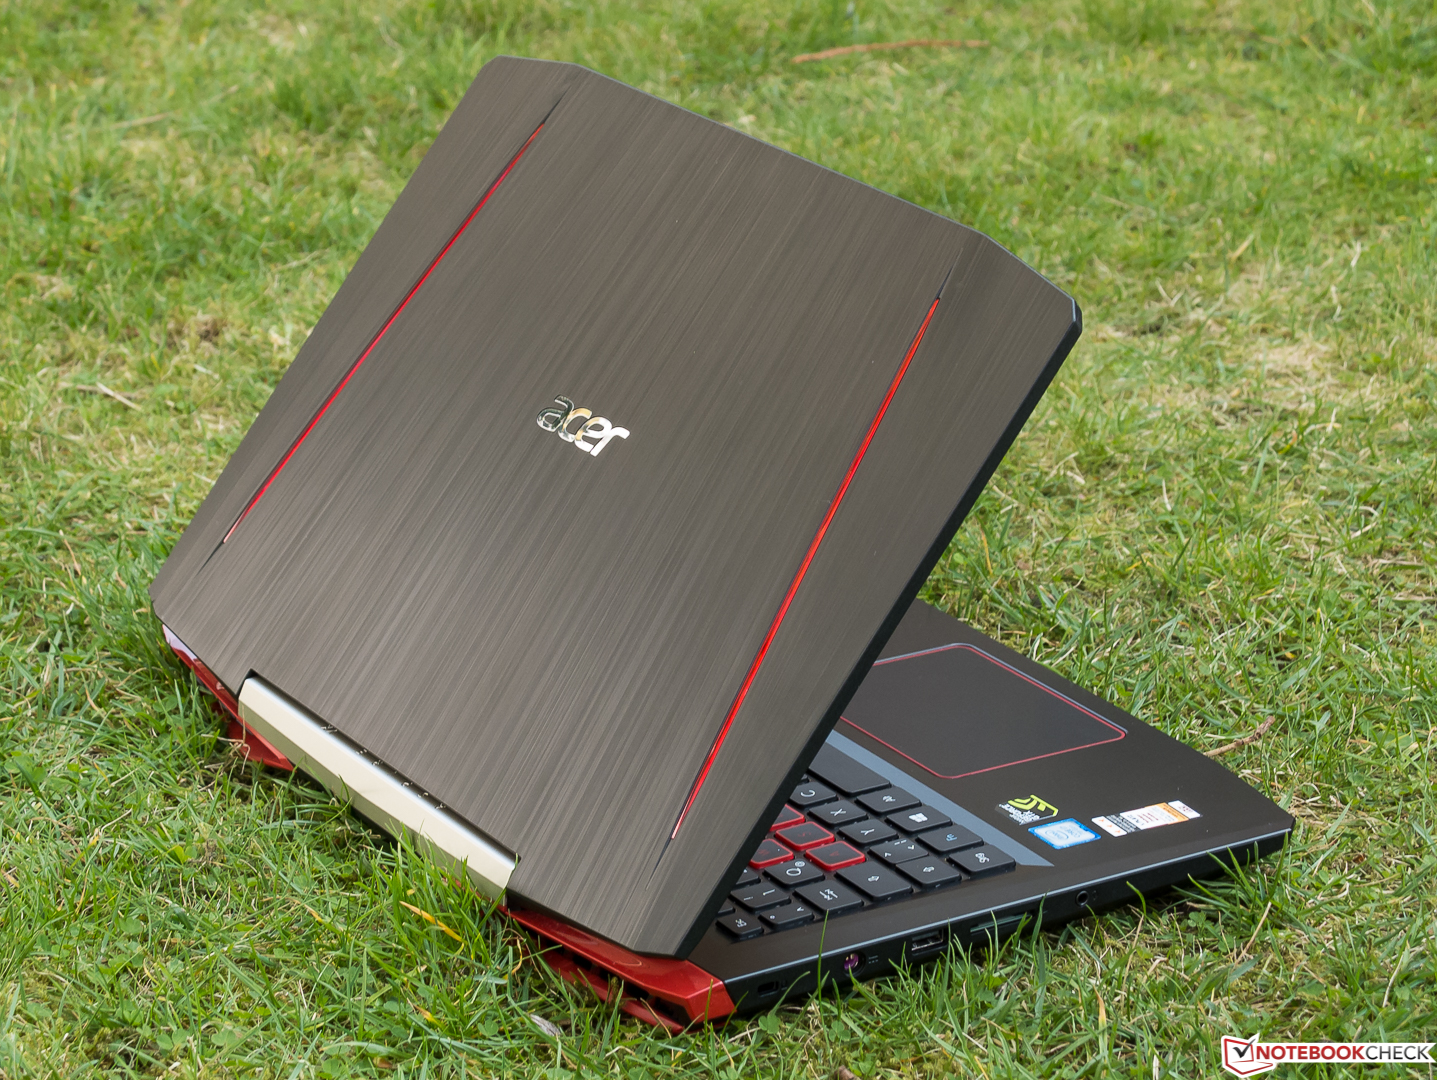
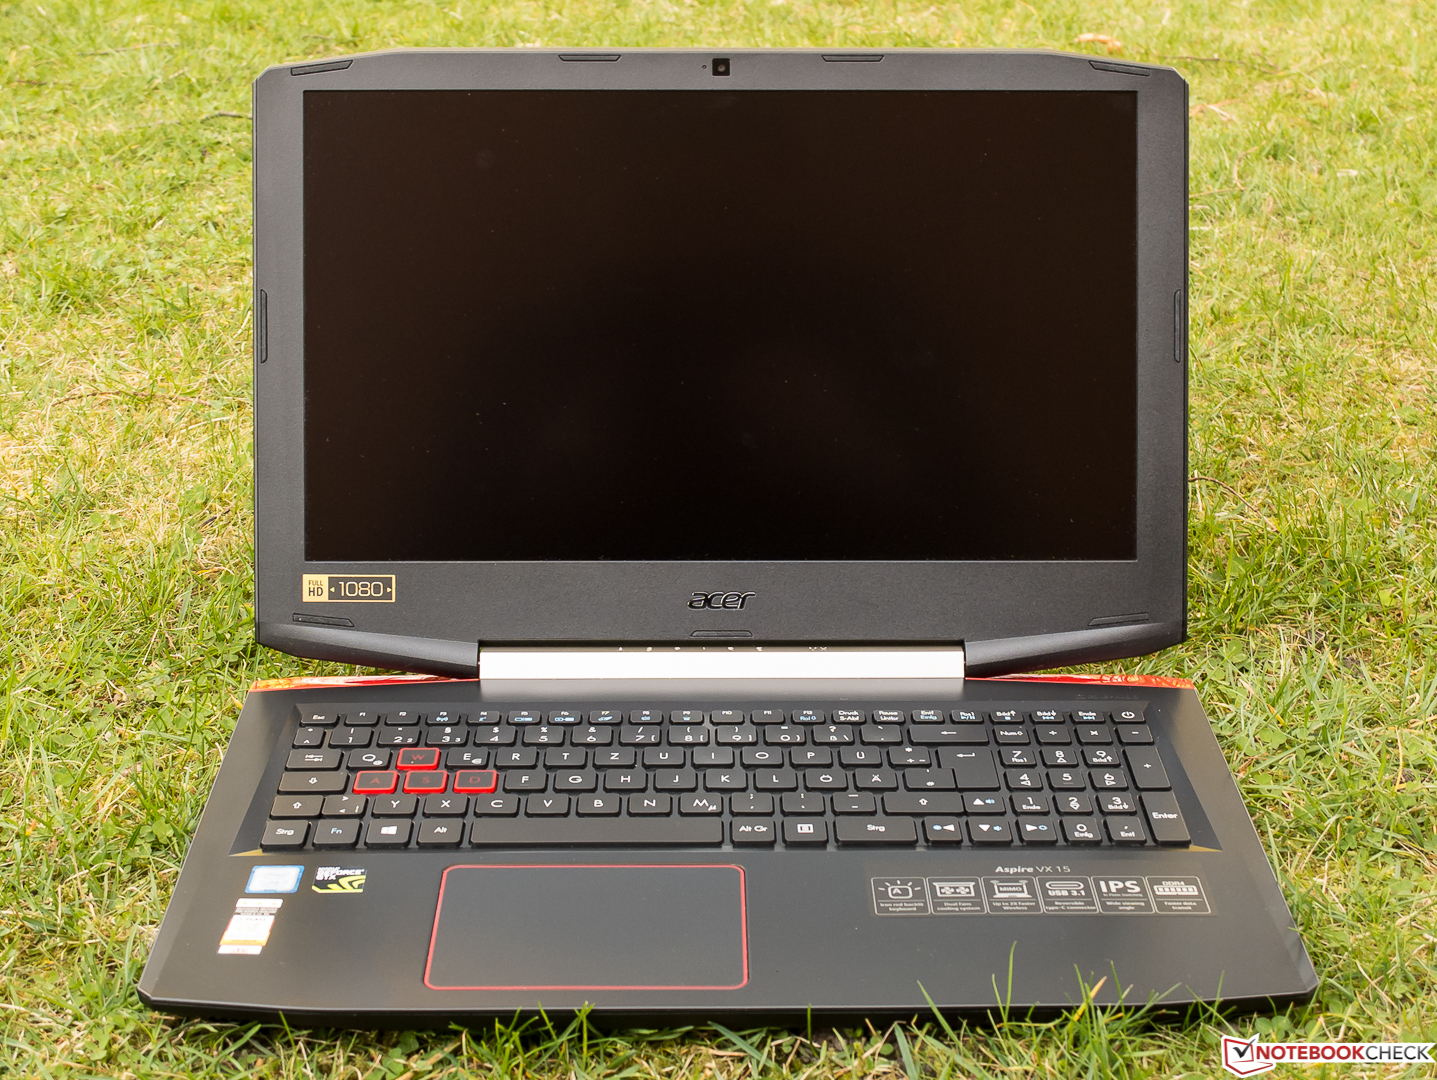
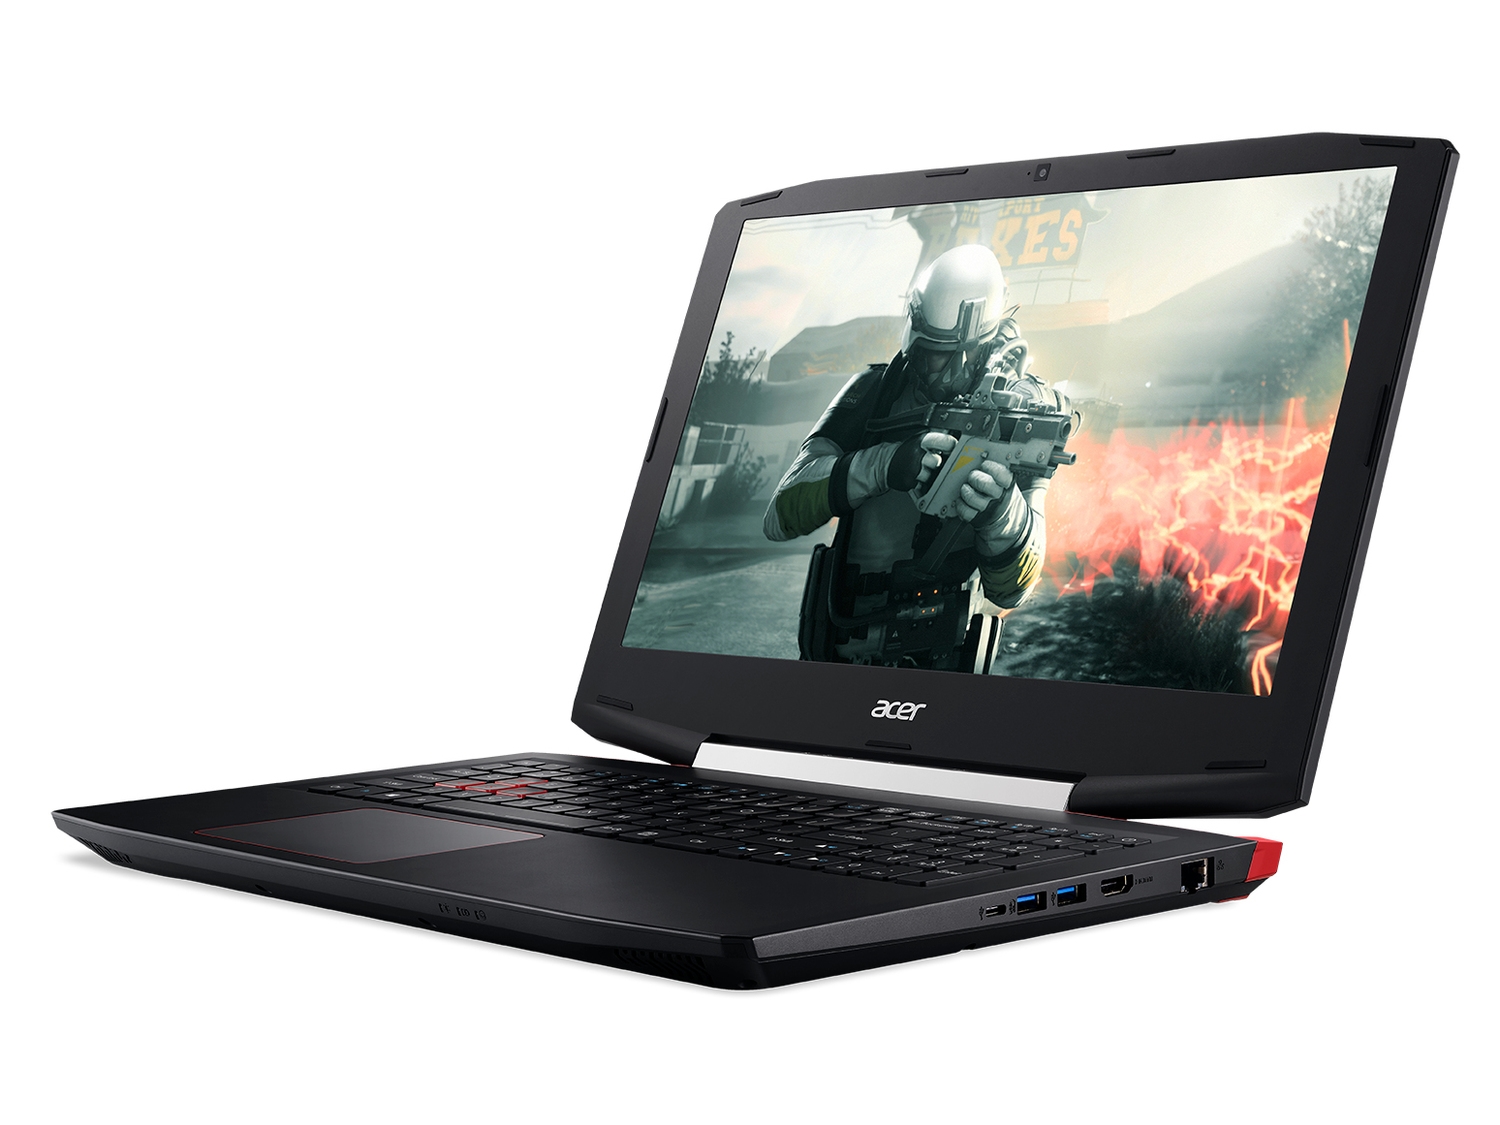
Breve análisis del Acer Aspire VX5-591G (7700HQ, FHD, GTX 1050 Ti)

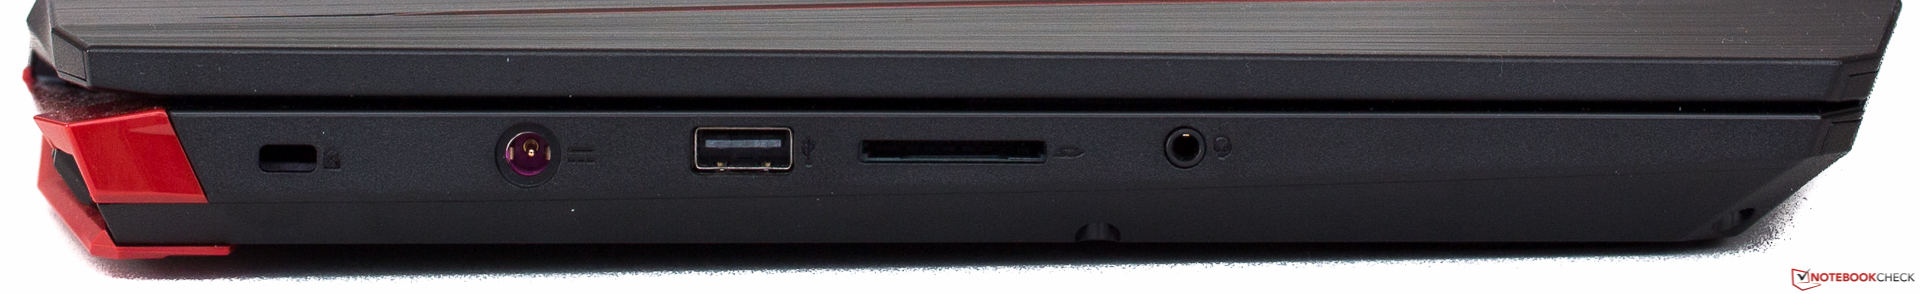
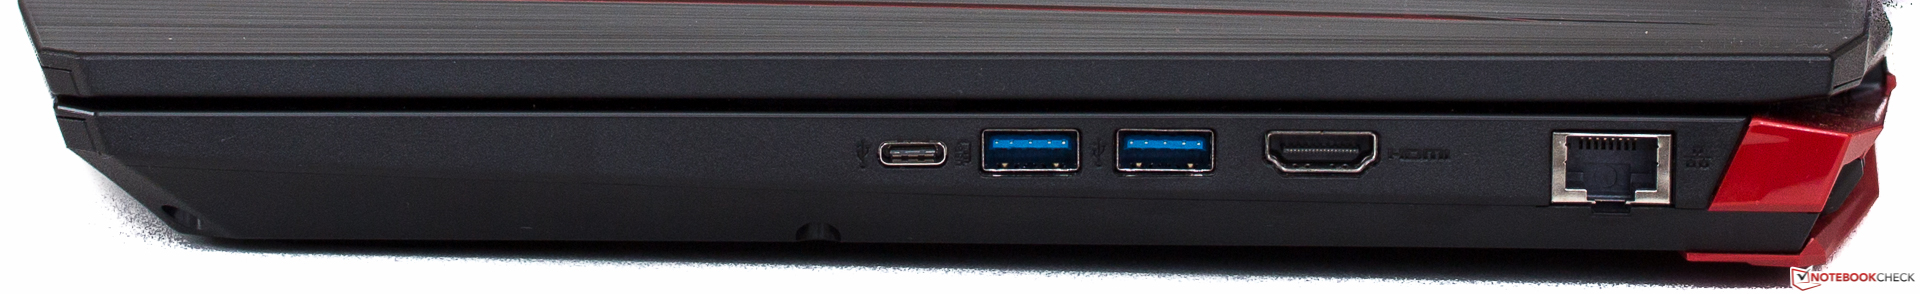
| SD Card Reader | |
| average JPG Copy Test (av. of 3 runs) | |
| Dell XPS 15 2017 9560 (7300HQ, Full-HD) | |
| Acer Aspire VX5-591G-75C4 VX15 | |
| Acer Aspire VN7-593G-73HP V15 Nitro BE | |
| Asus Zenbook UX510UW-CN044T | |
| maximum AS SSD Seq Read Test (1GB) | |
| Dell XPS 15 2017 9560 (7300HQ, Full-HD) | |
| Acer Aspire VX5-591G-75C4 VX15 | |
| Acer Aspire VN7-593G-73HP V15 Nitro BE | |
| Asus Zenbook UX510UW-CN044T | |
| |||||||||||||||||||||||||
iluminación: 85 %
Brillo con batería: 281 cd/m²
Contraste: 878:1 (Negro: 0.32 cd/m²)
ΔE ColorChecker Calman: 5.16 | ∀{0.5-29.43 Ø4.73}
ΔE Greyscale Calman: 4.57 | ∀{0.09-98 Ø4.97}
58% sRGB (Argyll 1.6.3 3D)
37% AdobeRGB 1998 (Argyll 1.6.3 3D)
40.2% AdobeRGB 1998 (Argyll 3D)
58.2% sRGB (Argyll 3D)
38.88% Display P3 (Argyll 3D)
Gamma: 2.59
CCT: 6931 K
| Acer Aspire VX5-591G-75C4 VX15 LG Philips LGD0550 / LP156WF6-SPK4, , 1920x1080, 15.6" | Acer Aspire VN7-593G-73HP V15 Nitro BE LG Display LP156WF6-SPP1, , 1920x1080, 15.6" | Dell XPS 15 2017 9560 (7300HQ, Full-HD) Sharp SHP1453 LQ156M1, , 1920x1080, 15.6" | Asus Zenbook UX510UW-CN044T LG Philips LP156WF6-SPB6, , 1920x1080, 15.6" | |
|---|---|---|---|---|
| Display | 57% | 74% | 47% | |
| Display P3 Coverage (%) | 38.88 | 65.8 69% | 68.9 77% | 61.5 58% |
| sRGB Coverage (%) | 58.2 | 85.1 46% | 98.9 70% | 80.4 38% |
| AdobeRGB 1998 Coverage (%) | 40.2 | 62.2 55% | 70.9 76% | 58.8 46% |
| Response Times | -67% | -137% | -48% | |
| Response Time Grey 50% / Grey 80% * (ms) | 22 ? | 41 ? -86% | 54 ? -145% | 40 ? -82% |
| Response Time Black / White * (ms) | 23 ? | 34 ? -48% | 52.4 ? -128% | 26 ? -13% |
| PWM Frequency (Hz) | ||||
| Screen | 16% | 27% | 7% | |
| Brightness middle (cd/m²) | 281 | 322 15% | 400 42% | 326 16% |
| Brightness (cd/m²) | 257 | 297 16% | 392 53% | 316 23% |
| Brightness Distribution (%) | 85 | 86 1% | 89 5% | 80 -6% |
| Black Level * (cd/m²) | 0.32 | 0.31 3% | 0.26 19% | 0.35 -9% |
| Contrast (:1) | 878 | 1039 18% | 1538 75% | 931 6% |
| Colorchecker dE 2000 * | 5.16 | 4.73 8% | 4.9 5% | 5.49 -6% |
| Colorchecker dE 2000 max. * | 9.09 | 12.37 -36% | 11 -21% | 11.36 -25% |
| Greyscale dE 2000 * | 4.57 | 2.99 35% | 7.2 -58% | 4.84 -6% |
| Gamma | 2.59 85% | 2.32 95% | 2.11 104% | 2.23 99% |
| CCT | 6931 94% | 6905 94% | 6911 94% | 5971 109% |
| Color Space (Percent of AdobeRGB 1998) (%) | 37 | 56 51% | 64.2 74% | 53 43% |
| Color Space (Percent of sRGB) (%) | 58 | 85 47% | 98.9 71% | 80 38% |
| Media total (Programa/Opciones) | 2% /
13% | -12% /
14% | 2% /
8% |
* ... más pequeño es mejor
Tiempos de respuesta del display
| ↔ Tiempo de respuesta de Negro a Blanco | ||
|---|---|---|
| 23 ms ... subida ↗ y bajada ↘ combinada | ↗ 13 ms subida | 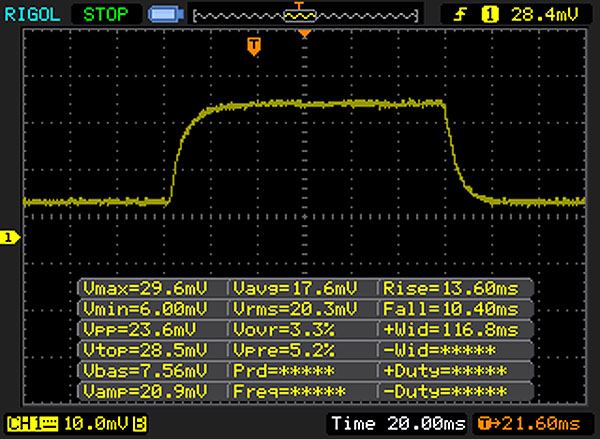 |
| ↘ 10 ms bajada | ||
| La pantalla mostró buenos tiempos de respuesta en nuestros tests pero podría ser demasiado lenta para los jugones competitivos. En comparación, todos los dispositivos de prueba van de ##min### (mínimo) a 240 (máximo) ms. » 52 % de todos los dispositivos son mejores. Eso quiere decir que el tiempo de respuesta es peor que la media (19.9 ms) de todos los dispositivos testados. | ||
| ↔ Tiempo de respuesta 50% Gris a 80% Gris | ||
| 22 ms ... subida ↗ y bajada ↘ combinada | ↗ 10 ms subida | 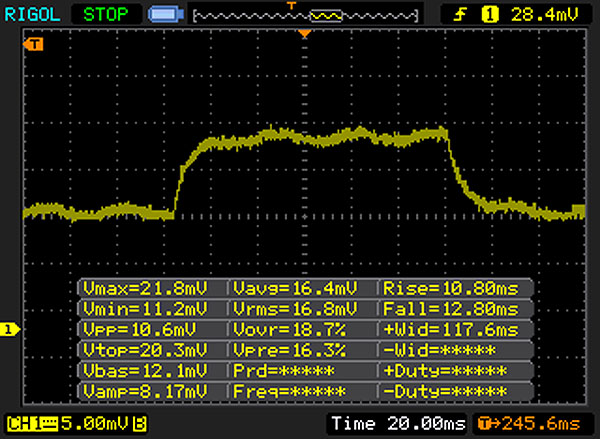 |
| ↘ 12 ms bajada | ||
| La pantalla mostró buenos tiempos de respuesta en nuestros tests pero podría ser demasiado lenta para los jugones competitivos. En comparación, todos los dispositivos de prueba van de ##min### (mínimo) a 636 (máximo) ms. » 33 % de todos los dispositivos son mejores. Esto quiere decir que el tiempo de respuesta medido es mejor que la media (31.1 ms) de todos los dispositivos testados. | ||
Parpadeo de Pantalla / PWM (Pulse-Width Modulation)
| Parpadeo de Pantalla / PWM no detectado | ||
Comparación: 52 % de todos los dispositivos testados no usaron PWM para atenuar el display. Si se usó, medimos una media de 7794 (mínimo: 5 - máxmo: 343500) Hz. | ||
| PCMark 8 | |
| Home Score Accelerated v2 | |
| Dell XPS 15 2017 9560 (7300HQ, Full-HD) | |
| Acer Aspire VX5-591G-75C4 VX15 | |
| Asus Zenbook UX510UW-CN044T | |
| Work Score Accelerated v2 | |
| Dell XPS 15 2017 9560 (7300HQ, Full-HD) | |
| Acer Aspire VX5-591G-75C4 VX15 | |
| Asus Zenbook UX510UW-CN044T | |
| PCMark 8 Home Score Accelerated v2 | 3565 puntos | |
| PCMark 8 Work Score Accelerated v2 | 4442 puntos | |
ayuda | ||
| Acer Aspire VX5-591G-75C4 VX15 Toshiba MQ01ABD100 | Acer Aspire VN7-593G-73HP V15 Nitro BE Seagate Mobile HDD 1TB ST1000LM035 | Dell XPS 15 2017 9560 (7300HQ, Full-HD) WDC WD10SPCX-75KHST0 + SanDisk Z400s M.2 2242 32 GB Cache | Asus Zenbook UX510UW-CN044T SanDisk SD8SNAT256G1002 | |
|---|---|---|---|---|
| CrystalDiskMark 3.0 | 28% | 1647% | 8078% | |
| Read Seq (MB/s) | 101.5 | 120.9 19% | 123 21% | 459.3 353% |
| Write Seq (MB/s) | 100.6 | 101.8 1% | 74.2 -26% | 325.5 224% |
| Read 512 (MB/s) | 28.33 | 37.83 34% | 101.7 259% | 279.2 886% |
| Write 512 (MB/s) | 28.31 | 84.4 198% | 42.51 50% | 280.1 889% |
| Read 4k (MB/s) | 0.327 | 0.473 45% | 10.84 3215% | 22.43 6759% |
| Write 4k (MB/s) | 0.846 | 0.313 -63% | 1.021 21% | 74.9 8753% |
| Read 4k QD32 (MB/s) | 0.718 | 1.133 58% | 69.8 9621% | 149 20652% |
| Write 4k QD32 (MB/s) | 0.893 | 0.274 -69% | 1.057 18% | 234 26104% |

| 3DMark 11 - 1280x720 Performance GPU | |
| Acer Aspire VN7-593G-73HP V15 Nitro BE | |
| Acer Aspire VX5-591G-75C4 VX15 | |
| Dell XPS 15 2017 9560 (7300HQ, Full-HD) | |
| Asus Zenbook UX510UW-CN044T | |
| 3DMark | |
| 1280x720 Cloud Gate Standard Graphics | |
| Acer Aspire VN7-593G-73HP V15 Nitro BE | |
| Acer Aspire VX5-591G-75C4 VX15 | |
| Dell XPS 15 2017 9560 (7300HQ, Full-HD) | |
| Asus Zenbook UX510UW-CN044T | |
| 1920x1080 Fire Strike Graphics | |
| Acer Aspire VN7-593G-73HP V15 Nitro BE | |
| Acer Aspire VX5-591G-75C4 VX15 | |
| Dell XPS 15 2017 9560 (7300HQ, Full-HD) | |
| Asus Zenbook UX510UW-CN044T | |
| 3DMark 11 Performance | 8674 puntos | |
| 3DMark Cloud Gate Standard Score | 20791 puntos | |
| 3DMark Fire Strike Score | 6774 puntos | |
ayuda | ||
| The Witcher 3 - 1920x1080 Ultra Graphics & Postprocessing (HBAO+) | |
| Acer Aspire VN7-593G-73HP V15 Nitro BE | |
| Acer Aspire VX5-591G-75C4 VX15 | |
| Dell XPS 15 2017 9560 (7300HQ, Full-HD) | |
| bajo | medio | alto | ultra | |
|---|---|---|---|---|
| The Witcher 3 (2015) | 45.8 | 25.2 | ||
| The Division (2016) | 0 | 42.6 | 34.9 | |
| For Honor (2017) | 44.8 | 40.9 | 21.2 | |
| Ghost Recon Wildlands (2017) | 40.9 | 21.2 |
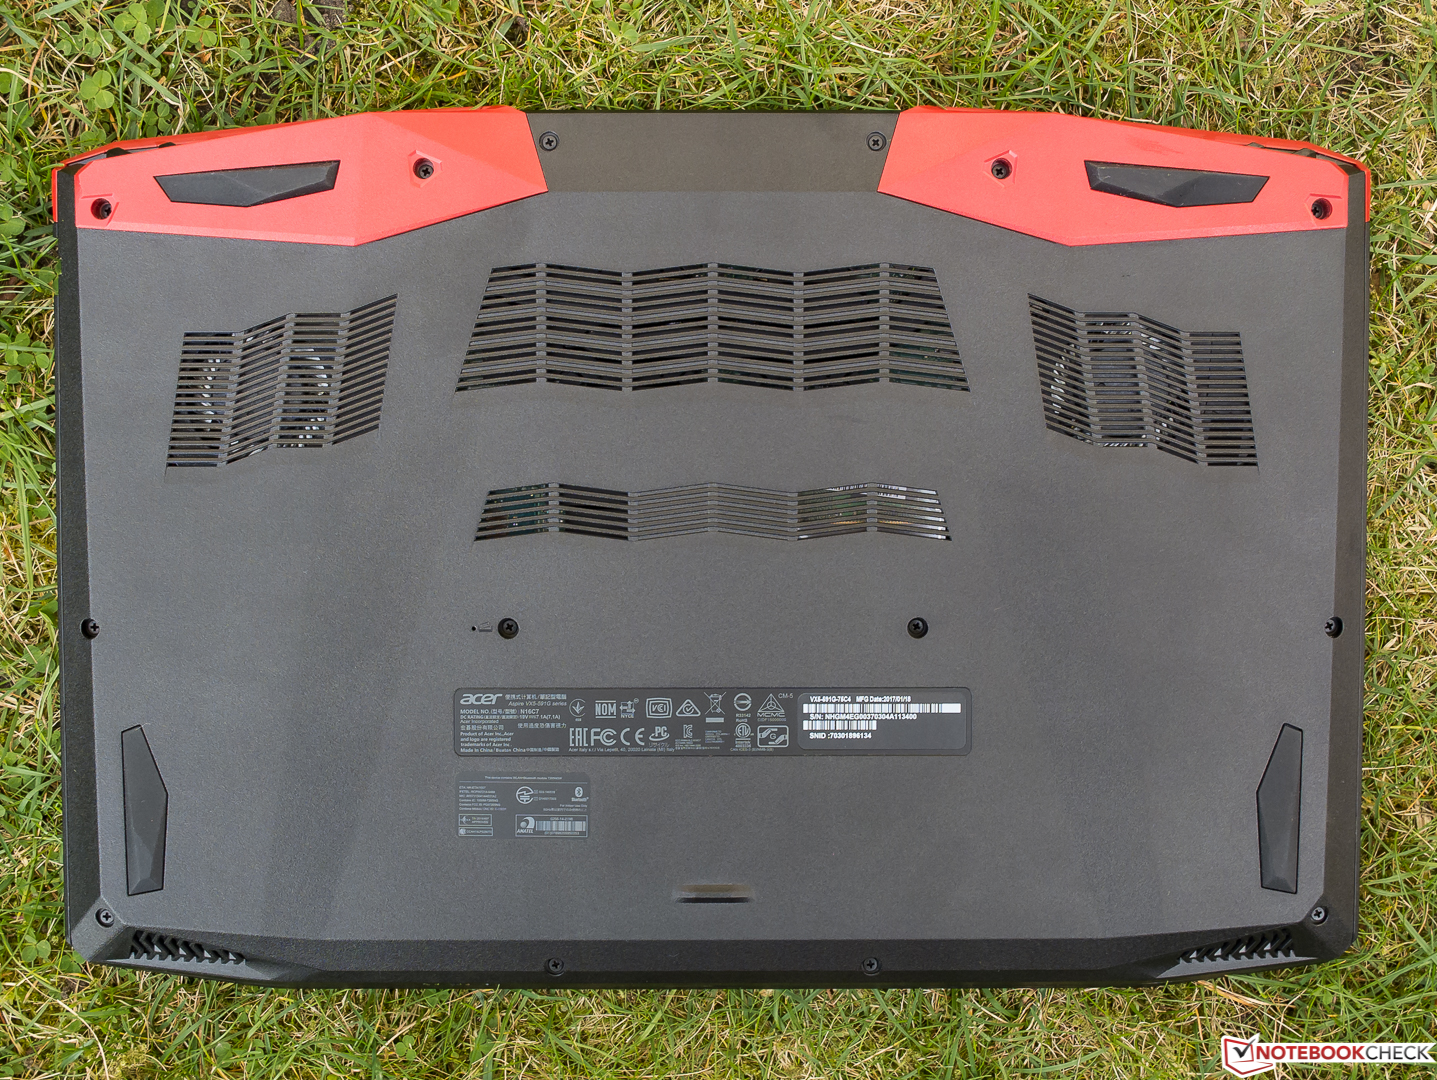
Ruido
| Ocioso |
| 31.4 / 31.4 / 31.4 dB(A) |
| HDD |
| 31.8 dB(A) |
| Carga |
| 36.8 / 41.3 dB(A) |
 | ||
30 dB silencioso 40 dB(A) audible 50 dB(A) ruidosamente alto |
||
min: | ||
(-) La temperatura máxima en la parte superior es de 47 °C / 117 F, frente a la media de 36.8 °C / 98 F, que oscila entre 21 y 71 °C para la clase Multimedia.
(-) El fondo se calienta hasta un máximo de 47 °C / 117 F, frente a la media de 39.1 °C / 102 F
(+) En reposo, la temperatura media de la parte superior es de 24.6 °C / 76# F, frente a la media del dispositivo de 31.3 °C / 88 F.
(+) El reposamanos y el panel táctil están a una temperatura inferior a la de la piel, con un máximo de 29.3 °C / 84.7 F y, por tanto, son fríos al tacto.
(±) La temperatura media de la zona del reposamanos de dispositivos similares fue de 28.7 °C / 83.7 F (-0.6 °C / -1 F).
Acer Aspire VX5-591G-75C4 VX15 análisis de audio
(±) | la sonoridad del altavoz es media pero buena (73 dB)
Graves 100 - 315 Hz
(-) | casi sin bajos - de media 15% inferior a la mediana
(±) | la linealidad de los graves es media (10.7% delta a frecuencia anterior)
Medios 400 - 2000 Hz
(+) | medios equilibrados - a sólo 1.9% de la mediana
(+) | los medios son lineales (5.9% delta a la frecuencia anterior)
Altos 2 - 16 kHz
(+) | máximos equilibrados - a sólo 4.8% de la mediana
(+) | los máximos son lineales (2.2% delta a la frecuencia anterior)
Total 100 - 16.000 Hz
(+) | el sonido global es lineal (14.8% de diferencia con la mediana)
En comparación con la misma clase
» 35% de todos los dispositivos probados de esta clase eran mejores, 4% similares, 61% peores
» El mejor tuvo un delta de 5%, la media fue 17%, el peor fue ###max##%
En comparación con todos los dispositivos probados
» 20% de todos los dispositivos probados eran mejores, 4% similares, 76% peores
» El mejor tuvo un delta de 4%, la media fue 24%, el peor fue ###max##%
Acer Aspire VN7-593G-73HP V15 Nitro BE análisis de audio
(±) | la sonoridad del altavoz es media pero buena (80 dB)
Graves 100 - 315 Hz
(±) | lubina reducida - en promedio 11.8% inferior a la mediana
(±) | la linealidad de los graves es media (13.5% delta a frecuencia anterior)
Medios 400 - 2000 Hz
(±) | medias más altas - de media 5.5% más altas que la mediana
(+) | los medios son lineales (6.6% delta a la frecuencia anterior)
Altos 2 - 16 kHz
(+) | máximos equilibrados - a sólo 1.1% de la mediana
(+) | los máximos son lineales (4% delta a la frecuencia anterior)
Total 100 - 16.000 Hz
(+) | el sonido global es lineal (14.6% de diferencia con la mediana)
En comparación con la misma clase
» 35% de todos los dispositivos probados de esta clase eran mejores, 4% similares, 61% peores
» El mejor tuvo un delta de 5%, la media fue 17%, el peor fue ###max##%
En comparación con todos los dispositivos probados
» 19% de todos los dispositivos probados eran mejores, 4% similares, 77% peores
» El mejor tuvo un delta de 4%, la media fue 24%, el peor fue ###max##%
Dell XPS 15 2017 9560 (7300HQ, Full-HD) análisis de audio
(+) | los altavoces pueden reproducir a un volumen relativamente alto (#87 dB)
Graves 100 - 315 Hz
(-) | casi sin bajos - de media 15.8% inferior a la mediana
(±) | la linealidad de los graves es media (13.9% delta a frecuencia anterior)
Medios 400 - 2000 Hz
(+) | medios equilibrados - a sólo 4.3% de la mediana
(±) | la linealidad de los medios es media (7.1% delta respecto a la frecuencia anterior)
Altos 2 - 16 kHz
(+) | máximos equilibrados - a sólo 3.1% de la mediana
(±) | la linealidad de los máximos es media (7.9% delta a frecuencia anterior)
Total 100 - 16.000 Hz
(+) | el sonido global es lineal (13.5% de diferencia con la mediana)
En comparación con la misma clase
» 29% de todos los dispositivos probados de esta clase eran mejores, 4% similares, 67% peores
» El mejor tuvo un delta de 5%, la media fue 17%, el peor fue ###max##%
En comparación con todos los dispositivos probados
» 14% de todos los dispositivos probados eran mejores, 4% similares, 82% peores
» El mejor tuvo un delta de 4%, la media fue 24%, el peor fue ###max##%
Asus Zenbook UX510UW-CN044T análisis de audio
(±) | la sonoridad del altavoz es media pero buena (73 dB)
Graves 100 - 315 Hz
(±) | lubina reducida - en promedio 14.8% inferior a la mediana
(±) | la linealidad de los graves es media (7.2% delta a frecuencia anterior)
Medios 400 - 2000 Hz
(+) | medios equilibrados - a sólo 3% de la mediana
(+) | los medios son lineales (6.3% delta a la frecuencia anterior)
Altos 2 - 16 kHz
(±) | máximos más altos - de media 6% más altos que la mediana
(+) | los máximos son lineales (4.6% delta a la frecuencia anterior)
Total 100 - 16.000 Hz
(±) | la linealidad del sonido global es media (16.6% de diferencia con la mediana)
En comparación con la misma clase
» 44% de todos los dispositivos probados de esta clase eran mejores, 7% similares, 49% peores
» El mejor tuvo un delta de 5%, la media fue 17%, el peor fue ###max##%
En comparación con todos los dispositivos probados
» 29% de todos los dispositivos probados eran mejores, 6% similares, 66% peores
» El mejor tuvo un delta de 4%, la media fue 24%, el peor fue ###max##%
| Off / Standby | |
| Ocioso | |
| Carga |
|
Clave:
min: | |
| Acer Aspire VX5-591G-75C4 VX15 i7-7700HQ, GeForce GTX 1050 Ti Mobile, Toshiba MQ01ABD100, IPS, 1920x1080, 15.6" | Acer Aspire VN7-593G-73HP V15 Nitro BE i7-7700HQ, GeForce GTX 1060 Mobile, Seagate Mobile HDD 1TB ST1000LM035, AH-IPS, Normally Black, Transmissive, 1920x1080, 15.6" | Dell XPS 15 2017 9560 (7300HQ, Full-HD) i5-7300HQ, GeForce GTX 1050 Mobile, WDC WD10SPCX-75KHST0 + SanDisk Z400s M.2 2242 32 GB Cache, LED IGZO IPS InfinityEdge, 1920x1080, 15.6" | Asus Zenbook UX510UW-CN044T 6500U, GeForce GTX 960M, SanDisk SD8SNAT256G1002, IPS, 1920x1080, 15.6" | |
|---|---|---|---|---|
| Power Consumption | -9% | 8% | 23% | |
| Idle Minimum * (Watt) | 7 | 7.2 -3% | 6.6 6% | 5 29% |
| Idle Average * (Watt) | 10.2 | 10.5 -3% | 9 12% | 8.9 13% |
| Idle Maximum * (Watt) | 14 | 16 -14% | 10.7 24% | 11.8 16% |
| Load Average * (Watt) | 78 | 82 -5% | 77.5 1% | 55 29% |
| Load Maximum * (Watt) | 127 | 155 -22% | 130 -2% | 93 27% |
| Witcher 3 ultra * (Watt) | 124 |
* ... más pequeño es mejor
| Acer Aspire VX5-591G-75C4 VX15 i7-7700HQ, GeForce GTX 1050 Ti Mobile, 52.5 Wh | Acer Aspire VN7-593G-73HP V15 Nitro BE i7-7700HQ, GeForce GTX 1060 Mobile, 69 Wh | Dell XPS 15 2017 9560 (7300HQ, Full-HD) i5-7300HQ, GeForce GTX 1050 Mobile, 56 Wh | Asus Zenbook UX510UW-CN044T 6500U, GeForce GTX 960M, 48 Wh | |
|---|---|---|---|---|
| Duración de Batería | 49% | 29% | 70% | |
| Reader / Idle (h) | 5.4 | 8.4 56% | 9.4 74% | 13.6 152% |
| WiFi v1.3 (h) | 5 | 6 20% | 5.6 12% | 7.2 44% |
| Load (h) | 1.4 | 2.4 71% | 1.4 0% | 1.6 14% |
| H.264 (h) | 7.1 |
Pro
Contra
Nada espectacular, pero sólido - Acer ha hecho un buen trabajo con su nuevo VX5-591G-75C4.
Excepto por el veloz procesador, la mayoría de componentes están situados en la parte alta de la gama media, correspondiente al precio de 1000 Euros de la versión de pruebas y 1200 Euros de la que tiene SSD. Esto nos lleva a la única pega real: Sólo podemos dar a un portátil multimedia sólido sin un SSD una recomendación de compra condicional. Los usuarios que quieran más potencia de juego y necesiten por tanto una GTX 1060 tendrán que hacer inevitables compromisos en ruido de sistema, ya que su consistente producción de ruido quedo es uno de los puntos fuertes del nuevo portátil multimedia de Acer.
Ésta es una versión acortada del análisis original. Puedes leer el análisis completo en inglés aquí.
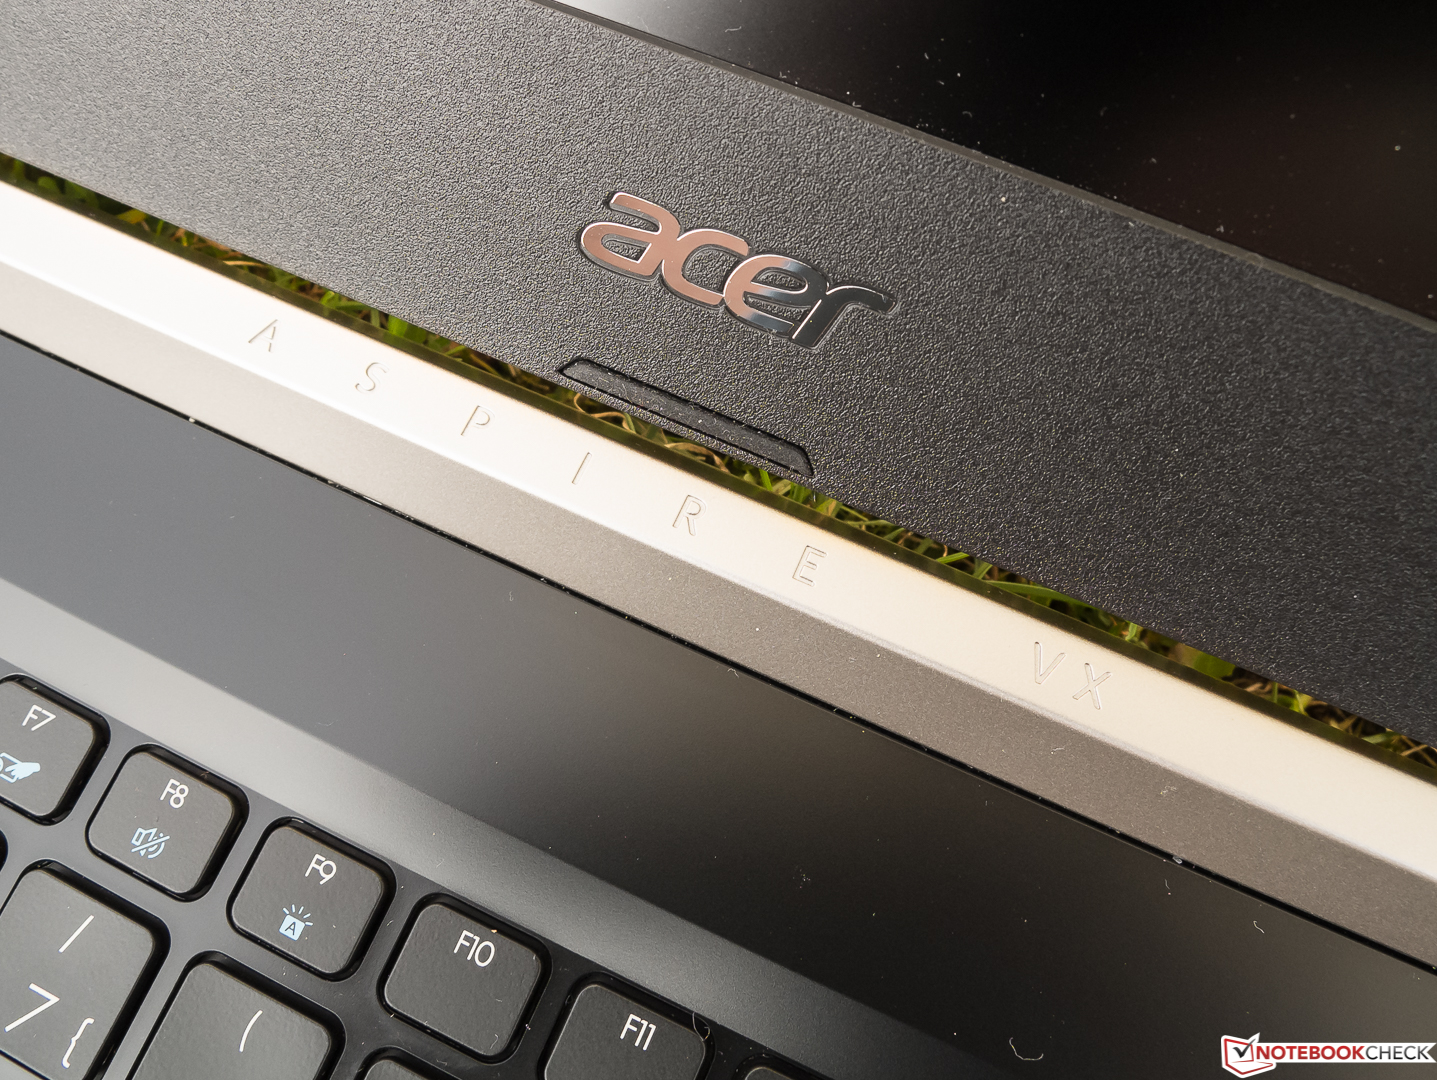
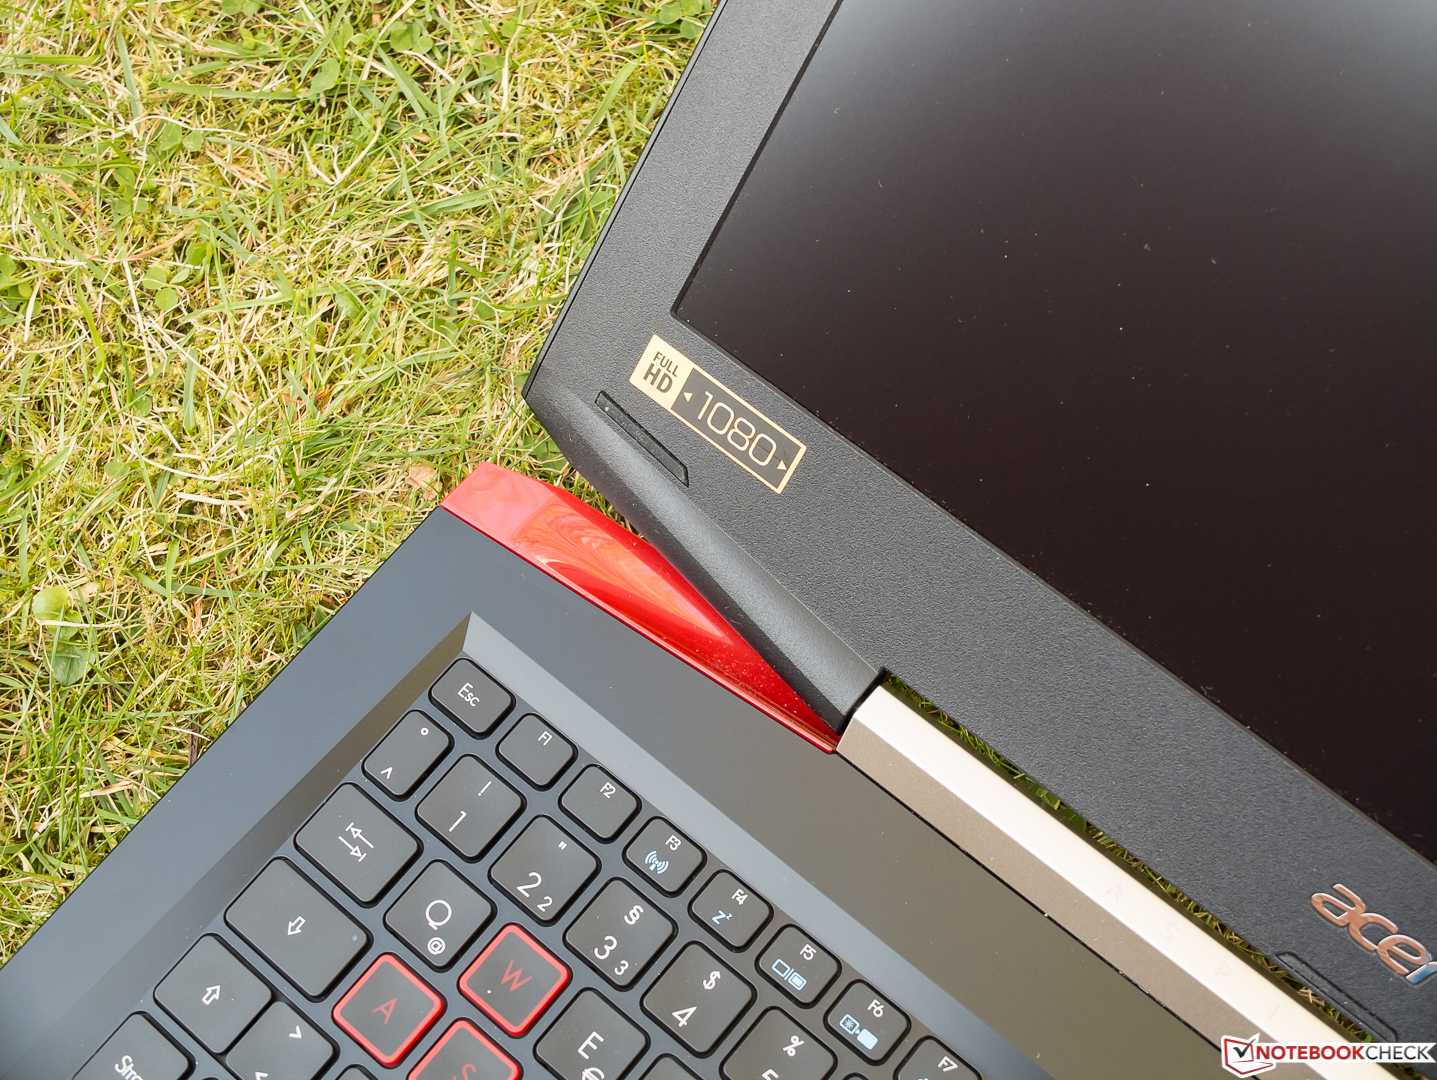
Acer Aspire VX5-591G-75C4 VX15
- 04/11/2017 v6 (old)
Sven Kloevekorn